Embed Size (px)
Citation preview
Understanding the Consequences of Technostress: A Non-Linear
Perspective
Research paper
Issa, Helmi, ESC Rennes, France, [email protected]
Bahli, Bouchaib, Ryerson University, Toronto, Canada, [email protected]
Abstract Despite the rise in technostress research, two significant gaps have been overlooked. First, although
studies on stress proposed curvilinear relationships, such interactions have rarely been examined in
the technostress literature. Second, despite stress being multi-disciplinary and theoretically related to
emotions, past technostress studies have rarely adopted transdisciplinary approaches. This paper
aims to address these knowledge gaps by adopting the triphasic stress model, the appraisal theory of
emotions, and the activation theory to investigate and explain the presence of curvilinear
relationships within a mediated and moderated model. Data were collected and analyzed by
surveying 215 employees from four different medium-sized US organizations. Our findings suggest
that antecedents such as ICT-self-efficacy and presenteeism significantly relate to technostressors
through cubic S-shaped interactions, while technostressors exhibit a quadratic U-shaped relation
with technoexhaustion, whereas technoexhaustion shows a positive linear relationship with
discontinuous usage intention. Furthermore, our results partially support the moderating influence of
negative affectivity and mediation effects of technoexhaustion. Through this study, we offer a different
theoretical perspective and an innovative understanding of the true nature of the technology and
stressors. It also offers insights on designing effective organizational ICT tools.
Keywords: technostress, curvilinear, triphasic stress model, activation theory.
2
1 Introduction Stress has been a ubiquitous phenomenon often associated with practical, economic, and health
consequences for individuals and organizations. Several academic surveys and studies show an
increase in overall stress levels from 4.8 to 5.1 on a 10-point scale (American Psychological
Association - APA, 2017) and a 9% increase in individuals facing at least one stress symptom per
month (APA, 2017). The adverse effects of stress subsequently lead to financial losses, higher
mortality rates, mental exhaustion, lower performance, lawsuits, lower profits, and individual
dissatisfaction (e.g., Chilton et al. 2005; CNN, 2006). Introduction and dependence on information
and communication technologies (ICTs) have also contributed to the presence of stress in the
workplace. Although ICTs are essential for businesses, they may lead to adverse outcomes due to
their excessive use (Bulgurcu et al. 2010). The effectiveness and efficiency of ICTs raise productivity
expectations and a competitive advantage, hence resulting in more stress for employees (Wang et al.
2008).
Stress is an unavoidable part of life, resulting in both negative and positive outcomes (Selye, 1973,
1974). Despite the suggestions from the positive psychology movement (Seligman and
Csikszentmihalyi, 2000) and the increasing interest in the positive consequences of stressors (Ohly
and Latour, 2014; Eurofound and the International Labor Office, 2017; Folkman and Moskowitz,
2004), technostress (TS) research has largely focused on the negative consequences. Prior IS research
framed and viewed technology related stress negatively (e.g., Baroudi 1985). Lately, IS research has
focused on the reasons behind the adverse psychological outcomes caused by technology (e.g.,
Ayyagari et al. 2011; Ragu-Nathan et al. 2008; Tarafdar et al. 2010; 2011). In sum, TS has been
widely recognized as an unintentional negative effect of technology (Ayyagari et al. 2011; Tarafdar et
al. 2011). Nevertheless, similar studies have related technology to bad and good stress (e.g., Sethi et
al. 1987; Califf et al. 2016). This paper follows their approach of distinguishing between the
perceptions and experiences of eustress and distress (Little et al. 2007; Le Fevre et al. 2003; Selye
1983) by testing for curvilinear relationships. Against this background, our research question is as
follows:
RQ: What types of relationships exist within a mediated and moderated technostress model?
There are two major contributions emanating from this study. First, although numerous studies on
stress from different disciplines examined the nonlinear effects of stressors (e.g., Singh, 1998;
Nygaard and Dahlstrom, 2002; Bhuian et al. 2005; Takeuchi et al. 2007; Uotila et al. 2009; Leung et
al. 2011; Mihalache et al. 2012; Lindberg et al. 2013; Haans et al. 2016) and despite nonlinearity
being suggested as an interesting future research direction in recent TS studies (Srivstava et al. 2015),
these types of relationships have been missing in TS literature. This study addresses this specific
research gap. Second, since a) stress is multi-disciplinary in nature (Fischer and Riedl, 2017; Tarafdar
et al. 2017), b) psychological stress is similar to the literature of emotions (Lazarus, 1993), and c) job
stress is also conceptualized as “a constellation of theories and models that addresses a meaningful
process or phenomenon” (Nelson and Simmons, 2003 - 04), the current research tests for curvilinear
relationships through the theoretical lenses of the triphasic stress model, appraisal theory of emotions,
and activation theory.
The rest of the paper is organized as follows: The first section of this paper describes the stress and TS
concepts. The second section discusses the adopted models and theories that were utilized to articulate
our arguments for the chosen research model and curvilinear relationships. The third section describes
the research methodology and data analysis techniques. The fourth section is devoted to the overall
empirical findings (including nonlinear regression analysis, restricted cubic splines regression
analysis, and nonlinear moderation and mediation analysis). The last section concludes with the
limitations, future research directions, research and practical implications, and discussion.
3
2 Theoretical Foundation 2.1 Stress and Technostress Early studies have defined stress as either a response from a physiological perspective (McGrath,
1976; Selye, 1956) or as a stimulus from a scientific approach (Baum, 1990). Stress occurs when the
relationship is perceived as personally significant and challenges the resources available for
successful coping strategies (Folkman, 2013). Thus, in addition to biological factors, psychological
and cognitive factors also have an impact on the perception of stress. Given the conceptual and
theoretical limitations of both approaches (e.g., Cooper et al. 2001; Cooper and Dewe, 2008; Lazarus
and Folkman, 1984), psychological stress theories followed a distinct approach involving
transactional processing between the individual and the environment. Therefore, stress has been
conceptualized as a process that includes an environmental condition, a demanding/challenging
stressor, coping responses, and psychological/behavioral/physiological outcomes (e.g., Folkman,
2011; Lazarus, 1966; Lazarus and Folkman, 1984; McGrath, 1976). Stressors have been defined as
conditions and events that induce strain (Kahn and Byosiere, 1992) and can be divided into physical
stressors (e.g., poor ergonomic conditions at the workplace), task-related job stressors (e.g., high time
pressure, work overload, task complexity, and system breakdown), role stressors (e.g., role overload,
role conflict, role ambiguity, and facing illegitimate tasks), social stressors (e.g., poor social
interactions and handling difficult customers), work schedule stressors (e.g., night/day time
arrangements), career-related stressors (e.g., job insecurity), traumatic events (e.g., disasters), and
organizational change (e.g., implementation of new technologies leading to other stressors, such as
job insecurity, overtime, and social conflicts).
The conceptualization of stress and stressors offers an adequate starting point for understanding the
concept of TS. TS has been defined as the constant need to adapt to new applications, functionalities,
software, and programs (Ragu-Nathan et al. 2008); as the inability to adapt to or cope with ICTs in a
healthy and positive manner (Srivastava et al. 2015); or as a consequence of perceived work overload
and information fatigue (Ayyagari et al. 2011; Ragu-Nathan et al. 2008). For instance, the
implementation of new applications, multitasking, constant connectivity, information overload,
frequent system upgrades, constant uncertainty, continual relearning, job-related insecurities, and
technical problems have been linked to the organizational use of technology (Tarafdar and Tu, 2010;
Ayyagari et al. 2011; Tarafdar et al. 2011). Tarafdar et al. (2007) identified five TS creators: techno-
overload, techno-invasion, techno-complexity, techno-insecurity, and techno-uncertainty. Because of
the omnipresence and practical significance of TS, academic interest in the topic has recently grown.
There are several studies examining different technological and cognitive antecedents (Ayyagari et al.
2011; Shu et al. 2011) and different consequences of TS (Tarafdar et al. 2007; 2010; 2014).
2.2 Appraisal Theories of Emotions and the Triphasic Stress Model
Lazarus (1993) argues that since psychological stress theory is equivalent to the theory of emotion and
because the two kinds of literature share similar concepts, both fields could be successfully adjoined
as the field of emotion theory. Following this suggestion, in this paper, we refer to the concepts of
stressors and stress as equivalent to the concept of emotions. Appraisal theories of emotion
conceptualize appraisals as direct, immediate, and intuitive cognitive evaluations of the environment
(Arnold, 1960). The fundamental principle is that emotions are related to specific combinations of
appraisals. Despite earlier theorists studying appraisals as the ones preceding emotions (e.g., Arnold,
1960; Lazarus, 1966), more recent studies showed that emotions could also lead to appraisals (e.g.,
Keltner et al. 1993; Lerner and Keltner, 2001). This supports the perspective that emotions and
appraisals are intertwined as the subset of same affective state (Ellsworth and Scherer, 2003). The
concept of appraisal was introduced to emotion theory specifically to support and systematically
explain the variability in emotional reactions (e.g., Lazarus and Folkman, 1984; Roseman and Smith,
2001). Although scholars disagree over details of the appraisal criteria (e.g., Reisenzein and Hofmann,
1993; Scherer et al. 2006), they broadly agree on the distinction among emotional reactions and how
they are triggered within the realm of appraisal theories (Ellsworth and Scherer, 2003). Most appraisal
4
models evaluate the extent to which a situation is helps one achieve specific goals and distinguishes
between positive and negative emotions (Ellsworth and Scherer, 2003). Although most appraisal
theories assume linear causations across many psychological, psychophysical, cognitive, and
technological processes (e.g., Ausubel and Marchetti, 1997; Treisman, 1999), few theorists have
challenged this view and suggested a reciprocal (S-shaped) relationship in which both the cognitive
appraisal and emotion development dynamically emerge and interact (e.g., Lewis, 2005; Tong et al.
2009; Kappas, 2001). In other words, emotions are continuously adapted by changes in appraisals,
while emotional effects gradually update appraisals. Therefore, there is no evident reason to assume
that appraisal–emotion relationships are strictly linear, especially since cognitive-neurological and
psycho-physiological disciplines follow the logic of S-shaped functions (Tong et al. 2009). It is
possible that appraisals can influence emotions either at extreme ends (U-shaped) or at moderate
levels (S-shaped function) (Tong and Tay, 2011). If appraisal–emotion relationships interact at
moderate levels, then it should be of interest to theorists, experimenters, and practitioners for theory
advancement (Roseman and Kaiser, 2001).
In this study, we have adopted the triphasic stress model (general adaptation syndrome, G-A-S)
(Selye, 1950) as a theoretic framework for explaining the combined linear-quadratic interactions as
observed in prior studies such as Bhuian et al. (2005). The triphasic stress model emerged from
laboratory observations by showing S-shaped patterns through measuring responses to increasing
levels of stimuli (Bhuian et al., 2005). The theory conceptualizes a three-phase model of reactions to
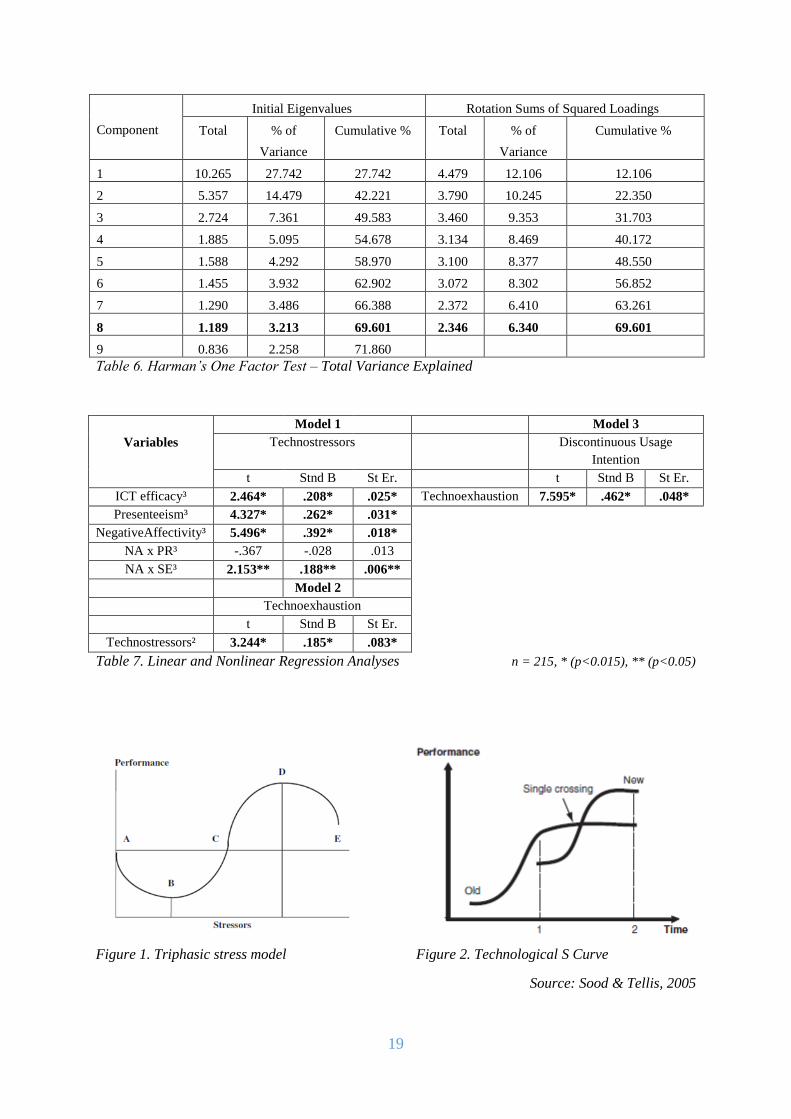
stress in the form of a sine curve (Nygaard and Dahlstrom, 2002) (see Figure 1). In the first phase,
stress negatively affects performance. In the second phase (B to D), performance improves as stress
rises. In the final phase (D to E), performance decreases (Nygaard and Dahlstrom, 2002). The model
appears to be credible since the triphasic perspective extends (rather than replacing) the existing
linear, quadratic and interactive views (Bhuian et al. 2005). As the model a) shows the cyclical (S-
shaped) behavior of stress through three different phases (Selye, 1950; Nygaard and Dahlstrom,
2002), and b) incorporates both linear and quadratic perspectives (Bhuian et al. 2005), we can expect
triphasic effects of the technostressors (TSS) within our hypothesized mediated nonlinear model.
Therefore, in this paper, the differentiation between the different phases leads to the proposition that
the reaction of stress could be either positive eustress (pleasant experience) or negative distress
(unpleasant experience) (Selye, 1973). We modeled ICT self-efficacy and presenteeism as sine
functions of TSS.
In technology management literature (e.g., Foster, 1986; Utterback, 1994), technological evolution
and radical innovation are IS-related areas that can be associated with the same pattern of the triphasic
stress model. Embracing the technological change requires knowledge regarding how new
technologies evolve (Sood and Tellis, 2005). The literature suggests that a new technology evolution
follows an S-shaped curve that starts below an outdated technology, intersects it once, and finally
ends ahead of the old technology (Utterback, 1994). In practice, it follows a managerial concept of
excluding a maturing technology and adopting a new one to stay competitive (Christensen, 1997).
Shifting to a new technology occurs at the point of inflection; beyond that threshold, performance
increases at a decreasing rate until maturity. In this paper, the shifting in technology resembles the
pace that ICTs are rapidly changing and affecting the behavior of employees through adaptation
mechanisms, resembling an S-shaped relationship similar to the triphasic stress model (see Figure 2).
3 Model and Hypotheses
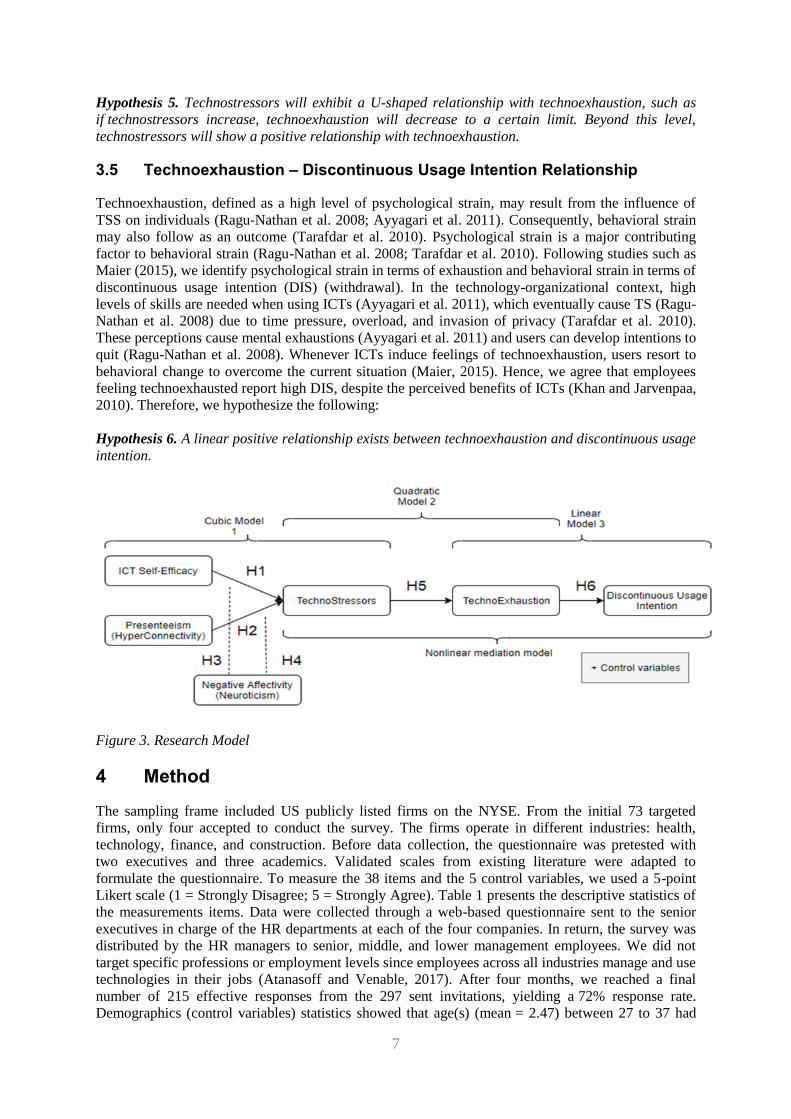
Our research model (see Figure 3) is adapted from the expanded stimulus-organism-response (S-O-R)
model of organizational stress (Strümpfer, 1986). The S-O-R model is an extended version of
Lazarus's psychological stress model. It refers to any factor in the environment (stimulus) as a
perceived and appraised stressor before leading to stress (as a reaction) and then to strain (as a
consequence). In this study, a similar conceptual framing is followed to relate TS with stress by
shifting focus from the organizational to the technological environment (Erasmus, 2003). However,
since the S-O-R model lacks curvilinear explanations, we further integrate the triphasic stress model,
appraisals theories of emotion, and activation theory to better describe the reasons and logic for our
proposed hypotheses.
5
3.1 ICT Self-Efficacy – Technostressors Relationship
ICT self-efficacy (SE) refers to one's belief in one's capability to successfully use and perform a
computer-related task (Compeau and Higgins, 1995). Hence, it is linked to ICT-related stress. Self-
efficacy reflects a broad sense of personal competence to manage stressful conditions (Schwarzer,
1992). Self-efficacy is responsible for how people think, feel, and behave. Individuals with low self-
efficacy have low self-esteem, pessimistic thoughts, negative feelings, and high anxiety levels.
Individuals with high self-efficacy have strong sense of competency, high decision-making qualities,
high levels of efforts, high levels of persistence, high commitment levels, greater achievement
approaches, behave more proactively, feel less threatened by stressful demand, and perform more
challenging tasks (Jex et al. 2001; Bandura, 1997). To date, the basic conceptualization of stressors
(i.e., role stressors) and their effects on self-efficacy has proposed and tested linear negative
relationships, in which high levels of stressors lead to low levels of self-efficacy (e.g., Brown et al.
2005; Sonnentag and Kruel, 2006). While this perspective dominates stress research, recent
developments show the potential for non-linear responses to stress (Lindberg et al. 2013). Despite
stressors being generally perceived as harmful, few scholars have opposed the view of the linear
negative relationship and found evidence for nonlinear causation (e.g., Lindberg et al. 2013). ICT-
efficacy and workload moderate the level of TS (Tarafdar et al. 2011; Suharti and Susanto, 2014).
Therefore, self-efficacy could act as an enhancer in the motivation process by reshaping the thoughts
towards positive emotional states (Llorens et al. 2007) or could positively influence thoughts in
negative scenarios. Since this dynamic construct a) influences perceptions of stress through thought
patterns and emotional reactions, b) functions as a cognitive regulator of anxiety arousal (Bandura,
1997), c) can change over time (Gist and Mitchell, 1992), and d) is explained by the appraisal-
emotion theory in terms of S-shaped relationships (Leary et al. 1998), we link our arguments to the
triphasic stress model and appraisal theories of emotions and hypothesize:
Hypothesis 1. The relationship between ICT-self efficacy and technostressors exhibits a cubic S-
shaped function, with negative and positive slopes at different levels of ICT-self efficacy.
3.2 Presenteeism (Hyper-connectivity) – Technostressors Relationship
Hyper-connectivity refers to the numerous methods of communication and interaction that overcome
time and space boundaries by virtualizing experience and physical presence (Fredette et al. 2012).
Technology dependence is one of the growing concerns because of hyper-connectivity (Fredette et al.
2012). Hyper-connectivity can also be defined as the degree to which technology enables users to be
accessible anywhere and anytime (Fredette et al. 2012), referred to as presenteeism (McGee, 1996).
Presenteeism (PR) is perceived as a source of stress/strain (Van de Heuvel et al. 2010; Ayyagari et al.
2011) and work overload due to endless connectivity (Cooper et al. 2001). Research on hyper-
connectivity (constant connectivity/presenteeism) relies on the nonlinear (S-shaped) technological
innovation (Foster, 1986; Utterback, 1994) and psychological concepts as key lenses to explore
increasingly stressful work environments (Mazmanian and Erickson, 2014). Since hyper-connectivity
has been defined as a result of an increasingly accelerated technological evolution affecting individual
and organizational behavior (Fredette et al. 2012), it can be curvilinearly associated with the
technology and stress-emotions literature. We argue that hyper-connectivity can be a powerful tool for
efficiency and development, but it can rapidly change the ways many tasks are performed. Hence,
people are expected to adapt to these changes (Fredette et al. 2012). Consequently, it would lead to
various stressful situations. Linking our arguments with the appraisals theory of emotions and the
triphasic stress model, pattern variations in the relationship between constant connectivity and
emotions (stressors) could be expected at all levels. Therefore, we hypothesize the following:
Hypothesis 2. The relationship between presenteeism and technostressors exhibits a cubic S-shaped
function, with negative and positive slopes at different levels of presenteeism.
6
3.3 Negative Affectivity as a Moderator
Negative Affectivity (NA) or Neuroticism is one of the five personality dimensions (McCrae and
Costa, 2003). It reflects the degree of emotional stability and adjustment. High level of NA or
neuroticism a) implies a high level of psychological distress and emotional instability (Costa and
McCrae, 1985(a)(b), 1992); b) interferes with one's ability to adapt (Tellegen, 1985); c) implies high
levels of job stress (Kumaresan and Ramayah, 2005); and d) relates to ICT-related job disruptions
(stress creators) due to individuals’ negative beliefs about the technology use (Lazarus and Folkman,
1984; Srivastava et al. 2015). Self-efficacy requires awareness of one's own emotions and the ability
to control them to achieve the desired results (Saarni, 2000). Recent studies show that low levels of
self-efficacy are preceded by high levels of negative emotions (Martinez and Salanova, 2005). Similar
studies show evidence that certain negative emotions influence the levels of self-efficacy (Garcia et al.
2006), buffer the benefits of high control on achievement (Ruthig et al. 2008), and interact as
moderators between self-efficacy and achievement (Villavicencio and Bernardo, 2013). Therefore, we
hypothesize the following:
Hypothesis 3. Negative affectivity moderates the relationship between ICT self-efficacy and
technostressors.
In the organizational context, since PR implies the continuous presence of the employee at all times,
the work-home boundaries have blurred. A growing body of research suggests that the affective trait
(NA) is related to high levels of work-family conflict (Bruck and Allen, 2003; Stoeva et al. 2002).
Furthermore, since PR, or hyper-connectivity, is perceived as a source of stress/strain (Van de Heuvel
et al. 2010; Ayyagari et al. 2011) and might be related to emotional problems or mood disorders that
are associated with high neuroticism (Carballedo et al. 2015), then it would be appropriate to consider
NA as a possible moderator between PR and TSS. Therefore, we hypothesize the following:
Hypothesis 4. Negative Affectivity moderates the relationship between Presenteeism and
Technostressors.
3.4 Technostressors – Technoexhaustion Relationship
Activation theory was prominently used as a theoretical lens for understanding emotion in psychology
(Donald B. Lindsley (1907-2003)). The activation theory provides explanation for the causes of job
stress (Gardner and Cummings, 1988). The use of the activation theory has focused on inverted U-
shaped relationships between job stress or characteristics with performance and satisfaction
(Champoux, 1978, 1980, 1992; Gardner, 1986; Schwab and Cummings, 1976). Activation theory
argues that both low and high levels of stressors inhibit performance because they either under- or
over-stimulate leading to disorganized responses (Scott, 1966). A low level of stressors weakens
awareness or resource activation (stimulation), hence resulting in lack of motivation or withdrawal
intentions (Onyemah, 2008). A high level of stressors overwhelms reactive and coping capacities,
hence leading to discouragement (Schaubroeck and Ganster, 1993). Studies showed that high levels of
stressors (e.g., workload & time pressure) reduce performance (Jehn, 1995), creativity and efficiency
(Amabile et al. 2002), and effective decision making (Barczak and Wilemon, 2003). On the other
hand, moderate levels of stressors provide balanced or optimum stimulation, subsequently leading to
desirable outcomes (Nygaard and Dahlstrom, 2002). Therefore, it is argued that moderate levels
stressors result in the best performance, while low and high levels of stressors should be associated
with poor performance (Rodriguez-Escudero et al. 2010), hence developing an inverted U-shaped
relationship. Drawing on these arguments and the activation theory principle, which suggest an
inverted U-shaped relationship exists between stressors and performance (positive outcome), we
argue for a U-shaped relationship between stressors and strain or exhaustion (negative outcome). We
believe that low and high levels of TSS (extreme ends) can be similarly dysfunctional, in which high
levels of technoexhaustion (TE) are observed (relative to poor performance). On the other hand,
moderate levels of TSS result in minimal TE (relative to optimal performance). Therefore, we
hypothesize the following:
7
Hypothesis 5. Technostressors will exhibit a U-shaped relationship with technoexhaustion, such as
if technostressors increase, technoexhaustion will decrease to a certain limit. Beyond this level,
technostressors will show a positive relationship with technoexhaustion.
3.5 Technoexhaustion – Discontinuous Usage Intention Relationship
Technoexhaustion, defined as a high level of psychological strain, may result from the influence of
TSS on individuals (Ragu-Nathan et al. 2008; Ayyagari et al. 2011). Consequently, behavioral strain
may also follow as an outcome (Tarafdar et al. 2010). Psychological strain is a major contributing
factor to behavioral strain (Ragu-Nathan et al. 2008; Tarafdar et al. 2010). Following studies such as
Maier (2015), we identify psychological strain in terms of exhaustion and behavioral strain in terms of
discontinuous usage intention (DIS) (withdrawal). In the technology-organizational context, high
levels of skills are needed when using ICTs (Ayyagari et al. 2011), which eventually cause TS (Ragu-
Nathan et al. 2008) due to time pressure, overload, and invasion of privacy (Tarafdar et al. 2010).
These perceptions cause mental exhaustions (Ayyagari et al. 2011) and users can develop intentions to
quit (Ragu-Nathan et al. 2008). Whenever ICTs induce feelings of technoexhaustion, users resort to
behavioral change to overcome the current situation (Maier, 2015). Hence, we agree that employees
feeling technoexhausted report high DIS, despite the perceived benefits of ICTs (Khan and Jarvenpaa,
2010). Therefore, we hypothesize the following:
Hypothesis 6. A linear positive relationship exists between technoexhaustion and discontinuous usage
intention.
Figure 3. Research Model
4 Method
The sampling frame included US publicly listed firms on the NYSE. From the initial 73 targeted
firms, only four accepted to conduct the survey. The firms operate in different industries: health,
technology, finance, and construction. Before data collection, the questionnaire was pretested with
two executives and three academics. Validated scales from existing literature were adapted to
formulate the questionnaire. To measure the 38 items and the 5 control variables, we used a 5-point
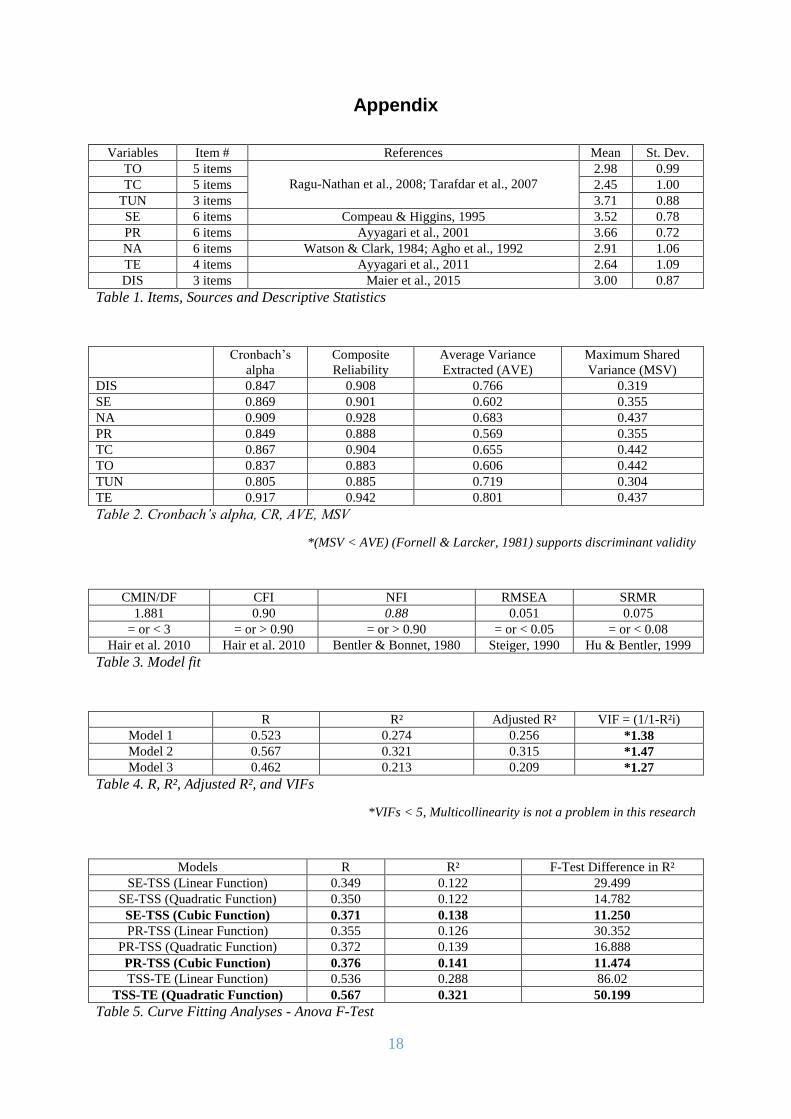
Likert scale (1 = Strongly Disagree; 5 = Strongly Agree). Table 1 presents the descriptive statistics of
the measurements items. Data were collected through a web-based questionnaire sent to the senior
executives in charge of the HR departments at each of the four companies. In return, the survey was
distributed by the HR managers to senior, middle, and lower management employees. We did not
target specific professions or employment levels since employees across all industries manage and use
technologies in their jobs (Atanasoff and Venable, 2017). After four months, we reached a final
number of 215 effective responses from the 297 sent invitations, yielding a 72% response rate.
Demographics (control variables) statistics showed that age(s) (mean = 2.47) between 27 to 37 had

8
the highest percentage of 40.9; gender (mean = 1.66) with females having highest percentage of 65.5;
education level (mean = 1.95) with college and university graduated employees having highest
percentages of 39.5 and 38.2, respectively; and employment level (mean = 3.25) was concentrated
mostly on middle management employees, with 38.9%.
5 Results
First, data were analyzed (internal consistencies, validity, descriptive analysis, linear-nonlinear
regression, and restricted cubic splines (RCS) nonlinear regression) using SPSS 23.0. Second,
nonlinear mediation was calculated through medcurve analysis (macro extension to SPSS). Third,
different confirmatory factor analyses (CFA) were computed using AMOS 23.0. Fourth, WarpPLS
5.0 was used for identifying nonlinear relationships, estimating path coefficients, and modeling
nonlinear moderation effects. Fifth, Stata 14.2 was implemented as a concluding robustness check for
all cubic and quadratic relationships.
Prior to the regression analysis, all validities (content (Haynes et al. 1995), convergent (Hair et al.
1998), discriminant (Fornell and Larcker, 1981)) and reliability measures were all checked for
consistency, robustness, and adequacy (see Table 2 and Table A for factor loadings). The model fit
provided an average-to-good overall results with all measurement loadings being statistically
significant (see Table 3). Table 4 shows the R, R², Adjusted R², and the Variance Inflation Factors
(VIFs) for each of the models as a test for multicollinearity issues. The F-Test for the difference in R²
is presented in Table 5 between the linear, quadratic, and cubic forms of all the interactions. The F-
test has been used to compare the statistical models to identify which model best fits the data
sampling. Further, since the data was self-reported and collected over specific time frame, then
common method variance may cause measurement error and haze the real estimates. To overcome
such issues, we adopted a number of technical procedures and statistical controls (Podsakoff et al.
2003; Ahuja et al. 2007; Liang et al. 2007; Ayyagari et al. 2011; Srivastava et al. 2015). Specific
technical procedures involved clear proposal of the questionnaire, separation of the criterion-predictor
items measures and anonymity assurance. However, for statistical control, we used Harman's one-
factor test (as a diagnostic tool; not a control method) by loading all variables into exploratory factor
analysis (EFA) to determine the number of factors necessary to account for the variance (see Table 6).
Our empirical analysis presents several interesting insights. Table 7 shows the regression results for
SE-NA-TSS and PR-NA-TSS (cubic model 1), TSS-TE (quadratic model 2), and TE-DIS (linear
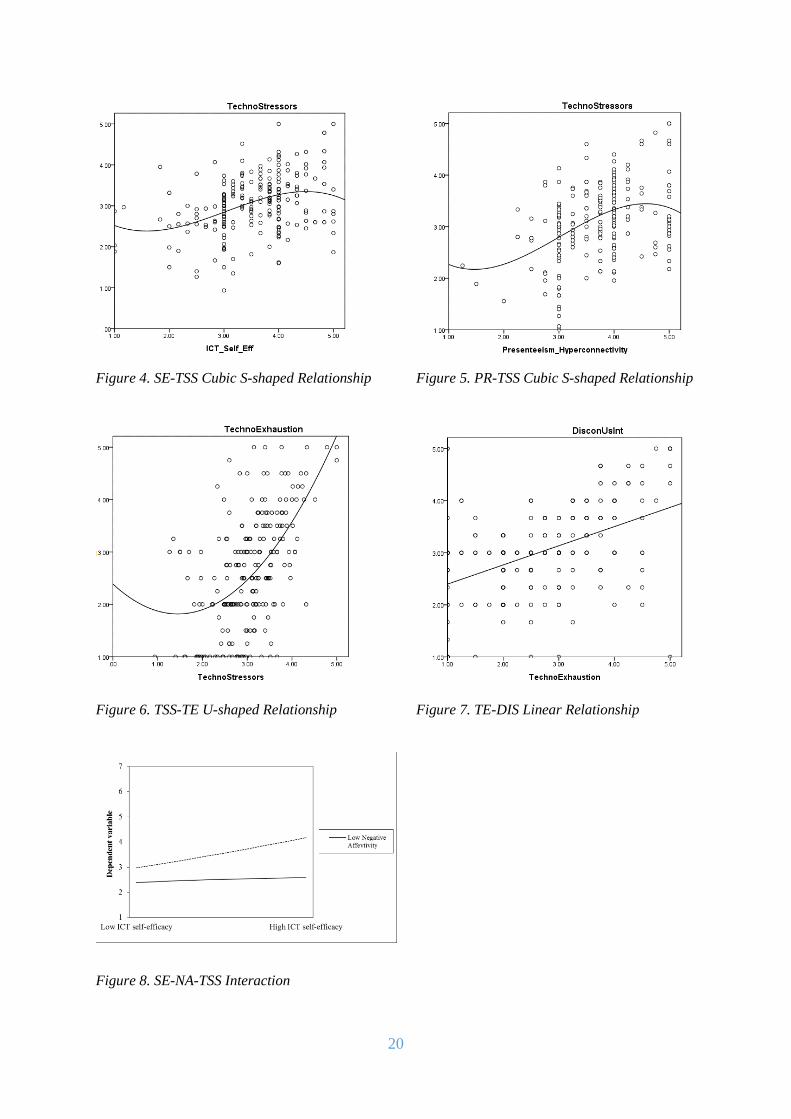
model 3). First, for model 1, SE³ and PR³ are significantly related to TSS (t = 2.464; β = .208; p ˂
.015) and (t = 4.327; β = .262; p < .015) respectively, hence supporting H1 and H2 (see Figures 4 and
5). Similarly, NA³ shows a significant relationship with the model (t = 5.496; β = .392; p < .015) and
is a moderator for the SE-TSS relationship (t = 2.153; β = .188; p < .05), hence supporting H3 (see
Figure 8). However, for the PR-TSS relationship, NA showed no significant influence (t = -.367; β = -
.028; p ˃ .05); hence, H4 was not supported. Second, for models 2 and 3, TSS² showed a significant
relationship with TE (t = 3.244; β = .185; p ˂ .015), and TE showed a significant linear relationship
with DIS (t = 7.595; β = .462; p ˂ .015), hence supporting H5 and H6 (see Figures 6 and 7).
For models 1 and 2, our findings indicate that low levels of SE and PR will hold a certain level of
TSS, but any increase in their levels will lead to a decrease in TSS (negative slope). However, a
further increase in SE or PR will lead to an increase in TSS up to a certain limit (positive slope), after
which the relationship will show an inverse pattern (negative slope). In other words, the low and
downward sloping of TSS (initial phase compared to the triphasic stress model) is equivalent to the
concept of eustress, while increasing levels of TSS (middle and last phases) embody the concept of
distress. Thus, the perception of eustress emerges when SE and PR are increasing at early stages,
hence reflecting on excitement (acquiring new skills) and adaptability. Moderate and high levels are
accompanied by increased work overload and expectations to finish more tasks under limited time,
hence reflecting on the concept of distress. Moreover, NA showed a significant moderating influence
on SE-TSS relationship (i.e., NA positively moderates [amplifies] the relationship), while it has no
effect on PR-TSS relationship. For the SE-NA-TSS relationship, low and high levels of SE lead to
minimal and constant TSS levels when NA is found at low levels, while low and high levels of SE
lead to increased TSS levels when NA is found at high levels. The absence of moderating effect on
the PR-TSS relationship is perhaps due to the fact that work-home conflict might be stressful, but
9
negative emotions might not exist in the presence of incentive or reward mechanisms for the
employees. Financial gain improves satisfaction rather than making it distressing (Bono and Vey,
2005), hence leading to positive emotions instead of negative emotions. For model 3, our results show
the fact that TSS found at minimal or maximum levels have the same damaging effect on the
individual in which TE will be at high levels. TSS found at moderate levels lead to low levels of TE,
in which the TSS are converted to motivational-positive tools (eustress) for adjusting and getting the
task done. For model 4, a simple linear relationship exists between TE and DIS.
5.1 Restricted Cubic Splines (RCS)
As a guideline for examining S-shaped relationships, researchers investigating longitudinal effects can
use stage theories (such as G-A-S) to hypothesize different levels of effects at different points in time
(e.g., Ahearne et al. 2010). Similarly, stage theories can also be used in cross-sectional research by
equating stages to levels of a given independent variable (Nygaard and Dahlstrom, 2002; Bhuian et al.
2005). Following such suggestions, we utilize trigonometric functions of the constructs to estimate
their triphasic cubic effects (restricted cubic splines regression).
RCS are introduced as algorithmic and validity testing of nonlinear hypotheses, in which
segmentation of an independent variable into multiple regression equations occurs. Regression models
in which the function changes along the range of the predictor are called splines (piecewise
polynomials). The locations of these shifts are termed knots (change of slopes defining the end and
the start of each segment). In this study, a spline model is hypothesized, expecting that the
relationships between SE and PR with TSS vary through four equally distant knots, thus testing for a
three-phase spline for each model. Applying the algorithmic approach, spline functions overcome
many disadvantages by replacing linear approximations with a system of piece-wise polynomial
approximations (Suits et al. 1978). Hence, each interval found between two knots relates to Y(x) = a +
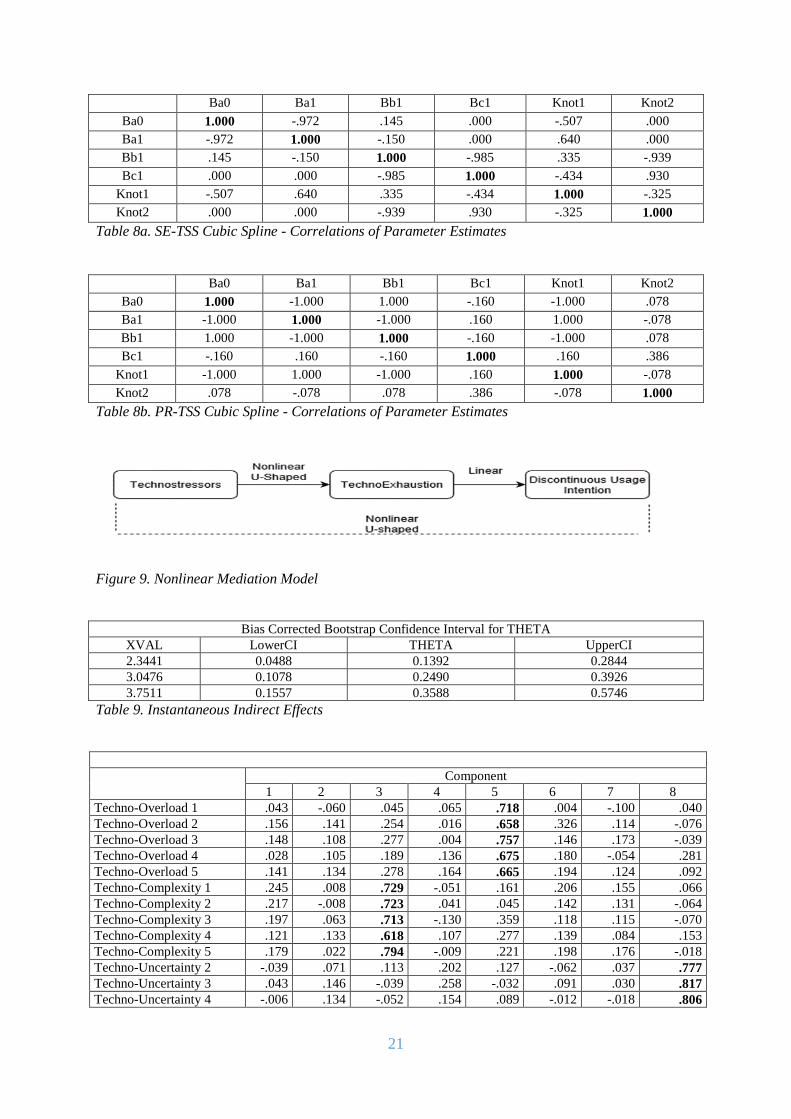
b1X¹ + b2X² + b3X³ for each of the SE and PR relationships. Tables 8a and 8b present the Cubic
Spline - Correlations of Parameter Estimates for both antecedents.
- Cubic Spline Regression model 1a = ba0 + ba1*ICT_Self_Eff + bb1*(ICT_Self_Eff-knot1)
*(ICT_Self_Eff ge knot1) + bc1*(ICT_Self_Eff-knot2) *(ICT_Self_Eff ge knot2)
- Cubic Spline Regression model 1b = ba0 + ba1*presenteeism + bb1*(presenteeism-knot1)
*(presenteeism ge knot1) + bc1*(presenteeism-knot2) *(presenteeism ge knot2)
5.2 Nonlinear Mediation Test
The nonlinear mediational analysis should be tested based on the concept of instantaneous indirect
effects using bootstrapping procedures for inference (Preacher and Hayes, 2010). This approach is the
only acknowledged test and, by far, more effective and accurate than Baron and Kenny (1986) or the
Sobel test (1982), both of which only address direct linear mediation. It facilitates the assessment of
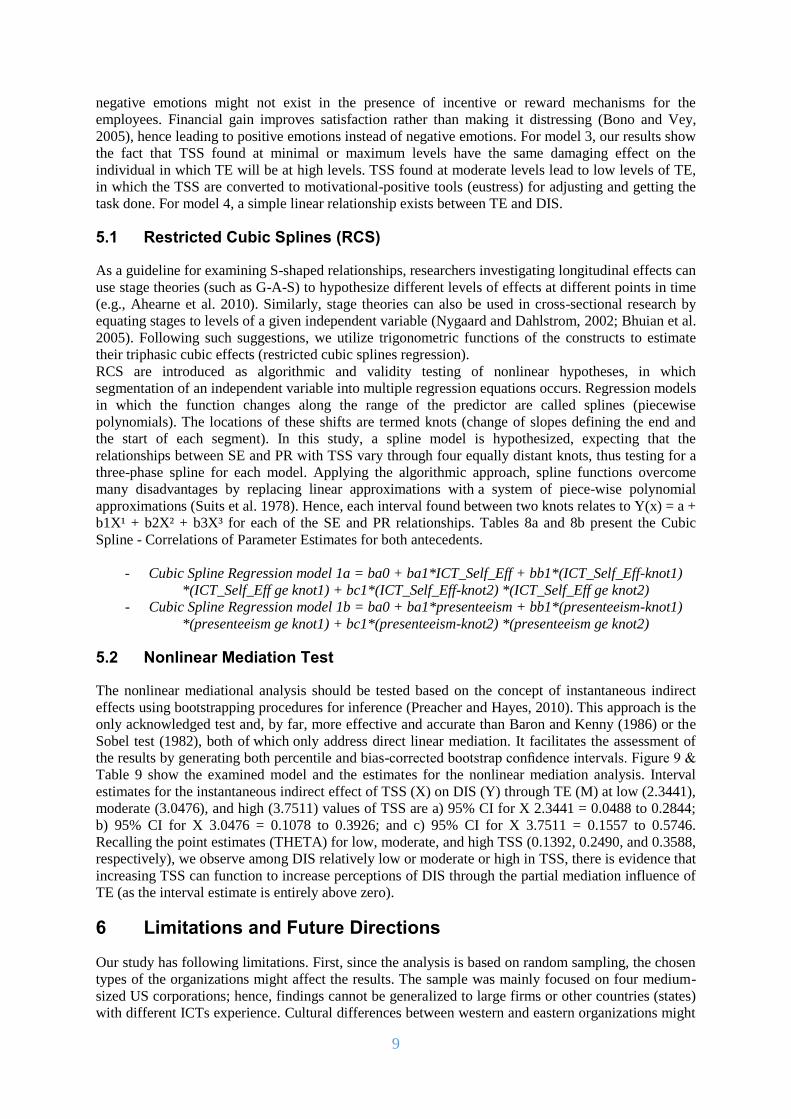
the results by generating both percentile and bias-corrected bootstrap confidence intervals. Figure 9 &
Table 9 show the examined model and the estimates for the nonlinear mediation analysis. Interval
estimates for the instantaneous indirect effect of TSS (X) on DIS (Y) through TE (M) at low (2.3441),
moderate (3.0476), and high (3.7511) values of TSS are a) 95% CI for X 2.3441 = 0.0488 to 0.2844;
b) 95% CI for X 3.0476 = 0.1078 to 0.3926; and c) 95% CI for X 3.7511 = 0.1557 to 0.5746.
Recalling the point estimates (THETA) for low, moderate, and high TSS (0.1392, 0.2490, and 0.3588,
respectively), we observe among DIS relatively low or moderate or high in TSS, there is evidence that
increasing TSS can function to increase perceptions of DIS through the partial mediation influence of
TE (as the interval estimate is entirely above zero).
6 Limitations and Future Directions
Our study has following limitations. First, since the analysis is based on random sampling, the chosen
types of the organizations might affect the results. The sample was mainly focused on four medium-
sized US corporations; hence, findings cannot be generalized to large firms or other countries (states)
with different ICTs experience. Cultural differences between western and eastern organizations might
10
influence certain stressors over the others (Tu et al. 2005). Therefore, a sample consisting of different
cultural background might offer further interesting insights in investigating TS (Chen, 2015). Second,
employees and managers from different departments or employment levels experience stress from
diverse ICTs sources and complexities. However, the study followed an undifferentiated treatment for
the use of ICTs, and diversification of technology was not controlled. Third, the findings can be
further developed by analyzing the effects of each of the control variables on TS as suggested by
Tarafdar et al (2011). For instance, personal characteristics (e.g., age, gender, and personality) may
influence the level of TS experienced by yielding different estimates and levels of intensities. Fourth,
only three out of the five TSS were adopted. We considered only the overload, complexity, and
uncertainty dimensions for this research since they are considered the most relevant in the IS
management-security-related stress and behavioral intention contexts (Anderson and Agarwal, 2010;
D'Arcy et al. 2014). Furthermore, techno-invasion and techno-insecurity were found to negatively
affect individual productivity (surplus in strain or deficiency in performance) since excessive ICT-
related pressure leads to stress and insecurity in employees' personal lives and jobs (Tu et al. 2005).
Thus, these two dimensions were removed from our model to avoid extreme measures. However, it
could be more interesting for future studies to apply all five dimensions (as one construct or
separately) in examining curvilinear relationships in different organizational contexts and locations.
Fifth, although we did our best to minimize response bias and noncollinearity issues, the conducted
cross-sectional design methodology (self-reporting) might not be as effective as longitudinal or
experimental studies that are more suitable for investigating stress-related processes. Therefore,
conducting studies that objectively measure the presence of stressors would provide an adequate
stance in addressing stress within the curvilinear realm (Muse et al. 2009).
7 Implications for Practice and Research
The majority of IS studies focus on "what technology can do for you" rather than "what technology
can do to you" (Ayyagari et al. 2011). Therefore, in this research, we focused on the later concept by
showing the curvilinear nature of the technology stressors' relationships and their damaging effects on
employees. Our main motive behind testing non-linear relationships is to provide important
implications for researchers (in terms of developing new conceptual models based on curvilinear
patterns) and for managers (in terms of designing ICTs that stimulate psychological and
organizational effectiveness). The empirical support found in this paper opens up new avenues for
understanding stress. In particular, for managers dealing with different decisions to help employees
deal with high levels of stress, the findings suggest a need for novel and unconventional formulation
of strategies. Since, work/ICT designs influence individuals' psychological, social, and physical well-
being, then organizational interventions need to examine all features (i.e., task, technology,
environment, and individual) through systematic and methodical strategies to achieve balanced levels
of stress and optimum performance. Adopting the balance and equilibrium concepts can offer
effective and holistic solutions. Since intermediate levels of stressors should encourage employees to
push their efforts further (Akgun et al. 2006), our findings suggest developing appropriate diagnostic
and interventional tools to a) reduce or increase stressors to moderate instead of high or low levels
(excessiveness or absence), b) moderate the ICT-related characteristics that directly balance the
effects on stress and performance, c) directly evaluate the level of stressors found in the organization,
d) introduce new technologies reasonably and gradually, and e) better manage the stressors levels to
yield desirable effects by identifying the three phases of the triphasic stress model. Past studies such
as Tarafdar et al. (2007) already suggest the need for managers be cognizant of appropriate
management mechanisms to reduce TS to counter the inverse relationship between TS and
productivity (Tarafdar et al. 2007).
One main reason for the lack of nonlinear findings is the failure to clearly examine such relationships
(Salamin and Hom, 2005). This is one of the few studies that attempt to investigate the curvilinear
nature of TSS and invoke different theoretical lenses. Our findings a) propose further investigations in
non-linear relationships because they are “theoretically predominant and can be exceedingly useful
tools in developing stress theories” (Johnson, 2014) and b) address research calls for implementing
multiple theoretical perspectives in TS studies (Fischer and Riedl, 2017; Tarafdar et al. 2017); c)
extend previous studies (e.g., Selye, 1964, 1987; Ayyagari et al. 2011; Srivastava et al. 2015) by
11
distinguishing between the concepts of good and bad stress through the perspectives of stressors and
technology.
8 Discussion and Conclusion
Technology integration and dependence have created challenges and opportunities for organizational
and individual growth (Symantec, 2009). TS has been globally witnessed across different businesses,
organizations, nations and cultures (Chen, 2015). We followed suggestions (Jex et al. 1992; Muse et
al. 2009) to identify stress from a challenge rather than a threat perspective in the technology context.
Hence, we make a distinction between the concepts of being under-challenged and over-challenged.
First, our findings show that moderate levels of stressors are the optimum level to obtain best outcome
(Onyemah, 2008) as they are evaluated as challenges rather than hindrances leading to inner-
stimulation and higher performance outcomes (lower exhaustion) (Rodriguez-Escudero et al. 2010;
Gilboa et al. 2008). Second, through the triphasic stress model, we validate previous arguments that
quadratic and linear relationships can be seen as complementary in shaping a cubic form. The way we
react to stressful situations is important, but managing them is a more demanding task. Balancing
between high and low job or ICT-related stressful demands is achieved through developing
organizational awareness and appropriate new strategies. To conclude, research efforts and empirical
studies on TS have been very limited (Chen, 2015) and lacking in theoretical progress (Tarafdar et al.
2017). Therefore, our findings can promote further research.
References
Agho, A.O., J.L. Price and C.W. Mueller (1992). “Discriminant validity of measures of job satisfaction,
positive affectivity and negative affectivity”. Journal of Occupational and Organizational Psychology
65, 185±196.
Ahuja, M.K., K.M. Chudoba, C.J. Kacmar, D.H. McKnight and J.F. George (2007). “IT road warriors:
Balancing work– family conflict, job autonomy, and work overload to mitigate turnover intentions”.
MIS Quarterly 31(1), 1-17.
Ahearne, M., S.B. MacKenzie, P.M. Podsakoff, J.E. Mathieu and S.K. Lam (2010). “The role of
consensus in sales team performance”. Journal of Marketing Research 47(3), 458-469.
Akgun, A.E., G.S. Lynn and J.C. Byrne (2006). “Antecedents and consequences of unlearning in new
product development teams”. Journal of Product Innovation Management 23 (1): 73-88.
Anderson, C.L. and R. Agarwal (2010). “Practicing safe computing: a multimedia empirical examination
of home computer user security behavioral intentions”. Journal MIS Quarterly 34 (3), Pages 613-643.
Arnold, M.B. (1960). Emotion and personality (Vols 1 & 2). New York: Columbia University Press.
APA (American Psychological Association) (2009-2017). Stress in America. Press room.
Amabile, T., C.N. Hadley and S.J. Kramer (2002). “Creativity under the Gun”. Harvard Business Review
80 (8):52–61.
Atanasoff, L. and M.A. Venable (2017). “Technostress: Implications for Adults in the Workforce”. The
career development quarterly 65 (4).
Ausubel, J.H. and C. Marchetti (1997). Elektron: Electrical Systems in Retrospect and Prospect.
Technological Trajectories and the Human Environment, J.H. Ausubel and H.D. Langford, eds.,
National Academy, Washington DC, pp. 115-140.
Ayyagari, R., V. Grover and R. Purvis (2011). “Technostress: technological antecedents and
implications”. MIS Quarterly 35 (4), 831-858.
Bandura, A. (1997). Self-efficacy: The exercise of control. New York, NY: Freeman.
Barczak, G. and D. Wilemon (2003). “Team Member Experience in New Product Development: Views
from the Trenches”. R&D Management 33:463–479.
Baum, A. (1990). “Stress, intrusive imagery, and chronic distress”. Health Psychology 9, pp. 653–675.
Baroudi, J. J. (1985) “The Impact of Role Variables on IS Personnel Work Attitudes and Intentions”. MIS
Quarterly 9 (4), pp. 341-356.
Bentler, P.M. and D.G. Bonett (1980). “Significance tests and goodness of fit in the analysis of
covariance structures”. Psychological Bulletin 88, 588–606.
12
Bhuian, S.N., B. Menguc and R. Borsboom (2005). “Stressors and job outcomes in sales: a triphasic
model versus a linear-quadratic-interactive model.” Journal of Business Research 58 ,141–150.
Bono, J. E. and M.A. Vey (2005). “Toward understanding emotional management at work: A
quantitative review of emotional labor research”. Emotions in organizational behavior (pp. 213-233).
Brown, S. P., E. Jones and T.W. Leigh (2005). “The Attenuating Effect of Role Overload on
Relationships Linking Self-Efficacy and Goal Level to Work Performance.” Journal of Applied
Psychology 90 (5), 972–979.
Bruck, C. S. and T.D. Allen (2003). “The relationship between big five personality traits, negative
affectivity, type A behavior, and work-family conflict”. Journal of Vocational Behavior 63 (3), 457-
472.
Bulgurcu, B., H. Cavusoglu and I. Benbasat (2010). “Information Security Policy Compliance: An
Empirical Study of Rationality-Based Beliefs and Information Security Awareness”. MIS Quarterly
34 (3), pp.523-548.
Califf, C. B., S. Sarker and C. Fitzgerald (2016). The Bright and Dark Sides of Technostress: An
Empirical Study of Healthcare Workers. Conference: International Conference on Information
Systems. At: Forth Worth, Texas.
Carballedo, A., M. Doyle, G. Lavelle, J. Sojo, H. McCarthy, J. Gormley, V. O’Keane and T. Frodl
(2014). “Affective network hyperconnectivity and hypoconnectivity of cognitive control and ventral
attention networks in adults with high neuroticism scores”. Annals of Depression and Anxiety 1 (6),
1029.
Compeau, D. R. and C.A. Higgins (1995). “Computer self-efficacy: Development of a measure and
initial test”. MIS Quarterly 19, 189.
Cooper, C. and P. Dewe (2008). “Well-Being: Absenteeism, Presenteeism, Coasts and Challenges”.
Occupational Medicine 58, 522-524.
Cooper, C.L., P. Dewe and M. O’driscoll (2001). Organizational Stress: A Review and Critique of
Theory, Research and Applications. Sage, Thousand Oaks, California.
Costa, P. T., Jr. and R.R. McCrae (1985a). “Concurrent validation after 20 years: Implications of
personality stability for its assessment”. In J. N. Butcher & C. D. Spielberger (Eds.), Advances in
personality assessment (Vol. 4, pp. 31-54). Hillsdale, NJ: Lawrence Erlbaum.
Costa, P. T., Jr. and R.R. McCrae (1985b). The NEO Personality Inventory manual. Odessa, FL :
Psychological Assessment Resources.
Costa, P. T., Jr. and R.R. McCrae (1992). Revised NEO Personality Inventory (NEO-PI-R) and NEO
Five-Factor Inventory (NEO-FFI) professional manual. Odessa, FL: Psychological Assessment
Resources.
Champoux, J. E. (1978). “A preliminary examination of some complex job scope- growth need strength
interactions”. Academy of Management Proceedings 59-63.
Champoux, J. E. (1980). “A three sample test of some extensions to the Job Characteristics Model of
work motivation”. Academy of Management Journal 23, 466-478.
Champoux, J. E. (1992). “A multivariate analysis of curvilinear relationships among job scope, work
context satisfactions, and affective outcomes”. Human Relations 45, 87-111.
Chen, L. (2015). "Validating the Technostress Instrument using a Sample of Chinese Knowledge
Workers." Journal of International Technology and Information Management 24 (1).
Chilton, M.A., B.C. Hardgrave and D.J. Armstrong (2005). "Person-Job Cognitive Style Fit for Software
Developers: The Effect on Strain and Performance." Journal of Management Information Systems 22
(2), pp 193-226.
Christensen, C. M. (1997). The Innovator’s Dilemma: When New Technologies Cause Great Firms to
Fail. Boston Harvard Business School Press.
CNN (2006). "Making cell phones simple is hard”.
D’Arcy, J., A. Gupta, M. Tarafdar and O. Turel (2014). “Reflecting on the “Dark Side” of Information
Technology use.” Communications of the AIS, Forthcoming.
Erasmus, E. (2003). “Psychological Character of Computer-related Technostress”. CHI-SA Gauteng,
South Africa. Copyright ACM SIGCHI South Africa Chapter.
Eurofound and the International Labour Office (2017). Working anytime, anywhere: The effects on the
world of work. Ref: EF1658EN, DOI 10.2806/372726.
13
Ellsworth, P. C. and K.R. Scherer (2003). Appraisal processes in emotions. In R. J. Davidson, H.
Goldsmith, & K. R. Scherer (Eds.), Handbook of affective science (pp. 572-595). New York, NY:
Oxford University Press.
Fischer, T. and R. Riedl (2017). “Techostress research: A nurturing ground for measurement pluralism?”
Communications of the Association for Information Systems 40 (17), 375–401.
Folkman, S. and J.T. Moskowitz (2004). “Coping: pitfalls and promise”. Annual Review of Psychology
55:745-74.
Folkman, S. (2011). The Oxford Handbook of Stress, Health and Coping. Oxford University Press, New
York.
Folkman, S. (2013). Stress Appraisal and Coping. Springer, Berlin.
Fornell, C. and D.F. Larcker (1981). “Evaluating structural equation models with unobservable variables
and measurement error”. Journal of Marketing Research 18 (1), 39-50.
Foster, R. (1986). Innovation: The Attacker’s Advantage. Summit Books, New York.
Fredette, J., R. Marom, K. Steinert and L. Witters (2012). The Promise and Peril of Hyperconnectivity
for Organizations and Societies. World Economic Forum.
García, M., S. Llorens, M. Salanova and E. Cifre (2006). “Antecedentes de la autoeficacia en profesores
de instituto”. Revista de Educación 339, 387-400.
Gardner, D. G. (1986). “Activation theory and task design: An empirical test of several new predictions”.
Journal of Applied Psychology 71 (3), 411-418.
Gardner, D.G. and L.L. Cummings (1988). “Activation theory and job design: Review and
reconceptualization.” Research in Organizational Behavior 10, P. 81-122.
Gist, M.E. and T.R. Mitchell (1992). “Self-Efficacy: A Theoretical Analysis of Its Determinants and
Malleability”. The Academy of Management Review 17 (2), pp. 183-211.
Gilboa, S., A. Shirom, Y. Fried and C. Cooper (2008). “A Met-analysis of Work Demand Stressors and
Job Performance: Examining Main and Moderating Effects”. Personnel Psychology 61 (2), Pages
227-271.
Haans, R.F.J., C. Pierters and Z.L. He (2016). “Thinking About U: Theorizing and Testing U- and
Inverted U-Shaped Relationships in Strategy Research.” Strategic Management Journal 37: 1177–
1195.
Hair, J., R. Anderson, R. Tatham and W. Black (1998). Multivariate Data Analysis. Prentice Hall
International, London.
Haynes, S.N., D.C.S. Richard and E.S. Kubany (1995). “Content validity in psychological assessment: a
functional approach to concepts and methods”. Psychological Assessment 7 (3), 238-247.
Hu, L. and P. Bentler (1999). “Cutoff criteria for fit indices in covariance structure analysis: conventional
criteria versus new alternatives”. Structural Equation Modeling 6, 1-55.
Jehn, K.A. (1995). “A Multimethod Examination of the Benefits and Detriments of Intragroup Conflict”.
Administrative Science Quarterly 40 (2):256–282.
Jex, S.M., T.A. Beehr and C.K. Roberts (1992). “The Meaning of Occupational Stress Items to Survey
Recipients”. Journal of Applied Psychology 77 (5):623-8.
Jex, S. M., P.D. Bliese, S. Buzzell and J. Primeau (2001). “The impact of self-efficacy on stressor strain
relations: Coping style as an explanatory mechanism”. Journal of Applied Psychology 86, 401–409.
Johnson, J.S. (2014). “Nonlinear analyses in sales research: theoretical bases and analytical
considerations for polynomial models”. Journal of Personal Selling & Sales Management 34 (4),
302–317.
Kappas, A. (2001). A metaphor is a metaphor is a metaphor: Exorcising the homunculus from appraisal
theory. In K. R. Scherer, A. Schorr & T. Johnstone (Eds.), Appraisal processes in emotion: Theory,
methods, and research (pp. 157-172). Oxford, UK: Oxford University Press.
Kahn, R. and P. Byosiere (1992). Stress in organizations. In Handbook of Industrial and Organizational
Psychology (DUNNETTE M and HOUGH L, ds), pp 571-650, Consulting Psychologists Press, Palo
Alto, California.
Keltner, D., P.C. Ellsworth and K. Edwards (1993). “Beyond simple pessimism: Effects of sadness and
anger on social perception”. Journal of Personality & Social Psychology 64, 740-752.
Khan, Z. and S.L. Jarvenpaa (2010). “Exploring temporal coordination of events with Facebook.com”. Journal of Information Technology 25 (2), pp 137–151.
14
Kumaresan, S. and T. Ramayah (2005). “Organizational and personality influences on job stress: The
case of Malaysian managers”. Malaysian Management Review.
Lazarus, R.S. (1966). Psychological stress and the coping process. New York: McGraw-Hill.
Lazarus, R.S. (1993). “From psychological stress to the emotions: a history of changing outlooks”.
Annual Review of Psychology 44 (1), 1-22.
Lazarus, R. S. and S. Folkman (1984). Stress, Appraisal, and Coping. New York: Springer.
Le Fevre, M., J. Matheny and G. Kolt (2003). ‘Eustress, distress, and interpretation in occupational
stress”. Journal of Managerial Psychology 18 (7), 726–744.
Leary, M.R., A.L. Haupt, K.S. Strausser and J.T. Chokel (1998). “Calibrating the sociometer: The
relationship between interpersonal appraisals and self-esteem”. Journal of Personality and Social
Psychology 74:1290–1299.
Lerner, J. S. and D. Keltner (2001). “Fear, anger, and risk”. Journal of Personality and Social
Psychology 81 (1), 146-159.
Leung K., K.L. Huang, C.H. Su and L. Lu (2011). “Curvilinear relationships between role stress and
innovative performance: Moderating effects of perceived support for innovation.” Journal of
Occupational and Organizational Psychology 84, 741–758.
Lewis, M. D. (2005). “Bridging emotion theory and neurobiology through dynamic systems modeling”.
Behavioral and Brain Sciences 28, 169-194.
Llorens, S., W. Schaufeli, A. Bakker and M. Salanova (2007). “Does a positive gain spiral of resources,
efficacy beliefs and engagement exist?” Computers in Human Behavior 23, pp. 825-841.
Liang, H., N. Saraf, Q. Hu and Y. Xue (2007). “Assimilation of enterprise systems: the effect of
institutional pressures and the mediating role of top management”. MIS Quarterly 31, 59–87.
Lindberg, E., J. Wincent and D. Ortqvist (2013). “Turning stressors into something productive: an
empirical study revealing nonlinear influences of role stressors on self-efficacy”. Journal of Applied
Social Psychology 43 (2), 263–274.
Little, L.M., B.L. Simmons and D.L. Nelson (2007). “Health Among Leaders: Positive and Negative
Affect, Engagement and Burnout, Forgiveness and Revenge”. Journal of Management Studies 44 (2),
pp. 243–260.
Maier, C., S. Laumer, C. Weinert and T. Weitzel (2015). “The effects of technostress and switching
stress on discontinued use of social networking services: a study of Facebook use”. Information
System Journal 25 (3), https://doi.org/10.1111/isj.12068
Martínez, I. and M. Salanova (2005). ‘Burnout en la enseñanza’. Revista de Psicología del Trabajo y las
Organizaciones 21, 55-70.
Mazmanian, M. and I. Erickson (2014). The product of availability: Understanding the economic
underpinnings of constant connectivity. In CHI 2014: One of a CHInd - Conference Proceedings,
32nd Annual ACM Conference on Human Factors in Computing Systems (pp. 763-772). Association
for Computing Machinery. DOI: 10.1145/2556288.2557381.
McGrath, J.E. (1976). Stress and behavior in organizations. In Handbook of Industrial and
Organizational Psychology (DUNNETTE M. D. Ed.), pp 1351-1395 Rand-McNally, Chicago,
Illinois.
McGee, M. K. (1996). “Burnout!”. InformationWeek, pp. 34-40.
McCrae, R.R. and P.T. Jr. Costa (2003). Personality in adulthood: A Five-Factor Theory perspective
(2nd. ed.). New York: Guilford Press. McCrae, R. R., & Costa, P. T., Jr. (in press). Cross-cultural
perspectives on adult personality trait development. In D. Mroczek & T. Little (Eds.), Handbook of
personality development. Hillsdale, NJ: Erlbaum.
Mihalache, O.R., J.J.J.P. Jansen, F. Van Den Bosch and H.W. Volberda (2012). “Offshoring and firm
innovation: the moderating role of top management team attributes”. Strategic Management Journal
33 (13), 1480-1498.
Muse, L.A., S.G. Harris and H.S. Field (2009). “Has the Inverted-U Theory of Stress and Job
Performance Had a Fair Test?” Human Performance 16 (4), 349-364, DOI:
10.1207/S15327043HUP1604_2.
Nelson, D.L. and B.L. Simmons (2003-2004). Eustress: An elusive construct, an engaging pursuit. In
Emotional and Physiological Processes and Positive Intervention Strategies. Research in Occupational
Stress and Well-being (PERREWE PL and GANSTER DC, Eds), Vol. 3, pp 265-322, Emerald Group
Publishing Limited, Oxford, UK.
15
Nygaard, A. and R. Dahlstrom (2002). “Role stress and effectiveness in horizontal alliances.” Journal of
Marketing 66 (2), pg. 61.
Ohly, S. and A. Latour (2014). “Work-related smartphone use and well-being in the evening: The role of
autonomous and controlled motivation”. Journal of Personnel Psychology 13 (4),174–183.
Onyemah, V. (2008). “Role Ambiguity, Role Conflict, and Performance Empirical Evidence of an
Inverted-U Relationship”. Journal of Personal Selling & Sales Management 28, 299-313.
Preacher, K.J. and A.F. Hayes (2010). “Quantifying and Testing Indirect Effects in Simple Mediation
Models When the Constituent Paths Are Nonlinear”. Multivariate Behavioral Research 4, :627–660.
Podsakoff, P.M., S.B. Mackenzie, J. Lee and N.P. Podsakoff (2003). “Common method biases in
behavioral research: a critical review of the literature and recommended remedies”. Journal of
Applied Psychology 88 (5), 879-903.
Ragu-Nathan, T. S., M. Tarafdar, B.S. Ragu-Nathan and T. Qiang (2008). “The consequences of
technostress for end users in organizations: conceptual development and empirical validation.”
Information Systems Research 19 (4), 417-433.
Reisenzein, R. and T. Hofmann (1993). “Discriminating emotions from appraisal-relevant situational
information: Baseline data for structural models of cognitive appraisals”. Cognition and Emotion 7,
271-293.
Rodríguez-Escudero, A.I., C. Pilar and J. Munuera-Alemán (2010). “Positive and Negative Effects of
Team Stressors on Job Satisfaction and New Product Performance”. Journal of Product Innovation
Management 27 (6):856 – 868. DOI10.1111/j.1540-5885.2010.00756.
Roseman, I. J. and S. Kaiser (2001). Applications of appraisal theory to understanding, diagnosing, and
treating emotional pathology. In K. R. Scherer, A. Schorr, & T. Johnstone (Eds.), Appraisal processes
in emotion: Theory, methods, research (pp. 249-267). New York, NY: Oxford University Press.
Roseman, I. J. and C.A. Smith (2001). Appraisal theory: Overview, assumptions, varieties, controversies.
In K. R. Scherer, A. Schorr, & T. Johnstone (Eds.), Appraisal processes in emotion: Theory, methods,
research (pp. 3-19). Oxford, UK: Oxford University Press.
Ruthig, J. C., R.P. Perry, S. Hladkyj, N.C. Hall, R. Pekrun and J.G. Chipperfield (2008). “Perceived
control and emotions: interactive effects on performance in achievement settings”. Social
Psychological Education 11, 161–180.
Saarni, C. (2000). Emotional Competence: A Developmental Perspective. In R. Bar-On, & J. D. A.
Parker (Eds.), The Handbook of Emotional Intelligence: Theory, Development, Assessment, and
Application at Home, School, and in the Workplace (pp. 68-91). San Francisco, CA: Jossey-Bass.
Salamin, A. and P.W. Hom (2005). “In Search of the Elusive U-Shaped Performance-Turnover
Relationship: Are High Performing Swiss Bankers More Liable to Quit?” Journal of Applied
Psychology 90 (6), 1204-1216.
Scherer, K.R., E.S. Dan and A. Flykt (2006). “What determines a feeling’s position in affective space? A
case for appraisal”. Cognition and Emotion 20 (1), 92-113.
Schaubroeck, J. and D.C. Ganster (1993). “Chronic demands and responsivity to challenge”. Journal of
Applied Psychology 78, 73-85.
Schwarzer, R. (Ed.) (1992). Self-efficacy: Thought control of action. Washington, DC: Hemisphere.
Scott, W.E. (1966). “Activation theory and task design”. Organizational Behavior and Human
Performance 1, 3-30.
Selye, H. (1950). The physiology and pathology of exposure to stress: a treatise based on the concepts of
the general adaptation-syndrome and the diseases of adaptation. Montreal, Canada: ACTA.
Selye, H. (1956). The Stress of Life. McGraw-Hill, New York, New York.
Selye, H. (1964). From Dream to Discovery. McGraw-Hill, New York, NY.
Selye, H. (1973). “The evolution of the stress concept”. American Scientist 61 (6), 692-699.
Selye, H. (1974). Stress without distress. Philadelphia, PA: J.B. Lippincott Co.
Selye, H. (1983). The Stress Concept: Past, Present and Future. Stress Research, C.L. Cooper (eds.),
New York: John Wiley.
Selye, H. (1987). Stress without Distress. Transworld, London.
Seligman, M.E.P. and M. Csikszentmihalyi (2000). “Positive Psychology: An Introduction”. American
Psychologist 55 (1):5-14 DOI10.1037/0003-066X.55.1.5
Sethi, A.S., D.H.J. Caro and R.S. Schuler (1987). Strategic Management of Technostress in an
Information Society, Hogrefe.
16
Schwab, D.P. and L.L. Cummings (1976). “A theoretical analysis of the impact of task scope on
employee performance”. Academy of Management Review 1, 23–35.
Srivastava, S.C., S. Chandra and A. Shirish (2015). “Technostress creators and job outcomes: theorizing
the moderating influence of personality traits.” Information Systems Journal 25, 355–401.
Shu, Q., Q. Tu and K. Wang (2011). “The impact of computer self-efficacy and technology dependence
on computer- related technostress: a social cognitive theory perspective.” International Journal of
Human-Computer Interaction 27, 923–939.
Singh, J. (1998). “Striking a Balance in Boundary-Spanning Positions: An Investigation of Some
Unconventional Influences of Role stressors and Job Characteristics.” Journal of Marketing 62, 69-
86.
Sonnentag, S. and U. Kruel (2006). “Psychological detachment from work during off-job time: The role
of job stressors, Job involvement, and recovery-related self-efficacy”. European Journal of Work and
Organizational Psychology 15 (2) DOI10.1080/13594320500513939.
Sood, A. and G.J. Tellis (2005). “Technological Evolution and Radical Innovation”. Journal of
Marketing 69, 152–168.
Steiger, J.H. (1990). “Structural model evaluation and modification: an interval estimation approach”.
Multivariate Behavioural Research 25, 173±180.
Stoeva, A. Z., R.K. Chiu and J.H. Greenhaus (2002). “Negative affectivity, role stress, and work–family
conflict”. Journal of Vocational Behavior 60 (1), 1–16.
Strumpfer, D. (1986). Executive stress. (In Barling, J., Fullagar, C. & Bluen, S. Behaviour in
organisations: South African perspectives. Isando: McGraw-Hill. p. 533-559.
Suharti, L. and A. Susanto (2014). “The impact of workload and technology competence on technostress
and performance of employees”. Indian Journal of Commerce and Management Studies 5 (2), 1-7.
Symantec (2009). Symantec Internet Security Threat Report. Trends for 2008.
Takeuchi, R., D.P. Lepak, S.V. Marinova and S. Yun (2007). “Nonlinear influences of stressors on
general adjustment: The case of Japanese expatriates and their spouses”. Journal of International
Business Studies 38 (6), 928-943.
Tarafdar, M., T.U. Qiang, T.S. Ragu-Nathan and B.S. Ragu-Nathan (2011). “Crossing to the dark side:
examining creators, outcomes, and Inhibitors of technostress.” Communications of the ACM 54 (9),
113-120.
Tarafdar, M., Q. Tu, B.S. Ragu-Nathan and T.S. Ragu-Nathan (2007). “The impact of technostress on
role stress and productivity.” Journal of Management Information Systems 24 (1), 301-328.
Tarafdar, M., Q. Tu and T.S. Ragu-Nathan (2010). “Impact of technostress on end-user satisfaction and
performance.” Journal of Management Information Systems 27 (3), 303-334.
Tarafdar, M., E.B. Pullins and T.S. Ragu-Nathan (2014). “Examining impacts of technostress on the
professional salesperson's behavioural performance”. Journal of Personal Selling & Sales
Management 34 (1), 51-69.
Tarafdar, M., C.L. Cooper and J.F. Stich (2017). “The technostress trifecta—Techno eustress, techno
distress and design: Theoretical directions and an agenda for research”. Information Systems Journal
1 (37).doi: 10.1111/isj.12169.
Tellegen, A. (1985). Structures of Mood and Personality and Their Relevance to Assessing Anxiety, with
an Emphasis on Self-Report. In A. H. Tuma, & J. D. Master (Eds.), Anxiety and the Anxiety
Disorders (pp. 681-706). Hillsdale, NJ: Erlbaum.
Tong, E.M.W., P.C. Ellsworth and G.D. Bishop (2009). “An S-Shaped Relationship Between Changes in
Appraisals and Changes in Emotions”. Emotion 9 (6):821-37 DOI10.1037/a0017812.
Tong, E.M.W. and K.L.H. Tay (2011). “S-shaped Appraisal–Emotion Relationships: The Role of
Neuroticism.” Social Psychological and Personality Science 2 (5) 487-493.
Treisman, M. (1999). “There are two types of psychometric function: A theory of cue combination in the
processing of complex stimuli with implications for categorical perception”. Journal of Experimental
Psychology: General 128, 517-546. doi:10.1037/ 0096-3445.128.4.517.
Tu, Q., K. Wang and Q. Shu (2005). “Computer-Related Techno-stress in China.” Communications of
the ACM 48 (4), pp. 77-81.
Utterback, J.M. (1994). “Radical Innovation and Corporate Regeneration.” Research Technology
Management 37 (4), 10.
17
Uotila, J., M. Maula, T. Keil and S.A. Zahra (2009). “Exploration, exploitation, and financial
performance: analysis of S&P 500 corporations”. Strategic Management Journal 30 (2), 221-231.
Van den Heuvel, O.A., Y.D. Van der Werf, K.M.W. Verhoef, S.J. De Wit, H.W. Berendse, E.C. Wolters
(2010). “Frontal-striatal abnormalities underlying behaviours in the compulsive-impulsive spectrum”.
Journal of Neuro Science 289: 55–59.
Villavicencio, F. T. and A.B.I. Bernardo (2013). “Positive academic emotions moderate the relationship
between self‐regulation and academic achievement”. British Journal of Educational Psychology 83
(2), 329-340.
Watson, D. and L.A. Clark (1984). “Negative affectivity: The disposition to experience aversive
emotional states”. Psychological Bulletin 96, 465-490.
Wang, K., Q. Shu and Q. Tu (2008). “Technostress under different organizational environments: An
empirical investigation.” Computers in Human Behavior 24 (6), 3002-3013.
18
Appendix
Variables Item # References Mean St. Dev.
TO 5 items
Ragu-Nathan et al., 2008; Tarafdar et al., 2007
2.98 0.99
TC 5 items 2.45 1.00
TUN 3 items 3.71 0.88
SE 6 items Compeau & Higgins, 1995 3.52 0.78
PR 6 items Ayyagari et al., 2001 3.66 0.72
NA 6 items Watson & Clark, 1984; Agho et al., 1992 2.91 1.06
TE 4 items Ayyagari et al., 2011 2.64 1.09
DIS 3 items Maier et al., 2015 3.00 0.87
Table 1. Items, Sources and Descriptive Statistics
Cronbach’s
alpha
Composite
Reliability
Average Variance
Extracted (AVE)
Maximum Shared
Variance (MSV)
DIS 0.847 0.908 0.766 0.319
SE 0.869 0.901 0.602 0.355
NA 0.909 0.928 0.683 0.437
PR 0.849 0.888 0.569 0.355
TC 0.867 0.904 0.655 0.442
TO 0.837 0.883 0.606 0.442
TUN 0.805 0.885 0.719 0.304
TE 0.917 0.942 0.801 0.437
Table 2. Cronbach’s alpha, CR, AVE, MSV
*(MSV < AVE) (Fornell & Larcker, 1981) supports discriminant validity
CMIN/DF CFI NFI RMSEA SRMR
1.881 0.90 0.88 0.051 0.075
= or < 3 = or > 0.90 = or > 0.90 = or < 0.05 = or < 0.08
Hair et al. 2010 Hair et al. 2010 Bentler & Bonnet, 1980 Steiger, 1990 Hu & Bentler, 1999
Table 3. Model fit
R R² Adjusted R² VIF = (1/1-R²i)
Model 1 0.523 0.274 0.256 *1.38
Model 2 0.567 0.321 0.315 *1.47
Model 3 0.462 0.213 0.209 *1.27
Table 4. R, R², Adjusted R², and VIFs
*VIFs < 5, Multicollinearity is not a problem in this research
Models R R² F-Test Difference in R²
SE-TSS (Linear Function) 0.349 0.122 29.499
SE-TSS (Quadratic Function) 0.350 0.122 14.782
SE-TSS (Cubic Function) 0.371 0.138 11.250
PR-TSS (Linear Function) 0.355 0.126 30.352
PR-TSS (Quadratic Function) 0.372 0.139 16.888
PR-TSS (Cubic Function) 0.376 0.141 11.474
TSS-TE (Linear Function) 0.536 0.288 86.02
TSS-TE (Quadratic Function) 0.567 0.321 50.199
Table 5. Curve Fitting Analyses - Anova F-Test
19
Table 6. Harman’s One Factor Test – Total Variance Explained
Model 1 Model 3
Variables Technostressors Discontinuous Usage
Intention
t Stnd B St Er. t Stnd B St Er.
ICT efficacy³ 2.464* .208* .025* Technoexhaustion 7.595* .462* .048*
Presenteeism³ 4.327* .262* .031*
NegativeAffectivity³ 5.496* .392* .018*
NA x PR³ -.367 -.028 .013
NA x SE³ 2.153** .188** .006**
Model 2
Technoexhaustion
t Stnd B St Er.
Technostressors² 3.244* .185* .083*
Table 7. Linear and Nonlinear Regression Analyses n = 215, * (p<0.015), ** (p<0.05)
Figure 1. Triphasic stress model Figure 2. Technological S Curve
Source: Sood & Tellis, 2005
Component
Initial Eigenvalues Rotation Sums of Squared Loadings
Total % of
Variance
Cumulative % Total % of
Variance
Cumulative %
1 10.265 27.742 27.742 4.479 12.106 12.106
2 5.357 14.479 42.221 3.790 10.245 22.350
3 2.724 7.361 49.583 3.460 9.353 31.703
4 1.885 5.095 54.678 3.134 8.469 40.172
5 1.588 4.292 58.970 3.100 8.377 48.550
6 1.455 3.932 62.902 3.072 8.302 56.852
7 1.290 3.486 66.388 2.372 6.410 63.261
8 1.189 3.213 69.601 2.346 6.340 69.601
9 0.836 2.258 71.860
20
Figure 4. SE-TSS Cubic S-shaped Relationship Figure 5. PR-TSS Cubic S-shaped Relationship
Figure 6. TSS-TE U-shaped Relationship Figure 7. TE-DIS Linear Relationship
Figure 8. SE-NA-TSS Interaction
21
Ba0 Ba1 Bb1 Bc1 Knot1 Knot2
Ba0 1.000 -.972 .145 .000 -.507 .000
Ba1 -.972 1.000 -.150 .000 .640 .000
Bb1 .145 -.150 1.000 -.985 .335 -.939
Bc1 .000 .000 -.985 1.000 -.434 .930
Knot1 -.507 .640 .335 -.434 1.000 -.325
Knot2 .000 .000 -.939 .930 -.325 1.000
Table 8a. SE-TSS Cubic Spline - Correlations of Parameter Estimates
Ba0 Ba1 Bb1 Bc1 Knot1 Knot2
Ba0 1.000 -1.000 1.000 -.160 -1.000 .078
Ba1 -1.000 1.000 -1.000 .160 1.000 -.078
Bb1 1.000 -1.000 1.000 -.160 -1.000 .078
Bc1 -.160 .160 -.160 1.000 .160 .386
Knot1 -1.000 1.000 -1.000 .160 1.000 -.078
Knot2 .078 -.078 .078 .386 -.078 1.000
Table 8b. PR-TSS Cubic Spline - Correlations of Parameter Estimates
Figure 9. Nonlinear Mediation Model
Bias Corrected Bootstrap Confidence Interval for THETA
XVAL LowerCI THETA UpperCI
2.3441 0.0488 0.1392 0.2844
3.0476 0.1078 0.2490 0.3926
3.7511 0.1557 0.3588 0.5746
Table 9. Instantaneous Indirect Effects
Component
1 2 3 4 5 6 7 8
Techno-Overload 1 .043 -.060 .045 .065 .718 .004 -.100 .040
Techno-Overload 2 .156 .141 .254 .016 .658 .326 .114 -.076
Techno-Overload 3 .148 .108 .277 .004 .757 .146 .173 -.039
Techno-Overload 4 .028 .105 .189 .136 .675 .180 -.054 .281
Techno-Overload 5 .141 .134 .278 .164 .665 .194 .124 .092
Techno-Complexity 1 .245 .008 .729 -.051 .161 .206 .155 .066
Techno-Complexity 2 .217 -.008 .723 .041 .045 .142 .131 -.064
Techno-Complexity 3 .197 .063 .713 -.130 .359 .118 .115 -.070
Techno-Complexity 4 .121 .133 .618 .107 .277 .139 .084 .153
Techno-Complexity 5 .179 .022 .794 -.009 .221 .198 .176 -.018
Techno-Uncertainty 2 -.039 .071 .113 .202 .127 -.062 .037 .777
Techno-Uncertainty 3 .043 .146 -.039 .258 -.032 .091 .030 .817
Techno-Uncertainty 4 -.006 .134 -.052 .154 .089 -.012 -.018 .806
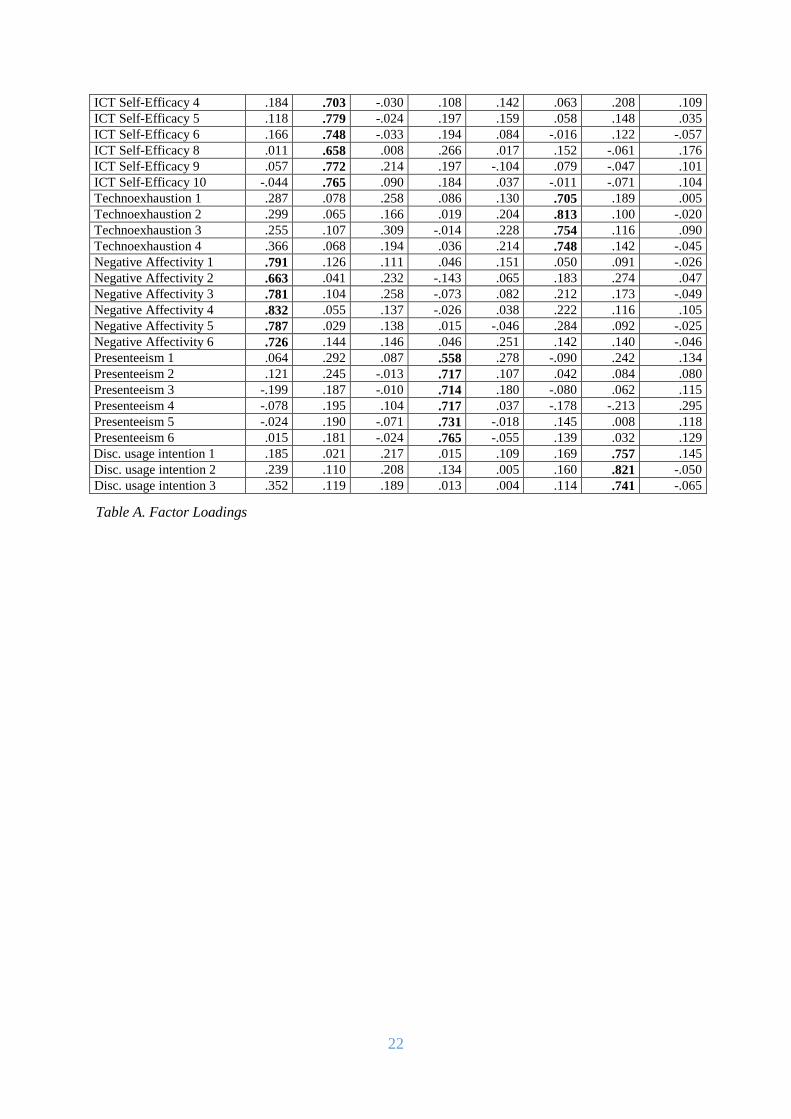
22
ICT Self-Efficacy 4 .184 .703 -.030 .108 .142 .063 .208 .109
ICT Self-Efficacy 5 .118 .779 -.024 .197 .159 .058 .148 .035
ICT Self-Efficacy 6 .166 .748 -.033 .194 .084 -.016 .122 -.057
ICT Self-Efficacy 8 .011 .658 .008 .266 .017 .152 -.061 .176
ICT Self-Efficacy 9 .057 .772 .214 .197 -.104 .079 -.047 .101
ICT Self-Efficacy 10 -.044 .765 .090 .184 .037 -.011 -.071 .104
Technoexhaustion 1 .287 .078 .258 .086 .130 .705 .189 .005
Technoexhaustion 2 .299 .065 .166 .019 .204 .813 .100 -.020
Technoexhaustion 3 .255 .107 .309 -.014 .228 .754 .116 .090
Technoexhaustion 4 .366 .068 .194 .036 .214 .748 .142 -.045
Negative Affectivity 1 .791 .126 .111 .046 .151 .050 .091 -.026
Negative Affectivity 2 .663 .041 .232 -.143 .065 .183 .274 .047
Negative Affectivity 3 .781 .104 .258 -.073 .082 .212 .173 -.049
Negative Affectivity 4 .832 .055 .137 -.026 .038 .222 .116 .105
Negative Affectivity 5 .787 .029 .138 .015 -.046 .284 .092 -.025
Negative Affectivity 6 .726 .144 .146 .046 .251 .142 .140 -.046
Presenteeism 1 .064 .292 .087 .558 .278 -.090 .242 .134
Presenteeism 2 .121 .245 -.013 .717 .107 .042 .084 .080
Presenteeism 3 -.199 .187 -.010 .714 .180 -.080 .062 .115
Presenteeism 4 -.078 .195 .104 .717 .037 -.178 -.213 .295
Presenteeism 5 -.024 .190 -.071 .731 -.018 .145 .008 .118
Presenteeism 6 .015 .181 -.024 .765 -.055 .139 .032 .129
Disc. usage intention 1 .185 .021 .217 .015 .109 .169 .757 .145
Disc. usage intention 2 .239 .110 .208 .134 .005 .160 .821 -.050
Disc. usage intention 3 .352 .119 .189 .013 .004 .114 .741 -.065
Table A. Factor Loadings