Embed Size (px)
Citation preview
Understanding the implications of Climate Change for woodland biodiversity and
community functioning
Pam Berry, Environmental Change Institute, University of Oxford
Yuko Onishi, Environmental Change Institute, University of Oxford
James Paterson, Centre for Environmental Management, University of Nottingham
Report commissioned by the Forestry Commission (UK)
1

Contents 1. Introduction ..........................................................................................................................3 2. Climate change ......................................................................................................................4
2.1. Introduction.........................................................................................................................4
2.2. Recent changes in climate ...................................................................................................4
2.3. Modelling future climate change ........................................................................................4
2.4. Observed impacts of climate change on biodiversity..........................................................6
2.5. Predicting climate change effects on biodiversity...............................................................6
3. Methodology.........................................................................................................................8
3.1. Literature review .................................................................................................................8
3.2. Bioclimate envelope modelling ...........................................................................................9
4. Results................................................................................................................................. 13
4.1. Reviewing the effects of climate change on biodiversity and community function .........13 4.2. Impacts of climate change on woodland Priority Habitat species ‐ results from the
bioclimate envelope modelling .........................................................................................16
4.3. Analysis of results in relation to the National Vegetation Classification (NVC).................31
4.4. Impacts of climate change on rare and charismatic species .............................................33
4.5. Potential new species ........................................................................................................41
5. Discussion............................................................................................................................ 42
5.1. Application of bioclimate models......................................................................................42
5.2. Comparison with Ecological Site Classification results ......................................................43
5.3. Potential impacts on woodland structure and function ...................................................51
5.4. Biological adaptation to climate change ...........................................................................54
5.5. Adaptation strategies for biodiversity conservation .........................................................54
5.6. Non‐intervention ...............................................................................................................61
5.7. Data gaps ........................................................................................................................... 65
5.8. Further Study.....................................................................................................................65
6. Conclusions ......................................................................................................................... 73
7. References........................................................................................................................... 77
8. Appendices........................................................................................................................ 102
8.1. Sources of European Species distribution data ...............................................................102
8.2. Modelling results for 8 climate change scenarios ...........................................................104
2

1. Introduction Forests and woodlands are important parts of the landscape of the UK covering over two and a
half million hectares (an area slightly larger than Wales), which equates to 12% of our total land
area. The tree species native to the UK have gradually spread in response to the local climate,
atmosphere and soils since the last glaciers retreated over 10,000 years ago. Other woodland
community assemblages have similarly developed in relation both directly to the climate and
indirectly through their link to the tree species. However, future climate changes are predicted to
have a range of effects on our native species which may have dramatic consequences for
woodland community structure and function.
There is much evidence of recent climate change impacting upon species in Europe and the UK
(Broadmeadow et al., 2002; Sparks & Menzel, 2002; Boisvenue & Running, 2006; Broadmeadow et
al., 2009a; Sier & Scott, 2009). There is, however, much less evidence for habitats (but see Sanz‐
Elorza et al., 2003; Peñuelas et al., 2007). The impacts on species may be of interest if the species
is of key importance to the habitat's composition ‐ for example tree species for woodlands ‐ and
may help in understanding the implications of climate change for woodland biodiversity and
community functioning. There are many approaches to identifying and projecting the impacts of
environmental pressures, including climate change, on biodiversity. The sensitivity of habitats to
future climate change can be established by a number of approaches. These include extrapolation
of observed and experimental data (Sparks, 2007) and niche and dynamic vegetation modelling
(e.g., Woodward & Lomas, 2004). In this report, the impacts are addressed through a review of the
existing evidence and literature, as well as further detailed analysis of the outputs of a bioclimate
envelope model, SPECIES.
This report sets out to examine the known effects of climate change on woodland biodiversity and
functioning, focusing on woodland Priority Habitats, as well as rare and charismatic species. The
effects of the arrival and increase of new species in the UK are also examined. Despite an
increasing body of work examining these issues there are still major knowledge gaps in this field;
here we make suggestions for further research, including methods for filling these gaps.
3

2. Climate change
2.1. Introduction
During the 20th century and especially during the later part, observed changes in climate were
increasingly seen as being due to human emissions and land cover change altering the
overwhelming scientific consensus is that man‐made causes have resulted in significant changes to
our climate since the industrial revolution (Hegerl et al., 2007; Le Treut et al., 2007).
2.2. Recent changes in climate
There are numerous methods for understanding changes in climate over various time‐scales and
all rely on observational records or measures of either direct climatic changes (e.g., temperature,
snowfall) or indirect changes (e.g., glacier retreat, sea‐level rise) (Trenberth et al., 2007). For
example, observational records (in some instances that go back many centuries) show global
average air and ocean temperatures have increased, snow cover has reduced and average sea
levels have risen over the past century (Lemke et al., 2007). Global average surface temperature is
perhaps the climatic variable that has changed most though: from 1906 to 2005 it rose by 0.74°C ±
0.18°C; between 1956 and 2005 it has risen by 0.13°C per decade (Trenberth et al., 2007).
In the UK, mean annual temperature (derived from the Central England Temperature monthly
series which is based on a number of weather stations around England, but is highly correlated
with temperature data from other British stations) has risen by approximately 1°C since 1980 and
the increase is actually is more pronounced than the global average over the same period (Jenkins
et al., 2009). In Scotland and Northern Ireland this rise has been 0.8°C. Annual mean precipitation
in England and Wales has remained relatively unchanged over the last few centuries, although the
summer rainfall has slightly decreased and winter rainfall has slightly increased.
2.3. Modelling future climate change
The science of global climate prediction is an ongoing undertaking of improvement and
understandably involves a complex and detailed process. Here, we outline the main aspects.
2.3.1. Emissions scenarios
The modelling used in this report relied upon a series of four emissions scenarios developed by the
IPCC (Nakićenović et al., 2009). These emissions scenarios (SRES ‐ Special Report on Emissions
Scenarios) were created to cover a range of different possible patterns of GHG emissions; they are
based on likely further economic development and encompass worst‐case scenarios, as well as
sustainable development forecasts.
This report utilises two contrasting scenarios:
• A2 scenarios represent a less cohesive world in which many nations are self‐reliant and
independent, the population increases unabated, there is slower uptake of technologies and
economic development is regional rather than global.
4
• The B1 scenarios are altogether more sustainable and integrated. Rapid economic growth
occurs but it is more oriented towards information and services, rather than primary
industry. The global population reaches a maximum of 9 billion in 2050; clean and resource
efficient technologies gain in popularity, as does an emphasis on economic, social and
environmental stability (Nakićenović et al., 2009).
2.3.2. General Circulation Models
In order to predict future climate change modellers have developed General Circulation Models
(GCMs) which are mathematical representations of atmospheric, ocean, cryosphere and land
parameters (Randall et al., 2007). They produce climate scenarios on a three‐dimensional grid over
the earth, albeit at a relatively coarse resolution, which produces averaged properties over the
large scales involved (and hence provides one source of uncertainty). Current models utilise ocean
and atmospheric (AOGCMs), as well as sea ice levels or evapotranspiration to produce better
quality outputs and are increasingly capable of incorporating feedback mechanisms, like water
vapour and warming, ice and snow albedo. The models use climate simulations (usually over a
defined time period) to project temperature changes under future climate scenarios (using the
SRES scenarios above).
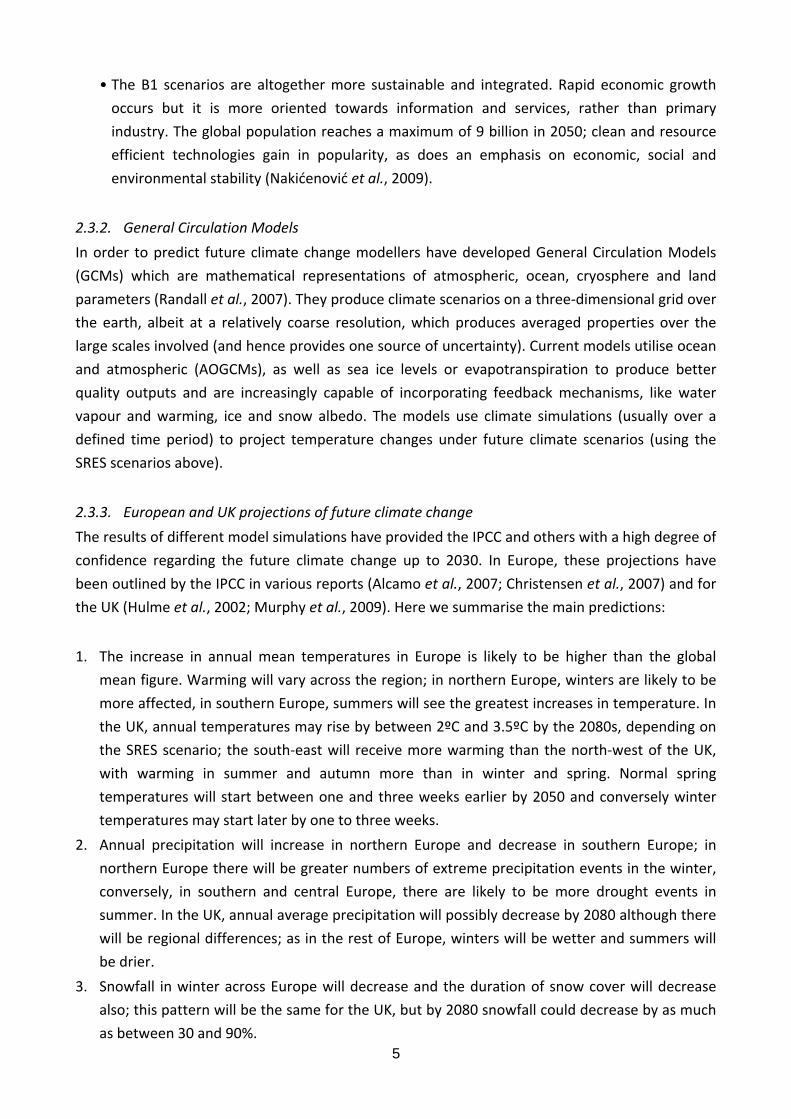
2.3.3. European and UK projections of future climate change
The results of different model simulations have provided the IPCC and others with a high degree of
confidence regarding the future climate change up to 2030. In Europe, these projections have
been outlined by the IPCC in various reports (Alcamo et al., 2007; Christensen et al., 2007) and for
the UK (Hulme et al., 2002; Murphy et al., 2009). Here we summarise the main predictions:
1. The increase in annual mean temperatures in Europe is likely to be higher than the global
mean figure. Warming will vary across the region; in northern Europe, winters are likely to be
more affected, in southern Europe, summers will see the greatest increases in temperature. In
the UK, annual temperatures may rise by between 2ºC and 3.5ºC by the 2080s, depending on
the SRES scenario; the south‐east will receive more warming than the north‐west of the UK,
with warming in summer and autumn more than in winter and spring. Normal spring
temperatures will start between one and three weeks earlier by 2050 and conversely winter
temperatures may start later by one to three weeks.
2. Annual precipitation will increase in northern Europe and decrease in southern Europe; in
northern Europe there will be greater numbers of extreme precipitation events in the winter,
conversely, in southern and central Europe, there are likely to be more drought events in
summer. In the UK, annual average precipitation will possibly decrease by 2080 although there
will be regional differences; as in the rest of Europe, winters will be wetter and summers will
be drier.
3. Snowfall in winter across Europe will decrease and the duration of snow cover will decrease
also; this pattern will be the same for the UK, but by 2080 snowfall could decrease by as much
as between 30 and 90%. 5

2.4. Observed impacts of climate change on biodiversity
The evidence of climate change impacts on species and habitats so far recorded is quite extensive.
Changes in climate can affect a number of aspects of a species' autoecology including phenology
(timing events like bud burst, senescence, etc.), growth, reproduction, germination,
establishment, competition and response to herbivory (Fitter & Fitter, 2002; Sparks et al., 2002).
These impacts not only affect species and their populations, but can have serious implications for
community structures and ultimately even ecosystem function (McCarty, 2001). The evidence for
impacts of climate change on species is now very conclusive (for issues of attribution see: Shoo et
al., 2006) and in recent years a number of comprehensive reviews of the impacts of climate
change on biodiversity have been produced summarising effects across different taxonomic
groups, biological systems, regions and type of response (Parmesan & Yohe, 2003; Root et al.,
2003; Hickling et al., 2006; Thomas et al., 2006).
In Section 4.1 we review the literature on climate change impacts on five main aspects of change
(physiological changes, distribution shifts, phenology, evolutionary change and community
responses) pertinent to species found in woodland habitats and conclude with a discussion of the
likely consequences for woodland ecosystem functioning.
2.5. Predicting climate change effects on biodiversity
Ecologists have a range of tools to utilise for prediction although they all have strengths and
weaknesses. Currently, the five main methods of studying the effects of climate change on plant
and animal communities involve some form of extrapolation or inference (Morecroft & Paterson,
2006); these are:
• Direct long‐term monitoring of species or habitats;
• Experimental control of climatic factors on species or habitats;
• Inference from spatial patterns in plant or animal communities;
• Inference from palaeoecological studies of previous habitats; and,
• Modelling climate change scenarios to determine species potential future climate space.
The technique used in this study is the latter (although the others are covered in the literature
review).
2.5.1. Bioclimate envelope models (BEM)
Bioclimatic envelope models have been used in ecology for a number of years now (Huntley et al.,
1995; Sykes et al., 1996; Guisan et al., 1999) and have enjoyed a steady development since then
(Thuiller et al., 2008; Elith & Leathwick, 2009; Rubidge & Monahan, 2011). BEM (or niche models)
are essentially correlative models that use two forms of data: presence and/or absence data for
species' distributions and corresponding environmental variables for each presence and/or
6

absence location. The basic assumption is that climatic factors are the main agents determining
species' distributions at continental and national scales, a relationship that has long been accepted
in ecology (Holdridge, 1947; Box, 1981). Therefore, by correlating current climatic factors with
current species' distribution, it is possible, by applying future climate change scenarios, to create
new potential distributions. This approach has been applied to various taxa including amphibians
and reptiles (Araújo et al., 2006), plants (Bakkenes et al., 2002; Berry et al., 2003; Iverson et al.,
2008) and birds (Peterson, 2003; Huntley et al., 2008). It is important to note that the outputs
produce potential suitable climate space for species not actual distributions.
The design of BEM varies considerably with a number of different statistical approaches in current
use including General Linear Models, General Additive Models, Genetic Algorithm for Rule‐set
Prediction and Classification Tree Analysis (Araújo et al., 2005; Elith et al., 2006; Heikkinen et al.,
2006). In this report, we used two approaches: an Artificial Neural Network (ANN) and Ecological
Niche Factorization Analysis (ENFA).
7
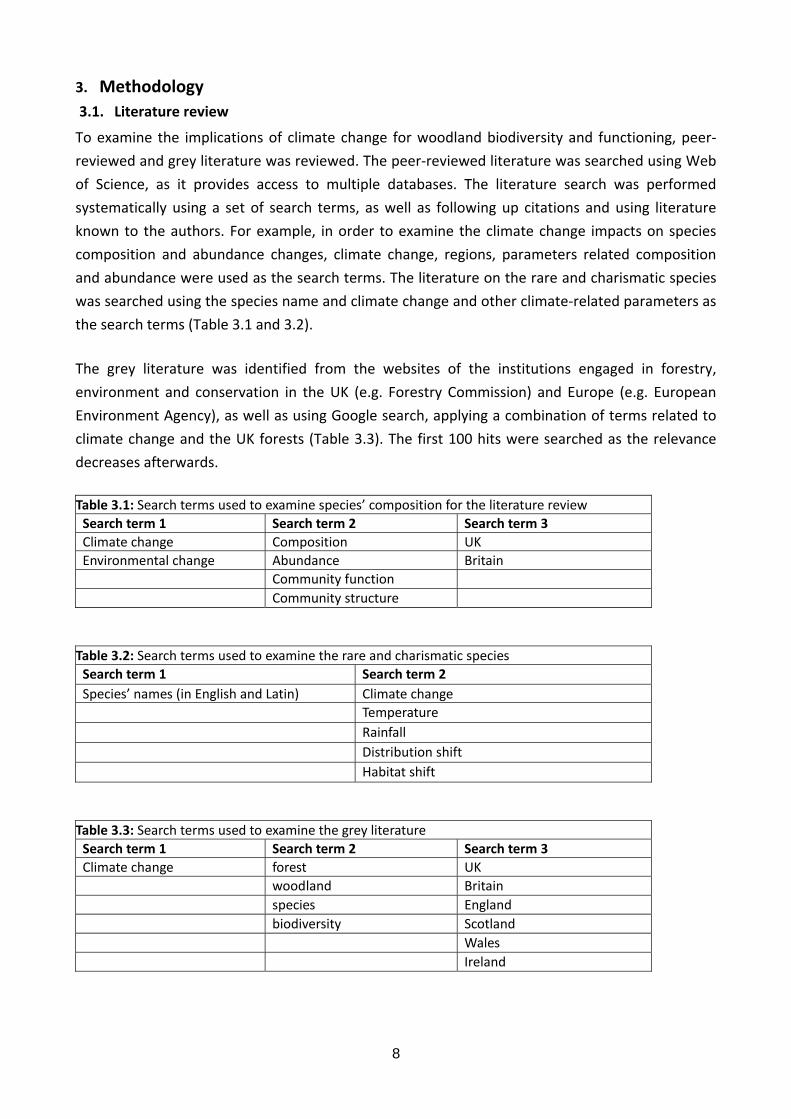
3. Methodology 3.1. Literature review
To examine the implications of climate change for woodland biodiversity and functioning, peer‐
reviewed and grey literature was reviewed. The peer‐reviewed literature was searched using Web
of Science, as it provides access to multiple databases. The literature search was performed
systematically using a set of search terms, as well as following up citations and using literature
known to the authors. For example, in order to examine the climate change impacts on species
composition and abundance changes, climate change, regions, parameters related composition
and abundance were used as the search terms. The literature on the rare and charismatic species
was searched using the species name and climate change and other climate‐related parameters as
the search terms (Table 3.1 and 3.2).
The grey literature was identified from the websites of the institutions engaged in forestry,
environment and conservation in the UK (e.g. Forestry Commission) and Europe (e.g. European
Environment Agency), as well as using Google search, applying a combination of terms related to
climate change and the UK forests (Table 3.3). The first 100 hits were searched as the relevance
decreases afterwards.
Table 3.1: Search terms used to examine species’ composition for the literature review Search term 1 Search term 2 Search term 3 Climate change Composition UK Environmental change Abundance Britain Community function Community structure
Table 3.2: Search terms used to examine the rare and charismatic species Search term 1 Search term 2 Species’ names (in English and Latin) Climate change Temperature Rainfall Distribution shift Habitat shift
Table 3.3: Search terms used to examine the grey literature Search term 1 Search term 2 Search term 3 Climate change forest UK woodland Britain species England biodiversity Scotland Wales Ireland
8
3.2. Bioclimate envelope modelling
Most of the species modelling used in this study was based on an artificial neural network
(SPECIES ‐ Spatial Estimator of the Climate Impacts on the Envelope of Species), but a number of
species with ‘presence‐only’ data were processed using Ecological Niche Factorization Analysis
(ENFA).
Artificial Neural Networks (ANNs) were initially developed to model biological functions and can
now be found in such diverse situations as speech recognition, molecular biology and predicting
farmer risk preferences (Lek & Guégan, 1999). ANNs are proving increasingly popular because of
their wide applicability and their ability to cope with complicated scenarios; these traits have
commended them to ecologists who often favour them because of the complexity of many
ecological problems.
3.2.1. Modelling Methodology
3.2.1.1. Data requirements
Reliable plant species distribution data was sourced from the Atlas Florae Europaeae and various
other distribution studies (see Appendix for full list). All these data were obtained in electronic
form consisting of the European grid‐cell coordinates of the species’ presence and absences or
from scans of hard‐copy book atlases.
The type of distribution data can affect model performance ‐ for example, a number of studies
have shown that presence/absence data is better than presence‐only data (Pearson et al., 2006)
although presence‐only techniques (like ENFA) can also provide robust results (and may be
necessary for studying mobile taxa like birds).
The BEM models works on the basis of a correlation between species distribution and
environmental factors. For all taxa, except birds, the following environmental data were used:
absolute minimum temperature expected over a 20 year period, annual maximum temperature,
growing degree‐days above 5°C, accumulated annual soil moisture deficit and accumulated annual
soil moisture surplus. The inputs used all have a direct physiological limiting function for plant
growth and were fed into the neural network along with an interpolated presence/absence data
set for each species. For birds different environmental data were used based on knowledge of
factors affecting their distribution in the UK, including absolute minimum temperature expected
over a 20‐year period, mean summer temperature (May, June, July), mean summer precipitation
(May, June, July), mean winter precipitation (December, January, February), and mean summer
water availability (May, June, July).
To cover as much of the possible variation in anticipated climate change as possible two main
climate change scenarios (A2 and B1) were used which cover much of the range of possible driving
forces of future GHG emissions (Nakićenović et al., 2009). These two scenarios were then used at
9

three different time‐slices (2011–2020, 2041–2050 and 2071–2080) which were modelled using
two global climate models (HadCM3 and PCM) (Gordon et al., 2000; Pope et al., 2000; Washington
et al., 2000).
3.2.1.2. Statistical and GIS tools
The preparation of data and running SPECIES required a number of statistical packages to augment
the processing of BEM including 'R' (R Development Core Team, 2008) (with the following
packages G‐stat, lattice and maptools), SNNS v4.1 (the neural network simulator) (Zell et al.,
1995), ArcCatatog and ArcMap (to digitise the distributions maps) (ArcMap, ESRI, Inc., Redlands,
California) and Idrisi Kilimanjaro (to convert the digitised distributions to text files (Clark Labs,
Clark University, Worcester, MA, USA).
Scanned and downloaded image maps of species distributions were digitised first using Arc GIS
software (ArcMap, ESRI, Inc., Redlands, California) and geo‐referenced accurately to European
latitudinal and longitudinal co‐ordinates. The distribution data (both the scanned and the AFE) had
to be interpolated into presence/absence data on a 0.5° grid of Europe and then interpolated
further using ‘Surfer’ software into a 10 km grid by ‘Kriging’, a geostatistical gridding method
(Pearson et al., 2002). Kriging aided the training of the ANN by making sure that a species
presence was not adjacent a species absence when the environmental conditions for both
locations were similar. The SPECIES model runs using data (species European presence/absence,
environmental data, climate change scenarios) in text file format and then exports text files of
future presence/absence for each scenario, as well as mapped images for visual interpretation.
A multi‐layer feed‐forward (MLFF) network, trained by backpropagation algorithm, was used in
the ANN because of its ability to model complex relationships between variables. The data set was
randomised, and then split into three equally sized sub‐data sets that were used for the training,
validation and testing (Bishop, 1995). The multi‐layer feed‐forward network was set for five input
nodes, eleven hidden nodes (one layer) and one output node.
Once the model is trained and validated output maps at different scales can be produced (here the
European scale input was used). Climate suitability maps (see figures in section 5) are produced
outlining the likelihood of a species being present (1, or the darkest shading = highest likelihood).
3.2.2. ENFA For modelling with “presence‐only” datasets, i.e., datasets containing a set of points with
observed species presences, but no absence points, which is a common situation for many rare
species, an Ecological Niche Factorization Analysis (ENFA) was used. This only requires known
presence data in order to generate habitat suitability surfaces (Figure X). Areas with low ENFA
suitability are then randomly selected and treated as pseudo‐absence points to train the SPECIES
model. The full methodology is explained in Chapter 2 of MONARCH 3 (Berry et al., 2007). In this
report ENFA was used for Andrena ferox, Loxia scotica, Trichomanes speciosum, Biatoridium 10
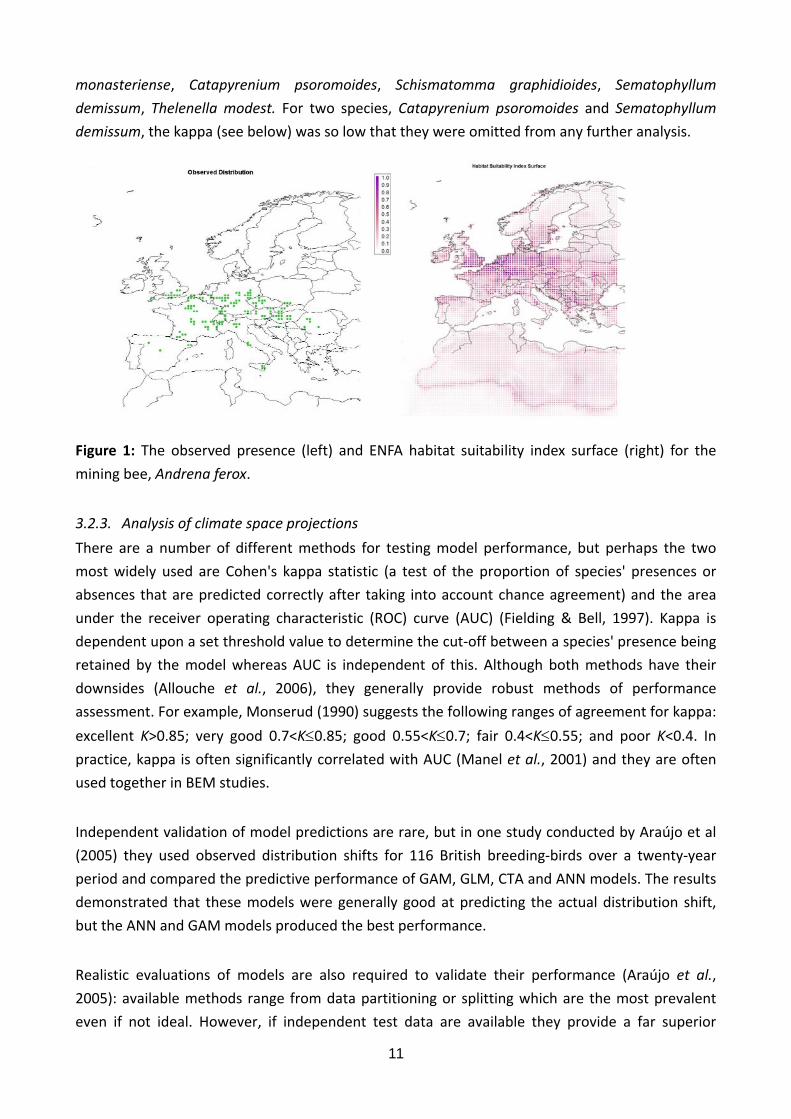
monasteriense, Catapyrenium psoromoides, Schismatomma graphidioides, Sematophyllum
demissum, Thelenella modest. For two species, Catapyrenium psoromoides and Sematophyllum
demissum, the kappa (see below) was so low that they were omitted from any further analysis.
Figure 1: The observed presence (left) and ENFA habitat suitability index surface (right) for the
mining bee, Andrena ferox.
3.2.3. Analysis of climate space projections
There are a number of different methods for testing model performance, but perhaps the two
most widely used are Cohen's kappa statistic (a test of the proportion of species' presences or
absences that are predicted correctly after taking into account chance agreement) and the area
under the receiver operating characteristic (ROC) curve (AUC) (Fielding & Bell, 1997). Kappa is
dependent upon a set threshold value to determine the cut‐off between a species' presence being
retained by the model whereas AUC is independent of this. Although both methods have their
downsides (Allouche et al., 2006), they generally provide robust methods of performance
assessment. For example, Monserud (1990) suggests the following ranges of agreement for kappa:
excellent K>0.85; very good 0.7<K≤0.85; good 0.55<K≤0.7; fair 0.4<K≤0.55; and poor K<0.4. In practice, kappa is often significantly correlated with AUC (Manel et al., 2001) and they are often
used together in BEM studies.
Independent validation of model predictions are rare, but in one study conducted by Araújo et al
(2005) they used observed distribution shifts for 116 British breeding‐birds over a twenty‐year
period and compared the predictive performance of GAM, GLM, CTA and ANN models. The results
demonstrated that these models were generally good at predicting the actual distribution shift,
but the ANN and GAM models produced the best performance.
Realistic evaluations of models are also required to validate their performance (Araújo et al.,
2005): available methods range from data partitioning or splitting which are the most prevalent
even if not ideal. However, if independent test data are available they provide a far superior
11

method of validation: e.g., the use of 'hindcasting' techniques, which tests the model on known
past distributions (sometimes using fossil pollen‐based distributions) (Hijmans & Graham, 2006;
Pearman et al., 2008). A test using breeding‐bird data over a twenty year period demonstrated
that non‐independent data (data splitting) produced more accurate test statistics than that of the
independent data (20‐year observed range shifts) suggesting that most models over‐estimate
performance (Araújo et al., 2005). Testing with other taxa against independent data is
troublesome though as most data are difficult to come by.
12

4. Results 4.1. Reviewing the effects of climate change on biodiversity and community function
We briefly outline how climate change has already begun to affect plant and animal autoecology
and cover four main aspects of change (physiological changes, distribution shifts, phenology and
evolutionary change) pertinent to species found in woodland habitats.
4.1.1. Physiological responses All species respond directly to climatic factors and for many species climate is largely the defining
element governing their growth and reproduction; it is important to note however, that whilst it is
comparatively easy to study the response of species to climatic factors or even to combinations of
factors (which better reflects reality), scaling up to community and ecosystem response is much
harder. The three main response factors of future climate change are temperature, water
availability and CO2, others though (not discussed here) include extreme events such as fire,
storms, floods and fire. Evidence of the effects of these factors on growth is accumulating,
although it is not always easy to disentangle their relative contributions (Hughes, 2000).
Plant response to CO2, temperature and water availability is a well‐studied field and a number of
generalisations regarding response can be made. For most temperate woodland plants (i.e., that
uses C3 carbon fixation), increased levels of CO2 stimulates growth (Hyvönen et al., 2007)
generally through a net increase in photosynthesis (Ziska et al., 2003). Although there is often a
long‐term acclimation of photosynthesis to increased CO2, and this response frequently interacts
with temperature and water availability, the overall pattern, certainly at a forest stand level, is for
increased growth for many woodlands in northern latitudes. This pattern is more complicated
though at more southerly latitudes where drought effects may have an over‐riding impact on, for
example, tree growth (Jump et al., 2006).
Increased growth is not the only response though: for example, the ratio of carbon to nitrogen in
the leaf is also affected by CO2, which has consequences for decomposition, herbivory and frost
resistance (Bazzaz, 1996). Reproduction and germination are also affected by CO2, but responses
vary across species.
Plant response to temperature is well recorded and is clearly one of the major determinants of
species' growth and distribution (Woodward, 1987). Dendroecology has highlighted variations in
growth for species along climatic (temperature and precipitation) gradients over centuries of
growth (Dittmar et al., 2003; Bascietto et al., 2004). Other responses to changes in temperature
include effects on the abundance of plants with winter seed chilling requirements (Inouye et al.,
2000) and effects on reproductive systems (Aerts et al., 2004). Temperature can have direct
impacts on plant physiology on a day‐to‐day basis: for example extreme heat can reduce
photosynthesis and increase respiration in many temperate tree species (Rennenberg et al., 2006).
However, the most important response to increased temperatures is likely to be the extension of
13

the growing season for most species in northern Europe (Hyvönen et al., 2007) and a reduction in
growth in southern Europe (Reich & Oleksyn, 2008).
Water is one of the most important limiting factors for plant growth (Pigott & Pigott, 1993) and
will play an important role in community composition in the future. Not only will annual
precipitation in many European countries decline, but extreme events such as drought and flood,
are very likely to increase too (Beniston et al., 2007). Reduced water availability limits growth
through a reduction in water uptake in the roots which reduces the water potential (along a root
to leaf gradient). However, different species demonstrate a range of ecological responses to water
availability, which is readily demonstrated within European trees by the contrasting responses of
the drought intolerant beech and the drought tolerant sessile oak (Thomas, 2000; Gessler et al.,
2007). These differential effects are likely to change the competitive balance in communities and
may result in the changes in community dominance (Fotelli et al., 2005; Saxe & Kerstiens, 2005;
Sthultz et al., 2007; Piovesan et al., 2008). These effects may be further enhanced by delayed
responses to drought in some species due to an inability to recover from a breakdown of
photosynthetic ability (Breda et al., 2006). This has been seen in some woodlands in Britain when
beech stands continued to decline or die several years after the severe drought of 1976 (Peterken
& Mountford, 1996).
There is huge variation in the ability of different plant species to cope with the above‐mentioned
climatic factors ‐ this is clearly reflected in the myriad vegetation biomes across the globe.
Although there is a large body of work which has examined the responses of plant species and
even communities to CO2, precipitation and temperature, there is still uncertainty over the
outcomes for many plant communities and ecosystems, particularly when other factors, like land‐
use change are taken into account (Tylianakis et al., 2008).
4.1.2. Range and altitudinal shifts The role of climate in determining a species' distribution has long been known (Woodward, 1987)
and evidence of species' range shifts during previous cooling and warming events is well
documented through extensive palaeoecological studies (Davis & Shaw, 2001; Moore, 2005).
However, whereas palaeoecological studies have demonstrated the migration of species often
tracked a relatively slow changing climate after glacial periods (except the Younger Dryas period),
more recent climatic change has occurred at a faster rate (Jansen et al., 2008). This poses
problems for many species that are not able to migrate quickly enough (e.g., tree species), but
already we have recorded distribution changes from a range of taxa. Two main responses have
been documented in species: range shifts, where the distribution of a species has moved (usually
polewards) as the climate has warmed (Parmesan, 2006); and, altitudinal or elevational shifts
where montane and sub‐montane species have shifted their zone of occurrence to higher altitudes
(Peñuelas & Boada, 2003; Raxworthy et al., 2008; Lenoir et al., 2010). Many of these effects have
been seen in more mobile taxa (e.g., butterflies, birds) although we are already witnessing the
decline of some plant species at the rear edge of their distribution (e.g., beech in the Catalonian
14
mountains: Peñuelas et al., 2007), as well as shifts in elevation for a number of shrub and tree
species in Scandinavia (Kullman, 2002). Long‐lived perennial plants present a more difficult group
to study as they can often have significant lags in response.
These changes are not only determined by temperature, long‐term changes in precipitation can
also affect species' distributions. In the southern or rear edge of species' distributions,
precipitation is known to be limiting factor for survival (Engelbrecht et al., 2007; Morin et al.,
2007) and recent changes in precipitation patterns have started to affect some species in southern
Europe (Castro et al., 2004; Jump et al., 2006).
4.1.3. Phenological change Perhaps the largest collection of observations recording climatic change responses is in the study
of phenology (Parmesan, 2006) and this aspect of species' biology has been the focus of a number
of reviews and studies on a range of taxa (Root et al., 2003; van Vliet et al., 2003; Visser & Both,
2005). Some studies observing phenological response date back many decades or even centuries
(Sparks & Carey, 1995) and often records have been maintained by non‐academic observers. For
plant phenology, the range of responses recorded has been large, but the most common are for
dates of first flowering, bud burst and leafing; however, autumn events are less well recorded
(Menzel et al., 2006).
The main patterns observed thus far are earlier response to spring events, like bud burst or first
flowering dates and slightly delayed leaf fall, but responses can vary across species (Fitter & Fitter,
2002; Menzel et al., 2006). Peñuelas et al (2002) found that whilst the mean flowering date
advanced for a range of plant species, some species in the Mediterranean region had delayed
flowering. Further inconsistencies in phenological trends can be seen in regional differences too:
Root et al (2003) and Parmesan (2007) have reported a greater response at northern latitudes
although this pattern reflects differences in regional climate changes.
Reports focussing solely on the responses of woodland plants are not common, but similar results
have been reported so far; for example, in Slovakia, six woodland herbs species have shown earlier
onset of flowering in response to climate over the last decade (Schieber, 2007). Similarly, in other
studies of ‐ or including ‐ European forest tree species, a general pattern of advancing leaf or
flowering dates over the last few decades due to warming spring temperatures has been reported
(Chmielewski & Rotzer, 2001; Gordo & Sanz, 2005).
4.1.4. Adaptation Although there are widespread records of species' populations responding to climate change by
migrating or becoming locally extinct, many species also have an ability to adapt in situ to new
climatic pressures (Jump & Penuelas, 2005; Aitken et al., 2008). This may occur with species that
have a large phenotypic plasticity (the ability of individuals to modify their behaviour, morphology
15
or physiology in response to altered environmental conditions) (Nicotra et al., 2010) (Hubert &
Cottrell, 2007), but other factors like fecundity and biotic interactions, may play a part (Aitken et
al., 2008). Adaptation is also likely to vary within species throughout their distribution; for
example, the genetic diversity of species' populations at range margins is sometimes more
impoverished due to the fragmented nature, low fecundity or effects of introduced species on the
population resulting in lower adaptation (Hampe & Petit, 2005; Aitken et al., 2008). Species with
large distributions and large populations with high genotypic variation are more likely to adapt to
climate change, despite a possible generational response lag (Aitken et al., 2008).
Foresters have made use of inter‐specific genetic variation in tree species for years and have
drawn on different provenances to meet suitable local climatic conditions (Leverenz et al., 1999;
Greenwood et al., 2002; Boshier & Stewart, 2005; Hubert & Cottrell, 2007). This artificial mixing of
genetic diversity may well actually benefit some species: many woodlands in the UK are composed
of native species, but often their provenance is foreign (Rackham, 2006); therefore, woodlands
that have genetic provenances of species (e.g., common oak) from lower latitude European
countries, may well be better adapted to future climate change. Challenges to the conservation
ethos that local provenance is best are discussed further in section 5.4.9.
Phenotypic plasticity is not the only feasible adaptation response, as some species are capable of
rapid evolution (Bradshaw & Holzapfel, 2006). However, for many species there will be constraints
on evolutionary response including the lag between climatic change and response (e.g., for most
perennial plants (Davis et al., 2005)); lack of genetic variation (e.g., in small populations (Willi et
al., 2006)); and erosion of genetic variation (Skelly et al., 2007). This means that plants that are
likely to evolve to adapt to climate change will be small, have short life cycles and have large
population sizes (Fitter & Fitter, 2002; Berteaux et al., 2004; Valladares, 2008).
There is some evidence that plants can adapt to rapid climate change through evolution, for
example, Franks et al (2007) have shown that the annual field mustard (Brassica rapa) was able to
respond to drought conditions by selecting for earlier flowering in the population under study.
However, the evidence suggests for many woodland species, once phenotypic plasticity is
stretched to its limit (Willi et al., 2006), the options in the face of climate change are either
migration or local extirpation (Jump & Penuelas, 2005; Valladares, 2008).
4.2. Impacts of climate change on woodland Priority Habitat species ‐ results from the
bioclimate envelope modelling
4.2.1. Overall picture
A total of 178 species woodland species have been modelled for the whole of the British Isles, of
these 31 are tree species, 18 shrub species, 86 ground flora species, 11 mammals, 1 moss, 5
lichens, 4 butterflies, 14 birds, 1 beetle, 1 bee, 4 ants and 2 amphibians. The overwhelming
16

pattern is for species bioclimatic space gain and mean1 figures for all species and all scenarios vary
from 12% gain (Had A2 2020) to 100% gain (PCM A2 2080). Table 4.1 outlines the main responses
to climate change in the British Isles for some key woodland species.
These responses are primarily described in terms of the change in climate space in the British Isles,
but significant differences between the countries are noted, as some species have the potential to
gain climate space one country (e.g. in Scotland) and lose it in another (e.g. England) and thus
while the net change may be small these gains and losses are important. Their significance for
woodland composition, structure and function are assessed using knowledge of their ecology and
other research on the species concerned.
Table 4.1: Key British Woodland Species
Change in British climate space
Trees Shrubs Other notable species
Very significant loss (>90% to 100%)
Pied flycatcher Ficedula hypoleuca
Significant loss (>50% to <90%)
Bird cherry Prunus padus Twinflower Linnaea borealis, Narrow‐headed ant Formica exsecta
Moderate loss (>25% to <50%)
Scots pine Pinus sylvestris, Wych elm Ulmus glabra, Grey sallow Salix cinerea
Blackberry Rubus fruticosus, Wild red raspberry Rubus idaeus, Cowberry Vaccinium vitis‐idaea
St Johns wort Hypericum maculatum, a lichen Biatoridium monasteriense, Stump lichen Cladonia botrytes, Bellflower Campanula latifolia, Globeflower Trollius europaeus, Wood vetch Vicia sylvatica, Scottish crossbill Loxia scotica, Great crested newt Triturus cristatus
Small loss (>15% to <25%)
Sycamore Acer pseudoplatanus, Silver birch Betula pendula, Downy birch Betula pubescens, Juniper Juniperus communis, Goat willow Salix caprea
Yellow‐necked mouse Apodemus flavicollis, Wild angelica Angelica sylvestris
Insignificant loss (<15%)
European hornbeam Carpinus betulus, Ash Fraxinus excelsior, Aspen Populus tremula, Oak Quercus petraea, Rowan Sorbus aucuparia
Hazel Corylus avellana,
Sweet woodruff Galium odoratum, Wood avens Geum urbanum, Honeysuckle Lonicera periclymenum
1 After taking out the extreme gains of 1000% or more for 4 species.
17
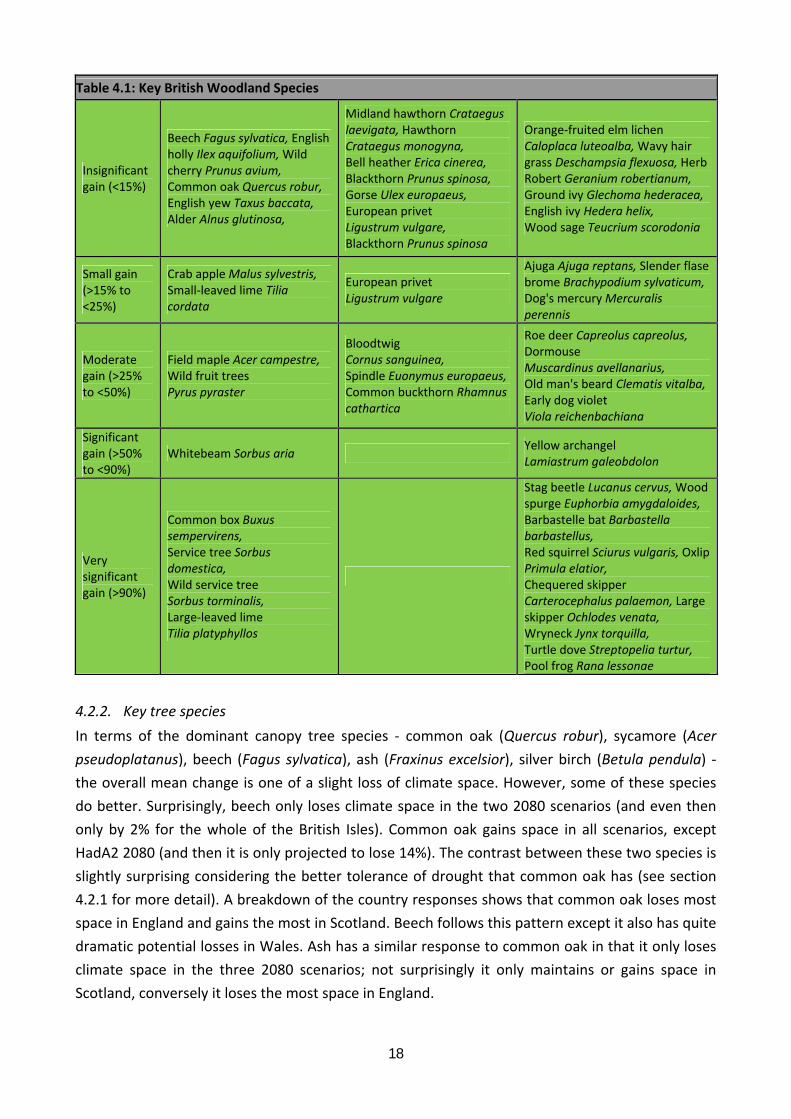
Table 4.1: Key British Woodland Species
Insignificant gain (<15%)
Beech Fagus sylvatica, English holly Ilex aquifolium, Wild cherry Prunus avium, Common oak Quercus robur, English yew Taxus baccata, Alder Alnus glutinosa,
Midland hawthorn Crataegus laevigata, Hawthorn Crataegus monogyna, Bell heather Erica cinerea, Blackthorn Prunus spinosa, Gorse Ulex europaeus, European privet Ligustrum vulgare, Blackthorn Prunus spinosa
Orange‐fruited elm lichen Caloplaca luteoalba, Wavy hair grass Deschampsia flexuosa, Herb Robert Geranium robertianum, Ground ivy Glechoma hederacea, English ivy Hedera helix, Wood sage Teucrium scorodonia
Small gain (>15% to <25%)
Crab apple Malus sylvestris, Small‐leaved lime Tilia cordata
European privet Ligustrum vulgare
Ajuga Ajuga reptans, Slender flase brome Brachypodium sylvaticum, Dog's mercury Mercuralis perennis
Moderate gain (>25% to <50%)
Field maple Acer campestre, Wild fruit trees Pyrus pyraster
Bloodtwig Cornus sanguinea, Spindle Euonymus europaeus, Common buckthorn Rhamnus cathartica
Roe deer Capreolus capreolus, Dormouse Muscardinus avellanarius, Old man's beard Clematis vitalba, Early dog violet Viola reichenbachiana
Significant gain (>50% to <90%)
Whitebeam Sorbus aria Yellow archangel Lamiastrum galeobdolon
Very significant gain (>90%)
Common box Buxus sempervirens, Service tree Sorbus domestica, Wild service tree Sorbus torminalis, Large‐leaved lime Tilia platyphyllos
Stag beetle Lucanus cervus, Wood spurge Euphorbia amygdaloides, Barbastelle bat Barbastella barbastellus, Red squirrel Sciurus vulgaris, Oxlip Primula elatior, Chequered skipper Carterocephalus palaemon, Large skipper Ochlodes venata, Wryneck Jynx torquilla, Turtle dove Streptopelia turtur, Pool frog Rana lessonae
4.2.2. Key tree species
In terms of the dominant canopy tree species ‐ common oak (Quercus robur), sycamore (Acer
pseudoplatanus), beech (Fagus sylvatica), ash (Fraxinus excelsior), silver birch (Betula pendula) ‐
the overall mean change is one of a slight loss of climate space. However, some of these species
do better. Surprisingly, beech only loses climate space in the two 2080 scenarios (and even then
only by 2% for the whole of the British Isles). Common oak gains space in all scenarios, except
HadA2 2080 (and then it is only projected to lose 14%). The contrast between these two species is
slightly surprising considering the better tolerance of drought that common oak has (see section
4.2.1 for more detail). A breakdown of the country responses shows that common oak loses most
space in England and gains the most in Scotland. Beech follows this pattern except it also has quite
dramatic potential losses in Wales. Ash has a similar response to common oak in that it only loses
climate space in the three 2080 scenarios; not surprisingly it only maintains or gains space in
Scotland, conversely it loses the most space in England.
18
4.2.3. Key Shrub species
On the whole, the main woodland shrub species do quite well and 13 of the 18 species maintain or
gain climate space (Table 4.1). Of these, gorse (Ulex europaeus), heather (Calluna vulgaris),
Midland hawthorn (Ulex gallii), privet (Ligustrum vulgare), dogwood (Cornus sanguinea),
buckthorn (Rhamnus cathartica) and spindle (Euonymus europaeus) do the best. The worst
performers are cowberry (Vaccinium vitis‐idaea), bramble (Rubus fruticosus), gooseberry (Ribes
uva‐crispa) and raspberry (Rubus idaeus), but even hazel loses a small amount of bioclimate space.
Not surprisingly, losses are greatest in England and minimal in Scotland; while dogwood, spindle
and buckthorn all gain large amounts of bioclimatic space in Scotland.
4.2.4. Key ground flora
The number of ground flora winners and losers is more complex; there are a number of species,
for example that lose bioclimatic space in England and Scotland (twinflower ‐ Linnaea borealis is a
good example), but there are also some species that appear to do badly in Wales, but nowhere
else: ryegrass (Poa trivialis), wood sorrel (Oxalis acetosella), Yorkshire fog (Holcus lanatus), hedge
woundwort (Stachys sylvatica), common cottongrass (Eriophorum angustifolium), tall oatgrass
(Arrhenatherum elatius), tufted hairgrass (Deschampsia cespitosa), wood sedge (Carex sylvatica),
honeysuckle (Lonicera periclymenum), Lords and Ladies (Arum maculatum), hare’s tail cottongrass
(Eriophorum vaginatum), globeflower (Trollius europaeus) and hogweed (Heracleum
sphondylium).
Other losses include: Lady’s slipper orchid (Cypripedium calceolus), Twinflower, small cow‐wheat
(Melampyrum sylvaticum), bellflower (Campanula latifolia), wood vetch (Vicia sylvatica), St. Johns
wort (Hypericum maculatum), globeflower (Trollius europaeus), lesser twayblade (Listera cordata),
crowberry (Empetrum nigrum), grass of Parnassus (Parnassia palustris), hogweed (Heracleum
sphondylium) and wild angelica (Angelica sylvestris), all lose more than 15% bioclimatic space in
the British Isles (with most losses occurring in England).
4.2.5. Other key species
Of the mobile species there are a number of major winners including: amphibia ‐ pool frog (Rana
lessonae); mammals ‐ Bechstein`s bat (Myotis bechsteinii), lesser horseshoe bat (Rhinolophus
hipposideros), Barbastelle bat (Barbastella barbastellus), red squirrel (Sciurus vulgaris), roe deer
(Capreolus capreolus), dormouse (Muscardinus avellanarius); birds ‐ red‐backed shrike (Lanius
collurio), turtle dove (Streptopelia turtur), tree sparrow (Passer montanus); butterflies ‐ Ochlodes
venata, Erynnis tages; beetles ‐ Lucanus cervus.
The species that lose most bioclimatic space are: ants ‐ Scottish wood ant (Formica aquilonia),
narrow head ant (Formica exsecta), southern wood ant (Formica rufa), hairy wood ant (Formica
lugubris); birds ‐ pied flycatcher (Ficedula hypoleuca), Scottish crossbill (Loxia scotica), spotted
flycatcher (Muscicapa striata), song thrush (Turdus philomelos), bullfinch (Pyrrhula pyrrhula),
19

black grouse (Tetrao tetrix), capercaillie (Tetrao urogallus); mammals ‐ yellow‐necked mouse
(Apodemus flavicollis), brown hare (Lepus europaeus), amphibia ‐ great crested newt (Triturus
cristatus); and butterflies ‐ pearl‐bordered fritillary (Boloria euphrosyne).
Nearly all mammals gain new climate space in Scotland (except brown hare, which loses 9%) and
for the other mobile taxa the only species that lose space are pearl‐bordered fritillary, pied
flycatcher, Scottish crossbill, fieldfare (Turdus pilaris), mining bee (Andrena ferox), Scottish wood
ant, narrow head ant and hairy wood ant. In England, a number of species run a risk of becoming
extinct by 2080 including pied flycatcher, black grouse, bullfinch, narrow head ant and hairy wood
ant.
The following sections focus on the main structural responses in different Priority Habitats and
NVCs; two additional sections outline the possible responses of rare and charismatic species.
4.2.6. Wood‐Pasture & Parkland
This Priority Habitat is described as “areas that have been managed by a long‐established tradition
of grazing allowing, where the site is in good condition, the survival of multiple generations of
trees, characteristically with at least some veteran trees or shrubs” (Maddock, 2010). It roughly
corresponds to several National Vegetation Classification (NVC) habitats including W10 (Quercus
robur‐Pteridium aquilinum‐Rubus fruticosus woodland), W11 (Quercus petraea‐Betula pubescens‐
Oxalis acetosella woodland), W14 (Fagus sylvatica‐Rubus fruticosus woodland), W15 (Fagus
sylvatica‐Deschampsia flexuosa woodland) and W16 (Quercus spp.‐Betula spp.‐Deschampsia
flexuosa woodland) (Rodwell, 1991; Rodwell & Dring, 2001). Clearly, unlike most of the other
Priority Habitats, Wood Pasture and Parkland can be found across a range of soil types and its
classification is more than anything a product of human intervention rather than edaphic or phyto‐
sociological associations.
Ninety‐eight of the species modelled were known to be associated with woodland pasture and
parkland. Of those, 17 were tree species tree species, 8 shrubs and 51 ground flora species. Table
4.2 highlights the major modelling results and the overall mean change in species climate space
for all scenarios was a slight gain of 9% for the British Isles.
The two key wood‐pasture tree species, beech and common oak, generally have a good outlook in
the UK with potentially insignificant losses, although both could lose more space in England by
2080 (oak by up to 47%). However, beech's greater intolerance of drought is further complicated
due to the lack of data on determining if woodland or parkland trees are more sensitive than
forest trees in these conditions. Whilst there has been research on evapotranspiration in parkland
trees (Paço et al., 2009), a comparison with woodland trees has not been made. Long term studies
at Denny Wood, an ancient wood‐pasture, indicate that over a 40 year period beech trees were
the most severely affected by drought, although some oak were killed too and drought
20
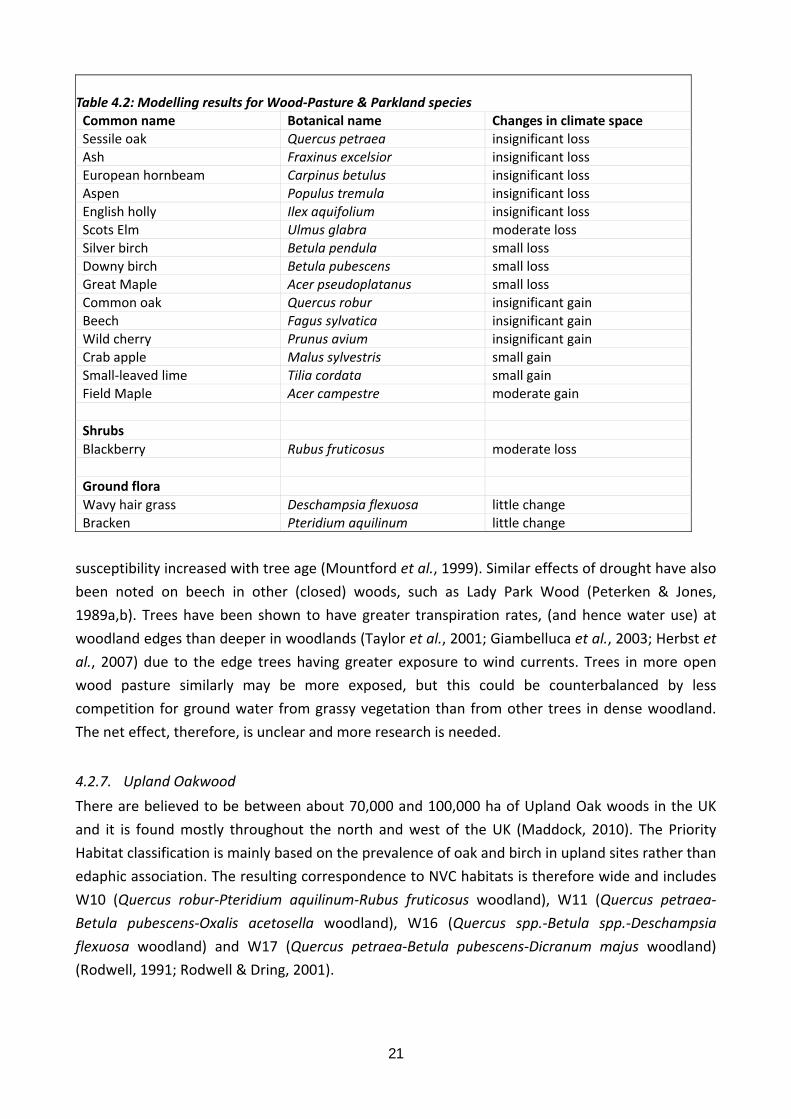
Table 4.2: Modelling results for Wood‐Pasture & Parkland species Common name Botanical name Changes in climate space Sessile oak Quercus petraea insignificant loss Ash Fraxinus excelsior insignificant loss European hornbeam Carpinus betulus insignificant loss Aspen Populus tremula insignificant loss English holly Ilex aquifolium insignificant loss Scots Elm Ulmus glabra moderate loss Silver birch Betula pendula small loss Downy birch Betula pubescens small loss Great Maple Acer pseudoplatanus small loss Common oak Quercus robur insignificant gain Beech Fagus sylvatica insignificant gain Wild cherry Prunus avium insignificant gain Crab apple Malus sylvestris small gain Small‐leaved lime Tilia cordata small gain Field Maple Acer campestre moderate gain
Shrubs Blackberry Rubus fruticosus moderate loss
Ground flora Wavy hair grass Deschampsia flexuosa little change Bracken Pteridium aquilinum little change
susceptibility increased with tree age (Mountford et al., 1999). Similar effects of drought have also
been noted on beech in other (closed) woods, such as Lady Park Wood (Peterken & Jones,
1989a,b). Trees have been shown to have greater transpiration rates, (and hence water use) at
woodland edges than deeper in woodlands (Taylor et al., 2001; Giambelluca et al., 2003; Herbst et
al., 2007) due to the edge trees having greater exposure to wind currents. Trees in more open
wood pasture similarly may be more exposed, but this could be counterbalanced by less
competition for ground water from grassy vegetation than from other trees in dense woodland.
The net effect, therefore, is unclear and more research is needed.
4.2.7. Upland Oakwood
There are believed to be between about 70,000 and 100,000 ha of Upland Oak woods in the UK
and it is found mostly throughout the north and west of the UK (Maddock, 2010). The Priority
Habitat classification is mainly based on the prevalence of oak and birch in upland sites rather than
edaphic association. The resulting correspondence to NVC habitats is therefore wide and includes
W10 (Quercus robur‐Pteridium aquilinum‐Rubus fruticosus woodland), W11 (Quercus petraea‐
Betula pubescens‐Oxalis acetosella woodland), W16 (Quercus spp.‐Betula spp.‐Deschampsia
flexuosa woodland) and W17 (Quercus petraea‐Betula pubescens‐Dicranum majus woodland)
(Rodwell, 1991; Rodwell & Dring, 2001).
21
Many of the main species associated with Upland Oak woods are modelled here (including all the
canopy trees and much of the shrub and ground flora). Notable omissions from the species list
include some of the main bird species often associated with the woodland type (e.g., redstart
Phoenicurus phoenicurus, wood warbler Phylloscopus sibilatrix) and some mosses (e.g,.
Eurhynchium spp). Otherwise, the 86 species modelled that are found in Upland Oak woods give a
fairly good representation of the community type. The modelling results suggest that these woods
are perhaps one of the least vulnerable habitats to climate change with a mean change in
bioclimatic space for trees of +18% (perhaps not surprising given that most of these woods are to
be found in Scotland and north‐west England). The dominant tree ‐ sessile oak ‐ also does well and
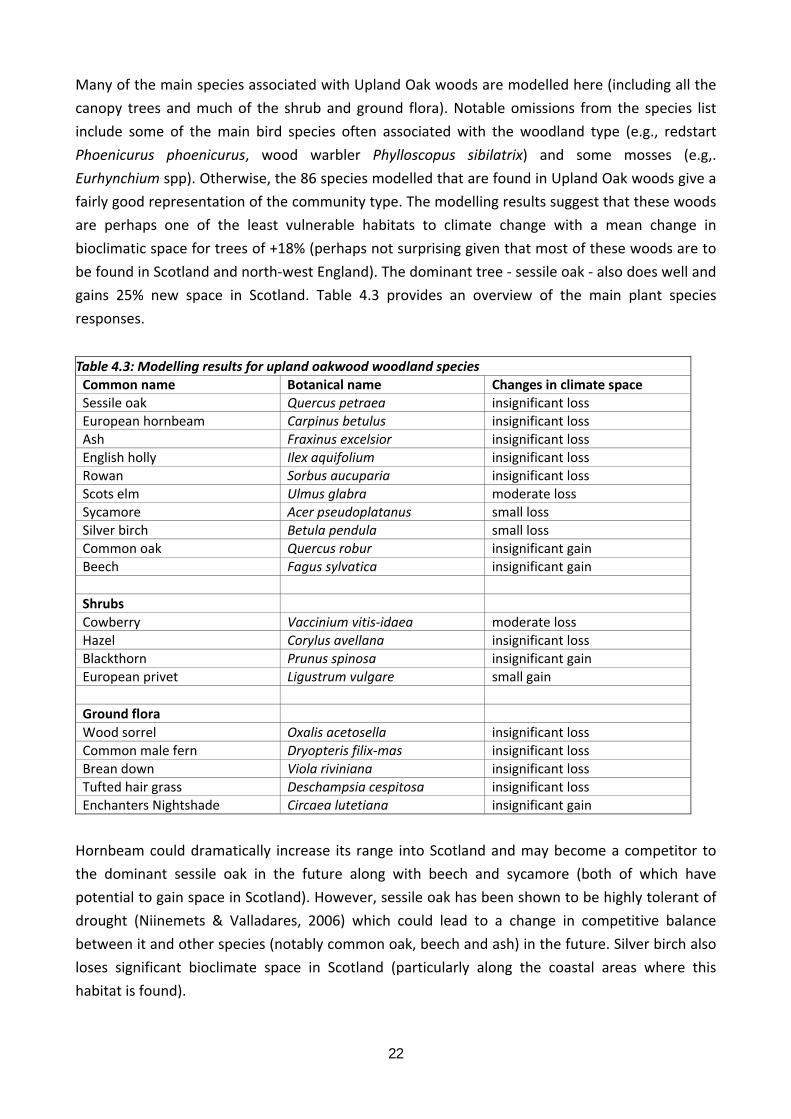
gains 25% new space in Scotland. Table 4.3 provides an overview of the main plant species
responses.
Table 4.3: Modelling results for upland oakwood woodland species Common name Botanical name Changes in climate space Sessile oak Quercus petraea insignificant loss European hornbeam Carpinus betulus insignificant loss Ash Fraxinus excelsior insignificant loss English holly Ilex aquifolium insignificant loss Rowan Sorbus aucuparia insignificant loss Scots elm Ulmus glabra moderate loss Sycamore Acer pseudoplatanus small loss Silver birch Betula pendula small loss Common oak Quercus robur insignificant gain Beech Fagus sylvatica insignificant gain
Shrubs Cowberry Vaccinium vitis‐idaea moderate loss Hazel Corylus avellana insignificant loss Blackthorn Prunus spinosa insignificant gain European privet Ligustrum vulgare small gain
Ground flora Wood sorrel Oxalis acetosella insignificant loss Common male fern Dryopteris filix‐mas insignificant loss Brean down Viola riviniana insignificant loss Tufted hair grass Deschampsia cespitosa insignificant loss Enchanters Nightshade Circaea lutetiana insignificant gain
Hornbeam could dramatically increase its range into Scotland and may become a competitor to
the dominant sessile oak in the future along with beech and sycamore (both of which have
potential to gain space in Scotland). However, sessile oak has been shown to be highly tolerant of
drought (Niinemets & Valladares, 2006) which could lead to a change in competitive balance
between it and other species (notably common oak, beech and ash) in the future. Silver birch also
loses significant bioclimate space in Scotland (particularly along the coastal areas where this
habitat is found).
22
Other notable changes in this habitat include a possible decline in cowberry (Vaccinium vitis‐idaea)
(27% of space lost in Scotland), but expansions of blackthorn (Prunus spinosa) and privet
(Ligustrum vulgare). Of the main ground flora species in this habitat, the biggest losers of
bioclimatic space are wood sorrel, common male fern (Dryopteris filix‐mas) and common dog
violet (Viola riviniana).
4.2.8. Lowland Beech and Yew Woodland
121 species were modelled in this habitat including 24 tree species, 12 shrub species and 85
ground flora species. Beech is the dominant tree species and in southern England is at the
northern edge of its (native) range, although it is successfully planted further north; the same
species is found much further south in Europe. The NVC classifications for this habitat are W12
(Fagus sylvatica‐Mercurialis perennis woodland), W13 (Taxus baccata woodland), W14 (Fagus
sylvatica‐Rubus fruticosus woodland) and W15 (Fagus sylvatica‐Deschampsia flexuosa woodland)
(Rodwell, 1991).
The results suggest that beech could be minimally affected in the UK under the projected climate
scenarios, but since its distribution extends into lower latitudes in continental Europe this is not
surprising. There are other aspects of climate change, however, that may reduce its capacity to
respond. Water stress from prolonged droughts is known to reduce growth, canopy condition and
competitiveness of beech and may result in increased mortality (Peterken & Mountford, 1996). In
north‐east Spain, at its southern limit, high spring and summer temperatures were shown to
decrease growth and tree establishment of beech at lower altitudes and precipitation limited adult
growth (Jump et al., 2007). Drought strongly limited growth of populations in this area (Jump et
al., 2006). Table 4.4 highlights the main plant species responses.
Broadmeadow et al (2005) predicted that beech would suffer growth reductions in south east
England by 2050, which would agree with the model results here. Observations have shown that in
central and northern Europe beech growth is increasing in some areas (Dittmar et al., 2003;
Bascietto et al., 2004; Gärtner et al., 2008), although in southern Europe (Spain and Italy) it is
showing a reduction in growth and there are already changes to its distribution due to successive
warmer and drier years (Peñuelas & Boada, 2003; Peñuelas et al., 2007).
In a comparison of various tree species, beech was considered to be relatively drought intolerant
(Niinemets & Valladares, 2006). Periods of drought may become more frequent in the future and
this may have significant impacts on the survival of beech. While beech growth and
competitiveness has been shown to increase with elevated levels of CO2, it suffers badly when
drought controls are introduced and can be outcompeted by other species (Fotelli et al., 2002;
Fotelli et al., 2005). It seems that increased droughts will be a problem for beech even if the future
projected mean climate change appears to be suitable.
23

Table 4.4: Modelling results for lowland beech and yew woodland species Trees Botanical name Changes in climate space Silver birch Betula pendula small loss Downy birch Betula pubescens small loss Sessile oak Quercus petraea insignificant loss Ash Fraxinus excelsior insignificant loss English holly Ilex aquifolium insignificant loss Beech Fagus sylvatica insignificant gain English yew Taxus baccata insignificant gain Common oak Quercus robur insignificant gain Common box Buxus sempervirens significant gain
Shrubs Blackberry Rubus fruticosus moderate loss
Ground flora Wood sorrel Oxalis acetosella insignificant loss Wavy hair grass Deschampsia flexuosa little change Bracken Pteridium aquilinum little change Dog's mercury Mercuralis perennis small gain
Even if beech does not lose climate space it may lose the competitive edge over other tree
species. Beech is dependent on available soil water to maintain growth and although the model
results suggest that it will fare better than the oak species, it is highly likely that, given a
succession of drought years, that oak will cope better than beech (Raftoyannis & Radoglou, 2002).
The response of beech to drought also depends on soil type and the underlying hydrology; beech
on chalk may be able to access additional moisture via capillary action, but those on acid gravels
and weakly gleyed soils may be at a greater risk of drought. Also, older trees seem more likely to
move into a period of decline and mortality following drought episodes, whereas young trees may
be able to respond well if shade and competition from mature trees is reduced.
The other major tree species in this habitat is yew. Although pure yew woodlands are rare in the
UK (Kingley Vale in Sussex stands out as the best example), yew can often form small stands in
other woods. Yew is considered to be quite tolerant of heat and drought and this is seen in the
results for England (small gain of 2%); in Scotland, where it is commonly only found in
churchyards, it gains 19% in bioclimate space. Although yew is a slow coloniser and depends upon
the right scrub conditions to develop (Tansley, 1965), it is possible that it could increase its range
in calcareous woods in Scotland in the future.
4.2.9. Upland Mixed Ashwoods
This is a particularly important habitat in the North‐west of the British Isles but also can be found
infrequently in England and is fairly widespread on the continent on steeper slopes (Barbati et al.,
2007). It corresponds to two main NVC habitats: W9 (Fraxinus excelsior‐Sorbus aucuparia‐
Mercurialis perennis woodland) and W8e (Fraxinus excelsior‐Acer campestre‐Mercurialis perennis
24
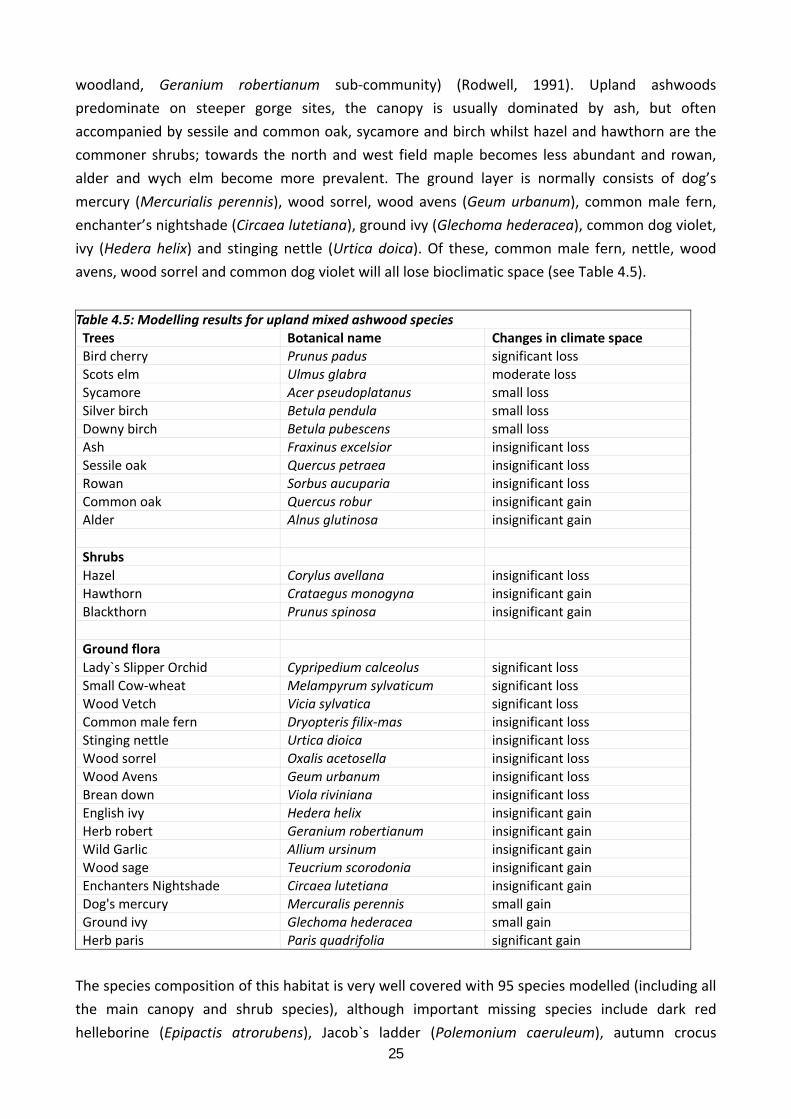
woodland, Geranium robertianum sub‐community) (Rodwell, 1991). Upland ashwoods
predominate on steeper gorge sites, the canopy is usually dominated by ash, but often
accompanied by sessile and common oak, sycamore and birch whilst hazel and hawthorn are the
commoner shrubs; towards the north and west field maple becomes less abundant and rowan,
alder and wych elm become more prevalent. The ground layer is normally consists of dog’s
mercury (Mercurialis perennis), wood sorrel, wood avens (Geum urbanum), common male fern,
enchanter’s nightshade (Circaea lutetiana), ground ivy (Glechoma hederacea), common dog violet,
ivy (Hedera helix) and stinging nettle (Urtica doica). Of these, common male fern, nettle, wood
avens, wood sorrel and common dog violet will all lose bioclimatic space (see Table 4.5).
Table 4.5: Modelling results for upland mixed ashwood species Trees Botanical name Changes in climate space Bird cherry Prunus padus significant loss Scots elm Ulmus glabra moderate loss Sycamore Acer pseudoplatanus small loss Silver birch Betula pendula small loss Downy birch Betula pubescens small loss Ash Fraxinus excelsior insignificant loss Sessile oak Quercus petraea insignificant loss Rowan Sorbus aucuparia insignificant loss Common oak Quercus robur insignificant gain Alder Alnus glutinosa insignificant gain
Shrubs Hazel Corylus avellana insignificant loss Hawthorn Crataegus monogyna insignificant gain Blackthorn Prunus spinosa insignificant gain
Ground flora Lady`s Slipper Orchid Cypripedium calceolus significant loss Small Cow‐wheat Melampyrum sylvaticum significant loss Wood Vetch Vicia sylvatica significant loss Common male fern Dryopteris filix‐mas insignificant loss Stinging nettle Urtica dioica insignificant loss Wood sorrel Oxalis acetosella insignificant loss Wood Avens Geum urbanum insignificant loss Brean down Viola riviniana insignificant loss English ivy Hedera helix insignificant gain Herb robert Geranium robertianum insignificant gain Wild Garlic Allium ursinum insignificant gain Wood sage Teucrium scorodonia insignificant gain Enchanters Nightshade Circaea lutetiana insignificant gain Dog's mercury Mercuralis perennis small gain Ground ivy Glechoma hederacea small gain Herb paris Paris quadrifolia significant gain
The species composition of this habitat is very well covered with 95 species modelled (including all
the main canopy and shrub species), although important missing species include dark red
helleborine (Epipactis atrorubens), Jacob`s ladder (Polemonium caeruleum), autumn crocus 25
(Colchicum autumnale) and whorled solomon`s seal (Polygonatum verticillatum) and a number of
beetle, flies and other invertebrates.
Like the oak woods, upland ash woods which are found in the north west of the British Isles seem
quite resilient to climate change (Table 4.5). In Scotland, the mean change in bioclimate space for
the trees is +15%, with only five species losing more than 50% bioclimate space: Lady`s slipper
orchid, Herb Paris (Paris quadrifolia), common cow wheat (Melampyrum sylvaticum), bird cherry
(Prunus padus), wood vetch (Vicia sylvatica). Furthermore, species that are just beginning to break
into the Scotland may do much better in future (e.g., the lime species which increase by 33% and
54% for T. cordata and T. platyphyllos). Alder may also increase if wetter conditions in winter
allow, while silver birch could lose 19% of its bioclimate space in north‐west Britain (although this
may be countered somewhat by local topography as these woodlands are usually colder and
wetter than the surrounding open countryside). One concern is whether sycamore in upland ash
woods will start to become locally more frequent and compete more with ash to become the
dominant canopy tree (despite an overall UK loss of bioclimate space it has a potential 16%
increase in Scotland and ash starts to lose space western Scotland in 2080). In the understory,
common hawthorn could continue to expand its range, although it may have to compete more
with blackthorn (+31%).
4.2.10. Wet Woodland
Wet woodlands are found on poorly drained and seasonally wet soils on a range of soil types,
including nutrient‐rich mineral and acid, nutrient‐poor organic ones (Rodwell, 1991). Often wet
woods occur within wet flushes in other woodland types (e.g. with upland mixed ash or oakwoods)
(Maddock, 2010). Correspondence between this Priority Habitat and the NVC is relatively
straightforward although there are 7 main NVC habitats that are relevant. The main groups are W1
(Salix cinerea‐Galium palustre woodland), W2 (Salix cinerea‐Betula pubescens‐Phragmites australis
woodland), W3 (Salix pentandra‐Carex rostrata woodland), W4c (Betula pubescens‐Molinia
caerulea woodland Sphagnum sub‐community), W5 (Alnus glutinosa‐Carex paniculata woodland),
W6 (Alnus glutinosa‐Urtica dioica woodland), and W7 (Alnus glutinosa‐Fraxinus excelsior‐
Lysimachia nemorum woodland) (Rodwell, 1991).
These woodlands are dominated by alder, silver birch, goat willow (Salix caprea) and grey willow
(Salix cinerea), but also ash and occasionally common oak and sycamore. The species composition
of this habitat is reasonably well covered with 67 species (see Table 4.6). The majority of species
modelled for wet woodlands cope quite well with the various climate change scenarios (mean 34%
gain for the British Isles).
Of the main tree species, both willow species, birch and sycamore decline by more than 10%, but
all the tree species show a decline in England and one of the important shrub species, buckthorn
(Rhamnus cathartica), increases by 21%. The implications of these changes could be quite
26

Table 4.6: Modelling results for wet woodland species Trees Botanical name Changes in climate space Grey sallow Salix cinerea moderate loss Scots elm Urtica dioica moderate loss Downy birch Betula pubescens small loss Goat willow Salix caprea small loss Sycamore Acer pseudoplatanus small loss Ash Fraxinus excelsior insignificant loss Alder Alnus glutinosa insignificant gain Common oak Quercus robur insignificant gain
Shrubs Common buckthorn Rhamnus cathartica moderate gain
Ground flora Grass of Parnassus Parnassia palustris moderate loss Globeflower Trollius europaeus moderate loss Purple moor grass Molinia caerula insignificant loss Bog‐moss Sphagnum cuspidatum insignificant loss Common reed Phragmites australis insignificant gain Tufted sedge Carex elata small gain Marsh valerian Valeriana dioica small gain Greater tussock sedge Carex paniculata moderate gain
profound as all of the dominant canopy species could struggle in southern Britain; the picture is
somewhat better for Scotland as alder and grey willow could both increase their range.
4.2.11. Native Pine Woodlands
Native Pine Woodlands are dominated by Scots pine, although birch, rowan (Sorbus aucuparia),
alder are also found and sessile oak occurs infrequently. The NVC has only one corresponding
classification ‐ W18 (Pinus sylvestris‐Hylocomium splendens woodland) (Rodwell, 1991); they occur
throughout the central and north‐eastern Grampians and in the northern and western Highlands of
Scotland on infertile podsolic soils (Maddock, 2010).
This habitat has only 34 species represented in the modelling results, although all the main tree
species, including Scots pine (Pinus sylvestris), are included (Table 4.7). In Scotland, Scots pine is
projected to lose suitable climate space significantly under the high emission scenarios (A2) and
moderately under the low emissions scenario (B2) by 2080. Silver birch is also projected to
decrease its suitable climate space in Scotland, although most of its climate space within pine
woodlands remains until 2080. On the other hand, alder and sessile oak are projected to increase
their suitable climate space. There is little change projected for downy birch and rowan.
For understory small trees and shrubs, the suitable climate space is projected to decline for
common juniper, while that of aspen (Populus tremula), holly (Ilex aquifolium), hazel, bell heather
(Erica cinerea) and crowberry show little change. Some ground flora species are projected to lose
their climate space, including lesser twayblade and twinflower (see 4.3.7). The charismatic red
27
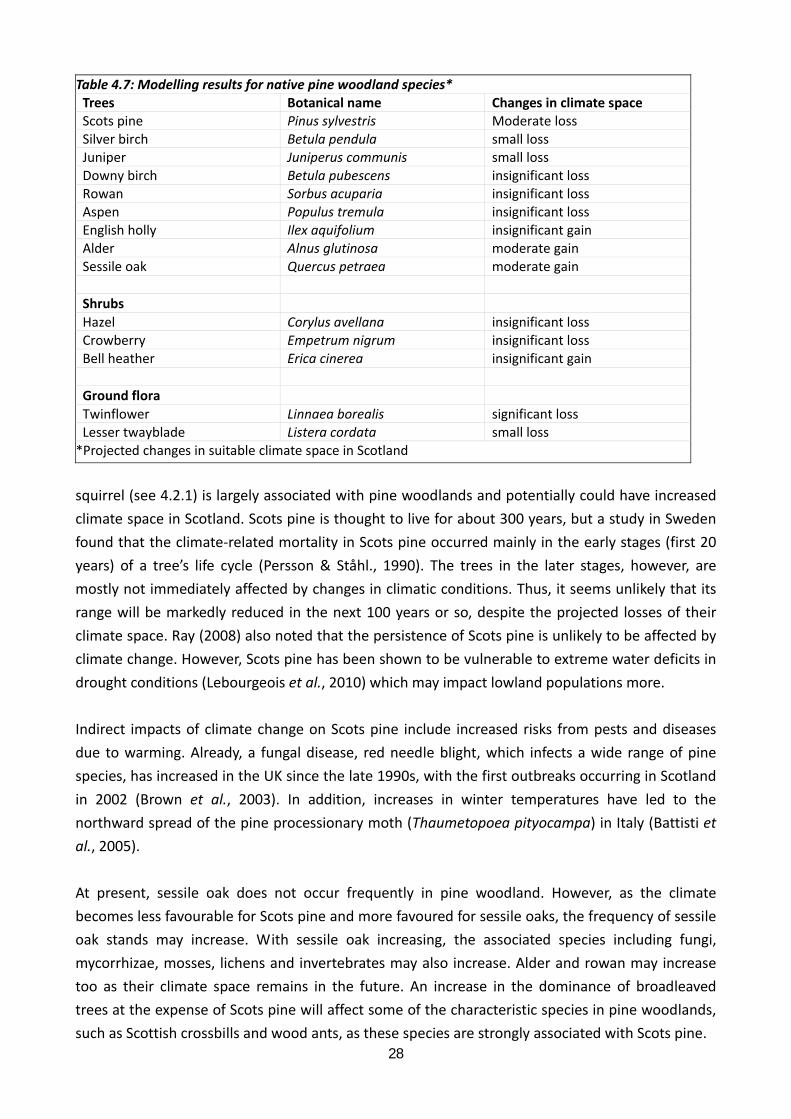
Table 4.7: Modelling results for native pine woodland species* Trees Botanical name Changes in climate space Scots pine Pinus sylvestris Moderate loss Silver birch Betula pendula small loss Juniper Juniperus communis small loss Downy birch Betula pubescens insignificant loss Rowan Sorbus acuparia insignificant loss Aspen Populus tremula insignificant loss English holly Ilex aquifolium insignificant gain Alder Alnus glutinosa moderate gain Sessile oak Quercus petraea moderate gain
Shrubs Hazel Corylus avellana insignificant loss Crowberry Empetrum nigrum insignificant loss Bell heather Erica cinerea insignificant gain
Ground flora Twinflower Linnaea borealis significant loss Lesser twayblade Listera cordata small loss *Projected changes in suitable climate space in Scotland
squirrel (see 4.2.1) is largely associated with pine woodlands and potentially could have increased
climate space in Scotland. Scots pine is thought to live for about 300 years, but a study in Sweden
found that the climate‐related mortality in Scots pine occurred mainly in the early stages (first 20
years) of a tree’s life cycle (Persson & Ståhl., 1990). The trees in the later stages, however, are
mostly not immediately affected by changes in climatic conditions. Thus, it seems unlikely that its
range will be markedly reduced in the next 100 years or so, despite the projected losses of their
climate space. Ray (2008) also noted that the persistence of Scots pine is unlikely to be affected by
climate change. However, Scots pine has been shown to be vulnerable to extreme water deficits in
drought conditions (Lebourgeois et al., 2010) which may impact lowland populations more.
Indirect impacts of climate change on Scots pine include increased risks from pests and diseases
due to warming. Already, a fungal disease, red needle blight, which infects a wide range of pine
species, has increased in the UK since the late 1990s, with the first outbreaks occurring in Scotland
in 2002 (Brown et al., 2003). In addition, increases in winter temperatures have led to the
northward spread of the pine processionary moth (Thaumetopoea pityocampa) in Italy (Battisti et
al., 2005).
At present, sessile oak does not occur frequently in pine woodland. However, as the climate
becomes less favourable for Scots pine and more favoured for sessile oaks, the frequency of sessile
oak stands may increase. With sessile oak increasing, the associated species including fungi,
mycorrhizae, mosses, lichens and invertebrates may also increase. Alder and rowan may increase
too as their climate space remains in the future. An increase in the dominance of broadleaved
trees at the expense of Scots pine will affect some of the characteristic species in pine woodlands,
such as Scottish crossbills and wood ants, as these species are strongly associated with Scots pine. 28
Colonisation in Scots pine communities would depend also on various factors other than climate,
including soil types, land cover, and grazing practices. For example, if land‐use and grazing pressure
allow, scrub species may shift above the current treeline and broaden the upper edge of
pinewoods (Ray, 2008). Juniper and montane willows may also shift to higher elevations where soil
conditions allow (Ray, 2008).
While the projected changes in temperatures and rainfall are likely to bring a negative impact on
Scots pine, enhanced carbon dioxide concentrations are likely to have a positive effect on the
height, diameter growth, and needle biomass (Broadmeadow & Jackson, 2000). The increase in
leaf and needle production will increase shading on the forest floor, which will then affect the
species intolerant of shading. For example, heather may disappear from areas within the pinewood
where light intensity falls below 40% of that under open conditions (Gimingham, 1960), although
its suitable climate space is projected to remain. Growth of wavy hair grass (Deschampsia flexousa)
may also be limited by shade. Thus, species composition may change through losses of the shrubs
and grasses together with their herbivores and this will in turn lead to the changes in ecosystem
functioning.
Disturbance events are likely to become more frequent under climate change. While fires can kill
much of the vegetation, they can often aid in the regeneration of Scots pine (Rodwell, 1991). Silver
birch may also regenerate well following a burn, as the open competition free conditions produced
are ideal for seedling establishment and growth (Atkinson, 1992). Thus, depending on the
regeneration rates, species composition may be affected.
Grazing, particularly by deer, has been identified as the major factor limiting the regeneration of
the native pine woodlands (Palmer & Truscott, 2003). Deer populations are adversely affected by
cold, wet weather, and thus the population densities and ranges are likely to increase due to
climate change (Stokes & Kerr, 2009). Therefore, unless appropriate management actions are
taken, climate change is likely to increase grazing pressures on pine woodland.
4.2.12. Lowland Mixed Deciduous Woodland
Lowland Mixed Deciduous Woodland corresponds with three NVC habitats: W8 (Fraxinus
excelsior‐Acer campestre‐Mercurialis perennis woodland), which makes up the bulk of the priority
habitat, W10 (Quercus robur‐Pteridium aquilinum‐Rubus fruticosus woodland) and W16 (Quercus
spp.‐Betula spp.‐Deschampsia flexuosa woodland) (Rodwell, 1991). Clearly then, this habitat is
found on a range of soil conditions and is found throughout the lowland areas of England, Wales,
Scotland and Ireland (Maddock, 2010). This woodland tends to be of great value for conservation
because many of the remaining examples of it are considered ancient semi‐natural woodlands.
Table 4.8 highlights the main plant species responses.
29
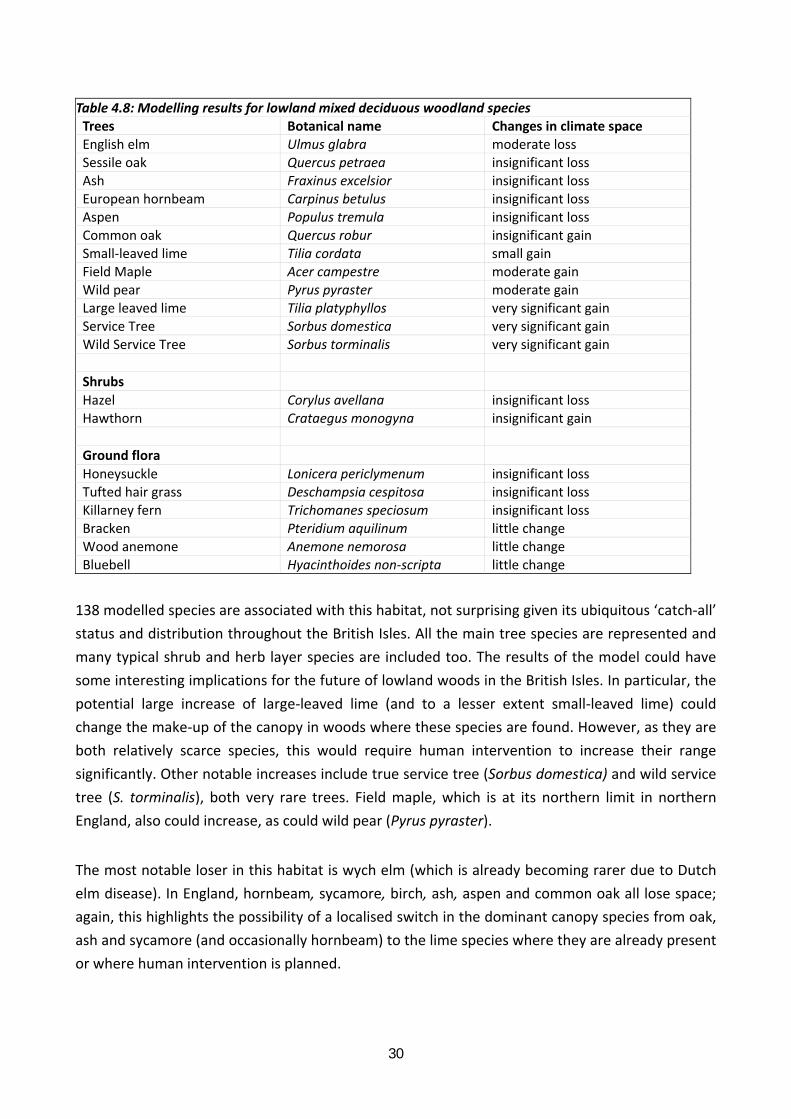
Table 4.8: Modelling results for lowland mixed deciduous woodland species Trees Botanical name Changes in climate space English elm Ulmus glabra moderate loss Sessile oak Quercus petraea insignificant loss Ash Fraxinus excelsior insignificant loss European hornbeam Carpinus betulus insignificant loss Aspen Populus tremula insignificant loss Common oak Quercus robur insignificant gain Small‐leaved lime Tilia cordata small gain Field Maple Acer campestre moderate gain Wild pear Pyrus pyraster moderate gain Large leaved lime Tilia platyphyllos very significant gain Service Tree Sorbus domestica very significant gain Wild Service Tree Sorbus torminalis very significant gain
Shrubs Hazel Corylus avellana insignificant loss Hawthorn Crataegus monogyna insignificant gain
Ground flora Honeysuckle Lonicera periclymenum insignificant loss Tufted hair grass Deschampsia cespitosa insignificant loss Killarney fern Trichomanes speciosum insignificant loss Bracken Pteridium aquilinum little change Wood anemone Anemone nemorosa little change Bluebell Hyacinthoides non‐scripta little change
138 modelled species are associated with this habitat, not surprising given its ubiquitous ‘catch‐all’
status and distribution throughout the British Isles. All the main tree species are represented and
many typical shrub and herb layer species are included too. The results of the model could have
some interesting implications for the future of lowland woods in the British Isles. In particular, the
potential large increase of large‐leaved lime (and to a lesser extent small‐leaved lime) could
change the make‐up of the canopy in woods where these species are found. However, as they are
both relatively scarce species, this would require human intervention to increase their range
significantly. Other notable increases include true service tree (Sorbus domestica) and wild service
tree (S. torminalis), both very rare trees. Field maple, which is at its northern limit in northern
England, also could increase, as could wild pear (Pyrus pyraster).
The most notable loser in this habitat is wych elm (which is already becoming rarer due to Dutch
elm disease). In England, hornbeam, sycamore, birch, ash, aspen and common oak all lose space;
again, this highlights the possibility of a localised switch in the dominant canopy species from oak,
ash and sycamore (and occasionally hornbeam) to the lime species where they are already present
or where human intervention is planned.
30
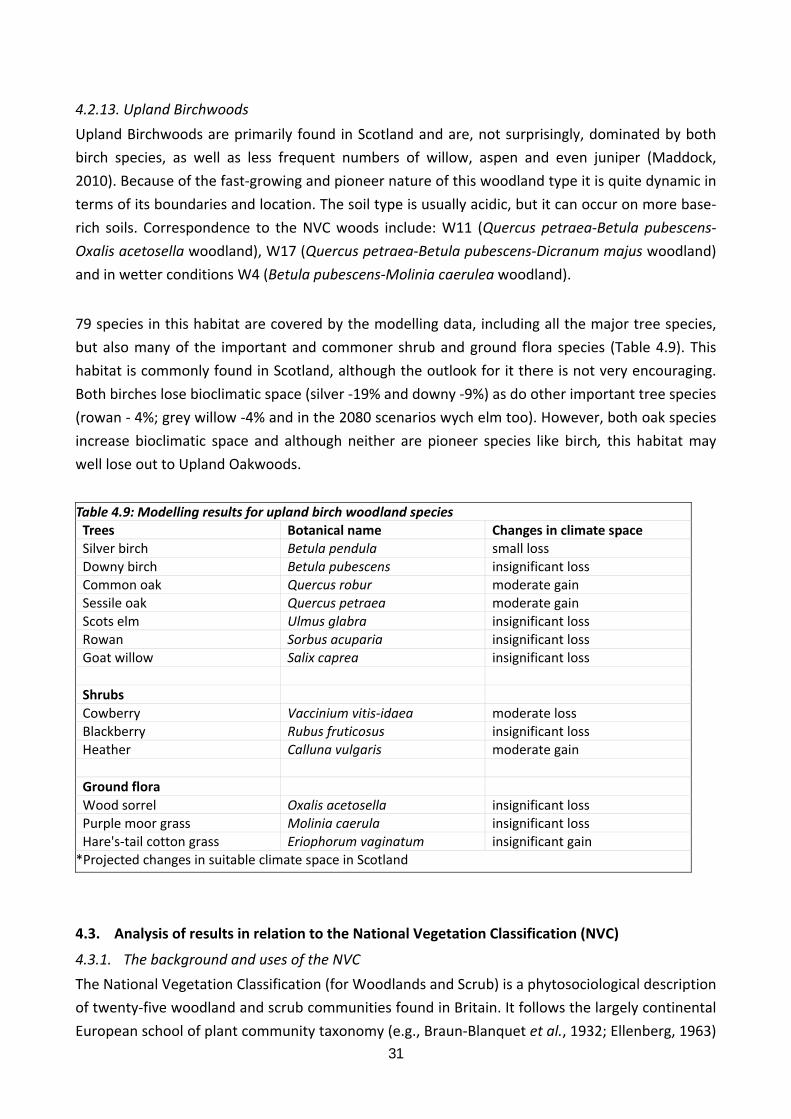
4.2.13. Upland Birchwoods Upland Birchwoods are primarily found in Scotland and are, not surprisingly, dominated by both
birch species, as well as less frequent numbers of willow, aspen and even juniper (Maddock,
2010). Because of the fast‐growing and pioneer nature of this woodland type it is quite dynamic in
terms of its boundaries and location. The soil type is usually acidic, but it can occur on more base‐
rich soils. Correspondence to the NVC woods include: W11 (Quercus petraea‐Betula pubescens‐
Oxalis acetosella woodland), W17 (Quercus petraea‐Betula pubescens‐Dicranum majus woodland)
and in wetter conditions W4 (Betula pubescens‐Molinia caerulea woodland).
79 species in this habitat are covered by the modelling data, including all the major tree species,
but also many of the important and commoner shrub and ground flora species (Table 4.9). This
habitat is commonly found in Scotland, although the outlook for it there is not very encouraging.
Both birches lose bioclimatic space (silver ‐19% and downy ‐9%) as do other important tree species
(rowan ‐ 4%; grey willow ‐4% and in the 2080 scenarios wych elm too). However, both oak species
increase bioclimatic space and although neither are pioneer species like birch, this habitat may
well lose out to Upland Oakwoods.
Table 4.9: Modelling results for upland birch woodland species Trees Botanical name Changes in climate space Silver birch Betula pendula small loss Downy birch Betula pubescens insignificant loss Common oak Quercus robur moderate gain Sessile oak Quercus petraea moderate gain Scots elm Ulmus glabra insignificant loss Rowan Sorbus acuparia insignificant loss Goat willow Salix caprea insignificant loss
Shrubs Cowberry Vaccinium vitis‐idaea moderate loss Blackberry Rubus fruticosus insignificant loss Heather Calluna vulgaris moderate gain
Ground flora Wood sorrel Oxalis acetosella insignificant loss Purple moor grass Molinia caerula insignificant loss Hare's‐tail cotton grass Eriophorum vaginatum insignificant gain *Projected changes in suitable climate space in Scotland
4.3. Analysis of results in relation to the National Vegetation Classification (NVC)
4.3.1. The background and uses of the NVC
The National Vegetation Classification (for Woodlands and Scrub) is a phytosociological description
of twenty‐five woodland and scrub communities found in Britain. It follows the largely continental
European school of plant community taxonomy (e.g., Braun‐Blanquet et al., 1932; Ellenberg, 1963) 31

in that it is the product of statistical classification (primarily TWINSPAN) on plant species
associations which does not make allowance of other factors such as management (compare, for
example, Rackham, 1980; Peterken, 1981). However, it was not the first British woodland
classification to be created in this manner (Tansley, 1965; Bunce, 1982), but it remains today as a
classification widely used by both conservationists and ecologists. It offers a different approach to
the Priority Habitat classification in that it is more refined and less generalised (for example,
Lowland Mixed Deciduous Woodland is covered by a multitude of NVC communities).
Using the NVC for analysing climate change effects on woodland communities offers some
advantages over the Priority Habitats; for example, will any given NVC habitat retain the same
classification and nomenclature over the next 50 or 80 years? This is less likely than the Priority
Habitats perhaps (as they are so broad) and poses some interesting questions for ecologists as
well as conservationists. The NVC, as a (fairly) easy classification to use, also allows woodland
managers an opportunity perhaps to gauge community change over the coming years more easily
than using the Priority Habitat system ‐ this, at least offers more scope for improving adaptation
options (see section 5.5). Here we will look at two fairly common and species‐rich NVC
communities.
4.3.2. NVC W8 Fraxinus excelsior‐Mercurialis perennis‐Acer campestre woodland
This lowland ash‐dominated woodland is fairly ubiquitous in Britain (in fact one of the sub‐
communities can be found on higher slopes too), although it is more of a rarity on the continent
(possibly as foresters prefer to encourage oak for timber) (Rodwell & Dring, 2001). A comparison
with the results from the Lowland Mixed Deciduous Woodland Priority Habitat allows us to pick
out the W8 species from the W10 (although in reality W8 and W10 share many species, but differ
in the dominance of the main canopy species, not surprisingly ash and oak). Although W8 is
probably the ‘climax’ woodland on their very base‐rich soils where rainfall is less than 1000mm
(out‐competing even oak) it requires a certain amount of soil moisture to grow comfortably
(Rodwell, 1991). In situations under future drier and warmer conditions the dominance of ash may
begin to be threatened by common oak which has a greater tolerance of drought. It may even see
a return to the prehistoric patterns of small‐leaf and large‐leaf lime dominance on these soil types
where they are still present (e.g., Wye valley and the White Peak (Pigott, 1969; Peterken & Jones,
1989a); if warmer and drier summers become more prevalent then an increase in lime is a distinct
possibility (Pigott & Huntley, 1978, 1980, 1981), especially if a more planned recovery/re‐
introduction programme is adopted. Certainly the modelling results suggest that the lime species
are capable of doing very well under future climate change and whilst other species also do well
(the service trees, wild pear and field maple), the limes are the only two, other than oak, that are
major canopy species.
However, without human intervention, it is perhaps more likely that oak will be a more common
successor to ash‐dominated woodlands (except in the really base‐rich soils) if only because oak is
very common and the limes, although widespread, are not very abundant (heavy browsing from
32

deer would also reduce the chances of limes spreading). On, the more northerly facing and
damper sites though ash is likely to hold on and maintain the W8 community composition for
longer.
4.3.3. NVC W10 Quercus robur‐Pteridium aquilinum‐Rubus fruticosus woodland
The NVC W10 oak woodlands are found on slightly more acidic soils to the W8 community
although they share many species. Their edaphic preferences lie in between the base‐rich soils and
the truly acidic podzols that W16 and W17 prefer, in this regard it is not surprising that they can be
very species‐rich. The relative climate change tolerance of both oak species suggests that many
W10 woods will remain fairly intact in terms of their dominant canopy species; however, like W8,
the lime species may prove to be more successful colonisers if encouraged by human intervantion.
Similarly, on the more acidic sites with W10, sweet chestnut (Castanea sativa) could compete
more with oak and start to replace it. In the north, where oak still outcompetes beech (and
hornbeam) there may be a gradual shift in dominance to beech. This is already happening but
many managers of W10 ancient semi‐natural woods in the north actively control beech. In the
wetter parts of Scotland, W10 may also succeed W11 (Quercus petraea‐Betula pubescens‐Oxalis
acetosella) as the climate becomes drier.
4.4. Impacts of climate change on rare and charismatic species
4.4.1. Charismatic species
The charismatic species showed a mixed response to projected changes in potential suitable
climate space (Table 4.10), which is similar to those found in other studies, such as MONARCH
(Harrison et al., 2001; Berry et al., 2005; Walmsley et al., 2007).
Table 4.10: Changes in potential suitable climate space for charismatic species
Non‐plant taxa Scientific name Change in climate space Great crested newt Triturus cristatus Decrease Capercaillie Tetrao urogallus Decrease Otter Lutra lutra Little change Bluebell Hyacinthoides non‐scripta Little change Nightjar Caprimulgus europaeus Increase Red squirrel Sciurus vulgaris Increase Beech Fagus sylvatica Increase Wild Service Tree Sorbus torminalis Increase Yew Taxus baccata Increase Dormouse Muscardinus avellanarius Mixed Plant taxa Juniper Juniperus communis Decrease Scots pine Pinus sylvestris Decrease
4.4.2. Species showing little change
Both the species showing little change are currently widespread, although they could be affected
by other pressures, which at the moment do not appear sufficiently serious to affect the species'
future. For example, otter (Lutra lutra) was a widespread species, and was lost from many 33

catchments in the 1950s‐1970s, but it has been recovering and spreading into southern and
northern English rivers as water quality improves (Crawford, 2003). Climate change appears to
have little direct impact via climate space, so providing water quality continues to improve and
remains suitable, despite possible climate change related decrease in flows, this species should
not be affected. For bluebell (Hyacinthoides non‐scripta), the spread of alien bluebells (hybrids or
‘Spanish’) is a possible future threat, although a study in south‐central Scotland showed that
currently increasing rainfall was associated with increasing native and decreasing alien densities
and that the presence of aliens was more related to human factors (Kohn et al., 2009).
4.4.3. Species showing potential increases in climate space
Of the five showing a potential increase, nightjar (Caprimulgus europaeus) is not projected to have
current suitable climate space, despite it being widely recorded in the UK, although it is not so
frequent in Scotland. Thus, while there is potential new climate space, particularly in Scotland and
Ireland, much of the apparent model increase is a function of the model not projecting current
suitable climate space well. The same is true for red squirrel and yew. Red squirrel, for example,
was recorded from almost all squares in Great Britain, apart from the north of Scotland and was
infrequently recorded in Ireland. Nowadays it is no longer found in many of these due to
competition with the introduced grey squirrel (Sciurus carolinensis) (Gurnell & Pepper, 1993). Grey
squirrel also carry parapox virus, which is highly pathogenic to red squirrels and studies in the UK
have shown that 61% of apparently healthy grey squirrels have been exposed to the virus and may
be carriers (McInnes, 2006). When the virus is present, the grey squirrel can replace the red
squirrel 20 times faster than normal replacement rate (Rushton et al., 2006) and thus is a
potentially more significant and immediate threat than climate change. The other main threats to
red squirrel are habitat loss and fragmentation, but these are not considered to pose a major risk
at present (Shar et al., 2008).
Beech is projected to increase, particularly in Scotland and Northern Ireland and a part of this is a
function of the model being trained on the “native range”, rather than its planted or naturalised
range (Berry et al., 2002). Wild service tree is found primarily in the southern and central parts of
England and the lower areas of Wales and there is a large increase potential increase of suitable
climate space in Scotland and Ireland. The other tree species are discussed in more detail under
the Priority Habitats with which they are associated.
Nightjar has declined in range by 52% between 1968‐72 and 1992, although there has been a
partial recovery due to improved forest management and increased felling. The decline is thought
to be due to loss of heathland habitat area and condition, although it is possible that a decrease in
food supply arising from changing agricultural practices and/or climate change also may have
affected population numbers (from the Species Action Plan). In a study of the effect of urban areas
and human disturbance on nightjar numbers, it was shown that the presence of woodland within
500m of the heathlands had a positive effect (Liley & Clarke, 2003).
34

4.4.4. Species showing potential decreases in climate space
The potential for a decline in great crested newt is supported by a 12 year study of four pond
systems near Canterbury, Kent, which found that variations in inter‐annual survival was inversely
related to winter temperatures and winter rainfall, while asynchrony in population dynamics was
probably a function of recruitment and juvenile dispersal (Griffiths et al., 2010).
A study characterising the fundamental and realised niche of capercaillie in Europe found that a
low degree of canopy density (50‐60%) and an extensive layer of dwarf shrubs (80‐100%) were
essential habitat parameters (Scherzinger, 2009). It was suggested that these can be achieved by
appropriate management when logging. The possible causes of declines in capercaillie in Scotland
since the 1970s have been reviewed by Moss (1994) and include low breeding success, predation,
and habitat destruction through changed silvicultural practices, climate change and collision with
fences (Baines & Summers, 1997; Baines & Andrew, 2003). Moss et al. (2000) suggested that the
main causes of decline were the low breeding success, exacerbated by deaths of fully grown birds
flying into forest fences. Wet summers and cool springs also have been associated with poor chick
survival (Moss et al., 2001) and data from Speyside shows a recent tendency for June rainfall to
increase (Summers et al., 2004).
Capercaillie is projected to lose all suitable climate space under some scenarios by the 2050s or
2080s, although the above studies suggest that warmer, drier summers should favour the species.
The key species with which it is associated: Scots pine and bilberry (Vaccinium myrtillus) do not
show significant losses (Berry et al., 2005) and thus if its habitat can be maintained and the other
pressures affecting its survival can be addressed, climate change could have a less severe impact
on this species.
Scots pine and juniper are discussed in association with pine woodland and both could decline in
range under climate change. Many stands of juniper are isolated in the present‐day British
landscape, and this fragmentation and loss of juniper populations can result from a variety of
causes, such as shading from planted or developing secondary woodland, land use changes (e.g.
Ward and King, 2006), aging juniper populations (Ward, 1982), or changes in site conditions
(Broome et al., 2008). Regeneration of juniper is now a rare event (e.g. Ward, 1973; Clifton et al.,
1997; Sullivan,2003) and this failure to regenerate may stem from a variety of causes linked to
changes in land management practices, including increased herbivore and rabbit pressure (Fitter
and Jennings, 1975; Gilbert, 1980; Ward, 1982; Clifton et al., 1997; Ward and King, 2006) and
possibly limited seed viability (Garcia et al., 2000; Verheyen et al., 2005; Verheyen et al., 2009).
This indicates a potential for a wider distribution if woodland was re‐created, pressures reduced
and climate remained suitable.
35

4.4.5. Species showing a mixed response
Dormouse (Muscardinus avellanarius) is primarily found only in England and it has become extinct
from seven counties. The main threats are changes in woodland management practice,
particularly the cessation of hazel coppicing and stock incursion into woodland, as well as
woodland fragmentation, since short distances, possibly as little as 100m, form absolute barriers
to dispersal, unless arboreal routes are available (Species Action Plan). Dormouse shows a mixed
response, with a possible decline under both the HadCM3 scenarios, but an increase under the
PCM scenarios, thus suggesting the climate space of this species is quite sensitive to climate.
A number of the charismatic species, therefore, have the potential to maintain or increase their
suitable climate space and thus continue to contribute to people's enjoyment of the woodlands in
which they are found. Other potential threats, however, have been identified and it is important
that these are monitored and/or action taken to reduce them so that the species are better placed
to cope with the pressure of climate change (Section 5).
4.4.6. Rare Species
The rare species also show a mixed response to climate change, with the greatest proportion
showing a loss of suitable climate space (Table 4.11). A number of the findings for the rare species
Table 4.11: Changes in potential suitable climate space for rare species in the UK
Change in climate space Species Scottish wood ant Formica aquilonia Decrease Narrow‐headed ant Formica exsecta Decrease Hairy wood ant Formica lugubris Decrease Southern wood ant Formica rufa Decrease Mining bee Andrena ferox, Decrease Scottish crossbill Loxia scotica Decrease Spotted flycatcher Muscicapa striata Decrease Bullfinch Pyrrhula pyrrhula Decrease Black grouse Tetrao tetrix, Decrease Song thrush Turdus philomelos Decrease Brown hare Lepus europaeus, Decrease Linnet Carduelis cannabina Little change
Wryneck Jynx torquilla Little change
Tree sparrow Passer montanus Little change
Pipistrelle bat Pipistrellus pipistrellus Little change
Lady`s slipper orchid Cypripedium calceolus Little change Pool frog Rana lessonae Increase Stag beetle Lucanus cervus Increase Barbastelle bat Barbastella barbastellus Increase
Bechstein’s bat Myotis bechsteinii Increase
Greater horseshoe bat Rhinolophus ferrumequinum Increase Lesser horseshoe bat Rhinolophus hipposideros Increase Pearl‐bordered fritillary Boloria euphrosyne (increase then decrease) Mixed Twinflower Linnaea borealis Decrease
36

need to be treated with caution, as often models have greater difficulty in accurately projecting the
species' current suitable climate space, particularly if there are few recorded presences. Also if
these presences are widely spaced then it can over‐project the current and future climate space,
with large parts of the UK being apparently climatically suitable, when the species occurrence is
infrequent and/or in restricted locations. An extreme example is the warty wax lichen (Thelenella
modesta), for which there are only eight records on the NBN website at sites widely distributed
across Britain and Ireland and the model shows most of this area to be suitable climate space. The
SAP2 says that there is only one remaining population which is stable for as long as its host tree
lives, although there are apparently suitable adjacent trees which have not been colonised. A
similar pattern is seen for some other lichens, such as Biatoridium monasteriense. The model,
therefore, is apparently over‐projecting suitable climate space, although this may not be the case
where there are particular environmental or historical factors that are severely constraining the
species' distribution in the UK.
Another difficulty encountered with modelling rare species is that if they are at the edge of their
range in the UK and/or have a very concentrated distribution, the model may not simulate any
suitable climate space for the species. This is the case for the stump lichen (Cladonia botrytes)
where the European distribution does not include its UK distribution and although there is suitable
climate space in the future it is in the west, not the east of Scotland where it is currently recorded.
A similar problem was encountered for the charismatic species, nightjar. These modelling
difficulties are discussed further in the MONARCH 3 report (Berry et al., 2007) and those species
for which the modelling outcomes are not sufficiently robust in terms of their relationship to the
species recorded distribution are not discussed further here. All the rare species had either an
excellent or very good agreement between their observed and projected European distribution
(see Section 3.2.3), while those for spotted flycatcher, Barbastelle bat and Bechstein’s bat were
classified as good. This suggests that the model outputs are robust enough for further analysis of
the potential future climate space distribution for these species.
4.4.7. Species with little change in suitable climate space
Those showing little change are species for which nearly the whole of the UK is projected as
suitable climate space, although in the case of the pipistrelle bat (Pipistrellus pipistrellus) there are
only a few records in Ireland and much of the currently suitable climate space has yet to be
colonised. Wryneck (Jynx torquilla) has a scattered distribution throughout Great Britain, with no
records in Ireland and for both there is little change in the availability of future climate space.
Climate change, especially increased rain in the breeding season is thought to be one of the
reasons for the long‐term decline in the numbers and range of wryneck (BirdLife International,
2011) and drier springs could help breeding success, but other factors, such as agricultural
improvement, loss of habitat and herbicide and pesticide use are also thought to be responsible
(del Hoyo et al., 2002). For all the species, factors such as changing agricultural practices affecting
2 http://www.ukbap‐reporting.org.uk/plans/national_plan.asp?SAP={37EE0A07‐1586‐4CB3‐8C28‐C8F9D7672474}.
Accessed 01/03/11 37
food availability at critical times of the year will be important factors affecting their future, while
pipistrelle bats could also be affected by the loss of winter roosting/hibernation sites in buildings
and old trees.
Lady’s slipper orchid used to be more widespread in northern England and currently is only found
naturally at one site and it has been planted in two others. It is one of the species for which the
model projects no current and little future suitable climate space in the UK and the latter has a low
probability of occurrence.
4.4.8. Species with increased suitable climate space
Pool frog only has very scattered records in England and has been re‐introduced in some of these
locations. While it has a great spread of potential future climate space it is unlikely to fulfil it, partly
due to a lack of suitable habitats to aid dispersal and colonisation, although longer hotter summers
could help the tadpoles to metamorphose in September. The projected increase in suitable climate
space for the Stag beetle (Lucanus cervus) across much of Britain and Ireland under the high
scenarios represents much of its former range. This is a thermophilous species, with the mean
average temperature in Belgium being largely found within the 16.5oC mean July isotherm (Hawes,
2004), although some authors suggest that its distribution is limited by the amount of rainfall
(Percy et al., 2000; Pratt, 2000). Also. it requires dead wood, possibly with a preference for oak.
This could mean a reduction in suitable future habitat in southern England, although it does lose
suitable climate space in some of this area under a 2080s high scenario.
All the bat species have declined over the last 50 years, as a result of factors such as loss of
pasture, wetlands and hedgerows that provide insect‐rich feeding areas and flyways, loss or
disturbance of roosting and hibernation sites, and for greater horseshoe bat population declines
during the 1960s and 1980s have been attributed to unsuitable weather conditions. They all show
a projected expansion northwards and in some cases eastwards in Britain and Ireland. Bechstein’s
bat is not observed in Ireland, but suitable climate space occurs here and there is a question as to
whether it is likely to fulfil any of this potential range. The bats have varying mean flying ranges
although individuals are known to have flown much further, but they should be able to disperse
into new suitable climate space providing that a sufficient supply of insects and roosting and
hibernation sites are available. Climate change could benefit the greater horseshoe bat, where it is
known that a minimum mean temperature of 10oC in April and May is crucial for the timing of
births and population numbers (Walmsley et al., 2007).
4.4.9. Species with decreased suitable climate space
The Scottish wood, narrow‐headed, hairy wood and southern wood ants are all projected to lose
suitable climate space, with the narrow‐headed ant being the most severely affected, with a
complete loss projected under the high emission scenario by the HadCM3 climate model. Also, the
narrow‐headed ant has very poor dispersal capabilities and it is unlikely that it can adapt or
disperse adequately in the face of rapid environmental change (Hughes, 2006). There is no new 38
climate space projected, but some overlap between its current and future climate space would
remain in Scandinavia.
Wood ants have been considered as a ‘keystone’ species in the forest ecosystem (Fowler &
Macgarvin, 1985), as they have a vital functional role through influencing the distribution and
abundance of many invertebrate species, dispersing seeds, preying on invertebrates that affect
tree health and growth, contributing to nutrient cycling, providing microhabitats and a food
source for predators, including the charismatic capercaillie (Hughes & Broome, 2007).
Both the Scottish wood ant and hairy wood ant are associated with areas of semi‐natural
woodland, especially pine and birch. Scottish wood ant is more tolerant of shading than hairy
wood ant and its nests tend to be in more sheltered spots, while hairy wood ant prefers more
open situations, as it needs more sunshine to raise solaria temperatures high enough for brood
development (Willet, 2001). If any changes occur to the species that provide the canopy cover,
wood ants can also be affected, but there is not enough evidence to know how the relative
abundance of the two might be affected. However, in an investigation into wood ants in southern
Finland it was found that the hairy wood ant was more common in young forests and in small old‐
forest fragments than expected by chance (Punttila, 1996). The main threats to these ant species
is shading due to lack of management or unsympathetic clear felling that may destroy nests and
lead to a loss of food sources (Hughes & Broome, 2007).
Little is known about the mining bee (Andrena ferox), but it is only found in a few sites in southern
England, thus its current climate space is far wider than its recorded distribution. It is only
projected to have slight decreases in climate space although these are particularly in Scotland
where it is not currently found. The mining bee is thought to be primarily associated with oak;
with populations being possibly affected by the availability of a succession of oak trees flowering,
such as would occur in a natural rather than even aged stand (Edwards, 2008). The mining bee also
could be adversely affected by the potential decline in oak in southern England, although it has
been observed collecting pollen from hawthorn and field maple (Edwards, 2008). Therefore, while
it is not likely to be directly affected by climate change, it could be indirectly affected through
declines in its prime pollen source.
The projected suitable climate space for Scottish crossbill declines moderately by 2080. Using a
different modelling technique (i.e. response‐surface approach), but with the same HadCM3
climate model, Huntley et al. (2008) also found a decrease in the suitable climate space, but to a
greater extent, such that climate space will completely be lost by 2080 under either a A2 or B2
scenario.
The Scottish crossbill is confined to northern and eastern Highlands of Scotland (Summers et al.,
2002). It feeds on conifer seeds, and while it is also found in conifer plantations, a high proportion
of the species is associated with Scots pine woodlands, particularly the old‐growth forests 39

(Summers et al., 2002; Summers, 2007). While Scots pine is unlikely to be lost within the next 100
years or so (see native pine woodland), phenological changes may occur, such as changes in the
timing and availability of seeds and the size of cones, which may affect its breeding phenology
(Benkman, 1987, 1990; Summers & Proctor, 1999). The degree of threat to the Scottish crossbill
also depends on whether populations that currently reside in Scots pine woodlands can adapt to
plantations of non‐native species, which is currently unknown.
The spotted flycatcher (Muscicapa striata) is a summer migrant bird that has shown no change in
its arrival date in recent years (Sparks et al., 2007), but has shown a more than 50% decrease in
populations in England between 1967–2006 (Thaxter et al., 2010). The causes of this decline are
not known, but the Species Action Plan suggests that weather in the UK or drought in the Sahel, as
well as loss of nest sites and decreased invertebrate availability in summer may contribute.
Increased summer temperatures and sunshine may have positive effects. The main loss of climate
space is projected to be in Wales and Ireland.
While the bullfinch (Pyrrhula pyrrhula) is widespread in the UK, the Common Bird Census has
indicated a 75% decline on farmland and 47% in woodland between 1968 and 1991. It is possible
that the loss of nesting habitat through the removal of farmland trees and hedgerows with an
associated loss of food sources (buds, seeds and fruits) through herbicide usage, along with a loss
of winter food sources, such as winter stubble fields, have contributed. The loss of climate space is
particularly severe in England and appropriate farmland management will be important in
increasing population numbers.
Historically black grouse used to be much more widespread, being common in Britain, but absent
from Ireland, thus the current climate space does not match its former distribution. Between
1994/95 and 2005 populations have declined by 22% (Sim et al., 2008), although there has been
recovery in some areas in North Wales and the Pennines as a consequence of favourable habitat
management. Agricultural intensification, moorland drainage, and increased grazing levels are
possible causes of decline, especially in the Pennines, while commercial forest maturation, along
with collision with fences are likely causes in the highlands of Scotland. Potential simulated climate
space is projected to be lost from almost the whole of Britain by the 2080s under the HadCM3 A2
scenario, although the Scottish Highlands remain suitable under the B1 scenario. Curculionidae,
which are thought to be an important part of their diet are predicted not to be particularly
vulnerable to climate change (Pearce‐Higgins, 2010).
The song thrush has declined since about 1970 and it appears to be particularly affected by long
frost periods and by drought (Robinson et al., 2007), which may affect its foraging for earthworms
in damp ground. The loss of grassland from eastern England, loss of hedges and scrub and the
degradation of woodland may be contributory factors (Peach et al., 2004). The projected loss of
climate space is particularly focused on southern England and this, combined with potentially
40

negative effects of climate change on its food supply in this area, poses a threat to this species,
however, a decline of frost periods could enhance fledgling success.
The brown hare (Lepus europaeus) has been declining in many areas and a study examining
population densities in connection with habitat found that in 12 European countries it is primarily
associated with farmland, with intensification of agriculture as the major cause of its decline
(Smith et al., 2005). While is a highly adaptable species it has a preference for weeds and wild
grasses when available and intensified agro‐practices have reduced this food source resulting in
the selection of crop species (Reichlin et al., 2006). By 2080, a significant amount of climate space
is lost in England, south of a line from the Mersey and the Humber.
Twinflower is confined to north‐east Scotland and occurs in highly isolated patches (Scobie &
Wilcock, 2009). It is projected to significantly lose suitable climate space by 2050 and may lose it
completely by 2080. Given that the current distribution is more restricted than its current climate
space, the loss could have detrimental effects on the species. However, it is not known to be
critical to ecosystem functioning or to provide a direct ecosystem service, other than perhaps a
cultural one.
Thus for many of these rare species, climate change is only one of a number of pressures that
could affect them in the future and, in many cases of species losing climate space the two act
together to enhance the risk of population and/or range loss. Reversing habitat loss and
inappropriate land management practices are two key options for addressing the impacts of
climate change on these species, although the exact requirements will depend on the ecology of
the species.
4.5. Potential new species
If no native tree species are suitable replacements in woodlands, then non‐natives might be
another option, but this suggestion is likely to be very controversial. Some continental European
tree species have similar ecological niches to some tree species potentially threatened by climate
change in Britain and could be substitutes, for example downy oak (a species that gains a lot of
space in Britain in the model) for common oak; and some have similar decay processes too e.g.
sweet chestnut and common oak.
Looking further afield, the eastern oriental beech is known to be more drought tolerant than
common beech (Wilson et al., 2008). Other potential replacement species include narrow‐leaf ash
(Fraxinus angustifolia), which also gains a lot of climate space in England and Wales, for common
ash; and by 2080 Manna ash (F. ornus) may even by a suitable replacement. However, much more
comparative work needs to be done to establish which species will provide similar niche
opportunities for specialists and which, if any, tree would offer a suitable replacement for drought
affected beech, before consideration of replacement tree species is a realistic option. There are
also issues relating to plant hygiene and, in addition, a fundamental shift in thought would be 41

needed to allow the introduction of exotic species onto sites of conservation importance where
the current management strategy is to maintain the current native species composition. Guidance
on dealing with the changing distribution of tree species in England (Natural England, 2009)
addresses controversial ‘possible’ native species, such as sycamore, and puts in context the value
of species like sweet chestnut and pines, but the clear presumption is that more ‘exotic’ species
are not recommended.
5. Discussion 5.1. Application of bioclimate models
Bioclimate envelope models are fraught with theoretical and practical difficulties, not least of
which is the actual extent to which climate governs distributions (Davis et al., 1998; Hampe, 2004).
Each current species' distribution represents the realised niche of that species but future re‐
distributions under climate change scenarios provide a fundamental niche (i.e., it does not take
into account biotic and other factors). At smaller scales other determinants affect species'
distribution including biotic factors like competition, facilitation and mutualism; but also intra‐
population factors like phenotypic plasticity; geographic factors like soil type, land‐use, human
management, fire and fragmentation. However, whether these factors exert any control over
macro‐scales is still disputed (Hampe, 2004; Araújo & Luoto, 2007). One study has shown that
European plant and bird distributions are closer to ‘climatic equilibrium’ than reptiles and
amphibians which has obvious implications for modelling performance in cross‐taxa studies for
conservation (Araújo & Pearson, 2005). However, other research has shown that in a study of 55
European tree species, the majority fill less than 50% of their potential climatic range (using a
bioclimatic model and Atlas Flora Europaeae data); they attributed this to historical factors such as
poor dispersal after the last glacial period (Svenning & Skov, 2004). The issue of equilibrium also
highlights problems that can occur with sampling distribution data ‐ a number of studies have
shown that model performance is reduced with incomplete coverage of all climatic zones in a
species' distribution (Stockwell & Peterson, 2002; Kadmon et al., 2003; Thuiller et al., 2004a).
Other studies have shown that where species have limited occurrence data available then the type
of modelling method can affect the performance considerably too (Hernandez et al., 2006; Wisz et
al., 2008).
To date, bioclimatic models have used a number of different statistical techniques including
various regressions (GLMs, GAMs, multiple logistic regression), classification tree analyses,
artificial neural networks and maximum entropy methods amongst others (Heikkinen et al., 2006).
A number of studies have compared these techniques although within the context of climate
change these have been comparatively few (Thuiller et al., 2003; Araújo et al., 2005; Pearson et
al., 2006). Results from these analyses vary although in general the more complex techniques
(GAMs and ANNs) have been more successful (Heikkinen et al., 2006), but it is also worth noting
that model performance also varies with the quality and selection of raw data.
ANNs have been shown to have a number of advantages over other approaches (Heikkinen et al.,
2006): they are robust to noise (e.g., errors in distribution data)(Hilbert & Ostendorf, 2001); they 42
have the ability to cope with different types of predictor variables such as categorical, numerical
or boolean (Pearson et al., 2002); and, they can work with distributions that have non‐linear
responses to variables (Hilbert & Ostendorf, 2001). The last advantage is particularly useful for
modelling species with non‐contiguous or patchy distributions and ANNs have been used
successfully in recent years for species distribution modelling (Guisan & Zimmermann, 2000;
Hilbert & Ostendorf, 2001; Williams et al., 2009).
So, given that these models have a number of caveats limiting their utility, do they have any use in
modern predictive ecology? They do at least offer a quick and (relatively easy) assessment of
climate change impacts for large numbers of species, particularly if there are few data on a
species' physiology and ecology. There is, though, plenty of room for improvement ‐ general calls
for improving data quality, processing and evaluation abound (Guisan & Thuiller, 2005; Araújo &
Guisan, 2006); in fact the limitations of bioclimatic models are well known and development
addressing any of these issues is a step forward (and indeed many research groups are doing just
this). Perhaps some issues stand out more than others though, and given the complexity of
community dynamics (Ferrier & Guisan, 2006), some are perhaps more attainable. For example,
Thuiller et al (2008) suggest progression in incorporating species migration as well as a better
understanding of species' trailing edge dynamics are imperatives. One other possible
improvement would be to incorporate more realistic community assembly processes, an approach
that would perhaps be best achieved by adopting species' traits (Thuiller et al., 2004b; Guisan et
al., 2006).
5.2. Comparison with Ecological Site Classification results
The potential impacts of climate change on timber tree species have been assessed by the
Forestry Commission using the Ecological Site Classification (ESC) (Ray, 2001; Broadmeadow &
Ray, 2005; Ray, 2008; Broadmeadow et al., 2009b; Ray et al., 2010). The ESC models indicate
suitability of tree species to site conditions where suitability is defined in terms of growth relative
to maximum growth rates achieved in the UK (Broadmeadow et al., 2009b). They use six
biophysical factors, including two soil factors, fertility and moisture availability, and four climatic
factors, accumulated temperature, moisture deficit, wind exposure, and continentality (distance
from the sea). ESC first calculates the potential yield of a given species at the site as a function of
accumulated temperature, subsequently modified by the most limiting of the remaining five
biophysical factors (Ray, 2001). The underlying climate data represent the 1961‐90 average
climate at a spatial resolution of 10 km. The future climate data are derived from UKCIP02 climate
projections in 2050 and 2080 under the High and Low emissions scenarios (Hulme et al., 2002).
Suitability is then calculated from the predicted yield; for example, the site is classified as ‘very
suitable’ if the species achieve 75% or more of its maximum yield in Britain, ‘suitable’ if 50%‐75%,
and ‘unsuitable’ if less than 50% (Ray, 2001). Like SPECIES, ESC suitability models do not
takeaccount of the effects of pests and pathogens, extreme climatic events, or increasing CO2
concentrations on tree productivity.
43

While both ESC and SPECIES models project the potential changes of suitable conditions for tree
species under future climate scenarios, comparison of the results are complicated partly because
the suitability changes projected by ESC models are different from the climate space changes
projected by SPECIES. The changes in the suitability classes in ESC represent the changes in timber
productivity. It follows that the effects of reduced suitability under the future climate are likely to
be seen in the form of reductions in productivity, rather than complete loss of the species from
the site (Broadmeadow et al., 2009b). In addition, ESC does not take account on the species
distributions and does not indicate if the species is planted at the ‘suitable’ site.
Moreover, the climate scenarios used to provide future climatic conditions are different as
SPECIES as used in this project utilised HadCM3 General Circulation Model (GCM) and the High and
Low emissions scenarios were derived from the IPCC A2 and B1 scenarios. On the other hand, the
UKCIP02 High emissions projections correspond with IPCC A1F1, while the UKCIP02 Low emissions
projections correspond with IPCC B1 scenario. The climate projections based on UKCIP02 High
emissions scenarios show generally greater changes than those for HadCM3 A2 scenarios, in
particular, temperature increases in England, winter precipitation increases in Wales, and summer
precipitation decreases in Britain (Table 5.1). (The projections for Northern Ireland were not
available for ESC models and thus excluded from comparison here.)
Table 5.1: Changes in temperature and precipitation for two 2080 scenarios
England Wales Scotland Annual temperature change (°C) UKCIP02 2080 High 3.9 3.64 2.95 HadCM3 2080 A2 3.14 3.1 2.76 Summer precipitation change (mm/month)
UKCIP02 2080 High ‐28.06 ‐38.16 ‐22.6
HadCM3 2080 A2 ‐22.38 ‐27.54 ‐12.61 Winter precipitation change (mm/month)
UKCIP02 2080 High 17.6 27.88 19.54
HadCM3 2080 A2 17.8 19.92 15.42
(Adapted from Berry et al., 2007)
The ESC projections for beech under Low and High scenarios in 2050 and 2080 (Figure 2) showed
that, under all but the 2080 High emissions scenario, the suitability in east and west Wales,
northern England, and eastern and western Scotland are projected to increase (Broadmeadow et
al., 2009b). In contrast, the suitability in eastern England declines to the extent that under the
2080s High emissions scenario, there is virtually no area deemed ‘suitable’ for beech in the region.
The model thus projects the likelihood of a significant regional shift in the occurrence of beech as
a productive forest species.
44
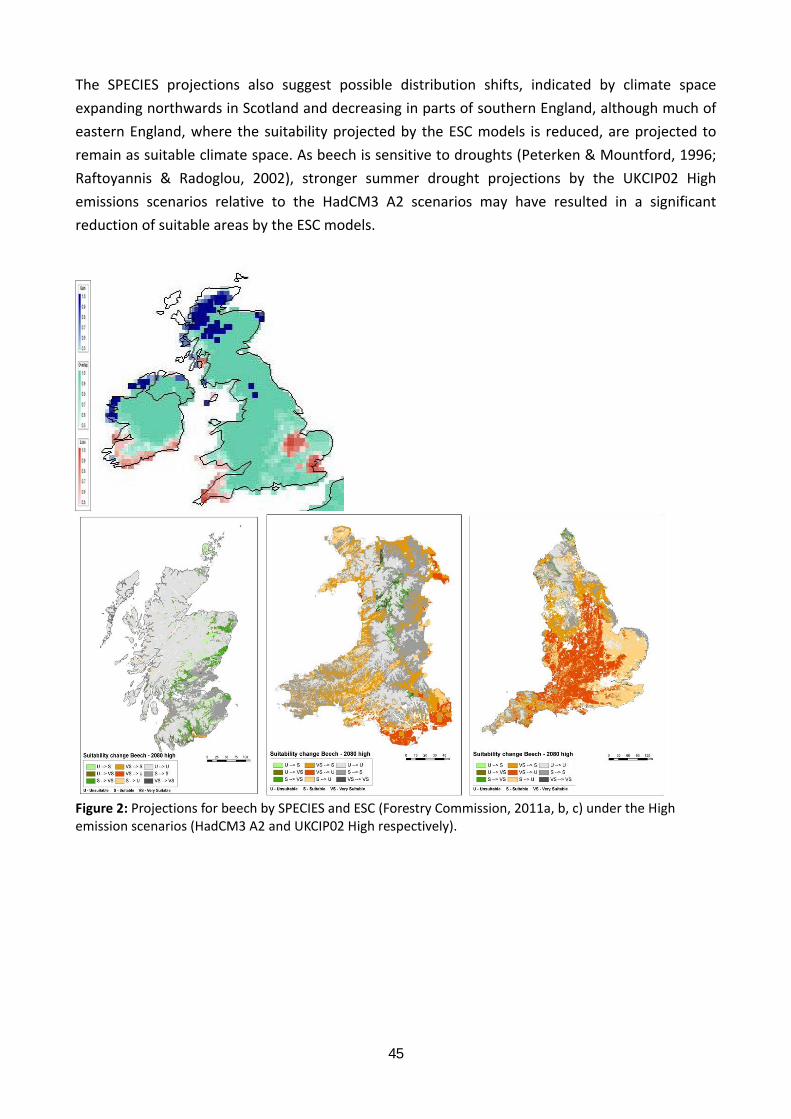
The SPECIES projections also suggest possible distribution shifts, indicated by climate space
expanding northwards in Scotland and decreasing in parts of southern England, although much of
eastern England, where the suitability projected by the ESC models is reduced, are projected to
remain as suitable climate space. As beech is sensitive to droughts (Peterken & Mountford, 1996;
Raftoyannis & Radoglou, 2002), stronger summer drought projections by the UKCIP02 High
emissions scenarios relative to the HadCM3 A2 scenarios may have resulted in a significant
reduction of suitable areas by the ESC models.
Figure 2: Projections for beech by SPECIES and ESC (Forestry Commission, 2011a, b, c) under the High emission scenarios (HadCM3 A2 and UKCIP02 High respectively).
45
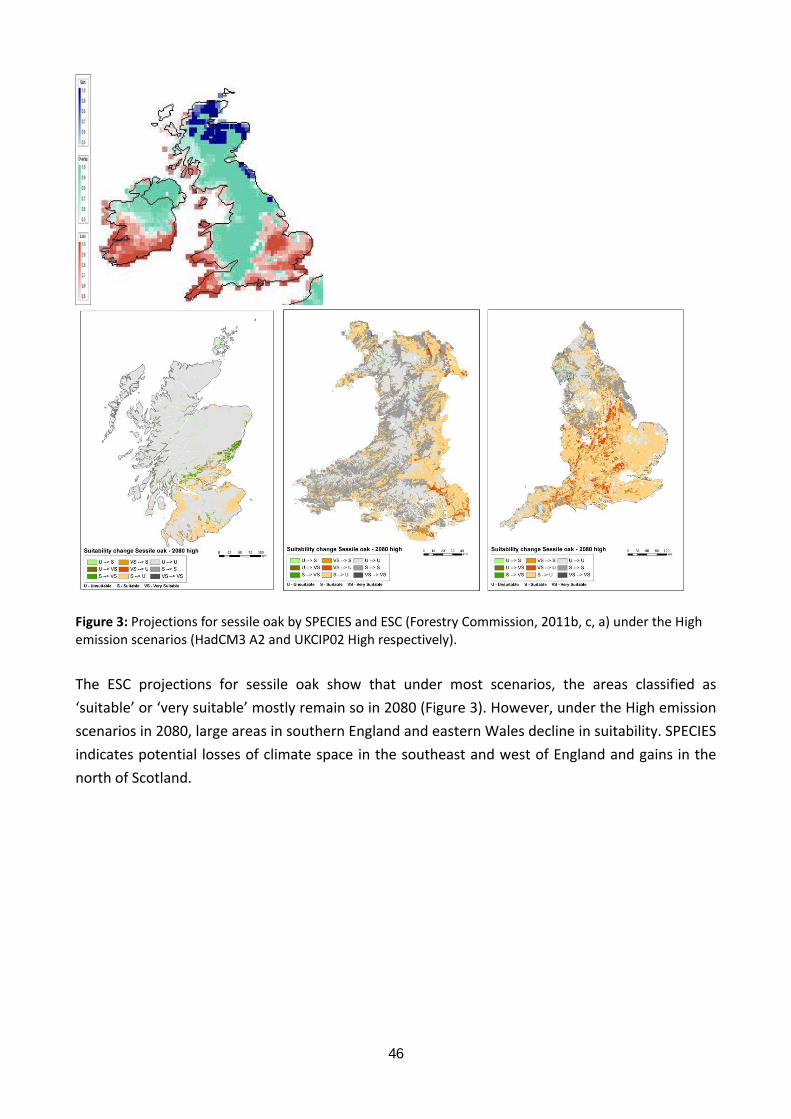
Figure 3: Projections for sessile oak by SPECIES and ESC (Forestry Commission, 2011b, c, a) under the High emission scenarios (HadCM3 A2 and UKCIP02 High respectively).
The ESC projections for sessile oak show that under most scenarios, the areas classified as
‘suitable’ or ‘very suitable’ mostly remain so in 2080 (Figure 3). However, under the High emission
scenarios in 2080, large areas in southern England and eastern Wales decline in suitability. SPECIES
indicates potential losses of climate space in the southeast and west of England and gains in the
north of Scotland.
46
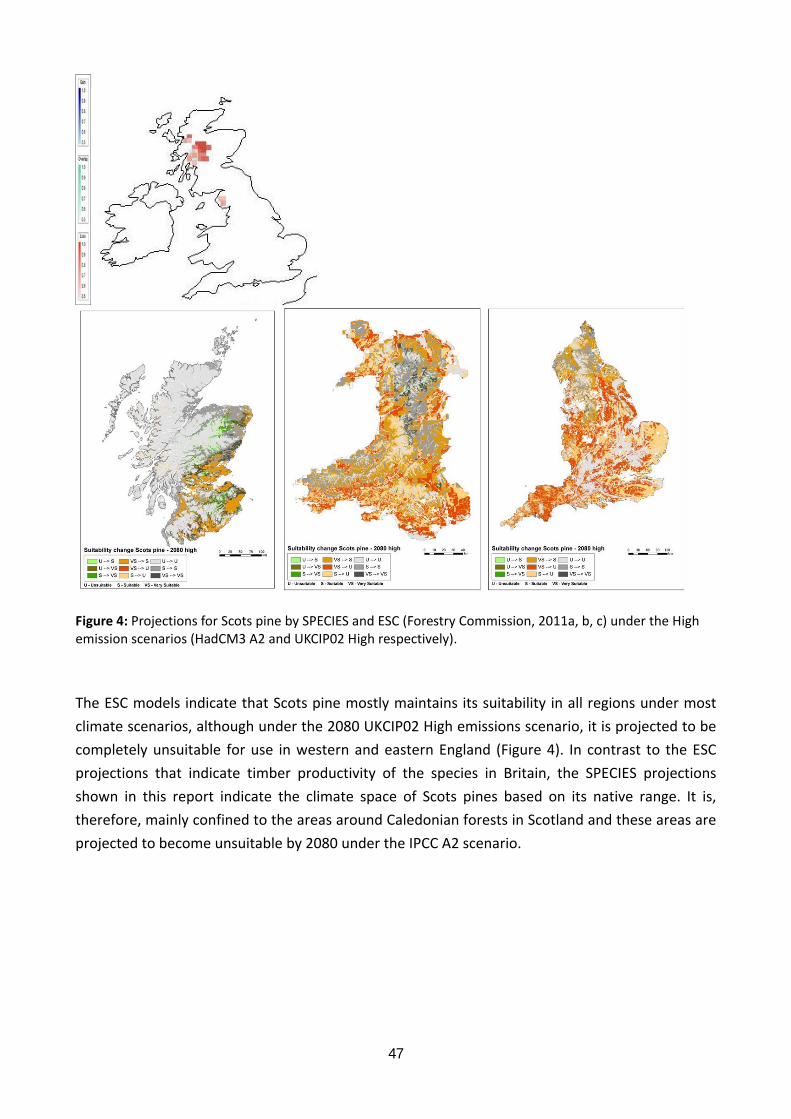
Figure 4: Projections for Scots pine by SPECIES and ESC (Forestry Commission, 2011a, b, c) under the High emission scenarios (HadCM3 A2 and UKCIP02 High respectively).
The ESC models indicate that Scots pine mostly maintains its suitability in all regions under most
climate scenarios, although under the 2080 UKCIP02 High emissions scenario, it is projected to be
completely unsuitable for use in western and eastern England (Figure 4). In contrast to the ESC
projections that indicate timber productivity of the species in Britain, the SPECIES projections
shown in this report indicate the climate space of Scots pines based on its native range. It is,
therefore, mainly confined to the areas around Caledonian forests in Scotland and these areas are
projected to become unsuitable by 2080 under the IPCC A2 scenario.
47
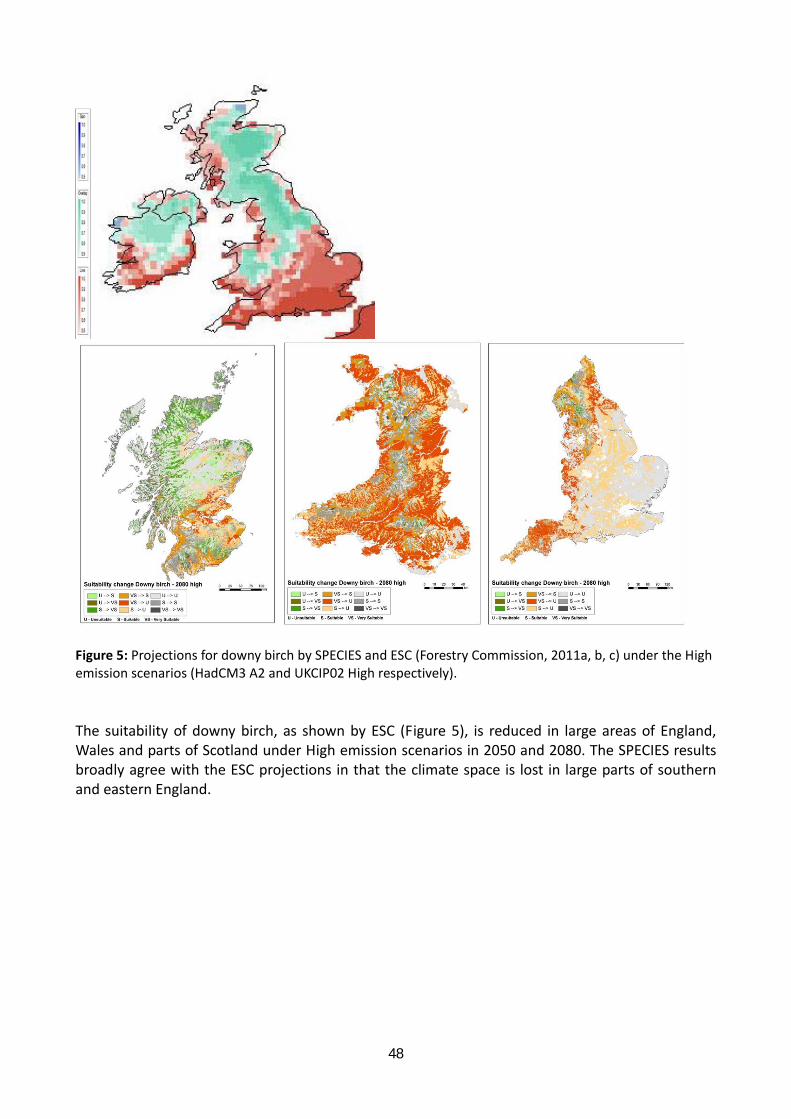
Figure 5: Projections for downy birch by SPECIES and ESC (Forestry Commission, 2011a, b, c) under the High emission scenarios (HadCM3 A2 and UKCIP02 High respectively). The suitability of downy birch, as shown by ESC (Figure 5), is reduced in large areas of England, Wales and parts of Scotland under High emission scenarios in 2050 and 2080. The SPECIES results broadly agree with the ESC projections in that the climate space is lost in large parts of southern and eastern England.
48

Figure 6: Projections for ash by SPECIES and ESC (Forestry Commission, 2011a, b, c) under the High emission scenarios (HadCM3 A2 and UKCIP02 High respectively). Under the 2080 High emissions scenario, the ESC models project that areas suitable for ash in
southern England mostly become unsuitable in 2080, while some areas in southern Scotland
become suitable (Figure 6). The SPECIES projections also show that the climate space in south‐
eastern England is projected become unsuitable and the climate space expands in northern
Scotland, although the climate space in eastern England, where the suitability of ESC models is
reduced, is projected to remain.
49

Figure 7: Projections for alder by SPECIES and ESC (Forestry Commission, 2011a, b, c) under the High emission scenarios (HadCM3 A2 and UKCIP02 High respectively). According to the ESC models, large areas classified as ‘suitable’ for alder under the baseline
climate is projected to become unsuitable by 2050 under the High emission scenario (Figure 7; Ray
et al., 2010). On the other hand, the SPECIES models indicate that the species could maintain its
climate space by 2080 even under the HadCM3 A2 scenario.
The ESC projections indicated similar patterns of changes in suitability across the six species, with
relatively stronger negative changes for Scots pine and downy birch and relatively modest changes
for ash. Under the High emissions scenario for 2080, suitability is significantly reduced across
much of England and Wales except for the north of England and central Wales, with modest
increases in the north or central Scotland.
The patterns of projected changes by SPECIES were also broadly similar, with the climate space
reducing in south and south‐east England and expanding in north and north‐east Scotland, with
the exception of Scots pine, for which an expansion is not projected. Thus, apart from Scots pine,
50

where the natural distribution range is significantly different from its potentially suitable areas for
timber production, the general patterns depicted from ESC and SPECIES models were similar.
However, ESC projected larger areas with reduced suitability under the High emissions scenarios in
2080 relative to SPECIES. This may be due to the differences in the climate scenarios, but perhaps
more to the differences in projected model outputs; i.e. species’ climate space vs. relative timber
productivity in the Britain. For example, reductions in timber productivity do not necessarily
indicate that the areas are climatically unsuitable for species’ survival. Thus, the differences in the
degrees of climate change impacts on tree species between ESC and SPECIES suggest that the
extrapolation of the model results require caution.
5.3. Potential impacts on woodland structure and function
5.3.1. Woodland structure
Understanding individual species' response to climate change is very useful but scaling those
responses up to community responses is an uphill task. The complexity of most natural
communities means that it is extraordinarily difficult to predict outcomes ‐ for example, biotic
interactions (competition, facilitation, herbivory, mutualisms) between species at different trophic
levels are all likely to be affected by physiological, phenological and migratory responses (Aerts et
al., 2006). However, evidence of community change is occurring at some well‐studied locations.
One study in the US has shown a shift in vegetation types since the 1950s due mainly to a higher
occurrence of severe droughts (Allen & Breshears, 1998); and evidence from Spain where many
European plant species are at the limits of their southern distribution is also burgeoning (Peñuelas
& Boada, 2003; Sanz‐Elorza et al., 2003; Peñuelas et al., 2007). At the other extreme there is also
evidence that alpine communities are changing too (Klanderud & Birks, 2003; Walther et al.,
2005).
In this area of study it is also worth noting the results of experimental work on community
response to climate change. Clearly, this field has practical limitations because of the difficulties of
replicating climatic effects on natural systems ‐ one approach has been to use small chambers but
these are rarely used on patches containing more than a few co‐existing species (de Valpine &
Harte, 2001; Dunne et al., 2003; Epstein et al., 2004; Grime et al., 2008). Another limitation is that
it is very difficult (and expensive) to study anything other than small forb or grass ecosystems:
examples are most common for alpine and tundra ecosystems (Harte et al., 1995; de Valpine &
Harte, 2001; Convey & Smith, 2006) but also calcareous grasslands (Buckland et al., 2001; Masters
et al., 2001; Morecroft et al., 2004).
There have, however, been a few studies on woodland ecosystems looking at the competitive
balance between species but these have been limited to the tree seedling cohort due to the
obvious difficulties in working with mature trees (Fotelli et al., 2005; Saxe & Kerstiens, 2005).
Similar work has also been undertaken in shrubland ecosystems but also looking at seedling
51
recruitment (Lloret et al., 2009). One pattern that is emerging from these studies is the relative
importance of species interactions (mainly competition and facilitation) under climatic change in
determining community assembly (Brooker, 2006; Sthultz et al., 2007) although other factors may
play a part too (herbivory, mutualisms) (Tylianakis et al., 2008). Current thinking emphasises the
growing importance of facilitation under higher abiotic stress conditions (e.g., the rear edge)
(Pugnaire & Luque, 2001; Castro et al., 2004; Lloret et al., 2005; Brooker et al., 2008).
The modelling results presented in section 4 suggest that for many of the woodland priority
habitats the different responses of their component species will result in changes to woodland
structure, if only due to changes in the dominance of some canopy species. The dominant tree
species that will be more tolerant of climate change are likely to increase their competitive edge
over those with lower tolerance to drought and heat. This could lead to increases in both oak
species, both lime species (where they are locally abundant), beech (in northern Britain, but
declining in southern England) and possibly some non‐native species such as sweet chestnut and
downy oak. However, perhaps not all these species changes will lead to massive structural changes
to communities; some species may be very suitable functional matches for the species they
replace (e.g., sweet chestnut and oak). However, palaeoecological data highlights the fact that
woodland composition and structure has changed considerably over long time‐scales (Willis &
Birks, 2006; Willis et al., 2007) and whilst current climate change is occurring at a far greater rate
than in prehistory, some change to woodland structure may not necessarily be a bad thing (Millar
et al., 2007).
Perhaps the greatest changes to structure will occur in the south‐east, where the most extreme
temperature and drought conditions are likely. In these conditions, woodlands on free‐draining
soils ‐ including Lowland Mixed Deciduous and Lowland Beech and Yew Woodland ‐ are most at
risk. If planned adaptation is not a considered and proactive strategy these woodlands may even
struggle to maintain a dominant canopy cover, particularly if conditions are too dry even for oak.
Over a series of warmer and drier years, woodlands may eventually start to die back and more
tolerant shrub species (hawthorn for example) and smaller tree species (whitebeam) may become
dominant (reduced) in the canopy.
5.3.2. Woodland Function
The deeper consequences of community change are beginning to be understood now and the
implications for changes in ecosystem function due to climate change are worrying (Hooper &
Vitousek, 1997; Lavorel & Garnier, 2002; Schroter et al., 2005; Hughes et al., 2008a). For example,
changes to climate affecting phenology in species may disrupt long‐standing synchronous
ecological relationships (Visser & Holleman, 2001; Sherry et al., 2007; Rich et al., 2008; Petchey et
al., 2010). This has particular importance for woodlands with such a diversity of taxa and huge
trophic webs present in most woodlands (Tylianakis et al., 2008).
52
Changes to forest ecosystems resulting from climatic change may have serious repercussions for a
range of ecosystem functions (Fischlin et al., 2007) including forest productivity (Boisvenue &
Running, 2006), carbon sequestration (Nabuurs et al., 2003; Phillips et al., 2009), soil protection
which can lead to flood control and resilience (Bradshaw et al., 2007), climate regulation (Bonan,
2008), timber production (Kirilenko & Sedjo, 2007), pest regulation (Volney & Fleming, 2000;
Chapin III et al., 2007) and leisure and recreation (Lacaze, 2000). The results presented here clearly
highlight that woodland function will change in the future; what remains difficult to assess is what
the change will be and how fast it will occur. Competitive interactions between dominant tree
species are often controlled by small differences in soil type, moisture and climate (e.g., ash and
sycamore ‐ Waters & Savill, 1992), so changes in climate over the next few decades are likely to
bring about gradual switches in dominance in canopy species. Whether these changes will have
deleterious impacts on ecosystem function is difficult to say. New research testing Grime’s (1998)
mass ratio hypothesis (which postulates that the effect of species on ecosystem function is
dependent on their proportional abundance in a community) suggests that removing a functional
group (e.g., canopy trees) from an ecosystem is more important than its relative dominance
(McLaren & Turkington, 2010). Although this research was based on a grassland community, if this
pattern proves to be reinforced in woodland communities, it suggests that replacing one dominant
tree species in a woodland with another will not have major consequences for ecosystem
function.
Perhaps the biggest concern should be the lack of dominant canopy tree species diversity in the
British Isles. If climate change opens up new niches for species, it is possible that our native flora
does not have a suitable species to fill a new niche. Compared to the continent, which has
considerably higher diversity of tree species, Britain is reliant on relatively few which may result in
exotic or introduced species becoming more competitive (e.g., downy oak, Larches, sweet
chestnut). However, although exotic species may not necessarily fulfil biodiversity conservation
aims, they could possibly maintain some important ecosystem functioning roles (e.g.,
productivity).
5.3.3. Other factors
The impact of a changing climate is not confined to mature trees, but is likely to influence
regeneration as well. Masting of beech and oak, for example, is quite likely to change in frequency
and production. This has already been seen in other countries in periods of climatic change (e.g.,
Sweden, Övergaard et al., 2007) but numerous other factors also affect masting, such as
atmospheric nitrogenous pollution, pollination success and seed predation. Resource masting
theory suggests that extreme events like drought will reduce masting (Kelly & Sork, 2002; Koenig &
Knops, 2005), but fruiting is not fully understood and predictions of the impact of future climate
are unknown (Schmidt, 2006).
Drought is also likely to affect seedling establishment in the absence of competition (Robson et al.,
2009). Higher CO2 levels will encourage tree sapling growth but the effects of increasing
53

temperature are likely to have a deleterious effect. Increased droughts may have a bigger effect
on saplings than on older cohorts, as competition for water is likely to be more intense [this is
contradicted elsewhere – older trees suffering more than young].
5.4. Biological adaptation to climate change
Autonomous adaptation responses are those which are under taken by natural systems, without
human intervention and include in situ genetic adaptation, phenological and physiological
adjustments and dispersal (polewards or upwards). A number of factors can hinder this adaptation
and contribute to vulnerability, including (Chown et al., 2010; Kramer et al., 2010; Nicotra et al.,
2010):
• Lack of opportunity for poleward migration
• Lack of opportunity for altitudinal migration
• Lack of opportunity for inland migration
• Limited dispersal capacity
• Barriers to dispersal e.g. oceans, urban areas
• Rarity/small population numbers
• Low genetic diversity
Other factors which may affect the success of adaptation include:
• Little or no overlap between present and potential future distributions
• Endemism
• Restricted range – current and/or projected future range
• Loss of critical associated species – those with monospecific relationships are most likely to
be affected
• Disruption of the synchrony in the timing of life cycle events (phenology) or of species’
interactions e.g. great tits and caterpillars.
• Increase competition from invading species (both natives and exotics) (from Berry, 2008)
In many instances it is likely that human intervention will be required to increase the adaptive
capacity of our woodlands. Human interventions, either reactively or proactively, constitute
planned adaptation strategies which are outlined below.
5.5. Adaptation strategies for biodiversity conservation
A number of planned adaptation options have been suggested for natural ecosystems and
protected areas that range in scope and feasibility (Hulme, 2005; Heller & Zavaleta, 2008; Seppälä
et al., 2009; Hagerman et al., 2010; Lindner et al., 2010; Spies et al., 2010). Here, we briefly outline
the basis for the main options possible for British woodlands.
54
5.5.1 Reduce and manage stresses from other sources and activities
One of the most common adaptation options discussed in the conservation literature is perhaps
the most obvious too. Simply, if other threats and stresses are reduced (such as air pollution, over‐
harvesting, habitat conversion and species’ invasions), species and habitats are likely to have
greater resilience to climate change (Halpin, 1997; Shafer, 1999; McCarty, 2001; Opdam &
Wascher, 2004; Hulme, 2005; de Dios et al., 2007). A good example of this is can be seen with
trees under water stress: many species are quite capable of tolerating drought, however, if they
are attacked by insect pests or pathogens also their resistance is reduced which may lead to
increased mortality within a population (Rouault et al., 2006). This option may be difficult in
densely populated areas in the UK, but some of these measures have been considered as part of
the Finnish National Adaptation Strategy (Marttila et al., 2005) and for management of the Cape
Flora, South Africa (Department of Environmental Affairs and Tourism, 2005) and under careful
and well‐backed community co‐operation could be a useful strategy in parts of Britain. In many
woodlands, particularly near urban populations, this may be the key strategy and successful
implementation could be the difference between maintaining ecosystem structure and function or
a breakdown of a key element. Some woodland nature reserves in the UK are already encouraging
neighbouring landowners to adopt agri‐environment schemes to reduce the effects of fertiliser
and herbicide drift on woodland ground flora.
5.5.2. Habitat restoration
Habitat restoration would increase the area of potential habitat for many species as well as buffer
existing reserves and hence increase resilience (Harris et al., 2006). This aim links with reducing
and managing stresses as well as increasing landscape connectivity. Restored habitats in the
landscape may allow migrating species a suitable habitat in a stepping‐stone or corridor matrix.
This is already a major aim of national conservation bodies (e.g., Natural England, the Wildlife
Trusts) but further development of regional (and national) partnerships should be encouraged.
The potential for this strategy in the UK is large because of a high number of privately owned
degraded woodlands, and there are also grants available to woodland owners to bring woodlands
back into biodiversity friendly management. However, there are certain caveats to this approach,
namely that restoring a habitat may indeed be taking a backward (and possibly an all too difficult)
ecological step in the light of climate change but even if this is possible it may also require data on
recent historical or even palaeoecological records to set targets which are often not available
(Harris et al., 2006; Willis & Bhagwat, 2009).
5.5.3. Increase landscape connectivity
As the British landscape is highly fragmented it is likely to be too much of a barrier for successful
species tracking of climate change (Jump & Penuelas, 2005). The implementation of corridors
and/or stepping stones to link areas of habitat or reserves is a popular objective (Machtans et al.,
1996; Maciver & Wheaton, 2005; Bailey, 2007; Öckinger & Smith, 2008). Examples include: Meso‐
American corridor and binational corridors in Latin America, in Europe, a multi‐lateral initiative to
establish a stronger (i.e. 'climatically robust') network of ecological areas has been set up ‐ the
55
Pan‐European Ecological Network PEEN. The Netherlands have a similar ecological network
(Ecological hoofdstructuur) that is being implemented and is intended to be a climate change
proof. In Britain, the Wildlife Trust is trying to implement a similar scheme by encouraging
landowners and reserve managers of similar habitat type to increase their linkages to
neighbouring reserves and in Scotland the Glasgow and Clyde Valley Integrated Habitat Networks
scheme is attempting a similar aim (Smith et al., 2008). Clearly, this would be a more useful
strategy for mobile species but even for many plant species, and in particular the wind‐dispersed
species, it will prove to be an important strategy (although a lot of woodland species are slow
colonisers ‐ van der Veken et al., 2007). Furthermore, by increasing colonising ability it is likely that
ecosystem functioning will be maintained or enhanced by ensuring a greater genetic diversity in
species populations (Bailey, 2007). However, natural or assisted migration is considered a natural
response to climate change for species although the risks of undesirable species migrating as well
as ‘native’ species should be considered (Kirby, 2009).
5.5.4. Increase landscape permeability
'Softening' the landscape through reduction in unfavourable management practices and increasing
area for biodiversity, e.g. through agri‐environment schemes (e.g., Living Landscape scheme run
by Wildlife Trusts) can be a very effective means for improving species dispersal (Noss, 2001;
Hannah et al., 2007). Although not quite as desirable as creating habitat corridors, in a multi‐use
landscape (and much of Britain is), it is more likely to be an adopted strategy. Questions remain
over its effectiveness however, and much work needs to be done to have a greater confidence in
it’s ability to improve species dispersal under a changing climate. However, although there is still
conflicting evidence (Kleijn et al., 2006), the benefits agri‐environment schemes bring to
biodiversity are encouraging (Gillings et al., 2005; Donald & Evans, 2006; Merckx et al., 2009; Maj
et al., 2010). For woodlands, this option may not be the most obvious choice, however, many agri‐
environment schemes offer short‐rotation coppice options for farmers which, although are not in
any way as diverse, can offer a more suitable habitat for mobile woodland species to disperse.
5.5.5. Increase size and/or number of reserves
Longstanding biogeographical relationships (MacArthur & Wilson, 1967) between species richness
and reserve size and number show that larger and more reserves offer greater biodiversity and
hence maintenance or improvement of ecosystem functioning (Hooper et al., 2005; Reiss et al.,
2009). This would also have implications for reserve connectivity (Pyke & Fischer, 2005; Williams
et al., 2005; Wilby & Perry, 2006; Hannah et al., 2007), which may help species dispersal and
migration. Additionally, like the first two strategies above, it will also help increase ecosystem
resilience towards climate change (Reusch et al., 2005; Chapin III et al., 2007; Baron et al., 2009).
This strategy is perhaps more likely to be a successful strategy in the UK due to the ever‐increasing
resurgence in woodland planting (e.g., the Caledonian pine project in Glen Affric); however, it is
also an opportunity to re‐address conventional wisdom on plant species provenance as increasing
genetic diversity in new woodlands is likely to improve climate change resilience (see 5.5.9 below).
56
Another example of this strategy working in the UK is the ever‐expanding National Forest in the
East Midlands (The National Forest, 2009).
5.5.6. Increase habitat heterogeneity
Increasing habitat heterogeneity within reserves increases the available niche space for a wider
range of species to migrate, grow and reproduce under changing climatic conditions (Lindenmayer
et al., 2008; Ackerly et al., 2010). Furthermore, it may also have an effect on reducing threats like
pathogen transmission (Condeso & Meentemeyer, 2007). Landscape heterogeneity should
improve migration due to shorter dispersal distances and community reassembly as heterogenous
landscapes usually have greater genetic diversity (which increases adaptive variation) and species
diversity (a richer range of taxa to better enable assembly into new communities) (Ackerly et al.,
2010). For the future of British woodlands this option is perhaps not as difficult as it first sounds;
foresters and conservation managers have been adjusting and creating new habitat structures for
centuries (for example, coppice coupe rotations, shelterwood systems, ride and glade creation)
and as a conservation strategy it is already commonly practised amongst many woods in the UK
anyway. It should also help maintain and improve ecosystem functioning by creating habitat, and
hence, species diversity (Reiss et al., 2009).
5.5.7. Focus on conservation efforts on north‐facing slopes
Very few studies have examined the effects of topography and aspect on community structure but
those that have confirm anecdotal evidence that aspect can have considerable effects on species
composition (Rorison et al., 1986; Bennie et al., 2006; Marini et al., 2007; Gonzalez et al., 2009;
Raatikainen et al., 2009). Bennie et al (2006) reported differences of 2.5 to 3.0oC in annual mean
temperature in adjacent chalk grassland slopes ‐ it would certainly seem then that focussing
conservation efforts for high priority species and habitats on north‐facing slopes would be a
worthwhile strategy as similar differences can be seen in woodlands. Modelling the utility of
topography has rarely been done either (but see Ackerly et al., 2010), but this would help identify
suitable target areas for conservation focus. Examples of this strategy are so far hard to find.
5.5.8. Translocations and re‐introduction of species
Translocations have been practised on a range of species groups and are considered to be one of
the main adaptation strategies (Conant, 1988; Hodder & Bullock, 1997; McLean, 2003; Edgar et al.,
2005; Hoegh‐Guldberg et al., 2008; Willis et al., 2009; Minteer & Collins, 2010). It may be
especially beneficial for those species providing key services such as pollination (Hodder & Bullock,
1997) or for replacing a key structural (i.e., tree or shrub) species. However, there are a number of
concerns about this approach and many think it is too simplified and does not take into account
unintentional consequences such as evolutionary changes, new biotic interactions or invasive
species risk (Huang, 2008; Ricciardi & Simberloff, 2009). It also raises some critical ethical issues
that are not easily dealt with by ecologists alone as perhaps, more than any other intervention,
highlights the role of man’s intervention in natural processes (Minteer & Collins, 2010). A number
of questions arise when considering the process (Minteer & Collins, 2010): how do you select the 57

species to translocate? What are the legal, ethical and policy implications of translocation? Who
decides to translocate a species? Should translocation just be used for climate change reasons or
others like ecosystem function? Who is responsible for the success of the project? Currently,
species translocation is more popular in the United States (Hannah, 2010) although examples in
the UK are rare it does have a policy prescription in place (McLean, 2003).
For many British woodlands perhaps one species to answer the first question would be large‐leaf
lime; the modelling results suggest it is more tolerant of climate change than oak and ash, and it
has a reasonable tolerance to drought; it would also fulfil a dominant canopy role in many of
Lowland Mixed Deciduous Woodland Priority Habitat and would be well adapted to the edaphic
conditions in much of Britain. Furthermore, as a native to England and a one‐time dominant
species throughout lowland Britain (Pigott, 1991), it may not be opposed as much by conservation
authorities (compared to say, Manna ash, sweet chestnut or downy oak).
5.5.9. Introduction of wider range of genotypes
For years conservation has worked on the assumption that for re‐establishing habitats sourcing
species from local provenance was crucial due to numerous generation’s worth of adaptation to
the local environment (Hubert & Cottrell, 2007). Clearly, as climate change forces local conditions
to change a new approach to the conservation of genetic resources will be required. Foresters
have been introducing different genetic stock of species for centuries; this approach may prove to
be beneficial for conservation if species have southern European populations that will already be
adapted to future British climates; e.g., beech seed from the drier zones in Northern Spain, Italy or
southern France (Broadmeadow & Ray, 2005; O'Brien et al., 2007). Species with wide European
distributions are likely to do better if genotypes from lower latitude sources are used in Britain;
those species with small or narrow distributions may not fare so well (Hubert & Cottrell, 2007). As
yet, no known example exists of this occurring in British conservation.
A number of studies have confirmed that European beech genotyes respond differently to drought
stresses (Peuke et al., 2002; Rennenberg & Schraml, 2002; Czajkowski & Bolte, 2006; Nahm et al.,
2007; Kramer et al., 2008; Meier & Leuschner, 2008; Rose et al., 2009). Sourcing provenances of
beech seed from other European countries would likely bring genotypes that would be better
adapted to future climate change in Britain. More importantly perhaps is that it would help
maintain ecosystem function within woodlands if this strategy could be applied to a range of key
species (not just trees and shrubs) within woodlands.
5.5.10. Maintaining native community ecosystem structure and function
Maintaining structure in its simplest sense (i.e., a typical woodland with canopy, shrub and herb
layers), if deemed a priority (for example, to maintain ecosystem services like recreation and
shade provision or productivity), would not be a difficult challenge as there are numerous suitable
species from warmer climates that could be used (see 5.4.11). However, maintaining structure and
biodiversity value would be an altogether more complex task; many of the above options would 58
certainly enhance ecosystem resistance and resilience in the face of climate change but ultimately
some species may start to suffer and possibly create gaps or changes to the previous structure.
The links between ecosystem structure and function are complex (Thompson et al., 2009;
Nadrowski et al., 2010) and indeed ecosystem function science is still a young discipline which is
still revealing contradictory relationships (Balvanera et al., 2006; Reiss et al., 2009). We still do not
know, for example, how many species in British woodlands are important components of
ecosystem function and how many have ‘functional redundancy’ (Petchey & Gaston, 2002; Luck et
al., 2009; Nadrowski et al., 2010). Inherent to this will be individual species tolerance of future
climate change and for some authors many woodland tree species have the potential to do will
simply due to their long‐lived nature; however, other studies also suggest that increasing mortality
in forest tree species may increase the evolutionary adaptation response to climate change by
allowing faster population turnover (older, maladapted trees dying make way for new, better
adapted seedlings)(Kuparinen et al., 2010).
5.5.11. Introduce new species to maintain habitat structure
Semi‐natural habitats provide a range of ecosystem services that are important for society; these
services may conflict with biodiversity conservation, but often they are mutually beneficial
(Paterson et al., 2008). The establishment of 'neo‐native' habitats (Millar et al., 2007; Bolte et al.,
2009) is very controversial but may be an only option if maintaining certain ecosystem services is
desired. For many non‐native species that have ranges in central Europe, the question of whether
they become neo‐native may be academic as without assisted migration, many of them won't be
able to make it to the UK. However, perhaps it is worthy of further discussion if there are suitable
species that may be able to maintain habitat structure (and possible hence ecosystem function).
There are a few continental European tree species, for example, that have similar ecological niches
to some potentially threatened tree species in England (e.g., Downy oak for common oak; narrow‐
leaf ash for common ash).
One problem (and a major ecological one) with introducing exotic species is that new species (or
neophytes) may not provide suitable environmental conditions for a whole host of other species
(e.g., invertebrates and fungi) and hence a breakdown in the food web may ensue. Replacement
species should ideally have similar traits to the original species (e.g., same shade provision, habit,
leaf decomposition rates) (Kirby, 2009). Would southern European oak species provide the same
niche opportunities for fungi that common oak does? What species would offer suitable (if any)
replacement niches for beech? Further research is required in this area. There is also an issue of
plant hygiene to ensure that micro‐organisms are not imported.
5.5.12. Improve inter agency and regional co‐operation
Perhaps one of the most crucial strategies as it has implications for translocation schemes, genetic
stock harvesting, corridor and landscape permeability schemes, etc (Tompkins & Adger, 2004).
Nationally, inter‐agency cooperation is aided and abetted by Natural England and as different
conservation bodies are usually working for a common good, relationships are normally healthy. 59

Attempts to include private landowners in conservation adaptation plans are mainly through
incentive schemes for landowners such as the ELS agri‐environment scheme; however, these
schemes, so far, pay little explicit attention to climate change adaptation and do not offer
opportunities for farmer members to plan across regional landscapes. This is not an impossible
goal however, as Natural England manage ELS schemes in England they are in a position to adopt
and encourage better regional connectivity and are increasingly involved in policy design for
nature adaptation.
Pan‐European cooperation is traditionally well founded in academic networks concerning
biodiversity, climate change and conservation; however, in the practicing conservation arena
there are comparatively few cooperative bodies. Some exceptions are ENCA (a network of the
heads of European Nature Conservation Agencies) which seek to promote “management of our
European landscapes to allow nature (as well as humans) to adapt to climate change… embedding
ecological concepts of resilience and a healthy natural environment into the adaptation debate…
aim[ing] for functioning ecosystems that are resilient to extreme events…” (Natural England are
leading members); the ECNC (European Centre for Nature Conservation) which is a multi‐partner
non‐profit organization seeking to promote ”conservation and sustainable use of Europe’s nature
and biodiversity”; and, (in eastern Europe) CEEweb (Central and Eastern Europe) which has a
strong climate change and conservation programme.
At European governance level the EU is promoting cooperation through various activities including
the NATURA 2000 policy directive which heavily invests in climate change adaptation research.
Also, the Pan‐European Biological and Landscape Diversity Strategy which also seeks to address
climate change but also aims to involve European NGOs. Finally, The EU’s recent white paper on
Adapting to climate change: Towards a European framework for action explicitly sets out a
number of adaptation aims across sectors (including conservation) but importantly calls for:
“employing a combination of policy instruments (market‐based instruments, guidelines, public‐
private partnerships) to ensure effective delivery of adaptation; stepping up international
cooperation on adaptation… the EU, national, regional and local authorities must cooperate
closely.”
5.5.13. Ex situ conservation
The use of ex situ seed banks, captive breeding or zoos is seen as a last resort by most however it
may be the only realistic response for some rare species (Maunder et al., 2001). The UK has a
strong history in ex situ conservation and many of the oldest and largest botanical gardens,
herbaria and arboreta (e.g., Kew Gardens, Bedgebury National Pinetum and Westonbirt National
Arboretum) have active conservation programmes. Ex situ conservation is however expensive and
can create population health problems caused by a lack of genetic mixing (Hamilton, 1994;
Maunder et al., 2001).
60

5.5.14. Maintain and increase monitoring
This strategy is vitally important as it provides the only really method of understanding what
change is occurring in the site and in what direction that change may be heading. Baseline data is
necessary to understand change (and the direction of change) and also makes adaptive
management easier (see below) (Suffling & Scott, 2002; Wilby & Perry, 2006). Monitoring species’
response to climate change is doubly important now and ideally should include measurements for
growth (above‐ and below‐ground), health (crown condition, pathogens), species’ relative
abundance, mortality, regeneration, soil water conditions and phenology. Unfortunately,
monitoring is an expensive operation and very few programmes exist to track changes to species
and habitats (Lepetz et al., 2009); however, although funding for monitoring is dwindling in some
organisations (Read, pers. com.), the UK does have an extensive Environmental Change Network
with twelve monitored sites (including woodlands) throughout the UK (ECN, 2011).
5.5.15. Adopt adaptive management approach
Heavily dependent on monitoring, this approach is essentially an iterative process that adapts to
and responds to ecological and environmental situations as they occur. It is seen as a crucial
response in a range of sectors including conservation and forest management (Lasch et al., 2002;
Scott et al., 2002; Tompkins & Adger, 2004; Hulme, 2005; Maciver & Wheaton, 2005) although it
requires an ability to analyse data and have the facilities to respond to changes so it is not a viable
option for organisations with minimal resources (Spies et al., 2010). It also relies on an underlying
faith in the further commitment to conservation in the face of climate change and as such can be
sensitive to the vagaries of future environmental policy and funding (Hagerman et al., 2009).
Ironically, many adaptive management practices can be learned from the forestry industry
(Heinimann, 2010) which in recent decades has sought to manage forest in a more holistic and
integrative manner. This process requires a good understanding of the ecological processes (e.g.,
regeneration, growth, competition, mortality), ecosystem processes (biogeochemical cycles,
succession, disturbance, etc.) over various time‐scales (it is also important to appreciate
ecosystems are dynamic and not static). Heinimann (2010) suggests that managers should realise
that most ecosystems will require the adoption of ‘moving targets’ as many ecosystem attributes
(functions and services) will change over time and space. He also highlights the concept of ‘rule
discovery’ which in essence allows new rules (or hypotheses for ecological approaches) to replace
old or disconfirmed ones.
5.6. Non‐intervention
5.6.1. Laissez‐faire approach
This approach stresses the importance of allowing ecological community processes to take their
course (i.e., change), rather than allowing human intervention to preserve structural “habitat
ideals” or particular species (Scott et al., 2002; Suffling & Scott, 2002; Hossell et al., 2003). This
may result in a new suite of species and thus altered community composition (Kirby, 2009).
Although outcomes may be hard to predict, the approach may well be beneficial for ecosystem
function if alternative management options are infeasible in terms of complexity, time, resource 61

or space availability. It also provides opportunities for those species which are adapting
autonomously to climate change, although their arrival could be facilitated by changing
management regimes.
The conservation priority of a given species in decline will depend on a number of factors,
including:
1) the perceived importance of the species,
2) the species’ remaining geographical extent,
3) the time‐scale and severity of the decline, and
4) the significance of knock on effects on other species/habitats.
In practice, the first and second of these factors will be reflected in whether the species is
recognised as of local, regional, national (e.g. BAP species) or international significance (listed in
EU Birds or Habitats Directive). This list could be seen as indicating an increasing level of priority in
order to meet conservation commitments and would make the laissez‐faire approach less likely to
be appropriate. Combining these priorities for the species with information on a species’ projected
future distributions will further assist priority ranking, with rare species with little available future
space warranting greater attention. In the context of climate change, a pervasive threat to most
species, this can be assessed in terms of the degree of loss of suitable climate space. The final
factor for consideration in determining the species’ priority is its role in relation to the wider
ecosystem. This is often difficult to assess, but a single species may be critical to other dependant
species or to particular ecosystem functions or services. For habitats, the equivalent question
would be: Is the habitat critical to maintaining species of high conservation concern? For example,
many tree species, such as beech and pedunculate oak, have saproxylic species associated with
them, which would be adversely affected by their loss. Once the level of priority has been decided,
then the feasibility of undertaking adaptation needs to be evaluated.
There are number of potential climate change adaptation options (Hopkins et al., 2007; Smithers
et al., 2008). In order to determine whether these management options are prioritised over the
laissez faire approach the feasibility of each management option needs to be assessed. The
flowchart in Figure 8 has been devised in order to facilitate this consideration. The level of priority,
as detailed above, should be used first to decide whether a particular decline is a management
priority (1). If it is (2), then the multiple management options available should be considered in
turn, with priority given in order to those with the potential to reverse, prevent and slow the
decline. These management options could include reducing pressures, such as grey squirrel
damage, or climate change through managing water levels in beech woodlands. If decline is not a
priority (3), then local measures might be taken to counter adverse impacts and monitoring
undertaken to see if the species’ priority warrants upgrading.
Where a suitable management option is available (4), then its feasibility needs evaluating as there
may be barriers to implementation, which make it unlikely to be undertaken (Berry et al., 2011). 62

Figure 8: Flowchart for assessing the feasibility of adaptation to climate change.
Available geographical space is a key barrier. For example, in a climate change context, if there is
little or no projected suitable climate space, then undertaking extensive measures might not be
appropriate. For example, in a climate change context, pressures related to land use and
management may reduce the likely success of climate change adaptation measures, thus reducing
the appropriateness of a management intervention beyond laissez faire. This could be especially
63

relevant for certain Arctic Alpine species in Scotland if they are maintaining their range elsewhere
e.g. in Scandinavia, even though the species, such as twinflower, may be of national importance.
Similarly if a species losing future suitable climate space is also experiencing decline due to other
pressures, and these pressures cannot be feasibly addressed and/or are projected to increase in
the future then letting go might be more pragmatic. In some cases, habitat recreation could be an
option, but when determining feasibility, time constraints need to be considered. Broadleaved
woodland, for example may take 100+ years to get the necessary structure and function. Another
measure, more applicable for species, is translocation, but this may have to be repeated to
maintain new populations and will have financial and resource implications. It could be possible for
lichens be transported northwards on suitable branches and then wait to see if they adapt to
growing on a new tree species.
If there are no options (5), then this could be considered grounds for adopting the laissez faire
approach and alternative species could be sought that would have similar functions within the
ecosystem. This could include species from within the community that may be better adapted to
the climate or new arrivals, as discussed in Section 4.
If action is feasible (4), then the level of feasibility of the action needs assessing (6). By balancing
the conservation priority of a species with the feasibility of the management option a decision can
then be made as to whether the species warrants the selected management option. If it is
consider unreasonable (7) or if it not feasible for any reason (6), then alternative management
options of lower effectiveness (2) could be considered. If the action is deemed appropriate (8),
then its impacts on other species, the community and habitat could be taken into consideration to
ensure that unwanted consequences and trade‐offs are not involved. An example of such a trade‐
off occurs in pine woodland, where if climate‐related mortality in young Scot’s pine could be
reduced to assist its survival in Scotland (Persson & Ståhl., 1990), this would have knock on effect
of reducing sessile oak’s potential to increase in abundance. If such knock‐on effects are seen as
undesirable then an alternative management option needs to be considered that either mitigates
these effects or takes a different approach (2). If the impacts are considered acceptable, then
adaptation management can be undertaken (10).
Thus the decision whether to “let go” of a species, by taking the laissez faire approach, should be
driven by the conservation priority given to that species and the feasibility of undertaking the
most appropriate management strategies. These decisions will necessitate subjective judgement
and may depend on context of the ecological community and other demands on management
resources. Decisions to let a species go should not be taken lightly, and would need to involve
consultation of appropriate interested parties from both governmental and non‐governmental
organisations and academic spheres.
64
5.7. Data gaps
One 178 woodland species were modelled in this study but there are distribution data available
for many more species associated with other woodland communities. Increasing the number of
species modelled would therefore improve the power of the analysis. However, there is still a lack
of distribution data for the vast majority of European species. Similarly, pursuing functional trait
approaches to understanding ecosystem response to climate change requires good quality data on
plant (and animal) traits not only for individual species but also to cope with intra‐species variation
(particularly for studying community assembly patterns or evolutionary processes) (Albert et al.,
2010).
5.8. Further Study
5.8.1. Developing better modelling techniques
Modelling responses of species interactions to climate change
Another important area of research in improving projections of the possible consequences of
climate change is the effect of species interactions. It is increasingly acknowledged that climate
change affects species interactions and that these interactions affect species ranges and
abundance, as well as ecosystem functions (Tylianakis et al., 2008; van der Putten et al., 2010;
Walther, 2010). Models incorporating biotic interactions have been built, which indicate that the
inclusion of the interactions improve the predictive performance (Heikkinen et al., 2007; Meier et
al., 2011). These models incorporate parameters indicating the effects of species' co‐occurrence as
biotic predictors, such as occurrence (Heikkinen et al., 2007) and basal area (Meier et al., 2011), in
order to project the future changes reflecting the competitive and facilitative interactions.
However, most of these models have been applied to a limited number of species within the same
trophic level (but see Araújo & Luoto, 2007; Kissling et al., 2010), whereas species actually interact
in complex food webs encompassing different trophic levels. Thus, it remains a major challenge to
include knowledge on multitrophic level interactions (Tylianakis et al., 2008)
One of the useful approaches in exploring the consequences of climate change on population and
community dynamics across trophic levels is ecological networks. Ecological networks as used here
are not explicitly spatial networks, but describe the species present in a network, their abundance,
and the frequency of interactions between them, as well as the functions that these species
perform (Morris, 2010). Ecological network research focuses on a guild of interacting species, e.g.
food webs, mutualistic networks (e.g. plant‐pollinator networks) and host‐parasitoid networks
(Ings et al., 2009). For example, Memmott et al. (2007; 2010) have shown that temperature‐
induced advanced flowering of plants reduces floral resource availability for many of their
pollinators, and this mismatch is likely to result in curtailment of the field season for the pollinators
and in some cases extinction of plant or pollinator species, and their interactions. On the other
hand, Devoto et al. (2009) have found that plants and their pollinators respond similarly. Although
the application of a network approach in the context of climate change is increasing (Montoya &
Raffaelli, 2010), studies for terrestrial species are still limited. More studies are available for
65

marine organisms, for example, on the effects of temperature warming on host‐parasite system
(Mouritsen et al., 2005; Studer et al., 2010) and on the effects of induced range shifts of invasive
species on trophic interactions (Occhipinti‐Ambrogi, 2007).
Limitations of ecological networks in projecting biodiversity changes include their tendency to be
biased towards species at the higher trophic levels rather than at the base of the web and that
well‐defined networks are often from species‐poor habitats (Ings et al., 2009). In addition,
ecological network research often focuses on a subset of interactions and does not include
different types of networks, e.g. food webs and host‐parasitoid networks (Ings et al., 2009), and
thus fails to describe complete networks in the ecosystem. Furthermore, ecological networks do
not take account of behavioural flexibility, for example, pollinators’ behavioural changes leading to
foraging on and pollination of new plant species (Burkle & Alarcon, 2011).
The network approach can be incorporated with bioclimatic envelope models using a conceptual
framework. For example, in MONARCH 2, a hybrid approach was taken, whereby outputs from
SPECIES were used to identify species which might be arriving in or leaving a habitat and then a
conceptual framework was developed for each situation, based on species interaction matrices,
particularly trophic interactions, and included the development of work on food web and niche
space as mechanisms in community ecology (Figure 9). The outcome for the community depended
on the position of the arriver/leaver within that community and this is illustrated for the case hairy
wood ant, which was projected to arrive in the pine woodlands around Rannoch (Figure 10).
So‐called ‘hybrid’ models (Thuiller et al., 2008; Fontes et al., 2010) are emerging, which are an
alternative approach for including biotic interactions into the projection of future range changes.
The hybrid models are developed from process‐based models incorporating physiological
responses and consist of various sub‐models working at different spatial scales. These models can
project dynamic range changes taking account of the effects of dispersal and competition (Lischke
et al., 2006; Hughes et al., 2008b). Complex interactions can also be expressed, including a novel
interaction by a species encountering another at the leading edge of its range due to climate‐
induced range shift (Thuiller et al., 2008). Further development is promising, although these
models are data hungry and require detailed knowledge of ecological processes that is usually
unavailable for large numbers of species and regions (Thuiller et al., 2008).
Including species interactions is essential in improving projections of climate change impacts
(Lavergne et al., 2010). Conceptual models integrating ecological networks into bioclimatic
envelope models and the hybrid models can provide more realistic projections of climate change
impacts than simple envelope models. However, both approaches are limited by data availability;
defining a complete ecological network requires extensive search efforts and constructing a hybrid
model requires detailed information on the physiology of organisms. Thus, more and better
empirical data are necessary to parameterise and test these models (Petchey et al., 2010), which
66

Figure 9: The Arriver conceptual model. This conceptual framework explores the consequences of a species arriving (migration/dispersal) in a community due to climate change. The model recognises that communities are dynamic entities changing over time (e.g. succession) and that climate change is going to be a major disturbance on community structure, function and dynamics (from Masters and Ward, in Berry et al., 2005).
Figure 10: A possible outcome on the composition of the species community of the colonisation by hairy wood ant, based on Fowler and Macgarvin’s (1985) suggestion that this species is a keystone species.
67
would require further laboratory and field‐based research and long‐term monitoring (Traill et al., 2010). 5.8.2. Understanding community response: species or traits?
A number of strands in ecology have been trying to provide better generalisations and models of
community dynamics by moving away from a traditional and individualistic taxonomic or species‐
based approach to one based on the response (or effect) of functional traits or groupings of traits
(McGill et al., 2006; Westoby & Wright, 2006). This approach is not new in ecology and although
its development gained ground in the 1970s and 1980s (Knight & Loucks, 1969; Grime, 1977;
Gaudet & Keddy, 1988), it wasn't until relatively recently that ecologists started to adopt it as a
method to address a number of important issues in ecology and conservation (Lavorel et al.,
2007). The trait approach in comparative ecology is not confined to plants alone and research into
different taxa is ongoing (e.g., Bonada et al., 2007; Cleary et al., 2007; Heino et al., 2007; Jiguet et
al., 2007).
Taxonomic approaches are often not able to produce generalised community responses to
change, for example, congeneric species may have greater differences in response to
environmental gradients than species totally unrelated but with similar ecological niches (Weiher
et al., 1999). Community descriptions that are based on taxonomy can fail to recognise if two
spatially separated communities with different species composition are structurally similar
(Duckworth et al., 2000). Furthermore, species‐based community analyses can sometimes suffer
from redundancy (Walker et al., 1999) and noise within the data (Gauch, 1982; McCune, 1997)
which can reduce the power of the analysis (Kent & Coker, 1992). Ultimately, therefore, as long as
trait variation is greater between species than within species, traits should provide an easier route
to defining ecological generalities and hence definable rules in ecology (Pakeman, 2004; McGill et
al., 2006; Shipley, 2007). When species are grouped into functional types or guilds based on their
shared or similar response to environmental factors these groupings are generally more useful for
analysing responses to, for example, disturbance (McGill et al., 2006; Westoby & Wright, 2006) or
to ecosystem functions like productivity (Bailey et al., 2004). Hence, rules developed in one
community may be applicable in another community in a different region or continent.
Trait‐based approaches provide a more direct link between the environment and the community ‐
as species presence is determined by so called 'environmental filters' for traits (Keddy, 1992; Díaz
et al., 1998; Lavorel & Garnier, 2002; Mouillot et al., 2007). This filtering acts hierarchically with
traits that survive the overarching climatic filter then passing through further disturbance and/or
interaction (with other organisms) filters (Díaz et al., 1999) and can provide a predictive link
between vegetation and environmental conditions (Dyer et al., 2001). Traits are also ubiquitous
whereas species vary immensely across geographic space (and time), this is particularly important
in communities that lack detailed taxonomic description or the flora is understudied (Pakeman,
2004).
68
The utility of traits in prediction ecology has made them a popular base for studying community
dynamics in response to a range of disturbances and environmental change (Lavorel et al., 2007).
Trait composition in communities has been analysed across gradients of fertility (Reader, 1998;
Pakeman, 2004; Clarke et al., 2005) and disturbance (Ackerly, 2004b; de Bello et al., 2005; Mabry
& Fraterrigo, 2009), or both (Craine et al., 2001; Fynn et al., 2005; Gross et al., 2007; Lehsten &
Kleyer, 2007). They have also proved useful for understanding invasive species ecology (Lloret et
al., 2004; Lambdon & Hulme, 2006; Moles et al., 2008) and community responses to fire (Falster &
Westoby, 2005; Moretti & Legg, 2006; Keith et al., 2007).
An important aspect of trait‐based research is to understand trade‐offs in plant design and
functioning that appear consistent across biogeographic regions (Westoby & Wright, 2006). Some
of the most recognised patterns are: specific leaf area and leaf life span (leaves with higher leaf
mass per leaf area tend to have a longer life span but require greater strength to maintain them,
however short‐lived leaves are easier to produce) (Reich et al., 1997; Craine et al., 2001; Wright et
al., 2004); seed mass and fecundity (smaller seeds are produced in greater numbers but their
chances of survival under different conditions are far lower than large seeds) (Turnbull et al.,
1999); and, potential plant height and growth rate or shade tolerance (taller trees are often slower
growers and shade tolerant when juvenile, smaller trees grow faster but will eventually be
overtaken by slower growing trees) (Poorter et al., 2003).
Gradients across varying climatic scales have provided ecologists with useful insights into plant
responses to factors like temperature and precipitation (Fonseca et al., 2000; Choler, 2005; de
Bello et al., 2005; Davidar et al., 2008; Oyarzabal et al., 2008). The growing interest in ecosystem
function is also providing another avenue of research for trait‐based projects. It is increasingly
recognised that some traits not only respond to environmental factors, but can have an effect on
ecosystem processes too; as they are measurable they can provide a quantifiable link to
ecosystem function (Eviner & Chapin III, 2003; Garnier et al., 2004; Quetier et al., 2007; Suding &
Goldstein, 2008).
One of the main aims in trait‐based ecology is to identify which functional traits are important for
predicting population, community and ecosystem processes (Lavorel & Garnier, 2002; McGill et al.,
2006). However, as important as this aim is, it must also be couched in practicality for ecologists if
they are to fulfil the aim of reducing complexity too (McGill et al., 2006; Lavorel et al., 2007).
Hence, the need to provide relatively easy trait measurement, which is also inexpensive and can
be standardised for ecologists anywhere, is paramount (Lepš et al., 2006). These trait data are
obtained from either field sampling, plants grown in a 'garden' environment with little
environmental heterogeneity, or from laboratory screening (with even better control of the
environment and also plant ontogeny) (Cornelissen et al., 2003). Plants for measuring should be
healthy, well‐grown and in well‐lit environments (which may be difficult for woodland under‐story
plants) (Cornelissen et al., 2003). Measurement data may be continuous (e.g., height, seed mass)
or categorical (e.g., life form, dispersal mode); further consideration must also be given to
69

phenological data due to its circular nature (i.e., to better identify the relative closeness of
December and January values which may not be clear with numerical assignations such as '12' and
'1') (Podani & Schmera, 2006).
The need for relatively easy and rapid quantification of trait measurements has given rise to them
being termed soft traits (Hodgson et al., 1999) which are more useful if they correlate with hard
traits (i.e., difficult to measure traits). For example, seed mass and seed shape are soft traits that
have been shown to correlate with the seed persistence (Thompson et al., 1993). Twelve years ago
Weiher et al (1999) set out to define the most useful traits that would capture the large majority
of the functional characteristics of plants by summarising research up to that point (table 5.1). This
list provides a useful a priori starting point for choosing soft traits as easier representatives of hard
trait characteristics; however, choosing the correct traits for any given study is very important if
the the true nature of environment/trait relationships is to be determined and the use of
ordination techniques can improve the explanatory power of the analyses (Bernhardt‐Romermann
et al., 2008).
Consensus on techniques for obtaining trait data from the field or laboratory is important
(Cornelissen et al., 2003); however, in recent years a range of trait databases have become
available to European ecologists (e.g., Fitter & Peat, 1994; Klimes & Klimesova, 1999; Poschlod et
al., 2003; Hill et al., 2004; Kühn et al., 2004; Niinemets & Valladares, 2006; Grime et al., 2007;
Kleyer et al., 2008) which have proved to be very popular in many comparative ecological studies.
Table 5.1: The common challenges faced by plants and some suggested traits (Weiher et al., 1999)
Challenge Hard trait Easy Trait 1. Dispersal Dispersal in space Dispersal distance Seed mass, Dispersal mode Dispersal in time Propagule longevity Seed mass, seed shape 2. Establishment Seedling growth Seed mass, Relative
Growth Rate Seed mass, Specific Leaf Area (SLA), Leaf Water Content (LWC)
3. Persistence Seed production Fecundity Seed mass, Above‐ground biomass Competitive ability Competitive effect
and response Height, Above‐ground biomass
Plasticity Reaction norm SLA, LWC Holding space / longevity Life span Life history, Stem density Acquiring space Vegetative spread Clonality Response to disturbance; stress and disturbance avoidance
Resprouting ability, Phenology, Palatability
Resprouting ability, Onset of flowering, SLA, LWC
5.8.3. Traits and community assembly
A major goal in ecology is to understand the processes behind community structure and assembly
(Keddy, 1992). Historical approaches to this goal have been quite varied (e.g., compare Clements,
70
1916; Gleason, 1926) and still continue to follow either a stochastic demographic route (Hubbell,
2005), or a more deterministic path (Tilman, 1985), or both (Weiher & Keddy, 1995; Fukami et al.,
2005). Community assembly using plant traits is a relatively young aspect of trait‐based ecology
and is seen as one possible way of reconciling the approaches above (Shipley et al., 2006). This has
seen the creation of 'assembly rules' (Keddy & Weiher, 1999) which are defined by abiotic factors
first and then biotic controls that set the levels of dominance in a community (Grime, 2001;
Cingolani et al., 2007). This approach is particularly useful because it defines relationships
between traits ‐ not species ‐ and environmental conditions; in theory the concept thus fulfils the
need for generalised principles (McGill et al., 2006) as these relationships can then be applied to
regions with different species pools (Keddy, 1992).
The ongoing development of the concept is building on the known relationships between traits
and climate, disturbance and biotic interactions. For example, potential plant height is a long‐
standing trait associated with competitive ability (Grime, 2001), however it is also known that
trait/competition associations may vary across different environments (Tilman, 1988; Goldberg,
1996): e.g., leaf and root traits are more important in dry (Ackerly, 2004a; Funk & Vitousek, 2007)
and nutrient poor environments (Craine et al., 2001). In some environments other biotic factors
may be more important for community assembly; e.g., facilitation is known to be a key interaction
in high stress environments (Brooker et al., 2008). The study of the role of traits in different
environments is slowly helping to identify the traits that respond to different environmental
conditions. For example, identifying the traits that convey drought tolerance in communities
(Barboni et al., 2004; Valladares & Sánchez‐Gómez, 2006; Sánchez‐Gómez et al., 2008) may help to
predict community outcomes under future climate change. But it is also worth noting that it is not
just environmental parameters that need to be modified for climate change prediction as other
filters may be changed indirectly by climate too (e.g., new pest attacks, change in fire frequency,
changes in species' competitive abilities) (Díaz et al., 1999; Bond & Keeley, 2005).
New methods have been developed to model community assembly using traits from the local
species pool (Shipley et al., 2006; Cornwell & Ackerly, 2009). Under the assumption that abundant
species are more important drivers of ecosystem processes in any given environmental state
(derived from Grime's (1998) mass‐ratio concept), community weighted means of the traits
selected can be calculated from species abundance data (Garnier et al., 2007; Lavorel et al., 2008).
This quantitative tool can then be applied to predicting the species' composition from different
species pools using the most useful functional traits representing most of the total biomass
(Shipley et al., 2006) and it has the potential for predicting community structural change in
response to different kinds of environmental (including climate) change.
5.8.4. Traits and ecosystem function
Plant traits have been shown to have responses to abiotic factors but they also have implications
for defining the relationship between community structure and ecosystem function (Grime, 1997;
Loreau, 2000; Loreau et al., 2001). In a time when ecosystem services are recognised as being vital
71

for human welfare (Millennium Ecosystem Assessement, 2005), and concerns that climatic change
and other global environmental drivers are having deleterious effects to society, the links between
functional traits and ecosystem function are more important than ever (Díaz et al., 2007; Fortunel
et al., 2009).
Community weighted means of traits is also key to understanding ecosystem function as
important traits for resource acquisition and use are related to their overall contribution to the
community (Lavorel & Garnier, 2002) which can also be 'scaled up' to the ecosystem level (Hooper
et al., 2005; Vile et al., 2006; Suding & Goldstein, 2008). The key aspect of this research is that it
can be applied to different scenarios of land‐use change or disturbance so ecosystem function can
be quantified across environments and has important implications as a tool in valuing and
protecting ecosystem services (Quetier et al., 2007).
Trait‐based approaches in ecology have also contributed to the relationship between biodiversity
and ecosystem function (Grime, 1997). There is increasing confidence that it is not species
diversity that is the main component affecting ecosystem function, but rather functional diversity
(Tilman et al., 1997; Díaz & Cabido, 2001; Hooper et al., 2005; Mokany et al., 2008). Definitions of
functional diversity vary but essentially it can be described as the functional trait variation among
species in a community (Petchey & Gaston, 2002). Petchy and Gaston (2006) have outlined four
main requirements for measuring functional diversity: the need for pertinent trait data for the
species under study; traits weighted according to their functional importance; a statistical
measure to cope with the form of measurement; and measurements that explain ecosystem
processes.
Much work has gone into devising suitable methodologies for measuring functional diversity
(Petchey et al., 2004) but perhaps the two most common methods are assessing dissimilarity
among species using their traits (the Rao Index) (Lepš et al., 2006) or assessing trait variance in a
community (Mason et al., 2005). In fact, Mason et al (2005) suggest that stricter definitions and
components of functional diversity should be ascribed by ecologists to break down functional
diversity into (analogous to species diversity indices) functional richness, functional evenness and
functional divergence. However, already the concept functional diversity has been applied to
predictions and measurements of various aspects of ecosystem function such as ecosystem
stability, nutrient cycling, decomposition and productivity (Cornelissen & Thompson, 1997; Tilman
et al., 1997; Díaz et al., 2004; Vile et al., 2006; Quetier et al., 2007; Nadrowski et al., 2010; Zavaleta
et al., 2010).
The burgeoning use of traits in ecology reflects their versatility in explaining plant responses to
environmental factors (Ackerly & Cornwell, 2007) as well as their utility in understanding
ecosystem function (Garnier et al., 2007), although the traits that confer these roles may not
overlap (Lavorel et al., 2007). The growth of trait databases will be an important aspect of the
further development of trait‐based research, but so too will the refinement of our understanding 72

of how different traits are important to the assembly of communities under changing climates
(McGill et al., 2006; Suding & Goldstein, 2008).
5.8.5. Traits and British woodlands
In the context of this report a discussion of a trait‐based approach is no good good if it cannot be
applied the future of woodlands in Britain. Certainly the relatively easy methodology for using
traits commends it working in many habitat types (Lavorel et al., 2008), and the burgeoning
development of trait databases in the UK and Europe allows for easier analysis. In fact, most of the
plant species studied in this report already have extensive autoecological data available (see list
above in section 5.8.2) as do many of the non‐plant species. In addition, new research has already
adopted trait‐based approaches in woodlands or wooded landscapes (Burton et al., 2009; Mabry
& Fraterrigo, 2009; Sciama et al., 2009; Walker et al., 2009; Baraloto et al., 2010; Tanaka & Koike,
2011). A next step then could be to apply this model to understanding the effects of climate
change on woodlands; a number of approaches are possible:
• Calibrate bioclimate models of species distributions further by analysing if specie’s
performance is affected by their traits (Pöyry et al., 2008; Pöyry et al., 2009; Hanspach et
al., 2010);
• Predict species composition of woodlands based on traits (Tanaka & Koike, 2011);
• Analyse woodlands across climatic gradients using community‐weighted trait composition
(Pakeman et al., 2008) to infer future changes in structure and function (Paterson,
unpublished);
• Relate trait composition of woodlands to changes in ecosystem services (Quetier et al.,
2007; de Bello et al., 2010; Lavorel et al., 2011).
Exploratory work in trait approaches to future woodland composition (Paterson, unpublished)
suggest that because the pace of climate change is such that migration of many plant species will
not track climate sufficiently well, particularly in the fragmented British landscape, the future
community assembly of woodlands in Britain may well draw from non‐native plant sources
(including our introduced garden flora). If community assembly filters can be predicted for future
climates in Britain, further screening the plant traits of our common garden flora may provide an
idea of the the possible species likely to compete with native species. Alternatively, if species'
translocation from continental European countries becomes financially and politically expedient,
knowledge of these trait characteristics will help identify candidate species from other lower
latitude woodland habitats.
6. Conclusions The evidence for the contribution of humans to climate change is now overwhelming and evidence
of biotic responses is burgeoning too. Species respond to climate change in a number of ways
including physiological, phenological, range shifts and evolutionary changes. While all these
responses have been documented in European and UK flora and fauna in the last few decades, the
73

evidence of changes to habitats in the UK is not yet conclusive.
Projecting biotic responses to climate change is problematic, but a number of tools are available.
One of the most popular is a modelling technique that projects new bioclimatic space for a specie’s
distribution under different climate scenarios. As this does not take into account factors, such as
biotic interactions, caution is necessary when interpreting the results. A total of 178 woodland‐
related species for which modelling results were available demonstrated that many woodland
species have quite different responses to climate change; some will be ‘winners’, but a
considerable number will lose potential bioclimatic space in the British Isles in the forthcoming
decades. Most species gained climate space, although there are some significant losers including
pied flycatcher, twinflower and narrow‐headed ant. Of the main winners, the two native lime
species both stand out as potential future dominant canopy species, although beech and oak also
make very small gains. South‐east England potentially will be hit hardest by species losses, with
many species, including major canopy trees losing bioclimate space here from 2050. Many species
that are dominant in the south today, however, will be more successful competitors in Scotland in
the future. Although beech is already naturalised in Scotland, management of it in semi‐natural
woodlands may need to be re‐evaluated. Most woodland shrub species do very well, although one
of the main losers could be bramble which would have implications for ecosystem functioning in
many woodlands. A number of mobile species gain bioclimate space, including some charismatic
species, such as the red squirrel and dormouse, but other factors may prevent them from realising
this. However, a number of species with strongholds in Scotland are likely to suffer including the
Scottish crossbill, Scottish wood ant and capercaillie.
On the basis of the modelling of the impacts of climate change on a range of species associated
with the woodland PH, it is likely that Wood Pasture and Parkland habitats, Upland Oakwoods and
Upland Mixed Ashwoods will see few changes. Lowland Beech and Yew woodland could extend
into northern Britain, but it may suffer losses, as although beech is projected to have suitable
future climate space, in reality, its intolerance to drought may reduce its growth and
competitiveness, especially in south‐east England. This may result in shifts to more oak dominated
woodlands. Yew woods, although comparatively rare, should remain fairly resistant to climate
change. The species found in Wet woodlands have a mixed response in the modelling results, as
both willow species suffer bioclimate space losses, although alder, a major component of many
wet woodlands gains slightly. Lowland Mixed Deciduous Woodland, which is possibly the most
ubiquitous woodland type in Britain, should remain relatively stable. A number of important tree
species could experience small losses which may affect the competitive balance in some
woodlands (e.g., between ash and oak in ash woodlands) although there are some striking gains
including three rare species (large‐leaf lime and both service trees). This has implications for
conservation, not least because lime used to be a dominant woodland canopy tree throughout
much of Britain several thousand years ago. Upland Birchwoods and Scots Pine woodlands are
possibly the major losers in this study. Both the iconic species in Upland Birchwoods (silver and
downy birch) lose bioclimate space as well as the other major trees (rowan, grey willow and wych
74

elm). The two winners are both oak species which suggests that even on the less stable soils and in
canopy gaps, the birches may not be successful colonisers and oak may dominate. For Scots Pine
woodlands, Scots pine is projected to lose significant amounts of climate space under the high
emission scenario by 2080, although it is unlikely that this will lead to immediate range reduction
due to the species’ longevity. Pests and diseases of Scots pine are, however, likely to increase with
warmer temperatures, but incidents of fire may increase, which often aid the regeneration of Scots
pine and silver birch. Woodland structure, therefore, may change, with sessile oak stands possibly
increasing, while Scots pine decreases, and subsequently, the species associated with Scots pine
could also decrease, including Scottish crossbills and wood ants.
Of the 11 rare species projected to lose suitable climate space (Table 4.11) little is known about the
potential effects on woodland functioning, although there is some evidence that it could be
affected by the possible decline or loss of wood ants. Many of these rarer species, however, are
currently more affected by land use and management practices, with climate change acting as an
additional pressure. These potential losses need to be balanced against the possible expansion of
some species associated with woodlands, such as some bats. In addition, there are continental
species, such as downy and holm oak and manna ash, which could have future suitable climate
space in the UK. These have similar ecological niches to some tree species potentially threatened
by climate change in Britain, so while they may lead to a change in woodland composition there
may be little change in some functions, but this needs further investigation.
In terms of functional groups, trees are projected to have a mean gain of 15%, while shrubs and
ground flora species show a mean 1% loss/gain respectively. It should be noted, however, that
these findings are based on a selection of British woodland species, although almost all major tree
and shrub species are included. For the other taxa, where the number of species is smaller,
mammals have potential gains in climate space, while birds and ants show losses. It is difficult to
predict whether new specialist species will replace those that are lost, as specialist species are
often poor at dispersal; thus generalist species are more likely to be successful colonisers. If
replacement does occur it is also hard to assess whether community structure and function will be
maintained, as we have no (few) examples of this and is likely to be situation specific. The
possibility of more competitive, possibly invasive, species becoming established could best be
ascertained by checking successful species against their traits.
Predicting changes to woodland structure are difficult, partly because the model does not take into
account biotic interactions, which are very important determinants of community structure at a
small scale. Some inferences can be made by drawing on changes to woodland structure
throughout recent and palaeoecological history, but even this is challenging. It is possible that non‐
analogue woodlands may arise consisting of species that hitherto have never been a major
component of Britain’s native woodlands (e.g., species from our garden flora or introductions from
overseas for forestry). It is likely, however, that the major structural elements of our woodlands
will, or can, be maintained.
75

Changes to ecosystem function are possibly even harder to predict, although it will be contingent
on which functions are examined (e.g., a long and developed forestry science history allows us to
predict biomass productivity very well). While many functions could be maintained, some on
which specialist species rely, such as specific decomposition pathways, could be more challenging
and require further research. If a non‐intervention laissez faire approach is adopted then gradual
community changes will be harder to predict.
Where climate change is identified as a potential threat to woodland composition, structure and
functioning, then there are a range of adaptation measures (Section 5.5), which could culminate in
adaptive management to ensure that desired outcomes are achieved. It is also possible that the
conservation of some vulnerable species may not be viable in the future and consideration should
be given to non‐intervention and seeking alternative species to maintain the habitat (Section 5.6).
The adoption of this approach can partly depend on whether interest is in a particular species or
habitat composition or on ecosystem functioning.
As this research has shown, there are still a number of research questions to be addressed
especially in relation to the impact of climate change on woodland structure and functioning. One
promising approach for understanding ecosystem change and its consequences for functioning and
ecosystem services is the use of traits. This offers an opportunity to understand how communities
assemble, which is particularly useful for climate change studies when the future pool of suitable
species may be novel or unknown. For more complex interactions between species at different
trophic levels, ecological networks can provide insights into the potential changes on food webs,
plant‐pollinator networks and host‐parasitoid networks and they can be incorporated into
bioclimatic envelope models using a conceptual framework. Alternatively, hybrid models which are
built on species’ physiological responses can also take account of species interactions. For all these
approaches data limitations are a serious issue and further laboratory and field‐based research and
long‐term monitoring is needed.
Based on BEM outputs this report has highlighted those PH which are considered most vulnerable
to climate change, and has shown that while it is possible to give indicative outcomes, especially at
the species level, there is still much to discover about the more complex habitat level. Also, using
the literature, it has qualitatively explored the implications for woodland composition, structure
and functioning. This is an area for much fruitful further work, both to increase our understanding
of how ecosystems operate and how they affect the delivery of ecosystem services.
76
7. References Ackerly, D. D. 2004a. Adaptation, niche conservatism, and convergence: Comparative studies of
leaf evolution in the California chaparral. American Naturalist. 163 (5): 654‐671. Ackerly, D. D. 2004b. Functional strategies of chaparral shrubs in relation to seasonal water deficit
and disturbance. Ecological Monographs. 74 (1): 25‐44. Ackerly, D. D. & Cornwell, W. K. 2007. A trait‐based approach to community assembly: partitioning
of species trait values into within‐ and among‐community components. Ecology Letters. 10 (2): 135‐145.
Ackerly, D. D., Loarie, S. R., Cornwell, W. K., et al. 2010. The geography of climate change: implications for conservation biogeography. Diversity and Distributions. 16 (3): 476‐487.
Aerts, R., Cornelissen, J. & Dorrepaal, E. 2006. Plant performance in a warmer world: general responses of plants from cold, northern biomes and the importance of winter and spring events. Plant Ecology. 182 (1‐2): 65‐77.
Aerts, R., Cornelissen, J. H. C., Dorrepaal, E., et al. 2004. Effects of experimentally imposed climate scenarios on flowering phenology and flower production of subarctic bog species. Global Change Biology. 10 (9): 1599‐1609.
Aitken, S., Yeaman, S., Holliday, J., et al. 2008. Adaptation, migration or extirpation: climate change outcomes for tree populations. Evolutionary Applications. 1 (1): 95‐111.
Albert, C. H., Thuiller, W., Yoccoz, N. G., et al. 2010. A multi‐trait approach reveals the structure and the relative importance of intra‐ vs. interspecific variability in plant traits. Functional Ecology. 24 (6): 1192‐1201.
Alcamo, J., Moreno, J., Nováky, B., et al. 2007. Europe. In: Climate Change 2007: Impacts, Adaptation and Vulnerability. Contribution of Working Group II to the Fourth Assessment Report of the Intergovernmental Panel on Climate Change. (ed. by Parry, M. L., Canziani, O. F., Palutikof, J. P., et al.). Cambridge, UK: Cambridge University Press. pp 541‐580.
Allen, C. D. & Breshears, D. D. 1998. Drought‐induced shift of a forest‐woodland ecotone: Rapid landscape response to climate variation. Proceedings of the National Academy of Sciences of the United States of America. 95 (25): 14839‐14842.
Allouche, O., Tsoar, A. & Kadmon, R. 2006. Assessing the accuracy of species distribution models: prevalence, kappa and the true skill statistic (TSS). Journal of Applied Ecology. 43 (6): 1223‐1232.
Araújo, M. B. & Guisan, A. 2006. Five (or so) challenges for species distribution modelling. Journal of Biogeography. 33 (10): 1677‐1688.
Araújo, M. B. & Luoto, M. 2007. The importance of biotic interactions for modelling species distributions under climate change. Global Ecology and Biogeography. 16 (6): 743‐753.
Araújo, M. B. & Pearson, R. G. 2005. Equilibrium of species' distributions with climate. Ecography. 28 (5): 693‐695.
Araújo, M. B., Pearson, R. G., Thuiller, W., et al. 2005. Validation of species‐climate impact models under climate change. Global Change Biology. 11 (9): 1504‐1513.
Araújo, M. B., Thuiller, W. & Pearson, R. G. 2006. Climate warming and the decline of amphibians and reptiles in Europe. Journal of Biogeography. 33 (10): 1712‐1728.
Atkinson, M. D. 1992. Biological Flora of the British Isles: Betula pendula Roth (B. Verrucosa Ehrh.) and B. pubescens Ehrh. Journal of Ecology. 80 (4): 837‐870.
Bailey, S. 2007. Increasing connectivity in fragmented landscapes: An investigation of evidence for biodiversity gain in woodlands. Forest Ecology and Management. 238 (1‐3): 7‐23.
Bailey, S.‐A., Horner‐Devine, M. C., Luck, G., et al. 2004. Primary productivity and species richness: relationships among functional guilds, residency groups and vagility classes at multiple spatial scales. Ecography. 27 (2): 207‐217.
77

Baines, D. & Andrew, M. 2003. Marking of deer fences to reduce frequency of collisions by woodland grouse. Biological Conservation. 110 (2): 169‐176.
Baines, D. & Summers, R. W. 1997. Assessment of bird collisions with deer fences in Scottish forests. Journal of Applied Ecology. 34: 941–948.
Bakkenes, M., Alkemade, J. R. M., Ihle, F., et al. 2002. Assessing effects of forecasted climate change on the diversity and distribution of European higher plants for 2050. Global Change Biology. 8 (4): 390‐407.
Balvanera, P., Pfisterer, A., Buchmann, N., et al. 2006. Quantifying the evidence for biodiversity effects on ecosystem functioning and services. Ecology Letters. 9 (10): 1146‐1156.
Baraloto, C., Paine, C. E. T., Patino, S., et al. 2010. Functional trait variation and sampling strategies in species‐rich plant communities. Functional Ecology. 24 (1): 208‐216.
Barbati, A., Corona, P. & Marchetti, M. 2007. A forest typology for monitoring sustainable forest management: The case of European Forest Types. Plant Biosystems. 141 (1): 93‐103.
Barboni, D., Harrison, S. P., Bartlein, P. J., et al. 2004. Relationships between plant traits and climate in the Mediterranean region: A pollen data analysis. Journal of Vegetation Science. 15 (5): 635‐646.
Baron, J. S., Gunderson, L., Allen, C. D., et al. 2009. Options for National Parks and Reserves for Adapting to Climate Change. Environmental Management. 44 (6): 1033‐1042.
Bascietto, M., Cherubini, P. & Scarascia‐Mugnozza, G. 2004. Tree rings from a European beech forest chronosequence are useful for detecting growth trends and carbon sequestration. Canadian Journal of Forest Research. 34 (2): 481‐492.
Battisti, A., Stastny, M., Netherer, S., et al. 2005. Expansion of geographic range in the pine processionary moth caused by increased winter temperatures. Ecological Applications. 15 (6): 2084‐2096.
Bazzaz, F. A. 1996. Plants in changing environments ‐ linking physiological, population and community ecology. Cambridge: Cambridge University Press.
Beniston, M., Stephenson, D. B., Christensen, O. B., et al. 2007. Future extreme events in European climate: An exploration of regional climate model projections. Climatic Change. 81 (SUPPL. 1): 71‐95.
Benkman, C. W. 1987. Food profitability and the foraging ecology of crossbills. Ecological Monographs. 57 (3): 251‐267.
Benkman, C. W. 1990. Intake rates and the timing of crossbill reproduction. Auk. 107 (2): 376‐386. Bennie, J., Hill, M. O., Baxter, R., et al. 2006. Influence of slope and aspect on long‐term vegetation
change in British chalk grasslands. Journal of Ecology. 94 (2): 355‐368. Bernhardt‐Romermann, M., Romermann, C., Nuske, R., et al. 2008. On the identification of the
most suitable traits for plant functional trait analyses. Oikos. 117 (10): 1533‐1541. Berry, P., Burch, S. & Sanders, M. 2011. EMBEDS: embedding biodiversity adaptation principles.
Report to Defra, Contract no: CR0488. Berry, P. M., Dawson, T., Harrison, P. A., et al. 2002. Modelling potential impacts of climate change
on the bioclimatic envelope of species in Britain and Ireland. Global Ecology and Biogeography. 11 (6): 453‐462.
Berry, P. M., Dawson, T., Harrison, P. A., et al. 2003. The sensitivity and vulnerability of terrestrial habitats and species in Britain and Ireland to climate change. Journal for Nature Conservation. 11 (1): 15‐24.
Berry, P. M., Harrison, P. A., Dawson, T. P., et al. 2005. Climate change and nature conservation in the UK and Ireland: modelling natural resource responses to climate change (MONARCH2). Oxford: UKCIP
78
Berry, P. M., O'Hanley, J. R., Thomson, C. L., et al. 2007. Modelling Natural Resource Responses to Climate Change (MONARCH): MONARCH 3 Contract Report. Oxford: UKCIP Technical Report.
Berteaux, D., Reale, D., McAdam, A. G., et al. 2004. Keeping pace with fast climate change: Can arctic life count on evolution? Integrative and Comparative Biology. 44 (2): 140‐151.
BirdLife International 2011. Species factsheet: Jynx torquilla. Downloaded from http://www.birdlife.org on 01/03/2011.
Bishop, C. M. 1995. Neural Networks for Pattern Recognition. Oxford: Oxford University Press. Boisvenue, C. & Running, S. 2006. Impacts of climate change on natural forest productivity ‐
Evidence since the middle of the 20th century. Global Change Biology. 12 (5): 862‐882. Bolte, A., Ammer, C., Löf, M., et al. 2009. Adaptive forest management in central Europe: Climate
change impacts, strategies and integrative concept. Scandinavian Journal of Forest Research. 24 (6): 473‐482.
Bonada, N., Dolédec, S. & Statzner, B. 2007. Taxonomic and biological trait differences of stream macroinvertebrate communities between mediterranean and temperate regions: implications for future climatic scenarios. Global Change Biology. 13 (8): 1658‐1671.
Bonan, G. 2008. Forests and climate change: forcings, feedbacks, and the climate benefits of forests. Science. 320 (5882): 1444‐1449.
Bond, W. J. & Keeley, J. E. 2005. Fire as a global 'herbivore': the ecology and evolution of flammable ecosystems. Trends in Ecology and Evolution. 20 (7): 387‐394.
Boshier, D. & Stewart, J. 2005. How local is local? Identifying the scale of adaptive variation in ash (Fraxinus excelsior L.): results from the nursery. Forestry. 78 (2): 135‐143.
Box, E. O. 1981. Macroclimate and plant forms: an introduction to predictive modeling in phytogeography.
Bradshaw, C., Sodhi, N., Peh, K., et al. 2007. Global evidence that deforestation amplifies flood risk and severity in the developing world. Global Change Biology. 13 (11): 2379‐2395.
Bradshaw, W. E. & Holzapfel, C. M. 2006. Evolutionary response to rapid climate change. Science. 312 (5779): 1477‐1478.
Braun‐Blanquet, J., Conard, H. S. & Fuller, G. D. 1932. Plant sociology: the study of plant communities ‐ authorized English translation of Pflanzensoziologie. London: McGraw‐Hill.
Breda, N., Huc, R., Granier, A., et al. 2006. Temperate forest trees and stands under severe drought: a review of ecophysiological responses, adaptation processes and long‐term consequences. Annals of Forest Science. 63 (6): 625‐644.
Broadmeadow, M. & Jackson, S. 2000. Growth responses of Quercus petraea, Fraxinus excelsior and Pinus sylvestris to elevated carbon dioxide, ozone and water supply. New Phytologist. 146 (3): 437‐451.
Broadmeadow, M. S. J., Morecroft, M. D. & Morison, J. I. L. 2009a. Observed impacts of climate change on UK forests to date. In: Combating climate change – a role for UK forests. An assessment of the potential of the UK’s trees and woodlands to mitigate and adapt to climate change. (ed. by Read, D., Freer‐Smith, P. H., Morison, J., et al.). Edinburgh: The Stationery Office. pp 50‐66.
Broadmeadow, M. S. J., Randle, T. & Broadmeadow, M. 2002. The impacts of increased CO2
concentrations on tree growth and function. Climate change: impacts on UK forests. Bulletin 125: 119‐140.
Broadmeadow, M. S. J. & Ray, D. 2005. Climate Change and British Woodland. Edinburgh: Forestry Commission.
Broadmeadow, M. S. J., Webber, J. F. & Berry, P. M. 2009b. An assessment of likely future impacts of climate change on UK forests. In: Combating climate change ‐ a role for UK forests. An
79

assessment of the potential of the UK's trees and woodlands to mitigate and adapt to climate change. (ed. by Read, D. J., Freer‐Smith, P. H., Morison.J.I.L, et al.). Edinburgh: The Stationary Office. pp.
Brooker, R. W. 2006. Plant‐plant interactions and environmental change. New Phytologist. 171 (2): 271‐284.
Brooker, R. W., Maestre, F. T., Callaway, R. M., et al. 2008. Facilitation in plant communities: The past, the present, and the future. Journal of Ecology. 96 (1): 18‐34.
Broome, A., Hendry, S., Smith, M., Rayner, W., Nichol, B., Perks, M., Connolly, T., Tene, A., & Bochereau, F. (2008). Investigation of the possible causes of dieback of Glenartney Juniper Wood SAC Perthshire. Project No: 18895. Report commissioned by Scottish Natural Heritage. Forest Research, Roslin.
Brown, A., Rose, D. & Webber, J. 2003. Red Band Needle Blight of Pine. Edinburgh: Forest Research.
Buckland, S. M., Thompson, K., Hodgson, J., et al. 2001. Grassland invasions: effects of manipulations of climate and management. Journal of Applied Ecology. 38 (2): 301‐309.
Bunce, R. G. H. 1982. A field key for classifying British woodland vegetation. Part 2. London: HMSO. Burkle, L. A. & Alarcon, R. 2011. The future of plant–pollinator diversity: Understanding interaction
networks across time, space, and global change. American Journal Of Botany. 98 (3): 528‐538.
Burton, M. L., Samuelson, L. J. & Mackenzie, M. D. 2009. Riparian woody plant traits across an urban‐rural land use gradient and implications for watershed function with urbanization. Landscape and Urban Planning. 90 (1‐2): 42‐55.
Castro, J., Zamora, R., Hodar, J., et al. 2004. Seedling establishment of a boreal tree species (Pinus sylvestris) at its southernmost distribution limit: consequences of being in a marginal Mediterranean habitat. Journal of Ecology. 92 (2): 266‐277.
Chapin III, F. S., Danell, K., Elmqvist, T., et al. 2007. Managing climate change impacts to enhance the resilience and sustainability of Fennoscandian forests. Ambio. 36 (7): 528‐533.
Chmielewski, F. M. & Rotzer, T. 2001. Response of tree phenology to climate change across Europe. Agricultural and Forest Meteorology. 108 (2): 101‐112.
Choler, P. 2005. Consistent shifts in alpine plant traits along a mesotopographical gradient. Arctic, Antarctic, and Alpine Research. 37 (4): 444‐453.
Chown, S. L., Hoffmann, A. A., Kristensen, T. N., et al. 2010. Adapting to climate change: A perspective from evolutionary physiology. Climate Research. 43 (1‐2): 3‐15.
Christensen, J., Solomon, S., Qin, D., et al. 2007. Regional Climate Projections. In: Climate Change 2007: The Physical Science Basis. Contribution of Working Group I to the Fourth Assessment Report of the Intergovernmental Panel on Climate Change. (ed. by Solomon, S., Qin, D., Manning, M., et al.). Cambridge, United Kingdom: Cambridge University Press. pp.
Cingolani, A. M., Cabido, M., Gurvich, D. E., et al. 2007. Filtering processes in the assembly of plant communities: Are species presence and abundance driven by the same traits? Journal of Vegetation Science. 18 (6): 911‐920.
Clark, J. S., Fastie, C., Hurtt, G., et al. 1998. Reid's paradox of rapid plant migration. Bioscience. 48 (1): 13‐24.
Clarke, P. J., Knox, K. J. E., Wills, K. E., et al. 2005. Landscape patterns of woody plant response to crown fire: disturbance and productivity influence sprouting ability. Journal of Ecology. 93 (3): 544‐555.
Cleary, D. F. R., Boyle, T. J. B., Setyawati, T., et al. 2007. Bird species and traits associated with logged and unlogged forest in Borneo. Ecological Applications. 17 (4): 1184‐1197.
80

Clements, F. E. 1916. Plant succession. An analysis of the development of vegetation. Washington D.C: Carnegie Institution of Washington.
Clifton, S. J ., Ward, L. K., & Ranner, D. S. 1997. The status of juniper Juniperus communis L. in North East England. Biological Conservation, 79, 67‐77.
Conant, S. 1988. Saving endangered species by translocation. Bioscience. 38 (4): 254‐257. Condeso, T. E. & Meentemeyer, R. K. 2007. Effects of landscape heterogeneity on the emerging
forest disease sudden oak death. Journal of Ecology. 95 (2): 364‐375. Convey, P. & Smith, R. 2006. Responses of terrestrial Antarctic ecosystems to climate change.
Plant Ecology. 182 (1‐2): 1‐10. Cornelissen, J. H. C., Lavorel, S., Garnier, E., et al. 2003. A handbook of protocols for standardised
and easy measurement of plant functional traits worldwide. Australian Journal of Botany. 51 (4): 335‐380.
Cornelissen, J. H. C. & Thompson, K. 1997. Functional leaf attributes predict litter decomposition rate in herbaceous plants. New Phytologist. 135 (1): 109‐114.
Cornwell, W. K. & Ackerly, D. D. 2009. Community assembly and shifts in plant trait distributions across an environmental gradient in coastal California. Ecological Monographs. 79 (1): 109‐1226.
Craine, J. M., Froehle, J., Tilman, D. G., et al. 2001. The relationships among root and leaf traits of 76 grassland species and relative abundance along fertility and disturbance gradients. Oikos. 93 (2): 274‐285.
Crawford, A. 2003. Fourth otter survey of England 2000 – 2002. Bristol: Environment Agency. Czajkowski, T. & Bolte, A. 2006. Different reaction of beech (Fagus sylvatica L.) provenances from
Germany and Poland to drought. Allgemeine Forst‐ und Jagdzeitung. 177 (2): 30‐40. Davidar, P., Rajagopal, B., Arjunan, M., et al. 2008. The relationship between local abundance and
distribution of rain forest trees across environmental gradients in India. Biotropica. 40 (6): 700‐706.
Davis, A., Jenkinson, L., Lawton, J., et al. 1998. Making mistakes when predicting shifts in species range in response to global warming. Nature. 391 (6669): 783‐786.
Davis, M. B. & Shaw, R. G. 2001. Range shifts and adaptive responses to Quaternary climate change. Science. 292 (5517): 673‐679.
Davis, M. B., Shaw, R. G. & Etterson, J. R. 2005. Evolutionary responses to changing climate. Ecology. 86 (7): 1704‐1714.
de Bello, F., Lavorel, S., Diaz, S., et al. 2010. Towards an assessment of multiple ecosystem processes and services via functional traits. Biodiversity and Conservation. 19 (10): 2873‐2893.
de Bello, F. D., Lepš, J. & Sebastia, M. 2005. Predictive value of plant traits to grazing along a climatic gradient in the Mediterranean. Journal of Applied Ecology. 42 (5): 824‐833.
de Dios, V. R., Fischer, C. & Colinas, C. 2007. Climate change effects on mediterranean forests and preventive measures. New Forests. 33 (1): 29‐40.
de Valpine, P. & Harte, J. 2001. Plant responses to experimental warming in a montane meadow. Ecology. 82 (3): 637‐648.
del Hoyo, J., Elliott, A. & Sargatal, J. 2002. Handbook of the birds of the world, vol. 7: jacamars to woodpeckers. Barcelona, Spain: Lynx Edicions.
Department of Environmental Affairs and Tourism 2005. The National Biodiversity Strategy and Action Plan for South Africa (NBSAP). Pretoria: CBD.
Devoto, M., Medan, D., Roig‐Alsina, A., et al. 2009. Patterns of species turnover in plant‐pollinator communities along a precipitation gradient in Patagonia (Argentina). Austral Ecology. 34 (8): 848‐857.
81

Díaz, S. & Cabido, M. 2001. Vive la difference: plant functional diversity matters to ecosystem processes. Trends in Ecology and Evolution. 16 (11): 646‐655.
Díaz, S., Cabido, M. & Casanoves, F. 1998. Plant functional traits and environmental filters at a regional scale. Journal of Vegetation Science. 9 (1): 113‐122.
Díaz, S., Cabido, M., Zak, M., et al. 1999. Plant functional traits, ecosystem structure and land‐use history along a climatic gradient in central‐western Argentina. Journal of Vegetation Science. 10 (5): 651‐660.
Díaz, S., Hodgson, J., Thompson, K., et al. 2004. The plant traits that drive ecosystems: Evidence from three continents. Journal of Vegetation Science. 15 (3): 295‐304.
Díaz, S., Lavorel, S., de Bello, F. D., et al. 2007. Incorporating plant functional diversity effects in ecosystem service assessments. Proceedings of the National Academy of Sciences of the United States of America. 104 (52): 20684‐20689.
Dittmar, C., Zech, W. & Elling, W. 2003. Growth variations of Common beech (Fagus sylvatica L.) under different climatic and environmental conditions in Europe ‐ a dendroecological study. Forest Ecology and Management. 173 (1‐3): 63‐78.
Donald, P. F. & Evans, A. D. 2006. Habitat connectivity and matrix restoration: the wider implications of agri‐environment schemes. Journal of Applied Ecology. 43 (2): 209‐218.
Duckworth, J. C., Kent, M. & Ramsay, P. M. 2000. Plant functional types: an alternative to taxonomic plant community description in biogeography? Progress in Physical Geography. 24 (4): 515‐542.
Dunne, J. A., Harte, J. & Taylor, K. J. 2003. Subalpine meadow flowering phenology responses to climate change: Integrating experimental and gradient methods. Ecological Monographs. 73 (1): 69‐86.
Dyer, A. R., Goldberg, D. E., Turkington, R., et al. 2001. Effects of growing conditions and source habitat on plant traits and functional group definition. Functional Ecology. 15 (1): 85‐95.
ECN 2011. The UK Environmental Change Network. Lancaster: http://www.ecn.ac.uk/ Edgar, P. W., Griffiths, R. & Foster, J. P. 2005. Evaluation of translocation as a tool for mitigating
development threats to great crested newts (Triturus cristatus) in England, 1990‐2001. Biological Conservation. 122 (1): 45‐52.
Edwards, M. 2008. An investigation into the flowering period of oak within planted and natural woodlands and the relationship with the presence of the bee Andrena ferox (Hymenoptera : Apidae). Peterborough: Natural England.
Elith, J., Graham, C., Anderson, R., et al. 2006. Novel methods improve prediction of species' distributions from occurrence data. Ecography. 29 (2): 129‐151.
Elith, J. & Leathwick, J. R. 2009. Species distribution models: ecological explanation and prediction across space and time. Annual Review of Ecology, Evolution, and Systematics. 40 (1): 677‐697.
Ellenberg, H. 1963. Vegetation Mitteleuropas mit den Alpen in ökologischer, dynamischer und historischer Sicht. Stuttgart: Ulmer.
Ellis, C. J. & Coppins, B. J. 2007. 19th century woodland structure controls stand‐scale epiphyte diversity in present‐day Scotland. Diversity and Distributions. 13 (1): 84‐91.
Engelbrecht, B. M. J., Comita, L. S., Condit, R., et al. 2007. Drought sensitivity shapes species distribution patterns in tropical forests. Nature. 447 (7140): 80‐82.
Epstein, H. E., Calef, M. P., Walker, M. D., et al. 2004. Detecting changes in arctic tundra plant communities in response to warming over decadal time scales. Global Change Biology. 10 (8): 1325‐1334.
82

Eviner, V. T. & Chapin III, F. S. 2003. Functional Matrix: a conceptual framework for predicting plant effects on ecosystem processes. Annual Review of Ecology, Evolution, and Systematics. 34: 455–485.
Falster, D. & Westoby, M. 2005. Tradeoffs between height growth rate, stem persistence and maximum height among plant species in a post‐fire succession. Oikos. 111 (1): 57‐66.
Ferrier, S. & Guisan, A. 2006. Spatial modelling of biodiversity at the community level. Journal of Applied Ecology. 43 (3): 393‐404.
Fielding, A. H. & Bell, J. 1997. A review of methods for the assessment of prediction errors in conservation presence/absence models. Environmental Conservation. 24 (1): 38‐49.
Fischlin, Midgley, G. F., Price, J., et al. 2007. Ecosystems, their properties, goods, and services. In: Climate Change 2007: Impacts, Adaptation and Vulnerability. Contribution of Working Group II to the Fourth Assessment Report of the Intergovernmental Panel on Climate Change. (ed. by Parry, M. L., Canziani, O. F., Palutikof, J. P., et al.). Cambridge: Cambridge University Press. pp 211‐272.
Fitter, A. H. & Fitter, R. S. R. 2002. Rapid changes in flowering time in British plants. Science. 296 (5573): 1689‐1691.
Fitter, A. H. & Peat, H. 1994. The ecological flora database. Journal of Ecology. 82 (2): 415‐425. Fitter, A. H. & Jennings, R. D. 1975. The effects of sheep grazing on the growth and survival of
seedling junipers (Juniperus communis). Journal of Applied Ecology, 12, 637‐642. Fonseca, C. R., Overton, J. M., Collins, B., et al. 2000. Shifts in trait‐combinations along rainfall and
phosphorus gradients. Journal of Ecology. 88 (6): 964‐977. Fontes, L., Bontemps, J. D., Bugmann, H., et al. 2010. Models for supporting forest management in
a changing environment. Forest Systems. 19: 8‐29. Forestry Commission. 2011a. Adapting England's forests to climate change ‐ changes in tree
species suitability. 23/3/2011: http://www.forestry.gov.uk/website/forestresearch.nsf/ByUnique/INFD‐837F9J.23/3/2011
Forestry Commission. 2011b. Adapting Scotland's forests to climate change ‐ changes in tree species suitability. http://www.forestry.gov.uk/website/forestresearch.nsf/ByUnique/INFD‐79RLEW.23/3/2011
Forestry Commission. 2011c. Climate change in Wales ‐ changes in tree species suitability. http://www.forestry.gov.uk/website/forestresearch.nsf/ByUnique/INFD‐7FXC3J.23/3/2011
Fortunel, C., Garnier, E., Joffre, R., et al. 2009. Leaf traits capture the effects of land use changes and climate on litter decomposability of grasslands across Europe. Ecology. 90 (3): 598‐611.
Fotelli, M. N., Rennenberg, H. & Gessler, A. 2002. Effects of drought on the competitive interference of an early successional species (Rubus fruticosus) on Fagus sylvatica L. seedlings: N‐15 uptake and partitioning, responses of amino acids and other N compounds. Plant Biology. 4 (3): 311‐320.
Fotelli, M. N., Rudolph, P., Rennenberg, H., et al. 2005. Irradiance and temperature affect the competitive interference of blackberry on the physiology of European beech seedlings. New Phytologist. 165 (2): 453‐462.
Fowler, S. V. & Macgarvin, M. 1985. The impact of hairy wood ants, Formica lugubris, on the guild structure of herbivorous insects on birch, Betula pubescens. Journal of Animal Ecology. 54 (3): 847‐855.
Franks, S. J., Sim, S. & Weis, A. E. 2007. Rapid evolution of flowering time by an annual plant in response to a climate fluctuation. Proceedings of the National Academy of Sciences of the United States of America. 104 (4): 1278‐1282.
83

Fukami, T., Bezemer, T., Mortimer, S., et al. 2005. Species divergence and trait convergence in experimental plant community assembly. Ecology Letters. 8 (12): 1283‐1290.
Funk, J. L. & Vitousek, P. M. 2007. Resource‐use efficiency and plant invasion in low‐resource systems. Nature. 446 (7139): 1079‐1081.
Fynn, R., Morris, C. D. & Kirkman, K. 2005. Plant strategies and trait trade‐offs influence trends in competitive ability along gradients of soil fertility and disturbance. Journal of Ecology. 93 (2): 384‐394.
Garnier, E., Cortez, J., Billes, G., et al. 2004. Plant functional markers capture ecosystem properties during secondary succession. Ecology. 85 (9): 2630‐2637.
Garnier, E., Lavorel, S., Ansquer, P., et al. 2007. Assessing the Effects of Land‐use Change on Plant Traits, Communities and Ecosystem Functioning in Grasslands: A Standardized Methodology and Lessons from an Application to 11 European Sites. Annals of Botany. 99 (5): 967‐985.
Gärtner, S., Reif, A., Xystrakis, F., et al. 2008. The drought tolerance limit of Fagus sylvatica forest on limestone in southwestern Germany. Journal of Vegetation Science. 19 (6): 757‐768.
Gauch, H. G. 1982. Noise reduction by eigenvector ordinations. Ecology. 63 (6): 1643‐1649. Gaudet, C. L. & Keddy, P. 1988. A comparative approach to predicting competitive ability from
plant traits. Nature. 334 (6179): 242‐243. Gessler, A., Keitel, C., Kreuzwieser, J., et al. 2007. Potential risks for European beech (Fagus
sylvatica L.) in a changing climate. Trees‐Structure and Function. 21 (1): 1‐11. Giambelluca, T. W., Ziegler, A. D., Nullet, M. A., et al. 2003. Transpiration in a small tropical forest
patch. Agricultural and Forest Meteorology. 117 (1‐2): 1‐22. Gilbert, O. L. 1980. Juniper in Upper Teesdale. Journal of Ecology, 68, 1013 ‐ 1024. Gillings, S., Newson, S., Noble, D. G., et al. 2005. Winter availability of cereal stubbles attracts
declining farmland birds and positively influences breeding population trends. Proceedings of the Royal Society of London. Series B, Biological Sciences. 272 (1564): 733‐739.
Gimingham, C. H. 1960. Calluna Salisb. Biological flora of the British Isles. Journal of Ecology. 48 (2): 455‐483.
Gleason, H. A. 1926. The individualistic concept of plant association. Bulletin of the Torrey Botanical Club. 53 (1): 7‐26.
Goldberg, D. E. 1996. Competitive ability: definitions, contingency and correlated traits. Philosophical Transactions of the Royal Society B: Biological Sciences. 351 (1345): 1377‐1385.
Gonzalez, M., Deconchat, M. & Balent, G. 2009. Woody plant composition of forest layers: The importance of environmental conditions and spatial configuration. Plant Ecology. 201 (1): 305‐318.
Gordo, O. & Sanz, J. 2005. Phenology and climate change: a long‐term study in a Mediterranean locality. Oecologia. 146 (3): 484‐495.
Gordon, C., Cooper, C., Senior, C. A., et al. 2000. The simulation of SST, sea ice extents and ocean heat transports in a version of the Hadley Centre coupled model without flux adjustments. Climate Dynamics. 16 (2 ‐ 3): 147‐168.
Greenwood, M. S., Livingston, W. H., Day, M. E., et al. 2002. Contrasting modes of survival by jack and pitch pine at a common range limit. Canadian Journal of Forest Research. 32 (9): 1662‐1674.
Griffiths, R. A., Sewell, D. & McCrea, R. S. 2010. Dynamics of a declining amphibian metapopulation: Survival, dispersal and the impact of climate. Biological Conservation. 143 (2): 485‐491.
84

Grime, J. P. 1977. Evidence for the existence of three primary strategies in plants and its relevance to ecological and evolutionary theory. American Naturalist. 111 (982): 1169‐1194.
Grime, J. P. 1997. Biodiversity and Ecosystem Function: The Debate Deepens. Science. 277 (5330): 1260‐1261.
Grime, J. P. 1998. Benefits of plant diversity to ecosystems: immediate, filter and founder effects. Journal of Ecology. 86 (6): 902‐910.
Grime, J. P. 2001. Plant strategies, vegetation processes and ecosystem properties. Chichester, Enlgand: Wiley.
Grime, J. P., Fridley, J. D., Askew, A. P., et al. 2008. Long‐term resistance to simulated climate change in an infertile grassland. Proceedings of the National Academy of Sciences of the United States of America. 105 (29): 10028‐10032.
Grime, J. P., Hodgson, J. & Hunt, R. 2007. Comparative Plant Ecology: a functional approach to common British species. Dalbeattie: Castlepoint Press.
Gross, N., Suding, K. N. & Lavorel, S. 2007. Leaf dry matter content and lateral spread predict response to land use change for six subalpine grassland species. Journal of Vegetation Science. 18 (2): 289‐300.
Guisan, A., Lehmann, A., Ferrier, S., et al. 2006. Making better biogeographical predictions of species' distributions. Journal of Applied Ecology. 43 (3): 386‐392.
Guisan, A. & Thuiller, W. 2005. Predicting species distribution: offering more than simple habitat models. Ecology Letters. 8 (9): 993‐1009.
Guisan, A. & Zimmermann, N. E. 2000. Predictive habitat distribution models in ecology. Ecological Modelling. 135 (2‐3): 147‐186.
Guisan, N., Weiss, S. B. & Weiss, A. D. 1999. GLM versus CCA spatial modeling of plant species distribution. Plant Ecology. 143 (1): 107‐122.
Gurnell, J. & Pepper, H. 1993. A critical look at conserving the British Red Squirrel Sciurus vulgaris. Mammal Review. 23 (3‐4): 127‐137.
Hagerman, S., Dowlatabadi, H., Chan, K. M. A., et al. 2009. Integrative propositions for adapting conservation policy to the impacts of climate change. Global Environmental Change. 20 (2): 351‐362
Hagerman, S., Dowlatabadi, H., Satterfield, T., et al. 2010. Expert views on biodiversity conservation in an era of climate change. Global Environmental Change. 20 (1): 192‐207.
Halpin, P. N. 1997. Global climate change and natural‐area protection: Management responses and research directions. Ecological Applications. 7 (3): 828‐843.
Hamilton, M. B. 1994. Ex‐Situ Conservation of Wild Plant‐Species ‐ Time to Reassess the Genetic Assumptions and Implications of Seed Banks. Conservation Biology. 8 (1): 39‐49.
Hampe, A. 2004. Bioclimate envelope models: what they detect and what they hide. Global Ecology and Biogeography. 13 (5): 469‐471.
Hampe, A. & Petit, R. J. 2005. Conserving biodiversity under climate change: the rear edge matters. Ecology Letters. 8 (5): 461‐467.
Hannah, L. 2010. A global conservation system for climate‐change adaptation: Special section. Conservation Biology. 24 (1): 70‐77.
Hannah, L., Midgley, G. F., Andelman, S., et al. 2007. Protected area needs in a changing climate. Frontiers In Ecology and The Environment. 5 (3): 131‐138.
Hanspach, J., Kühn, I., Pompe, S., et al. 2010. Predictive performance of plant species distribution models depends on species traits. Perspectives in Plant Ecol, Evol and Systematics. 12 (3): 219‐225.
Harris, J., Hobbs, R., Higgs, E., et al. 2006. Ecological Restoration and Global Climate Change. Restoration Ecology. 14 (2): 170‐176.
85

Harrison, P. A., Berry, P. M. & Dawson, T. 2001. Climate change and nature conservation in Britain and Ireland: modelling natural resource responses to climate change (the MONARCH project). Oxford: UKCIP.
Harte, J., Torn, M. S., Chang, F., et al. 1995. Global warming and soil microclimate: results from a meadow‐warming experiment. Ecological Applications. 5 (1): 132‐150.
Hawes, C. 2004.The Stag Beetle Lucanus cervus (L.) (Coleoptera: Lucanidae) in the County of Suffolk (England): Distribution and Monitoring. In Proceedings of the 3rd Symposium and Workshop on the Conservation of Saproxylic Beetles Riga, Latvia.
Heikkinen, R. K., Luoto, M., Araújo, M. B., et al. 2006. Methods and uncertainties in bioclimatic envelope modelling under climate change. Progress in Physical Geography. 30 (6): 751‐777.
Heikkinen, R. K., Luoto, M., Virkkala, R., et al. 2007. Biotic interactions improve prediction of boreal bird distributions at macro‐scales. Global Ecology and Biogeography. 16 (6): 754‐763.
Heinimann, H. R. 2010. A concept in adaptive ecosystem management‐An engineering perspective. Forest Ecology and Management. 259 (4): 848‐856.
Heino, J., Mykra, H., Kotanen, J., et al. 2007. Ecological filters and variability in stream macroinvertebrate communities: do taxonomic and functional structure follow the same path? Ecography. 30 (2): 217‐230.
Heller, N. E. & Zavaleta, E. S. 2008. Biodiversity management in the face of climate change: A review of 22 years of recommendations. Biological Conservation. 142 (1): 14‐32.
Herbst, M., Roberts, J. M., Rosier, P., et al. 2007. Edge effects and forest water use: A field study in a mixed deciduous woodland. Forest Ecology and Management. 250 (3): 176‐186.
Hernandez, P. A., Graham, C., Master, L., et al. 2006. The effect of sample size and species characteristics on performance of different species distribution modeling methods. Ecography. 29 (5): 773‐785.
Hickling, R., Roy, D. B., Hill, J., et al. 2006. The distributions of a wide range of taxonomic groups are expanding polewards. Global Change Biology. 12 (3): 450‐455.
Hijmans, R. J. & Graham, C. H. 2006. The ability of climate envelope models to predict the effect of climate change on species distributions. Global Change Biology. 12 (12): 2272‐2281.
Hilbert, D. W. & Ostendorf, B. 2001. The utility of artificial neural networks for modelling the distribution of vegetation in past, present and future climates. Ecological Modelling. 146 (1‐3): 311‐327.
Hill, M. O., Preston, C. D. & Roy, D. B. 2004. PLANTATTR ‐ attributes of British and Irish Plants: status, size, life history, geography and habitats. Huntingdon: Centre for Ecology and Hydrology.
Hodder, K. H. & Bullock, J. M. 1997. Translocations of native species in the UK: Implications for biodiversity. Journal of Applied Ecology. 34 (3): 547‐565.
Hodgson, J., Wilson, P. J., Hunt, R., et al. 1999. Allocating C‐S‐R plant functional types: a soft approach to a hard problem. Oikos. 85 (2): 282‐294.
Hoegh‐Guldberg, O., Hughes, L., McIntyre, S., et al. 2008. Assisted colonization and rapid climate change. Science. 321 (5887): 345.
Holdridge, L. R. 1947. Determination of world plant formations from simple climatic data. Science. 105: 367‐368.
Hooper, D. U., Chapin III, F. S., Ewel, J. J., et al. 2005. Effects of biodiversity on ecosystem functioning: A consensus of current knowledge. Ecological Monographs. 75 (1): 3‐35.
Hooper, D. U. & Vitousek, P. M. 1997. The Effects of Plant Composition and Diversity on Ecosystem Processes. Science. 277 (5330): 1302‐1305.
86

Hopkins, J. J., Allison, H., Walmsley, C., et al. 2007. Conserving biodiversity in a changing climate: guidance on building capacity to adapt. London: Defra.
Hossell, J. E., Ellis, N. E., Harley, M. J., et al. 2003. Climate change and nature conservation: Implications for policy and practice in Britain and Ireland. Journal for Nature Conservation. 11 (1): 67‐73.
Huang, D. 2008. Assisted Colonization Won't Help Rare Species. Science. 322 (5904): 1049. Hubbell, S. P. 2005. Neutral theory in community ecology and the hypothesis of functional
equivalence. Functional Ecology. 19 (1): 166‐172. Hubert, J. & Cottrell, J. 2007. The Role of Forest Genetic Resources in Helping British Forests
Respond to Climate Change. Edinburgh: Forestry Commission. Hughes, A., Inouye, B., Johnson, M., et al. 2008a. Ecological consequences of genetic diversity.
Ecology Letters. 11 (6): 609‐623. Hughes, G. O., Thuiller, W., Midgley, G. F., et al. 2008b. Environmental change hastens the demise
of the critically endangered riverine rabbit (Bunolagus monticulairis). Biological Conservation. 141 (1): 23‐34.
Hughes, J. 2006. A review of wood ants (Hymenoptera: Formicidae) in Scotland. Inverness: Scottish Natural Heritage Commissioned Report No. 178.
Hughes, J. & Broome, A. 2007 Forests and Word Ants in Scotland. Forestry Commission Information Note.
Hughes, L. 2000. Biological consequences of global warming: is the signal already apparent? Trends in Ecology and Evolution. 15 (2): 56‐61.
Hulme, M., Turnpenny, J. & Jenkins, G. 2002. Climate Change Scenarios for the United Kingdom: The UKCIP02 Briefing Report. Norwich: Tyndall Centre for Climate Change Research.
Hulme, P. E. 2005. Adapting to climate change: is there scope for ecological management in the face of a global threat? Journal of Applied Ecology. 42 (5): 784‐794.
Huntley, B., Berry, P. M., Cramer, W., et al. 1995. Modelling present and potential future ranges of some European higher plants using climate response surfaces. Journal of Biogeography. 22 (6): 967‐1001.
Huntley, B., Collingham, Y., Willis, S., et al. 2008. Potential Impacts of Climatic Change on European Breeding Birds. PLoS ONE. 3 (1): e1439.
Hyvönen, R., Agren, G. I., Linder, S., et al. 2007. The likely impact of elevated [CO2], nitrogen deposition, increased temperature and management on carbon sequestration in temperate and boreal forest ecosystems: a literature review. New Phytologist. 173 (3): 463‐480.
Ings, T. C., Montoya, J. M., Bascompte, J., et al. 2009. Ecological networks ‐ beyond food webs. Journal of Animal Ecology. 78 (1): 253‐269.
Inouye, D., Barr, B., Armitage, K., et al. 2000. Climate change is affecting altitudinal migrants and hibernating species. Proceedings of the National Academy of Sciences of the United States of America. 97 (4): 1630‐1633.
Iverson, L., Prasad, A. & Matthews, S. 2008. Modeling potential climate change impacts on the trees of the northeastern United States. Mitigation and Adaptation Strategies for Global Change. 13 (5‐6): 487‐516.
Jackson, S. T. & Williams, J. W. 2004. Modern analogs in Quaternary paleoecology: Here today, gone yesterday, gone tomorrow? Annual Review of Earth and Planetary Sciences. 32: 495‐537.
Jansen, E., Overpeck, J., Briffa, K., et al. 2008. Palaeoclimate. In: Climate Change 2007: The Physical Science Basis. Contribution of Working Group I to the Fourth Assessment Report of the
87
Intergovernmental Panel on Climate Change. (ed. by Solomon, S., Qin, D., Manning, M., et al.). Cambridge: Cambridge University Press. pp 66.
Jenkins, G. J., Murphy, J. M., Sexton, D., et al. 2009. UK Climate Projections: Briefing report. London: Defra.
Jiguet, F., Gadot, A., Julliard, R., et al. 2007. Climate envelope, life history traits and the resilience of birds facing global change. Global Change Biology. 13 (8): 1672‐1684.
Jump, A. S., Hunt, J. M. & Penuelas, J. 2006. Rapid climate change‐related growth decline at the southern range edge of Fagus sylvatica. Global Change Biology. 12 (11): 2163‐2174.
Jump, A. S., Hunt, J. M. & Penuelas, J. 2007. Climate relationships of growth and establishment across the altitudinal range of Fagus sylvatica in the Montseny Mountains, northeast Spain. Ecoscience. 14 (4): 507‐518.
Jump, A. S. & Penuelas, J. 2005. Running to stand still: adaptation and the response of plants to rapid climate change. Ecology Letters. 8 (9): 1010‐1020.
Kadmon, R., Farber, O. & Danin, A. 2003. A systematic analysis of factors affecting the performance of climatic envelope models. Ecological Applications. 13 (3): 853‐867.
Keddy, P. 1992. Assembly and response rules: two goals for predictive community ecology. Journal of Vegetation Science. 3 (2): 157‐164.
Keddy, P. & Weiher, E. 1999. Assembly rules as general constraints on community composition. Ecological assembly rules: perspectives, advances, retreats. 251‐271.
Keith, D., Holman, L., Rodoreda, S., et al. 2007. Plant functional types can predict decade‐scale changes in fire‐prone vegetation. Journal of Ecology. 95 (6): 1324‐1337.
Kelly, D. & Sork, V. 2002. Mast seeding in perennial plants: Why, how, where? Annual Review of Ecology and Systematics. 33: 427‐447.
Kent, M. & Coker, P. 1992. Vegetation description and analysis ‐ a practical approach. Chichester: John Wiley & Sons.
Kirby, K. J. 2009. Guidance on dealing with the changing distribution of tree species. Natural England Technical Information Note TIN053. 1‐10.
Kirilenko, A. P. & Sedjo, R. A. 2007. Climate change impacts on forestry. Proceedings of the National Academy of Sciences of the United States of America. 104 (50): 19697‐19702.
Kissling, W. D., Field, R., Korntheuer, H., et al. 2010. Woody plants and the prediction of climate‐change impacts on bird diversity. Philosophical Transactions of the Royal Society B: Biological Sciences. 365 (1549): 2035‐2045.
Klanderud, K. & Birks, H. J. B. 2003. Recent increases in species richness and shifts in altitudinal distributions of Norwegian mountain plants. Holocene. 13 (1): 1‐6.
Kleijn, D., Baquero, R., Clough, Y., et al. 2006. Mixed biodiversity benefits of agri‐environment schemes in five European countries. Ecology Letters. 9 (3): 243‐254.
Kleyer, M., Bekker, R., Knevel, I., et al. 2008. The LEDA Traitbase: a database of life‐history traits of the Northwest European flora. Journal of Ecology. 96 (6): 1266–1274.
Klimes, L. & Klimesova, J. 1999. CLO‐PLA2 ‐ a database of clonal plants in central Europe. Plant Ecology. 141 (1‐2): 9‐19.
Knight, D. H. & Loucks, O. L. 1969. A quantitative analysis of Wisconsin forest vegetation on the basis of plant function and gross morphology. Ecology. 50 (2): 219‐234.
Koenig, W. & Knops, J. 2005. The mystery of masting in trees. American Scientist. 93 (4): 340‐347. Kohn, D. D., Hulme, P. E., Hollingsworth, P. M., et al. 2009. Are native bluebells (Hyacinthoides
non‐scripta) at risk from alien congenerics? Evidence from distributions and co‐occurrence in Scotland. Biological Conservation. 142 (1): 61‐74.
88

Kramer, K., Buiteveld, J., Forstreuter, M., et al. 2008. Bridging the gap between ecophysiological and genetic knowledge to assess the adaptive potential of European beech. Ecological Modelling. 216 (3‐4): 333‐353.
Kramer, K., Degen, B., Buschbom, J., et al. 2010. Modelling exploration of the future of European beech (Fagus sylvatica L.) under climate change‐Range, abundance, genetic diversity and adaptive response. Forest Ecology and Management. 259 (11): 2213‐2222.
Kühn, I., Durka, W. & Klotz, S. 2004. BiolFlor ‐ a new plant‐trait database as a tool for plant invasion ecology. Diversity and Distributions. 10 (5‐6): 363‐365.
Kullman, L. 2002. Rapid recent range‐margin rise of tree and shrub species in the Swedish Scandes. Journal of Ecology. 90 (1): 68‐77.
Kuparinen, A., Savolainen, O. & Schurr, F. M. 2010. Increased mortality can promote evolutionary adaptation of forest trees to climate change. Forest Ecology and Management. 259 (5): 1003‐1008.
Lacaze, J. 2000. Forest management for recreation and conservation: new challenges. Forestry. 73 (2): 137.
Lambdon, P. W. & Hulme, P. E. 2006. Predicting the invasion success of Mediterranean alien plants from their introduction characteristics. Ecography. 29 (6): 853‐865.
Lasch, P., Lindner, M., Erhard, M., et al. 2002. Regional impact assessment on forest structure and functions under climate change‐‐the Brandenburg case study. Forest Ecology and Management. 162 (1): 73‐86.
Lavergne, S., Mouquet, N., Thuiller, W., et al. 2010. Biodiversity and Climate Change: Integrating Evolutionary and Ecological Responses of Species and Communities. Annual Review of Ecology, Evolution, and Systematics. 41: 321‐350.
Lavorel, S., Díaz, S., Cornelissen, J. H. C., et al. 2007. Plant functional types: are we getting any closer to the Holy Grail? In: Terrestrial ecosystems in a changing world. (ed. by Canadell, J. G., Pataki, D. E. & Pitelka, L. F.). Berlin: Springer. pp 149‐164.
Lavorel, S. & Garnier, E. 2002. Predicting changes in community composition and ecosystem functioning from plant traits: revisiting the Holy Grail. Functional Ecology. 16 (5): 545‐556.
Lavorel, S., Grigulis, K., Lamarque, P., et al. 2011. Using plant functional traits to understand the landscape distribution of multiple ecosystem services. Journal of Ecology. 99 (1): 135‐147.
Lavorel, S., Grigulis, K., McIntyre, S., et al. 2008. Assessing functional diversity in the field ‐ methodology matters! Functional Ecology. 22 (1): 134‐147.
Lebourgeois, F., Rathgeber, C. B. K. & Ulrich, E. 2010. Sensitivity of French temperate coniferous forests to climate variability and extreme events (Abies alba, Picea abies and Pinus sylvestris). Journal of Vegetation Science. 21 (2): 364‐376.
Lehsten, V. & Kleyer, M. 2007. Turnover of plant trait hierarchies in simulated community assembly in response to fertility and disturbance. Ecological Modelling. 203 (3‐4): 270‐278.
Lek, S. & Guégan, J. 1999. Artificial neural networks as a tool in ecological modelling, an introduction. Ecological Modelling. 120 (2‐3): 65‐73.
Lemke, P., Ren, J., Alley, R., et al. 2007. Observations: Changes in Snow, Ice and Frozen Ground. In: Climate Change 2007: The Physical Science Basis. Contribution of Working Group I to the Fourth Assessment Report of the Intergovernmental Panel on Climate Change. (ed. by Solomon, S., Qin, D., Manning, M., et al.). Cambridge: Cambridge University Press. pp 48.
Lenoir, J., Gégout, J. C., Dupouey, J. L., et al. 2010. Forest plant community changes during 1989‐2007 in response to climate warming in the Jura Mountains (France and Switzerland). Journal of Vegetation Science. no‐no.
89
Lepetz, V., Massot, M., Schmeller, D., et al. 2009. Biodiversity monitoring: Some proposals to adequately study species' responses to climate change. Biodiversity and Conservation. 18 (12): 3185‐3203.
Lepš, J., de Bello, F. D., Lavorel, S., et al. 2006. Quantifying and interpreting functional diversity of natural communities: practical considerations matter. Preslia. 78 (4): 481‐501.
Leverenz, J. W., Bruhn, D. & Saxe, H. 1999. Responses of two provenances of Fagus sylvatica seedlings to a combination of four temperature and two CO2 treatments during their first growing season: gas exchange of leaves and roots. New Phytologist. 144 (3): 437‐454.
Liley, D. & Clarke, R. T. 2003. The impact of urban development and human disturbance on the numbers of nightjar Caprimulgus europaeus on heathlands in Dorset, England. Biological Conservation. 114 (2): 219‐230.
Lindenmayer, D. B., Hobbs, R., Montague‐Drake, R., et al. 2008. A checklist for ecological management of landscapes for conservation. Ecology Letters. 11 (1): 78‐91.
Lindner, M., Maroschek, M., Netherer, S., et al. 2010. Climate change impacts, adaptive capacity, and vulnerability of European forest ecosystems. Forest Ecology and Management. 259 (4): 698‐709.
Lischke, H., Zimmermann, N. E., Bolliger, J., et al. 2006. TreeMig: A forest‐landscape model for simulating spatio‐temporal patterns from stand to landscape scale. Ecological Modelling. 199 (4): 409‐420.
Lloret, F., Medail, F., Brundu, G., et al. 2004. Local and regional abundance of exotic plant species on Mediterranean islands: are species traits important? Global Ecology and Biogeography. 13 (1): 37‐45.
Lloret, F., Peñuelas, J. & Estiarte, M. 2005. Effects of vegetation canopy and climate on seedling establishment in Mediterranean shrubland. Journal of Vegetation Science. 16 (1): 67‐76.
Lloret, F., Peñuelas, J., Prieto, P., et al. 2009. Plant community changes induced by experimental climate change: Seedling and adult species composition. Perspectives in Plant Ecology, Evolution and Systematics. 11 (1): 53‐63.
Loreau, M. 2000. Biodiversity and ecosystem functioning: Recent theoretical advances. Oikos. 91 (1): 3‐17.
Loreau, M., Naeini, S. A. R. M., Inchausti, P., et al. 2001. Biodiversity and Ecosystem Functioning: Current Knowledge and Future Challenges. Science. 294 (5543): 804‐808.
Luck, G. W., Harrington, R., Harrison, P. A., et al. 2009. Quantifying the Contribution of Organisms to the Provision of Ecosystem Services. Bioscience. 59 (3): 223‐235.
Mabry, C. & Fraterrigo, J. M. 2009. Species traits as generalized predictors of forest community response to human disturbance. Forest Ecology and Management. 257 (2): 723‐730.
MacArthur, R. H. & Wilson, E. O. 1967. The Theory of Island Biodiversity. Princeton, New Jersey: Princeton University Press.
Machtans, C. S., Villard, M. A. & Hannon, S. J. 1996. Use of riparian buffer strips as movement corridors by forest birds. Conservation Biology. 10 (5): 1366‐1379.
Maciver, D. C. & Wheaton, E. 2005. Tomorrow's forests: Adapting to a changing climate. Climatic Change. 70 (1‐2): 273‐282.
Maddock, A. (Ed) (2010). UK Biodiversity Action Plan; Priority Habitat Descriptions. Peterborough: Biodiversity Reporting and Information Group.
Maj, R., Mathilda, E. & Henrik, G. S. 2010. Organic farming at local and landscape scales benefits plant diversity. Ecography. 33 (3): 514‐522.
Manel, S., Williams, H. C. & Ormerod, S. J. 2001. Evaluating presence‐absence models in ecology: the need to account for prevalence. Journal of Applied Ecology. 38 (5): 921‐931.
90
Marini, L., Scotton, M., Klimek, S., et al. 2007. Effects of local factors on plant species richness and composition of Alpine meadows. Agriculture, Ecosystems and Environment. 119 (3‐4): 281‐288.
Marttila, V., Granholm, H., Laanikari, J., et al. 2005. Finland’s National Strategy for Adaptation to Climate Change. Helsinki: Ministry of Agriculture and Forestry of Finland.
Mason, N. W. H., Mouillot, D., Lee, W. G., et al. 2005. Functional richness, functional evenness and functional divergence: the primary components of functional diversity. Oikos. 111 (1): 112‐118.
Masters, G. J., Brown, V., Green, R., et al. 2001. Effects of experimental manipulation of climate on calcareous grasssland plants and invertebrates. Impacts of climate change on wildlife. 57‐59.
Maunder, M., Higgens, S. & Culham, A. 2001. The effectiveness of botanic garden collections in supporting plant conservation: a European case study. Biodiversity and Conservation. 10 (3): 383‐401.
McCarty, J. P. 2001. Ecological consequences of recent climate change. Conservation Biology. 15 (2): 320‐331.
McCune, B. 1997. Influence of noisy environmental data on canonical correspondence analysis. Ecology. 78 (8): 2617‐2623.
McGill, B. J., Enquist, B., Weiher, E., et al. 2006. Rebuilding community ecology from functional traits. Trends in Ecology and Evolution. 21 (4): 178‐185.
McInnes, C. 2006. Mechanisms of immune evasion by Orf virus and the identification of virulence genes. http://www.mri.sari.ac.uk/virology‐reports‐03.asp
McLaren, J. R. & Turkington, R. 2010. Ecosystem properties determined by plant functional group identity. Journal of Ecology. 98 (2): 459‐469.
McLean, I. 2003. A Policy for Conservation Translocations of Species in Britain. Peterborough: Natural England.
Meier, E. S., Edwards, T. C., Kienast, F., et al. 2011. Co‐occurrence patterns of trees along macro‐climatic gradients and their potential influence on the present and future distribution of Fagussylvatica L. Journal of Biogeography. 38 (2): 371‐382.
Meier, I. & Leuschner, C. 2008. Genotypic variation and phenotypic plasticity in the drought response of fine roots of European beech. Tree Physiology. 28 (2): 297‐309.
Memmott, J., Carvell, C., Pywell, R. F., et al. 2010. The potential impact of global warming on the efficacy of field margins sown for the conservation of bumble‐bees. Philosophical Transactions of the Royal Society B‐Biological Sciences. 365 (1549): 2071‐2079.
Memmott, J., Craze, P. G., Waser, N. M., et al. 2007. Global warming and the disruption of plant‐pollinator interactions. Ecology Letters. 10 (8): 710‐717.
Menzel, A., Sparks, T. H., Estrella, N., et al. 2006. European phenological response to climate change matches the warming pattern. Global Change Biology. 12 (10): 1969‐1976.
Merckx, T., Feber, R., Riordan, P., et al. 2009. Optimizing the biodiversity gain from agri‐environment schemes. Agriculture, Ecosystems and Environment. 130 (3‐4): 177‐182.
Millar, C., Stephenson, N. & Stephens, S. 2007. Climate change and forests of the future: Managing in the face of uncertainty. Ecological Applications. 17 (8): 2145‐2151.
Millennium Ecosystem Assessement 2005. Ecosystems and human well‐being: biodiversity synthesis. Washington, DC: Island Press.
Minteer, B. A. & Collins, J. P. 2010. Move it or lose it? the ecological ethics of relocating species under climate change. Ecological Applications. 20 (7): 1801‐1804.
91

Mokany, K., Ash, J. & Roxburgh, S. 2008. Functional identity is more important than diversity in influencing ecosystem processes in a temperate native grassland. Journal of Ecology. 96 (5): 884‐893.
Moles, A. T., Gruber, M. A. M. & Bonser, S. P. 2008. A new framework for predicting invasive plant species. Journal of Ecology. 96 (1): 13‐17.
Monserud, R. A. 1990. Methods for Comparing Global Vegetation Maps. WP‐90‐40, IIASA, Luxembourg.
Montoya, J. M. & Raffaelli, D. 2010. Climate change, biotic interactions and ecosystem services. Philosophical Transactions of the Royal Society B: Biological Sciences. 365 (1549): 2013‐2018.
Moore, P. D. 2005. Palaeoecology: down to the woods yesterday. Nature. 433 (7026): 588‐589. Morecroft, M. D., Masters, G. J., Brown, V., et al. 2004. Changing precipitation patterns alter plant
community dynamics and succession in an ex‐arable grassland. Functional Ecology. 18 (5): 648‐655.
Morecroft, M. D. & Paterson, J. S. 2006. Effects of temperature and precipitation changes on plant communities. In: Plant growth and climate change. (ed. by Morison, J. I. L. & Morecroft, M. D.). Oxford: Blackwells. pp 146‐164.
Moretti, M. & Legg, C. 2006. Predictive value of plant and animal traits to fire. Forest Ecology and Management. 234 (Supplement 1): S164.
Morin, X., Augspurger, C. & Chuine, I. 2007. Process‐based modeling of species' distributions: What limits temperate tree species' range boundaries? Ecology. 88 (9): 2280‐2291.
Morris, R. J. 2010. Anthropogenic impacts on tropical forest biodiversity: a network structure and ecosystem functioning perspective. Philosophical Transactions of the Royal Society B‐Biological Sciences. 365 (1558): 3709‐3718.
Moss, R. 1994. Decline of capercaillie (Tetrao urogallus) in Scotland. Gibier Faune Sauvage. 11 (HS2): 217–222.
Moss, R., Oswald, J. & Baines, D. 2001. Climate change and breeding success: Decline of the capercaillie in Scotland. Journal of Animal Ecology. 70 (1): 47‐61.
Moss, R., Picozzi, N., Summers, R. W., et al. 2000. Capercaillie Tetrao urogallus in Scotland ‐ Demography of a declining population. Ibis. 142 (2): 259‐267.
Mouillot, D., Mason, N. W. H. & Wilson, J. B. 2007. Is the abundance of species determined by their functional traits? A new method with a test using plant communities. Oecologia. 152 (4): 729‐737.
Mountford, E., Peterken, G. F., Edwards, P., et al. 1999. Long‐term change in growth, mortality and regeneration of trees in Denny Wood, an old‐growth wood‐pasture in the New Forest (UK). Perspectives in Plant Ecology, Evolution and Systematics. 2 (2): 223‐272.
Mouritsen, K. N., Tompkins, D. M. & Poulin, R. 2005. Climate warming may cause a parasite‐induced collapse in coastal amphipod populations. Oecologia. 146 (3): 476‐483.
Murphy, J. M., Sexton, D. M. H., Jenkins, G. J., et al. 2009. UK climate projections science report: Climate change projections. Exeter, UK: Meteorological Office Hadley Centre.
Nabuurs, G. J., Schelhaas, M., Mohrens, G., et al. 2003. Temporal evolution of the European forest sector carbon sink from 1950 to 1999. Global Change Biology. 9 (2): 152‐160.
Nadrowski, K., Wirth, C. & Scherer‐Lorenzen, M. 2010. Is forest diversity driving ecosystem function and service? Current Opinion in Environmental Sustainability. 2: 1‐5.
Nahm, M., Matzarakis, A., Rennenberg, H., et al. 2007. Seasonal courses of key parameters of nitrogen, carbon and water balance in European beech (Fagus sylvatica L.) grown on four different study sites along a European North‐South climate gradient during the 2003 drought. Trees ‐ Structure and Function. 21 (1): 79‐92.
92

Nakićenović, N., Davidson, O., Davis, G., et al. 2009. IPCC Special Report on Emissions Scenarios. Cambridge: Cambridge University Press.
Natural England 2009. Climate Change and Biodiversity Adaptation: The Role of the Spacial Planning System. Peterborough: Natural England.
Nicotra, A. B., Atkin, O. K., Bonser, S. P., et al. 2010. Plant phenotypic plasticity in a changing climate. Trends in Plant Science. 15 (12): 684‐692.
Niinemets, U. & Valladares, F. 2006. Tolerance to shade, drought, and waterlogging of temperate Northern Hemisphere trees and shrubs. Ecological Monographs. 76 (4): 521‐547.
Noss, R. F. 2001. Beyond Kyoto: forest management in a time of rapid climate change. Conservation Biology. 15 (3): 578‐590.
O'Brien, E. K., Mazanec, R. A. & Krauss, S. L. 2007. Provenance variation of ecologically important traits of forest trees: implications for restoration. Journal of Applied Ecology. 44 (3): 583‐593.
Occhipinti‐Ambrogi, A. 2007. Global change and marine communities: Alien species and climate change. Marine Pollution Bulletin. 55 (7‐9): 342‐352.
Öckinger, E. & Smith, H. G. 2008. Do corridors promote dispersal in grassland butterflies and other insects? Landscape Ecology. 23 (1): 27‐40.
Opdam, P. & Wascher, D. 2004. Climate change meets habitat fragmentation: linking landscape and biogeographical scale levels in research and conservation. Biological Conservation. 117 (3): 285‐297.
Övergaard, R., Gemmel, P. & Karlsson, M. 2007. Effects of weather conditions on mast year frequency in beech (Fagus sylvatica L.) in Sweden. Forestry. 80 (5): 555‐565.
Oyarzabal, M., Paruelo, J. M., del, P., F, et al. 2008. Trait differences between grass species along a climatic gradient in South and North America. Journal of Vegetation Science. 19 (2): 183‐U181.
Paço, T., David, T., Henriques, M., et al. 2009. Evapotranspiration from a Mediterranean evergreen oak savannah: The role of trees and pasture. Journal of Hydrology. 369 (1‐2): 98‐106.
Pakeman, R. 2004. Consistency of plant species and trait responses to grazing along a productivity gradient: a multi‐site analysis. Journal of Ecology. 92 (5): 893‐905.
Pakeman, R., Garnier, E., Lavorel, S., et al. 2008. Impact of abundance weighting on the response of seed traits to climate and land use. Journal of Ecology. 96 (2): 355‐366.
Palmer, S. C. F. & Truscott, A. M. 2003. Seasonal habitat use and browsing by deer in Caledonian pinewoods. Forest Ecology and Management. 174 ((1‐3)): 149‐166.
Parmesan, C. 2006. Ecological and evolutionary responses to recent climate change. Annual Review Of Ecology Evolution and Systematics. 37: 637‐669.
Parmesan, C. 2007. Influences of species, latitudes and methodologies on estimates of phenological response to global warming. Global Change Biology. 13 (9): 1860‐1872.
Parmesan, C. & Yohe, G. 2003. A globally coherent fingerprint of climate change impacts across natural systems. Nature. 421 (6918): 37‐42.
Paterson, J. S., Araújo, M. B., Berry, P. M., et al. 2008. Mitigation, adaptation, and the threat to biodiversity. Conservation Biology. 22 (5): 1352‐1355.
Peach, W. J., Robinson, R. A. & Murray, K. A. 2004. Demographic and environmental causes of the decline of rural Song Thrushes Turdus philomelos in lowland Britain. Ibis. 146 (SUPPL. 2): 50‐59.
Pearce‐Higgins, J. W. 2010. Using diet to assess the sensitivity of northern and upland birds to climate change. Climate Research. 45 (1): 119‐130.
Pearman, P. B., Randin, C., Broennimann, O., et al. 2008. Prediction of plant species distributions across six millennia. Ecology Letters. 11 (4): 357‐369.
93

Pearson, R. G., Dawson, T., Berry, P. M., et al. 2002. SPECIES: A Spatial Evaluation of Climate Impact on the Envelope of Species. Ecological Modelling. 154 (3): 289‐300.
Pearson, R. G., Thuiller, W., Araújo, M. B., et al. 2006. Model‐based uncertainty in species range prediction. Journal of Biogeography. 33 (10): 1704‐1711.
Peñuelas, J. & Boada, M. 2003. A global change‐induced biome shift in the Montseny mountains (NE Spain). Global Change Biology. 9 (2): 131‐140.
Peñuelas, J., Filella, I. & Comas, P. 2002. Changed plant and animal life cycles from 1952 to 2000 in the Mediterranean region. Global Change Biology. 8 (6): 531‐544.
Peñuelas, J., Ogaya, R., Boada, M., et al. 2007. Migration, invasion and decline: Changes in recruitment and forest structure in a warming‐linked shift of European beech forest in Catalonia (NE Spain). Ecography. 30 (6): 829‐837.
Percy, C., Bassford, G. & Keeble, V. 2000. Findings of the 1998 National Stag Beetle Survey. London.
Persson, B. & Ståhl., E. G. 1990. Survival and yield of Pinus sylvestris L. as related to provenance transfer and spacing at high altitudes in Northern Sweden. Scandinavian Journal of Forest Research. 5: 381‐395.
Petchey, O. L., Brose, U. & Rall, B. C. 2010. Predicting the effects of temperature on food web connectance. Philosophical Transactions of the Royal Society B: Biological Sciences. 365 (1549): 2081‐2091.
Petchey, O. L. & Gaston, K. J. 2002. Functional diversity (FD), species richness and community composition. Ecology Letters. 5 (3): 402‐411.
Petchey, O. L. & Gaston, K. J. 2006. Functional diversity: back to basics and looking forward. Ecology Letters. 9 (6): 741‐758.
Petchey, O. L., Hector, A. & Gaston, K. J. 2004. How do different measures of functional diversity perform? Ecology. 85 (3): 847‐857.
Peterken, G. F. 1981. Woodland conservation and management. London: Chapman & Hall. Peterken, G. F. & Jones, E. W. 1989a. Forty years of change in Lady Park wood: the old growth
stands. Journal of Ecology. 75 (2): 477‐512. Peterken, G. F. & Jones, E. W. 1989b. Forty years of change in Lady Park wood: the young growth
stands. Journal of Ecology. 77 (2): 401‐429. Peterken, G. F. & Mountford, E. 1996. Effects of drought on beech in Lady Park Wood, an
unmanaged mixed deciduous woodland. Forestry. 69 (2): 125‐136. Peterson, A. T. 2003. Projected climate change effects on Rocky Mountain and Great Plains birds:
generalities of biodiversity consequences. Global Change Biology. 9 (5): 647‐655. Peuke, A., Schraml, C., Hartung, W., et al. 2002. Identification of drought‐sensitive beech ecotypes
by physiological parameters. New Phytologist. 154 (2): 373‐387. Phillips, O. L., Aragao, L., Lewis, S., et al. 2009. Drought Sensitivity of the Amazon Rainforest.
Science. 323 (5919): 1344‐1347. Pigott, C. D. 1969. The status of Tilia Cordata and T. Platyphyllos on the Derbyshire Limestone.
Journal of Ecology. 57 (2): 491‐504. Pigott, C. D. 1991. Biological Flora of the British Isles: Tilia cordata Miller. Journal of Ecology. 79
(4): 1147‐1207. Pigott, C. D. & Huntley, J. P. 1978. Factors controlling the distribution of Tilia cordata at the
northern limits of its geographical range. I. Distribution in north‐west England. New Phytologist. 81 (2): 429‐441.
Pigott, C. D. & Huntley, J. P. 1980. Factors controlling the distribution of Tilia cordata at the northern limits of its geographical range. II. History in north‐west England. New Phytologist. 84 (1): 145‐164.
94

Pigott, C. D. & Huntley, J. P. 1981. Factors controlling the distribution of Tilia‐Cordata at the northern limits of its geographical range .III. Nature and causes of seed sterility. New Phytologist. 87 (4): 817‐839.
Pigott, C. D. & Pigott, S. 1993. Water as a determinant of the distribution of trees at the boundary of the mediterranean zone. Journal of Ecology. 81 (3): 557‐566.
Piovesan, G., Biondi, F., di Filippo, A., et al. 2008. Drought‐driven growth reduction in old beech (Fagus sylvatica L.) forests of the central Apennines, Italy. Global Change Biology. 14 (6): 1265‐1281.
Podani, J. & Schmera, D. 2006. On dendrogram‐based measures of functional diversity. Oikos. 115 (1): 179‐185.
Poorter, L., Bongers, F., Sterck, F., et al. 2003. Architecture of 53 rain forest tree species differing in adult stature and shade tolerance. Ecology. 84 (3): 602‐608.
Pope, V. D., Gallani, M. L., Rowntree, P. R., et al. 2000. The impact of new physical parametrizations in the Hadley Centre climate model: HadAM3. Climate Dynamics. 16 (2 ‐ 3): 123‐146.
Poschlod, P., Kleyer, M., Jackel, A., et al. 2003. BIOPOP ‐ a database of plant traits and Internet application for nature conservation. Folia Geobotanica. 38 (3): 263‐271.
Pöyry, J., Luoto, M., Heikkinen, R. K., et al. 2009. Species traits explain recent range shifts of Finnish butterflies. Global Change Biology. 15 (3): 732‐743.
Pöyry, J., Luoto, M., Heikkinen, R. K., et al. 2008. Species traits are associated with the quality of bioclimatic models. Global Ecology and Biogeography. 17 (3): 403‐414.
Pratt, C. R. 2000. An investigation into the status history of the Stag Beetle Lucanus cervus (Linnaeus) (Lucanidae) in Sussex. Coleopterist. 9: 75–90.
Pugnaire, F. I. & Luque, M. T. 2001. Changes in plant interactions along a gradient of environmental stress. Oikos. 93 (1): 42‐49.
Punttila, P. 1996. Succession, forest fragmentation, and the distribution of wood ants. Oikos. 75 (2): 291‐298.
Pyke, C. R. & Fischer, D. T. 2005. Selection of bioclimatically representative biological reserve systems under climate change. Biological Conservation. 121 (3): 429‐441.
Quetier, F., Lavorel, S., Thuiller, W., et al. 2007. Plant‐trait‐based modeling assessment of ecosystem‐service sensitivity to land‐use change. Ecological Applications. 17 (8): 2377‐2386.
Raatikainen, K., Heikkinen, R. K. & Luoto, M. 2009. Relative importance of habitat area, connectivity, management and local factors for vascular plants: Spring ephemerals in boreal semi‐natural grasslands. Biodiversity and Conservation. 18 (4): 1067‐1085.
Rackham, O. 1980. Ancient woodland: its history, vegetation and uses in England. London: Edward Arnold.
Rackham, O. 2006. Woodlands. London: Collins. Rackham, O. 2008. Ancient woodlands: modern threats. New Phytologist. 180 (3): 571‐586. Raftoyannis, Y. & Radoglou, K. 2002. Physiological responses of beech and sessile oak in a natural
mixed stand during a dry summer. Annals of Botany. 89 (6): 723‐730. Randall, D. A., Wood, A., Bony, S., et al. 2007. Climate models and their evaluation. In: Climate
Change 2007: The Physical Science Basis. Contribution of Working Group I to the Fourth Assessment Report of the Intergovernmental Panel on Climate Change. (ed. by Solomon, S., Qin, D., Manning, M., et al.). Cambridge: Cambridge University Press. pp.
Raxworthy, C. J., Pearson, R. G., Rabibisoa, N., et al. 2008. Extinction vulnerability of tropical montane endemism from warming and upslope displacement: a preliminary appraisal for the highest massif in Madagascar. Global Change Biology. 14 (8): 1703–1720.
95

Ray, D. 2001. Ecological Site Classification User's Guide. Edinburgh: Forestry Commission. Ray, D. 2008. Impacts of climate change on forests in Scotland – a preliminary synopsis of spatial
modelling research. Edinburgh: Forestry Commission Research Note 101. Ray, D., Morison, J. & Broadmeadow, M. S. J. 2010. Climate change: impacts and adaptation in
England’s woodlands. Edinburgh: Forest Research. Reader, R. J. 1998. Relationship between species relative abundance and plant traits for an
infertile habitat. Plant Ecology. 134 (1): 43‐51. Reich, P. B. & Oleksyn, J. 2008. Climate warming will reduce growth and survival of Scots pine
except in the far north. Ecology Letters. 11 (6): 588‐597. Reich, P. B., Walters, M. B. & Ellsworth, D. S. 1997. From tropics to tundra: global convergence in
plant functioning. Proceedings of the National Academy of Sciences of the United States of America. 94 (25): 13730‐13734.
Reichlin, T., Klansek, E. & Hackl√§nder, K. 2006. Diet selection by hares (Lepus europaeus) in arable land and its implications for habitat management. European Journal of Wildlife Research. 52 (2): 109‐118.
Reiss, J., Bridle, J. R., Montoya, J. M., et al. 2009. Emerging horizons in biodiversity and ecosystem functioning research. Trends in Ecology and Evolution. 24 (9): 505‐514.
Rennenberg, H., Loreto, F., Polle, A., et al. 2006. Physiological responses of forest trees to heat and drought. Plant Biology. 8 (5): 556‐571.
Rennenberg, H. & Schraml, C. 2002. The different reactions of beech tree (Fagus sylvatica L.) ecotypes to drought stress. European Journal of Forest Research. 121 (2): 59‐72.
Reusch, T. B. H., Ehlers, A., Hammerli, A., et al. 2005. Ecosystem recovery after climatic extremes enhanced by genotypic diversity. Proceedings of the National Academy of Sciences of the United States of America. 102 (8): 2826‐2831.
Ricciardi, A. & Simberloff, D. 2009. Assisted colonization is not a viable conservation strategy. Trends in Ecology and Evolution. 24 (5): 248‐253.
Rich, P. M., Breshears, D. D. & White, A. 2008. Phenology of mixed woody‐herbaceous ecosystems following extreme events: Net and differential responses. Ecology. 89 (2): 342‐352.
Robinson, R. A., Baillie, S. R. & Crick, H. Q. P. 2007. Weather‐dependent survival: Implications of climate change for passerine population processes. Ibis. 149 (2): 357‐364.
Robson, T., Rodríguez‐Calcerrada, J., Sánchez‐Gómez, D., et al. 2009. Summer drought impedes beech seedling performance more in a sub‐Mediterranean forest understory than in small gaps. Tree Physiology. 29 (2): 249‐259.
Rodwell, J. S. (Ed) (1991). British Plant Communities Volume 1: Woodlands and Scrub. Cambridge: Cambridge University Press.
Rodwell, J. S. & Dring, J. 2001. European significance of British woodland types. Peterborough: English Nature.
Root, T. L., Price, J. T., Hall, K. R., et al. 2003. Fingerprints of global warming on wild animals and plants. Nature. 421 (6918): 57‐60.
Rorison, I. H., Sutton, F. & Hunt, R. 1986. Local climate, topography and plant growth in Lathkill Dale NNR. I. A twelve‐year summary of solar radiation and temperature. Plant Cell and Environment. 9 (1): 49‐56.
Rose, L., Leuschner, C., Köckemann, B., et al. 2009. Are marginal beech (Fagus sylvatica L.) provenances a source for drought tolerant ecotypes? European Journal of Forest Research. 1‐9.
Rouault, G., Candau, J., Lieutier, F., et al. 2006. Effects of drought and heat on forest insect populations in relation to the 2003 drought in Western Europe. Annals of Forest Science. 63 (6): 613‐624.
96

Rubidge, E. M. & Monahan, W. B. 2011. The role of climate, habitat, and species co‐occurrence as drivers of change in small mammal distributions over the past century. Global Change Biology. 17 (2): 696‐708.
Rushton, S. P., Lurz, P. W. W., Gurnell, J., et al. 2006. Disease threats posed by alien species: The role of a poxvirus in the decline of the native red squirrel in Britain. Epidemiology and Infection. 134 (3): 521‐533.
Sánchez‐Gómez, D., Zavala, M. A. & Valladares, F. 2008. Functional traits and plasticity linked to seedlings' performance under shade and drought in mediterranean woody species. Annals of Forest Science. 65 (3): 311 p311‐311 p310.
Sanz‐Elorza, M., Dana, E. D., Gonzalez, A., et al. 2003. Changes in the high‐mountain vegetation of the central Iberian peninsula as a probable sign of global warming. Annals of Botany. 92 (2): 273‐280.
Saxe, H. & Kerstiens, G. 2005. Climate change reverses the competitive balance of ash and beech seedlings under simulated forest conditions. Plant Biology. 7 (4): 375‐386.
Scherzinger, W. 2009. The fundamental niche of the Capercaillie Tetrao urogallus. Ornithologischer Anzeiger. 48 (1): 19‐32.
Schieber, B. 2007. Changes of flowering phenology of six herbal species in a beech forest (Central Slovakia): A decade analysis. Polish Journal of Ecology. 55 (2): 233‐244.
Schmidt, W. 2006. Temporal variation in beech masting (Fagus sylvatica L.) in a limestone beech forest (1981‐2004). Allgemeine Forst‐ und Jagdzeitung. 177 (1): 9‐19.
Schroter, D., Cramer, W., Leemans, R., et al. 2005. Ecosystem service supply and vulnerability to global change in Europe. Science. 310 (5752): 1333‐1337.
Sciama, D., Augusto, L., Dupouey, J., et al. 2009. Floristic and ecological differences between recent and ancient forests growing on non‐acidic soils. Forest Ecology and Management. 258 (5): 600‐608.
Scobie, A. R. & Wilcock, C. C. 2009. Limited mate availability decreases reproductive success of fragmented populations of Linnaea borealis, a rare, clonal self‐incompatible plant. Annals of Botany. 103 (6): 835‐846.
Scott, D., Malcolm, J. R. & Lemieux, C. 2002. Climate change and modelled biome representation in Canada's national park system: implications for system planning and park mandates. Global Ecology and Biogeography. 11 (6): 475‐484.
Seppälä, R., Buck, A. & Katila, P. 2009. Adaptation of Forests and People to Climate Change. Helsinki: IUFRO.
Shafer, C. L. 1999. National park and reserve planning to protect biological diversity: some basic elements. Landscape and Urban Planning. 44 (2‐3): 123‐153.
Shar, S., Lkhagvasuren, D., Bertolino, S., et al. 2008.Sciurus vulgaris. In IUCN Red List of Threatened Species, Vol. Version 2010.4: IUCN
Sherry, R. A., Zhou, X., Gu, S., et al. 2007. Divergence of reproductive phenology under climate warming. Proceedings of the National Academy of Sciences of the United States of America. 104 (1): 198‐202.
Shipley, B. 2007. Comparative plant ecology as a tool for integrating across scales. Annals of Botany. 99 (5): 965‐966.
Shipley, B., Vile, D. & Garnier, E. 2006. From plant traits to plant communities: a statistical mechanistic approach to biodiversity. Science. 314 (5800): 812‐814.
Shoo, L. P., Williams, S. E. & Hero, J. 2006. Detecting climate change induced range shifts: Where and how should we be looking? Austral Ecology. 31 (1): 22‐29.
Sier, A. R. J. & Scott, W. A. 2009. Climate change impacts: evidence from ECN sites. London: NERC/Centre for Ecology and Hydrology.
97

Sim, I. M. W., Eaton, M. A., Setchfield, R. P., et al. 2008. Abundance of male Black Grouse Tetrao tetrix in Britain in 2005, and change since 1995‐96. Bird Study. 55: 304‐ 313.
Skelly, D. K., Joseph, L. N., Possingham, H. P., et al. 2007. Evolutionary Responses to Climate Change. Conservation Biology. 21 (5): 1353‐1355.
Smith, M., Mosely, D., Chetcuti, J., et al. 2008. Glasgow and Clyde Valley Integrated Habitat Networks. Roslin: Forest Research.
Smith, R. K., Jennings, N. V. & Harris, S. 2005. A quantitative analysis of the abundance and demography of European hares Lepus europaeus in relation to habitat type, intensity of agriculture and climate. Mammal Review. 35 (1): 1‐24.
Smithers, R., Cowan, C., Harley, M. J., et al. 2008. England Biodiversity Strategy ‐ Climate Change Adaptation Principles Conserving biodiversity in a changing climate. London: Defra.
Sparks, T. 2007. Lateral thinking on data to identify climate impacts. Trends in Ecology and Evolution. 22 (4): 169‐171.
Sparks, T. & Menzel, A. 2002. Observed changes in seasons: an overview. International Journal of Climatology. 22 (14): 1715‐1725.
Sparks, T. H. & Carey, P. D. 1995. The responses of species to climate over two centuries: an analysis of the Marsham Phenological Record, 1736‐1947. Journal of Ecology. 83 (2): 321‐329.
Sparks, T. H., Gill, R. & Broadmeadow, M. S. J. 2002. Climate change and the seasonality of woodland flora and fauna. Edinburgh: Forestry Commission.
Sparks, T. H., Huber, K., Bland, R. L., et al. 2007. How consistent are trends in arrival (and departure) dates of migrant birds in the UK? Journal of Ornithology. 148 (4): 503‐511.
Spies, T. A., Giesen, T. W., Swanson, F. J., et al. 2010. Climate change adaptation strategies for federal forests of the Pacific Northwest, USA: ecological, policy, and socio‐economic perspectives. Landscape Ecology. 25 (8): 1185‐1199.
Sthultz, C. M., Gehring, C. A. & Whitham, T. G. 2007. Shifts from competition to facilitation between a foundation tree and a pioneer shrub across spatial and temporal scales in a semiarid woodland. New Phytologist. 173 (1): 135‐145.
Stockwell, D. R. B. & Peterson, A. T. 2002. Effects of sample size on accuracy of species distribution models. Ecological Modelling. 148 (1): 1‐13.
Stokes, V. & Kerr, G. 2009. The evidence supporting the use of CCF in adapting Scotland's forests to the risks of climate change. Edinburgh: The Forestry Commission.
Studer, A., Thieltges, D. W. & Poulin, R. 2010. Parasites and global warming: net effects of temperature on an intertidal host‐parasite system. Marine Ecology‐Progress Series. 415: 11‐22.
Suding, K. N. & Goldstein, L. J. 2008. Testing the Holy Grail framework: using functional traits to predict ecosystem change. New Phytologist. 180: 559‐562.
Suffling, R. & Scott, D. 2002. Assessment of climate change effects on Canada's National Park system. Environmental Monitoring and Assessment. 74 (2): 117‐139.
Sullivan, G. 200). Extent and condition of juniper scrub in Scotland Contract No. BAT/AC205/01/02/96. Scottish Natural Heritage, Edinburgh.
Summers, R. W. 2007. Stand selection by birds in Scots pinewoods in Scotland: the need for more old‐growth pinewood. Ibis. 149 (S2): 175‐182.
Summers, R. W., Green, R. E., Proctor, R., et al. 2004. An experimental study of the effects of predation on the breeding productivity of capercaillie and black grouse. Journal of Applied Ecology. 41 (3): 513‐525.
98

Summers, R. W., Jardine, D. C., Marquiss, M., et al. 2002. The distribution and habitats of crossbills Loxia spp. in Britain, with special reference to the Scottish Crossbill Loxia scotica. Ibis. 144 (3): 393‐410.
Summers, R. W. & Proctor, R. 1999. Tree and cone selection by crossbills Loxia sp. and red squirrels Sciurus vulgaris at Abernethy forest, Strathspey. Forest Ecology and Management. 118 (1‐3): 173‐182.
Svenning, J. C. & Skov, F. 2004. Limited filling of the potential range in European tree species. Ecology Letters. 7 (7): 565‐573.
Sykes, M. T., Prentice, I. C. & Cramer, W. 1996. A bioclimatic model for the potential distribution of north European tree species under present and future climates. Journal of Biogeography. 23 (2): 203‐233.
Tanaka, R. & Koike, F. 2011. Prediction of species composition of plant communities in a rural landscape based on species traits. Ecological Research. 26 (1): 27‐36.
Tansley, A. G. 1965. The British islands and their vegetation. Cambridge: Cambridge University Press.
Taylor, P. J., Nuberg, I. K. & Hatton, T. J. 2001. Enhanced transpiration in response to wind effects at the edge of a blue gum (Eucalyptus globulus) plantation. Tree Physiology. 21 (6): 403‐408.
Thaxter, C. B., Joys, A. C., Gregory, R. D., et al. 2010. Hypotheses to explain patterns of population change among breeding bird species in England. Biological Conservation. 143 (9): 2006‐2019.
The National Forest 2009. The National Forest Delivery Plan 2009 ‐ 2014. Swadlincote: The National Forest.
Thomas, C. D., Franco, A. & Hill, J. 2006. Range retractions and extinction in the face of climate warming. Trends in Ecology and Evolution. 21 (8): 415‐416.
Thomas, F. M. 2000. Growth and water relations of four deciduous tree species (Fagus sylvatica L., Quercus petraea [MATT.] LIEBL., Q. pubescens WILLD., Sorbus aria [L.] Cr.) occurring at Central‐European tree‐line sites on shallow calcareous soils: physiological reactions of seedlings to severe drought. Flora ‐ Morphology, Distribution, Functional Ecology of Plants. 195 (2): 104‐115.
Thompson, I., Mackey, B., McNulty, S., et al. 2009. Forest Resilience, Biodiversity, and Climate Change. A synthesis of the biodiversity/resilience/stability relationship in forest ecosystems. Montreal: Secretariat of the Convention on Biological Diversity,.
Thompson, K., Band, S. & Hodgson, J. G. 1993. Seed size and shape predict persistence in soil. Functional Ecology. 7 (2): 236‐241.
Thuiller, W., Albert, C., Araújo, M. B., et al. 2008. Predicting global change impacts on plant species’ distributions: Future challenges. Perspectives in Plant Ecology, Evolution and Systematics. 9 (3‐4): 137‐152.
Thuiller, W., Araújo, M. B. & Lavorel, S. 2003. Generalized models vs. classification tree analysis: Predicting spatial distributions of plant species at different scales. Journal of Vegetation Science. 14 (5): 669‐680.
Thuiller, W., Brotons, L., Araújo, M. B., et al. 2004a. Effects of restricting environmental range of data to project current and future species distributions. Ecography. 27 (2): 165‐172.
Thuiller, W., Lavorel, S., Midgley, G. F., et al. 2004b. Relating plant traits and species distributions along bioclimatic gradients for 88 Leucadendron taxa. Ecology. 85 (6): 1688‐1699.
Tilman, D. G. 1985. The Resource‐Ratio Hypothesis of Plant Succession. American Naturalist. 125 (6): 827‐852.
99

Tilman, D. G. 1988. Plant strategies and the dynamics and structure of plant communities. Princeton, New Jersey: Princeton University Press.
Tilman, D. G., Knops, J., Wedin, D., et al. 1997. The Influence of Functional Diversity and Composition on Ecosystem Processes. Science. 277 (5330): 1300‐1302.
Tompkins, E. L. & Adger, W. 2004. Does adaptive management of natural resources enhance resilience to climate change? Ecology and Society. 9 (2): 10.
Traill, L. W., Lim, M. L. M., Sodhi, N. S., et al. 2010. Mechanisms driving change: altered species interactions and ecosystem function through global warming. Journal of Animal Ecology. 79 (5): 937‐947.
Trenberth, K. E., Jones, P., Ambenje, P., et al. 2007. Observations: Surface and Atmospheric Climate Change. In: Climate Change 2007: The Physical Science Basis. Contribution of Working Group I to the Fourth Assessment Report of the Intergovernmental Panel on Climate Change. (ed. by Solomon, S., Qin, D., Manning, M., et al.). Cambridge: Cambridge University Press. pp 102.
Turnbull, L. A., Rees, M. & Crawley, M. J. 1999. Seed mass and the competition/colonization trade‐off: a sowing experiment. Journal of Ecology. 87 (5): 899‐912.
Tylianakis, J. M., Didham, R. K., Bascompte, J., et al. 2008. Global change and species interactions in terrestrial ecosystems. Ecology Letters. 11 (12): 1351‐1363.
Valladares, F. 2008. A mechanistic view of the capacity of forest to cope with climate change. In: Managing forest ecosystems: the challenge of climate change. (ed. by Bravo, F., le May, V., Jandl, R., et al.). Berlin: Springer‐Verlag. pp 11‐35.
Valladares, F. & Sánchez‐Gómez, D. 2006. Ecophysiological traits associated with drought in Mediterranean tree seedlings: Individual responses versus interspecific trends in eleven species. Plant Biology. 8 (5): 688‐697.
van der Putten, W. H., Macel, M. & Visser, M. E. 2010. Predicting species distribution and abundance responses to climate change: why it is essential to include biotic interactions across trophic levels. Philosophical Transactions of the Royal Society B: Biological Sciences. 365 (1549): 2025‐2034.
van der Veken, S., Bellemare, J., Verheyen, K., et al. 2007. Life‐history traits are correlated with geographical distribution patterns of western European forest herb species. Journal of Biogeography. 34 (10): 1723‐1735.
van Vliet, A. J. H., de Groot, R. S., Bellens, Y., et al. 2003. The European Phenology Network. International Journal of Biometeorology. 47 (4): 202‐212.
Verheyen, K., Schreurs, K., Vanholen, B., & Hermy, M. 2005. Intensive management fails to promote recruitment in the last large population of Juniperus communis (L.) in Flanders (Belgium). Biological Conservation, 124, 113‐121.
Verheyen, K., Adriaenssens, S., Gruwez, R., Michalczyk, I. M., Ward, L. K., Rosseel, Y., Van den Broeck, A. & Garcia, D. 2009. Juniperus communis: victim of the combined action of climate warming and nitrogen deposition? Plant Biology, 11, 49‐59.
Vile, D., Shipley, B. & Garnier, E. 2006. Ecosystem productivity can be predicted from potential relative growth rate and species abundance. Ecology Letters. 9 (9): 1061‐1067.
Visser, M. E. & Both, C. 2005. Shifts in phenology due to global climate change: the need for a yardstick. Proceedings of the Royal Society of London. Series B, Biological Sciences. 272 (1581): 2561‐2569.
Visser, M. E. & Holleman, L. J. M. 2001. Warmer springs disrupt the synchrony of oak and winter moth phenology. Proceedings: Biological Sciences. 268 (1464): 289‐294.
Volney, W. J. A. & Fleming, R. A. 2000. Climate change and impacts of boreal forest insects. Agriculture, Ecosystems and Environment. 82 (1‐3): 283‐294.
100

Walker, B., Kinzig, A. & Langridge, J. 1999. Plant attribute diversity, resilience, and ecosystem function: The nature and significance of dominant and minor species. Ecosystems. 2 (2): 95‐113.
Walker, K., Preston, C. & Boon, C. 2009. Fifty years of change in an area of intensive agriculture: plant trait responses to habitat modification and conservation, Bedfordshire, England. Biodiversity and Conservation. 18 (13): 3597‐3613.
Walmsley, C. A., Smithers, R. J., Berry, P. M., et al. 2007. MONARCH ‐ Modelling Natural Resource Responses to Climate Change: A Synthesis for Biodiversity Conservation. Oxford: UKCIP.
Walther, G.‐R. 2010. Community and ecosystem responses to recent climate change. Philosophical Transactions of the Royal Society B: Biological Sciences. 365 (1549): 2019‐2024.
Walther, G. R., Beißner, S. & Burga, C. A. 2005. Trends in the upward shift of alpine plants. Journal of Vegetation Science. 16 (5): 541‐548.
Ward, L. K. 1982. The conservation of juniper: longevity and old age. Journal of Applied Ecology, 19, 917‐928.
Ward, L. K. 1973. The Conservation of Juniper. I. Present Status of Juniper in Southern England. Journal of Applied Ecology, 10, 165‐188.
Ward, L. K. & King, M. 2006. Decline of juniper in Sussex. Quarterly Journal of Forestry, 100, 263‐272.
Washington, W. M., Weatherly, J. W., Meehl, G. A., et al. 2000. Parallel climate model (PCM) control and transient simulations. Climate Dynamics. 16 (10 ‐ 11): 755‐774.
Waters, T. & Savill, P. 1992. Ash and sycamore regeneration and the phenomenon of their alternation. Forestry. 65 (4): 417‐433.
Weiher, E. & Keddy, P. 1995. The assembly of experimental wetland plant communities. Oikos. 73 (3): 323‐335.
Weiher, E., van der Werf, A., Thompson, K., et al. 1999. Challenging Theophrastus: A common core list of plant traits for functional ecology. Journal of Vegetation Science. 10 (5): 609‐620.
Westoby, M. & Wright, I. J. 2006. Land‐plant ecology on the basis of functional traits. Trends in Ecology and Evolution. 21 (5): 261‐268.
Wilby, R. L. & Perry, G. L. W. 2006. Climate change, biodiversity and the urban environment: a critical review based on London, UK. Progress in Physical Geography. 30 (1): 73‐98.
Willet, J. 2001. Wood Ant Action Plan. Stirling: Stirling Council. Willi, Y., van Buskirk, J. & Hoffmann, A. 2006. Limits to the adaptive potential of small populations.
Annual Review of Ecology, Evolution, and Systematics. 37: 433‐458. Williams, J., Seo, C., Thorne, J., et al. 2009. Using species distribution models to predict new
occurrences for rare plants. Diversity and Distributions. 15 (4): 565‐576. Williams, J. W. & Jackson, S. T. 2007. Novel climates, no‐analog communities, and ecological
surprises. Frontiers In Ecology and The Environment. 5 (9): 475‐482. Williams, P., Hannah, L., Andelman, S., et al. 2005. Planning for climate change: identifying
minimum‐dispersal corridors for the Cape Proteaceae. Conservation Biology. 19 (4): 1063‐1074.
Willis, K. J., Araújo, M. B., Bennett, K., et al. 2007. How can a knowledge of the past help to conserve the future? Biodiversity conservation and the relevance of long‐term ecological studies. Philosophical Transactions of the Royal Society B: Biological Sciences. 362 (1478): 175‐186.
Willis, K. J. & Bhagwat, S. 2009. Ecology. Biodiversity and climate change. Science. 326 (5954): 806‐807.
Willis, K. J. & Birks, H. J. B. 2006. What is natural? The need for a long‐term perspective in Biodiversity Conservation. Science. 314 (5803): 1261‐1265.
101
Willis, S., Hill, J., Thomas, C. D., et al. 2009. Assisted colonization in a changing climate: a test‐study using two U.K. butterflies. Conservation Letters. 2 (1): 46‐52.
Wilson, S. M., Broadmeadow, M. S. J., Sanders, T. G., et al. 2008. Effect of summer drought on the increment of beech trees in southern England. Quarterly Journal of Forestry. 102 (2): 111‐120.
Wisz, M. S., Hijmans, R. J., Li, J., et al. 2008. Effects of sample size on the performance of species distribution models. Diversity and Distributions.
Woodward, F. I. 1987. Climate and Plant Distribution. Cambridge: Cambridge University Press. Woodward, F. I. & Lomas, M. R. 2004. Vegetation dynamics ‐ simulating responses to climatic
change. Biological Reviews. 79 (3): 643‐670. Wright, I. J., Reich, P. B., Westoby, M., et al. 2004. The worldwide leaf economics spectrum.
Nature. 428 (6985): 821‐827. Zavaleta, E., Pasari, J., Hulvey, K., et al. 2010. Sustaining multiple ecosystem functions in grassland
communities requires higher biodiversity. Proceedings of the National Academy of Sciences. 107 (4): 1443‐1446.
Zell, A., Mamier, G., Vogt, M., et al. 1995. Stuttgart Neural Network Simulator ‐ User Manual, Version 4.1. 2004 (13/4/2004).
Ziska, L. H., Gebhard, D. E., Frenz, D. A., et al. 2003. Cities as harbingers of climate change: Common ragweed, urbanization, and public health. Journal of Allergy and Clinical Immunology. 111 (2): 290‐295.
8. Appendices 8.1. Sources of European Species distribution data
Vascular plants
Hultén, E. and Fries, M. (1986). Atlas of North European vascular plants: north of the Tropic of Cancer I‐III
Jalas, J. and Suominen, J. (1972‐91). Atlas Florae Europaeae. Vols. 1‐9, Societas Biologica Fennica Vanamo, Helsinki.
Meusel, H., Jäger, E. and Weinert, E. (1965). Vergleichende Chorologie der Zentraleuropäischen Flora Vol 1. Gustav Fischer Jena.
Meusel, H., Jäger, E., Weinert, E. and Rauschert, S.T. (1978). Vergleichende Chorologie der Zentraleuropäischen Flora Vol 2. Gustav Fischer Jena.
Hultén, E. (1971) Atlas över växternas utbredning i norden = : Atlas of the distribution of vascular plants in NW Europe Stockholm : Generalstabens Litografiska Anstalts Förlag
Reptiles
Spellerberg, Ian F. (2002). Amphibians and reptiles of North‐West Europe: their natural history, ecology and conservation
Mosses
Daniels, R.E., Eddy, E., 1985. Handbook of European Sphagna. Institute of Terrestrial Ecology, Handbook 195, National Environment Research Council, Huntington.
Molluscs
102
Van Helsdingen, P. J., Willemse, L. and Speight, M. C. D. (1996) Background information on invertebrates of the Habitats Directive and Bern Convention. Part III Mollusca and Echinodermata
Mammals
Societas Europea Mammalogica (www.european‐mammals.org) Mitchell‐Jones, J.A., Amori, G., Bogdanowicz, W., Krystufek, B., Reijinders, P.J.H., Spitzenberger, F.,
Stubbe, M., Thissen, J.B.M., Vohralík, V., Zima, J., 1999. The atlas of European mammals. T. & A.D. Poyser, London.???
Lichen
Acta Bot. Fennica 150 (1994). Breuss, O. 1990.Die Flechtengattung Catapyrenium (Verrucariaceae) in Europa. Stapfia 23.
Butterflies
Higgins, L.G. and Riley, N.D. (1970). A Field Guide to the Butterflies of Britain and Europe Tolman, T., (1997). Butterflies of Britain and Europe. Collins Field Guide, Harper Collins, London. Birds: Digital data received from European Bird Census Council. Hagemeijer, W.J.M. and Blair, M. (Eds.) (1997) The EBCC Atlas of European Breeding Birds: Their
Distribution and Abundance. T.& A.D. Poyser, London.
Beetles
Van Helsdingen, P. J., Willemse, L. and Speight, M. C. D. (1996) Background information on invertebrates of the Habitats Directive and Bern Convention. Part I Crustacea, Coleoptera and Lepidoptera.
Ants Collingwood, Cedric A. (1979). The formicidae (Hymenoptera) of Fennoscandia and Denmark.
Amphibians
Spellerberg, Ian F. (2002) Amphibians and reptiles of North‐West Europe: their natural history, ecology and conservation
103

8.2. Modelling results for 8 climate change scenarios
Percent change bioclimate space in British Isles for each scenario
Species Common name
Had A2 2020
Had A2 2050
Had A2 2080
Had B1 2050
Had B1 2080
PCM A2 2020
PCM A2 2050
PCM A2 2080
Trees Acer campestre Field Maple 61 62 38 52 46 50 47 29 Acer pseudoplatanus
Sycamore ‐6 ‐20 ‐31 ‐19 ‐24 0 ‐5 ‐18
Alnus glutinosa Alder 8 6 ‐1 4 ‐1 7 3 ‐11 Alnus incana Grey Alder ‐78 ‐100 ‐100 ‐89 ‐97 ‐73 ‐100 ‐100 Betula pendula Silver birch 0 ‐10 ‐53 ‐3 ‐16 ‐1 ‐9 ‐23 Betula pubescens Downy birch 3 ‐6 ‐50 ‐7 ‐24 2 ‐6 ‐30 Buxus sempervirens
Common box 206 256 280 254 272 150 149 134
Carpinus betulus European hornbeam
18 5 ‐52 11 ‐4 12 9 ‐4
Fagus sylvatica Beech 11 9 ‐2 7 5 10 7 ‐2 Fraxinus excelsior Ash 8 4 ‐26 3 ‐5 8 3 ‐15 Ilex aquifolium English holly 1 1 1 1 1 1 1 1 Juniperus communis
Juniper ‐3 ‐7 ‐21 ‐7 ‐10 ‐3 ‐9 ‐22
Malus sylvestris Crab apple 17 15 7 13 9 16 14 ‐1 Pinus sylvestris Scots pine 14 ‐39 ‐78 ‐19 ‐47 22 ‐31 ‐67 Populus tremula Aspen 2 ‐3 ‐18 ‐3 ‐10 1 ‐5 ‐24 Prunus avium Wild cherry 11 9 0 6 3 10 5 ‐9 Prunus padus Bird cherry ‐49 ‐77 ‐97 ‐65 ‐80 ‐39 ‐64 ‐87 Pyrus pyraster Wild fruit trees 56 54 7 61 63 49 51 51 Quercus petraea Sessile Oak 6 ‐0 ‐30 0 ‐7 6 1 ‐13 Quercus robur Common oak 13 10 ‐14 8 0 13 11 1 Salix caprea Goat willow 3 ‐16 ‐61 ‐12 ‐32 3 ‐5 ‐36 Salix cinerea Grey sallow ‐3 ‐24 ‐73 ‐20 ‐38 ‐1 ‐16 ‐47 Sorbus aria Whitebeam 86 93 99 93 96 66 61 50 Sorbus aucuparia Rowan 0 ‐4 ‐17 ‐4 ‐10 0 ‐6 ‐24 Sorbus domestica Service Tree 1128 1430 1632 1268 1337 840 865 744 Sorbus torminalis Wild Service Tree 112 141 130 121 124 84 96 91 Taxus baccata English Yew 10 11 8 10 10 9 8 6 Tilia cordata Small‐leaf lime 39 29 ‐20 28 16 32 16 ‐16 Tilia platyphyllos Large‐leaf lime 215 250 271 246 272 171 191 202 Ulmus glabra Scots Elm ‐11 ‐40 ‐71 ‐35 ‐48 ‐4 ‐20 ‐55
Shrubs Calluna vulgaris Heather 15 12 8 9 6 13 7 ‐7 Cornus sanguinea Dogwood 19 23 25 20 21 18 22 22 Corylus avellana Hazel 2 ‐0 ‐7 ‐0 ‐2 2 ‐2 ‐12 Crataegus laevigata
English Hawthorn 14 14 4 19 21 7 1 ‐12
Crataegus monogyna
Hawthorn 4 3 2 2 2 4 2 ‐5
Erica cinerea Bell heather 1 1 ‐0 1 0 1 0 ‐2
Erica tetralix Cross‐leaved heath
0 0 ‐0 0 0 0 0 0
Euonymus europaeus
Spindle 26 29 13 28 27 21 26 17
Ligustrum vulgare European privet 13 14 14 12 11 11 11 5 Prunus spinosa Blackthorn 10 5 ‐10 4 ‐0 9 4 ‐12 Rhamnus cathartica
Common buckthorn
25 28 19 27 26 18 17 11
Ribes uva‐crispa Gooseberry 0 ‐23 ‐60 ‐18 ‐36 0 ‐21 ‐57 Rosa canina Dog rose 4 2 ‐2 2 0 3 ‐1 ‐10
104

Percent change bioclimate space in British Isles for each scenario Had Had Had Had Had PCM PCM PCM Common
Species A2 A2 A2 B1 B1 A2 A2 A2 name 2020 2050 2080 2050 2080 2020 2050 2080
Rubus fruticosus Blackberry ‐10 ‐36 ‐77 ‐28 ‐52 ‐5 ‐19 ‐50
Rubus idaeus Wild red raspberry
4 ‐16 ‐57 ‐13 ‐31 5 ‐9 ‐50
Ulex europaeus Gorse 2 3 3 2 1 2 3 4 Ulex gallii Western gorse 11 11 ‐0 4 ‐3 14 17 20 Vaccinium vitis‐idaea
Cowberry ‐33 ‐53 ‐70 ‐46 ‐56 ‐29 ‐44 ‐63
Mammals Apodemus flavicollis
Yellow‐necked mouse
20 ‐24 ‐44 ‐16 ‐26 16 ‐26 ‐60
Barbastella barbastellus
Barbastelle Bat 121 152 182 144 161 108 134 160
Capreolus capreolus
Roe deer 55 47 ‐24 54 33 36 31 7
Lepus europaeus Brown Hare ‐10 ‐17 ‐37 ‐2 3 ‐9 ‐6 15 Lutra lutra Otter ‐0 ‐0 ‐1 ‐2 ‐3 ‐0 ‐0 ‐2 Muscardinus avellanarius
Dormouse 35 ‐6 ‐70 30 23 46 52 68
Myotis bechsteinii Bechstein`s Bat 144 174 128 171 187 104 133 158 Pipistrellus pipistrellus
Pipistrelle Bat 2 1 ‐2 1 0 2 1 ‐7
Rhinolophus hipposideros
Lesser Horseshoe Bat
124 156 183 142 159 105 135 158
Sciurus vulgaris Red Squirrel 110 131 121 130 134 89 119 148 Vulpes vulpes Red fox 3 3 ‐6 3 2 3 3 ‐1
Lichens & Mosses Biatoridium monasteriense
a lichen ‐30 ‐56 ‐85 ‐50 ‐67 ‐25 ‐47 ‐74
Caloplaca luteoalba
Orange fruited elm lichen
7 7 ‐14 5 ‐1 7 5 ‐0
Cladonia_botrytes Stump lichen ‐20 ‐100 ‐100 0 ‐20 ‐20 ‐100 ‐100 Schismatomma graphidioides
a lichen ‐9 ‐15 ‐21 ‐15 ‐18 ‐4 ‐7 ‐10
Sphagnum cuspidatum
Bog‐moss ‐0 ‐9 ‐32 ‐8 ‐18 0 0 ‐1
Thelenella modesta
Warty wax lichen 0 3 5 2 3 0 2 3
Forbs
Agrostis capillaris Common bent‐grass
‐0 ‐1 ‐3 ‐1 ‐2 0 ‐1 ‐6
Ajuga reptans Bugle 9 11 10 10 11 9 11 12 Allium ursinum Wild Garlic 12 9 ‐16 9 2 11 9 4 Anemone nemorosa
Wood anemone 6 2 ‐19 2 ‐4 5 3 ‐5
Angelica sylvestris Wild Angelica ‐5 ‐15 ‐41 ‐13 ‐22 ‐5 ‐15 ‐31 Anthoxanthum odoratum
Sweet vernal grass
0 0 0 0 0 0 0 0
Arrhenatherum elatius
Tall oatgrass 4 ‐1 ‐15 ‐3 ‐12 3 ‐4 ‐26
Arum maculatum Lords and Ladies 13 12 ‐24 7 ‐2 11 9 ‐4 Blechnum spicant Deer fern 0 ‐0 ‐1 ‐0 ‐1 ‐0 ‐0 ‐0 Brachypodium sylvaticum
Slender Flase brome
13 13 10 12 10 13 11 2
Bromus ramosa Hairy brome 11 7 ‐4 5 0 9 2 ‐12 Campanula latifolia
Bellflower ‐38 ‐57 ‐85 ‐54 ‐67 ‐30 ‐53 ‐76
Carex elata Tufted sedge 10 16 9 14 16 9 16 23
105
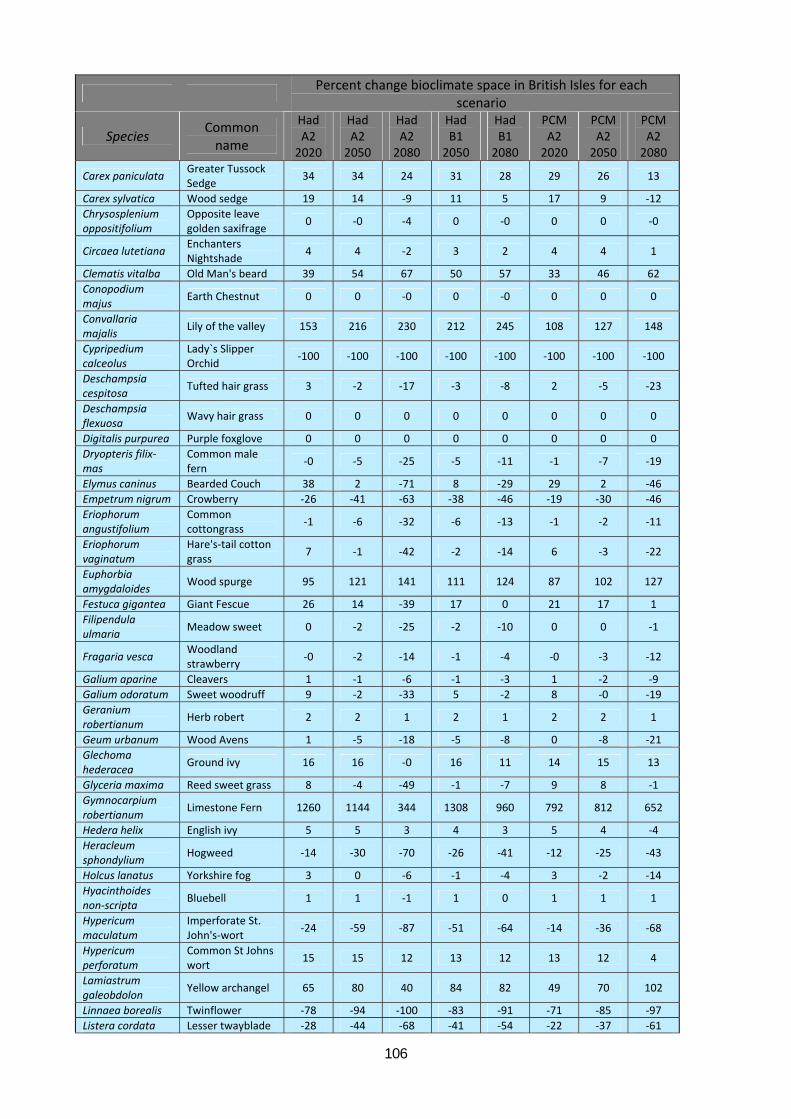
Percent change bioclimate space in British Isles for each scenario Had Had Had Had Had PCM PCM PCM Common
Species A2 A2 A2 B1 B1 A2 A2 A2 name 2020 2050 2080 2050 2080 2020 2050 2080
Carex paniculata Greater Tussock Sedge
34 34 24 31 28 29 26 13
Carex sylvatica Wood sedge 19 14 ‐9 11 5 17 9 ‐12 Chrysosplenium oppositifolium
Opposite leave golden saxifrage
0 ‐0 ‐4 0 ‐0 0 0 ‐0
Circaea lutetiana Enchanters Nightshade
4 4 ‐2 3 2 4 4 1
Clematis vitalba Old Man's beard 39 54 67 50 57 33 46 62 Conopodium majus
Earth Chestnut 0 0 ‐0 0 ‐0 0 0 0
Convallaria majalis
Lily of the valley 153 216 230 212 245 108 127 148
Cypripedium calceolus
Lady`s Slipper Orchid
‐100 ‐100 ‐100 ‐100 ‐100 ‐100 ‐100 ‐100
Deschampsia cespitosa
Tufted hair grass 3 ‐2 ‐17 ‐3 ‐8 2 ‐5 ‐23
Deschampsia flexuosa
Wavy hair grass 0 0 0 0 0 0 0 0
Digitalis purpurea Purple foxglove 0 0 0 0 0 0 0 0 Dryopteris filix‐mas
Common male fern
‐0 ‐5 ‐25 ‐5 ‐11 ‐1 ‐7 ‐19
Elymus caninus Bearded Couch 38 2 ‐71 8 ‐29 29 2 ‐46 Empetrum nigrum Crowberry ‐26 ‐41 ‐63 ‐38 ‐46 ‐19 ‐30 ‐46 Eriophorum angustifolium
Common cottongrass
‐1 ‐6 ‐32 ‐6 ‐13 ‐1 ‐2 ‐11
Eriophorum vaginatum
Hare's‐tail cotton grass
7 ‐1 ‐42 ‐2 ‐14 6 ‐3 ‐22
Euphorbia amygdaloides
Wood spurge 95 121 141 111 124 87 102 127
Festuca gigantea Giant Fescue 26 14 ‐39 17 0 21 17 1 Filipendula ulmaria
Meadow sweet 0 ‐2 ‐25 ‐2 ‐10 0 0 ‐1
Fragaria vesca Woodland strawberry
‐0 ‐2 ‐14 ‐1 ‐4 ‐0 ‐3 ‐12
Galium aparine Cleavers 1 ‐1 ‐6 ‐1 ‐3 1 ‐2 ‐9 Galium odoratum Sweet woodruff 9 ‐2 ‐33 5 ‐2 8 ‐0 ‐19 Geranium robertianum
Herb robert 2 2 1 2 1 2 2 1
Geum urbanum Wood Avens 1 ‐5 ‐18 ‐5 ‐8 0 ‐8 ‐21 Glechoma hederacea
Ground ivy 16 16 ‐0 16 11 14 15 13
Glyceria maxima Reed sweet grass 8 ‐4 ‐49 ‐1 ‐7 9 8 ‐1 Gymnocarpium robertianum
Limestone Fern 1260 1144 344 1308 960 792 812 652
Hedera helix English ivy 5 5 3 4 3 5 4 ‐4 Heracleum sphondylium
Hogweed ‐14 ‐30 ‐70 ‐26 ‐41 ‐12 ‐25 ‐43
Holcus lanatus Yorkshire fog 3 0 ‐6 ‐1 ‐4 3 ‐2 ‐14 Hyacinthoides non‐scripta
Bluebell 1 1 ‐1 1 0 1 1 1
Hypericum maculatum
Imperforate St. John's‐wort
‐24 ‐59 ‐87 ‐51 ‐64 ‐14 ‐36 ‐68
Hypericum perforatum
Common St Johns wort
15 15 12 13 12 13 12 4
Lamiastrum galeobdolon
Yellow archangel 65 80 40 84 82 49 70 102
Linnaea borealis Twinflower ‐78 ‐94 ‐100 ‐83 ‐91 ‐71 ‐85 ‐97 Listera cordata Lesser twayblade ‐28 ‐44 ‐68 ‐41 ‐54 ‐22 ‐37 ‐61
106
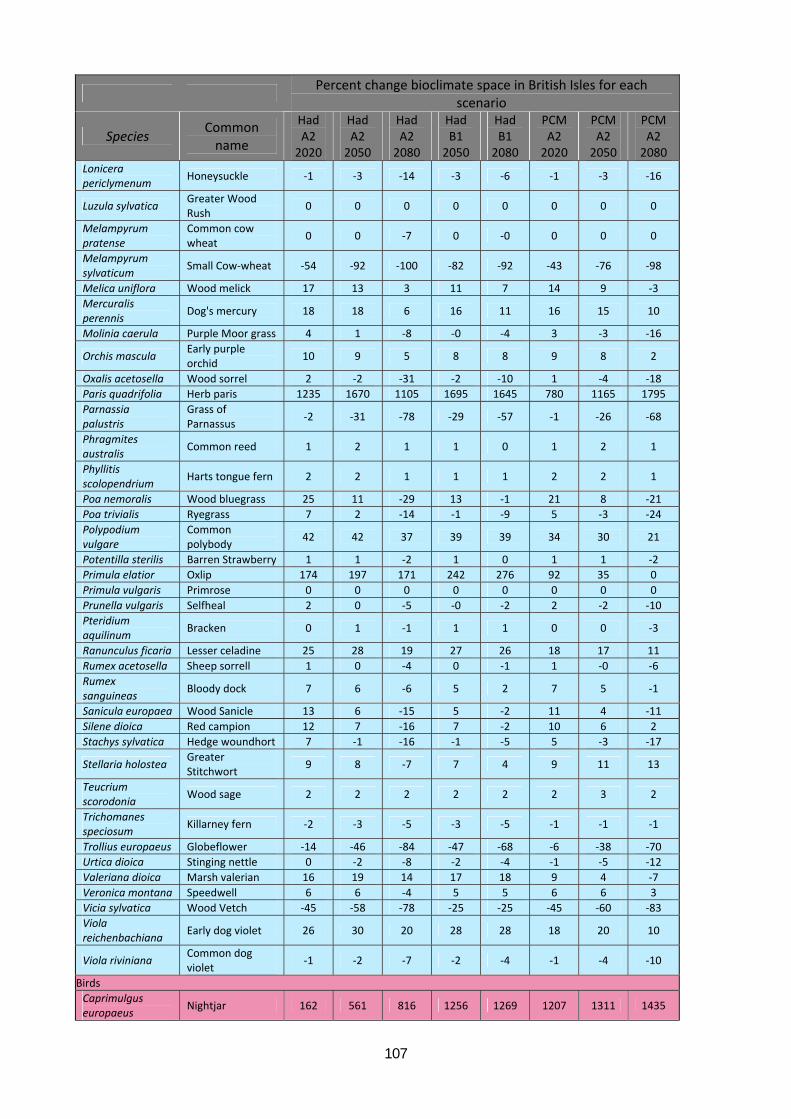
Percent change bioclimate space in British Isles for each scenario Had Had Had Had Had PCM PCM PCM Common
Species A2 A2 A2 B1 B1 A2 A2 A2 name 2020 2050 2080 2050 2080 2020 2050 2080
Lonicera periclymenum
Honeysuckle ‐1 ‐3 ‐14 ‐3 ‐6 ‐1 ‐3 ‐16
Luzula sylvatica Greater Wood Rush
0 0 0 0 0 0 0 0
Melampyrum pratense
Common cow wheat
0 0 ‐7 0 ‐0 0 0 0
Melampyrum sylvaticum
Small Cow‐wheat ‐54 ‐92 ‐100 ‐82 ‐92 ‐43 ‐76 ‐98
Melica uniflora Wood melick 17 13 3 11 7 14 9 ‐3 Mercuralis perennis
Dog's mercury 18 18 6 16 11 16 15 10
Molinia caerula Purple Moor grass 4 1 ‐8 ‐0 ‐4 3 ‐3 ‐16
Orchis mascula Early purple orchid
10 9 5 8 8 9 8 2
Oxalis acetosella Wood sorrel 2 ‐2 ‐31 ‐2 ‐10 1 ‐4 ‐18 Paris quadrifolia Herb paris 1235 1670 1105 1695 1645 780 1165 1795 Parnassia palustris
Grass of Parnassus
‐2 ‐31 ‐78 ‐29 ‐57 ‐1 ‐26 ‐68
Phragmites australis
Common reed 1 2 1 1 0 1 2 1
Phyllitis scolopendrium
Harts tongue fern 2 2 1 1 1 2 2 1
Poa nemoralis Wood bluegrass 25 11 ‐29 13 ‐1 21 8 ‐21 Poa trivialis Ryegrass 7 2 ‐14 ‐1 ‐9 5 ‐3 ‐24 Polypodium vulgare
Common polybody
42 42 37 39 39 34 30 21
Potentilla sterilis Barren Strawberry 1 1 ‐2 1 0 1 1 ‐2 Primula elatior Oxlip 174 197 171 242 276 92 35 0 Primula vulgaris Primrose 0 0 0 0 0 0 0 0 Prunella vulgaris Selfheal 2 0 ‐5 ‐0 ‐2 2 ‐2 ‐10 Pteridium aquilinum
Bracken 0 1 ‐1 1 1 0 0 ‐3
Ranunculus ficaria Lesser celadine 25 28 19 27 26 18 17 11 Rumex acetosella Sheep sorrell 1 0 ‐4 0 ‐1 1 ‐0 ‐6 Rumex sanguineas
Bloody dock 7 6 ‐6 5 2 7 5 ‐1
Sanicula europaea Wood Sanicle 13 6 ‐15 5 ‐2 11 4 ‐11 Silene dioica Red campion 12 7 ‐16 7 ‐2 10 6 2 Stachys sylvatica Hedge woundhort 7 ‐1 ‐16 ‐1 ‐5 5 ‐3 ‐17
Stellaria holostea Greater Stitchwort
9 8 ‐7 7 4 9 11 13
Teucrium scorodonia
Wood sage 2 2 2 2 2 2 3 2
Trichomanes speciosum
Killarney fern ‐2 ‐3 ‐5 ‐3 ‐5 ‐1 ‐1 ‐1
Trollius europaeus Globeflower ‐14 ‐46 ‐84 ‐47 ‐68 ‐6 ‐38 ‐70 Urtica dioica Stinging nettle 0 ‐2 ‐8 ‐2 ‐4 ‐1 ‐5 ‐12 Valeriana dioica Marsh valerian 16 19 14 17 18 9 4 ‐7 Veronica montana Speedwell 6 6 ‐4 5 5 6 6 3 Vicia sylvatica Wood Vetch ‐45 ‐58 ‐78 ‐25 ‐25 ‐45 ‐60 ‐83 Viola reichenbachiana
Early dog violet 26 30 20 28 28 18 20 10
Viola riviniana Common dog violet
‐1 ‐2 ‐7 ‐2 ‐4 ‐1 ‐4 ‐10
Birds Caprimulgus europaeus
Nightjar 162 561 816 1256 1269 1207 1311 1435
107
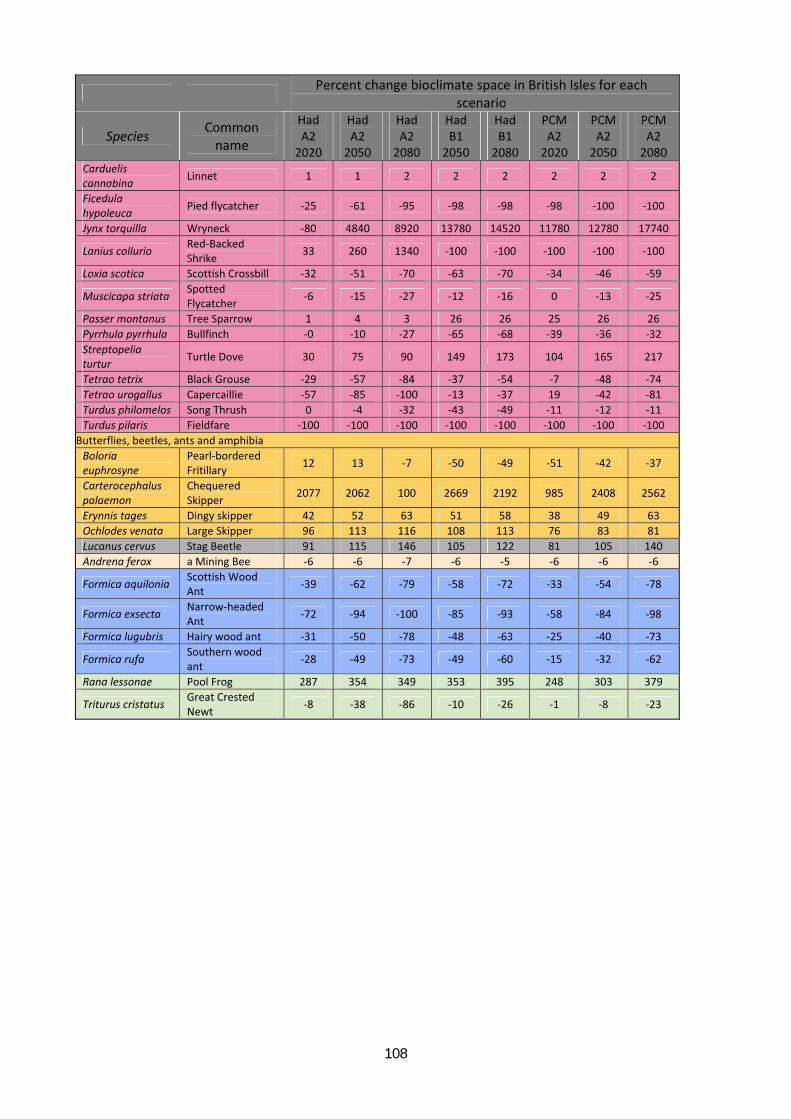
Percent change bioclimate space in British Isles for each scenario Had Had Had Had Had PCM PCM PCM Common
Species A2 A2 A2 B1 B1 A2 A2 A2 name 2020 2050 2080 2050 2080 2020 2050 2080
Carduelis cannabina
Linnet 1 1 2 2 2 2 2 2
Ficedula hypoleuca
Pied flycatcher ‐25 ‐61 ‐95 ‐98 ‐98 ‐98 ‐100 ‐100
Jynx torquilla Wryneck ‐80 4840 8920 13780 14520 11780 12780 17740
Lanius collurio Red‐Backed Shrike
33 260 1340 ‐100 ‐100 ‐100 ‐100 ‐100
Loxia scotica Scottish Crossbill ‐32 ‐51 ‐70 ‐63 ‐70 ‐34 ‐46 ‐59
Muscicapa striata Spotted Flycatcher
‐6 ‐15 ‐27 ‐12 ‐16 0 ‐13 ‐25
Passer montanus Tree Sparrow 1 4 3 26 26 25 26 26 Pyrrhula pyrrhula Bullfinch ‐0 ‐10 ‐27 ‐65 ‐68 ‐39 ‐36 ‐32 Streptopelia turtur
Turtle Dove 30 75 90 149 173 104 165 217
Tetrao tetrix Black Grouse ‐29 ‐57 ‐84 ‐37 ‐54 ‐7 ‐48 ‐74 Tetrao urogallus Capercaillie ‐57 ‐85 ‐100 ‐13 ‐37 19 ‐42 ‐81 Turdus philomelos Song Thrush 0 ‐4 ‐32 ‐43 ‐49 ‐11 ‐12 ‐11 Turdus pilaris Fieldfare ‐100 ‐100 ‐100 ‐100 ‐100 ‐100 ‐100 ‐100
Butterflies, beetles, ants and amphibia Boloria euphrosyne
Pearl‐bordered Fritillary
12 13 ‐7 ‐50 ‐49 ‐51 ‐42 ‐37
Carterocephalus palaemon
Chequered Skipper
2077 2062 100 2669 2192 985 2408 2562
Erynnis tages Dingy skipper 42 52 63 51 58 38 49 63 Ochlodes venata Large Skipper 96 113 116 108 113 76 83 81 Lucanus cervus Stag Beetle 91 115 146 105 122 81 105 140 Andrena ferox a Mining Bee ‐6 ‐6 ‐7 ‐6 ‐5 ‐6 ‐6 ‐6
Formica aquilonia Scottish Wood Ant
‐39 ‐62 ‐79 ‐58 ‐72 ‐33 ‐54 ‐78
Formica exsecta Narrow‐headed Ant
‐72 ‐94 ‐100 ‐85 ‐93 ‐58 ‐84 ‐98
Formica lugubris Hairy wood ant ‐31 ‐50 ‐78 ‐48 ‐63 ‐25 ‐40 ‐73
Formica rufa Southern wood ant
‐28 ‐49 ‐73 ‐49 ‐60 ‐15 ‐32 ‐62
Rana lessonae Pool Frog 287 354 349 353 395 248 303 379
Triturus cristatus Great Crested Newt
‐8 ‐38 ‐86 ‐10 ‐26 ‐1 ‐8 ‐23
108