Embed Size (px)
Citation preview

Revised January 2018 | Issue Brief
Understanding the Intersection of Medicaid and Work
Rachel Garfield, Robin Rudowitz and Anthony Damico
Medicaid is the nation’s public health insurance program for people with low incomes. Overall, the Medicaid
program covers one in five Americans, including many with complex and costly needs for care. Historically,
nonelderly adults without disabilities accounted for a small share of Medicaid enrollees; however, the
Affordable Care Act (ACA) expanded coverage to nonelderly adults with income up to 138% FPL, or $16,642
per year for an individual in 2017. As of December 2017, 32 states have implemented the ACA Medicaid
expansion.1 By design, the expansion extended coverage to the working poor (both parents and childless
adults), most of whom do not otherwise have access to affordable coverage. While many have gained coverage
under the expansion, the majority of Medicaid enrollees are still the “traditional” populations of children,
people with disabilities, and the elderly.
Some states and the Trump administration have stated that the ACA Medicaid expansion targets “able-bodied”
adults and seek to make Medicaid eligibility contingent on work. Under current law, states cannot impose a
work requirement as a condition of Medicaid eligibility, but some states are seeking waiver authority to do so.
These types of waiver requests were denied by the Obama administration, but the Trump administration has
indicated a willingness to approve such waivers. This issue brief provides data on the work status of the nearly
25 million non-elderly adults without SSI enrolled in Medicaid (referred to as “Medicaid adults” throughout
this brief) to understand the potential implications of work requirement proposals in Medicaid. Key takeaways
include the following:
Among Medicaid adults (including parents and childless adults — the group targeted by the Medicaid
expansion), nearly 8 in 10 live in working families, and a majority are working themselves. Nearly half of
working Medicaid enrollees are employed by small firms, and many work in industries with low employer-
sponsored insurance offer rates.
Among the adult Medicaid enrollees who were not working, most report major impediments to their ability
to work including illness or disability or care-giving responsibilities.
While proponents of work requirements say such provisions aim to promote work for those who are not
working, these policies could have negative implications on many who are working or exempt from the
requirements. For example, coverage for working or exempt enrollees may be at risk if enrollees face
administrative obstacles in verifying their work status or documenting an exemption.

Understanding the Intersection of Medicaid and Work 2
Data Findings
Among nonelderly adults with Medicaid coverage—the group of enrollees most likely to be in
the workforce—nearly 8 in 10 live in working families, and a majority are working themselves.
Because policies around work requirements would be
intended to apply to primarily to nonelderly adults
without disabilities, we focus this analysis on adults
whose eligibility is not based on receipt of
Supplemental Security Income (SSI, see methods box
for more detail). Data show that among the nearly 25
million non-SSI adults (ages 19-64) enrolled in
Medicaid in 2016, 6 in 10 (60%) are working
themselves (Figure 1). A larger share, nearly 8 in 10
(79%), are in families with at least one worker, with
nearly two-thirds (64%) with a full-time worker and
another 14% with a part-time worker; one of the
adults in such families may not work, often due to
caregiving or other responsibilities.
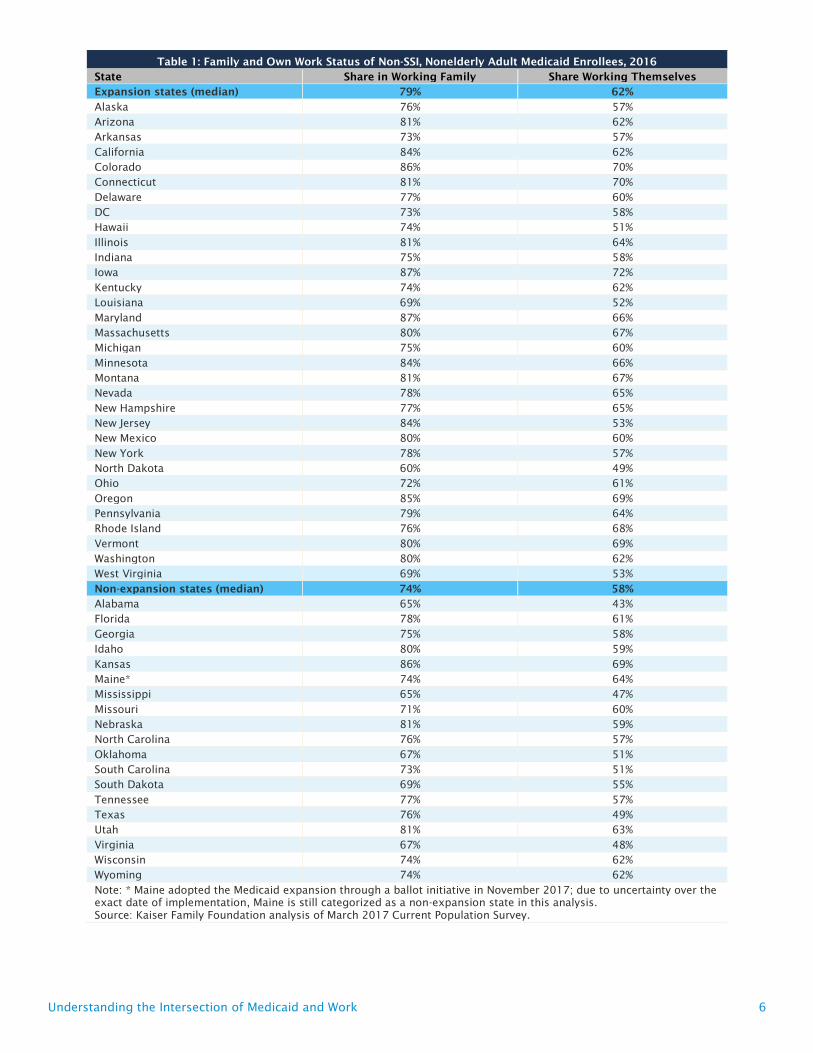
Because states that expanded Medicaid under the ACA cover adults with family incomes at higher levels than
those that did not, adults in Medicaid expansion states are more likely to be in working families or working
themselves than those in non-expansion states (Table 1). Adults who are younger, male, Hispanic or Asian were
more likely to be working than those who are older, female, or White, Black, or American Indian, respectively
(Figure 2 and Table 2). Not surprisingly, adults with more education or better health were more likely to work
than others (Figure 3 and Table 2). Perhaps reflecting job market conditions, those living in the South were less
likely to work than those in other areas, though similar rates of enrollees in urban and rural areas were working
(Table 2). For state-level data, see Appendix tables.
Figure 1
64%
42%
14%
18%
21%
40%
Family Work Status Own Work Status
None
Part-Time
Full-time
NOTE: Totals may not add due to rounding. Includes nonelderly adults who do not receive Supplemental Security Income (SSI). SOURCE: Kaiser Family Foundation analysis of March 2017 Current Population Survey.
Work Status of Non-SSI, Nonelderly Adult Medicaid Enrollees, 2016
Total = 24.6 Million Non-Elderly Adults without SSI
Figure 2
62%
67%
50%
65%
56%59%
57%
63% 62%
45%
Under 26 26-45 46 or older Male Female White,Non-
Hispanic
Black, Non-Hispanic
Hispanic Asian AI/AN
NOTE: Includes nonelderly adults who do not receive Supplemental Security Income (SSI). “Asian” includes Asian, Native Hawaiian, or Pacific Islander. “AI/AN” includes American Indian or Alaska Native.SOURCE: Kaiser Family Foundation analysis of March 2017 Current Population Survey.
Work Status of Non-SSI, Nonelderly Adult Medicaid Enrollees by Key Demographics, 2016Share who are working themselves:
Age Sex Race/Ethnicity
Figure 3
51%
58%
64%69%
61% 62%
55%
63%
70%
63%
33%
NOTE: Includes nonelderly adults who do not receive Supplemental Security Income (SSI). “Asian” includes Asian, Native Hawaiian, or Pacific Islander. “AI/AN” includes American Indian or Alaska Native.SOURCE: Kaiser Family Foundation analysis of March 2017 Current Population Survey.
Work Status of Non-SSI, Nonelderly Adult Medicaid Enrollees by Key Demographics, 2016Share who are working themselves:
Education
< High School
High SchoolGrad
Some College
BA or higher
Region
Northeast
Midwest
South West
Health Status
Excellent/Very Good
Good Fair/Poor

Understanding the Intersection of Medicaid and Work 3
Most Medicaid enrollees who work are working full-time for the full year, but their annual
incomes are still low enough to qualify for Medicaid. Among adult Medicaid enrollees who work, the
majority (51%) worked full-time (at least 35 hours per week) for the entire year (at least 50 weeks during the
year) (Table 3).2 Most of those who work for only part of the year still work for the majority of the year (26
weeks or more). By definition (that is, in order to meet Medicaid eligibility criteria), these individuals are
working low-wage jobs. For example, an individual working full-time (40 hours/week) for the full year (52
weeks) at the federal minimum wage would earn an annual salary of just over $15,000 a year, or about 125% of
poverty, below the 138% FPL maximum targeted by the ACA Medicaid expansion.
Many Medicaid enrollees working part-time face impediments to finding full-time work. Among
adult Medicaid enrollees who work part-time, many cite economic reasons such as inability to find full-time
work (10%) or slack business conditions (11%) as the reason they work part-time versus full-time. Other major
reasons are attendance at school (14%) or other family obligations (14%).
Nearly half of working adult Medicaid enrollees are employed by small firms, and many work
in industries with low employer-sponsored coverage offer rates. Working Medicaid enrollees work
in firms and industries that often have limited employer-based coverage options. More than four in ten adult
Medicaid enrollees who work are employed by small firms with fewer than 50 employees that will not be
subject to ACA penalties for not offering coverage (Figure 4). Further, many firms do not offer coverage to part-
time workers. Four in ten Medicaid adults who work are employed in industries with historically low insurance
rates, such as the agriculture and service industries. A closer look by specific industry shows that one-third of
working Medicaid enrollees are employed in ten industries, with one in 10 enrollees working in restaurants or
food services (Figure 5). The Medicaid expansion was designed to reach low-income adults left out of the
employer-based system, so, it is not surprising that among those who work, most are unlikely to have access to
health coverage through a job.
Among the adult Medicaid enrollees who were not working, most report major impediments to
their ability to work. Even though individuals qualifying for Medicaid on the basis of a disability through
SSI were excluded from this group, more than one-third of those not working reported that illness or disability
Figure 4
<50 workers,
42%
50-99 workers, 8%
100+ workers,
51%
By Firm Size
Notes: Data may not sum to 100% due to rounding. Includes nonelderly adults who do not receive Supplemental Security Income (SSI). Industry classifications: Agricult./Service includes agriculture, construction, leisure and hospitality services, wholesale and retail trade. Educ./Health includes education and health services. Prof/Public Admin includes finance, professional and business services, information, and public administration. Manufacturing includes mining, manufacturing, utilities, and transportation. SOURCE: Kaiser Family Foundation analysis of March 2017 Current Population Survey.
Agricult./Service,
40%
Educ. / Health,
21%
Prof / Public
Admin, 18%
Manufacturing, 14%
Other, 6%
By Industry
Work Characteristics of Working Adult Medicaid Enrollees, 2016
Total = 14.8 Million
Characteristics based on own work status:
Figure 5
Industry Number of Adult Workers with Medicaid
Restaurant and food services 1,486,000
Construction 974,000
Elementary and secondary schools 461,000
Grocery stores 396,000
Hospitals 354,000
Department stores and discount stores 328,000
Home health care services 311,000
Services to buildings and dwellings 294,000
Nursing care facilities 275,000
Child day care services 274,000
Total for Listed Industries (38% of adult Medicaid enrollees who are workers)
5,153,000
NOTE: Includes nonelderly adults who do not receive Supplemental Security Income (SSI). SOURCE: Kaiser Family Foundation analysis of March 2017 Current Population Survey.
Industries with Largest Number of Workers Covered by Medicaid, 2016

Understanding the Intersection of Medicaid and Work 4
was the primary reason for not working. SSI
disability criteria are stringent and can take a long
time to establish. People can have physical and/or
mental health disabilities that interfere with their
ability to work, or to work full-time, without those
impairments rising to the SSI level of severity. Other
analysis indicates that nearly nine in ten (88%) non-
SSI Medicaid adults who reports not working due to
illness or disability has a functional limitation, and
more than two-thirds (67%) have two or more
chronic conditions such as arthritis or asthma.3
30% of non-working Medicaid adults reported that
they did not work because they were taking care of home or family; 15% were in school; 6% were looking for
work and another 9% were retired (Figure 6). Women accounted for 62% of Medicaid enrollees who were not
working in 2016, and parents with children under the age of 6 accounted for 17%.
Policy Implications
Under current law, states cannot impose a work requirement as a condition of Medicaid
eligibility. As with other core requirements, the Medicaid statute sets minimum eligibility standards, and
states are able to expand coverage beyond these minimum levels. Prior to the ACA, individuals had to meet not
only income and resource requirements but also categorical requirements to be eligible for the program. These
categorical requirements provided coverage pathways for adults who were pregnant women or parents as well
as individuals with disabilities, but other adults without dependent children were largely excluded from
coverage. The ACA was designed to fill in gaps in coverage and effectively eliminate these categorical eligibility
requirements by establishing a uniform income threshold for most adults. States are not allowed to impose
other eligibility requirements that are not in the law.
Some states have proposed tying Medicaid eligibility to work requirements using waiver
authority that may be approved by the Trump Administration. Under Section 1115 of the Social
Security Act, the Secretary of HHS can waive certain provisions of Medicaid as long as the Secretary
determines that the initiative is a “research and demonstration project” that “is likely to assist in promoting the
objectives” of the program. The Obama administration did not approve waivers that would condition Medicaid
eligibility on work on the grounds that they did not meet the waiver test to further the purpose of the program
which is to provide health coverage. The Trump Administration has indicated a willingness to approve waivers
to require work.
Research shows that Medicaid expansion has not negatively affected labor market
participation, and some research indicates that Medicaid coverage supports work. A
comprehensive review of research on the ACA Medicaid expansion found that there is no significant negative
effect of the ACA Medicaid expansion on employment rates and other measures of employment and employee
behavior (such as transitions from employment to non-employment, the rate of job switches, transitions from
full- to part-time employment, labor force participation, and usual hours worked per week). In addition, focus
Figure 6
Ill or disabled, 36%
Retired, 9%
Taking care of home or family,
30%
Going to school, 15%
Could not find work, 6%
Other, 3%
Total = 9.8 Million
Main reasons for not working among non-SSI, adult Medicaid enrollees, 2016
NOTE: Includes nonelderly adults who do not receive Supplemental Security Income (SSI). SOURCE: Kaiser Family Foundation analysis of March 2017 Current Population Survey.

Understanding the Intersection of Medicaid and Work 5
groups, state studies, and anecdotal reports highlight examples of Medicaid coverage supporting work and
helping enrollees transition into new careers. For example, individuals have reported that receiving medication
for conditions like asthma or rheumatoid arthritis through Medicaid is critical in supporting their ability to
work. Addressing barriers to work requires adequate funding and supports. While TANF spending on work
activities and supports is critiqued by some as too low, it exceeds estimates of state Medicaid program spending
to implement a work requirement.
Implementing work requirements can create administrative complexity and put coverage at
risk for eligible enrollees who are working or who may be exempt. States can incur additional costs
and demands on staff, and some eligible people could lose coverage. While work requirements are intended to
promote work among those not working, coverage for those who are working could be at risk if beneficiaries
face administrative obstacles in verifying their work status or documenting an exemption. In addition, some
individuals who may be exempt may face challenges in navigating an exemption which could also put coverage
at risk.
Methods
This analysis is based on Kaiser Family Foundation analysis of the March 2017 Current Population Survey
(CPS), which reflects health insurance coverage in 2016. We included nonelderly adults (age 19-64) who
indicated that they had Medicaid at some point during the year. We excluded people who indicated that they
received Supplemental Security Income (SSI) during the year, since these individuals likely qualify for
Medicaid on the basis of having a disability (and would likely be excluded from work requirements). To match
timing of work variables to health insurance coverage, we used measures of work status throughout 2016.
Individuals who worked at any point in 2016 were classified as “working.”
Rachel Garfield and Robin Rudowitz are with the Kaiser Family Foundation. Anthony Damico is an
independent consultant to the Kaiser Family Foundation.
Understanding the Intersection of Medicaid and Work 6
Table 1: Family and Own Work Status of Non-SSI, Nonelderly Adult Medicaid Enrollees, 2016
State Share in Working Family Share Working Themselves
Expansion states (median) 79% 62%
Alaska 76% 57%
Arizona 81% 62%
Arkansas 73% 57%
California 84% 62%
Colorado 86% 70%
Connecticut 81% 70%
Delaware 77% 60%
DC 73% 58%
Hawaii 74% 51%
Illinois 81% 64%
Indiana 75% 58%
Iowa 87% 72%
Kentucky 74% 62%
Louisiana 69% 52%
Maryland 87% 66%
Massachusetts 80% 67%
Michigan 75% 60%
Minnesota 84% 66%
Montana 81% 67%
Nevada 78% 65%
New Hampshire 77% 65%
New Jersey 84% 53%
New Mexico 80% 60%
New York 78% 57%
North Dakota 60% 49%
Ohio 72% 61%
Oregon 85% 69%
Pennsylvania 79% 64%
Rhode Island 76% 68%
Vermont 80% 69%
Washington 80% 62%
West Virginia 69% 53%
Non-expansion states (median) 74% 58%
Alabama 65% 43%
Florida 78% 61%
Georgia 75% 58%
Idaho 80% 59%
Kansas 86% 69%
Maine* 74% 64%
Mississippi 65% 47%
Missouri 71% 60%
Nebraska 81% 59%
North Carolina 76% 57%
Oklahoma 67% 51%
South Carolina 73% 51%
South Dakota 69% 55%
Tennessee 77% 57%
Texas 76% 49%
Utah 81% 63%
Virginia 67% 48%
Wisconsin 74% 62%
Wyoming 74% 62%
Note: * Maine adopted the Medicaid expansion through a ballot initiative in November 2017; due to uncertainty over the
exact date of implementation, Maine is still categorized as a non-expansion state in this analysis.
Source: Kaiser Family Foundation analysis of March 2017 Current Population Survey.

Understanding the Intersection of Medicaid and Work 7
Table 2: Own Work Status of Non-SSI, Nonelderly Adult Medicaid Enrollees, 2016
Total Share
Who
Worked in
2016
Share Who
Did Not
Work in
2016
Total 24,580,000 60% 40%
Age
Under 26 5,379,000 62% 38%
26 - 45 11,449,000 67% 33%
46 or older 7,751,000 50% 50%
Sex
Male 10,718,000 65% 35%
Female 13,862,000 56% 44%
Race/Ethnicity
White Non-Hispanic 11,478,000 59% 41%
Black Non-Hispanic 4,035,000 57% 43%
Hispanic 6,658,000 63% 37%
Asian, Native Hawaiian, or Pacific Islander 1,626,000 62% 38%
American Indian or Alaska Native 320,000 45% 55%
Multiple Races 463,000 68% 32%
Education
Less than High School 4,488,000 51% 49%
High School Graduate 9,185,000 58% 42%
Some College 7,395,000 64% 36%
Bachelor's Degree or Higher 3,513,000 69% 31%
Geographic Region
Northeast 5,104,000 61% 39%
Midwest 5,095,000 62% 38%
South 6,465,000 55% 45%
West 7,915,000 63% 37%
Metro Status
Non-Metro* 3,720,000 58% 42%
Metro 20,860,000 61% 39%
Family Type
One Parent with Children 2,336,000 73% 27%
Two Parents with Children 4,815,000 68% 32%
Multi-generational 1,824,000 58% 42%
Married Adults 2,702,000 55% 45%
Adults Living Together 4,688,000 52% 48%
Single Person 4,513,000 56% 44%
Other 3,704,000 62% 38%
Family Work Status
Multiple Full-Time Workers in Family 4,888,000 86% 14%
One Full-Time Worker in Family 10,947,000 71% 29%
Only Part-Time Workers in Family 3,519,000 81% 19%
No Workers in Family 5,226,000 0% 100%
Self-Reported
Health
Excellent/Very Good 11,866,000 70% 30%
Good 7,705,000 63% 37%
Fair/Poor 5,009,000 33% 67%
* Includes people in not-identified areas
SOURCE: Kaiser Family Foundation analysis of March 2017 Current Population Survey.

Table 3: Characteristics of Working Nonelderly Adult (19-64) Medicaid Enrollees, 2016
Total 14,802,000
Work Status
Full-Time* 69%
Full-Time, Full-Year 51%
Full-Time, Part-Year 19%
Part-Time 31%
Part-Time, Full-Year 16%
Part-Time, Part-Year 15%
Number of Weeks
Worked During the
Year
1-12 weeks 8%
13-25 weeks 8%
26-38 weeks 9%
39-51 weeks 12%
52 weeks 64%
Firm Size
< 50 employees 42%
50 - 99 employees 8%
100+ employees 51%
* Full-Time is based on total number of hours worked per week (at least 35 hours). Full-time workers may be
simultaneously working more than one-job.
SOURCE: Kaiser Family Foundation analysis of March 2017 Current Population Survey.
Endnotes
1 Maine adopted the Medicaid expansion through a ballot initiative in November 2017; due to uncertainty over the exact date of implementation, Maine is still categorized as a non-expansion state in this analysis.
2 Full-time workers include people working 35 hours or more, those who worked 1-34 hours for noneconomic reasons (e.g., illness) and usually work full-time, and people "with a job but not at work" who usually work full- time. People working full time may work at more than one job.
3 Kaiser Family Foundation analysis of 2016 National Health Interview Survey.
Understanding the Intersection of Medicaid and Work 8

Total # Non-SSI, Nonelderly
Adult Medicaid Enrollees
No Worker in
Family
Full-Time Worker in
Family
Part-Time Worker
in Family
Not
Working
Working Full-
Time
Working Part-
Time
US TOTAL 24,580,000 21% 64% 14% 40% 42% 18%
ALABAMA 308,000 35% 58% 8% 57% 31% 12%
ALASKA 69,000 24% 61% 15% 43% 39% 19%
ARIZONA 636,000 19% 63% 18% 38% 41% 21%
ARKANSAS 178,000 27% 60% 13% 43% 40% 17%
CALIFORNIA 4,777,000 16% 69% 14% 38% 44% 18%
COLORADO 361,000 14% 73% 13% 30% 54% 16%
CONNECTICUT 337,000 19% 60% 21% 30% 47% 23%
DELAWARE 103,000 23% 67% 9% 40% 43% 17%
DISTRICT OF COLUMBIA 88,000 27% 62% 11% 42% 46% 12%
FLORIDA 1,069,000 22% 67% 12% 39% 44% 18%
GEORGIA 398,000 25% 65% NA 42% 40% 18%
HAWAII 96,000 26% 57% 18% 49% 32% 19%
IDAHO 87,000 20% 69% 11% 41% 41% 18%
ILLINOIS 1,040,000 19% 68% 13% 36% 46% 19%
INDIANA 541,000 25% 64% 11% 42% 45% 14%
IOWA 245,000 13% 66% 20% 28% 45% 27%
KANSAS 107,000 14% 68% 18% 31% 47% 21%
KENTUCKY 337,000 26% 64% NA 38% 47% 14%
LOUISIANA 421,000 31% 54% 15% 48% 34% 18%
MAINE 100,000 26% 52% 22% 36% 39% 25%
MARYLAND 390,000 NA 74% 12% 34% 51% 16%
MASSACHUSETTS 776,000 20% 64% 16% 33% 46% 21%
MICHIGAN 967,000 25% 61% 14% 40% 42% 18%
MINNESOTA 354,000 16% 73% 10% 34% 48% 18%
MISSISSIPPI 182,000 35% 57% 9% 53% 35% 12%
MISSOURI 285,000 29% 61% 10% 40% 44% 16%
MONTANA 86,000 19% 64% 16% 33% 46% 21%
NEBRASKA 65,000 19% 65% 16% 41% 40% NA
NEVADA 216,000 22% 66% 12% 35% 46% 18%
NEW HAMPSHIRE 56,000 23% 66% NA 35% 41% 24%
NEW JERSEY 639,000 16% 69% 15% 47% 37% 16%
NEW MEXICO 306,000 20% 63% 17% 40% 40% 20%
NEW YORK 2,114,000 22% 66% 13% 43% 39% 18%
NORTH CAROLINA 520,000 24% 60% 16% 43% 39% 18%
NORTH DAKOTA 28,000 40% 47% 12% 51% 33% 16%
OHIO 1,121,000 28% 58% 15% 39% 40% 21%
OKLAHOMA 203,000 33% 53% NA 49% 35% 16%
OREGON 459,000 15% 74% 11% 31% 53% 16%
PENNSYLVANIA 942,000 21% 60% 19% 36% 41% 23%
RHODE ISLAND 87,000 24% 60% 16% 32% 44% 24%
SOUTH CAROLINA 280,000 27% 63% NA 49% 41% 11%
SOUTH DAKOTA 38,000 31% 48% 21% 45% 36% 19%
TENNESSEE 482,000 23% 61% 16% 43% 37% 20%
TEXAS 1,016,000 24% 63% 13% 51% 33% 16%
UTAH 97,000 NA 63% 18% 37% 39% 24%
VERMONT 54,000 20% 59% 20% 31% 47% 22%
VIRGINIA 298,000 33% 53% NA 52% 35% 12%
WASHINGTON 705,000 20% 62% 18% 38% 38% 23%
WEST VIRGINIA 194,000 31% 54% 15% 47% 38% 15%
WISCONSIN 303,000 26% 51% 24% 38% 37% 25%
WYOMING 20,000 26% 59% 15% 38% 38% 24%Notes: NA= estimate does not meet minimum standard for statistical reliability. Full-Time is based on total number of hours worked per week (at least 35 hours). Full-time
workers may be simultaneously working more than one-job. Note that total number of non-elderly, non-SSI adults from survey data may be lower than state administrative
data.
Source: Kaiser Family Foundation analysis of March 2017 Current Population Survey.
Appendix Table 1: Family and Own Work Status of Non-SSI, Nonelderly Adult Medicaid Enrollees, 2016
Family Work Status Own Work Status
Understanding the Intersection of Medicaid and Work 9
Appendix Tables

Ill or Disabled Caretaking
Attending
School Other Reason
US TOTAL 36% 30% 15% 19%
ALABAMA 41% 23% 14% 22%
ALASKA 26% 26% NA 21%
ARIZONA 37% 34% NA 19%
ARKANSAS 53% 27% NA 14%
CALIFORNIA 28% 36% 18% 17%
COLORADO 36% 30% NA NA
CONNECTICUT 35% 30% 22% NA
DELAWARE 42% 21% 13% 24%
DISTRICT OF COLUMBIA 26% 27% 19% 28%
FLORIDA 36% 29% 14% 21%
GEORGIA 47% 28% NA NA
HAWAII 33% 32% NA 26%
IDAHO 39% 26% NA 24%
ILLINOIS 36% 26% 14% 24%
INDIANA 47% 26% NA 23%
IOWA 37% 30% 14% NA
KANSAS 42% NA NA NA
KENTUCKY 51% 27% NA NA
LOUISIANA 29% 27% 23% 21%
MAINE 52% 33% NA NA
MARYLAND 39% NA 17% NA
MASSACHUSETTS 42% 22% 9% 27%
MICHIGAN 39% 31% 12% 18%
MINNESOTA 35% NA NA 33%
MISSISSIPPI 48% 24% NA NA
MISSOURI 54% 31% NA NA
MONTANA 37% 33% 18% NA
NEBRASKA 40% NA NA NA
NEVADA 28% 39% NA NA
NEW HAMPSHIRE 49% NA NA 27%
NEW JERSEY 27% 23% 31% 19%
NEW MEXICO 29% 33% 19% 19%
NEW YORK 26% 28% 24% 22%
NORTH CAROLINA 40% 31% 20% NA
NORTH DAKOTA 32% NA NA NA
OHIO 58% 30% NA NA
OKLAHOMA 29% 40% NA 18%
OREGON 24% 39% NA 23%
PENNSYLVANIA 45% 19% 15% 21%
RHODE ISLAND 37% 29% NA 32%
SOUTH CAROLINA 52% 32% NA NA
SOUTH DAKOTA 29% NA NA NA
TENNESSEE 41% 27% 17% 15%
TEXAS 33% 35% 14% 17%
UTAH 39% 36% NA NA
VERMONT 56% 29% NA NA
VIRGINIA 46% 27% NA NA
WASHINGTON 29% 26% 15% 29%
WEST VIRGINIA 41% 34% 12% 14%
WISCONSIN 43% 39% NA NA
WYOMING 62% 30% NA NA
Appendix Table 2: Reason for Not Working Among Non-SSI, Nonelderly Adult Medicaid
Enrollees, 2016
Notes: NA= estimate does not meet minimum standard for statistical reliability.
Source: Kaiser Family Foundation analysis of March 2017 Current Population Survey.
Understanding the Intersection of Medicaid and Work 10

<50
Employees
50-99
Employees
100+
Employees
Agricult./
Service
Educ./
Health
Prof/Public
Admin Manufacturing Top Industry
US TOTAL 42% 8% 51% 40% 21% 18% 14% Restaurants/Food Service
ALABAMA 34% NA 61% 40% 19% NA 26% NA
ALASKA 51% NA 41% 43% 23% 13% 11% Construction
ARIZONA 44% 6% 50% 44% 16% 24% 13% Construction
ARKANSAS 45% NA 48% 26% 30% 22% 13% NA
CALIFORNIA 47% 8% 45% 42% 17% 19% 15% Restaurants/Food Service
COLORADO 44% NA 52% 39% 16% 21% NA NA
CONNECTICUT 30% NA 60% 37% 28% 19% 15% Construction
DELAWARE 30% NA 61% 48% 21% 20% NA Restaurants/Food Service
DISTRICT OF COLUMBIA 31% 10% 59% 34% 27% 26% 6% Restaurants/Food Service
FLORIDA 40% 5% 55% 46% 18% 21% 8% Restaurants/Food Service
GEORGIA 36% NA 58% 42% 17% 21% NA NA
HAWAII 58% NA 38% 45% 18% 14% NA NA
IDAHO 39% NA 52% 39% 27% 19% NA NA
ILLINOIS 37% 9% 54% 40% 20% 16% 18% Restaurants/Food Service
INDIANA 33% 9% 58% 25% 18% 23% 27% NA
IOWA 33% NA 60% 35% 21% 19% 23% Elementary/Secondary Schools
KANSAS 39% NA 53% 39% 25% NA NA NA
KENTUCKY 47% NA 48% 43% 16% 21% 14% NA
LOUISIANA 37% 9% 53% 44% 24% 14% 11% Restaurants/Food Service
MAINE 52% NA 43% 57% 27% NA NA NA
MARYLAND 41% NA 55% 37% 27% 22% NA Restaurants/Food Service
MASSACHUSETTS 39% 10% 51% 40% 26% 18% 10% Restaurants/Food Service
MICHIGAN 37% 10% 53% 33% 23% 16% 19% Restaurants/Food Service
MINNESOTA 35% 13% 52% 39% 24% 19% 12% NA
MISSISSIPPI 42% NA 55% 52% 17% 12% 11% Furniture manufacturing
MISSOURI 33% NA 56% 30% 23% 20% 20% NA
MONTANA 56% NA 37% 48% 20% 21% NA Construction
NEBRASKA 35% NA 59% 35% 22% 32% NA NA
NEVADA 38% NA 55% 53% NA 24% NA NA
NEW HAMPSHIRE 38% NA 55% 47% 24% NA NA NA
NEW JERSEY 46% 10% 43% 36% 26% 13% 14% NA
NEW MEXICO 45% 8% 47% 50% 20% 16% 7% Construction
NEW YORK 46% 7% 47% 38% 25% 17% 14% Restaurants/Food Service
NORTH CAROLINA 44% NA 53% 42% 17% 19% 18% Construction
NORTH DAKOTA 43% NA 44% 44% NA NA NA NA
OHIO 36% 5% 59% 40% 23% 17% 16% Restaurants/Food Service
OKLAHOMA 37% NA 58% 42% 24% NA 13% NA
OREGON 53% 6% 41% 40% 21% 19% 14% Restaurants/Food Service
PENNSYLVANIA 35% 9% 57% 36% 23% 18% 17% Restaurants/Food Service
RHODE ISLAND 38% NA 55% 39% 25% NA 19% NA
SOUTH CAROLINA 29% NA 64% 41% 18% 17% 20% NA
SOUTH DAKOTA 37% NA 47% 47% NA NA NA NA
TENNESSEE 42% NA 53% 34% 19% 16% 26% Restaurants/Food Service
TEXAS 40% 6% 54% 41% 19% 22% 10% Restaurants/Food Service
UTAH 36% 0% 64% 44% NA 21% NA NA
VERMONT 58% NA 38% 36% 26% 18% NA NA
VIRGINIA 56% NA 41% 41% 26% NA NA NA
WASHINGTON 42% 13% 45% 46% 24% 16% 10% Glass manufacturing
WEST VIRGINIA 39% 10% 51% 38% 21% 15% 21% Restaurants/Food Service
WISCONSIN 43% NA 50% 38% 23% NA 16% NA
WYOMING 40% NA 50% 30% 25% NA 16% NA
Industry
Appendix Table 3: Characteristics of Working Nonelderly Adult Medicaid Enrollees, 2016
Notes: NA= estimate does not meet minimum standard for statistical reliability.
Source: Kaiser Family Foundation analysis of March 2017 Current Population Survey.
Firm Size
Understanding the Intersection of Medicaid and Work 11
Age 19-25 Age 26-45 Age 46+ Women Men
White, Non-
Hispanic
Black, Non-
Hispanic Hispanic
Other Non-
Hispanic
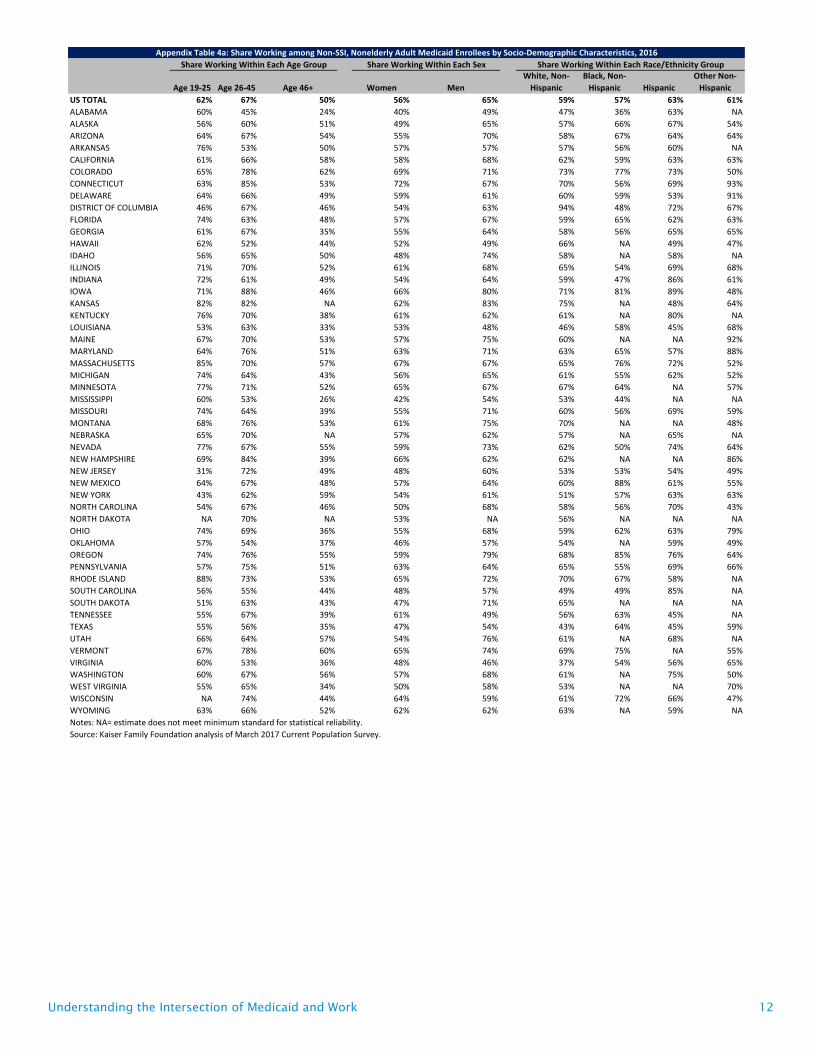
US TOTAL 62% 67% 50% 56% 65% 59% 57% 63% 61%
ALABAMA 60% 45% 24% 40% 49% 47% 36% 63% NA
ALASKA 56% 60% 51% 49% 65% 57% 66% 67% 54%
ARIZONA 64% 67% 54% 55% 70% 58% 67% 64% 64%
ARKANSAS 76% 53% 50% 57% 57% 57% 56% 60% NA
CALIFORNIA 61% 66% 58% 58% 68% 62% 59% 63% 63%
COLORADO 65% 78% 62% 69% 71% 73% 77% 73% 50%
CONNECTICUT 63% 85% 53% 72% 67% 70% 56% 69% 93%
DELAWARE 64% 66% 49% 59% 61% 60% 59% 53% 91%
DISTRICT OF COLUMBIA 46% 67% 46% 54% 63% 94% 48% 72% 67%
FLORIDA 74% 63% 48% 57% 67% 59% 65% 62% 63%
GEORGIA 61% 67% 35% 55% 64% 58% 56% 65% 65%
HAWAII 62% 52% 44% 52% 49% 66% NA 49% 47%
IDAHO 56% 65% 50% 48% 74% 58% NA 58% NA
ILLINOIS 71% 70% 52% 61% 68% 65% 54% 69% 68%
INDIANA 72% 61% 49% 54% 64% 59% 47% 86% 61%
IOWA 71% 88% 46% 66% 80% 71% 81% 89% 48%
KANSAS 82% 82% NA 62% 83% 75% NA 48% 64%
KENTUCKY 76% 70% 38% 61% 62% 61% NA 80% NA
LOUISIANA 53% 63% 33% 53% 48% 46% 58% 45% 68%
MAINE 67% 70% 53% 57% 75% 60% NA NA 92%
MARYLAND 64% 76% 51% 63% 71% 63% 65% 57% 88%
MASSACHUSETTS 85% 70% 57% 67% 67% 65% 76% 72% 52%
MICHIGAN 74% 64% 43% 56% 65% 61% 55% 62% 52%
MINNESOTA 77% 71% 52% 65% 67% 67% 64% NA 57%
MISSISSIPPI 60% 53% 26% 42% 54% 53% 44% NA NA
MISSOURI 74% 64% 39% 55% 71% 60% 56% 69% 59%
MONTANA 68% 76% 53% 61% 75% 70% NA NA 48%
NEBRASKA 65% 70% NA 57% 62% 57% NA 65% NA
NEVADA 77% 67% 55% 59% 73% 62% 50% 74% 64%
NEW HAMPSHIRE 69% 84% 39% 66% 62% 62% NA NA 86%
NEW JERSEY 31% 72% 49% 48% 60% 53% 53% 54% 49%
NEW MEXICO 64% 67% 48% 57% 64% 60% 88% 61% 55%
NEW YORK 43% 62% 59% 54% 61% 51% 57% 63% 63%
NORTH CAROLINA 54% 67% 46% 50% 68% 58% 56% 70% 43%
NORTH DAKOTA NA 70% NA 53% NA 56% NA NA NA
OHIO 74% 69% 36% 55% 68% 59% 62% 63% 79%
OKLAHOMA 57% 54% 37% 46% 57% 54% NA 59% 49%
OREGON 74% 76% 55% 59% 79% 68% 85% 76% 64%
PENNSYLVANIA 57% 75% 51% 63% 64% 65% 55% 69% 66%
RHODE ISLAND 88% 73% 53% 65% 72% 70% 67% 58% NA
SOUTH CAROLINA 56% 55% 44% 48% 57% 49% 49% 85% NA
SOUTH DAKOTA 51% 63% 43% 47% 71% 65% NA NA NA
TENNESSEE 55% 67% 39% 61% 49% 56% 63% 45% NA
TEXAS 55% 56% 35% 47% 54% 43% 64% 45% 59%
UTAH 66% 64% 57% 54% 76% 61% NA 68% NA
VERMONT 67% 78% 60% 65% 74% 69% 75% NA 55%
VIRGINIA 60% 53% 36% 48% 46% 37% 54% 56% 65%
WASHINGTON 60% 67% 56% 57% 68% 61% NA 75% 50%
WEST VIRGINIA 55% 65% 34% 50% 58% 53% NA NA 70%
WISCONSIN NA 74% 44% 64% 59% 61% 72% 66% 47%
WYOMING 63% 66% 52% 62% 62% 63% NA 59% NA
Share Working Within Each Age Group Share Working Within Each Sex
Appendix Table 4a: Share Working among Non-SSI, Nonelderly Adult Medicaid Enrollees by Socio-Demographic Characteristics, 2016
Share Working Within Each Race/Ethnicity Group
Notes: NA= estimate does not meet minimum standard for statistical reliability.
Source: Kaiser Family Foundation analysis of March 2017 Current Population Survey.
Understanding the Intersection of Medicaid and Work 12

< High
School
High
School
Some
College BA or Higher Fair/Poor Good
Excellent/ Very
Good
US TOTAL 51% 58% 64% 69% 33% 63% 70%
ALABAMA 35% 40% 56% 43% 28% 40% 54%
ALASKA 49% 59% 58% 57% 42% 51% 75%
ARIZONA 57% 61% 68% 65% 31% 66% 74%
ARKANSAS 44% 60% 63% 60% 43% 50% 75%
CALIFORNIA 58% 60% 66% 69% 38% 64% 70%
COLORADO 33% 64% 87% 82% NA 75% 80%
CONNECTICUT 60% 62% 73% 88% 68% 65% 73%
DELAWARE 49% 57% 65% 73% NA 51% 79%
DISTRICT OF COLUMBIA 54% 49% 65% 69% 25% 65% 62%
FLORIDA 61% 58% 65% 62% 36% 50% 75%
GEORGIA 58% 60% 57% 51% NA 72% 64%
HAWAII 57% 47% 46% 66% NA 57% 59%
IDAHO 50% 53% 58% 76% 43% 61% 68%
ILLINOIS 41% 65% 72% 67% 34% 66% 75%
INDIANA 50% 53% 62% 79% 27% 53% 82%
IOWA 37% 77% 73% 78% 42% 85% 76%
KANSAS NA 79% 70% 57% 38% 62% 81%
KENTUCKY 54% 65% 55% 79% NA 79% 72%
LOUISIANA 34% 55% 58% 65% 40% 51% 58%
MAINE NA 64% 67% 66% 21% 66% 79%
MARYLAND 50% 71% 70% 65% 38% 65% 75%
MASSACHUSETTS 47% 69% 67% 75% 35% 68% 79%
MICHIGAN 46% 61% 60% 65% 35% 65% 67%
MINNESOTA 46% 61% 68% 81% 43% 67% 73%
MISSISSIPPI 33% 43% 54% 74% 20% 52% 59%
MISSOURI 38% 69% 57% 72% NA 55% 83%
MONTANA 53% 64% 65% 83% 41% 65% 77%
NEBRASKA NA 57% 68% NA NA 75% 61%
NEVADA 46% 69% 65% 69% 48% 65% 70%
NEW HAMPSHIRE 65% 64% 58% 85% 34% 78% 79%
NEW JERSEY 41% 63% 42% 55% 30% 61% 56%
NEW MEXICO 46% 60% 64% 72% 38% 57% 72%
NEW YORK 53% 51% 61% 68% 32% 61% 62%
NORTH CAROLINA 51% 53% 63% 61% 33% 58% 71%
NORTH DAKOTA NA 59% NA 60% NA NA 58%
OHIO 50% 53% 68% 79% 29% 64% 75%
OKLAHOMA 45% 41% 67% 58% NA 43% 64%
OREGON 72% 68% 63% 79% 35% 77% 79%
PENNSYLVANIA 52% 64% 61% 73% 39% 70% 74%
RHODE ISLAND 45% 68% 79% 73% 39% 62% 88%
SOUTH CAROLINA 30% 58% 54% 63% NA 51% 71%
SOUTH DAKOTA NA 55% 68% 74% NA 59% 64%
TENNESSEE 48% 48% 74% 70% NA 70% 72%
TEXAS 44% 40% 57% 73% 25% 57% 58%
UTAH NA 61% 75% 62% NA 74% 70%
VERMONT 52% 66% 71% 81% 44% 73% 76%
VIRGINIA NA 45% 83% NA 34% 46% 58%
WASHINGTON 55% 69% 54% 69% 42% 65% 69%
WEST VIRGINIA 37% 50% 68% 62% 30% 60% 63%
WISCONSIN 51% 55% 73% 75% 31% 77% 73%
WYOMING 67% 55% 68% 59% NA 75% 75%
Appendix Table 4b: Share Working among Non-SSI, Nonelderly Adult Medicaid Enrollees by Socio-Demographic Characteristics,
2016
Notes: NA= estimate does not meet minimum standard for statistical reliability.
Source: Kaiser Family Foundation analysis of March 2017 Current Population Survey.
Share Working Within Each Education Level Share Working Within Each Health Status Group
The Henry J. Kaiser Family Foundation Headquarters: 2400 Sand Hill Road, Menlo Park, CA 94025 | Phone 650-854-9400
Washington Offices and Barbara Jordan Conference Center: 1330 G Street, NW, Washington, DC 20005 | Phone 202-347-5270
www.kff.org | Email Alerts: kff.org/email | facebook.com/KaiserFamilyFoundation | twitter.com/KaiserFamFound
Filling the need for trusted information on national health issues, the Kaiser Family Foundation is a nonprofit organization based in Menlo Park, California.