Embed Size (px)
Citation preview

Understanding the Leave voteAuthor: Kirby Swales

Acknowledgements: Thank you to the following people who assisted in the production of this report: Allison Dunatchik, Anne Summers, Curtis Jessop, Ian Simpson, John Curtice, Leigh Marshall, Martin Wood, Matt Jonas and Sean Willmott. With thanks also to UK and a Changing Europe and ESRC for funding this project.
NatCen Social Research35 Northampton SquareLondonEC1V 0AXTel. 020 7250 1866Fax. 020 7250 1524E-mail: [email protected]
Cover photo: BTN/LMUG photowalk. 2012. © Flickr/Betsy Weber

NatCen Social Research: Understanding the Leave vote 1
Contents
1 Summary 2
2 Introduction 3
Data sources 3
3 Background 4
The rise of Euroscepticism 4
What tipped the balance? 5
4 The demographics of the vote 7
Objective characteristics 7
Subjective characteristics 7
5 The policy issues at stake 13
Which issues were most important in the Referendum? 13
Did views on the EU vote match wider policy concerns? 14
The EU vote in the context of general political attitudes 15
6 The politics of the vote 19
The role of ‘new’ voters 19
Understanding turnout 19
How did political allegiance influence the vote? 20
Did the public know where MPs stood? 21
7 Segmenting the population 25
8 Conclusions 27
Notes and references 28
2 NatCen Social Research: Understanding the Leave vote
1 Summary
Identity politics played a roleThe Leave victory was not about objective demographics alone. Matters of identity were equally, if not more strongly, associated with the Leave vote – particularly feelings of national identity and sense of change over time.
Voters not persuaded by arguments about economic risksThe Leave campaign resonated more strongly with the public. There was a greater sense of certainty about what impact leaving the EU would have on immigration and independence. People were less persuaded by the Remain campaign’s focus on the economic risks.
‘New voters’ leant towards LeaveThe Referendum attracted a group of ‘new voters’ who did not participate in the 2015 General Election. A majority (60%) of this group voted Leave.
The vote split across traditional party linesThe Referendum was not decided along typical party political lines. It is clear that Conservative supporters rejected the position of their party leader, David Cameron. However, the position of Conservative MPs was better understood by the public than that of their Labour counterparts.
Conventional left-right politics do not help explain the Referendum vote. The public splits across party lines and people’s broader social values were more helpful at explaining the result.
Turnout favoured LeaveTurnout played a potentially decisive role. Those who said they leant towards Remain in the run-up to the Referendum were more likely to not vote (19% vs. 11% of Leave supporters). If turnout among supporters of both sides had been equal the vote would have been closer still.
Leave brought together a broad coalition of votersThe Leave campaign’s success was underpinned by a broad-based coalition of voters which is much more wide-ranging than the ‘left behind’. This included three main groups; affluent Eurosceptics, the older working class and a smaller group of economically disadvantaged, anti-Immigration voters.

NatCen Social Research: Understanding the Leave vote 3
2 Introduction What were the ‘real’ reasons behind the Brexit vote? It is one of the most pressing questions of our times and the level of comment and analysis has already been significant. The answer matters because interpretations will guide policy responses. Most obviously, it helps inform the type of relationship with the European Union that would be acceptable to public opinion as part of the eventual Brexit deal. Beyond this, what are the broader implications – for example, should it be interpreted as a call for more focus on tackling poverty, or income inequality, or for increasing community cohesion?
The UK Government is already signalling a major change in policy direction, in an attempt to tackle what they believe to be the underlying reasons for the Leave vote. In particular, Theresa May has stated that her Government will be focussed on supporting the ‘JAMs’ (just about managing) and will be less driven by the needs of big business. The election of Donald Trump in the US has further reinforced a sense of changing political times, and that these results represent a shock to the political order. There are a number of important European elections in the coming year, which could also see a similar phenomenon.
Social and political science has an important role to play in helping politicians and others understand the vote to leave the EU, by bringing evidence, analysis and theory to bear. The purpose of this report is to provide a high-level overview of the main findings from an analysis of the latest and highest quality data. We hope that it will stimulate debate, discussion and further research. We use three main data sources, described below.
This report, and the accompanying table annex and discussion event, have been produced as part of the UK in Changing Europe initiative. We are very grateful to the ESRC for their support.
Data sourcesThis report is based on a synthesis of evidence from three of the highest quality sources of data available on the EU Referendum. Data from other relevant sources and reports is also referenced where relevant.
British Social AttitudesBritish Social Attitudes is the longest running study of political, social and moral attitudes in Britain. The study is an annual cross-sectional study using a sample of around 3,000 adults, selected using a random probability method. The survey tracks attitudes to the EU and relevant policy issues all the way back to 1983.
www.bsa.natcen.ac.uk
NatCen Panel Pre- and Post-Referendum surveysThe NatCen Panel is a research panel of nearly 4,000 people in Britain, recruited via the British Social Attitudes survey, using a random probability sampling method. Those taking part receive invitations to take part in surveys around once every two months.Two surveys about the EU Referendum have been carried out using the panel; one just before the Referendum, in May/Junea, and the other afterwards in September.
www.natcen.ac.uk/probability-panel
British Election Study Internet PanelThe British Election Study Internet Panel is a panel of around 30,000 individuals. The panel was recruited using quota sampling methods, via YouGov’s self-selecting online panel. The panel study asks the same questions at key points over the electoral cycle so the evolution of voter attitudes can be tracked over time.
www.britishelectionstudy.com

4 NatCen Social Research: Understanding the Leave vote
3 Background
The rise of EuroscepticismOn 23rd June 2016, the United Kingdom voted to leave the European Union with 17.4 million people voting Leave and 16.1 million voting Remain (equivalent to 51.9% and 48.1%). The Referendum was called by a Conservative Prime Minister in response to pressure from a strong Eurosceptic movement within his own party and the potential political threat from the rise of the UK Independence Party. The Government was pro-Remain but it allowed senior members of the party to campaign for the Leave side.
This was not the first time the public had been asked for their views on Britain’s relationship with Europe. The previous Referendum in 1975 was called by the Labour Party, which was internally divided on the benefits of the Conservative Government’s decision to join the European Economic Community (EEC)in 1973. The Referendum asked the public to vote ‘yes’ or ‘no’ to remaining in the EEC. In the event, Yes won with 67% of the vote, though it should be noted that the vast majority of the media and political establishment supported remaining within the EEC.b
1992 1993 1994 1995 1996 1997 1998 1999 2000 2001 2002 2003 2004 2005 2006 2008 2012 2013 2014 2015 2016
Base: British Social Attitudes 1993-2015, expt. 1992 British Election Study
Maastricht treaty
Schengen agreement introduced
EU bans exportof British beef
European SocialCharter signed
Euro introduced
Ten new countries inEastern and CentralEurope join the EU
Great recessionbegins, followed byEurozone debt crisis
David Cameronpromises renegotiationand a referendum
UK votes leave in Referendum
Figure 1. Long-term rise in Euroscepticism
0%
10%
20%
30%
40%
50%
60%
70%
Leave the EU Stay in EU but reduce its powers

NatCen Social Research: Understanding the Leave vote 5
1 Question: Do you think Britain’s long-term policy should be … to leave the European Union, to stay in the EU and try to reduce the EU’s powers, to leave things as they are, to stay in the EU and try to increase the EU’s powers, or to work for the formation of a single European government?
Between 1975 and 2016, we have seen many events in the history of British-European relations. NatCen has been tracking overall attitudes to the European Union since 1993 (see Figure 1).1 The core anti-European vote remained stable during the 1990s and early 2000s but rose steeply afterwards, doubling from 15% to 30% between 2006 and 2012. Alongside this, there has been a long-term rise in more general scepticism about the EU.
By 2015 there was clear evidence that the UK was in a Eurosceptic mood, with two thirds opposed to the UK’s existing relationship with the EU. Twenty two per cent said that we should leave the EU and 43% wanted a reduction in EU powers. It has been argued that Euroscepticism was not new but best seen as the intensification of a climate of opinion already present since the mid-1990s (in the wake of the EU export ban on British Beef).c This mood of rising Euroscepticism can go some way to explaining why the Prime Minister, David Cameron, proposed renegotiating EU membership.
Nevertheless, the proportion who thought that the UK should actually leave was 26% in 2015 (albeit this had risen from 17% in 1997).d So, whilst there were strong feelings
against Europe, the majority clearly felt that, on balance, remaining in the EU was the best course of action.
What tipped the balance? On the face of it, people were weighing up the arguments and policies of the respective campaigns. For the Leave campaign, the key messages were mainly about ‘taking back control’ of borders, law-making, and the money Britain contributes to the EU budget. For the Remain side, the main arguments were about the economic benefits of membership and maintaining influence in the world.
However, we also know that voters are influenced by other factors. They will listen to the views of others, including party leaders and also the media, celebrities and their peers. There is also a role for ‘identity’ politics, where peoples’ vote is more driven by their perceived position in society and background characteristics. In this paper, we therefore focus on three main themes: (i) the demographics of the vote, (ii) the policy issues at stake, and (iii) the politics of the vote.

6 NatCen Social Research: Understanding the Leave vote

NatCen Social Research: Understanding the Leave vote 7
4 The demographics of the vote In this section, we look at who voted Leave in terms of objective characteristics like income, as well as opinions on things like the trajectory of life in Britain. We also examine newspaper readership.
Objective characteristicsFigure 2 shows the proportion of voters who chose Leave, broken down by a range of objective characteristics. Those most likely to vote Leave were:
• Those with no formal education qualifications (78%) or whose highest qualifications are CSEs or O-levels (61%)
• Those with an income of less than £1,200 per month (66%)
• Those in social housing provided by a local authority (70%) or housing association (68%)
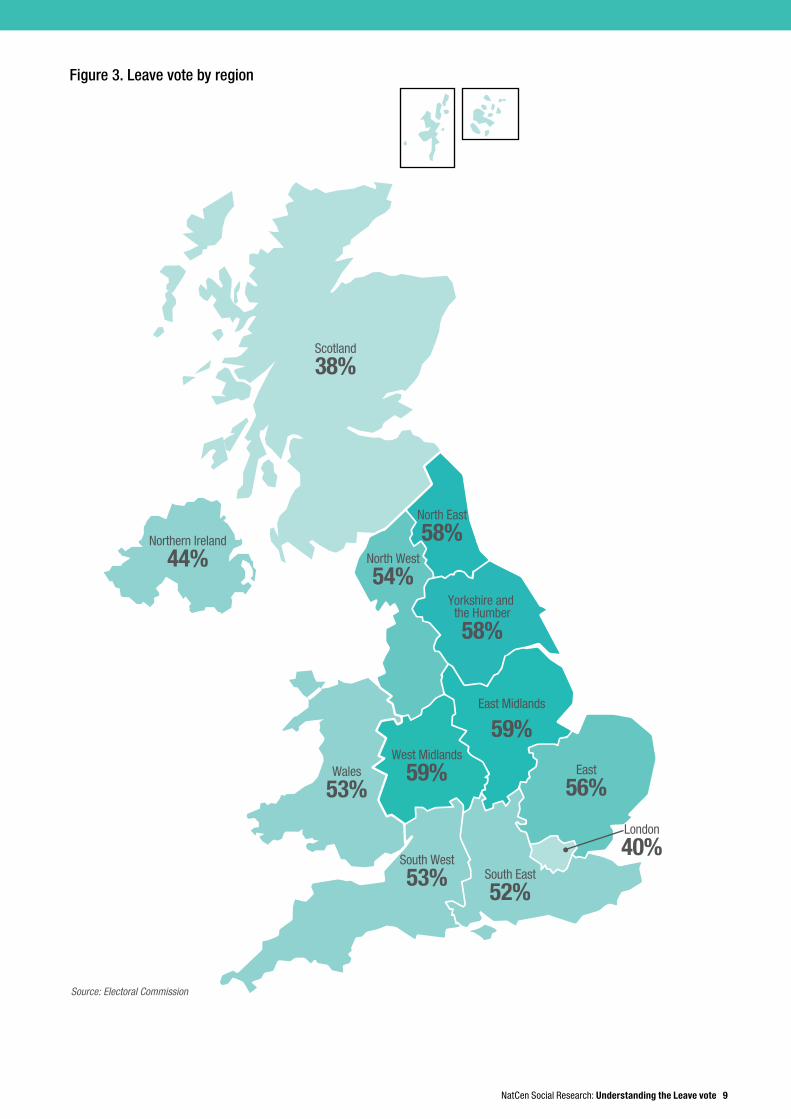
There are some other important differences in voting patterns. In particular those from minority ethnic groups were much less likely to vote Leave. For example, according to the British Election Study, 29% of Black adults and 32% of Asian adults voted Leave. In the NatCen Panel, men were also more likely to vote Leave (at 54%). There were important regional differences too, with the Leave vote highest in the East and West Midlands, and lowest in London and Scotland (see Figure 3). A more detailed geographical analysis by the Resolution Foundation shows that the vote was more highly polarised at Local Authority (LA) level; the Leave vote was over 70% in eight LAs, and higher than 60% in 102.e
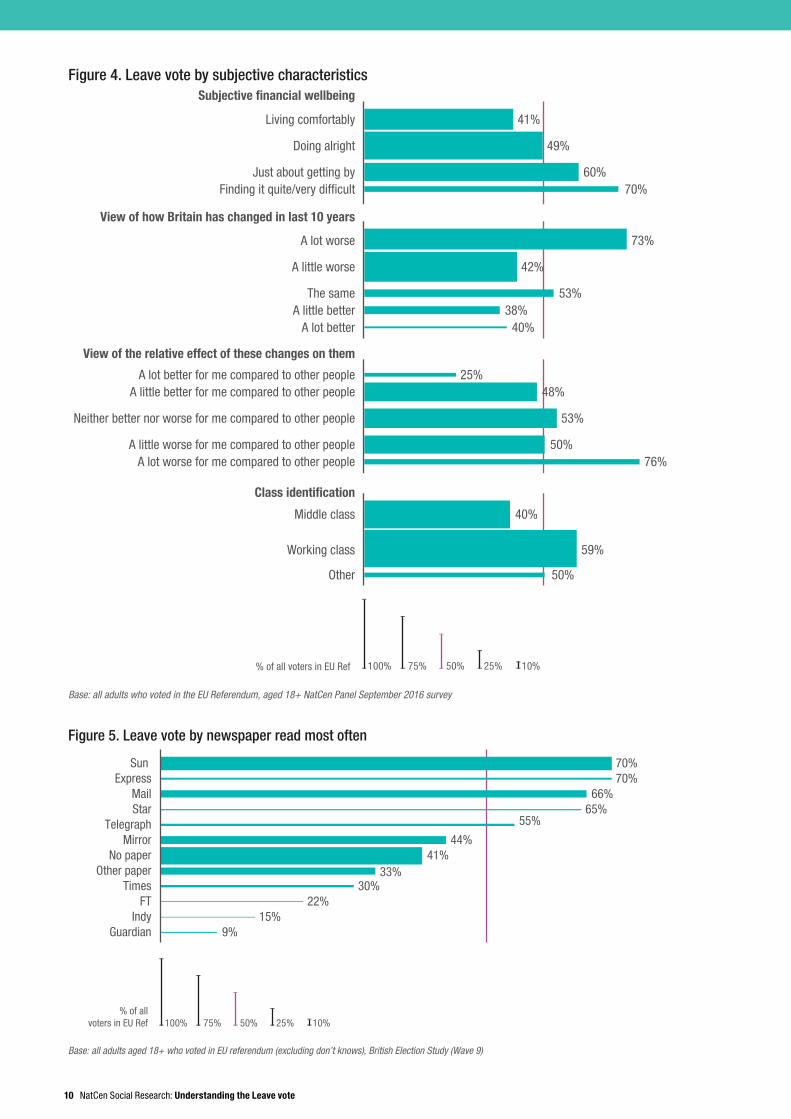
Subjective characteristicsFigure 4 looks at a range of subjective characteristics, such as financial well-being and
national identity. The groups most likely to vote Leave were:
• Those finding it difficult to manage financially (70%) or just about getting by (60%)
• Those who believed Britain has got a lot worse in the last ten years (73%)
• Those who think things have got worse for them rather than other people (76%)
• Those who perceive themselves as working class (59%)
• Those who see themselves as English rather than British (74%) or more English than British (62%)
Finally, Figure 5 shows the proportion voting Leave for each main daily newspaper. The papers with the highest proportion of Leave votes were the Sun and Express (both 70%), the Mail (66%) and the Star (65%). The other newspaper where the majority of the readership voted Leave was the Telegraph, though the proportion was lower (at 55%).
It is clear that the Leave vote was most concentrated amongst those with least economic resources. However, in order to win the Referendum, the Leave vote mobilised a broader base of supporters. Almost half of those who said they were ‘doing alright’ financially voted Leave, as well as almost 40% of those describing themselves as middle class.
There is no simple explanation for the Leave victory based on demographics alone, though it is clear that age, levels of education, income and newspaper readership are all related to the likelihood of voting Leave. Beyond this, matters of identity are equally if not more strongly associated with the vote to Leave – particularly feelings of national identity and sense of change over time.

8 NatCen Social Research: Understanding the Leave vote
54%
49%
40%
50%
52%
51%
61%
51%
34%
37%
32%
29%
43%
47%
70%
68%
50%
52%
50%
26%
50%
61%
78%
66%
57%
51%
38%
Male
Female
18-34
35-44
45-54
55-64
65+
White British
Other white
Mixed
Asian
Black
Other
Owned/being bought
Rented (Local Authority)
Rented (housing association)
Private rental
Urban
Rural
Degree
Higher educ below degree/A level
O level or equiv/CSE
No quali�cation
Less than £1,200 p.m.
£1,201 - 2,200 p.m.
£2,201 - 3,700 p.m.
£3,701 or more p.m.
Base: all adults who voted in the EU Referendum, aged 18+ NatCen Panel May 2016 and September 2016 survey
% of all voters in EU Ref 10%100% 75% 50% 25%
Figure 2. Leave vote by objective characteristics
Sex
Age
Ethnicity
Housing tenure
Location
Education
Income
NatCen Social Research: Understanding the Leave vote 9
Scotland
38%
Northern Ireland
44%
North East
58%
the Humber
58%
North West
54%
Wales
53%
East Midlands
59%West Midlands
59% East
56%
South East
52%
London
40%South West
53%
Source: Electoral Commission
Figure 3. Leave vote by region
Yorkshire and
10 NatCen Social Research: Understanding the Leave vote
41%
49%
60%70%
73%
42%
53%38%
40%
25%48%
53%
50%76%
40%
59%
50%
Living comfortably
Doing alright
Just about getting byFinding it quite/very dif�cult
A lot worse
A little worse
The sameA little better
A lot better
A lot better for me compared to other peopleA little better for me compared to other people
Neither better nor worse for me compared to other people
A little worse for me compared to other peopleA lot worse for me compared to other people
Middle class
Working class
Other
Figure 4. Leave vote by subjective characteristics
Base: all adults who voted in the EU Referendum, aged 18+ NatCen Panel September 2016 survey
% of all voters in EU Ref 10%100% 75% 50% 25%
Subjective �nancial wellbeing
View of how Britain has changed in last 10 years
View of the relative effect of these changes on them
Class identi�cation
70%70%
66%65%
55%
44%41%
33%30%
22%15%
9%
Sun Express
MailStar
TelegraphMirror
No paperOther paper
TimesFT
IndyGuardian
Base: all adults aged 18+ who voted in EU referendum (excluding don’t knows), British Election Study (Wave 9)
% of allvoters in EU Ref 10%100% 75% 50% 25%
Figure 5. Leave vote by newspaper read most often

NatCen Social Research: Understanding the Leave vote 11
The Leave victory was not about demographics alone, though it is clear that age, levels of education, income and newspaper readership are all related to the likelihood of voting Leave.
Matters of identity were equally, if not more strongly associated with the Leave vote – particularly feelings of national identity and sense of change in Britain over time.
““

12 NatCen Social Research: Understanding the Leave vote

NatCen Social Research: Understanding the Leave vote 13
5 The policy issues at stakeIn this section, we look at the policy issues that were most important to people in the campaign, and how their views on these issues related to their vote in the Referendum. We also look at whether people’s general social and political attitudes may have played a role in their voting behaviour.
Which issues were most important in the Referendum?Figure 6 shows the relative importance of the issues at stake when people were asked directly about what influenced their vote. It is clear from this that there were three stand-out issues: the economy (21%), immigration (20%) and sovereignty (17%).f
The relationship between these issues and people’s vote is very strong, as was clear from analysis in the run-up to the Referendum.g According to the British Election Study, the
vast majority who said immigration (88%) or sovereignty (90%) was the most important issue voted Leave, compared to a small minority (15%) who said it was the economy.
The NatCen Panel found that people’s views on the likely impact of leaving the EU ahead of the Referendum were significantly associated with how they eventually voted. Those that felt that leaving the EU would give Britain more influence in the world, reduce unemployment, lower immigration, make the economy better off, and strengthen Britain’s security were all significantly more likely to vote Leave. The same pattern also applied to those who said that immigration had been negative for Britain, or that the EU had undermined Britain’s independence or sense of identity.
More people were sure that leaving the EU would lead to a fall in immigration than were sure that the economy would be worse off (66% and 43% respectively) – see Figure 7. Whilst the Leave vote was low amongst those who felt the economy would be worse off (17%), it was high amongst those who though there
21% 20% 17%
Campaign/outcome fairness
Foreign policy EU spending/regulations/
cost
British/englishidentity
Cosmopolitanism
7% 5% 5% 4% 3%
Protectionof rights
Sovereignty/EU bureaucracy
Economy
Immigration
2% 2% 2% 2%1%
Other stabilityor uncertainty
concern
Family
Socialidentity/
partisanship
EU integration/stability
Base: all adults aged 18+ who voted in EU referendum (excluding don’t knows & no answer), British Election Study Wave 8
Figure 6. Issues cited as most important in deciding EU Referendum position

14 NatCen Social Research: Understanding the Leave vote
Base: all adults who voted in the EU Referendum, aged 18+ NatCen Panel May 2016 and September 2016 survey
Figure 7. Agreement with key Leave and Remain campaign arguments
Leaving the EU would makeBritain's economy worse off
Leaving the EU would makeimmigration lower
EU membership underminesBritain's independence 66%
66%
43%
wouldn’t be much difference (68%) as well as those who thought it would be better off (84%). This supports the argument that the Remain campaign failed to persuade enough people that there would be a significant economic downside of leaving the EU.h
Did views on the EU vote match wider policy concerns?It is, of course, possible that people rationalise their voting intention by choosing supporting policy positions. For example, people who vote Leave would be unlikely to say the economy would be worse off if the UK left the EU. One way to begin to disentangle whether people’s thoughts about specific areas of EU membership were influencing their vote, or just reflecting their underlying intention, is to ask about their concerns outside the EU context.
The NatCen Panel post-Referendum survey asked what people thought the current priority for government should be. Those who voted Remain were significantly more likely to select education, poverty and inequality, and the economy as their concerns. Those who voted Leave were significantly more likely to select immigration. The biggest single distinguishing factor in terms of general priorities for government is immigration (47% of Leave voters compared to 16% Remain voters). This confirms that the issues that were most important in the EU Referendum – immigration
and the economy – broadly matched voters’ wider policy concerns.
It is also worth noting that Europe and the EU was significantly less likely to be selected overall than every issue other than unemployment, and less likely to be selected than education, the NHS, and immigration for those who voted Leave. This suggests that people were more focused on the domestic issues, rather than the detailed arguments about European relations.
We looked at the relationship between how people voted and what they thought the UK’s long-term EU policy should be (see Figure 8). This shows that a significant majority of those who think the UK’s long-term policy should be to stay in the EU and reduce its powers voted Remain in the Referendum. However, at the same time, around one in five, even though their underlying preference was to stay in the EU, voted Leave. People’s opinions about what the UK’s long-term policy towards the EU were gathered after the Referendum. Although support for withdrawing from the EU has increased there is still considerable support for simply reducing EU powers, even amongst a minority of Leave voters.

NatCen Social Research: Understanding the Leave vote 15
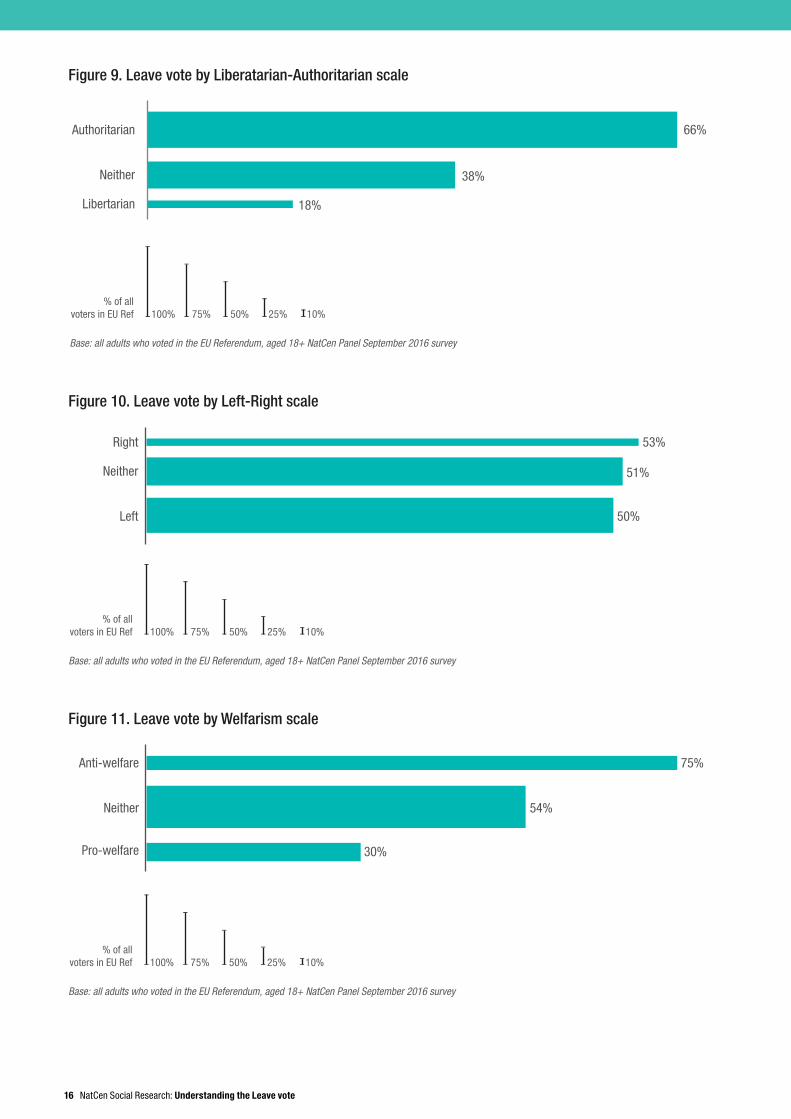
The EU vote in the context of general social and political attitudesThe final element we looked at is people’s general social and political attitudes, rather than their positions on the policy issues of the day. This tells us whether traditional political divides played out in the Referendum, or whether different values lay behind voter behaviour. In particular, there are three scales used in the British Social Attitudes survey which we used: the ‘libertarian- authoritarian’ scale; the ‘left-right’ scale; and the ‘welfarism’ scale (see details of how these scales are compiled in Notes and references).
People identified as ‘authoritarian’ were significantly more likely to vote Leave than those identified as ‘libertarian’, 66% compared with 18% respectively (see Figure 9).i However, there was no significant variation by whether people identified as left or right leaning (see Figure 10), and much less than in usual elections. Those identified as anti-welfare were significantly more likely to vote Leave than those who were pro-welfare (see Figure 11).
This section shows that the policy issues at stake in the Referendum were highly associated with the patterns of voting; those concerned about immigration and sovereignty/independence were much more likely to vote Leave. We also found that there was a greater sense of certainty about the impact of leaving the EU on immigration and independence, compared with impact on the economy. People were less persuaded by Remain arguments about the economic risks of leaving, than by Leave arguments around immigration.
Perhaps most interestingly, when we look at underlying political attitudes we find the left-right split is less important than people’s position on social values (what we call the ‘libertarian-authoritarian’ scale). This suggests that this debate might be increasingly decided by views on acceptable social behaviour and moral fairness, rather than redistribution and the role of the state. This is explored further in the next section when we look at the role of party politics.
95%
22%
6%
Leave the European Union
Stay in the EU and try to reduce the EU's powers
Stay in the EU and maintain or increase powers
Figure 8. Leave vote by opinion on long-term EU policy
Base: all adults who voted in the EU Referendum, aged 18+ NatCen Panel September 2016 survey
% of all voters in EU Ref 10%100% 75% 50% 25%
16 NatCen Social Research: Understanding the Leave vote
50%
51%
53%
Left
Neither
Right
Figure 10. Leave vote by Left-Right scale
Base: all adults who voted in the EU Referendum, aged 18+ NatCen Panel September 2016 survey
% of allvoters in EU Ref 10%100% 75% 50% 25%
30%
54%
75%
Pro-welfare
Neither
Anti-welfare
Figure 11. Leave vote by Welfarism scale
Base: all adults who voted in the EU Referendum, aged 18+ NatCen Panel September 2016 survey
% of allvoters in EU Ref 10%100% 75% 50% 25%
18%
38%
66%
Libertarian
Neither
Authoritarian
Figure 9. Leave vote by Liberatarian-Authoritarian scale
Base: all adults who voted in the EU Referendum, aged 18+ NatCen Panel September 2016 survey
% of allvoters in EU Ref 10%100% 75% 50% 25%

NatCen Social Research: Understanding the Leave vote 17
The Leave campaign resonated more strongly with the public. There was a greater sense of certainty about what impact leaving the EU would have on immigration and independence. People were less persuaded by the Remain campaign’s focus on the economic risks.
““

18 NatCen Social Research: Understanding the Leave vote
NatCen Social Research: Understanding the Leave vote 19
6 The politics of the voteIn this section, we look at whether the size of the Leave vote was boosted by differential turnout and whether there was a change between how people said they would vote and how they eventually did. We also look at the relationship between the vote and political affiliation and how well people understood the position of MPs.
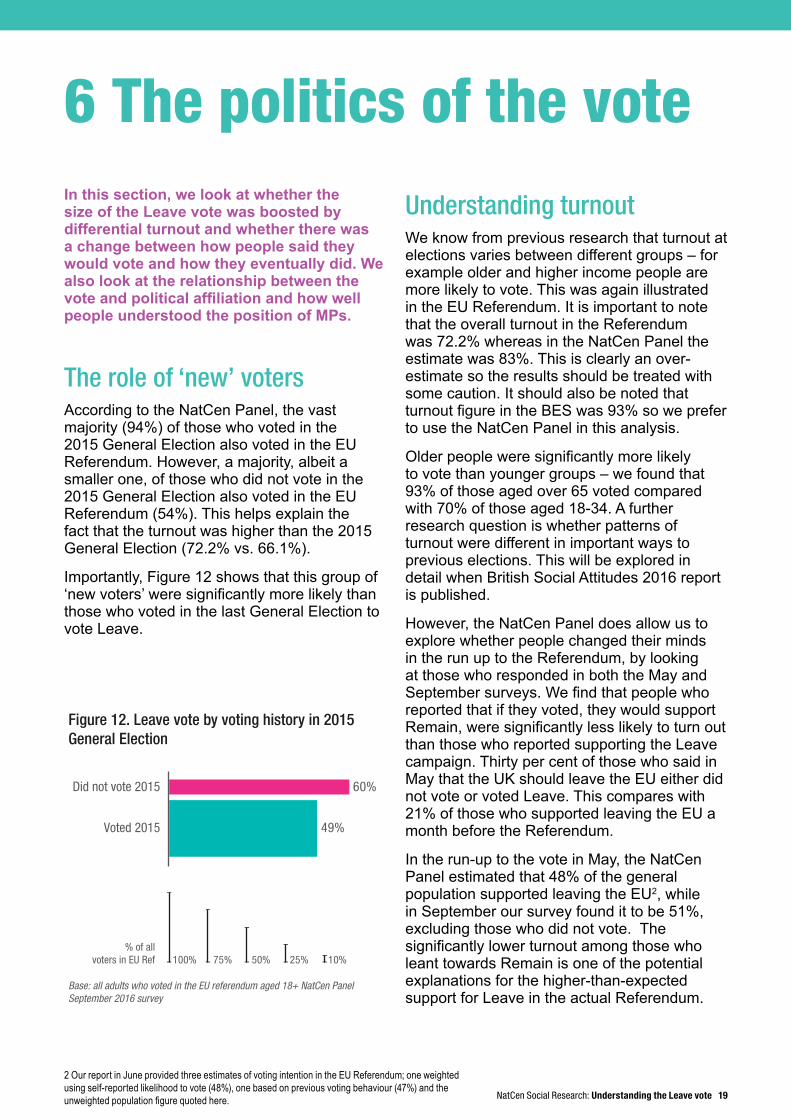
The role of ‘new’ votersAccording to the NatCen Panel, the vast majority (94%) of those who voted in the 2015 General Election also voted in the EU Referendum. However, a majority, albeit a smaller one, of those who did not vote in the 2015 General Election also voted in the EU Referendum (54%). This helps explain the fact that the turnout was higher than the 2015 General Election (72.2% vs. 66.1%).
Importantly, Figure 12 shows that this group of ‘new voters’ were significantly more likely than those who voted in the last General Election to vote Leave.
Understanding turnoutWe know from previous research that turnout at elections varies between different groups – for example older and higher income people are more likely to vote. This was again illustrated in the EU Referendum. It is important to note that the overall turnout in the Referendum was 72.2% whereas in the NatCen Panel the estimate was 83%. This is clearly an over-estimate so the results should be treated with some caution. It should also be noted that turnout figure in the BES was 93% so we prefer to use the NatCen Panel in this analysis.
Older people were significantly more likely to vote than younger groups – we found that 93% of those aged over 65 voted compared with 70% of those aged 18-34. A further research question is whether patterns of turnout were different in important ways to previous elections. This will be explored in detail when British Social Attitudes 2016 report is published.
However, the NatCen Panel does allow us to explore whether people changed their minds in the run up to the Referendum, by looking at those who responded in both the May and September surveys. We find that people who reported that if they voted, they would support Remain, were significantly less likely to turn out than those who reported supporting the Leave campaign. Thirty per cent of those who said in May that the UK should leave the EU either did not vote or voted Leave. This compares with 21% of those who supported leaving the EU a month before the Referendum.
In the run-up to the vote in May, the NatCen Panel estimated that 48% of the general population supported leaving the EU2, while in September our survey found it to be 51%, excluding those who did not vote. The significantly lower turnout among those who leant towards Remain is one of the potential explanations for the higher-than-expected support for Leave in the actual Referendum.
Did not vote 2015
Voted 2015
Base: all adults who voted in the EU referendum aged 18+ NatCen PanelSeptember 2016 survey
% of allvoters in EU Ref 10%100% 75% 50% 25%
Figure 12. Leave vote by voting history in 2015General Election
49%
60%
2 Our report in June provided three estimates of voting intention in the EU Referendum; one weighted using self-reported likelihood to vote (48%), one based on previous voting behaviour (47%) and the unweighted population figure quoted here.
20 NatCen Social Research: Understanding the Leave vote
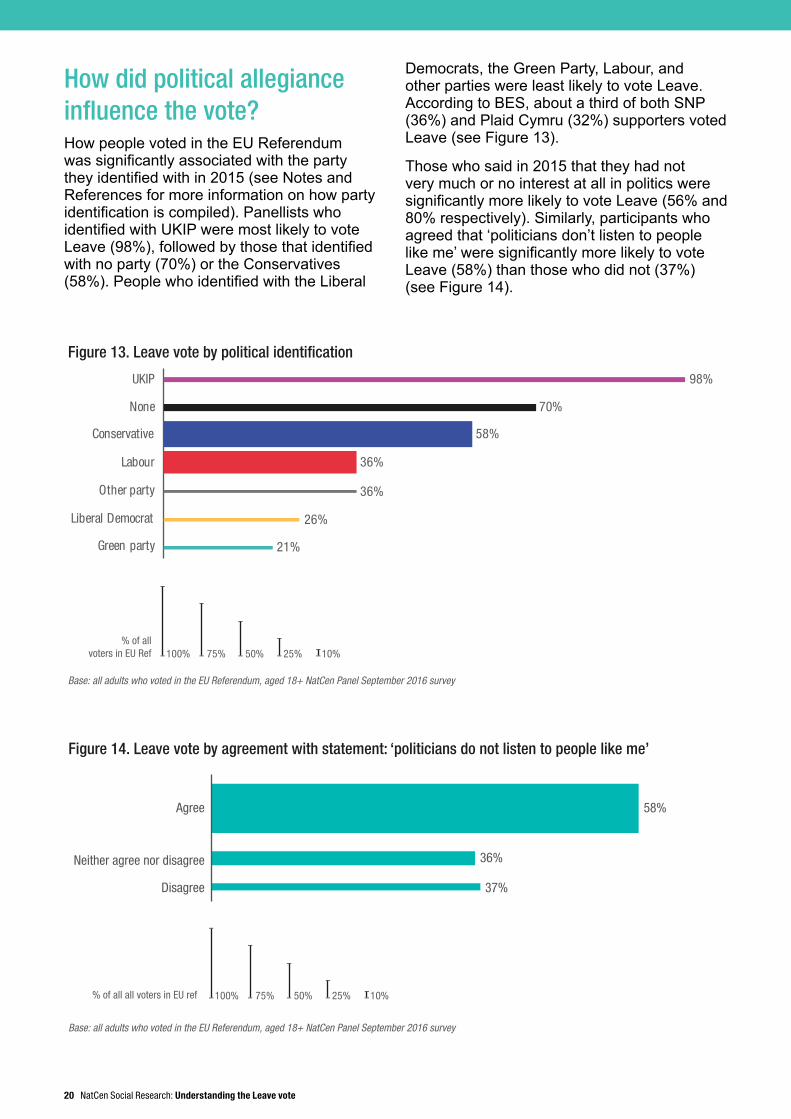
How did political allegiance influence the vote?How people voted in the EU Referendum was significantly associated with the party they identified with in 2015 (see Notes and References for more information on how party identification is compiled). Panellists who identified with UKIP were most likely to vote Leave (98%), followed by those that identified with no party (70%) or the Conservatives (58%). People who identified with the Liberal
Democrats, the Green Party, Labour, and other parties were least likely to vote Leave. According to BES, about a third of both SNP (36%) and Plaid Cymru (32%) supporters voted Leave (see Figure 13).
Those who said in 2015 that they had not very much or no interest at all in politics were significantly more likely to vote Leave (56% and 80% respectively). Similarly, participants who agreed that ‘politicians don’t listen to people like me’ were significantly more likely to vote Leave (58%) than those who did not (37%) (see Figure 14).
Conservative
Base: all adults who voted in the EU Referendum, aged 18+ NatCen Panel September 2016 survey
None
Other party
Green party
UKIP
Liberal Democrat
Labour
% of allvoters in EU Ref 10%100% 75% 50% 25%
Figure 13. Leave vote by political identification
98%
70%
58%
36%
36%
26%
21%
58%
36%
37%
Agree
Neither agree nor disagree
Disagree
Figure 14. Leave vote by agreement with statement: ‘politicians do not listen to people like me’
Base: all adults who voted in the EU Referendum, aged 18+ NatCen Panel September 2016 survey
% of all all voters in EU ref 10%100% 75% 50% 25%
NatCen Social Research: Understanding the Leave vote 21
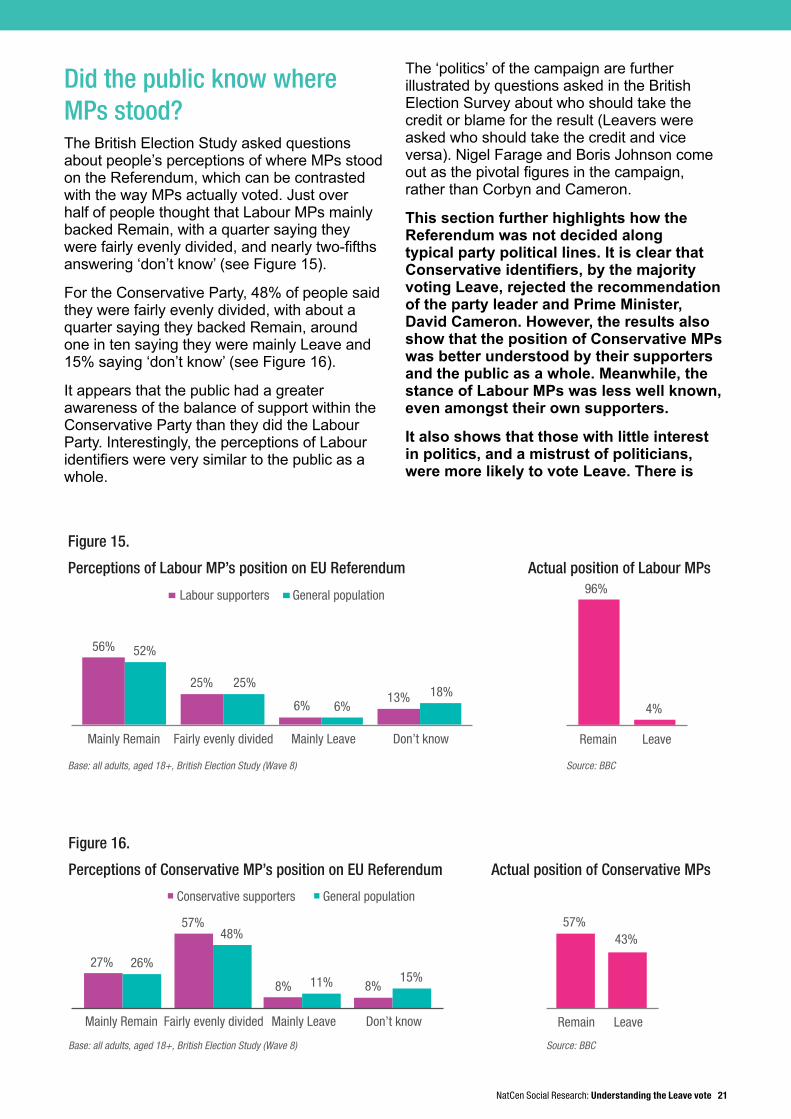
Did the public know where MPs stood?The British Election Study asked questions about people’s perceptions of where MPs stood on the Referendum, which can be contrasted with the way MPs actually voted. Just over half of people thought that Labour MPs mainly backed Remain, with a quarter saying they were fairly evenly divided, and nearly two-fifths answering ‘don’t know’ (see Figure 15).
For the Conservative Party, 48% of people said they were fairly evenly divided, with about a quarter saying they backed Remain, around one in ten saying they were mainly Leave and 15% saying ‘don’t know’ (see Figure 16).
It appears that the public had a greater awareness of the balance of support within the Conservative Party than they did the Labour Party. Interestingly, the perceptions of Labour identifiers were very similar to the public as a whole.
The ‘politics’ of the campaign are further illustrated by questions asked in the British Election Survey about who should take the credit or blame for the result (Leavers were asked who should take the credit and vice versa). Nigel Farage and Boris Johnson come out as the pivotal figures in the campaign, rather than Corbyn and Cameron.
This section further highlights how the Referendum was not decided along typical party political lines. It is clear that Conservative identifiers, by the majority voting Leave, rejected the recommendation of the party leader and Prime Minister, David Cameron. However, the results also show that the position of Conservative MPs was better understood by their supporters and the public as a whole. Meanwhile, the stance of Labour MPs was less well known, even amongst their own supporters.
It also shows that those with little interest in politics, and a mistrust of politicians, were more likely to vote Leave. There is
25%
6%13%
52%
25%
6%18%
Mainly Remain Fairly evenly divided Mainly Leave Don’t know
Labour supporters General population
Figure 15.
Base: all adults, aged 18+, British Election Study (Wave 8)
56%
96%
4%
Remain Leave
Actual position of Labour MPs
Source: BBC
Perceptions of Labour MP’s position on EU Referendum
27%
57%
8% 8%
26%
48%
11% 15%
Mainly Remain Fairly evenly divided Mainly Leave Don’t know
Conservative supporters General population
Figure 16.
Base: all adults, aged 18+, British Election Study (Wave 8)
Actual position of Conservative MPsPerceptions of Conservative MP’s position on EU Referendum
57%43%
Remain Leave
Source: BBC

22 NatCen Social Research: Understanding the Leave vote
also evidence that the ‘new voters’, who did not vote in the 2015 General Election, were more likely to vote Leave.
As well as the Leave vote attracting a group of new voters, the results of the NatCen Panel suggests a softening of Remain support during the campaign. Those intending to vote Remain prior to the Referendum were more likely to not turn out to vote, and this was most pronounced amongst those without a party affiliation.
NatCen Social Research: Understanding the Leave vote 23
The Referendum attracted a group of ‘new voters’ who did not participate in the 2015 General Election. A majority of this group voted Leave.
Turnout also played a potentially decisive role. Those who said they leant towards Remain in the run-up to the Referendum were more likely not to vote. If turnout among supporters of both sides had been equal the vote would have been closer still.
““
24 NatCen Social Research: Understanding the Leave vote
NatCen Social Research: Understanding the Leave vote 25
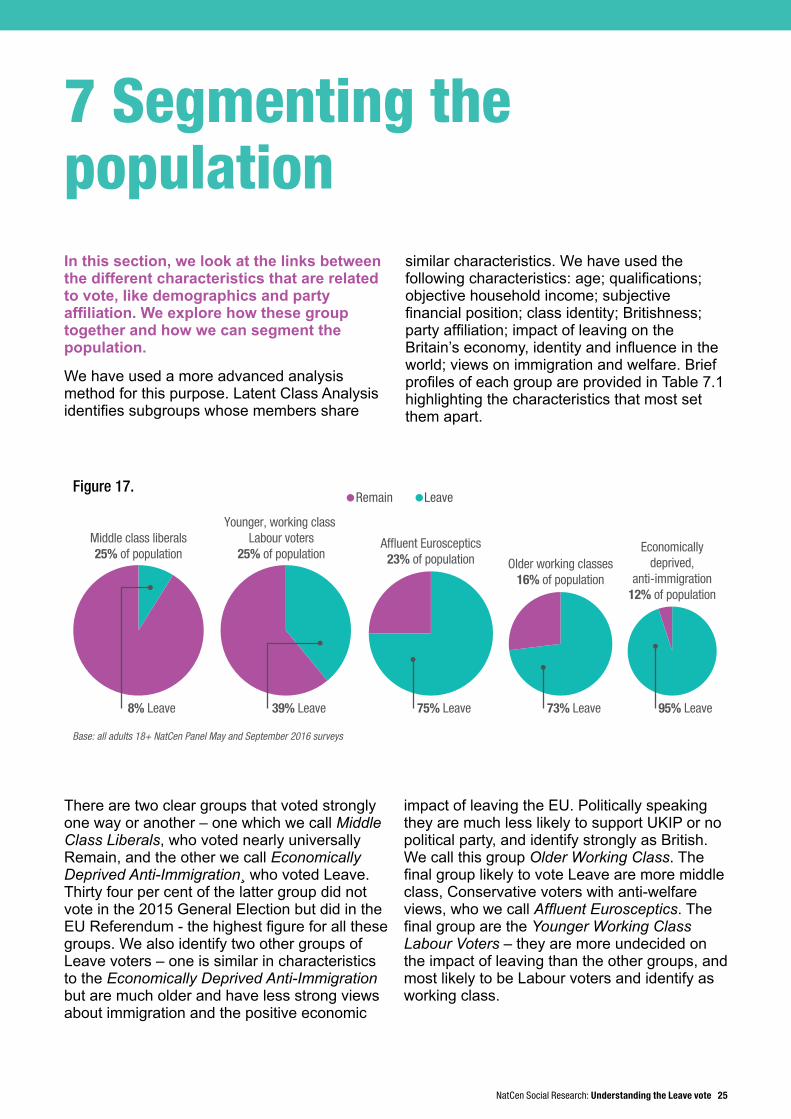
7 Segmenting the populationIn this section, we look at the links between the different characteristics that are related to vote, like demographics and party affiliation. We explore how these group together and how we can segment the population.
We have used a more advanced analysis method for this purpose. Latent Class Analysis identifies subgroups whose members share
similar characteristics. We have used the following characteristics: age; qualifications; objective household income; subjective financial position; class identity; Britishness; party affiliation; impact of leaving on the Britain’s economy, identity and influence in the world; views on immigration and welfare. Brief profiles of each group are provided in Table 7.1 highlighting the characteristics that most set them apart.
Middle class liberals25% of population
Younger, working class Labour voters
25% of populationAf�uent Eurosceptics
23% of population Older working classes16% of population
73% Leave 95% Leave75% Leave39% Leave8% Leave
Economicallydeprived,
anti-immigration12% of population
Figure 17. Remain Leave
Base: all adults 18+ NatCen Panel May and September 2016 surveys
There are two clear groups that voted strongly one way or another – one which we call Middle Class Liberals, who voted nearly universally Remain, and the other we call Economically Deprived Anti-Immigration¸ who voted Leave. Thirty four per cent of the latter group did not vote in the 2015 General Election but did in the EU Referendum - the highest figure for all these groups. We also identify two other groups of Leave voters – one is similar in characteristics to the Economically Deprived Anti-Immigration but are much older and have less strong views about immigration and the positive economic
impact of leaving the EU. Politically speaking they are much less likely to support UKIP or no political party, and identify strongly as British. We call this group Older Working Class. The final group likely to vote Leave are more middle class, Conservative voters with anti-welfare views, who we call Affluent Eurosceptics. The final group are the Younger Working Class Labour Voters – they are more undecided on the impact of leaving than the other groups, and most likely to be Labour voters and identify as working class.

26 NatCen Social Research: Understanding the Leave vote
Table 7.1 Population segmentation
Middle class liberals
Younger, working
class Labour voters
Affluent Eurosceptics
Older working classes
Economically deprived, anti-
immigration
% of population 25% 25% 23% 16% 12%
DemographicsAverage age 46 37 47 71 47Degree-level education 60% 13% 30% 1% 2%
Identify as working class 27% 77% 50% 70% 69%
Just about getting by or finding it difficult financially
15% 57% 13% 24% 79%
HH income of less than £2,200 per month
17% 66% 16% 82% 80%
PoliticsConservative identifiers 32% 10% 65% 48% 10%
Labour identifiers 39% 47% 16% 27% 14%UKIP identifiers 0% 1% 7% 5% 32%Do not identify with a political party
2% 30% 6% 12% 34%
Anti-welfare 4% 20% 37% 16% 13%
Opinions on campaign issuesThink the economy would be worse off if we left the EU
85% 55% 18% 21% 1%
Think immigration has made things worse
14% 57% 64% 69% 91%
Think leaving the EU would mean UK has less influence in the world
79% 42% 12% 15% 2%
Voted in EU Ref 94% 67% 90% 89% 81%Voted Leave 8% 39% 75% 73% 95%
Base: all adults who aged 18+ NatCen Panel May and September 2016 survey
NatCen Social Research: Understanding the Leave vote 27
8 Conclusions‘Who voted Leave and why?’ is the question we set ourselves for this study. At our disposal, we had the wealth of survey data about voting behaviour, demographics and social and political attitudes held in the British Election Study, NatCen Panel and British Social Attitudes Survey.
We find three distinct groups that made up the vote to Leave:
• Economically deprived, anti-immigration. Those with least economic resources and who are most anti-immigration and nationalistic. Various labels can be attached to this group, such as the ‘left behind’ or ‘just about managing’. They form the bedrock of UKIP support and have been politically disengaged in the past.
• Affluent Eurosceptics. This group are more Conservative than UKIP and more middle class. Yes, they are anti-immigration but they are also interested in Britain’s indepedence and are noticeably anti-welfare
• Older working classes. They are on low incomes and have little in the way of formal qualifications – but don’t feel poor or badly educated. They are concerned about immigration and changing identity but are socially different to the first group.
So, the Leave vote was underpinned by the campaign’s ability to draw together a broad-based coalition. It is much more wide-ranging than the ‘left behind’.
It was clearly a very close vote, and so the obvious question is to ask what whether it could have gone the other way. What tipped the balance? We draw out four likely candidates:
Differential turnout. Two points stand out from our analysis. The first is that the EU Referendum attracted a new set of voters and they were more likely to vote Leave. The second is that the Remain vote clearly softened during the campaign. If the turnout had been the same as the General Election, or if all the people who said they would vote Remain had
done so, the vote would have been closer still, This must raise questions about the ability of the Remain campaign to ‘get out the vote’.
Leave countering the argument on economic risks. In particular, the Leave campaign had two issues that resonated with the public (controlling immigration and greater sovereignty) whereas the Remain campaign was mainly reliant on stressing the economic risks of leaving. It is also clear that the public felt much less clear about the impacts on the economy than the other two. This raises questions about the strategy and tactics of the Remain campaign, though perhaps their hands were always tied following the lack of concrete concessions on immigration’ from the EU in the run-up to the vote.
Newspapers. The balance of pro- and anti- Leave positions of the newspapers was important given how many people read them, particularly the popular press. It is interesting to note that, when it came to the EU Referendum vote, people were more likely to follow the position of the newspaper they read than the political party they identify with.
‘Not’ following the party line. Two factors stand out here. The first is that many people were unclear about the position of Labour MPs, and thought they were more divided than they were. The second, and numerically most important, is the divide within the Conservative Party, amplified by the role Boris Johnson played in the Leave campaign. Politics matter.
In summary, it is clear that a particular set of circumstances helped tip the balance for the Leave vote though it is important to be aware the background to the Referendum was a slow burn of growing Euroscepticism.
The EU Referendum was highly divisive, highlighting a wide range of social, geographical and other differences in Great Britain. This was less a traditional left-right battle, and more about identity and values (liberalism vs authoritarianism). It is a strong sign that the so-called ‘culture wars’ of the US have arrived in Great Britain in earnest.
28 NatCen Social Research: Understanding the Leave vote
Notes and references
Notes
Party identificationBritish Social Attitudes and NatCen Panel
Party Identification is a composite variable. Respondents can be classified as identifying with a particular political party on one of three counts: if they consider themselves supporters of that party, closer to it than to others, or more likely to support it in the event of a general election. The three groups are generally described respectively as ‘partisans’, ‘sympathisers’ and ‘residual identifiers’. In combination, the three groups are referred to as ‘identifiers’.
British Election Study
Party identification in the British Election Study is formed by two questions. The main question is ‘Generally speaking, do you think of yourself as Labour, Conservative, Liberal Democrat or what?’. If people do not pick a party they are then asked: ‘Do you generally think of yourself as a little closer to one of the parties than the others? If yes, which party?’
Attitudinal scalesThe analysis includes three scales measuring political attitudes; the left-right, libertarian-authoritarian and welfarism scales. These indices are formed by compiling a number
of variables. They have been tested for their reliability using data from British Social Attitudes.
Left-Right scale
• Government should redistribute income from the better off to those who are less well off
• Big business benefits owners at the expense of workers
• Ordinary working people do not get their fair share of the nation’s wealth
• There is one law for the rich and one for the poor
• Management will always try to get the better of employees if it gets the chance
Libertarian-Authoritarian scale:
• Young people today don’t have enough respect for traditional British values
• People who break the law should be given stiffer sentences
• For some crimes, the death penalty is the most appropriate sentence
• Schools should teach children to obey authority
• The law should always be obeyed, even if a particular law is wrong
• Censorship of films and magazines is necessary to uphold moral standards
Welfarism scale
• The welfare state encourages people to stop helping each other
Looking forward, it remains to be seen if these divisions heal or continue to drive politics in Britain. Could there be a re-alignment of party politics along the cleavages identified? Can the Labour Party remain a strong force in working class and low income communities? Can the Liberal Democrats attract some of the Conservative Remainers?
More importantly, is this a forewarning of future problems in the functioning of democracy and the cohesion of the nation? It is important now to have measured debates about the nature of ‘Brexit’, and to find an arrangement that allows as many as possible to feel a stake in the post-EU future.
NatCen Social Research: Understanding the Leave vote 29
• The government should spend more money on welfare benefits for the poor, even if it leads to higher taxes
• Around here, most unemployed people could find a job if they really wanted one
• Many people who get social security don’t really deserve any help
• Most people on the dole are fiddling in one way or another
• If welfare benefits weren’t so generous, people would learn to stand on their own two feet
• Cutting welfare benefits would damage too many people’s lives
• The creation of the welfare state is one of Britain’s proudest achievements
References
a NatCen Social Research (2016). Public opinion on the EU referendum question: a new approach www.whatukthinks.org
b Kitzinger, U., & Butler, D. (1976). The 1975 Referendum.
c NatCen Social Research (2016). How deeply does Britain’s Euroscepticism run? www.whatukthinks.org
d NatCen Social Research (2015). Britain and Europe: Are we all Euro-sceptics now? British Social Attitudes 32.
e Clarke, S., & Whittaker, M. (2016). The Importance of Place: explaining the characteristics underpinning the Brexit vote across different parts of the UK. Resolution Foundation.
f NatCen Social Research (2016). The two poles of the referendum debate: immigration and the economy. www.whatukthinks.org
g NatCen Social Research (2016). The two poles of the Referendum debate: immigration and the economy / Public opinion on the EU Referendum question: a new approach.
h NatCen Social Research (2016). The economics of Brexit in voters’ eyes. Or, Why the Remain Campaign Failed. www.whatukthinks.org
i Kaufmann, E. (2016). It’s NOT the economy, stupid: Brexit as a story of personal values’. The London School of Economics and Political Science, 7.
Photo creditsPage 6: A very crowded south bank near the London Eye. 2014. © Flickr/oatsy40
Page 12: The voute leave at Southend pier. 2016. © Flickr/southessexmale
Page 17: Front page headlines in the UK following Brexit referendum result. 2016. © iStock/George Clerk
Page 21: May 5: Vote. 2011. © Flickr/John Keane

NatCen Social Research35 Northampton SquareLondonEC1V 0AXTel. 020 7250 1866Fax. 020 7250 1524E-mail: [email protected]
NatCen Social Research is accreditedto the following international standards:ISO 20252:2006 Market, opinion and socialresearch, and ISO 27001:2005 InformationSecurity Management.
Company limited by guarantee. Reg No.4392418. A Charity registered in England andWales (1091768) and in Scotland (SC038454)