Embed Size (px)
Citation preview
Understanding the Mechanism and Determinantsof Compromise EffectsShibin ShengAdelphi University
Andrew M. ParkerVirginia Polytechnic Institute and State University
Kent NakamotoVirginia Polytechnic Institute and State University
ABSTRACT
In this article, compromise effects are distinguished theoreticallyfrom attraction effects, which have received more research attentionin the past. This article proposes and tests expected-loss minimizationunder decision uncertainty as the underlying mechanism to explaincompromise effects. Next, it examines the effects of a consumer’sfamiliarity with the product and attribute-importance structure oncompromise effects. The empirical results demonstrate the negativeinfluences of familiarity and asymmetry of attribute importance oncompromise effects, as well as the mediating effect of attribute impor-tance on the familiarity–compromise-effect relationship. Furtherresearch directions are also discussed. © 2005 Wiley Periodicals, Inc.
Recent research in decision making and marketing indicates that con-sumer preferences for options in a choice set are influenced by the deci-sion context, leading to the widely studied attraction and compromiseeffects (Burton & Zinkhan, 1987; Huber, Payne, & Puto, 1982; Huber &
Psychology & Marketing, Vol. 22(7): 591–609 (July 2005)Published online in Wiley InterScience (www.interscience.wiley.com)© 2005 Wiley Periodicals, Inc. DOI: 10.1002/mar.20075
591
Puto, 1983; Ratneshwar, Shocker, & Stewart, 1987; Simonson, 1989;Simonson & Tversky, 1992). Context effects imply that, when evaluatinga focal option, individuals take into consideration characteristics of othercomparative alternatives rather than only the features of that focal alter-native, complicating the decision-making process. Attraction and com-promise effects have spawned considerable conceptual and empiricalresearch because, among other things, they violate the principle of reg-ularity, which asserts that one cannot increase the probability of choos-ing one option by adding more alternatives to the choice set.
Simonson (1989) first introduces the concept of compromise effect intothe consumer-behavior literature as one type of context effects, distin-guishing it from attraction effects. The essence of compromise effect isthat “an alternative would tend to gain market share when it becomesa compromise or middle option in the choice set” (Simonson, 1989, p.159). That is, a brand in a two-alternative choice set can gain more mar-ket share following the addition of an adjacent competitor that makes onebrand a compromise choice in the choice set. Empirical studies havedemonstrated that compromise effects are not exceptional, but both com-mon and robust (Simonson, 1989; Simonson & Tversky, 1992).
Research on context effects in decision making has been widespreadover the past two decades. However, theoretical discussions of compro-mise effects have received only limited attention. Simonson (1989)asserts that a consumer tends to choose the compromise alternativebecause of a search for reasons and a need to be favorably evaluated byothers. A compromise choice can reduce the conflict associated with giv-ing up one attribute for another and can be justified by arguing that itcombines both attributes. However, an individual’s decision motivesmight be more complex than this explanation. Accountable decision-makers may base their choice only on justifications for their decisions,without considering reasons or evaluations of others (Simonson, 1989).In addition, Simonson and Tversky (1992) explain compromise effects byan individual’s “extremeness aversion,” due to the fact that disadvan-tages of an alternative are weighted more heavily than the correspon-ding advantages. As depicted in Figure 1, each extreme option (A or C)has an advantage and a disadvantage relative to the middle option (B).Because disadvantages loom larger than the corresponding advantages,the middle option B appears better in the triple than in the pairs, lead-ing to the compromise effect. However, as pointed out by Simonson andTversky (1992), the difference in evaluations of advantages and disad-vantages may depend on the attributes in question—it may not existfor certain attributes, such as prices. And empirically, their findings sug-gest extremeness aversion only for quality but not for prices. This mightalso be the case for other attributes that are evaluated by a decisionmaker. An alternative explanation, advanced in this article, might pro-vide further understanding of the mechanism of compromise effects inconsumer decision making.
SHENG, PARKER, AND NAKAMOTO592
One probable reason for the lack of research attention toward com-promise effects is that researchers may categorize compromise effectsas a special case of attraction effects, without any theoretical distinc-tion. Therefore, this article begins with a clarification of the theoreticaldistinction between compromise and attraction effects. Then, it proposesand tests an alternative explanation of the mechanism underlying com-promise effects. It also empirically tests how a consumer’s product famil-iarity and attribute-importance weight structure influence the signifi-cance of compromise effects.
Theoretical Distinction Between Compromise and Attraction Effects
Attraction effect refers to the phenomenon that the addition of a domi-nated alternative into a choice set can increase the likelihood of an exist-ing alternative being chosen, given that the existing alternative is supe-rior to the new entrant on both attributes examined (Huber et al., 1982;Huber & Puto, 1983; Lehmann & Pan, 1994; Pan & Lehmann, 1993; Rat-neshwar, Shocker, & Stewart, 1987; Simonson, 1989; Simonson & Tver-sky, 1992). A compromise effect does not share this dominance relation-ship. Instead, the new entrant is relatively superior to the preexistingoptions on one dimension and inferior on the other, effectively making oneof the preexisting options a compromise (and hence more attractive).Because both attraction and compromise effects deal with the result ofthe addition of a third alternative on an existing two-alternative choiceset, and both have the same outcome in terms of the increase of marketshare of the focal brand, attraction and compromise effects have beenclassified as a single phenomenon in some studies (Lehmann & Pan,1994; Pan & Lehmann, 1993). However, a conceptual elaboration of thedistinction between compromise and attraction effects is warranted to
COMPROMISE EFFECTS 593
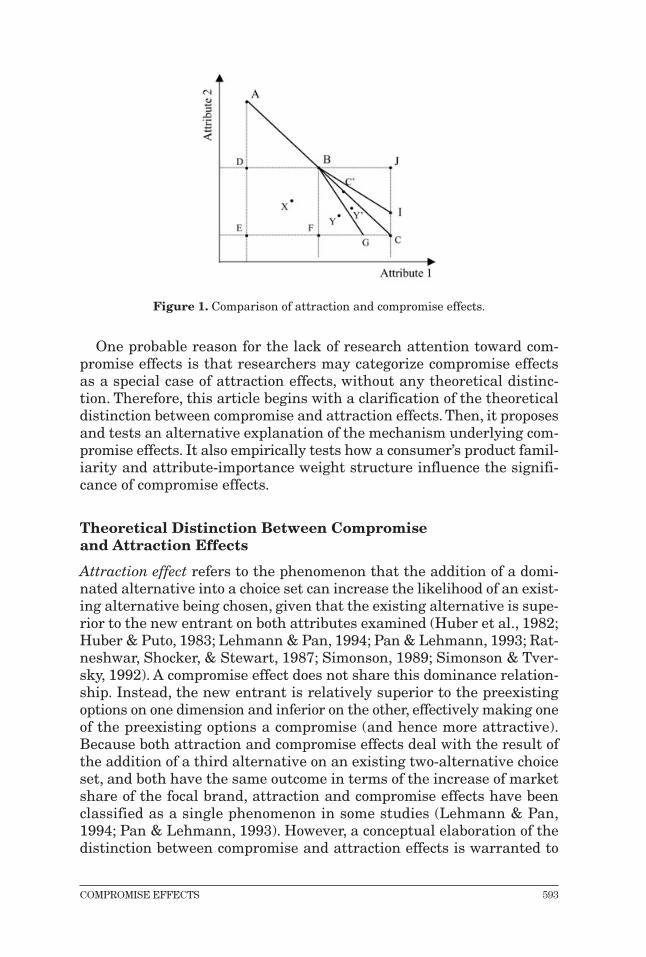
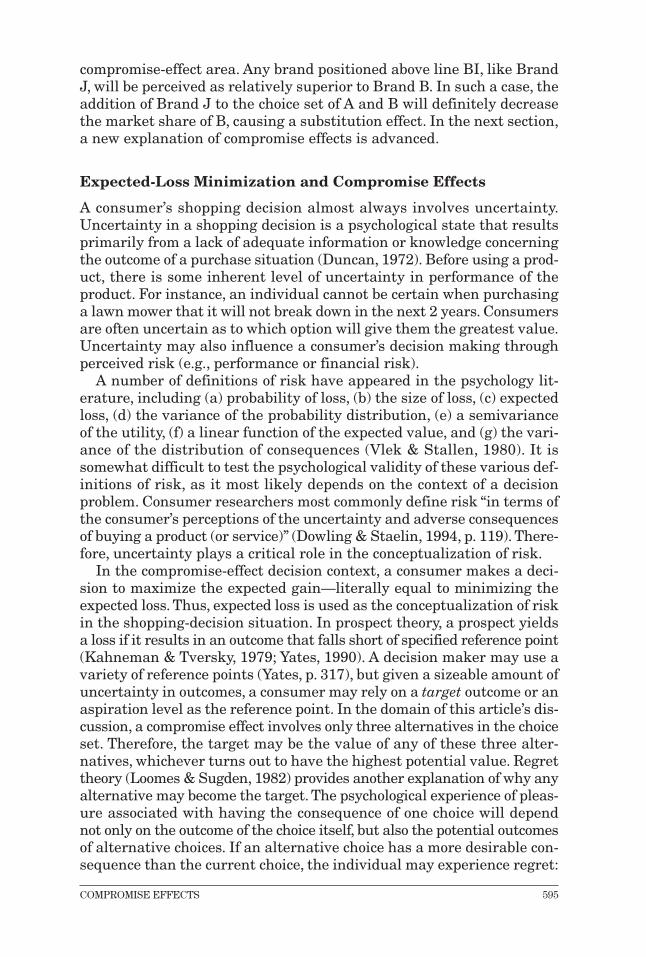
Figure 1. Comparison of attraction and compromise effects.
facilitate further research about the mechanism and causes of compro-mise effect. Figure 1 compares attraction and compromise effects. Whenevaluating options in a choice set, consumers are often portrayed as mak-ing trade-offs among attribute combinations, represented by a trade-offline.1 In Figure 1, an increase on either Attribute 1 or 2 increases thefavorability of a brand. Brands A and B may be perceived as equivalentif the consumer perceives that the loss in Attribute 2 from Brand A to Bcan be offset by the gain in Attribute 1 (moving downward and rightalong the trade-off line, AB, which is the consumer’s trade-off line, andassumed stable in this discussion). For simplicity, other attributes are notconsidered in the illustration.
Using a similar diagram, Ratneshwar et al. (1987) clearly demonstratethat the addition of a decoy alternative, X, will increase the market shareof the focal brand B (i.e., the attraction effect). X is dominated by B,because B is better (or at least as good as) than X on both Attributes 1and 2.
A compromise effect occurs when a third alterative, C, is added to theextended trade-off line AB. Similar to an attraction effect, market shareof Brand B increases as a result of the addition of C to the consumer’schoice set {A,B}. However, the contexts of attraction and compromiseeffects are different. The essential distinction is that the decoy brand Xis completely dominated by Brand B in the attraction-effect situation,whereas Brand C is perceived as equivalent to Brand B in the compro-mise-effect situation.
Furthermore, Huber and Puto (1983) extend the attraction effect toinclude the triangular area BCF. They argue that a decoy, which is notdominated by Brand B, can also cause preference shifts toward Brand B.This decoy is relatively inferior because switching from B to Y repre-sents a poorer trade-off in attributes than that obtained by switchingfrom A to B. To some extent, this relative inferiority cannot be perceivedby a consumer in the whole triangular area of BFC. Consider a brand atpoint Y ', which is not on trade-off line BC but very close to BC. A con-sumer may not distinguish this point from a nearby point on trade-off lineBC. Thus, Y ' could still be perceived as equivalent to Brand B. There-fore, there should exist an empirical boundary line between attraction-effect and compromise-effect areas, although this boundary may be unpre-dictable, varying across different consumers. In Figure 1, line BG is sucha hypothesized boundary line. A third alternative brand added abovethis boundary line will cause a compromise effect; if it is added below thisboundary line it will cause an attraction effect.
Similarly, there will exist another compromise-effect area above lineBC, in which a decoy can be perceived equivalent to brands at any pointon trade-off line BC. Like BG, line BI is the upward boundary line of the
SHENG, PARKER, AND NAKAMOTO594
1 This trade-off line is conventionally assumed to be linear in marketing literature (Huber et al., 1982;Huber & Puto, 1983; Lehmann & Pan, 1994; Pan & Lehmann, 1993; Ratneshwar et al., 1987;Simonson, 1989; Simonson & Tversky, 1992). It also might be curvilinear. However, the linear sim-plification can make the illustration more straightforward without losing generality.
COMPROMISE EFFECTS 595
compromise-effect area. Any brand positioned above line BI, like BrandJ, will be perceived as relatively superior to Brand B. In such a case, theaddition of Brand J to the choice set of A and B will definitely decreasethe market share of B, causing a substitution effect. In the next section,a new explanation of compromise effects is advanced.
Expected-Loss Minimization and Compromise Effects
A consumer’s shopping decision almost always involves uncertainty.Uncertainty in a shopping decision is a psychological state that resultsprimarily from a lack of adequate information or knowledge concerningthe outcome of a purchase situation (Duncan, 1972). Before using a prod-uct, there is some inherent level of uncertainty in performance of theproduct. For instance, an individual cannot be certain when purchasinga lawn mower that it will not break down in the next 2 years. Consumersare often uncertain as to which option will give them the greatest value.Uncertainty may also influence a consumer’s decision making throughperceived risk (e.g., performance or financial risk).
A number of definitions of risk have appeared in the psychology lit-erature, including (a) probability of loss, (b) the size of loss, (c) expectedloss, (d) the variance of the probability distribution, (e) a semivarianceof the utility, (f) a linear function of the expected value, and (g) the vari-ance of the distribution of consequences (Vlek & Stallen, 1980). It issomewhat difficult to test the psychological validity of these various def-initions of risk, as it most likely depends on the context of a decisionproblem. Consumer researchers most commonly define risk “in terms ofthe consumer’s perceptions of the uncertainty and adverse consequencesof buying a product (or service)” (Dowling & Staelin, 1994, p. 119). There-fore, uncertainty plays a critical role in the conceptualization of risk.
In the compromise-effect decision context, a consumer makes a deci-sion to maximize the expected gain—literally equal to minimizing theexpected loss. Thus, expected loss is used as the conceptualization of riskin the shopping-decision situation. In prospect theory, a prospect yieldsa loss if it results in an outcome that falls short of specified reference point(Kahneman & Tversky, 1979; Yates, 1990). A decision maker may use avariety of reference points (Yates, p. 317), but given a sizeable amount ofuncertainty in outcomes, a consumer may rely on a target outcome or anaspiration level as the reference point. In the domain of this article’s dis-cussion, a compromise effect involves only three alternatives in the choiceset. Therefore, the target may be the value of any of these three alter-natives, whichever turns out to have the highest potential value. Regrettheory (Loomes & Sugden, 1982) provides another explanation of why anyalternative may become the target. The psychological experience of pleas-ure associated with having the consequence of one choice will dependnot only on the outcome of the choice itself, but also the potential outcomesof alternative choices. If an alternative choice has a more desirable con-sequence than the current choice, the individual may experience regret:
SHENG, PARKER, AND NAKAMOTO596
“he may reflect on how much better his position would have been, hadhe chosen differently, and this reflection may reduce the pleasure thatderives from current choice” (Loomes & Sugden, 1982, p. 808). In thiscase, an option with the most desirable potential consequence becomesthe reference point. The following argument demonstrates why con-sumers might choose the compromise option to minimize the expected losswhen they are uncertain about which alternative will give them the high-est value (see Appendix 1 for a more general proof of the mechanism). Theexpected loss of a consumer’s decision is:
EL � �i
Pi(Vi – Vs ), (1)
�i
Pi � 1, i � A, B, C, (2)
where EL is the expected loss; Pi (i � A,B,C) is the probability of the ith
alternative being evaluated as the best choice post hoc, and hence the tar-get; Vi is the value of the ith alternative, which is a function of linearcombination of the level of each attribute, given the assumption of lin-ear trade-off line in the previous discussion. Vs is the value of the brandchosen by the consumer. Vs � Vj (j � A,B,C), if the jth brand is chosen.Given the uncertainty about which alternative will be the best choice, posthoc, a uniform distribution can be assumed; that is, PA � PB � PC � 1/3.Meanwhile, alternatives A, B, and C are assumed to be positioned withequal distance on the trade-off line, as depicted in Figure 1. The shiftfrom the reference point to the chosen brand is 0, 1, or 2 units of value.Based on Equation (1), the expected loss for each of the three differentdecision scenarios is calculated as follows:
Choosing A: EL � PA(VA – VA) � PB(VB – VA) � PC(VC – VA) � 1/3 *0 � 1/3 * 1 � 1/3 * 2 � 1;
Choosing B: EL � PA(VA – VB) � PB(VB – VB) � PC(VC – VB) � 1/3 *1 � 1/3 * 0 � 1/3 * 1 � 2/3;
Choosing C: EL � PA(VA – VC) � PB(VB – VC) � PC(VC – VC) � 1/3 *2 � 1/3 * 1 � 1/3 * 0 � 1.
A comparison of these three scenarios demonstrates that the expectedloss is minimized when B is chosen.
As the distribution of Pi becomes less uniform (i.e., there is more cer-tainty in the decision), consumer preferences will shift along with the skewof the distribution. In the extreme, when a consumer is certain that prod-uct C will result in the highest value (i.e., PC � 1), choosing C incurs the low-est expected loss (i.e., LE � 0 in this case). In the opposite, the higher a con-sumer’s decision uncertainty (reflected in a more uniform distribution of Pi),the more likely he or she will select the compromise option as a vehicle tominimize the expected loss of a decision. This illustration of expected-lossminimization also provides a possible underlying mechanism for Simonson’s
(1989, p. 171) assertion that “a search for reasons and a need to be favor-ably evaluated by others increases the likelihood that decision makers willprefer middle alternatives.” With a need for external justification, a con-sumer may be aware that each alternative in the choice set might be jus-tified post hoc as the one with the highest value, since he or she may havelittle information about others’ preferences in advance. Hence, a uniformdistribution may be reasonable in this situation (i.e., PA � PB � PC �1/3).Therefore, the middle option, B, may be the safest brand when consideringthe reactions of others.
In the rest of this article, two empirical studies are reported. Study 1reveals the mechanism underlying compromise effects. Study 2 tests howconsumer product familiarity and attribute-importance structures influ-ence the significance level of compromise effect.
STUDY 1
Hypotheses
As advanced in the previous section, the following hypothesis is offered:
H1: The higher an individual’s decision uncertainty, the more likely heor she will choose the compromise option in the choice set.
Following the line of reasoning in Equation (1), the difference ofexpected losses between choosing B and C decreases as C moves towardB. Assume another decoy brand, C', is positioned very close to Brand B(See the positioning of C' in Figure 1), other conditions being the sameas that in the previous section. Then, VC' ≈ VB. The expected-losses for thethree different decision scenarios are as follows:
Choosing A: EL � PA(VA – VA) � PB(VB – VA) � PC' (VC' – VA) ≈ 1/3 *0 � 1/3 * 1 � 1/3 * 1 ≈ 2/3,
Choosing B: EL � PA(VA – VB) � PB(VB – VB) � PC' (VC' – VB) ≈ 1/3 *1 � 1/3 * 0 � 1/3 * 0 ≈ 1/3,
Choosing C': EL � PA(VA – VC') � PB(VB – VC') � PC' (VC' – VC') ≈ 1/3 *1 � 1/3 * 0 � 1/3 * 0 ≈ 1/3.
In this situation, choosing B has the same expected loss as choosing C'.The closer C' is to B, the less choosing B can reduce the expected loss, andthe less likely a consumer will choose the compromise option. Therefore,the following hypothesis is offered:
H2: The closer the decoy brand to the compromise brand in the choiceset, the less significant is the compromise effect.
COMPROMISE EFFECTS 597
Pilot Study: Scale Development
The primary intent of Study 1 is to examine the proposed underlyingmechanism of compromise effect. However, prior to this investigation, avalid and reliable measure of decision uncertainty needs to be developedin the current research context. Therefore, a pilot scale developmentstudy was run prior to the main study.
The development of a psychological decision-uncertainty instrumentbegan with a thorough literature review that generated an item pool,designed to measure hypothesized components of decision uncertainty.Twenty-one items were generated to reflect five facets of consumer decisionuncertainty: decision process uncertainty, inadequacy of information, prod-uct uncertainty, prediction uncertainty, and justifiability (for details of theinstrument, see Appendix 2). A 9-point Likert scale anchored by stronglydisagree and strongly agree was attached to each item. Wording for half ofthe items was randomly reversed to avoid response bias. Six product cate-gories (lawn mower, cordless phone, stair climber, add-on snow thrower,digital camera, and disc sander) were used in the scale-development study.A self-administered questionnaire for scale development was given to aninitial sample of 54 undergraduate students enrolled in a state university.Participants were presented with pairs of brands within a product cate-gory, varying along two attributes in each product category.Then they wererequired to choose one product from each pair after examining features ofthese two brands.After they made decision about each pair, they respondedto these 21 scales of the uncertainty instrument regarding their decisions.The same procedure was repeated for each product category.
An exploratory factor analysis was conducted for each product cate-gory.2 The pattern of factor loadings exhibited inconsistency across thesix different products (see Table 1). However, within each of the productcategories, the first (biggest) factor accounted for more than 50% of thevariance in the original data. In order to obtain a consistent scale acrossall six products, decision uncertainty was assumed to be unidimensionaland all the items that did not load strongly on the first factor in any ofthe product categories were removed. Eventually, eight items remainedin the instrument (see Appendix 2). Measured by these eight items, deci-sion uncertainty exhibited high reliability for all six products (Cron-bach’s α � .85). Thus, these eight indicators were employed to measuredecision uncertainty in Study 1.
Method
Design and Procedure.As the existence of compromise effects has beenclearly established in previous research (e.g., Simonson, 1989; Simonson
SHENG, PARKER, AND NAKAMOTO598
2 One can also pool together the data for different product categories, in other words, do one factoranalysis across product categories. However, that will violate the assumed independence of obser-vations, because every respondent rated each of the six products.
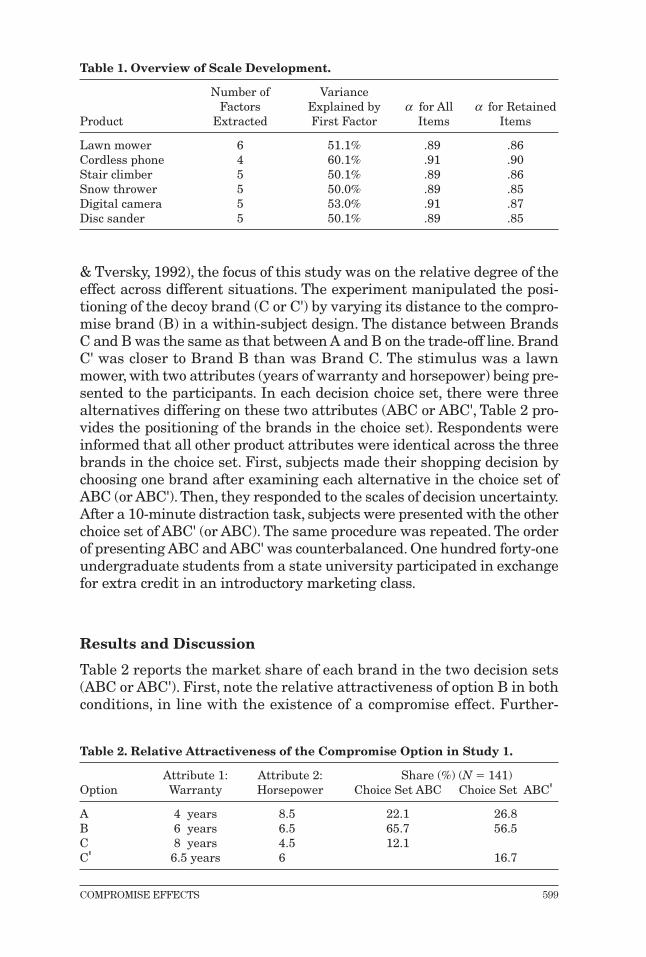
& Tversky, 1992), the focus of this study was on the relative degree of theeffect across different situations. The experiment manipulated the posi-tioning of the decoy brand (C or C') by varying its distance to the compro-mise brand (B) in a within-subject design. The distance between BrandsC and B was the same as that between A and B on the trade-off line. BrandC' was closer to Brand B than was Brand C. The stimulus was a lawnmower, with two attributes (years of warranty and horsepower) being pre-sented to the participants. In each decision choice set, there were threealternatives differing on these two attributes (ABC or ABC', Table 2 pro-vides the positioning of the brands in the choice set). Respondents wereinformed that all other product attributes were identical across the threebrands in the choice set. First, subjects made their shopping decision bychoosing one brand after examining each alternative in the choice set ofABC (or ABC'). Then, they responded to the scales of decision uncertainty.After a 10-minute distraction task, subjects were presented with the otherchoice set of ABC' (or ABC). The same procedure was repeated. The orderof presenting ABC and ABC' was counterbalanced. One hundred forty-oneundergraduate students from a state university participated in exchangefor extra credit in an introductory marketing class.
Results and Discussion
Table 2 reports the market share of each brand in the two decision sets(ABC or ABC'). First, note the relative attractiveness of option B in bothconditions, in line with the existence of a compromise effect. Further-
COMPROMISE EFFECTS 599
Table 1. Overview of Scale Development.
Number of Variance Factors Explained by α for All α for Retained
Product Extracted First Factor Items Items
Lawn mower 6 51.1% .89 .86Cordless phone 4 60.1% .91 .90Stair climber 5 50.1% .89 .86Snow thrower 5 50.0% .89 .85Digital camera 5 53.0% .91 .87Disc sander 5 50.1% .89 .85
Table 2. Relative Attractiveness of the Compromise Option in Study 1.
Attribute 1: Attribute 2: Share (%) (N � 141)Option Warranty Horsepower Choice Set ABC Choice Set ABC'
A 4 years 8.5 22.1 26.8B 6 years 6.5 65.7 56.5C 8 years 4.5 12.1C' 6.5 years 6 16.7
more, consistent with H2, the market share of the middle option (BrandB) was greater in the choice set of ABC than that in the choice set ofABC'. The tests of hypotheses are outlined as follows.
Effect of Decision Uncertainty. The measure of decision uncertaintydemonstrated acceptable reliability (Cronbach’s α � .82) after the eighthitem (“My choice is easy to justify”) was dropped. A respondent’s shop-ping decision was coded as 1 if he or she chose alternative B (the com-promise option) and as 0 otherwise. The experiment condition of the posi-tioning of decoy brand was coded as 1 (if C' was in the choice set) or 0 (ifC was in the choice set). Because the dependent variable was binary andit was a within-subject design, the SAS procedure PROC GENMOD wasapplied to conduct a repeated-measure logistic regression to test theimpact of decision uncertainty on compromise effect. A subject’s choicewas regressed on measured decision uncertainty and the decoy-positionexperimental condition. Decision uncertainty had a significant effect onthe compromise effect (β � .30, p � .03), supporting H1.
Effect of Positioning of Decoy Brand. H2 predicts that the closer thedecoy brand to the middle brand in the choice set, the less significant thecompromise effect. The pattern of the change of Brand B’s market sharesin Table 2 supported the hypothesis, with 65.7% choosing Brand B in theABC choice set and 56.5% in the ABC' choice set (within-subjects McNe-mar test x2 � 6.50, p � .01).This effect was also significant in the repeated-measure logistic regression analysis (β � –.37, p � .01), supporting H2.
In sum, the empirical results supported the hypotheses about the mech-anism underlying compromise effects. However, as discussed earlier, com-promise effects do not occur in all cases. Similarly, as recognized by Simon-son and Tversky (1992), if consumers have well-established preferences,compromise effect is less likely to occur. And if a consumer is familiar witha product category, he or she will have better-developed knowledge struc-ture (Marks & Olson, 1981), including preference structure and evaluativecriteria. Thus, a consumer’s product-category familiarity will diminish thelikelihood of compromise effects.Therefore, Study 2 investigates how an indi-vidual consumer’s characteristics, including familiarity and attribute-impor-tance structure in the evaluative process, influence compromise effects.
STUDY 2
Hypotheses
Product Familiarity. The degree of previous knowledge that a consumerbrings to a choice task can have substantial impacts on the resultantprocess (Bettman, Johnson, & Payne, 1990). Researchers have often usedthe terms familiarity, expertise, and experience interchangeably when refer-ring to prior knowledge.Alba and Hutchinson (1987) categorized consumerknowledge as two major components: familiarity and expertise. Familiar-
SHENG, PARKER, AND NAKAMOTO600
ity is defined as the number of product-related experiences that have beenaccumulated by the consumer. Expertise is defined as the ability to per-form product-related tasks successfully. Because a consumer’s familiaritywith products or brands plays a critical role in information processing andbrand evaluation (Alba & Hutchinson, 1987; Fazio, 1986; Johnson & Russo,1984), familiarity was used to reflect a consumer’s knowledge in this study.
Product familiarity may influence compromise effects from two per-spectives. First, familiarity may influence consumers’ information pro-cessing. Brucks (1985) indicates that prior knowledge facilitates the acqui-sition of new information and increases search efficiency.Thus, a consumerwith high product familiarity may gain more information from both theshopping environment and their own memory before making a decision.With more information related to the judgment tasks, a high-familiarityconsumer may generate a more comprehensive evaluation of the prod-uct, and thus is less likely to be influenced by the compromise rationale.Second, a consumer’s product-category familiarity may facilitate the devel-opment of evaluative criteria or rules for the decision task. As Marks andOlson (1981) suggest, increased familiarity leads to better-developedknowledge structures or schema about a product. These well-developedknowledge structures or schema often include evaluative criteria andrules, which in turn facilitate a consumer’s judgment of superiority ofcertain products in a choice set and development of preference. Thus, anoption is less likely to become the decision choice simply because it is acompromise. Based upon this logic, the following hypothesis is offered:
H3: The more familiar an individual with the product, the less likelyhe or she will choose the compromise option in the choice set.
Attribute-Importance Structure. This article only considers two prod-uct attributes as a simplification. When having a symmetric attribute-importance structure, a consumer is faced with a relatively difficult deci-sion, because an option’s relative advantage on one attribute is offset byits disadvantage on the other attribute. The more symmetric the attrib-ute-importance structure, the more difficult the decision is and the morelikely a compromise option will be attractive to the consumer. When anindividual’s attribute-importance structure is asymmetric, the brandwith the highest value in the more important attribute tends to dominate,diminishing the probability of the compromise effect. Therefore, the fol-lowing hypothesis is offered:
H4: The more asymmetric an individual’s attribute importance of aproduct, the less likely he or she will choose the compromise optionin the choice set.
Mediating Effect of Attribute Importance. A consumer’s attribute-importance structure is shaped by previous experience or knowledge of
COMPROMISE EFFECTS 601
that product. If a consumer is familiar with a product category, he or shemay have a preformed evaluation structure, which may have an asym-metry of relative importance of attributes. However, when a consumer isunfamiliar with the product category, they may use a simplifying heuris-tic involving a compensatory, equal weighting of attributes (Coupey,Irwin, & Payne, 1998). Research results of Coupey et al. (1998) and Park(1976) suggest that consumers’ judgments showed a stronger tendencytoward equal weighting in unfamiliar product categories than in famil-iar product categories. Because a symmetric attribute-importance struc-ture will lead to more significant compromise effects, the followinghypothesis is offered:
H5: The effect of an individual’s product familiarity on compromiseeffects is mediated by the asymmetry of attribute-importancestructure.
Method
Stimuli and Procedure. Six product categories were used in Study 2 (forfeatures of the products, see Table 3). For each product category, there werethree brands in the choice set, with combinations varying on two attributes.None of these three alternatives was dominant over the other two. An advan-tage of any brand on one attribute was offset by a disadvantage over theother attribute. All other attributes of a product category were defined asidentical across the three brands in a choice set. For each product category,subjects examined the alternatives in the choice set, made their shoppingdecision by choosing one brand, and then answered questions about famil-iarity and attribute-importance weights. The same procedure was repeatedfor each product category. One hundred forty-nine undergraduate studentsfrom a state university participated in the study as a class requirement.
A separate control condition (sample size � 70) was conducted to obtainmarket shares of brands from the binary choice set for each of these sixproduct categories. In this condition, a subject’s task was only to makea choice from the binary (A vs. B) choice set for each product category.
Measure of Familiarity. The instrument used three indicators to meas-ure familiarity, one for the product and the others for the two attributespresented in each product category. For example, for the lawn mower,participants indicated their agreement/ disagreements on three 7-pointLikert scales: “I’m familiar with lawn mowers,” “I’m knowledgeable aboutthe meaning of horse-power of a lawn mower,” and “I’m knowledgeableabout the warranty of a lawn mower.” Measures for all the six productsexhibited high reliability for familiarity (Cronbach’s α � .80 for lawnmower, .86 for cordless phone, .85 for stair climber, .92 for snow thrower,.96 for digital camera, .97 for disc sander).
SHENG, PARKER, AND NAKAMOTO602
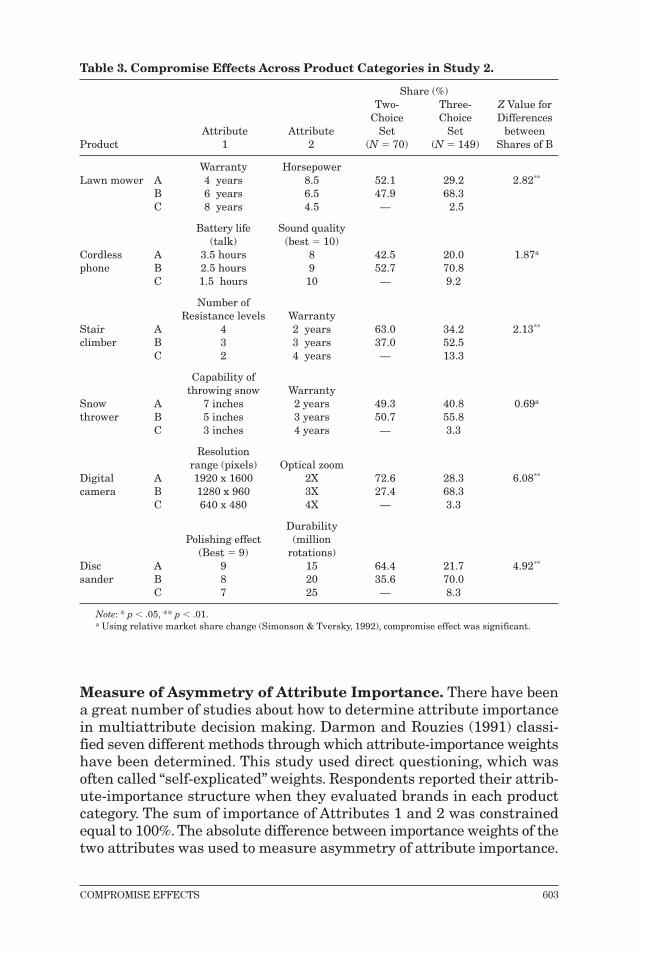
Measure of Asymmetry of Attribute Importance. There have beena great number of studies about how to determine attribute importancein multiattribute decision making. Darmon and Rouzies (1991) classi-fied seven different methods through which attribute-importance weightshave been determined. This study used direct questioning, which wasoften called “self-explicated” weights. Respondents reported their attrib-ute-importance structure when they evaluated brands in each productcategory. The sum of importance of Attributes 1 and 2 was constrainedequal to 100%. The absolute difference between importance weights of thetwo attributes was used to measure asymmetry of attribute importance.
COMPROMISE EFFECTS 603
Table 3. Compromise Effects Across Product Categories in Study 2.
Share (%)Two- Three- Z Value for
Choice Choice Differences Attribute Attribute Set Set between
Product 1 2 (N � 70) (N � 149) Shares of B
Warranty HorsepowerLawn mower A 4 years 8.5 52.1 29.2 2.82**
B 6 years 6.5 47.9 68.3C 8 years 4.5 — 2.5
Battery life Sound quality(talk) (best � 10)
Cordless A 3.5 hours 8 42.5 20.0 1.87a
phone B 2.5 hours 9 52.7 70.8C 1.5 hours 10 — 9.2
Number of Resistance levels Warranty
Stair A 4 2 years 63.0 34.2 2.13**
climber B 3 3 years 37.0 52.5C 2 4 years — 13.3
Capability of throwing snow Warranty
Snow A 7 inches 2 years 49.3 40.8 0.69a
thrower B 5 inches 3 years 50.7 55.8C 3 inches 4 years — 3.3
Resolution range (pixels) Optical zoom
Digital A 1920 x 1600 2X 72.6 28.3 6.08**
camera B 1280 x 960 3X 27.4 68.3C 640 x 480 4X — 3.3
Durability Polishing effect (million
(Best � 9) rotations)Disc A 9 15 64.4 21.7 4.92**
sander B 8 20 35.6 70.0C 7 25 — 8.3
Note: * p � .05, ** p � .01.a Using relative market share change (Simonson & Tversky, 1992), compromise effect was significant.
Results and Discussion
Compromise Effect. The compromise effect suggests that the marketshare of the compromise option (Brand B) will increase as a result of theaddition of the third brand to the choice set. In this study, the compro-mise effect was significant in four out of six product categories, as shownin Table 3. In addition, relative market share of B to A significantlyincreased in all of the six product categories.
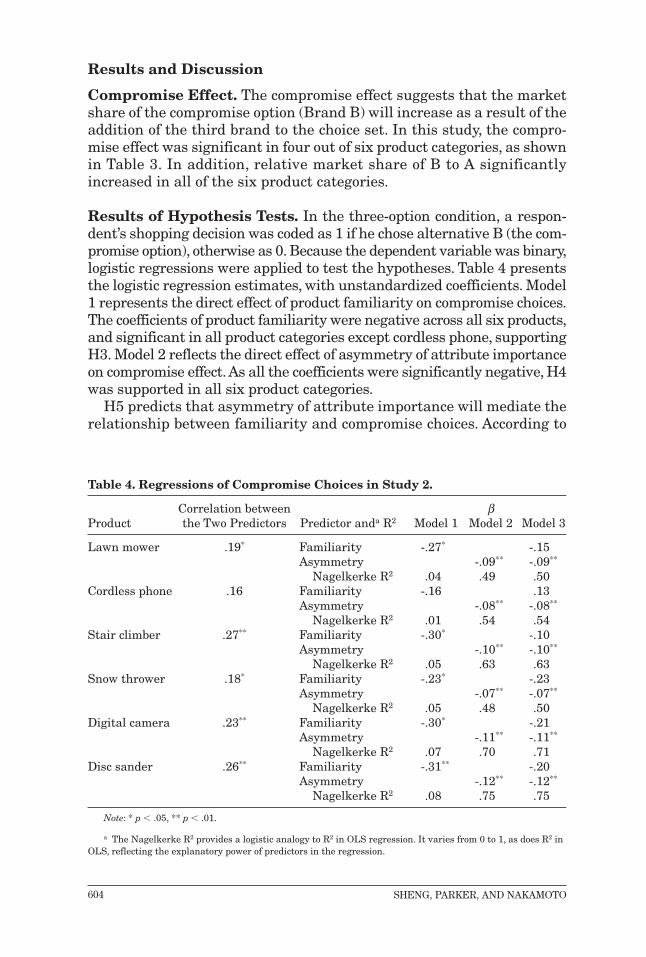
Results of Hypothesis Tests. In the three-option condition, a respon-dent’s shopping decision was coded as 1 if he chose alternative B (the com-promise option), otherwise as 0. Because the dependent variable was binary,logistic regressions were applied to test the hypotheses. Table 4 presentsthe logistic regression estimates, with unstandardized coefficients. Model1 represents the direct effect of product familiarity on compromise choices.The coefficients of product familiarity were negative across all six products,and significant in all product categories except cordless phone, supportingH3. Model 2 reflects the direct effect of asymmetry of attribute importanceon compromise effect.As all the coefficients were significantly negative, H4was supported in all six product categories.
H5 predicts that asymmetry of attribute importance will mediate therelationship between familiarity and compromise choices. According to
SHENG, PARKER, AND NAKAMOTO604
Table 4. Regressions of Compromise Choices in Study 2.
Correlation between βProduct the Two Predictors Predictor anda R2 Model 1 Model 2 Model 3
Lawn mower .19* Familiarity -.27* -.15Asymmetry -.09** -.09**
Nagelkerke R2 .04 .49 .50Cordless phone .16 Familiarity -.16 .13
Asymmetry -.08** -.08**
Nagelkerke R2 .01 .54 .54Stair climber .27** Familiarity -.30* -.10
Asymmetry -.10** -.10**
Nagelkerke R2 .05 .63 .63Snow thrower .18* Familiarity -.23* -.23
Asymmetry -.07** -.07**
Nagelkerke R2 .05 .48 .50Digital camera .23** Familiarity -.30* -.21
Asymmetry -.11** -.11**
Nagelkerke R2 .07 .70 .71Disc sander .26** Familiarity -.31** -.20
Asymmetry -.12** -.12**
Nagelkerke R2 .08 .75 .75
Note: * p � .05, ** p � .01.
a The Nagelkerke R2 provides a logistic analogy to R2 in OLS regression. It varies from 0 to 1, as does R2 inOLS, reflecting the explanatory power of predictors in the regression.
Baron and Kenny (1986), three regression equations must be estimatedto test a mediating effect, and the following conditions must hold:
1. There must be a significant effect of regressing the mediator on theindependent variable.
2. There must be a significant effect of regressing the dependent vari-able on the independent variable.
3. When the dependent variable is regressed on both the mediatorand the independent variable, the effect of the independent variablemust be weaker than that in the second regression equation. And,when the effect of independent variable in the third condition iszero, there is a complete mediating effect; otherwise, partial medi-ation exists.
These criteria were applied to test H5. Model 3 in Table 4 was con-structed to test the mediating effect of attribute-importance structure.As shown in Table 4, there were significant positive correlations betweenfamiliarity and asymmetry of attribute importance across all productcategories except cordless phone. Meanwhile, coefficients of familiarityin Model 3 decreased, with all being nonsignificant, whereas they weresignificant in Model 2. These results demonstrated that the impact offamiliarity on compromise effect was mediated by asymmetry of attrib-ute-importance structure, supporting H5.
CONCLUSION
The empirical results presented in this article supported expected-lossminimization as the mechanism underlying the compromise effect underdecision uncertainty. As expected, individuals experiencing higher deci-sion uncertainty were more likely to make compromise choices. Fur-thermore, the compromise effect was reduced when the decoy option (C)was brought closer to the other two options (C'). Expanding on thesefindings, Study 2 demonstrated that individuals who were more famil-iar with the product had more symmetric attribute-importance struc-ture, and thus were less likely to choose the compromise option.
This research enriches understanding of context effects in decisionmaking. When evaluating a focal alternative, individuals take into con-sideration comparative characteristics of other alternatives rather thanonly the features of the focal alternative, complicating the decision-mak-ing process. However, context effects are less likely to play a role when con-sumers have established preference structure.When consumers are uncer-tain about the values of options, they are more likely to use the contextin decision making (Simonson & Tversky, 1992). The mechanism of com-promise effect presented and tested in this article further attested therole of decision uncertainty in context effects. In addition, the decision-
COMPROMISE EFFECTS 605
uncertainty instrument developed in this research provides a platform forfurther research in this field. Aside from this theoretical significance, theempirical findings could also have important practical implications forthe design of product positioning. When consumers are less familiar withor less knowledgeable about a product category, they will be more likelyto choose the compromise option, if it is evaluated in a triple or a choiceset with even more options. Therefore, it can be a plausible tactic toincrease attractiveness of a product by positioning it as a compromiseoption in the choice set. This tactic will also work for products for whichconsumers have a balanced attribute-importance structure.
Of course, there are several limitations in this study. First, the brandsused in these studies were described on only two attributes, withoutphysical presentation of products. Although it allows for greater controlover extraneous variables, this limits the external validity of the study.However, these limitations also suggest research avenues for furtherunderstanding of compromise effects. As shown in Tables 2 and 3, themagnitude of the shift in market share for the compromise option variesacross different product categories. The compromise effect is not a uni-versal phenomenon occurring in all circumstances. Future researchshould work to more precisely identify the conditions that promote com-promise effects.
This article only investigated the effect of certain consumer charac-teristics, namely, familiarity and attribute-importance structure. Com-promise effects might also be influenced by other individual differences,characteristics of the choice task, as well as the product. For instance, theavailability and quantity of information in the stimulus material mayinfluence a consumer’s decision strategy, possibly changing the likeli-hood of choosing the compromise option. Further empirical research fol-lowing these directions may provide insights toward a more thoroughunderstanding of compromise effects.
REFERENCES
Alba, J. W., & Hutchinson, W. (1987). Dimensions of consumer expertise. Journalof Consumer Research, 13, 411–453.
Baron, R. M., & Kenny, D.A. (1986).The moderator–mediator variable distinctionin social psychological research: Conceptual, strategic and statistical consid-erations. Journal of Personality and Social Psychology, 51, 1173–1182.
Bettman, J. R., Johnson, E. J., & Payne, J. W. (1990). A componential analysis ofcognitive effort in choice. Organizational Behavior and Human DecisionProcesses, 45, 111–139.
Brucks, M. (1985). The effects of product class knowledge on information searchbehavior. Journal of Consumer Research, 12, 1–16.
Burton, S., & Zinkhan, G. M. (1987). Changes in consumer choice: Further inves-tigation of similarity and attraction effects. Psychology & Marketing, 4, 255–266.
Coupey, E., Irwin, J. R., & Payne, J.W. (1998). Product category familiarity and pref-erence construction. Journal of Consumer Research, 24, 459–467.
SHENG, PARKER, AND NAKAMOTO606
Darmon, R. Y., & Rouzies, D. (1991). Internal validity assessment of conjoint esti-mated attribute importance weights. Journal of the Academy of Marketing Sci-ence, 19, 315–322.
Dowling, G. R., & Staelin, R. (1994). A model of perceived risk and intended risk-handling activity. Journal of Consumer Research, 21, 119–134.
Duncan, R. B. (1972). Characteristics of organizational environments and per-ceived environmental uncertainty. Administrative Science Quarterly, 17,313–327.
Fazio, R. H. (1986). How do attitudes guide behavior? In R. M. Sorrentino & E. T.Higgins (Eds.), The handbook of motivation and cognitions for social behavior.New York: Guilford Press.
Huber, J., Payne, J.W., & Puto, C. (1982).Adding asymmetrically dominated alter-natives: Violations of regularity and the similarity hypothesis. Journal of Con-sumer Research, 9, 90–98.
Huber, J., & Puto, C. (1983). Market boundaries and produce choice: Illustratingattraction and substitution effects. Journal of Consumer Research, 10, 31–44.
Johnson, E. J., & Russo, J. E. (1984). Product familiarity and learning new infor-mation. Journal of Consumer Research, 11, 542–550.
Kahneman, D., & Tversky, A. (1979). Prospect theory: An analysis of decisionunder uncertainty. Econometrica, 47, 263–291.
Lehmann, D. R., & Pan, Y. (1994). Context effects, new brand entry, and consid-eration sets. Journal of Marketing Research, 31, 364–374.
Loomes, G., & Sugden, G. (1982). Regret theory: An alternative theory of rationalchoice under uncertainty. Economic Journal, 92, 805–824.
Marks, L. J., & Olson, J. C. (1981). Towards a cognitive structure conceptualiza-tion of product familiarity. In K. B. Monroe (Ed.),Advances in consumer research(Vol. 8, pp. 145–150). Ann Arbor, MI: Association for Consumer Research.
Pan, Y., & Lehmann, D. R. (1993). The influence of new brand entry on subjectivebrand judgments. Journal of Consumer Research, 20, 76–86.
Park, C. W. (1976). The effect of individual and situation-related factors on con-sumer selection of judgmental models. Journal of Consumer Research, 13,144–151.
Ratneshwar, S., Shocker,A. D., & Stewart, D.W. (1987).Toward understanding theattraction effect:The implication of product stimulus meaningfulness and famil-iarity. Journal of Consumer Research, 13, 520–533.
Simonson, I. (1989). Choice based on reason: The case of attraction and compro-mise effects. Journal of Consumer Research, 16, 158–174.
Simonson, I., & Tversky, A. (1992). Choice in context: Tradeoff contrast andextremeness aversion. Journal of Marketing Research, 29, 281–295.
Vlek, C., & Stallen, P. (1980). Rational and personal aspects of risk. Acta Psycho-logica, 45, 273–300.
Yates, J. F. (1990). Judgment and decision making (p. 317). Englewood Cliffs,NJ: Prentice-Hall.
Correspondence regarding this article should be sent to: Shibin Sheng, Schoolof Business, Adelphi University, Garden City, NY 11530 ([email protected]).
COMPROMISE EFFECTS 607
APPENDIX 1
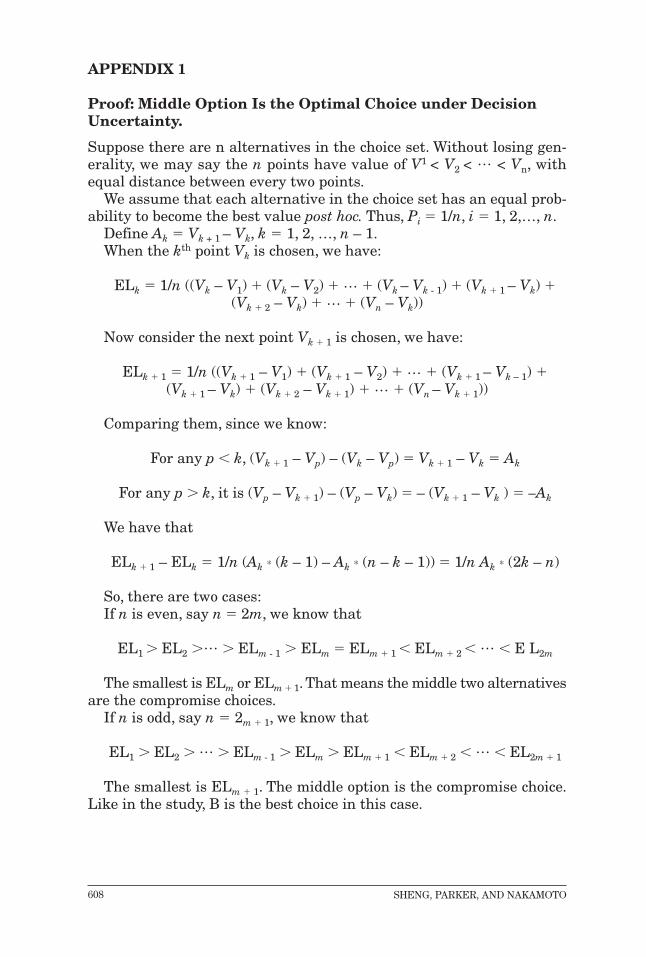
Proof: Middle Option Is the Optimal Choice under DecisionUncertainty.
Suppose there are n alternatives in the choice set. Without losing gen-erality, we may say the n points have value of V1 < V2 < … < Vn, withequal distance between every two points.
We assume that each alternative in the choice set has an equal prob-ability to become the best value post hoc. Thus, Pi � 1/n, i � 1, 2,…, n.
Define Ak � Vk + 1 – Vk, k � 1, 2, …, n – 1.When the kth point Vk is chosen, we have:
ELk � 1/n ((Vk – V1) � (Vk – V2) � … � (Vk – Vk - 1) � (Vk � 1 – Vk) �(Vk � 2 – Vk) � … � (Vn – Vk))
Now consider the next point Vk � 1 is chosen, we have:
ELk � 1 � 1/n ((Vk � 1 – V1) � (Vk � 1 – V2) � … � (Vk � 1 – Vk – 1) �(Vk � 1 – Vk) � (Vk � 2 – Vk � 1) � … � (Vn – Vk � 1))
Comparing them, since we know:
For any p � k, (Vk � 1 – Vp) – (Vk – Vp) � Vk � 1 – Vk � Ak
For any p � k, it is (Vp – Vk � 1) – (Vp – Vk) � – (Vk � 1 – Vk ) � –Ak
We have that
ELk � 1 – ELk � 1/n (Ak * (k – 1) – Ak * (n – k – 1)) � 1/n Ak * (2k – n)
So, there are two cases:If n is even, say n � 2m, we know that
EL1 � EL2 �… � ELm - 1 � ELm � ELm � 1 � ELm � 2 � … � E L2m
The smallest is ELm or ELm � 1. That means the middle two alternativesare the compromise choices.
If n is odd, say n � 2m � 1, we know that
EL1 � EL2 � … � ELm - 1 � ELm � ELm � 1 � ELm � 2 � … � EL2m � 1
The smallest is ELm � 1. The middle option is the compromise choice.Like in the study, B is the best choice in this case.
SHENG, PARKER, AND NAKAMOTO608
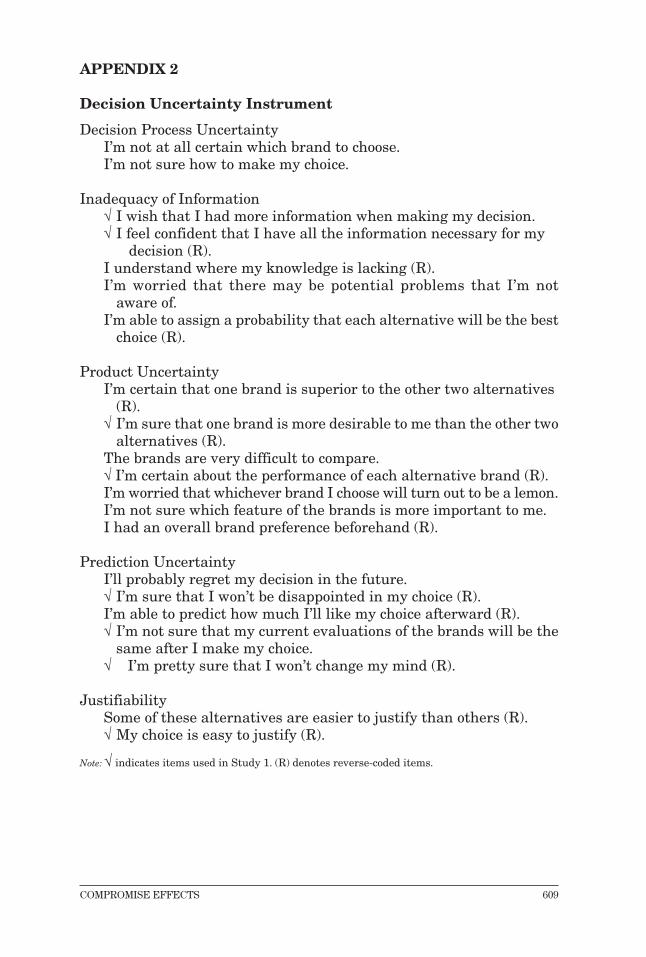
APPENDIX 2
Decision Uncertainty Instrument
Decision Process UncertaintyI’m not at all certain which brand to choose.I’m not sure how to make my choice.
Inadequacy of Information√ I wish that I had more information when making my decision.√ I feel confident that I have all the information necessary for my
decision (R).I understand where my knowledge is lacking (R).I’m worried that there may be potential problems that I’m not
aware of.I’m able to assign a probability that each alternative will be the best
choice (R).
Product UncertaintyI’m certain that one brand is superior to the other two alternatives
(R).√ I’m sure that one brand is more desirable to me than the other two
alternatives (R).The brands are very difficult to compare.√ I’m certain about the performance of each alternative brand (R).I’m worried that whichever brand I choose will turn out to be a lemon.I’m not sure which feature of the brands is more important to me.I had an overall brand preference beforehand (R).
Prediction UncertaintyI’ll probably regret my decision in the future.√ I’m sure that I won’t be disappointed in my choice (R).I’m able to predict how much I’ll like my choice afterward (R).√ I’m not sure that my current evaluations of the brands will be the
same after I make my choice.√ I’m pretty sure that I won’t change my mind (R).
JustifiabilitySome of these alternatives are easier to justify than others (R).√ My choice is easy to justify (R).
Note: √ indicates items used in Study 1. (R) denotes reverse-coded items.
COMPROMISE EFFECTS 609