Embed Size (px)
Citation preview
University of Groningen
Understanding the Mismatch Between Coaches' and Players' Perceptions of ExertionBrink, Michel S.; Kersten, Anna W.; Frencken, Wouter G. P.
Published in:International journal of sports physiology and performance
DOI:10.1123/ijspp.2016-0215
IMPORTANT NOTE: You are advised to consult the publisher's version (publisher's PDF) if you wish to cite fromit. Please check the document version below.
Document VersionFinal author's version (accepted by publisher, after peer review)
Publication date:2017
Link to publication in University of Groningen/UMCG research database
Citation for published version (APA):Brink, M. S., Kersten, A. W., & Frencken, W. G. P. (2017). Understanding the Mismatch Between Coaches'and Players' Perceptions of Exertion. International journal of sports physiology and performance, 12(4),562-568. https://doi.org/10.1123/ijspp.2016-0215
CopyrightOther than for strictly personal use, it is not permitted to download or to forward/distribute the text or part of it without the consent of theauthor(s) and/or copyright holder(s), unless the work is under an open content license (like Creative Commons).
Take-down policyIf you believe that this document breaches copyright please contact us providing details, and we will remove access to the work immediatelyand investigate your claim.
Downloaded from the University of Groningen/UMCG research database (Pure): http://www.rug.nl/research/portal. For technical reasons thenumber of authors shown on this cover page is limited to 10 maximum.
Download date: 23-05-2020
“Understanding the Mismatch Between Coaches' and Players' Perceptions of Exertion”
by Brink MS, Kersten AW, Grencken WG
International Journal of Sports Physiology and Performance
© 2016 Human Kinetics, Inc.
Note. This article will be published in a forthcoming issue of the
International Journal of Sports Physiology and Performance. The article
appears here in its accepted, peer-reviewed form, as it was provided by
the submitting author. It has not been copyedited, proofread, or
formatted by the publisher.
Section: Original Investigation
Article Title: Understanding the Mismatch Between Coaches' and Players' Perceptions of
Exertion
Authors: Michel S. Brink 1, Anna W. Kersten 2, and Wouter G.P. Frencken 1,2,3
Affiliations: 1Center of Human Movement Sciences, University of Groningen, the Netherlands. 2School of Sport Studies, Hanze University of Applied Sciences, the Netherlands. 3Football Club
Groningen, the Netherlands.
Journal: International Journal of Sports Physiology and Performance
Acceptance Date: August 15, 2016
©2016 Human Kinetics, Inc.
DOI: http://dx.doi.org/10.1123/ijspp.2016-0215
“Understanding the Mismatch Between Coaches' and Players' Perceptions of Exertion”
by Brink MS, Kersten AW, Grencken WG
International Journal of Sports Physiology and Performance
© 2016 Human Kinetics, Inc.
Full Title: Understanding the mismatch between coaches' and players' perceptions of
exertion
Paper Type: Original Investigation
Authors: Michel S. Brink 1, Anna W. Kersten 2, Wouter G.P. Frencken 1,2,3
1. Center of Human Movement Sciences, University of Groningen, the
Netherlands
2. School of Sport Studies, Hanze University of Applied Sciences, the
Netherlands 3. Football Club Groningen, the Netherlands
Corresponding author:
Name: Michel S. Brink
Postal address: P.O. Box 196, 9700 AD Groningen, the Netherlands
E-mail: [email protected]
Phone: +31503616055 Fax: +31503633150
Running Title: Intended, observed and perceived exertion
Abstract word count: 238
Text only word count: 3062 (excluding references, figure and tables)
Number of Figures: 3
Number of Tables: 2
Dow
nloa
ded
by R
ijksu
nive
rsite
it B
iblio
tec
on 0
5/08
/17,
Vol
ume
0, A
rtic
le N
umbe
r 0
“Understanding the Mismatch Between Coaches' and Players' Perceptions of Exertion”
by Brink MS, Kersten AW, Grencken WG
International Journal of Sports Physiology and Performance
© 2016 Human Kinetics, Inc.
Abstract
A mismatch between the intended training exertion by the coach and the perceived exertion by
players is well established in sports. However, it is unknown if coaches are able to accurately
observe exertion of individual players during training. Furthermore, the discrepancy in coaches’
and players’ perceptions has not been explained. Purpose: We aim to 1) determine the relation
between intended and observed training exertion by the coach and perceived training exertion by
the player and 2) establish if on-field training characteristics, intermittent endurance capacity and
maturity status explain the mismatch. Methods: During two mesocycles of 4 weeks (November
and March) intended (RIE), observed (ROE) and perceived (RPE) exertion were monitored of 31
young elite soccer players. External and internal training load were objectively quantified with
accelerometers (PlayerLoad) and heart rate monitors (TRIMPmod). Interval Shuttle Run Test
(ISRT) and age at peak height velocity (APHV) were determined for all players. Results: 977
training sessions were monitored with RIE, ROE and RPE. The correlations between RIE and
RPE (r=.58; p<0.01) and ROE and RPE (r=.64; p<0.01) were moderate. The mean difference
between RIE and RPE was -0.31±1.99 and between ROE and RPE was -0.37±1.87. Multilevel
analyses showed that PlayerLoad and ISRT predicted RIE and ROE. Conclusion: Coaches base
their intended and observed exertion on what they expect players will do and what they actually
did on the field. When doing this, they consider the intermittent endurance capacity of individual
players.
Keywords: Soccer, periodization, monitoring, intensity, training load, football
Dow
nloa
ded
by R
ijksu
nive
rsite
it B
iblio
tec
on 0
5/08
/17,
Vol
ume
0, A
rtic
le N
umbe
r 0
“Understanding the Mismatch Between Coaches' and Players' Perceptions of Exertion”
by Brink MS, Kersten AW, Grencken WG
International Journal of Sports Physiology and Performance
© 2016 Human Kinetics, Inc.
Introduction
A mismatch between intended and perceived exertion is well established in individual
and team sports. 1-10 It is suggested that this mismatch is even more pronounced in team sports
like soccer, because training load during group exercises is difficult to control. 6 Moreover,
coaches need to consider the individual characteristics of a large number of players on the field.
It is assumed that discrepancies between intended and perceived exertion could lead to either
under- or overtraining. 4 This is most delicate in the development of young players because
inadequate training routines can lead to suboptimal performance and higher risk for injuries and
illness. 11
It has been suggested that coaches adjust their perceptions after observing training
sessions. 7,8 Thus far, only two studies explored the ability of coaches to accurately observe the
exertion of individual athletes. 7,8 These studies included tennis players and volleyball players
and their coaches. The ratings of the tennis coaches before and after the training sessions were
correlated and both underestimated the RPE of the player. This underestimation was confirmed
in volleyball, particularly during physical training. However, if soccer coaches with teams up to
twenty young players are able to observe intensity of individuals is not yet known.
Up to now, information about underlying factors that explain the mismatch between
intended, observed and actual exertion is lacking. However, a better understanding of the sources
of information that coaches uses may help to better calibrate their perceptions with that of
players. A likely starting point is to consider what actually happens during the training session
using technology such as accelerometers (external load) and heart rate monitors (internal load).
Secondly, it is assumed that coaches consider the individual characteristics of players. An
important individual characteristic that has great influence on the internal load is the intermittent
Dow
nloa
ded
by R
ijksu
nive
rsite
it B
iblio
tec
on 0
5/08
/17,
Vol
ume
0, A
rtic
le N
umbe
r 0
“Understanding the Mismatch Between Coaches' and Players' Perceptions of Exertion”
by Brink MS, Kersten AW, Grencken WG
International Journal of Sports Physiology and Performance
© 2016 Human Kinetics, Inc.
endurance capacity. 12 Hence, it is useful to determine if coaches use information of intermittent
endurance capacity when estimating intended and observed exertion. A third factor could be the
maturity status of players 13, because first-year soccer players perceive training harder than
second-year soccer players within one team. 6 In addition, maturity status has a substantial
impact on intermittent endurance capacity. 14,15 A similar external training load could thus result
in a different internal load based on the maturity status of players.
The aim of this study is to define the relation between intended and observed training
load by the coach and perceived training load by the player. Furthermore, we aim to explain a
potential mismatch between the intended and observed training load by the coach and perceived
load of the players through on-field training characteristics, intermittent endurance capacity and
maturity status.
Method
Subjects
Thirty-one players participated in the study; sixteen players from the U15 team (14.3±0.3
years, 56.3±12.9 kg, 168.1±11.1 cm) and fifteen players from the U17 team (16.3±0.2 year,
67.8±5.2 kg, 179.9±4.9 cm). Both teams played at the highest-level of competition in the
Netherlands. Their coaches are certified to coach at the highest level, accredited by the Royal
Dutch Football Association. The U17-coach and the U15-coach had 23 and 18 years of
professional coaching experience respectively. All participants were informed of the procedures
of the study and player and both parents signed an informed consent. The ethical committee of
the Center for Human Movement Sciences (University of Groningen, UMCG, Groningen)
approved the study.
Dow
nloa
ded
by R
ijksu
nive
rsite
it B
iblio
tec
on 0
5/08
/17,
Vol
ume
0, A
rtic
le N
umbe
r 0
“Understanding the Mismatch Between Coaches' and Players' Perceptions of Exertion”
by Brink MS, Kersten AW, Grencken WG
International Journal of Sports Physiology and Performance
© 2016 Human Kinetics, Inc.
Design
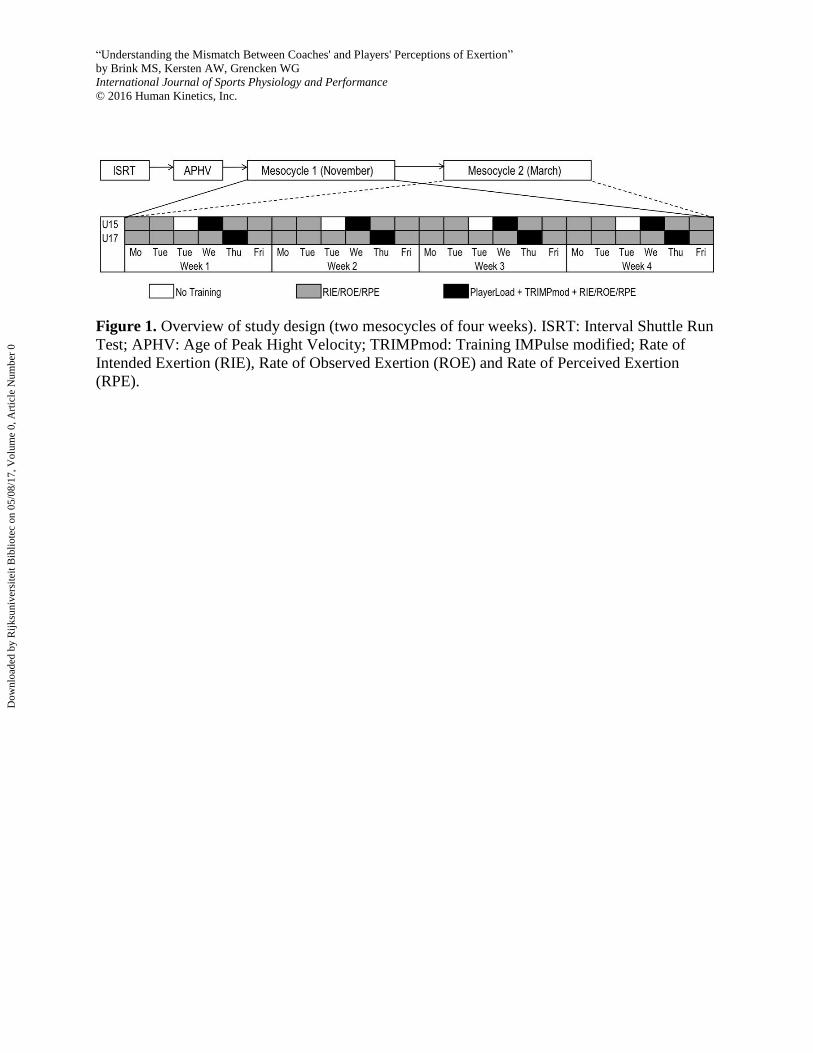
During two mesocycles of four weeks (November and March) of the competitive season
intended (RIE), observed (ROE) and perceived exertion (RPE) were monitored (figure. 1). The
U15 team had five training sessions a week, one on every weekday. The U17 team had six
training sessions each week with an additional strength training session on Tuesday afternoon.
Once a week within both mesocycles, one training session was monitored using Zephyr
Bioharnass to measure accelerations and heart rate. The U15 team was measured every
Wednesday during the mesocycle and the U17 team every Thursday. At the start of the
competitive season (September) all players performed the Interval Shuttle Run Test (ISRT) to
assess the intermittent endurance capacity. Four weeks thereafter Age at Peak Height Velocity
(APHV) of each individual was determined.
Methodology
Intended, observed and perceived exertion
To measure the intended, observed and perceived exertion a Borg scale from 6 (no
exertion) to 20 (extreme exertion) was used. To quantify subjective training exertion, the Rate of
Perceived Exertion is a frequently used and valid method. 16-18 Before each training the coach
scored the Rate of Intended Exertion for all individual players of his team for the entire session.
Right after the training session, the coach filled in the Rate of Observed Exertion for all
individual players based on his observations of the whole training session. About thirty minutes
afterwards, players gave their RPE for the whole training session. 16,17 In line with previous work
we used the original Borg scale instead of the category ratio scale, because in the Netherlands
school exams are graded on a 10 point scale. 6,11 This association could lead to ignorance of the
lower half of the scale.
Dow
nloa
ded
by R
ijksu
nive
rsite
it B
iblio
tec
on 0
5/08
/17,
Vol
ume
0, A
rtic
le N
umbe
r 0
“Understanding the Mismatch Between Coaches' and Players' Perceptions of Exertion”
by Brink MS, Kersten AW, Grencken WG
International Journal of Sports Physiology and Performance
© 2016 Human Kinetics, Inc.
PlayerLoad and heartrate
The Zephyr’s BioHarnessTM 3 (Zephyr Technology Corporation, Annapolis, MD, US)
was used to measure external load with accelerometers and to measure internal load with heart
rate. The accelerometer measures accelerations in three orthogonal components with a frequency
of 100 Hz. The raw accelerometer data were in bits and had to be converted into m/s2. The
accelerometer data was filtered with a second order Butterworth filter with a cut-off frequency of
4 Hz. The external load for each player can be defined as an arbitrary unit by the accumulation of
the orthogonal components and correlates highly with covered distance. 19
Second, heart rate was measured with a frequency of 1 Hz. The maximal heart rate of the
players was determined during the maximal ISRT at the start of the season and used to calculate
the TRaining IMPulse modified (TRIMPmod) for the whole training session. 20
Intermittent endurance capacity
Intermittent endurance capacity was measured with a maximal ISRT. The ISRT is a valid
and reliable method of measuring intermittent endurance capacity and the outcome correlates
highly with VO2max. 21,22 The test was performed at the start of training and consisted of 30
seconds of running alternated by 15 seconds of rest. The running speed increased every 90
seconds, started at 10 km/h and increased until 15 km/h. The instruction for the players was to
achieve as many runs as possible.
Maturity status
To determine the maturity status, APHV was calculated. 23 The length and weight
measurements took place four weeks after the ISRT measurement. Mass, stature and sitting
height were measured according to the protocol of Ross et al. (1991). All players were dressed in
Dow
nloa
ded
by R
ijksu
nive
rsite
it B
iblio
tec
on 0
5/08
/17,
Vol
ume
0, A
rtic
le N
umbe
r 0
“Understanding the Mismatch Between Coaches' and Players' Perceptions of Exertion”
by Brink MS, Kersten AW, Grencken WG
International Journal of Sports Physiology and Performance
© 2016 Human Kinetics, Inc.
shorts and did not wear shoes. Mass was recorded to nearest 0.5 kg; stature and sitting height
were measured nearest to 1 mm. For stature, length was the maximum distance from the floor to
the vertex of the head. Sitting height was maximal distance from the sitting surface to the vertex.
The peak height velocity was calculated as described by Mirwald et al. 24 in which the ratio of leg
length to sitting height is used. For boys the maturity offset = -9.236 + (0.0002708 * (leg
length*sitting height)) + (0.007216 * (age*sitting height)) + (0.02292*(mass by stature ratio)).
Statistical analysis
Descriptive statistics and correlations were calculated using IBM SPSS statistics 23.0.
Means and standard deviations of RIE, ROE, RPE, PlayerLoad, TRIMPmod, ISRT and APHV
were calculated for both teams and all players. Paired sample T-tests were used to check
differences between RIE and RPE and ROE and RPE. Only full training sessions of players were
included. If players dropped out before completion of the full training session, or missed a
training session due to injuries, illnesses or other reasons their sessions were excluded from
further analyses.
Pearson correlation coefficients were calculated to examine the association between RIE
and RPE and ROE and RPE. Pearson correlations were executed for all players (N=31) together.
Criteria for the degree of correlation were set to: 0 zero association, 0-0.3 weak association, 0.4-
0.6 moderate association, 0.7-0.9 strong association, 1 perfect association. 25 Thereafter, mean
differences were calculated following Bland Altman procedures for agreement.
Predictors for intended and observed exertion were investigated using the multilevel
modeling program MLwiN 2.29. Multilevel models are appropriate for investigating dependent
data in which training sessions are nested within players and players are nested within teams, like
in the current study. It also allows for a different number of training sessions completed per
Dow
nloa
ded
by R
ijksu
nive
rsite
it B
iblio
tec
on 0
5/08
/17,
Vol
ume
0, A
rtic
le N
umbe
r 0
“Understanding the Mismatch Between Coaches' and Players' Perceptions of Exertion”
by Brink MS, Kersten AW, Grencken WG
International Journal of Sports Physiology and Performance
© 2016 Human Kinetics, Inc.
player when the missing data is random. In the multilevel analyses models for RIE and ROE
were created. Levels 1 in these models were the different training sessions in which data was
gathered. Levels 2 were the differences between individual players and levels 3 were the
differences between both teams. Predictors entered for RIE and ROE were PlayerLoad,
TRIMPmod, ISRT and APHV. Moreover, random intercepts were expected which means unique
intercepts for all players. Also, random slopes were entered into the model to check for different
slopes when predicting RIE and ROE for different players. Prediction variables were entered
separately into the initial model. The order for entering the prediction variables was based on the
correlation with of each variable with RIE and ROE, starting with the variable with the highest
correlation. After addition of each variable the -2*loglikelihood (IGLS deviance) was compared
to the previous model. Variables that did not improve the model significantly (p<0.05) were
removed from further analysis. Predictions of the variables were calculated based on the final
estimated model. Subsequently, the explained variance was calculated from the difference in
variance between the initial and the final model. In all statistical analyses alpha was set to 5%.
Results
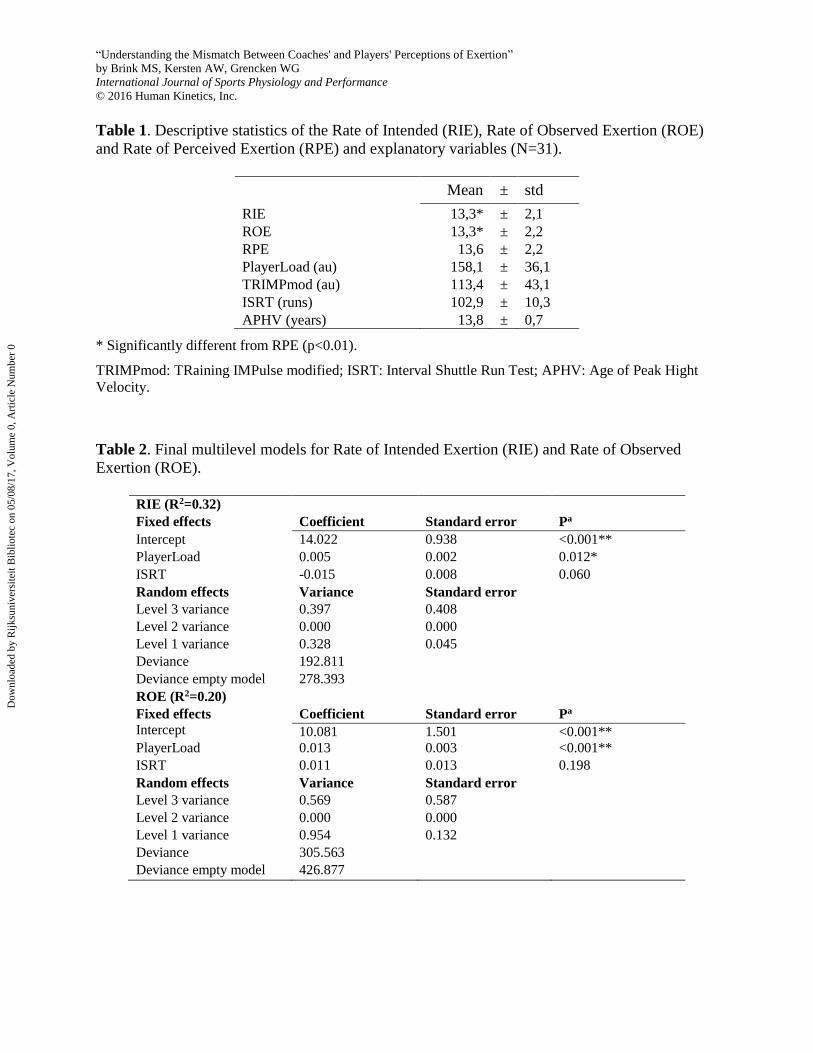
RIE, ROE and RPE were obtained from 977 training sessions (U15 445 sessions, U17
532 sessions). From these 977 sessions, 111 sessions (11% of all sessions, U15 46 sessions, U17
65 sessions) were measured using Zephyr to determine PlayerLoad and TRIMPmod. This
corresponds with 3.6 sessions per player. Table 1 shows the means and standard deviations for
all variables. RIE (t=-4.89, df=976, p<0.001) and ROE (t=-6.19, df=976, p<0.001) were
significantly lower than RPE.
Dow
nloa
ded
by R
ijksu
nive
rsite
it B
iblio
tec
on 0
5/08
/17,
Vol
ume
0, A
rtic
le N
umbe
r 0
“Understanding the Mismatch Between Coaches' and Players' Perceptions of Exertion”
by Brink MS, Kersten AW, Grencken WG
International Journal of Sports Physiology and Performance
© 2016 Human Kinetics, Inc.
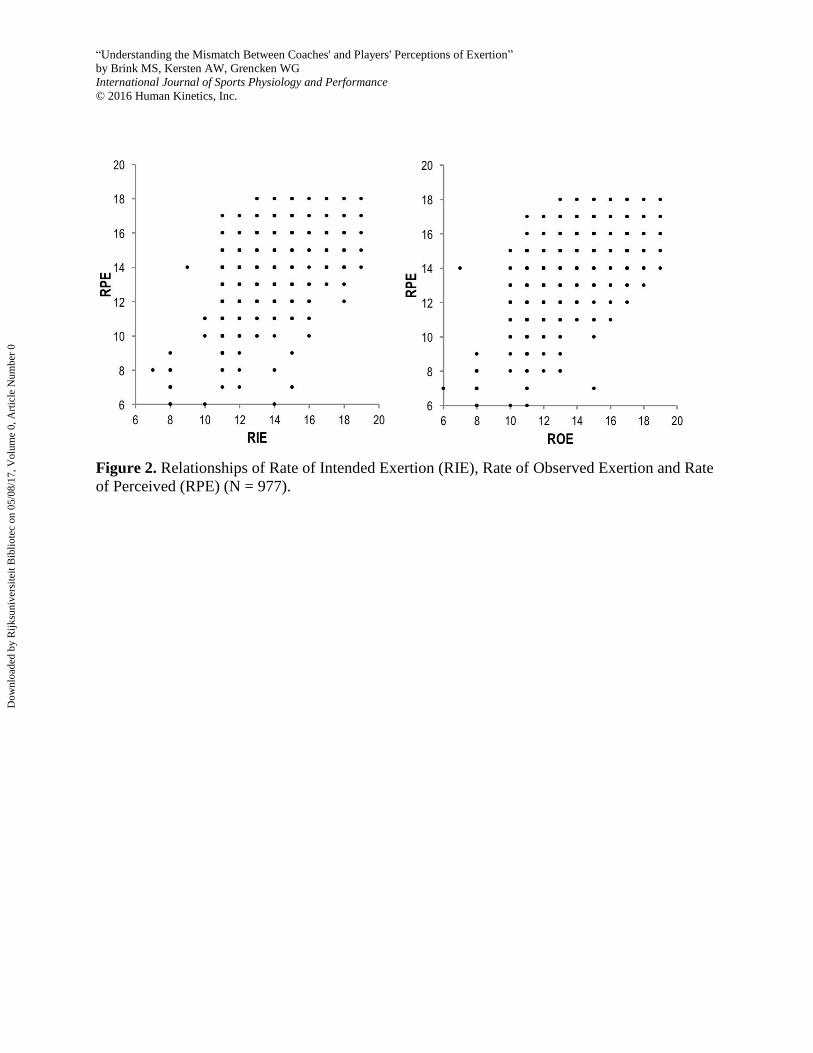
Figure 2 shows the bivariate Pearson correlation coefficients for RIE, ROE and RPE.
Correlation between RIE and RPE was r=.58 (p<0.01) and between ROE and RPE r=.64
(p<0.01).
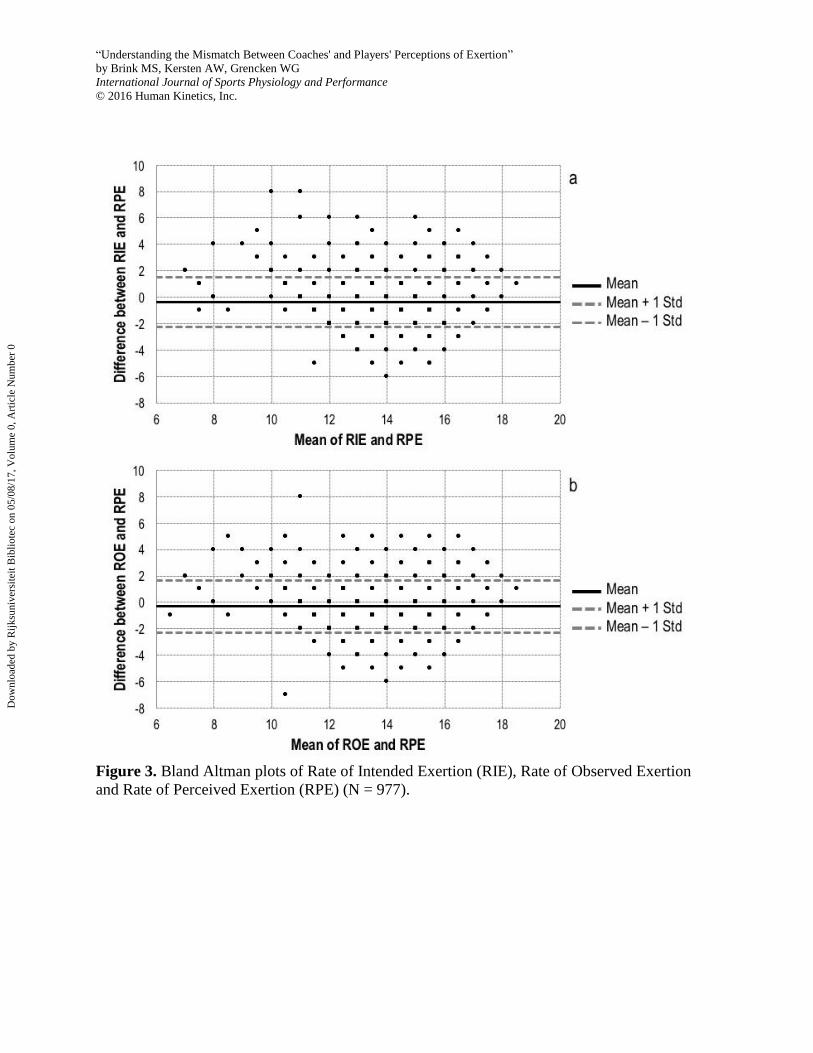
Figure 3a depicts the Bland Altman plot of RIE and RPE. The mean difference was
-0.31±1.99, CI 95% [-0,43, -0,19] with a minimum of -6 and a maximum of 8. For ROE
and RPE, the mean difference was -0.37±1.87, CI 95% [-0,49, -0,25] with a minimum of -7 and a
maximum of 8 (figure 3b). No significant difference was found between these values.
The final models that explain RIE and ROE are presented in table 2. All models included
significant different intercepts but the slopes were the same for different players. Both models
included PlayerLoad and ISRT and improved the model significantly (p<0.05). TRIMPmod an
APHV did not improve the model. The models explained 32% and 20% of the total variance for
RIE and ROE, respectively. Training session (level 1) and team (level 3) contributed both to the
total explained variance for both RIE and ROE.
Discussion
The first aim of this study was to determine the relation between intended and observed
training exertion by the coach and perceived training exertion by the player. The moderate
correlations between intended and observed exertion by the coach and perceived exertion by the
player demonstrated a mismatch. Furthermore, we aimed to explain this mismatch through on-
field training characteristics, intermittent endurance capacity and maturity status. The multilevel
models showed that both external load and intermittent endurance capacity are predictors of the
Rate of Intended Exertion and Rate of Observed Exertion and that internal load and maturity
status are not.
Dow
nloa
ded
by R
ijksu
nive
rsite
it B
iblio
tec
on 0
5/08
/17,
Vol
ume
0, A
rtic
le N
umbe
r 0
“Understanding the Mismatch Between Coaches' and Players' Perceptions of Exertion”
by Brink MS, Kersten AW, Grencken WG
International Journal of Sports Physiology and Performance
© 2016 Human Kinetics, Inc.
The moderate association between intended and perceived exertion is comparable with
previous findings in young elite soccer players. 6 Although the correlation between observed and
perceived exertion was somewhat stronger compared to intended and perceived exertion, coaches
underestimated players perceived exertion before and after training. So, even when coaches
decided to change their initial scores after observing training, the mismatch with the perceptions
of players remained. This confirms previous findings that coaches are unable to accurately
observe the internal load of players. 7,8 Thus, there is not only a discrepancy between intended
exertion and perceived exertion but also between observed exertion and perceived exertion. The
magnitude of these discrepancies is illustrated by the Bland Altman procedures. Although the
mean difference was close to zero, the standard deviation of around 2 indicates that 32% of all
pairings deviate more than 2 points with overestimations up to 8 points and underestimations up
to 7 points.
The multilevel models of both intended exertion and observed exertion included external
load and the interval endurance capacity. The external load of a training session usually includes
the type of exercise, repetitions and duration as planned by the coach. Therefore, it can be argued
that the intended external exertion by the coach should correspond with the external load of the
players measured with PlayerLoad. Our results support this, given the predictive value of
PlayerLoad in the model. Additionally, ISRT was a positive predictor of both intended and
observed exertion. This reveals that the coach considers the intermittent endurance capacity of
his players for the estimations, e.g. coaches estimate that players with a lower intermittent
endurance capacity will perceive the training as harder.
In contrast to PlayerLoad and ISRT, TRIMPmod and APHV were not included in the
final multilevel models. For TRIMPmod, a likely explanation is that the combination of external
Dow
nloa
ded
by R
ijksu
nive
rsite
it B
iblio
tec
on 0
5/08
/17,
Vol
ume
0, A
rtic
le N
umbe
r 0
“Understanding the Mismatch Between Coaches' and Players' Perceptions of Exertion”
by Brink MS, Kersten AW, Grencken WG
International Journal of Sports Physiology and Performance
© 2016 Human Kinetics, Inc.
load (PlayerLoad) and the individual endurance capacity of players already reflect the internal
load. Although TRIMPmod was related to intended and observed exertion, it did not improve the
model. For APHV it turned out that almost all players of both teams already passed APHV. In
addition, it is known that when players grow mature, intermittent endurance capacity also
improves. 26,27 Thus, coaches might have included maturity status through accounting for ISRT
in scoring intended and observed exertion.
The models in this study explained 32% and 20% of the variance respectively. This
suggests that a large proportion remains unexplained. Several factors during training and before
or after training may underlie this. First, static exercises like core-stability programs within
training are not measured through PlayerLoad. Exclusion of these static exercises likely lower
the RPE-values. 18 Moreover, TRIMPmod only represents the aerobic part of internal load.
Activities such as jumps, sprints and resistance exercises during the training sessions refer to the
anaerobic system and these were not measured using TRIMPmod. Finally, cognitively
demanding tasks such as new tactical concepts within training can also increase RPE-values. 28
Since the explained variance for observed exertion was lower than for intended exertion, it
appears that coaches used other information to adjust their observed exertion, e.g. sweating,
breathing characteristics or face color.
Because observations of coaches predominantly focus on the relatively short period on
the pitch, it is important to realize that off-pitch factors can also explain the discrepancy. It is
assumed that the session RPE not only captures cardiovascular load, but also stress in personal
lives of players, for instance school exams or family problems. 16 Accounting for these issues
when planning training for a large squad is a difficult and complex task for coaches. Moreover,
coaches might be unaware of activities undertaken by players in the ±22 hours between training
Dow
nloa
ded
by R
ijksu
nive
rsite
it B
iblio
tec
on 0
5/08
/17,
Vol
ume
0, A
rtic
le N
umbe
r 0
“Understanding the Mismatch Between Coaches' and Players' Perceptions of Exertion”
by Brink MS, Kersten AW, Grencken WG
International Journal of Sports Physiology and Performance
© 2016 Human Kinetics, Inc.
sessions. A lack of recovery or additional physical activity at school could result in accumulated
fatigue and a higher perceived exertion even if the external load is similar. 29
A limitation of the study is that only two coaches participated. This is a common issue in
coach-related research given the unfavorable coach player ratio. This restricts generalizability to
other coaches. Indeed, differences between coaches exist and also occur in our study.
Nonetheless, previous studies all support the mismatch between coaches and players’ perceptions
of exertion. 1-10
Although application of monitoring systems in a practical setting often assumes a better
insight in individual training load, this is not necessarily true. Future research should study
potential changes in the discrepancy between coaches and players after an intervention with and
without feedback on training load. In addition, studies must focus on the cognitive aspects of
training load to better explain the mismatch. This is especially important because cognitive tasks
impair physical performance. 30
Practical applications
A consequence of a mismatch between intended and perceived exertion is that the
periodization strategy is not executed as initially planned. If coaches are unable to observe the
exertion of players, they cannot adjust their plan for the following training sessions
appropriately. For instance, if players train less hard than planned during an intensive
microcycle, performance of players will probably not improve. Providing coaches with feedback
about internal training load may calibrate their perception and give better insight in the actual
training load of individual players. Together, this may help them to improve and individualize
training programs. It should be noted that this is only true under the assumption that coaches'
training prescription is optimal and players are not able to self-regulate training intensity.
Dow
nloa
ded
by R
ijksu
nive
rsite
it B
iblio
tec
on 0
5/08
/17,
Vol
ume
0, A
rtic
le N
umbe
r 0
“Understanding the Mismatch Between Coaches' and Players' Perceptions of Exertion”
by Brink MS, Kersten AW, Grencken WG
International Journal of Sports Physiology and Performance
© 2016 Human Kinetics, Inc.
Conclusion
Altogether, our study confirms a mismatch between intended and perceived exertion, but
more importantly highlights that coaches were unable to accurately adjust the observed exertion
after training. Together, these differences could lead to maladaptation of the players to the
intended training program. When coaches rate the intended and observed exertion of the training
session they consider the external training characteristics and the intermittent endurance capacity
of the players. Since the explained variance for observed exertion was lower than for intended
exertion, it appears that coaches used other information to adjust their perception.
Acknowledgements
The authors would like to thank the coaches and players for their participation.
Dow
nloa
ded
by R
ijksu
nive
rsite
it B
iblio
tec
on 0
5/08
/17,
Vol
ume
0, A
rtic
le N
umbe
r 0
“Understanding the Mismatch Between Coaches' and Players' Perceptions of Exertion”
by Brink MS, Kersten AW, Grencken WG
International Journal of Sports Physiology and Performance
© 2016 Human Kinetics, Inc.
References
1. Stewart AM, Hopkins WG. Swimmers’ compliance with training prescription. Med Sci
Sport Excerc. 1997;29:1389–1392.
2. Imamura H, Yoshimura Y, Uchida K, Tanaka A, Nishimura S. Nakazawa, AT. Heart
rate, blood lactate responses and ratings of perceived exertion to 1,000 punches and 1,000
kicks in collegiate Karate practitioners. App Hum Sci. 1997;16:9-13.
3. Foster C, Heimann KM, Esten PL, Brice G, Porcari JP. Differences in perceptions of
training by coaches and athletes. S Afri J Sports Med. 2001;8:3-7.
4. Wallace LK, Slattery KM, Coutts AJ. The ecological validity and application of the
session RPE method for quantifying training loads in swimming. J Strength Cond Res.
2009;23:33–38.
5. Viveiros, L., Costa, E. C., Moreira, A., Nakamura, F. Y., Aoki, M. S. (2011).
Trainingload monitoring in judo: comparison between the training load intensity planned
by the coach and the intensity experienced by the athlete. Rev Bras Med Esporte. , 17,
266–269
6. Brink MS, Frencken WGP, Jordet G, Lemmink KAMP. Coaches’ and players’
perceptions of training dose: not a perfect match. Int J Sports Physiol Perform.
2014;9:497-502
7. Murphy AP, Duffield R, Kellett A, Reid M. Comparison of athlete-coach perceptions of
internal and external load markers for elite junior tennis training. Int J Sports Physiol
Perform. 2014;9:751-756.
8. Rodríguez-Marroyo JA, Medina J, García-López J, García- Tormo JV, Foster C.
Correspondence between training load executed by volleyball players and the one
observed by coaches. J Strength Cond Res. 2014;28:1588-1594
9. Barroso R, Cardoso RK, do Carmo EC, Tricoli V. Perceived exertion in coaches and
young swimmers with different training experience. Int J Sports Physiol Perform. 2014;
9:212-216
10. Rabelo FN., Pasquarelli BN, Gonçalves B, Matzenbacher F, Campos FA, Sampaio J,
Nakamura FY. Monitoring the intended and perceived training of a professional football
team over 45 weeks: a case study. J Strength Cond Res. 2016;30: 134-40.
11. Brink MS, Visscher C, Arends S, Zwerver J, Post WJ, Lemmink, KAPM. Monitoring
stress and recovery; new insights for the prevention of injuries and illnesses in elite youth
soccer players. Br J Sports Med. 2010;44:809-15.
12. Miloski B, Moreira A, Andrade FC, Freitas VH, Pecanha T, Nogueira RA, Bara M. Do
physical fitness measures influence internal training load responses in high-level futsal
players? J Sports Med Phys Fitness, 2014;54:588-594.
Dow
nloa
ded
by R
ijksu
nive
rsite
it B
iblio
tec
on 0
5/08
/17,
Vol
ume
0, A
rtic
le N
umbe
r 0
“Understanding the Mismatch Between Coaches' and Players' Perceptions of Exertion”
by Brink MS, Kersten AW, Grencken WG
International Journal of Sports Physiology and Performance
© 2016 Human Kinetics, Inc.
13. Malina, RM. Growth and maturity status of young soccer (football) players. In: T. Reilly
and M. Williams. Science and Soccer, 2nd ed. London, England: Routledge. 2003:287-
306.
14. Figueiredo AJ, Goncalves CE, Coelho-e-Silva MJ, Malina RM. Youth soccer players, 11-
14 years: Maturity, size, function, skill and goal orientation. Ann Hum Biol. 2009;36: 60-
73.
15. Gastin PB, Bennet G, Cook J. Biological maturity influences running performance in
junior Australian football. J Sci Med Sport. 2013;16:140-145.
16. Foster C, Florhaug JA, Franklin J, Gottschall L, Hrovatin LA, Parker S, Doleshal P,
Dodge C. A new approach to monitoring exercise training. J Strength Cond Res.
2001;15:109-15.
17. Impellizzeri FM, Rampinini E, Couts, AJ, Sassi A, Marcora SM. Use of RPE-based
training load in soccer. Med Sci Sport Excerc. 2004;36:1042-7.
18. Day ML, McGuigan MR, Brice G, Foster C. Monitoring exercise intensity during
resistance training using the session RPE scale. J Strength Cond Res. 2004;18:353-58.
19. Boyd LJ, Ball K, Aughey RJ. Quantifying external load in Australian football matches
and training using accelerometers. Int J Sports Physiol Perform. 2013;8:44-51.
20. Stagno KM, Thatcher R, van Someren KA. A modified TRIMP to quantify the in-season
training load of team sport players. J Sports Sci. 2007;25:629-634.
21. Lemmink KAPM, Visscher C, Lambert MI, Lamberts RP. The interval shuttle run test for
intermittent sport players: Evaluation of reliability. J Strength Cond Res. 2004;18:821-
827.
22. Lemmink KAMP, Visscher C. The relationship between the Interval Shuttle Run Test
and maximal oxygen uptake in soccer players. J Hum Mov Studi. 2003;45:219–232.
23. Mirwald R, Baxter-Jones ADG, Bailey DA, Beunen GP. An assessment of maturity from
anthropometric measurements. Med Sci Sport Excerc. 2002;34:689–694.
24. Ross WD, Marfell-Jones MJ, MacDougall JD, Wenger HA, Green HJ). Physiological
Testing of the High-Performance Athlete. Human Kinetics Books (pp.), Champaign,
Illinois. 1991: 223-308.
25. Dancey CP, Reidy J. Statistic Without Maths for Psychology: using SPSS for Windows.
Harlow, England: Pearson/Prentice Hall; 2004.
26. Buchheit M, Mendez-Villanueva A. Effects of age, maturity and body dimensions on
match running performance in highly trained under-15 soccer players. J Sports Sci.
2014;32:1271-1278.
Dow
nloa
ded
by R
ijksu
nive
rsite
it B
iblio
tec
on 0
5/08
/17,
Vol
ume
0, A
rtic
le N
umbe
r 0
“Understanding the Mismatch Between Coaches' and Players' Perceptions of Exertion”
by Brink MS, Kersten AW, Grencken WG
International Journal of Sports Physiology and Performance
© 2016 Human Kinetics, Inc.
27. Carvalho HM, Bidaurrazaga-Letona, I, Lekue JA, Amado M, Figueiredo AJ, Gil SM.
Physical Growth and Changes in Intermittent Endurance Run Performance in Young
Male Basque Soccer Players. Res Sports Med, 2014;22:408-424.
28. Marcora SM, Staiano W, Manning V. Mental fatigue impairs physical performance in
humans. J Appl Physiol. 2009;106:857-864.
29. Nédélec M, McCall A, Carling C, Legall F, Berthoin S, Dupont G. Recovery in soccer:
part ii-recovery strategies. Sports Med. 2013;43:9-22.
30. Smith MR, Coutts AJ, Merlini M, Deprez D, Lenoir M, Marcora SM. Mental Fatigue
Impairs Soccer-Specific Physical and Technical Performance Med Sci Sport Excerc.
2016;48:267-76.
Dow
nloa
ded
by R
ijksu
nive
rsite
it B
iblio
tec
on 0
5/08
/17,
Vol
ume
0, A
rtic
le N
umbe
r 0
“Understanding the Mismatch Between Coaches' and Players' Perceptions of Exertion”
by Brink MS, Kersten AW, Grencken WG
International Journal of Sports Physiology and Performance
© 2016 Human Kinetics, Inc.
Figure 1. Overview of study design (two mesocycles of four weeks). ISRT: Interval Shuttle Run
Test; APHV: Age of Peak Hight Velocity; TRIMPmod: Training IMPulse modified; Rate of
Intended Exertion (RIE), Rate of Observed Exertion (ROE) and Rate of Perceived Exertion
(RPE).
Dow
nloa
ded
by R
ijksu
nive
rsite
it B
iblio
tec
on 0
5/08
/17,
Vol
ume
0, A
rtic
le N
umbe
r 0
“Understanding the Mismatch Between Coaches' and Players' Perceptions of Exertion”
by Brink MS, Kersten AW, Grencken WG
International Journal of Sports Physiology and Performance
© 2016 Human Kinetics, Inc.
Figure 2. Relationships of Rate of Intended Exertion (RIE), Rate of Observed Exertion and Rate
of Perceived (RPE) (N = 977).
Dow
nloa
ded
by R
ijksu
nive
rsite
it B
iblio
tec
on 0
5/08
/17,
Vol
ume
0, A
rtic
le N
umbe
r 0
“Understanding the Mismatch Between Coaches' and Players' Perceptions of Exertion”
by Brink MS, Kersten AW, Grencken WG
International Journal of Sports Physiology and Performance
© 2016 Human Kinetics, Inc.
Figure 3. Bland Altman plots of Rate of Intended Exertion (RIE), Rate of Observed Exertion
and Rate of Perceived Exertion (RPE) (N = 977).
Dow
nloa
ded
by R
ijksu
nive
rsite
it B
iblio
tec
on 0
5/08
/17,
Vol
ume
0, A
rtic
le N
umbe
r 0
“Understanding the Mismatch Between Coaches' and Players' Perceptions of Exertion”
by Brink MS, Kersten AW, Grencken WG
International Journal of Sports Physiology and Performance
© 2016 Human Kinetics, Inc.
Table 1. Descriptive statistics of the Rate of Intended (RIE), Rate of Observed Exertion (ROE)
and Rate of Perceived Exertion (RPE) and explanatory variables (N=31).
Mean ± std
RIE 13,3* ± 2,1
ROE 13,3* ± 2,2
RPE 13,6 ± 2,2
PlayerLoad (au) 158,1 ± 36,1
TRIMPmod (au) 113,4 ± 43,1
ISRT (runs) 102,9 ± 10,3
APHV (years) 13,8 ± 0,7
* Significantly different from RPE (p<0.01).
TRIMPmod: TRaining IMPulse modified; ISRT: Interval Shuttle Run Test; APHV: Age of Peak Hight
Velocity.
Table 2. Final multilevel models for Rate of Intended Exertion (RIE) and Rate of Observed
Exertion (ROE).
RIE (R2=0.32)
Fixed effects Coefficient Standard error Pa
Intercept 14.022 0.938 <0.001**
PlayerLoad 0.005 0.002 0.012*
ISRT -0.015 0.008 0.060
Random effects Variance Standard error
Level 3 variance 0.397 0.408
Level 2 variance 0.000 0.000
Level 1 variance 0.328 0.045
Deviance 192.811
Deviance empty model 278.393
ROE (R2=0.20)
Fixed effects
Intercept Coefficient Standard error Pa
10.081 1.501 <0.001**
PlayerLoad 0.013 0.003 <0.001**
ISRT 0.011 0.013 0.198
Random effects Variance Standard error
Level 3 variance 0.569 0.587
Level 2 variance 0.000 0.000
Level 1 variance 0.954 0.132
Deviance 305.563
Deviance empty model 426.877
Dow
nloa
ded
by R
ijksu
nive
rsite
it B
iblio
tec
on 0
5/08
/17,
Vol
ume
0, A
rtic
le N
umbe
r 0


![The [Mis] Perceptions of Graduate Student Research Skills ......MENTOR PERCEPTIONS AND STUDENT RESEARCH SKILLS 1 Abstract The mismatch between the academic preparation and realistic](https://img.pdfslide.net/doc/110x75/5e5fb64dbced5e760a5780d8/the-mis-perceptions-of-graduate-student-research-skills-mentor-perceptions.jpg)