Embed Size (px)
Citation preview

Understanding the Role of Sender Reputation inAbuse Reporting and Cleanup
Orcun Cetin∗, Mohammad Hanif Jhaveri†, Carlos Ganan∗, Michel van Eeten∗, Tyler Moore†∗Delft University of Technology, Faculty of Technology, Policy and Management
{f.o.cetin, c.h.g.hernandezganan, m.j.g.vaneeten}@tudelft.nl†Southern Methodist University, Computer Science and Engineering Department
{[email protected], [email protected]}
Abstract—Participants on the front lines of abuse reportinghave a variety of options to notify intermediaries and resourceowners about abuse of their systems and services. These caninclude emails to personal messages to blacklists to machine-generated feeds. Recipients of these reports have to voluntarilyact on this information. We know remarkably little about thefactors that drive higher response rates to abuse reports. Onesuch factor is the reputation of the sender. In this paper,we present the first randomized controlled experiment intosender reputation. We used a private datafeed of Asprox-infectedwebsites to issue notifications from three senders with differentreputations: an individual, a university and an established anti-malware organization. We find that our detailed abuse reportssignificantly increase cleanup rates. Surprisingly, we find noevidence that sender reputation improves cleanup. We do seethat the evasiveness of the attacker in hiding compromise cansubstantially hamper cleanup efforts. Furthermore, we find thatthe minority of hosting providers who viewed our cleanup advicewebpage were much more likely to remediate infections thanthose who did not, but that website owners who viewed the advicefared no better.
I. INTRODUCTION
Advances in detecting and predicting malicious activityon the Internet, impressive as they are, tend to obscurea humbling question: Who is actually acting against theseabusive resources? The reality is that the bulk of the fightagainst criminal activity depends critically on the voluntaryactions of many thousands of providers and resource ownerswho receive abuse reports. These reports relay that a resourceunder their control – be it a machine, account, or service –has been observed in malicious activity. Each day, millionsof abuse reports are sent out across the Internet via a varietyof mechanisms, from personal messages to emails to publictrackers to queryable blacklists with thousands of hacked sitesor millions of spambots.
Proactive participants may pull data from clearinghousessuch as Spamhaus and Shadowserver. But in many cases, thereports are pushed to recipients based upon publicly availableabuse contact information. In these circumstances, those whocan act against the abusive resource might never actuallysee the information. If the information does reach them, itmight be ignored, misunderstood or assigned low priority. Still,against all these odds, many reports are acted upon, withoutany formal requirement, across different jurisdictions andoften without a pre-established relationship between sender
and recipient. This voluntary action is an under-appreciatedcomponent of the fight against cybercrime.
Remarkably little research has been undertaken into whatfactors drive the chances of a recipient acting upon an abusereport (notable exceptions are [1]–[4]). One factor, the reputa-tion of the sender, clearly plays an important role in practice.Not all reports are treated equal, as can be seen from the factthat some recipients assign a trusted status to some senders(’trusted complainer’), sometimes tied to a specific API forreceiving the report and even semi-automatically acting uponit.
The underlying issue is a signaling problem, and therefore,an economic one. There is no central authority that clearswhich notifications are valid and merit the attention of theintermediary or resource owner. This problem is exacerbatedby the fact that many intermediaries receive thousands ofreports each day. One way to triage this influx of requestsfor action is to judge the reputation of the sender.
We present the first randomized controlled experiment tomeasure the effect of sender reputation on cleanup rates andspeed. During two campaigns over December 2014–Februrary2015, we sent out a total of 480 abuse reports to hostingproviders and website owners from three senders with varyingreputation signals. We compared their cleanup rates to eachother and to a control group compromised with the samemalware.
In the next section, we outline the experimental design. InSection III, we turn to the process of data collection, mostnotably tracking the cleanup of the compromised resourcesthat were being reported on. The results of the experimentare discussed in Section IV. Surprisingly, we find no evidencethat sender reputation improves cleanup. We find that the eva-siveness of the attacker in hiding compromise can substantiallyhamper cleanup efforts. Furthermore, we find that the minorityof hosting providers who viewed our cleanup advice weremuch more likely to remediate infections than those who didnot, but that website owners who viewed the advice fared nobetter. We compare our findings to related work in the area inSection V. We describe limitations in Section VI and concludein Section VII.
II. EXPERIMENTAL DESIGN
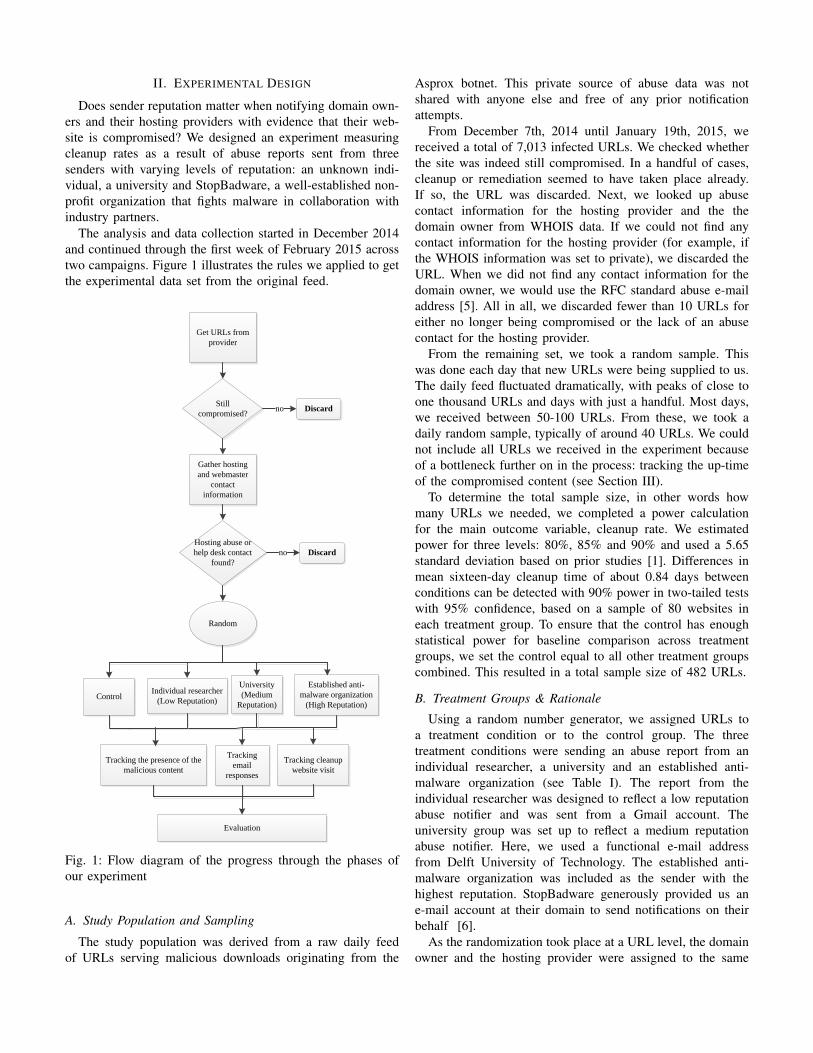
Does sender reputation matter when notifying domain own-ers and their hosting providers with evidence that their web-site is compromised? We designed an experiment measuringcleanup rates as a result of abuse reports sent from threesenders with varying levels of reputation: an unknown indi-vidual, a university and StopBadware, a well-established non-profit organization that fights malware in collaboration withindustry partners.
The analysis and data collection started in December 2014and continued through the first week of February 2015 acrosstwo campaigns. Figure 1 illustrates the rules we applied to getthe experimental data set from the original feed.
Get URLs from provider
Still compromised?
Discardno
Gather hosting and webmaster
contact information
Hosting abuse or help desk contact
found? Discardno
Random
Established anti-malware organization
(High Reputation)
Individual researcher(Low Reputation)
University (Medium
Reputation)Control
Tracking the presence of the malicious content
Tracking email
responses
Tracking cleanup website visit
Evaluation
Fig. 1: Flow diagram of the progress through the phases ofour experiment
A. Study Population and Sampling
The study population was derived from a raw daily feedof URLs serving malicious downloads originating from the
Asprox botnet. This private source of abuse data was notshared with anyone else and free of any prior notificationattempts.
From December 7th, 2014 until January 19th, 2015, wereceived a total of 7,013 infected URLs. We checked whetherthe site was indeed still compromised. In a handful of cases,cleanup or remediation seemed to have taken place already.If so, the URL was discarded. Next, we looked up abusecontact information for the hosting provider and the thedomain owner from WHOIS data. If we could not find anycontact information for the hosting provider (for example, ifthe WHOIS information was set to private), we discarded theURL. When we did not find any contact information for thedomain owner, we would use the RFC standard abuse e-mailaddress [5]. All in all, we discarded fewer than 10 URLs foreither no longer being compromised or the lack of an abusecontact for the hosting provider.
From the remaining set, we took a random sample. Thiswas done each day that new URLs were being supplied to us.The daily feed fluctuated dramatically, with peaks of close toone thousand URLs and days with just a handful. Most days,we received between 50-100 URLs. From these, we took adaily random sample, typically of around 40 URLs. We couldnot include all URLs we received in the experiment becauseof a bottleneck further on in the process: tracking the up-timeof the compromised content (see Section III).
To determine the total sample size, in other words howmany URLs we needed, we completed a power calculationfor the main outcome variable, cleanup rate. We estimatedpower for three levels: 80%, 85% and 90% and used a 5.65standard deviation based on prior studies [1]. Differences inmean sixteen-day cleanup time of about 0.84 days betweenconditions can be detected with 90% power in two-tailed testswith 95% confidence, based on a sample of 80 websites ineach treatment group. To ensure that the control has enoughstatistical power for baseline comparison across treatmentgroups, we set the control equal to all other treatment groupscombined. This resulted in a total sample size of 482 URLs.
B. Treatment Groups & Rationale
Using a random number generator, we assigned URLs toa treatment condition or to the control group. The threetreatment conditions were sending an abuse report from anindividual researcher, a university and an established anti-malware organization (see Table I). The report from theindividual researcher was designed to reflect a low reputationabuse notifier and was sent from a Gmail account. Theuniversity group was set up to reflect a medium reputationabuse notifier. Here, we used a functional e-mail addressfrom Delft University of Technology. The established anti-malware organization was included as the sender with thehighest reputation. StopBadware generously provided us ane-mail account at their domain to send notifications on theirbehalf [6].
As the randomization took place at a URL level, the domainowner and the hosting provider were assigned to the same
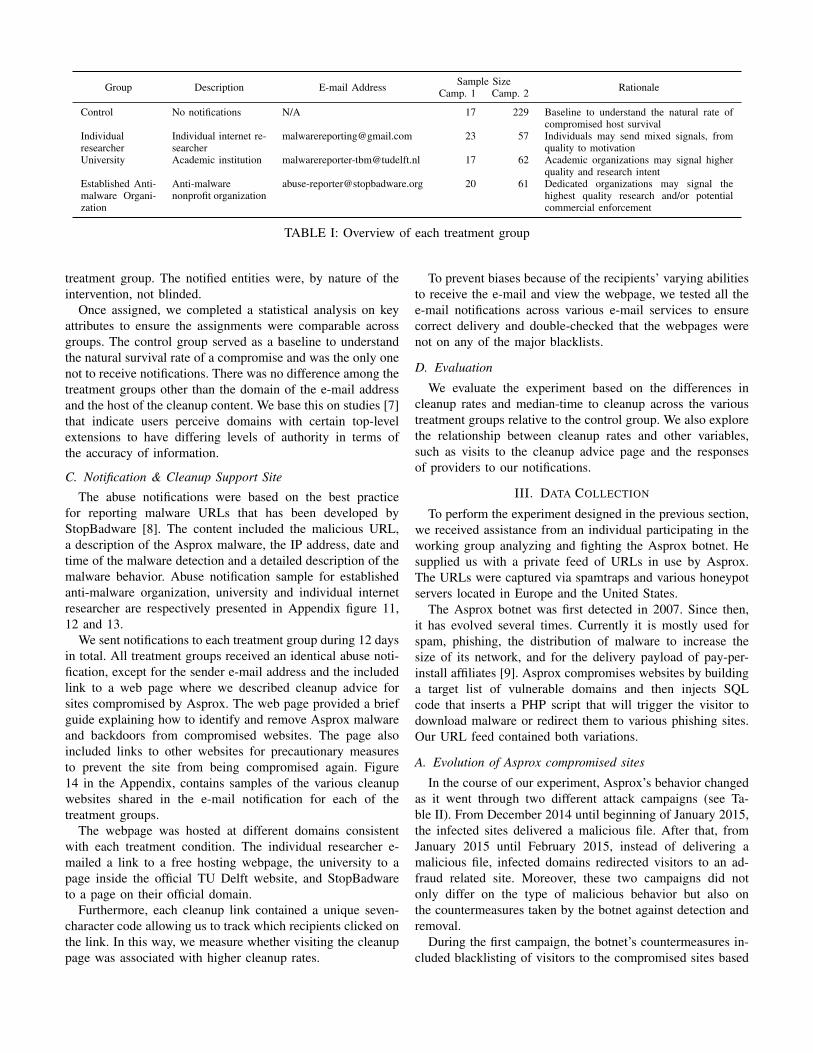
Group Description E-mail Address Sample Size RationaleCamp. 1 Camp. 2
Control No notifications N/A 17 229 Baseline to understand the natural rate ofcompromised host survival
Individualresearcher
Individual internet re-searcher
[email protected] 23 57 Individuals may send mixed signals, fromquality to motivation
University Academic institution [email protected] 17 62 Academic organizations may signal higherquality and research intent
Established Anti-malware Organi-zation
Anti-malwarenonprofit organization
[email protected] 20 61 Dedicated organizations may signal thehighest quality research and/or potentialcommercial enforcement
TABLE I: Overview of each treatment group
treatment group. The notified entities were, by nature of theintervention, not blinded.
Once assigned, we completed a statistical analysis on keyattributes to ensure the assignments were comparable acrossgroups. The control group served as a baseline to understandthe natural survival rate of a compromise and was the only onenot to receive notifications. There was no difference among thetreatment groups other than the domain of the e-mail addressand the host of the cleanup content. We base this on studies [7]that indicate users perceive domains with certain top-levelextensions to have differing levels of authority in terms ofthe accuracy of information.
C. Notification & Cleanup Support Site
The abuse notifications were based on the best practicefor reporting malware URLs that has been developed byStopBadware [8]. The content included the malicious URL,a description of the Asprox malware, the IP address, date andtime of the malware detection and a detailed description of themalware behavior. Abuse notification sample for establishedanti-malware organization, university and individual internetresearcher are respectively presented in Appendix figure 11,12 and 13.
We sent notifications to each treatment group during 12 daysin total. All treatment groups received an identical abuse noti-fication, except for the sender e-mail address and the includedlink to a web page where we described cleanup advice forsites compromised by Asprox. The web page provided a briefguide explaining how to identify and remove Asprox malwareand backdoors from compromised websites. The page alsoincluded links to other websites for precautionary measuresto prevent the site from being compromised again. Figure14 in the Appendix, contains samples of the various cleanupwebsites shared in the e-mail notification for each of thetreatment groups.
The webpage was hosted at different domains consistentwith each treatment condition. The individual researcher e-mailed a link to a free hosting webpage, the university to apage inside the official TU Delft website, and StopBadwareto a page on their official domain.
Furthermore, each cleanup link contained a unique seven-character code allowing us to track which recipients clicked onthe link. In this way, we measure whether visiting the cleanuppage was associated with higher cleanup rates.
To prevent biases because of the recipients’ varying abilitiesto receive the e-mail and view the webpage, we tested all thee-mail notifications across various e-mail services to ensurecorrect delivery and double-checked that the webpages werenot on any of the major blacklists.
D. Evaluation
We evaluate the experiment based on the differences incleanup rates and median-time to cleanup across the varioustreatment groups relative to the control group. We also explorethe relationship between cleanup rates and other variables,such as visits to the cleanup advice page and the responsesof providers to our notifications.
III. DATA COLLECTION
To perform the experiment designed in the previous section,we received assistance from an individual participating in theworking group analyzing and fighting the Asprox botnet. Hesupplied us with a private feed of URLs in use by Asprox.The URLs were captured via spamtraps and various honeypotservers located in Europe and the United States.
The Asprox botnet was first detected in 2007. Since then,it has evolved several times. Currently it is mostly used forspam, phishing, the distribution of malware to increase thesize of its network, and for the delivery payload of pay-per-install affiliates [9]. Asprox compromises websites by buildinga target list of vulnerable domains and then injects SQLcode that inserts a PHP script that will trigger the visitor todownload malware or redirect them to various phishing sites.Our URL feed contained both variations.
A. Evolution of Asprox compromised sites
In the course of our experiment, Asprox’s behavior changedas it went through two different attack campaigns (see Ta-ble II). From December 2014 until beginning of January 2015,the infected sites delivered a malicious file. After that, fromJanuary 2015 until February 2015, instead of delivering amalicious file, infected domains redirected visitors to an ad-fraud related site. Moreover, these two campaigns did notonly differ on the type of malicious behavior but also onthe countermeasures taken by the botnet against detection andremoval.
During the first campaign, the botnet’s countermeasures in-cluded blacklisting of visitors to the compromised sites based
Campaigns Start Date End Date Type Character
Campaign 1 12/08/2014 12/26/2014 Malware * Customized and standard error messages* IP and identifier based blacklisting
Campaign 2 01/12/2015 02/04/2015 Ad-fraud * Standard error message
TABLE II: Overview of each campaign
on IP addresses and machine fingerprinting. The blacklistwas managed by back-end command-and-control systems andshared among the compromised sites.
Once an IP address was blacklisted, the compromised sitesstopped serving the malicious ZIP file to that particular IPand displayed an error message instead. We encountered twodifferent types of error messages: (i) HTTP standard errormessages such as 404 Not Found, and (ii) customized errormessages such as “You have exceeded the maximum num-ber of downloads”. In addition, sites only accepted requestscoming from Internet Explorer 7 and versions above.
In contrast to the first campaign, the second campaigndid not apply any type of blacklisting. Instead the maincountermeasure consisted of displaying an error message whentrying to access the malicious PHP file alone. Moreover, thepath to reach the malicious content would change periodically.
In most cases, the malicious content was only accessiblethrough the URLs included in the phishing e-mails. TheseURLs included a request code that allowed infected sites toserve malware binaries and phishing pages that belonged toa specific Asprox attack. Once that specific attack ended, thecompromised sites stopped responding to the correspondingURLs and displayed an error message instead. Table III showsa list of request codes and the corresponding attributes for bothmalware and phishing URLs. For instance, “?pizza=” codewas only used for triggering PizzaHut Coupon.exe Asproxmalware binary.
B. Tracking presence of malicious content
Given the evolution and countermeasures of the Asproxbotnet, the experiment required a complex methodology totrack the notified entities acted upon our abuse report andcleaned up the compromised site. In the following, we describethe notification process and the methodology to track Asproxinfected websites.
To identify and monitor malicious content for the firstcampaign, we first required a mechanism to bypass the botnet’sblacklisting of visitors based on IP-addresses and fingerprint-ing. The compromised sites used error messages to make itharder to distinguish malicious links from broken or deadlinks. We developed an automated tool that used IP addressesfrom 2 private and 7 public HTTP proxy services and checkedwhether the IP address that the tracking tool received had notbeen used before. Each day, 3 different proxy services wereselected. All new IP addresses were checked against a list ofpreviously used IP addresses. If it has been previously used,we discarded it. If not, we added it to the list. The IP addresseswere selected following a round-robin algorithm from the poolof proxy services.
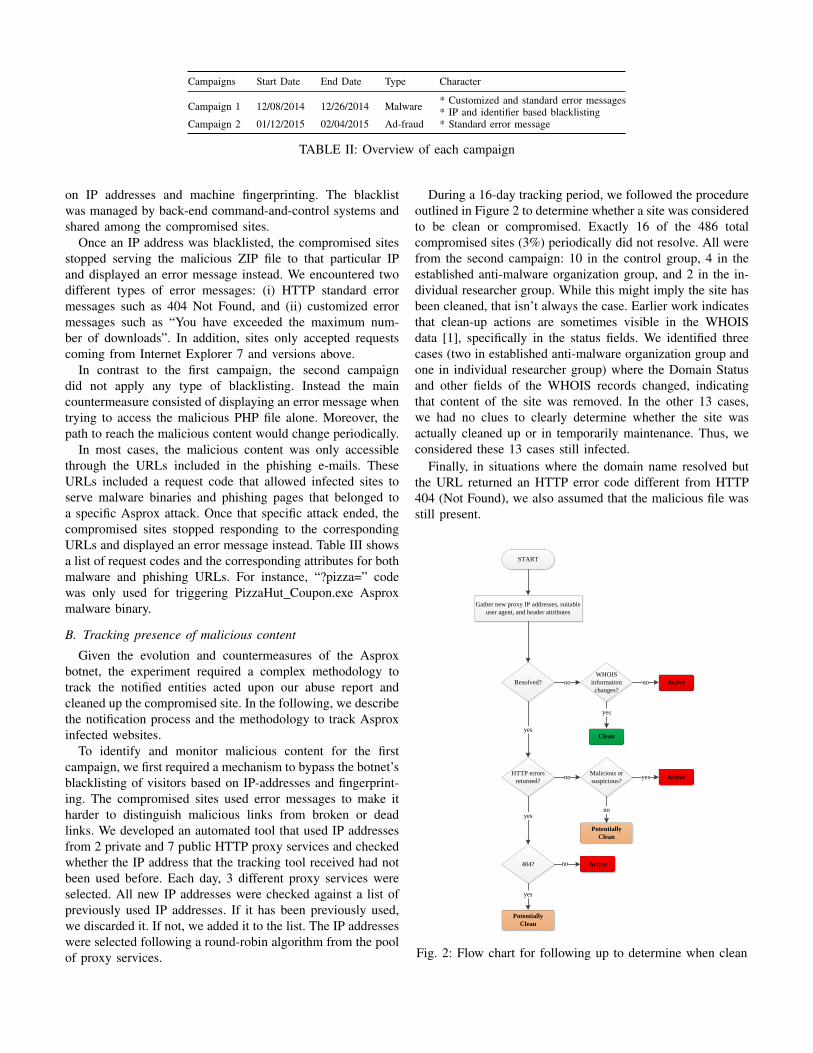
During a 16-day tracking period, we followed the procedureoutlined in Figure 2 to determine whether a site was consideredto be clean or compromised. Exactly 16 of the 486 totalcompromised sites (3%) periodically did not resolve. All werefrom the second campaign: 10 in the control group, 4 in theestablished anti-malware organization group, and 2 in the in-dividual researcher group. While this might imply the site hasbeen cleaned, that isn’t always the case. Earlier work indicatesthat clean-up actions are sometimes visible in the WHOISdata [1], specifically in the status fields. We identified threecases (two in established anti-malware organization group andone in individual researcher group) where the Domain Statusand other fields of the WHOIS records changed, indicatingthat content of the site was removed. In the other 13 cases,we had no clues to clearly determine whether the site wasactually cleaned up or in temporarily maintenance. Thus, weconsidered these 13 cases still infected.
Finally, in situations where the domain name resolved butthe URL returned an HTTP error code different from HTTP404 (Not Found), we also assumed that the malicious file wasstill present.
START
Gather new proxy IP addresses, suitable user agent, and header attributes
Resolved?WHOIS
information changes?
no
HTTP errors returned?
yes
404?
yes
yes
no
Malicious or suspicious?
no yes
no
yes
no Active
Clean
Active
Active
Potentially Clean
Potentially Clean
Fig. 2: Flow chart for following up to determine when clean
Malware Campaign
Request Code Targeted Companies Sample Name of Executable
?c= Costco ?c=r24t/fwI8nYJeoktSMii3IkC8ItN3Dqcpphcm375Sg4 Costco OrderID.exe
?fb= Facebook ?fb=i2uXy5/kOZ77bjvMAA0hgsai4YbZNvC78Ji7amd1D8Y FB-Password-Reset Form.exe
?w= Walgreens ?w=uhUGpftxxueBCfO/6FxAx7p2/Guz9BjRwRj/1YVMcKI Walgreens OrderID.exe
?pizza= Pizza Hut ?pizza=Wa5wEaLOSojFl3kTaW3OIgOW150DCm7Jda8m83pzVJo PizzaHut Coupon.exe
Ad Fraud and Phishing Campaign
Request Code Type of Scam Sample
?po= Ad-Fraud ?po=rIdsS+cFDm7bNp4duz57G0IWqGTH15cqcKUdvtSGBME?r= Dating Website Scam ?r=2
TABLE III: Examples request codes and what they represent.
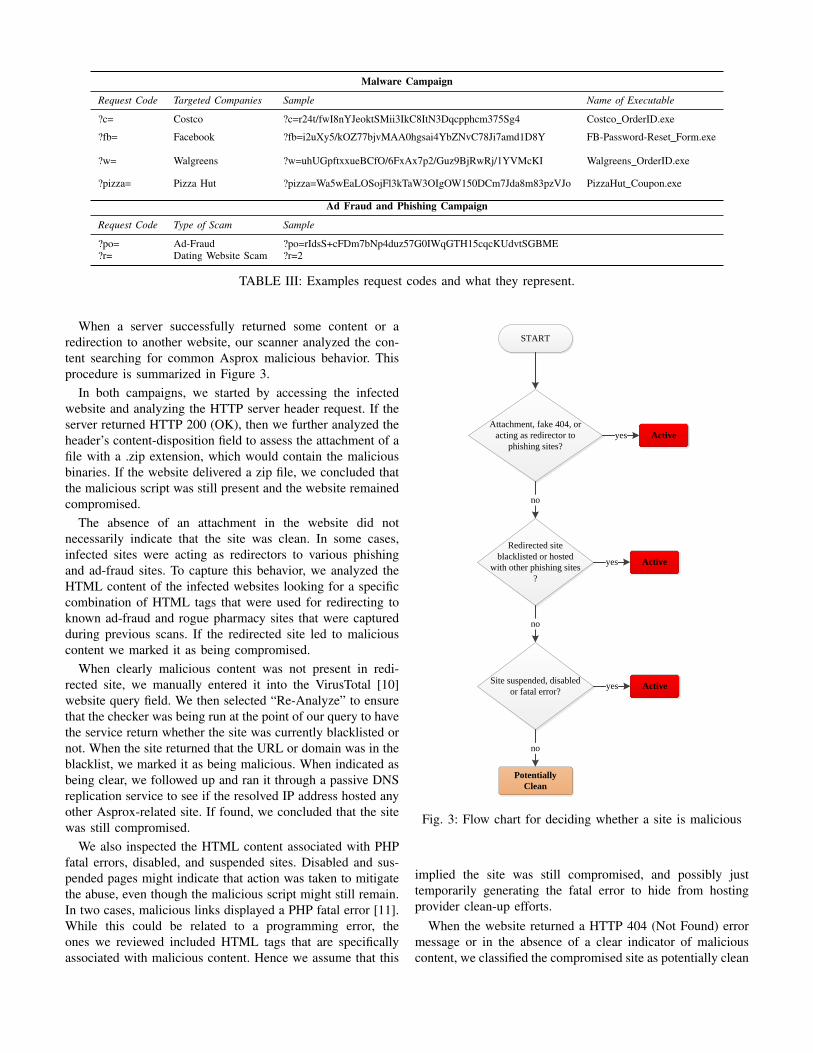
When a server successfully returned some content or aredirection to another website, our scanner analyzed the con-tent searching for common Asprox malicious behavior. Thisprocedure is summarized in Figure 3.
In both campaigns, we started by accessing the infectedwebsite and analyzing the HTTP server header request. If theserver returned HTTP 200 (OK), then we further analyzed theheader’s content-disposition field to assess the attachment of afile with a .zip extension, which would contain the maliciousbinaries. If the website delivered a zip file, we concluded thatthe malicious script was still present and the website remainedcompromised.
The absence of an attachment in the website did notnecessarily indicate that the site was clean. In some cases,infected sites were acting as redirectors to various phishingand ad-fraud sites. To capture this behavior, we analyzed theHTML content of the infected websites looking for a specificcombination of HTML tags that were used for redirecting toknown ad-fraud and rogue pharmacy sites that were capturedduring previous scans. If the redirected site led to maliciouscontent we marked it as being compromised.
When clearly malicious content was not present in redi-rected site, we manually entered it into the VirusTotal [10]website query field. We then selected “Re-Analyze” to ensurethat the checker was being run at the point of our query to havethe service return whether the site was currently blacklisted ornot. When the site returned that the URL or domain was in theblacklist, we marked it as being malicious. When indicated asbeing clear, we followed up and ran it through a passive DNSreplication service to see if the resolved IP address hosted anyother Asprox-related site. If found, we concluded that the sitewas still compromised.
We also inspected the HTML content associated with PHPfatal errors, disabled, and suspended sites. Disabled and sus-pended pages might indicate that action was taken to mitigatethe abuse, even though the malicious script might still remain.In two cases, malicious links displayed a PHP fatal error [11].While this could be related to a programming error, theones we reviewed included HTML tags that are specificallyassociated with malicious content. Hence we assume that this
START
Site suspended, disabled or fatal error?
ActiveAttachment, fake 404, or
acting as redirector to phishing sites?
Active
Redirected site blacklisted or hosted
with other phishing sites ?
Active
yes
yes
Potentially Clean
no
no
yes
no
Fig. 3: Flow chart for deciding whether a site is malicious
implied the site was still compromised, and possibly justtemporarily generating the fatal error to hide from hostingprovider clean-up efforts.
When the website returned a HTTP 404 (Not Found) errormessage or in the absence of a clear indicator of maliciouscontent, we classified the compromised site as potentially clean

since the botnet infrastructure had modules to prevent securitybots from reaching the malicious content. To gather more in-formation about these potentially clean websites, we scan thosesites 2 more times on the same day. If during these 2 additionalscans no indicators of malicious or suspicious behavior werefound, follow-ups scans were performed during the next 2 dayswith 3 unique requests. If there was no malicious or suspiciousbehavior during 3 consecutive days, then we considered thesite to be potentially clean and manually investigated the URLsusing online server header checker websites (e.g. [12]) and byvisiting it manually using a ’clean’ set of IP addresses thatwere acquired via a premium VPN subscription. These manualfollow-ups were made to ensure reliable measurements on thepresence of malicious content. The evolution of Asprox madeit impossible to fully rely on automation. In the end, we onlyconsidered a site clean if it was never subsequently observedto be malicious in manual and automated scans.
During the second campaign, the botnet infrastructure wasno longer using blacklisting based on IP addresses or finger-printing. Therefore, we only used IP addresses from a singleHTTP proxy service to track the presence of malicious content.As a preventive measure, our scanner used a mechanism whereIP addresses were changed twice a day and different browsersuits were used to visit the site. Only one followup was madefor each day of tracking due to lack of blacklisting. Anotherdifference with the first campaign was that scans for the lastday of tracking was automated. We only considered a siteclean if, and only if, there was no malicious content relatedto Asprox botnet in both followups and last day scans.
Throughout the tracking process of the second campaign,compromised sites stopped redirecting to ad-fraud sites andpaths to ad-fraud campaign were displaying standard errormessages. This indicated that Asprox ad-fraud campaign wasover. New links were generated by the botmasters for redirect-ing to the new scams sites such as fake dating or diet websites.Thus, the same infected websites that were used during thesecond campaign to redirect to ad-fraud related websites werenow being used to redirect to other type of scams.
C. Tracking affected party responses
As part of the experiment, we also regularly checkedthe inbox of the different e-mail accounts created for thisstudy. We received automated and manual responses fromthe affected parties. Automated responses came from hostingproviders to acknowledge the reception of our notification.Most of the automated responses contained a ticket number,to be included in further communication about the infection.Some providers also included details of the ticket along witha URL for tracking the incident status.
Manual responses came from domain owners and abuse-desk employees to inform us about the cleanup action takenor requesting more evidence about the compromise. When wereceived a manual response stating that appropriate action wastaken, we re-scan the website to confirm this action. If theresults of the scan found that the infection was still present,we responded to the corresponding entity stating the existence
of the malicious PHP script. In these responses, a HTTP headerrequest from the malicious URL was included to serve asevidence showing the existence of the malicious file. Whenmore evidence of the compromised was requested, a briefexplanation of the compromise and a specific solution wasgiven.
We also analyzed the logs of our web pages with cleanupadvice. Via the unique codes included in the URLs, weidentified which hosting provider or site owner visited oneof our cleanup websites. Unfortunately, we discovered inthe course of the experiment that the server logs for theStopBadware page could not be analyzed, as the webserverrelied on Cloudflare’s CDN service to serve the static content,thus leaving no log of the visit [13].
IV. RESULTS
From December 7th, 2014 until January 19th, 2015, atotal of 7,013 infected URLs were identified. From these weexcluded less than 10 URLs that were not active or for whichwe were not able to obtain reliable contact information forthe hosting provider. The daily feed fluctuated dramatically,with peaks of close to one thousand URLs and days with justa handful. Most days, we received between 50-100 URLs.From these, we took a daily random sample, typically around40. Over time, this accumulated to a random sample of 486URLs.
In the following we empirically estimate the survival prob-abilities using the Kaplan-Meier method. Survival functionsmeasure the fraction of URLs that remain infected after aperiod of time. Because some websites remain infected at theend of the study, we cannot directly measure this probabilitybut must estimate it instead. Differences between treatmentgroups were evaluated using the log-rank test. Additionally,a Cox proportional regression model was used to obtain thehazard ratios (HR). All two-sided p values less than 0.05 wereconsidered significant.
A. Measuring the impact of notices
First, we determined whether sending notices to hostingproviders and domain owners had an impact on the cleanup ofthe infected URLs. Table IV provides some summary statisticsregarding the status of the infected URLs 16 days after thenotification. Entries are given for each treatment group. Wereported the percentage of websites that were clean and themedian number of days required to clean up those sites.
It is worth noting the significant difference between the twomalware campaigns that took placed during our experiment.From table IV, we can see that while 35% of the websitesin the control group were clean after 16 days during the firstcampaign, only 26% of the websites in the control groupsduring the second campaign remediated their infection. Thesame trend was observed for the rest of the treatment groups,i.e., lower cleanup rates were achieved during the secondcampaign than during the first campaign. For instance, thepercentage of remediated infections for the high-reputationgroup was reduced from 81% in the first campaign to 49%
Treatment typeCampaign 1 Campaign 2
# % clean Median clean up time # % clean Median clean up time
Control 17 35.29% 14 days 229 26.20% 8 daysIndiv. researcher 23 69.57% 4 days 57 49.12% 2.5 days
University 17 64.71% 4 days 61 44.26% 3 daysAnti-malware Org. 20 80.95% 2 days 62 48.39% 1.5 days
TABLE IV: Summary statistics on the time to clean up, according to the treatment group
Time(days)
Su
rviv
al P
rob
ab
ility
0 2 4 6 8 10 12 14 16 18 20
0.0
0.4
0.8
Campaign 1Campaign 2
Hazard Ratio = 2.11 Log-rank p = 3.75e-06
1
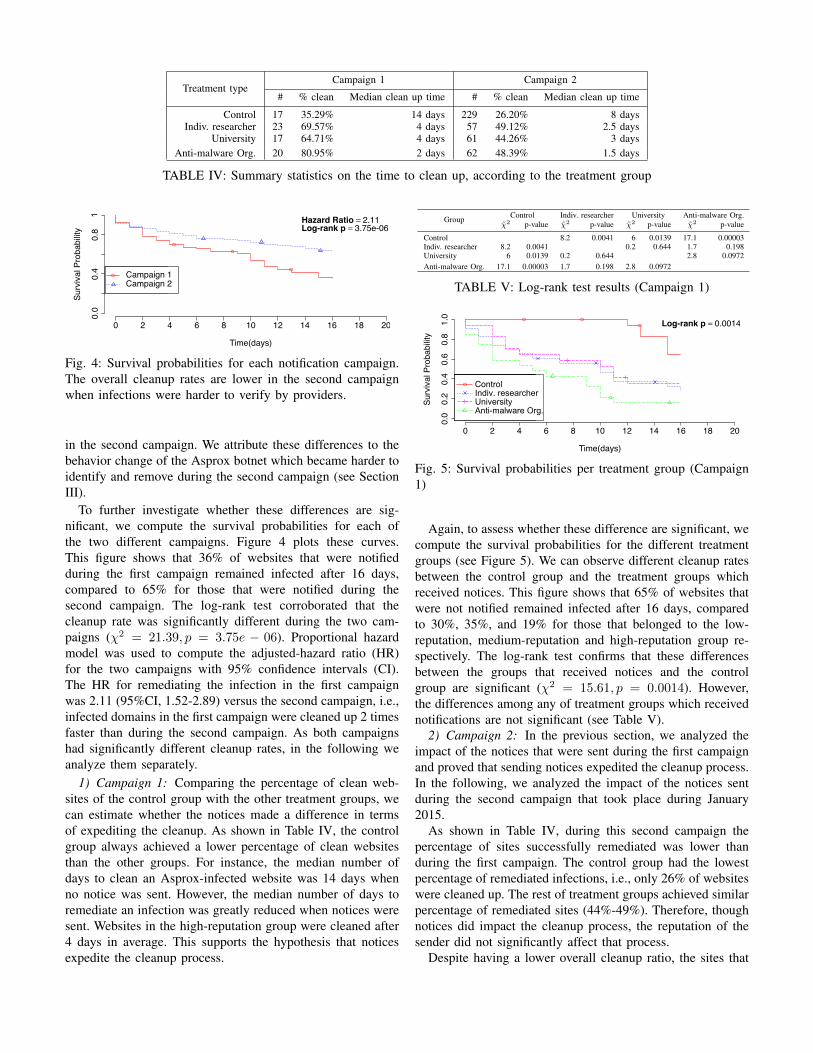
Fig. 4: Survival probabilities for each notification campaign.The overall cleanup rates are lower in the second campaignwhen infections were harder to verify by providers.
in the second campaign. We attribute these differences to thebehavior change of the Asprox botnet which became harder toidentify and remove during the second campaign (see SectionIII).
To further investigate whether these differences are sig-nificant, we compute the survival probabilities for each ofthe two different campaigns. Figure 4 plots these curves.This figure shows that 36% of websites that were notifiedduring the first campaign remained infected after 16 days,compared to 65% for those that were notified during thesecond campaign. The log-rank test corroborated that thecleanup rate was significantly different during the two cam-paigns (χ2 = 21.39, p = 3.75e − 06). Proportional hazardmodel was used to compute the adjusted-hazard ratio (HR)for the two campaigns with 95% confidence intervals (CI).The HR for remediating the infection in the first campaignwas 2.11 (95%CI, 1.52-2.89) versus the second campaign, i.e.,infected domains in the first campaign were cleaned up 2 timesfaster than during the second campaign. As both campaignshad significantly different cleanup rates, in the following weanalyze them separately.
1) Campaign 1: Comparing the percentage of clean web-sites of the control group with the other treatment groups, wecan estimate whether the notices made a difference in termsof expediting the cleanup. As shown in Table IV, the controlgroup always achieved a lower percentage of clean websitesthan the other groups. For instance, the median number ofdays to clean an Asprox-infected website was 14 days whenno notice was sent. However, the median number of days toremediate an infection was greatly reduced when notices weresent. Websites in the high-reputation group were cleaned after4 days in average. This supports the hypothesis that noticesexpedite the cleanup process.
Group Control Indiv. researcher University Anti-malware Org.χ2 p-value χ2 p-value χ2 p-value χ2 p-value
Control 8.2 0.0041 6 0.0139 17.1 0.00003Indiv. researcher 8.2 0.0041 0.2 0.644 1.7 0.198University 6 0.0139 0.2 0.644 2.8 0.0972Anti-malware Org. 17.1 0.00003 1.7 0.198 2.8 0.0972
TABLE V: Log-rank test results (Campaign 1)
Time(days)
Su
rviv
al P
rob
ab
ility
0 2 4 6 8 10 12 14 16 18 20
0.0
0.2
0.4
0.6
0.8
1.0
ControlIndiv. researcherUniversityAnti-malware Org.
Log-rank p = 0.0014
Fig. 5: Survival probabilities per treatment group (Campaign1)
Again, to assess whether these difference are significant, wecompute the survival probabilities for the different treatmentgroups (see Figure 5). We can observe different cleanup ratesbetween the control group and the treatment groups whichreceived notices. This figure shows that 65% of websites thatwere not notified remained infected after 16 days, comparedto 30%, 35%, and 19% for those that belonged to the low-reputation, medium-reputation and high-reputation group re-spectively. The log-rank test confirms that these differencesbetween the groups that received notices and the controlgroup are significant (χ2 = 15.61, p = 0.0014). However,the differences among any of treatment groups which receivednotifications are not significant (see Table V).
2) Campaign 2: In the previous section, we analyzed theimpact of the notices that were sent during the first campaignand proved that sending notices expedited the cleanup process.In the following, we analyzed the impact of the notices sentduring the second campaign that took place during January2015.
As shown in Table IV, during this second campaign thepercentage of sites successfully remediated was lower thanduring the first campaign. The control group had the lowestpercentage of remediated infections, i.e., only 26% of websiteswere cleaned up. The rest of treatment groups achieved similarpercentage of remediated sites (44%-49%). Therefore, thoughnotices did impact the cleanup process, the reputation of thesender did not significantly affect that process.
Despite having a lower overall cleanup ratio, the sites that
Time(days)
Surv
ival
Pro
babi
lity
0 2 4 6 8 10 12 14 16 18 20
0.0
0.2
0.4
0.6
0.8
1.0
Log-rank p = 3e-06
ControlIndiv. researcherUniversityAnti-malware Org.
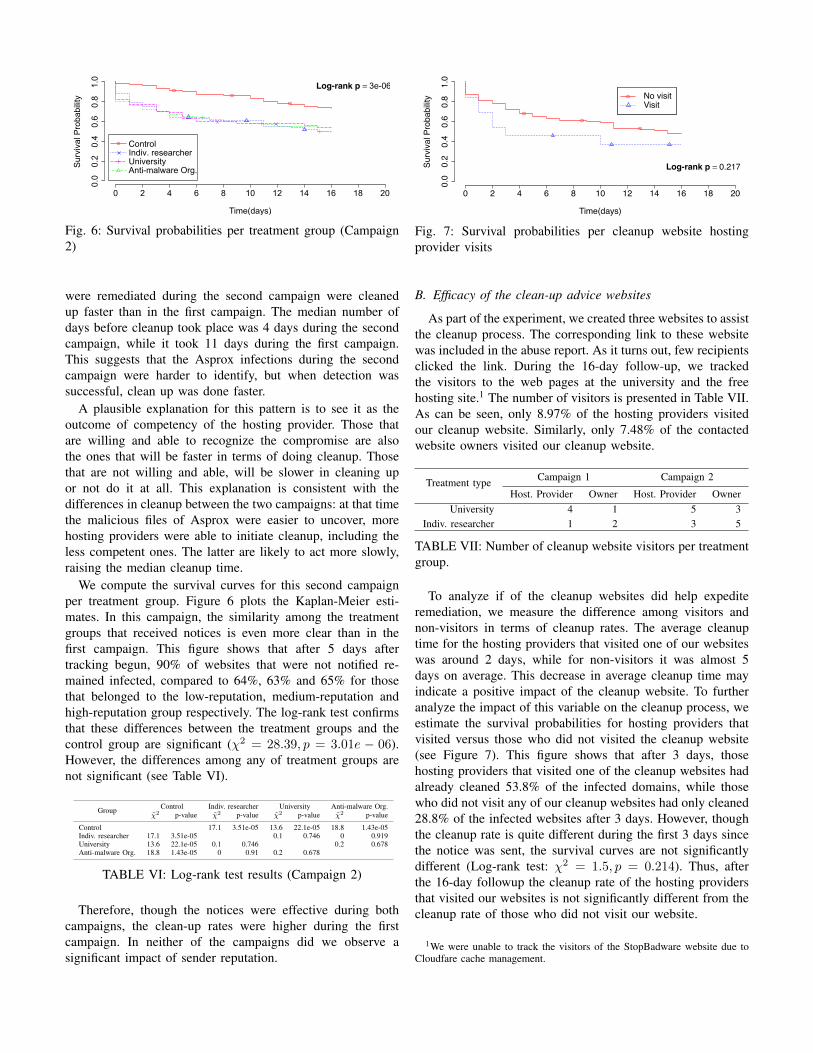
Fig. 6: Survival probabilities per treatment group (Campaign2)
were remediated during the second campaign were cleanedup faster than in the first campaign. The median number ofdays before cleanup took place was 4 days during the secondcampaign, while it took 11 days during the first campaign.This suggests that the Asprox infections during the secondcampaign were harder to identify, but when detection wassuccessful, clean up was done faster.
A plausible explanation for this pattern is to see it as theoutcome of competency of the hosting provider. Those thatare willing and able to recognize the compromise are alsothe ones that will be faster in terms of doing cleanup. Thosethat are not willing and able, will be slower in cleaning upor not do it at all. This explanation is consistent with thedifferences in cleanup between the two campaigns: at that timethe malicious files of Asprox were easier to uncover, morehosting providers were able to initiate cleanup, including theless competent ones. The latter are likely to act more slowly,raising the median cleanup time.
We compute the survival curves for this second campaignper treatment group. Figure 6 plots the Kaplan-Meier esti-mates. In this campaign, the similarity among the treatmentgroups that received notices is even more clear than in thefirst campaign. This figure shows that after 5 days aftertracking begun, 90% of websites that were not notified re-mained infected, compared to 64%, 63% and 65% for thosethat belonged to the low-reputation, medium-reputation andhigh-reputation group respectively. The log-rank test confirmsthat these differences between the treatment groups and thecontrol group are significant (χ2 = 28.39, p = 3.01e − 06).However, the differences among any of treatment groups arenot significant (see Table VI).
Group Control Indiv. researcher University Anti-malware Org.χ2 p-value χ2 p-value χ2 p-value χ2 p-value
Control 17.1 3.51e-05 13.6 22.1e-05 18.8 1.43e-05Indiv. researcher 17.1 3.51e-05 0.1 0.746 0 0.919University 13.6 22.1e-05 0.1 0.746 0.2 0.678Anti-malware Org. 18.8 1.43e-05 0 0.91 0.2 0.678
TABLE VI: Log-rank test results (Campaign 2)
Therefore, though the notices were effective during bothcampaigns, the clean-up rates were higher during the firstcampaign. In neither of the campaigns did we observe asignificant impact of sender reputation.
Time(days)
Su
rviv
al P
rob
ab
ility
0 2 4 6 8 10 12 14 16 18 20
0.0
0.2
0.4
0.6
0.8
1.0
No visitVisit
Log-rank p = 0.217
Fig. 7: Survival probabilities per cleanup website hostingprovider visits
B. Efficacy of the clean-up advice websites
As part of the experiment, we created three websites to assistthe cleanup process. The corresponding link to these websitewas included in the abuse report. As it turns out, few recipientsclicked the link. During the 16-day follow-up, we trackedthe visitors to the web pages at the university and the freehosting site.1 The number of visitors is presented in Table VII.As can be seen, only 8.97% of the hosting providers visitedour cleanup website. Similarly, only 7.48% of the contactedwebsite owners visited our cleanup website.
Treatment type Campaign 1 Campaign 2
Host. Provider Owner Host. Provider OwnerUniversity 4 1 5 3
Indiv. researcher 1 2 3 5
TABLE VII: Number of cleanup website visitors per treatmentgroup.
To analyze if of the cleanup websites did help expediteremediation, we measure the difference among visitors andnon-visitors in terms of cleanup rates. The average cleanuptime for the hosting providers that visited one of our websiteswas around 2 days, while for non-visitors it was almost 5days on average. This decrease in average cleanup time mayindicate a positive impact of the cleanup website. To furtheranalyze the impact of this variable on the cleanup process, weestimate the survival probabilities for hosting providers thatvisited versus those who did not visited the cleanup website(see Figure 7). This figure shows that after 3 days, thosehosting providers that visited one of the cleanup websites hadalready cleaned 53.8% of the infected domains, while thosewho did not visit any of our cleanup websites had only cleaned28.8% of the infected websites after 3 days. However, thoughthe cleanup rate is quite different during the first 3 days sincethe notice was sent, the survival curves are not significantlydifferent (Log-rank test: χ2 = 1.5, p = 0.214). Thus, afterthe 16-day followup the cleanup rate of the hosting providersthat visited our websites is not significantly different from thecleanup rate of those who did not visit our website.
1We were unable to track the visitors of the StopBadware website due toCloudfare cache management.

Time(days)
Su
rviv
al P
rob
ab
ility
0 2 4 6 8 10 12 14 16 18 20
0.0
0.4
0.8
133351627622611249402634736351429105464167249891
Fig. 8: Survival probabilities top 10 autonomous systems
This also suggests that hosting providers have differentpolicies to deal with website infections. Table VIII describessome basic statistics of the top 10 autonomous systems interms of number of Asprox infected domains. We can seeclear differences both in terms of the amount of remediatedinfections and also in terms of average time to clean up aninfected website. For instance, ’InMotion’ hosting providerremediated all the infection in less than 4 days in average,while ’OVH’ only remediated 21.05% of the websites andtook around 8 days on average for those it did clean up.Figure 8 plots the survival curves for these hosting providers.Again, we can see significant different in terms of cleanup ratefor the different hosting providers. ’InMotion’, ’CS Loxinfo’and ’Hetzner’ had cleaned more than 20% of their infectedwebsites after 5 days while the rest of hosting providers tookmore than 10 days to achieve a similar percentage.
AS Name #AS # Infections % clean Avg. Cleanup Time (days) CCCamp. 1 Camp. 2 Camp. 1 Camp. 2 Camp. 1 Camp. 2
CloudFlare 13335 0 9 - 44% - 10.25 USOVH 16276 9 29 22.22% 21% 10.00 7.29 FRInMotion-West 22611 2 6 100.00% 100% 7.00 5.17 USHetzner 24940 5 15 100.00% 20% 5.20 1.67 DEDreamhost 26347 0 6 - 33% - 6.50 USSoftLayer 36351 3 25 66.67% 20% 8.33 4.40 USSadeceHosting 42910 2 9 50.00% 11% 10.00 7.00 TRInMotion 54641 0 6 - 100% - 3.33 USStrato 6724 1 12 100.00% 25% 10.00 5.40 DECS Loxinfo PLC 9891 0 17 - 71% - 3.08 TH
TABLE VIII: Summary cleanup statistics per AS owner.
Similarly, we measured whether website owners that visitedour websites were capable of cleaning their infected websitesfaster. The average cleanup time for the website owners thatvisited one of our websites was 4.20 days in average, whilefor those who did not visit a cleanup website it was 4.26 daysin average – an insignificant difference. The same result isshown by the survival probabilities (see Figure 9). After 7days, the owners who visited the site had cleaned 36.4% ofthe infected domains, while those who did not visit cleaned40.8% of the websites after 7 days. Thus, visiting the cleanupwebsite did not make a difference for the website owners (Log-rank test: χ2 = 0.2, p = 0.648). In short, it seems providingcleanup advice is not helpful, at least not in this form. If weassume that less technically competent owners are more likelyto follow the link, then even basic advice does not enable themto achieve better cleanup.
These results suggest that: i) hosting providers play a majorrole when it comes to remediating an Asprox infection, ii)
Time(days)
Su
rviv
al P
rob
ab
ility
0 2 4 6 8 10 12 14 16 18 20
0.0
0.2
0.4
0.6
0.8
1.0
No visitVisit
Log-rank p = 0.64
Fig. 9: Survival probabilities per cleanup website owner visi-tors
hosting providers that visited our cleanup website correlatedto a higher rate of remediating the infection that those that didnot, and iii) website owners seem to not have enough skills toclean up their own website once it gets infected, even whenbasic suggestions are provided.
C. Analyzing responses from notified parties
During our experiment, we contacted 480 abuse contactsand received e-mail responses from 89 contacts. Of these11 (12%) were clearly from a human, while 78 (88%) weremachine-generated. The vast majority of responses were inEnglish. Other common languages included Chinese, Russian,German, French, Turkish, Iranian, Thai, and Spanish.
Automated messages came in two forms: confirmations(28%) and tickets (72%). Confirmation e-mails simply ac-knowledge receiving our notification. Tickets provided a ref-erence or ticket identifier associated with our notificationmessage.
Throughout the experiment, 173 out of 240 notificationswe sent to site owners bounced back mostly due to lackof abuse@domain address. On the other hand, the sameaddresses belonging to hosting providers bounced back once,indicating that the vast majority of hosting providers were atleast setup to receive abuse e-mails. The difference can beexplained in terms of awareness, technical knowledge, and/orliability. Whereas site owners are likely not aware of abusereporting conventions, lack technical knowledge, and generallyare not held liable for the distribution of malicious content,hosting providers as organizations generally are aware, andalso potentially liable [14].
We investigated the relationship between the responses ofnotified parties and their cleanup behavior. Table IX providessome summary statistics regarding the status of the infectedURLs after 16 days according to each response type that wereceived. Entries are given for each treatment group. Again,we reported the percentage of websites that have been foundclean at the end of our 16-day investigation and the mediannumber of days required to clean up those sites. We cannotobserve any significant difference in the number of receivedresponses across the treatment groups. This suggests that noneof the notified entities decided whether to reply based on thereputation of the sender.

Treatment Group
Campaign 1 Campaign 2
Human responses Automated responses Human responses Automated responses
# % clean Median Cleanup # % clean Median Cleanup # % clean Median Cleanup # % clean Median Cleanup
Indiv. Researcher 3 100% 1 day 7 86% 5 days 1 100% 1 day 16 56% 13 daysUniversity 1 100% 2 days 5 60% 12 days 4 75% 5 days 23 57% 4 days
Anti-malware Org. 1 100% 6 days 7 100% 2 days 1 100% 4 days 20 60% 4 days
TABLE IX: Summary statistics on the cleanup time according to the type of response
Time(days)
Sur
viva
l Pro
babi
lity
0 2 4 6 8 10 12 14 16 18 20
0.0
0.2
0.4
0.6
0.8
1.0
AutomatedHumanNone
Log−rank p = 0.000257
Fig. 10: Survival probabilities per response type
We did, however, find statistically significant differencesbetween each of the type of responses and cleanup rates(Log-rank test: χ2 = 16.6, p = 0.000247). As shown inFigure 10, within four days after notification, 64% of hu-man responders had already cleaned up their websites, whileautomated responders had remediated 43% of the infections,and those parties that didn’t reply at all had only cleaned29% of the compromised sites. Thus, the second strongestreactions came from contacts configured to send automatedresponses. This indicates that hosting providers using a systemto automatically process notifications and complaints are morelikely to act. As expected, the least effective reaction camefrom those hosting providers that never responded. After thefirst week, only 32% of such contacts had conducted someremediation; after 16 days, 48% had. While these cleanup ratesare lower, they do show that even when hosting providers donot respond, it does not imply they ignored the message.
V. RELATED WORK
A few researchers have recently begun investigating hownotifications about system compromise or vulnerability canpromote remediation. Most similar to our own work, Vasek& Moore conducted an experimental study on web-basedmalware URLs submitted to the StopBadware communityfeed [1]. They found that abuse reports sent with detailedinformation on the compromise are cleaned up better thanthose not receiving a notice (62% vs. 45% cleaned after 16days). Moreover, they found no difference between the cleanuprates for websites receiving a minimal notice and those notreceiving any notice at all. Based on this finding, we electedto provide detailed information in the abuse reports we sent.Thus, we corroborate their finding that detailed notices workon a different type of incident dataset.
Furthermore, we studied how different forms of notificationsaffected uptimes of malware cleanup rates [15]. To this end,
we compared the uptimes of ZeuS command and controlservers provided by Zeus Tracker, Cybercrime Tracker anda private company. ZeuS Tracker and Cybercrime Trackerpresent a publicly accessible dynamic webpage that displaysZeuS malware command and control servers. On the otherhand, the private company did not publicize any of detectedcommand and control servers. We showed that publicizedcommand and control servers were mitigated 2.8 times fasterthan the ones that were not publicized.
Another malware-orientated study supported the notion thatnotifications spur intermediaries to take action: in Canali etal. [2], researchers setup vulnerable webservers and compro-mised them. After a period of 25 days, they notified their ownweb hosts. Approximately 50% took action, generally sus-pending access. To ensure that the notifications were actuallybeing read and not simply being acted upon without evidence,false abuse reports were also sent, resulting in 3 of the 22providers suspending an account without actual evidence. Thisin turn suggests that most, but not all, recipients investigateabuse reports before taking action.
Whereas the present work and studies described abovefocus on reports of compromise, other researchers have sentnotifications to the operators of vulnerable, but not neces-sarily compromised, systems. The goal here is to patch thevulnerable systems instead of remediating an infection. Forexample, Durumeric et al. notified hosts vulnerable to thewidely reported Heartbleed vulnerability [3]. After scanningand excluding device and large-scale cloud providers (suchas Amazon), researchers automatically identified 4,648 uniqueadministrative contacts for 162,805 vulnerable hosts. Theythen divided the contacts into a treatment group receivingnotifications and a control group that did not (at least initially).The treatment group was notified by e-mail and pointed toa detailed patching guide hosted at a University website.The researchers observed a 39.5% rate of patching for thosereceiving notifications, versus 26.8% for those that did not.
Similarly, Kuhrer et al. issued notifications for systemsvulnerable to DDoS amplification attacks involving NTP [4].Rather than directly notify each individual host with infor-mation about the vulnerability, the researchers provided listsof afflicted IP addresses to key organizations such as abuseteam contacts at CERTs, security data clearinghouses suchas Shadowserver, and afflicted vendors such as Cisco. Theycomplemented this effort by working with CERTs to issueinformative advisories warning of the vulnerability and how topatch affected systems. This multi-pronged approach provedvery effective: they observed a 92% reduction in amplifiers

after three months tracking a population of 1.6 million affectedhosts. Although the authors did not design an experimentwith a control group, the researchers credited the campaign’ssuccess to collaboration with reputable sources who then issuenotifications. This suggests that sender reputation might beinfluential after all, despite the negative findings from ourstudy. In future work, we recommend investigating alternativesources of reputation, such as other intermediaries capable ofcoordinating cleanup and/or the use of private contact detailsfor sharing compromise information.
Finally, with respect to general e-mail spam, a quasi-experiment by Tang et al. [16] saw researchers use twoblocklists to compile a large source of e-mail spam andpublish aggregated measures on SpamRankings.net. They thenpublished the results for a treatment group and withheld resultsfor a control group, observing a 15.9% reduction in spamamong the treated group. Rather than notify individual hosts inorder to remediate infections, the researchers’ strategy reliedon public shaming. The study indicates that abuse informationcould provide incentive for intermediaries to cooperate inremediating abuse on their networks.
VI. LIMITATIONS
A number of limitations may impact the findings from ourstudy.
First, we selected contacts to notify by inspecting theWHOIS for affected domains. Many abuse reports are sentbetween personal contacts, not general contact addresses, butwe were unable to capture the impact of reputation in thesetrusted interactions. Our findings, therefore, apply only to thebaseline case where personal contact has not been established.To put it differently, we are not claiming that reputation doesnot matter. Not only did an earlier study suggest it might (seesectionV), but the actual practices of abuse reporting showthis every day. For example, many providers work with trustedreporters. In some cases, these notifications are trusted enoughto allow for automated countermeasures or takedown actions.
Second, we measured reputation by the domain associatedwith the notification and the website used for cleanup advice.One potential issue is that our University-affiliated address wastudelft.nl, as opposed to the more widely known .edutop-level domain.2 Nonetheless, anyone visiting the websitefor cleanup advice would clearly see the association with aUniversity, while those visiting StopBadware’s website wouldsee that it was a non-profit cybersecurity organization. How-ever, this is only one way to measure reputation. Reputationcan also be established by sending credible notifications overa period of time. Because none of the organizations in ourstudy regularly send notifications, we were unable to measurereputation in this fashion. However, it is something that wehope to do in future work, provided that we can partner withan organization that regularly sends abuse reports.
Third, we relied on a source of compromised URLs fo-cused specifically on the malware delivery component of a
2Moreover, in certain cases, e-mails from .nl and .org addresses getcaught in spam filters, whereas those from Gmail get through.
single, long-established botnet. We made this design decisionintentionally, in order to control for the natural variation thatexists between different types of abuse data. For example,a hosting provider might prioritize cleanup of commandand control infrastructure over hacked websites that delivermalware. Furthermore, advanced persistent threats, bankingtrojans and phishing sites could attract more attention fromhosting providers due to the financial implications and poten-tial liability. The impact of sender reputation may differ inthese scenarios, and so we defer such investigations to futurework.
Fourth, there is a chance that latent characteristics appeareddisproportionately in the treatment groups that influenced theoverall outcome. For example, hosting provider size and type(shared vs. dedicated) may influence cleanup rates, but wewere unable to verify that the distribution of these features isproportionate among treatment groups.
Fifth, we did not study re-infection of previously cleanedwebsites. Frequently, websites are recompromised when thehole that let the attacker in the first time is not plugged [17].Because we were primarily interested in measuring the re-sponse to abuse reports, we elected to ignore subsequentreinfections.
Finally, there are a number of characteristics closely relatedto reputation that we did not examine. For example, none ofour reports carried any suggestions that punitive action mayresult for ignoring the report. By contrast, notifications sentby Google (who controls search results) or ISPs and hostingproviders (who control Internet access) might carry moreweight due to the implication that there could be consequencesfor inaction. We defer investigating these effects to futurework.
VII. CONCLUSION
In this paper, we described an experiment to measure thedifferences in cleanup among notifications from senders withdiffering reputations. We find no evidence that reputation,as measured by the sender’s type of organization, influencescleanup rates. However, we do find that detailed notices resultsin better cleanup overall. This confirms earlier findings carriedout on websites distributing drive-by-downloads [1].
Furthermore, we find that publicizing and linking to acleanup website containing specific instructions improves thecleanup rate when hosting providers view the instructions.However, this same positive impact is not shared by resourceowners who served as point of contact for their domains. Thissuggests that differences in technical proficiency influence thesuccess of a notification. Finally, throughout the trial, reportsthat elicited personal responses from the affected partiesachieved higher cleanup rates. This suggests that personalinteraction may contribute to better cleanup.
The role of the attacker in evading detection also plays a bigrole in how effective cleanup can be. We presented evidencethat when compromise could be easily verified, cleanup rateswere much higher than when the attackers took steps to hide

the compromise. We plan to study this effect in greater detailin future work.
Moving forward, we recommend three specific areas ofstudy to further build on the work of this paper: first, the con-tent of the notification and the presence of punitive measures;second, studying how cleanup websites are actually used byresource owners and intermediaries in order to craft a moreeffective message; and finally, sending notifications for otheraspects of the cybercrime ecosystem, including command andcontrol.
VIII. ACKNOWLEDGMENTS
The authors would like to thank the anonymous contributorfor generously sharing the Asprox data feed. Also, we thankStopBadware (Bryan Gulachenski and Marie Vasek) for theirkind support and TU Delft’s ICT staff for their help. Thispublication was supported by a subcontract from RutgersUniversity, DIMACS, under Award No. 2009-ST-061-CCI002-06 from the U.S. Department of Homeland Security andby a grant from the Netherlands Organisation for ScientificResearch (NWO), under project number 628.001.022.
REFERENCES
[1] M. Vasek and T. Moore, “Do malware reports expedite cleanup? Anexperimental study,” in Proceedings of the 5th USENIX Workshop onCyber Security Experimentation and Test (CSET), 2012.
[2] D. Canali, D. Balzarotti, and A. Francillon, “The role of web hostingproviders in detecting compromised websites,” in Proceedings of the22nd international conference on World Wide Web. International WorldWide Web Conferences Steering Committee, 2013, pp. 177–188.
[3] Z. Durumeric, J. Kasten, D. Adrian, J. A. Halderman, M. Bailey,F. Li, N. Weaver, J. Amann, J. Beekman, M. Payer et al., “The matterof heartbleed,” in Proceedings of the 2014 Conference on InternetMeasurement Conference. ACM, 2014, pp. 475–488.
[4] M. Kuhrer, T. Hupperich, C. Rossow, and T. Holz, “Exit from hell?reducing the impact of amplification DDoS attacks,” in USENIX SecuritySymposium, 2014.
[5] D. Crocker, “Mailbox Names for Common Services, Roles andFunctions,” RFC 2142 (Proposed Standard), Internet Engineering TaskForce, May 1997. [Online]. Available: http://www.ietf.org/rfc/rfc2142.txt
[6] “StopBadware,” http://www.stopbadware.org/.[7] “The moz blog study: How searchers perceive country code top-level
domains,” http://moz.com/blog/cc-tld-domain-study.[8] “Best Practices for Reporting Badware URLs,” 2011, https://www.
stopbadware.org/files/best-practices-for-reporting-badware-urls.pdf.[9] J. d. T. Nart Villeneuve and D. Sancho, “Asprox Reborn,” Trend Micro
Incorporated, Tech. Rep., 2009.[10] “Searching with virustotal,” https://www.virustotal.com/en/
documentation/searching/#getting-url-scans.[11] “Sucuri malware labs - php error: Fatal error,” http://labs.sucuri.net/db/
malware/php-error-fatal-error?v6.[12] “Server header checker – SEO tools,” http://tools.seobook.com/
server-header-checker.[13] “Cloudflare content delivery network,” https://www.cloudflare.com/
features-cdn.[14] “National institute of standards and technology - stopbad-
ware commentary on liability of web hosts for malwaredistribution,” http://www.nist.gov/itl/upload/StopBadware Web-Hosting-Provider-Liability-for-Malicious-Content.pdf.
[15] C. Ganan, O. Cetin, and M. van Eeten, “An empirical analysis ofzeus c&c lifetime,” in Proceedings of the 10th ACM Symposium onInformation, Computer and Communications Security. ACM, 2015,pp. 97–108.
[16] Q. Tang, “Improving internet security through social information andsocial comparison: A field quasi-experiment.”
[17] T. Moore and R. Clayton, “Evil searching: Compromise and recom-promise of internet hosts for phishing,” in Financial Cryptography andData Security, ser. Lecture Notes in Computer Science, R. Dingledineand P. Golle, Eds., vol. 5628. Springer, 2009, pp. 256–272.

APPENDIXCONTENT OF ABUSE REPORTS AND CLEANUP WEBSITES
hxxp://poorcompromisedwebsite .com/user.php is currently being abused to spread malware. This means it may be placing Internet users at risk. Please investigate and takeappropriate action to resolve or mitigate the threat.
Description: Asprox botnet dropper
Date/time of detection: 2014−12−07 at 00.31 (GMT+1)IP address at time of detection: 195.158.28.146Additional parties notified: [email protected] (site owner)
You are receiving this report because this was listed as the technical contact e−mail in the WHOIS record for 195.158.28.146. If you believe you have received this reportin error, or for more information, please contact us at this address: abuse−[email protected]
Caution: Opening malware URLs in your browser can infect your computer. For security reasons, URLs in this e−mail have been modified by replacing http with hxxpand by adding a space before the firstdot(.)
======================ADDITIONAL INFORMATION======================
Detailed malware description:
URL accessed: hxxp://poorcompromisedwebsite .com/user.php?c=RwFGxB7fBPAjwwWISCS7T09bzqUT3Behaviour: Delivers malicious executables and ZIP files.Special condition: Only delivers malicious executables when accessed through Windows Internet Explorer.
Tips for cleaning & securing a compromised website:https://www.stopbadware.org/asprox−cleanup−advice#7NSVRLZ
Fig. 11: Example of anti-malware organization e-mail notification
hxxp://poorcompromisedwebsite .com/user.php is currently being abused to spread malware. This means it may be placing Internet users at risk. Please investigate and takeappropriate action to resolve or mitigate the threat.
Description: Asprox botnet dropper
Date/time of detection: 2014−12−07 at 00.31 (GMT+1)IP address at time of detection: 10.1.5.3Additional parties notified: [email protected] (site owner)
You are receiving this report because this was listed as the technical contact e−mail in the WHOIS record for 10.1.5.3. If you believe you have received this report inerror, or for more information, please contact us at this address: malwarereporter−[email protected].
Caution: Opening malware URLs in your browser can infect your computer. For security reasons, URLs in this e−mail have been modified by replacing http with hxxpand by adding a space before the firstdot(.)
======================ADDITIONAL INFORMATION======================
Detailed malware description:
URL accessed: hxxp://poorcompromisedwebsite .com/user.php?c=OG30hQ5HtuQGGQ38fe744itfo/kMWBKwc+Wjn7UH5moBehaviour: Delivers malicious executables and ZIP files.Special condition: Only delivers malicious executables when accessed through Windows Internet Explorer.
Tips for cleaning & securing a compromised website:http://www.cleanup−advice.tudelft.nl/#WJUB5TG
Fig. 12: Example of University e-mail notification

hxxp://poorcompromisedwebsite .com/error.php is currently being abused to spread malware. This means it may be placing Internet users at risk. Please investigate andtake appropriate action to resolve or mitigate the threat.
Description: Asprox botnet dropper
Date/time of detection: 2014−12−07 at 00.31 (GMT+1)IP address at time of detection: 112.78.8.33Additional parties notified: [email protected] (site owner)
You are receiving this report because this was listed as the technical contact e−mail in the WHOISrecord for 112.78.8.33. If you believe you have received this report in error, or for moreinformation, please contact us at this address: [email protected].
Caution: Opening malware URLs in your browser can infect your computer. For security reasons, URLs in this e−mail have been modified by replacing http with hxxpand by adding a space before the firstdot(.)
======================
ADDITIONAL INFORMATION
======================
Detailed malware description:
URL accessed: hxxp://poorcompromisedwebsite .com/error.php?c=WhfXoeHz6uhPe0IqdCHdcaG2Fi/2U1Y/xYy11GMOm2YBehaviour: Delivers malicious executables and ZIP files.Special condition: Only delivers malicious executables when accessed through Windows Internet Explorer.
Tips for cleaning & securing a compromised website:http://cleanup−advice.besaba.com/#MNVTUUT
Fig. 13: Example of individual researcher e-mail notification
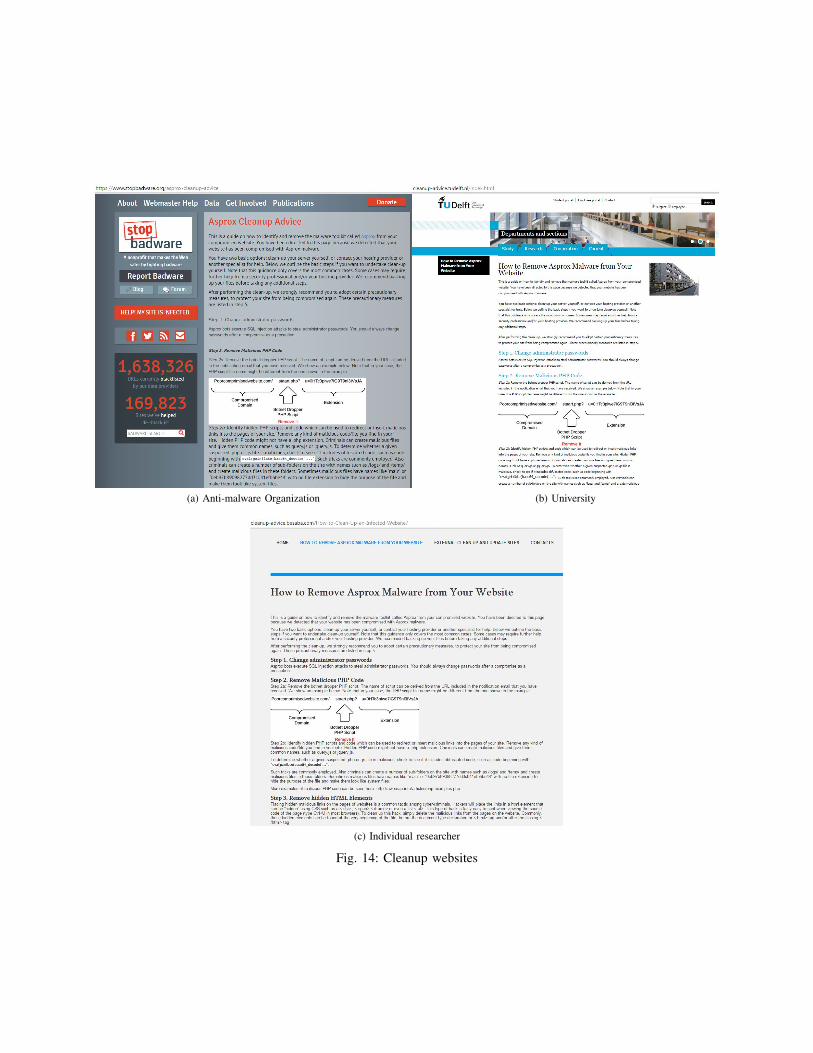
(a) Anti-malware Organization (b) University
(c) Individual researcher
Fig. 14: Cleanup websites