Embed Size (px)
DESCRIPTION
Understanding Water Quality in the Lunan Water. Discussion Group 1 st May 2008. Welcome. Purpose of today To find out your views regarding the health of the Lunan Water and present some results from our research. - PowerPoint PPT Presentation
Citation preview
Understanding Water Quality in the Lunan Water
Discussion Group
1st May 2008

Welcome
• Purpose of today– To find out your views regarding the health of the
Lunan Water and present some results from our research.• Many right answers – want your range of views and
experiences from people living in the area
• Purpose of research – To better understand water quality using scientific and
your local knowledge• Part of a wider project funded by the Scottish Government
involving SAC & SEPA
• Any Questions?
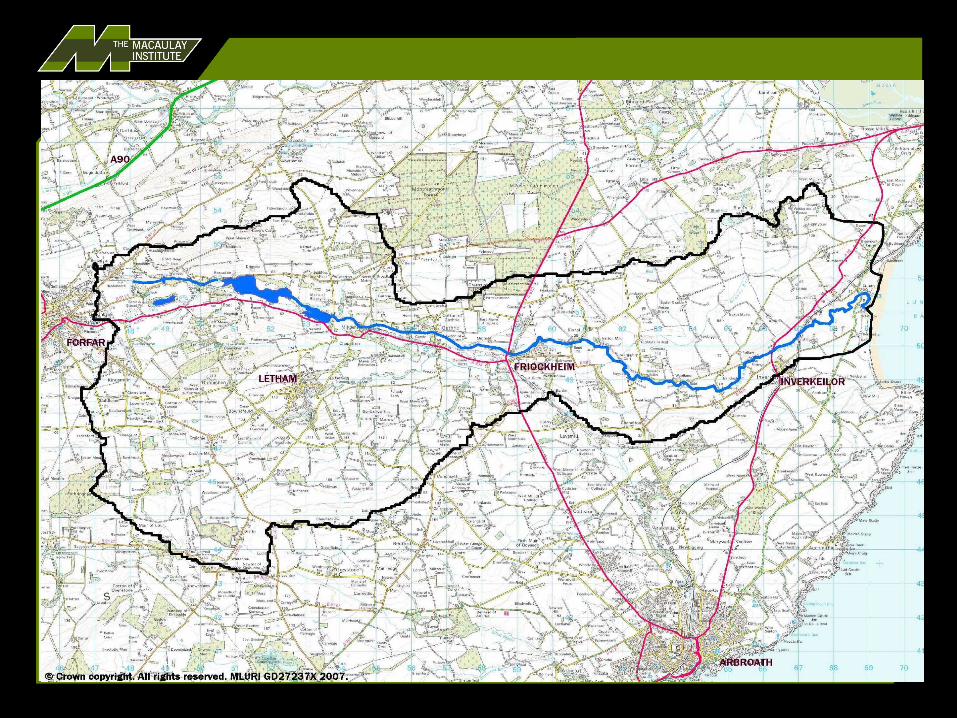

Lunan Water
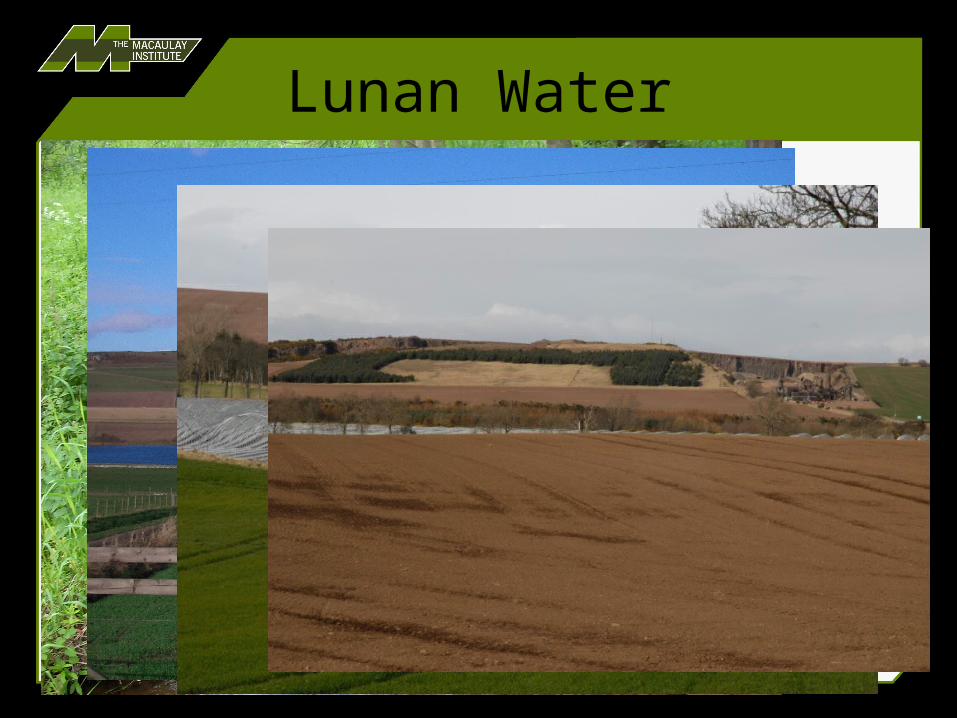
Lunan Water
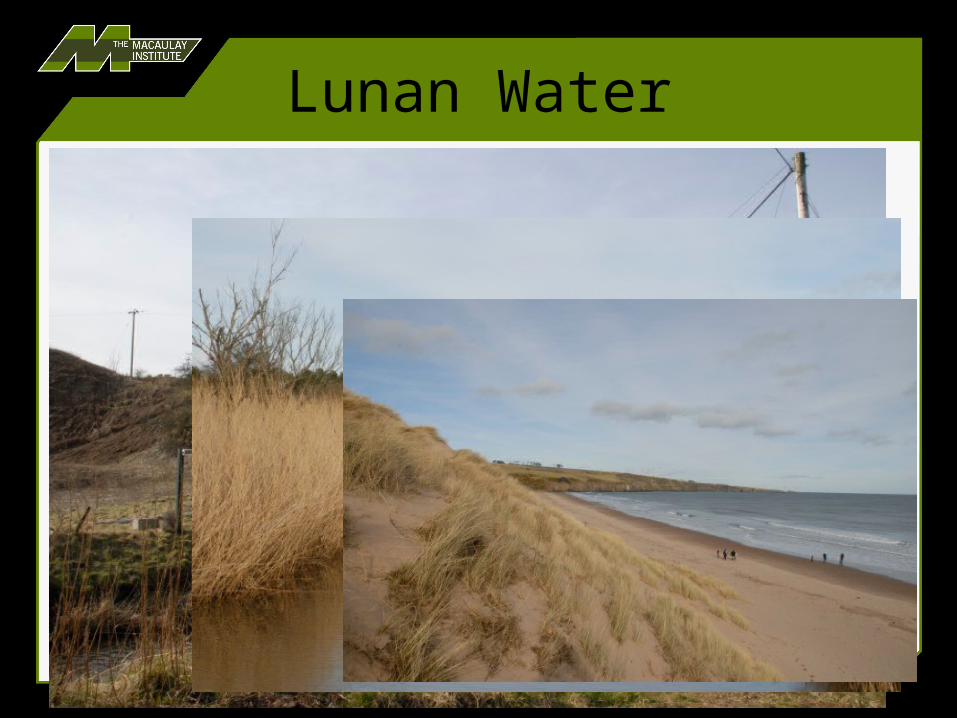
Lunan Water
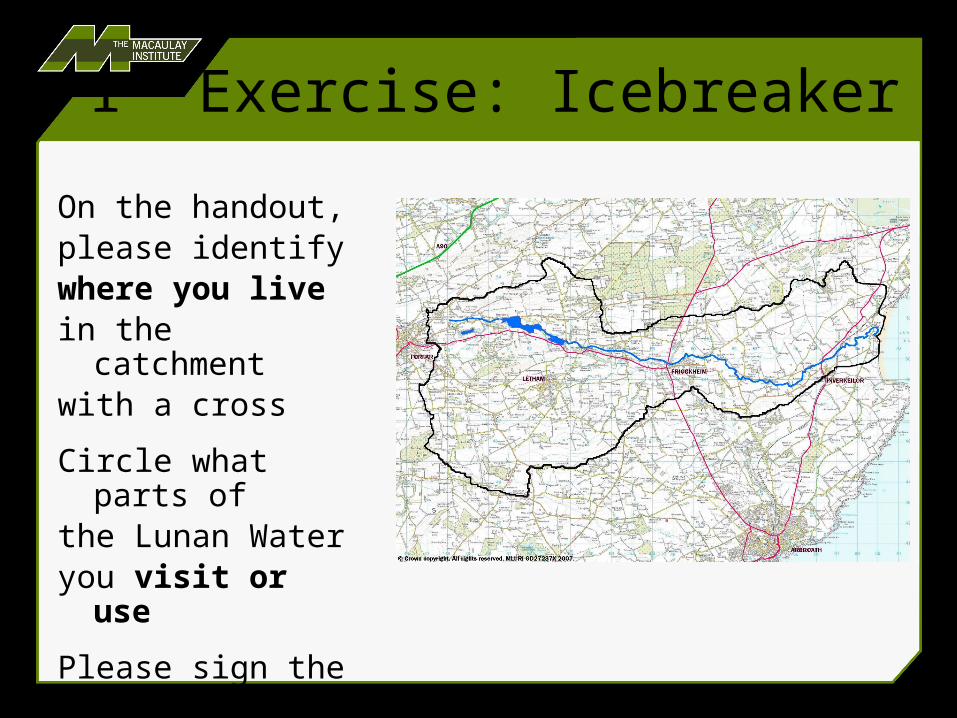
1st Exercise: Icebreaker
On the handout,please identifywhere you live in the catchmentwith a cross
Circle what parts ofthe Lunan Wateryou visit or use
Please sign the mapwith your name
2nd exercise: What, where, why?
• What do you think of the health of the Lunan Water?
• Note we mean all aspects of water not just chemical quality
• Where, if anywhere, do you think things needs to be improved?– Shade these areas on the map with a pencil or pen
• What might be causing these issues in the Lunan Water?
• Your information has given us a good feel for all the issues in the area
• Our research focuses specifically on one issue: nutrients
• Present our results to date for discussion
• Use your information to question and refine our research in the future
Nutrients in the Lunan Water
• What are they– Fertilizers– Nitrogen and phosphorus
• What do they do in surface waters ?– Cause unwanted plant growth
• Where do they come from– Agriculture and sewage– Loch sediments
• Are they a problem ?

Negative effects of nutrients
• Nitrogen– Excessive algal growth in estuaries– Leads to loss of oxygen in water– May result in loss of marine habitat
• Phosphorus– Excessive algal growth in lochs– Leads to loss of oxygen in water– May result in loss of fish habitat
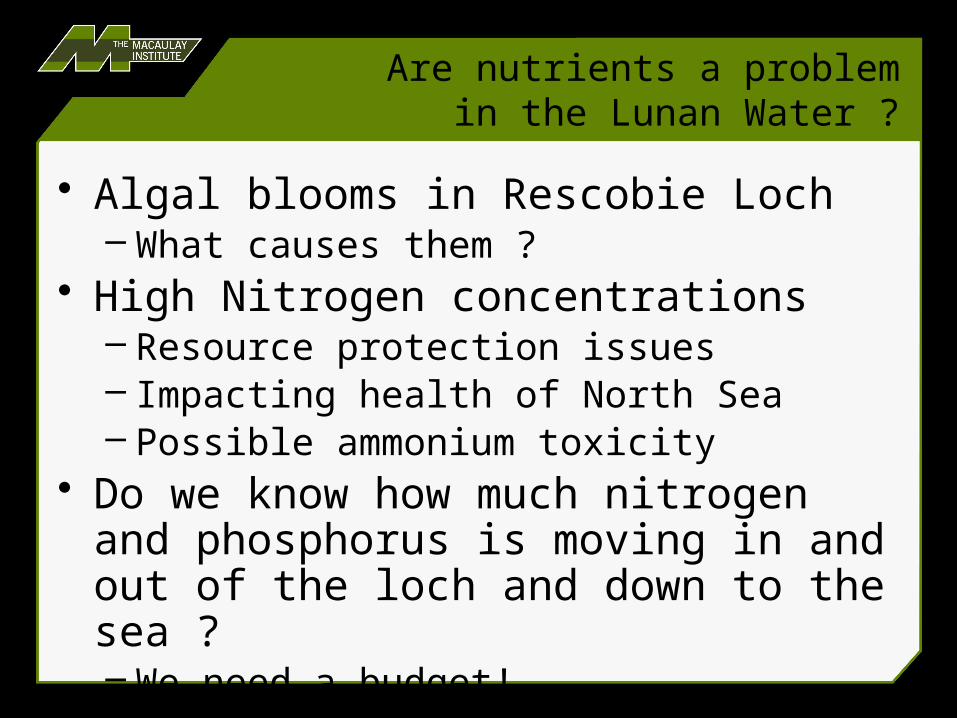
Are nutrients a problem in the Lunan Water ?
• Algal blooms in Rescobie Loch– What causes them ?
• High Nitrogen concentrations– Resource protection issues– Impacting health of North Sea– Possible ammonium toxicity
• Do we know how much nitrogen and phosphorus is moving in and out of the loch and down to the sea ?– We need a budget!
Simple nutrient budget
• Flux– How much nitrogen (or phosphorus) goes
under the bridge at Kirkton Mill every year ?– Flow X Concentration– Reliant on SEPA-collected data
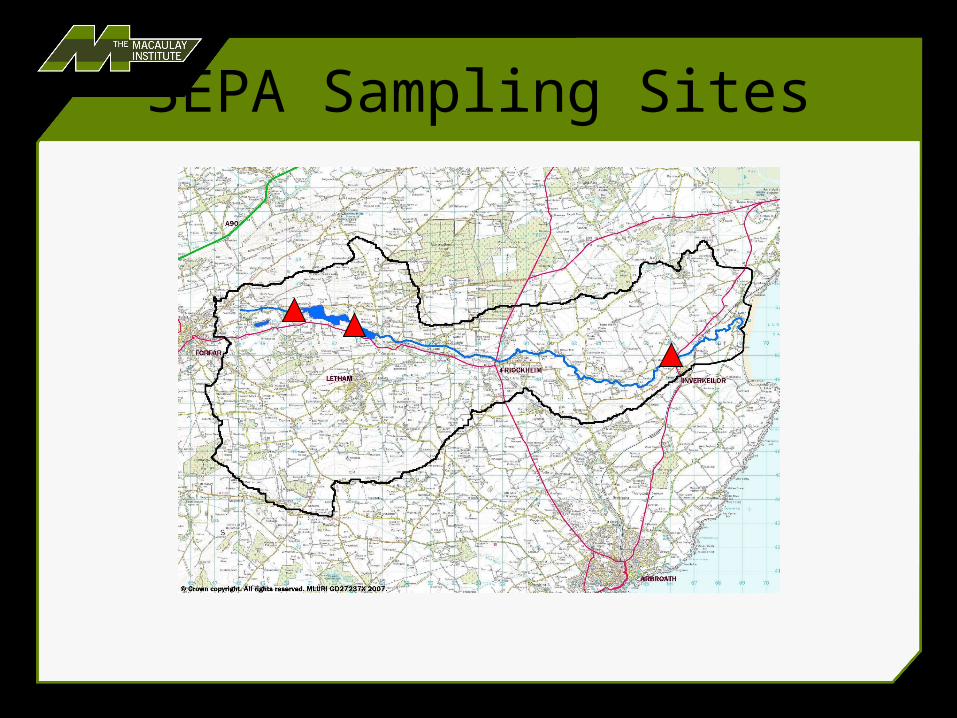
SEPA Sampling Sites
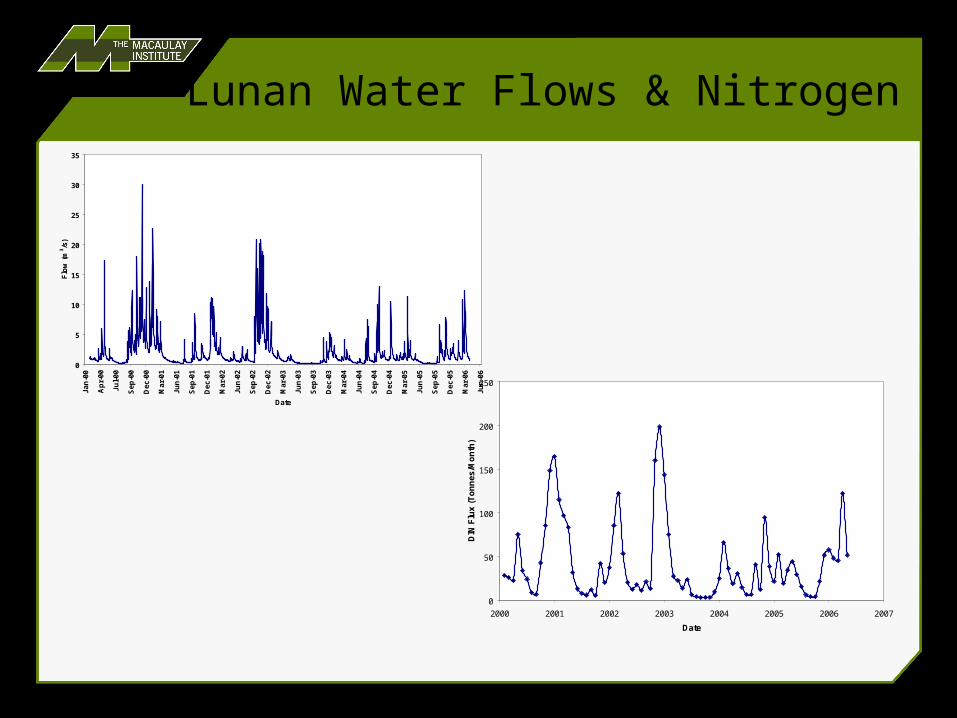
Lunan Water Flows & Nitrogen
0
5
10
15
20
25
30
35
Jan
-00
Ap
r-0
0
Ju
l-0
0
Se
p-0
0
De
c-0
0
Mar
-01
Ju
n-0
1
Se
p-0
1
De
c-0
1
Mar
-02
Ju
n-0
2
Se
p-0
2
De
c-0
2
Mar
-03
Ju
n-0
3
Se
p-0
3
De
c-0
3
Mar
-04
Ju
n-0
4
Se
p-0
4
De
c-0
4
Mar
-05
Ju
n-0
5
Se
p-0
5
De
c-0
5
Mar
-06
Ju
n-0
6
Date
Flo
w (
m3 /s
)
0
50
100
150
200
250
2000 2001 2002 2003 2004 2005 2006 2007
Date
DIN
Flu
x (T
on
ne
s/M
on
th)

Nitrogen summary
• 42 tonnes/month runs into sea• Almost all from agriculture (+/- 99%)• At £270/tonne for N fertiliser, this is
equivalent to pouring £400,000 into the sea, every year!
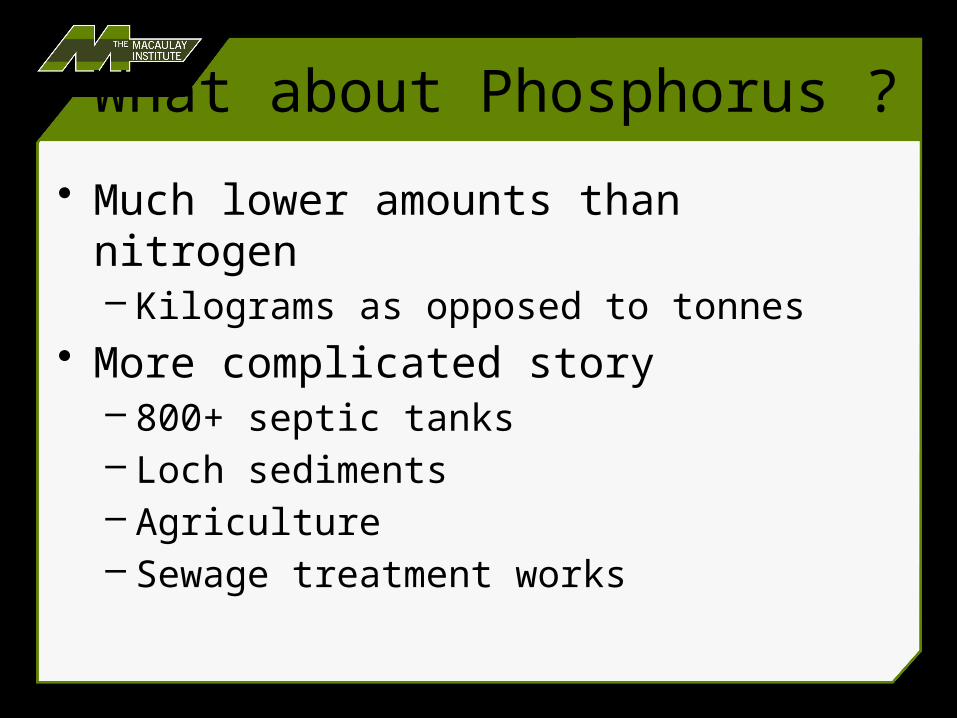
What about Phosphorus ?
• Much lower amounts than nitrogen – Kilograms as opposed to tonnes
• More complicated story– 800+ septic tanks– Loch sediments– Agriculture– Sewage treatment works
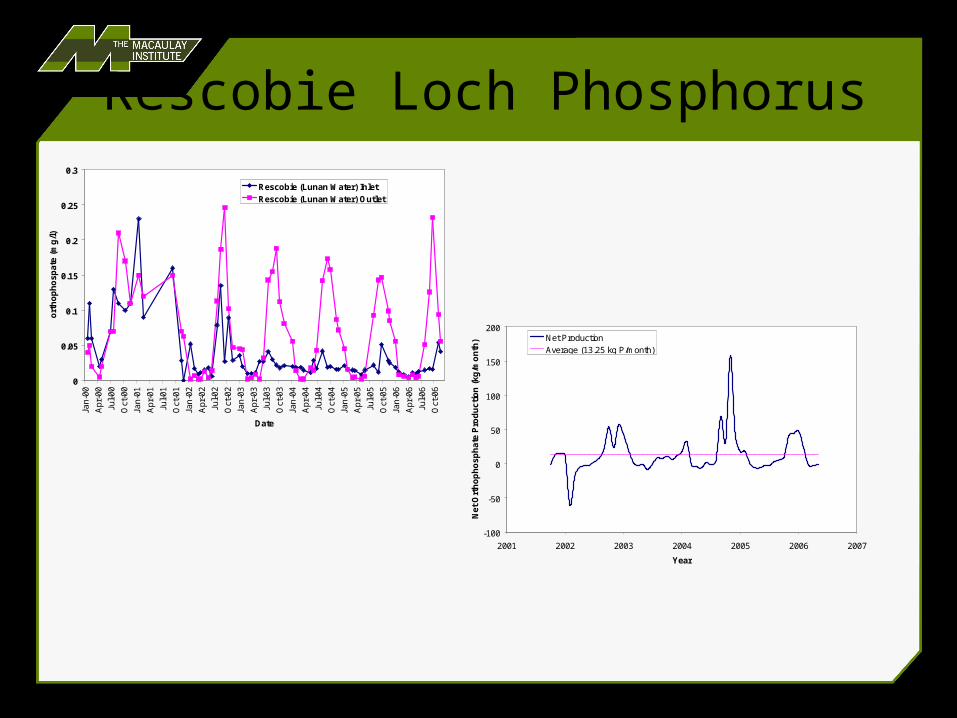
Rescobie Loch Phosphorus
0
0.05
0.1
0.15
0.2
0.25
0.3
Jan-
00
Apr
-00
Jul-0
0
Oct
-00
Jan-
01
Apr
-01
Jul-0
1
Oct
-01
Jan-
02
Apr
-02
Jul-0
2
Oct
-02
Jan-
03
Apr
-03
Jul-0
3
Oct
-03
Jan-
04
Apr
-04
Jul-0
4
Oct
-04
Jan-
05
Apr
-05
Jul-0
5
Oct
-05
Jan-
06
Apr
-06
Jul-0
6
Oct
-06
Date
ort
ho
ph
osp
ate
(mg
/l)
Rescobie (Lunan Water) Inlet
Rescobie (Lunan Water) Outlet
-100
-50
0
50
100
150
200
2001 2002 2003 2004 2005 2006 2007
Year
Net
Ort
ho
ph
osp
ha
te P
rod
uct
ion
(kg
/mo
nth
) Net Production
Average (13.25 kg P/month)
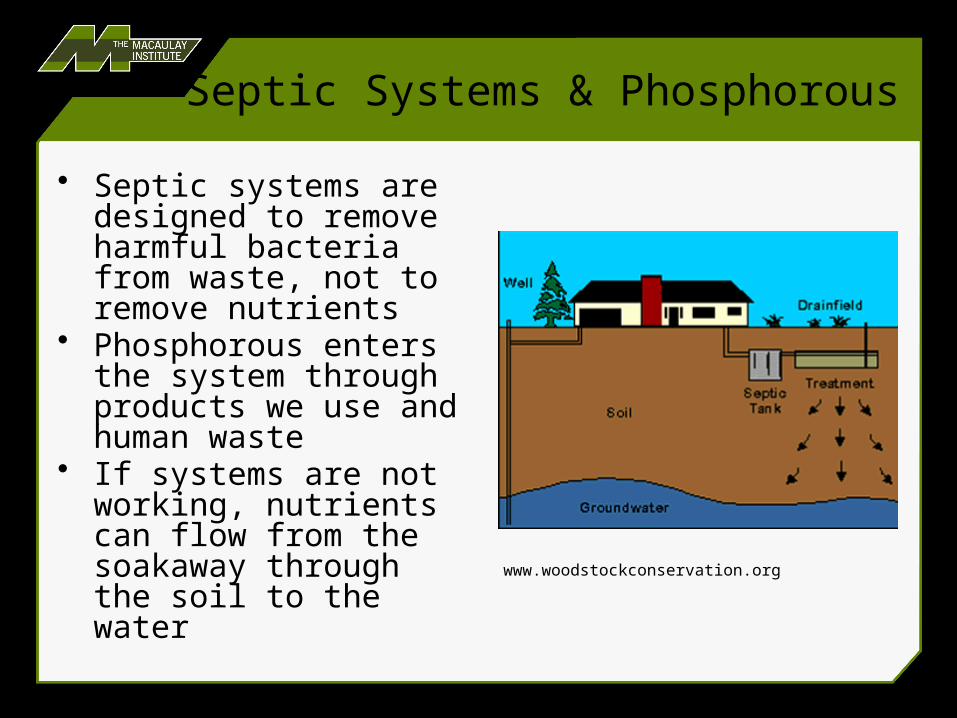
Septic Systems & Phosphorous
• Septic systems are designed to remove harmful bacteria from waste, not to remove nutrients
• Phosphorous enters the system through products we use and human waste
• If systems are not working, nutrients can flow from the soakaway through the soil to the water www.woodstockconservation.org
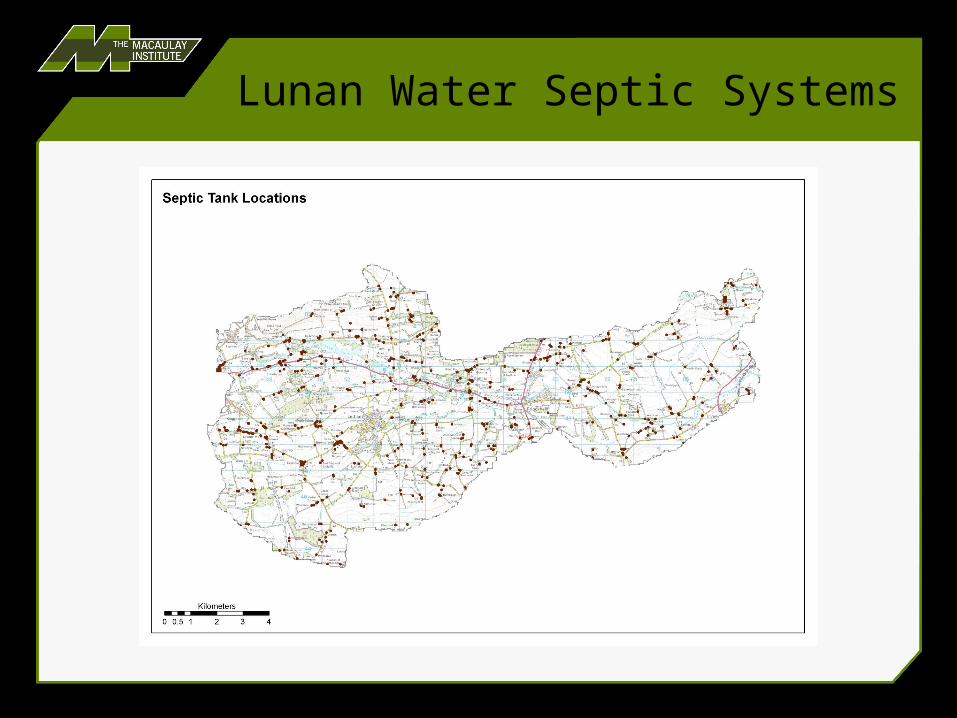
Lunan Water Septic Systems
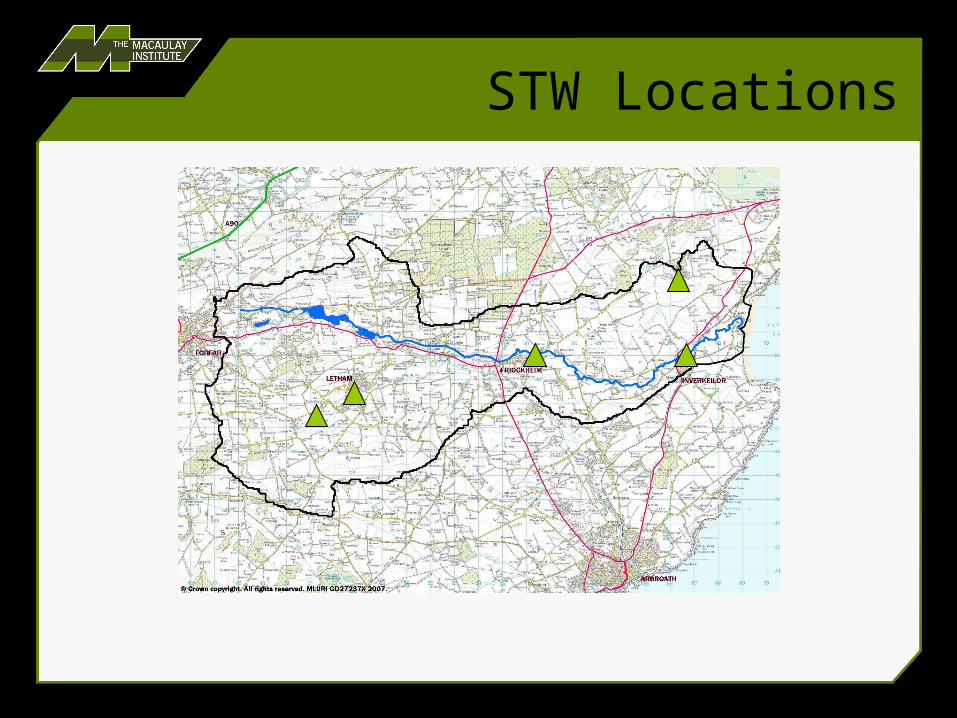
STW Locations

STW Phosphorus
0
2
4
6
8
10
12M
ay
-90
No
v-9
0
Ma
y-9
1
No
v-9
1
Ma
y-9
2
No
v-9
2
Ma
y-9
3
No
v-9
3
Ma
y-9
4
No
v-9
4
Ma
y-9
5
No
v-9
5
Ma
y-9
6
No
v-9
6
Ma
y-9
7
No
v-9
7
Ma
y-9
8
No
v-9
8
Ma
y-9
9
No
v-9
9
Ma
y-0
0
No
v-0
0
Ma
y-0
1
No
v-0
1
Ma
y-0
2
No
v-0
2
Ma
y-0
3
No
v-0
3
Ma
y-0
4
No
v-0
4
Ma
y-0
5
No
v-0
5
Ma
y-0
6
No
v-0
6
Ma
y-0
7
No
v-0
7
Date
o-P
ho
s (m
g/l
)
Friockheim STW, FE to Lunan Water
VINNY W_ AT IDVIES MILL (D/S LETHAM STW)
VINNY W_ D/S CRAICHIE STW
LUNAN W_ D/S INVERKEILOR STW
ROSSIE SCHOOL STW
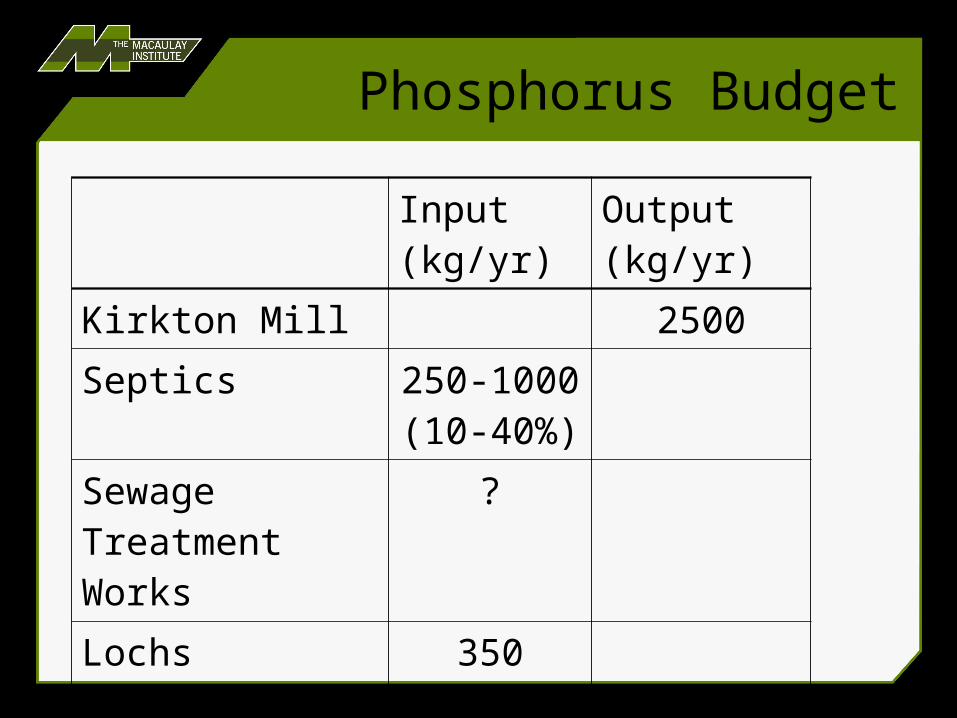
Phosphorus Budget
Input (kg/yr)
Output (kg/yr)
Kirkton Mill 2500Septics 250-1000
(10-40%)Sewage Treatment Works
?
Lochs 350 (14%)Agriculture(by difference)
1150-1900(46-76%)

Summary
• Nutrients in the Lunan Water are affecting the health of the lochs and the North Sea
• Nitrogen is mostly from agriculture• Phosphorus is from agriculture, septic
systems, loch sediments, sewage treatment works, etc.
Discuss Results
• What, if anything, surprised you about these results?
• Did you think this budget captured the main issues for the catchment?
• Did you learn anything from these results?• What are the main things we should take
away from this discussion?
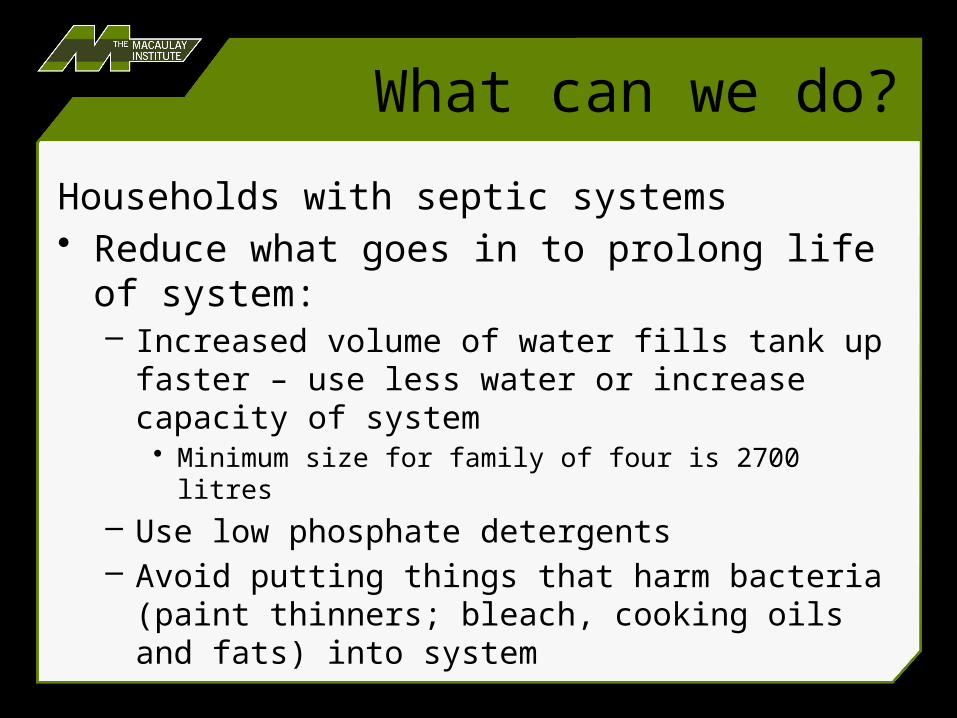
What can we do?
Households with septic systems• Reduce what goes in to prolong life of system:
– Increased volume of water fills tank up faster – use less water or increase capacity of system• Minimum size for family of four is 2700 litres
– Use low phosphate detergents – Avoid putting things that harm bacteria (paint thinners;
bleach, cooking oils and fats) into system– System can’t digest paper, nappies, cigarette butts
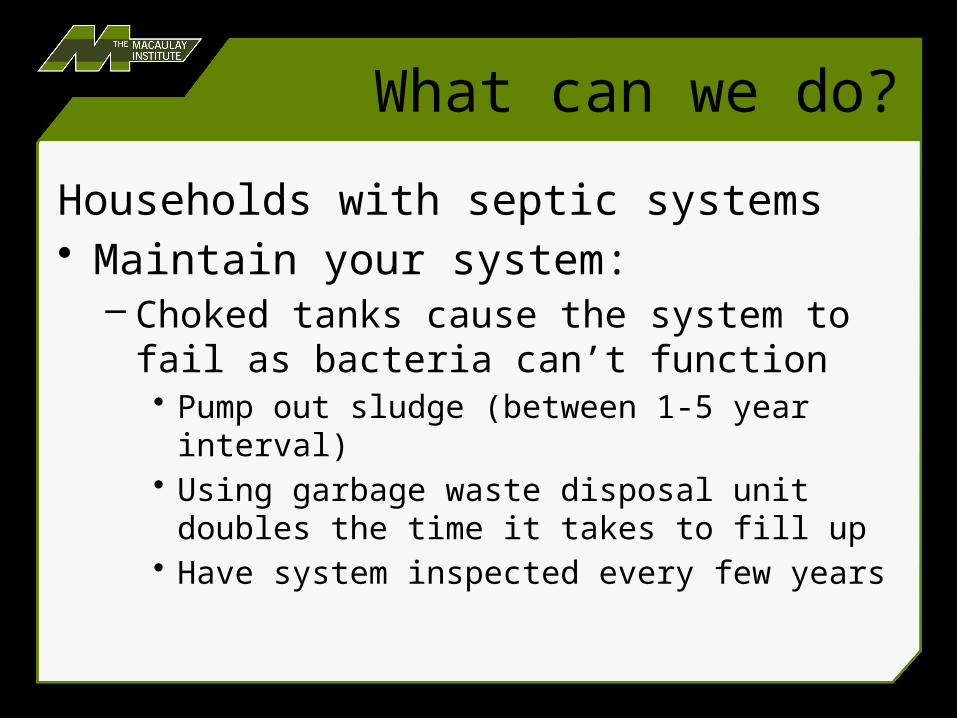
What can we do?
Households with septic systems• Maintain your system:
– Choked tanks cause the system to fail as bacteria can’t function• Pump out sludge (between 1-5 year interval)• Using garbage waste disposal unit doubles the
time it takes to fill up • Have system inspected every few years
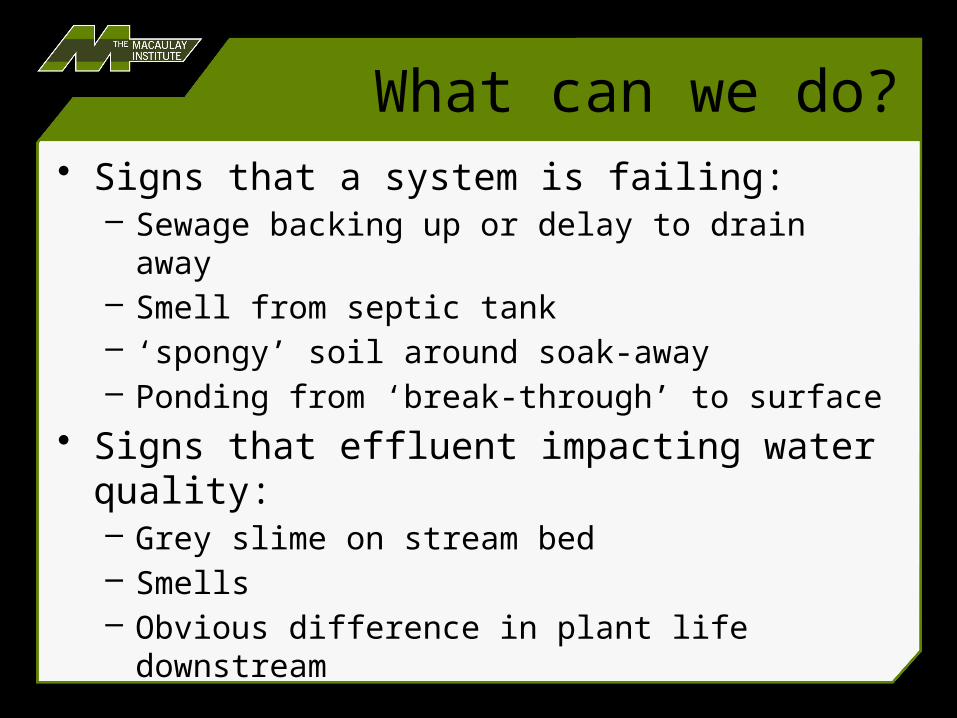
What can we do?• Signs that a system is failing:
– Sewage backing up or delay to drain away– Smell from septic tank– ‘spongy’ soil around soak-away – Ponding from ‘break-through’ to surface
• Signs that effluent impacting water quality:– Grey slime on stream bed– Smells– Obvious difference in plant life downstream
• Contact SEPA to report pollution & Scottish Water, or Angus Council for list of contractors

What can we do?
Land Managers• Explore the Best Management Practice
Handbook: http://www.ceh.ac.uk/sepa/• Environmental Focus Farm project
– Group of local farmers sharing good practice with each other & Monitoring programme to assess effectiveness of measures
– Organised by SAC with inputs from Macaulay & SEPA
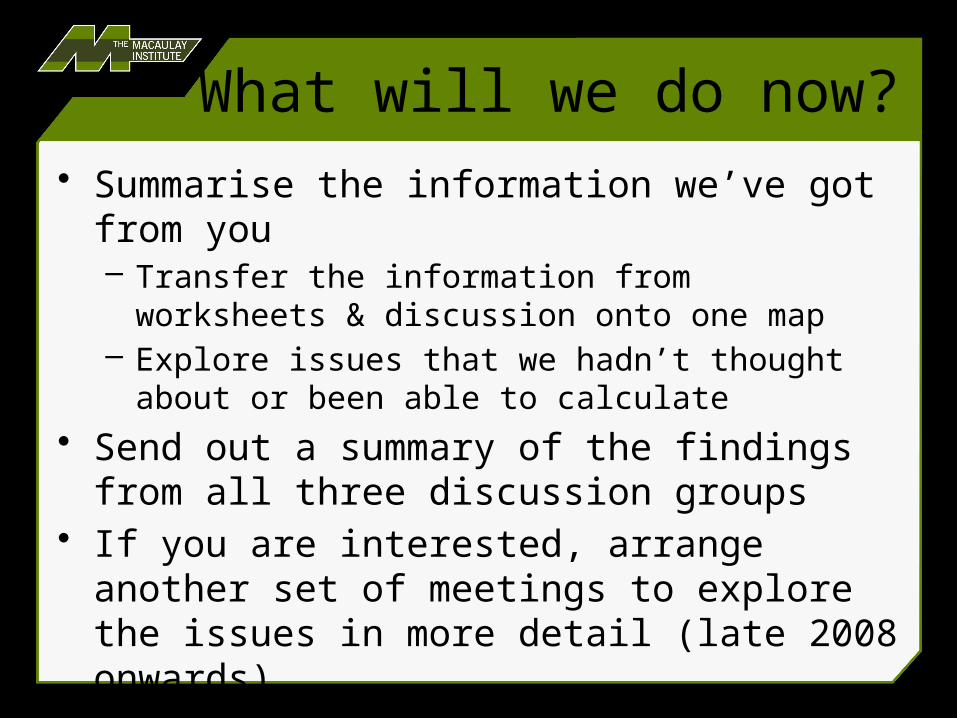
What will we do now?• Summarise the information we’ve got from you
– Transfer the information from worksheets & discussion onto one map
– Explore issues that we hadn’t thought about or been able to calculate
• Send out a summary of the findings from all three discussion groups
• If you are interested, arrange another set of meetings to explore the issues in more detail (late 2008 onwards)

Thank you very much for all your input
If you want more information, please contact us:Kirsty 01224 498200 ext 2389
[email protected] 01224 498200 ext 2410
[email protected] 01224 498200 ext 2411