Embed Size (px)
Citation preview
Coorong LAP Meningie soil health field day 1
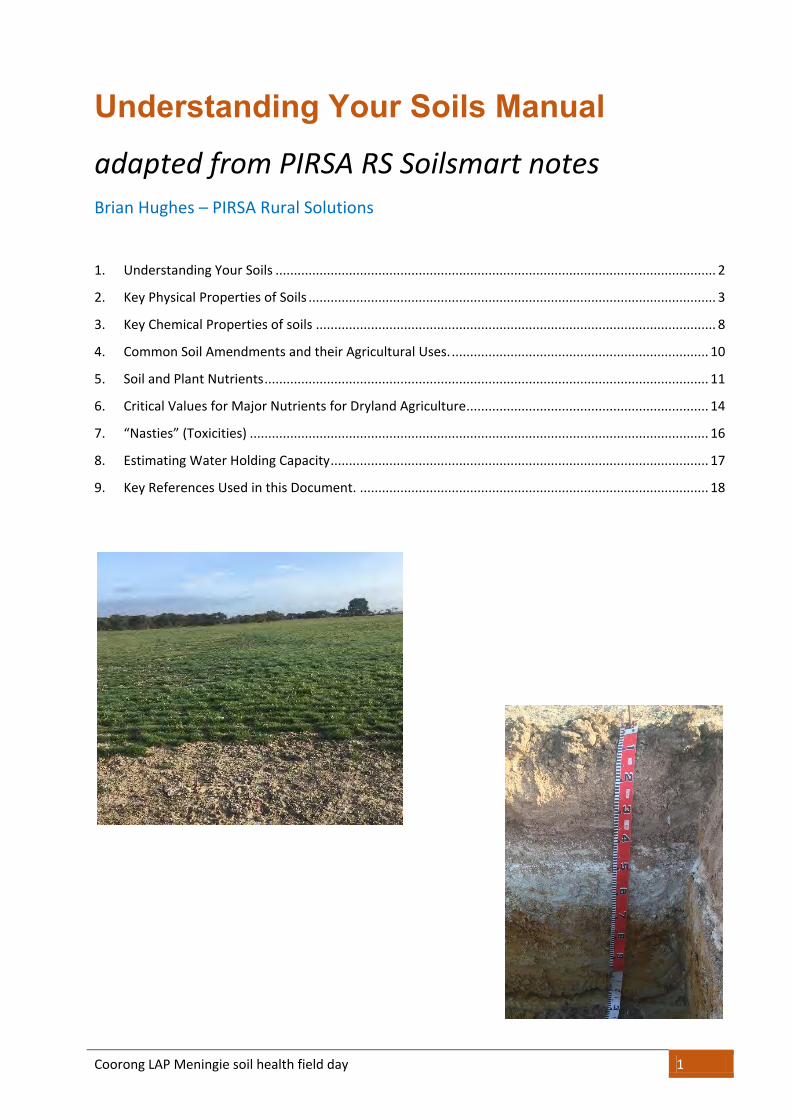
Understanding Your Soils Manual adapted from PIRSA RS Soilsmart notes Brian Hughes – PIRSA Rural Solutions
1. Understanding Your Soils ........................................................................................................................ 2
2. Key Physical Properties of Soils ............................................................................................................... 3
3. Key Chemical Properties of soils ............................................................................................................. 8
4. Common Soil Amendments and their Agricultural Uses. ...................................................................... 10
5. Soil and Plant Nutrients ......................................................................................................................... 11
6. Critical Values for Major Nutrients for Dryland Agriculture.................................................................. 14
7. “Nasties” (Toxicities) ............................................................................................................................. 16
8. Estimating Water Holding Capacity ....................................................................................................... 17
9. Key References Used in this Document. ............................................................................................... 18
Coorong LAP Meningie soil health field day 2
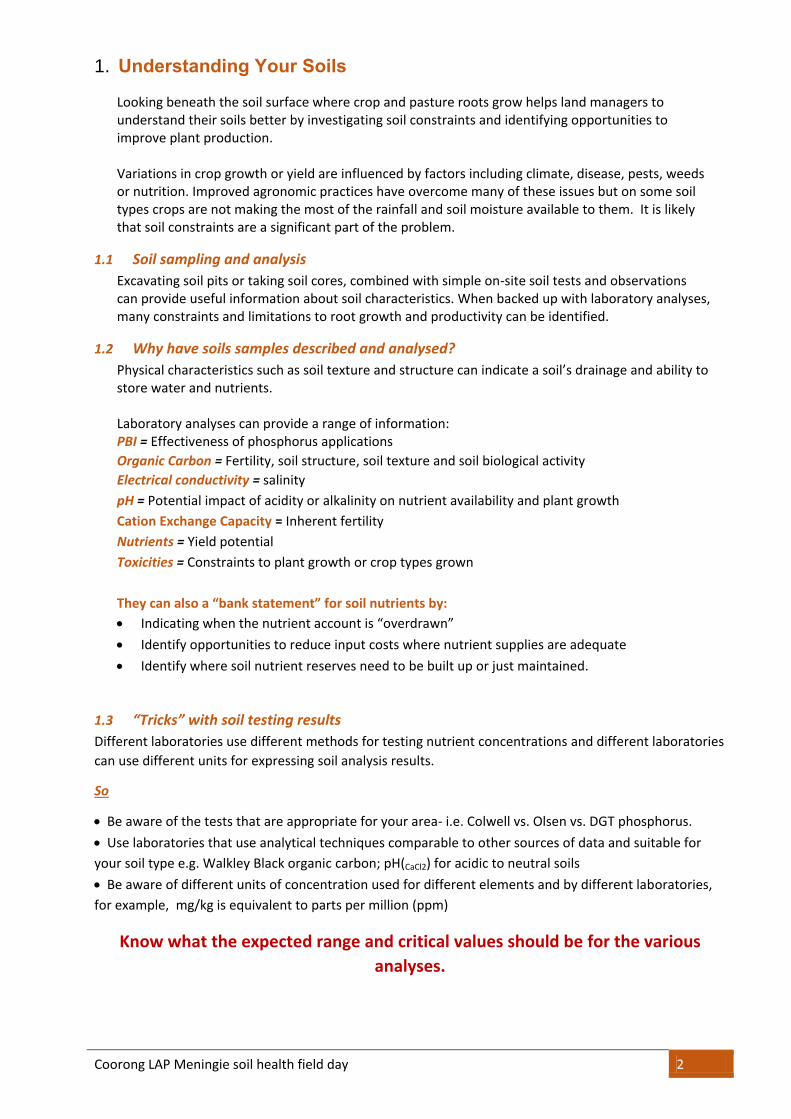
1. Understanding Your Soils
Looking beneath the soil surface where crop and pasture roots grow helps land managers to understand their soils better by investigating soil constraints and identifying opportunities to improve plant production. Variations in crop growth or yield are influenced by factors including climate, disease, pests, weeds or nutrition. Improved agronomic practices have overcome many of these issues but on some soil types crops are not making the most of the rainfall and soil moisture available to them. It is likely that soil constraints are a significant part of the problem.
1.1 Soil sampling and analysis
Excavating soil pits or taking soil cores, combined with simple on-site soil tests and observations can provide useful information about soil characteristics. When backed up with laboratory analyses, many constraints and limitations to root growth and productivity can be identified.
1.2 Why have soils samples described and analysed?
Physical characteristics such as soil texture and structure can indicate a soil’s drainage and ability to store water and nutrients. Laboratory analyses can provide a range of information: PBI = Effectiveness of phosphorus applications
Organic Carbon = Fertility, soil structure, soil texture and soil biological activity
Electrical conductivity = salinity
pH = Potential impact of acidity or alkalinity on nutrient availability and plant growth
Cation Exchange Capacity = Inherent fertility
Nutrients = Yield potential
Toxicities = Constraints to plant growth or crop types grown
They can also a “bank statement” for soil nutrients by:
Indicating when the nutrient account is “overdrawn”
Identify opportunities to reduce input costs where nutrient supplies are adequate
Identify where soil nutrient reserves need to be built up or just maintained.
1.3 “Tricks” with soil testing results
Different laboratories use different methods for testing nutrient concentrations and different laboratories
can use different units for expressing soil analysis results.
So
Be aware of the tests that are appropriate for your area- i.e. Colwell vs. Olsen vs. DGT phosphorus.
Use laboratories that use analytical techniques comparable to other sources of data and suitable for
your soil type e.g. Walkley Black organic carbon; pH(CaCl2) for acidic to neutral soils
Be aware of different units of concentration used for different elements and by different laboratories,
for example, mg/kg is equivalent to parts per million (ppm)
Know what the expected range and critical values should be for the various
analyses.
Coorong LAP Meningie soil health field day 3
2. Key Physical Properties of Soils
2.1 Structure
Soil structure refers to the way soil particles are arranged together and interconnected. Well-structured
soils enable better infiltration of rainfall, drainage and root growth. Poorly-structured soils can be subject
to waterlogging, erosion and compaction.
Hard-setting and Surface Sealing
Hard-setting soil can be caused by either lack of organic matter, sodicity, compaction or the proportions
of sand to clay in the soil. A simple but reasonably objective test to measure soil strength is to try to insert
a 300mm length of 2.4mm welding rod into the soil. If the rod can be pushed through the soil with an
open palm, strength is less than 1Mpa and root growth is unimpeded. If the rod can be inserted using a
coin to protect the palm, strength is between 1 and 3 MPa, meaning root growth is likely to be partly
restricted. Above 3Mpa, root growth is largely restricted to old root channels and cracks. This test is
highly moisture dependent, so should be done when root growth is critical (e.g. at emergence, initiation
of tillering and completion of tillering).
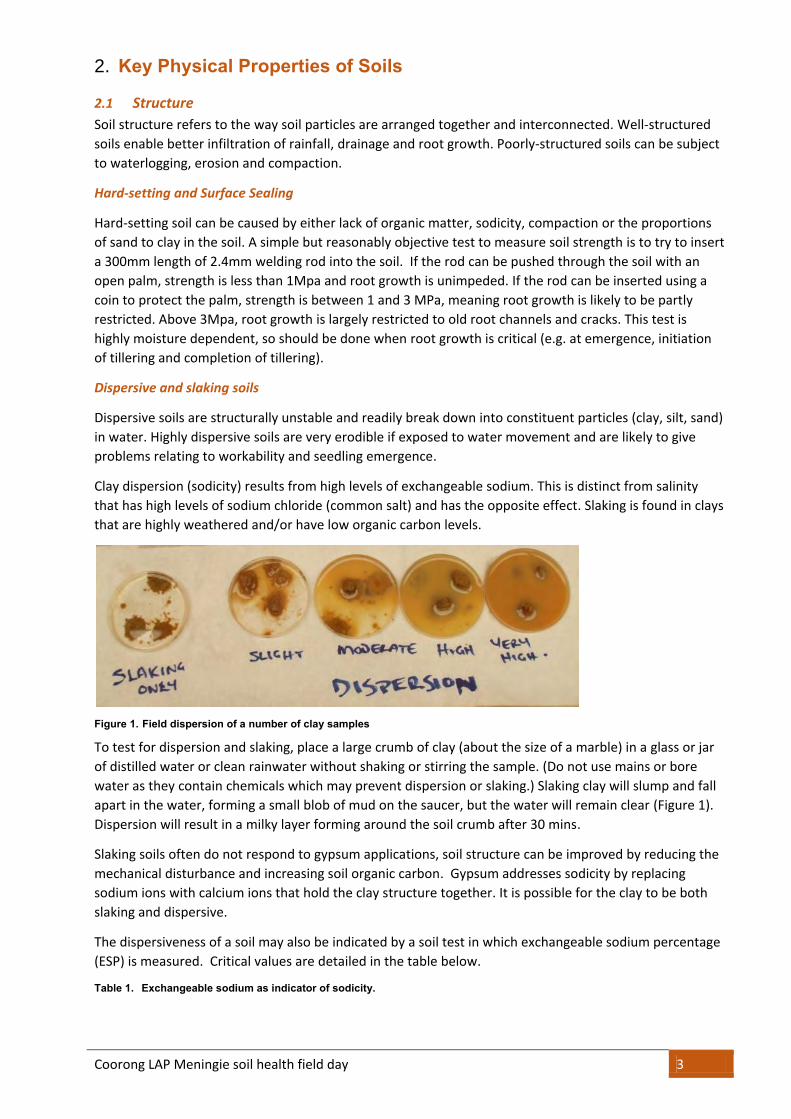
Dispersive and slaking soils
Dispersive soils are structurally unstable and readily break down into constituent particles (clay, silt, sand)
in water. Highly dispersive soils are very erodible if exposed to water movement and are likely to give
problems relating to workability and seedling emergence.
Clay dispersion (sodicity) results from high levels of exchangeable sodium. This is distinct from salinity
that has high levels of sodium chloride (common salt) and has the opposite effect. Slaking is found in clays
that are highly weathered and/or have low organic carbon levels.
Figure 1. Field dispersion of a number of clay samples
To test for dispersion and slaking, place a large crumb of clay (about the size of a marble) in a glass or jar
of distilled water or clean rainwater without shaking or stirring the sample. (Do not use mains or bore
water as they contain chemicals which may prevent dispersion or slaking.) Slaking clay will slump and fall
apart in the water, forming a small blob of mud on the saucer, but the water will remain clear (Figure 1).
Dispersion will result in a milky layer forming around the soil crumb after 30 mins.
Slaking soils often do not respond to gypsum applications, soil structure can be improved by reducing the
mechanical disturbance and increasing soil organic carbon. Gypsum addresses sodicity by replacing
sodium ions with calcium ions that hold the clay structure together. It is possible for the clay to be both
slaking and dispersive.
The dispersiveness of a soil may also be indicated by a soil test in which exchangeable sodium percentage
(ESP) is measured. Critical values are detailed in the table below.
Table 1. Exchangeable sodium as indicator of sodicity.

Coorong LAP Meningie soil health field day 4
NOTE: Depending on the laboratory used the exchangeable sodium percentage can be overestimated
where high levels of sodium chloride are present. Do not apply gypsum to saline soils as it is unlikely
sodium will be displaced and the high salinity is the main issue to be addressed.
NOTES:
Non sodic ESP < 6%
Sodic ESP 6-15%
Strongly Sodic ESP > 15%
Coorong LAP Meningie soil health field day 5
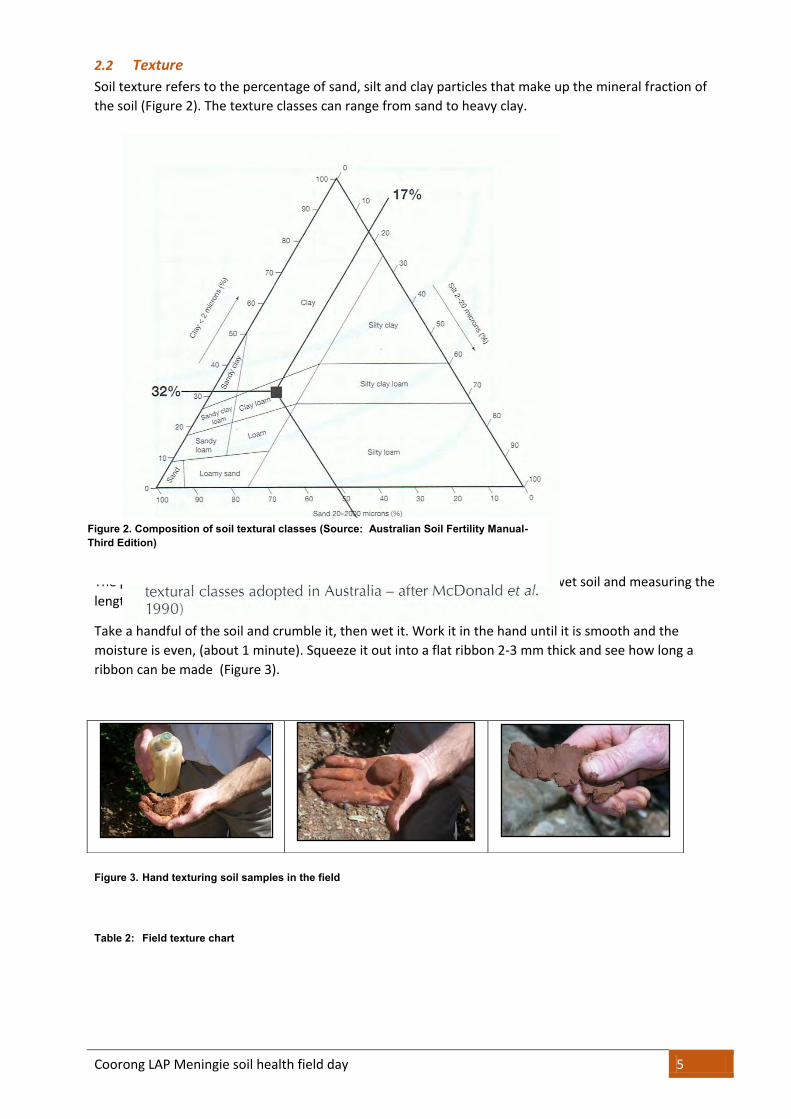
2.2 Texture
Soil texture refers to the percentage of sand, silt and clay particles that make up the mineral fraction of
the soil (Figure 2). The texture classes can range from sand to heavy clay.
Figure 2.
The percentage of clay in the soil can be estimated by making a ribbon of the wet soil and measuring the
length.
Take a handful of the soil and crumble it, then wet it. Work it in the hand until it is smooth and the
moisture is even, (about 1 minute). Squeeze it out into a flat ribbon 2-3 mm thick and see how long a
ribbon can be made (Figure 3).
Figure 3. Hand texturing soil samples in the field
Table 2: Field texture chart
Figure 2. Composition of soil textural classes (Source: Australian Soil Fertility Manual-
Third Edition)
Coorong LAP Meningie soil health field day 6
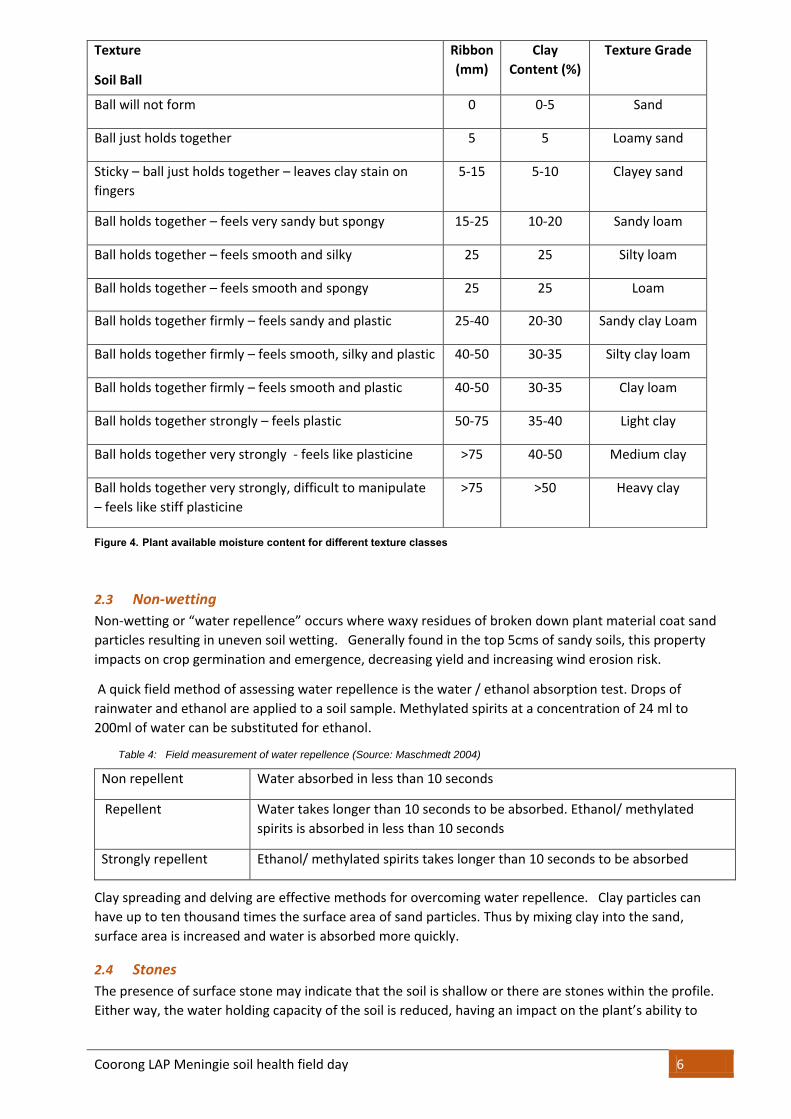
Figure 4. Plant available moisture content for different texture classes
2.3 Non-wetting
Non-wetting or “water repellence” occurs where waxy residues of broken down plant material coat sand
particles resulting in uneven soil wetting. Generally found in the top 5cms of sandy soils, this property
impacts on crop germination and emergence, decreasing yield and increasing wind erosion risk.
A quick field method of assessing water repellence is the water / ethanol absorption test. Drops of
rainwater and ethanol are applied to a soil sample. Methylated spirits at a concentration of 24 ml to
200ml of water can be substituted for ethanol.
Table 4: Field measurement of water repellence (Source: Maschmedt 2004)
Non repellent Water absorbed in less than 10 seconds
Repellent Water takes longer than 10 seconds to be absorbed. Ethanol/ methylated
spirits is absorbed in less than 10 seconds
Strongly repellent Ethanol/ methylated spirits takes longer than 10 seconds to be absorbed
Clay spreading and delving are effective methods for overcoming water repellence. Clay particles can
have up to ten thousand times the surface area of sand particles. Thus by mixing clay into the sand,
surface area is increased and water is absorbed more quickly.
2.4 Stones
The presence of surface stone may indicate that the soil is shallow or there are stones within the profile.
Either way, the water holding capacity of the soil is reduced, having an impact on the plant’s ability to
Texture
Soil Ball
Ribbon
(mm)
Clay
Content (%)
Texture Grade
Ball will not form 0 0-5 Sand
Ball just holds together 5 5 Loamy sand
Sticky – ball just holds together – leaves clay stain on
fingers
5-15 5-10 Clayey sand
Ball holds together – feels very sandy but spongy 15-25 10-20 Sandy loam
Ball holds together – feels smooth and silky 25 25 Silty loam
Ball holds together – feels smooth and spongy 25 25 Loam
Ball holds together firmly – feels sandy and plastic 25-40 20-30 Sandy clay Loam
Ball holds together firmly – feels smooth, silky and plastic 40-50 30-35 Silty clay loam
Ball holds together firmly – feels smooth and plastic 40-50 30-35 Clay loam
Ball holds together strongly – feels plastic 50-75 35-40 Light clay
Ball holds together very strongly - feels like plasticine >75 40-50 Medium clay
Ball holds together very strongly, difficult to manipulate
– feels like stiff plasticine
>75 >50 Heavy clay
Coorong LAP Meningie soil health field day 7
finish satisfactorily. Surface stone can damage and abrade equipment, and in severe stony conditions,
stone picking or rolling may be necessary. The type of stone can provide an indicator of soil
characteristics, for example, limestone (calcrete) is often linked to calcareous soil types that have nutrient
deficiencies and limit crop choice.
2.5 Colour
When soil pits are dug, the layers or horizons are often differentiated by colour. The colour of the soil is
an indicator of soil condition and potential rooting depth.
Soils with bright colours (particularly red) indicate they are well aerated and moderately well
drained. Darker coloured surface soils indicate high organic carbon levels and are often more
fertile. Reddish soils can often indicate the presence of iron.
Clayey soils that are grey with orange and yellow mottles and often a light bleached layer above
the clay indicate poor drainage. Anaerobic conditions during waterlogged periods or leaching of
elements change the colour of the soil.
Lighter pale red or off-white colours down the profile and into the sub-soil may be related to the
presence of soil carbonates (lime), either as soft, fine earth carbonate or rubble.
On sandy soils there can often be a lighter coloured (bleached) layer below the darker organic
surface layer. This can indicate leaching of organic matter and nutrients through the profile.
Coorong LAP Meningie soil health field day 8
3. Key Chemical Properties of soils
3.1 Soil pH and carbonates
3.1.1 Soil pH
The pH of a soil indicates whether it is acid or alkaline which in turn provides an indication of nutrient
availability. Soil pH can also affect the way in which agricultural fertilisers and herbicides react in the soil
for example, sulfonylurea herbicides break down very slowly in alkaline soils compared to neutral or
acidic soils. A field pH reading can provide an guide to a soil’s acidity or alkalinity. Most agricultural plants
prefer a pH of 6 – 8.5 (water).
Testing pH in the field
A field pH test kit (Figure 5) gives a reasonably accurate (within 0.5 pH units) measurement to a
laboratory pH(water) value but is likely to be between 0.5 and 1 unit higher than the laboratory pH(CaCl2)
value. Kits are available in most hardware or garden stores, and will do up to 100 tests.
Figure 5. Some commonly available pH field test kits
When using one of these kits, put some soil on the plastic card provided. Drop some indicator solution on
the soil, mix it in then puff a little bit of the white powder onto it. The powder changes colour. Compare
this colour to that on the pH card provided in the kit.
Interpreting pH results
pH test results from a laboratory will usually come back with two results: pH in water (pHH20) and a
reading where a salt (calcium chloride) has been added to the soil solution (pHCaCl2). Measurement of soil
pH is highly dependent upon soil moisture content and the pH(water) value will fluctuate depending on
seasonal conditions. The addition of Calcium chloride to the soil solution can help reduce the variation in
measurement and as such is a more accurate indication of the “true” pH of the soil. pH(CaCl2) values are
usually 0.5 to 1.0 units lower than pH(water)
The pH scale ranges from 1 to 14 and is a measure of hydrogen ions in the soil – the more hydrogen the
greater the acidity. Low pH values have high levels of hydrogen ions and are considered acid. High pH
values reflect low levels of hydrogen ions and are alkaline (Table 5).
High pH levels (greater than 8.3) indicate the presence of toxicities such as sodium bicarbonate. Sodium is
often associated with boron, so clays with a very high pH can be high in lime, salinity and boron.
NOTES:
Coorong LAP Meningie soil health field day 9
3.1.2 Carbonates (Fizz Test)
Carbonates are a group of compounds that include calcium (lime, calcrete) and magnesium carbonates
(dolomite). High carbonate levels affect soil pH and can “tie up” nutrients such as described earlier. The
presence of soft carbonates indicates the depth of the wetting front over a very long (geologic) time.
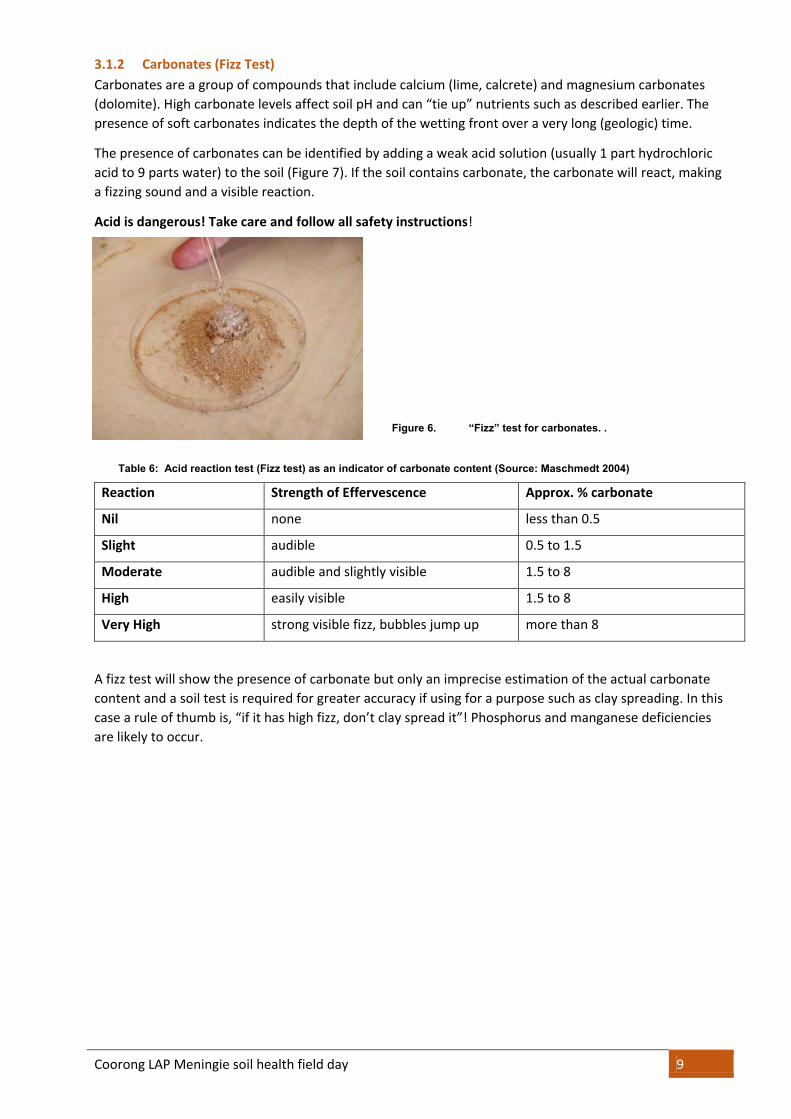
The presence of carbonates can be identified by adding a weak acid solution (usually 1 part hydrochloric
acid to 9 parts water) to the soil (Figure 7). If the soil contains carbonate, the carbonate will react, making
a fizzing sound and a visible reaction.
Acid is dangerous! Take care and follow all safety instructions!
Figure 6. “Fizz” test for carbonates. .
Table 6: Acid reaction test (Fizz test) as an indicator of carbonate content (Source: Maschmedt 2004)
Reaction Strength of Effervescence Approx. % carbonate
Nil none less than 0.5
Slight audible 0.5 to 1.5
Moderate audible and slightly visible 1.5 to 8
High easily visible 1.5 to 8
Very High strong visible fizz, bubbles jump up more than 8
A fizz test will show the presence of carbonate but only an imprecise estimation of the actual carbonate
content and a soil test is required for greater accuracy if using for a purpose such as clay spreading. In this
case a rule of thumb is, “if it has high fizz, don’t clay spread it”! Phosphorus and manganese deficiencies
are likely to occur.
Coorong LAP Meningie soil health field day 10
3.2 Organic Carbon (%)
Organic carbon supports provides a food source for soil biology, aids in improving soil structure, water
holding capacity and nutrient retention. High organic carbon levels are generally favourable however, can
also indicate low levels of biological activity due to acidity or waterlogging.
There are several methods for measuring organic carbon. Some methods also measure inorganic carbon
such as found in lime and for this reason the most common analysis used in South Australia is the
Walkley/Black method.
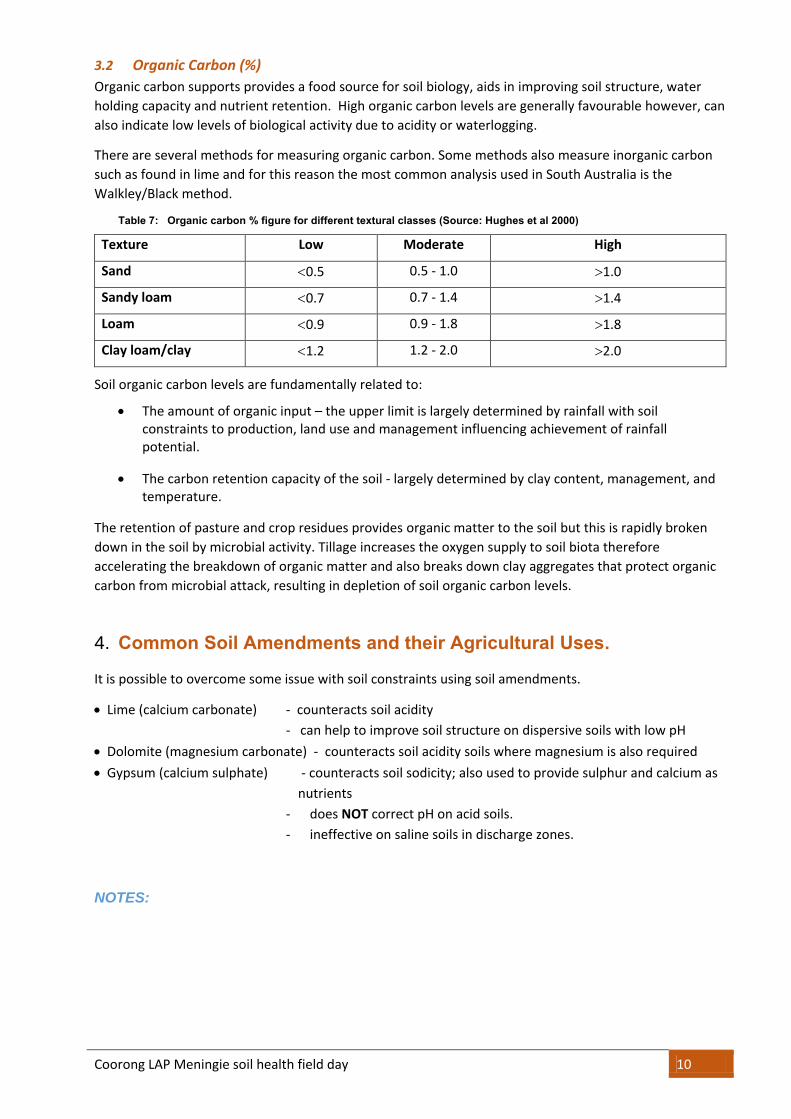
Table 7: Organic carbon % figure for different textural classes (Source: Hughes et al 2000)
Texture Low Moderate High
Sand 0.5 0.5 - 1.0 1.0
Sandy loam 0.7 0.7 - 1.4 1.4
Loam 0.9 0.9 - 1.8 1.8
Clay loam/clay 1.2 1.2 - 2.0 2.0
Soil organic carbon levels are fundamentally related to:
The amount of organic input – the upper limit is largely determined by rainfall with soil constraints to production, land use and management influencing achievement of rainfall potential.
The carbon retention capacity of the soil - largely determined by clay content, management, and temperature.
The retention of pasture and crop residues provides organic matter to the soil but this is rapidly broken
down in the soil by microbial activity. Tillage increases the oxygen supply to soil biota therefore
accelerating the breakdown of organic matter and also breaks down clay aggregates that protect organic
carbon from microbial attack, resulting in depletion of soil organic carbon levels.
4. Common Soil Amendments and their Agricultural Uses.
It is possible to overcome some issue with soil constraints using soil amendments.
Lime (calcium carbonate) - counteracts soil acidity
- can help to improve soil structure on dispersive soils with low pH
Dolomite (magnesium carbonate) - counteracts soil acidity soils where magnesium is also required
Gypsum (calcium sulphate) - counteracts soil sodicity; also used to provide sulphur and calcium as
nutrients
- does NOT correct pH on acid soils.
- ineffective on saline soils in discharge zones.
NOTES:
Coorong LAP Meningie soil health field day 11
5. Soil and Plant Nutrients
5.1 Major and Minor (Trace) Elements
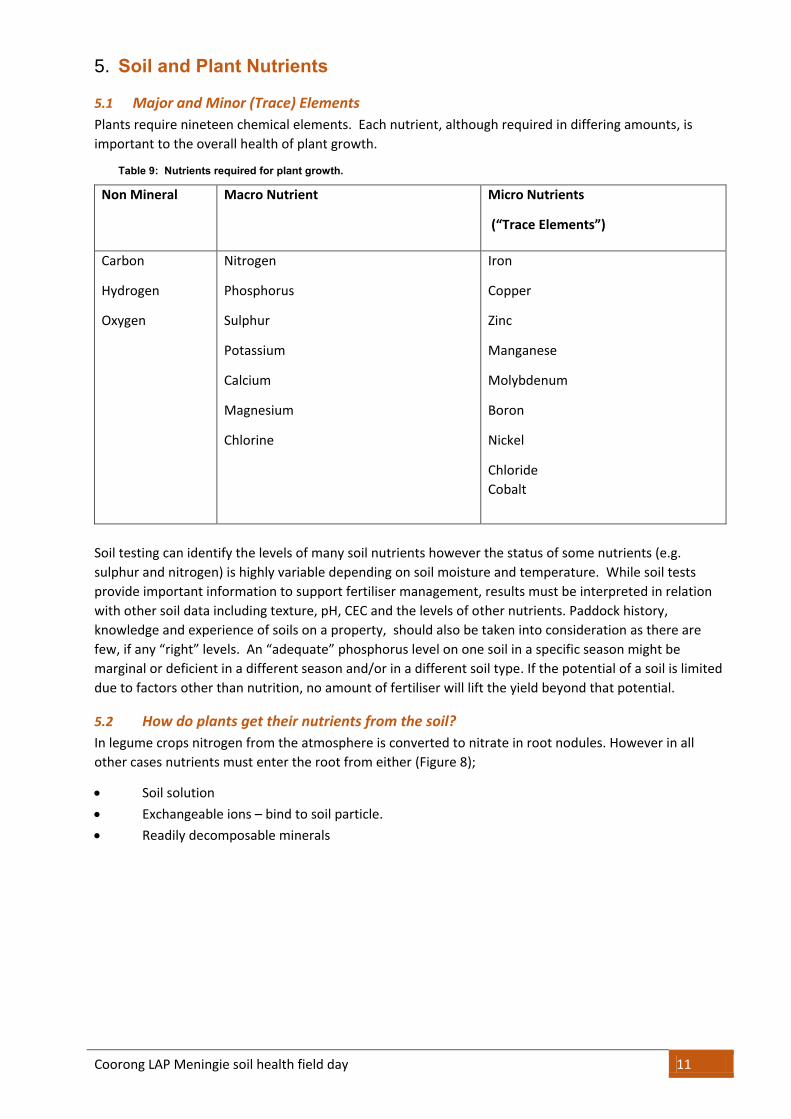
Plants require nineteen chemical elements. Each nutrient, although required in differing amounts, is
important to the overall health of plant growth.
Table 9: Nutrients required for plant growth.
Non Mineral
Macro Nutrient Micro Nutrients
(“Trace Elements”)
Carbon
Hydrogen
Oxygen
Nitrogen
Phosphorus
Sulphur
Potassium
Calcium
Magnesium
Chlorine
Iron
Copper
Zinc
Manganese
Molybdenum
Boron
Nickel
Chloride
Cobalt
Soil testing can identify the levels of many soil nutrients however the status of some nutrients (e.g.
sulphur and nitrogen) is highly variable depending on soil moisture and temperature. While soil tests
provide important information to support fertiliser management, results must be interpreted in relation
with other soil data including texture, pH, CEC and the levels of other nutrients. Paddock history,
knowledge and experience of soils on a property, should also be taken into consideration as there are
few, if any “right” levels. An “adequate” phosphorus level on one soil in a specific season might be
marginal or deficient in a different season and/or in a different soil type. If the potential of a soil is limited
due to factors other than nutrition, no amount of fertiliser will lift the yield beyond that potential.
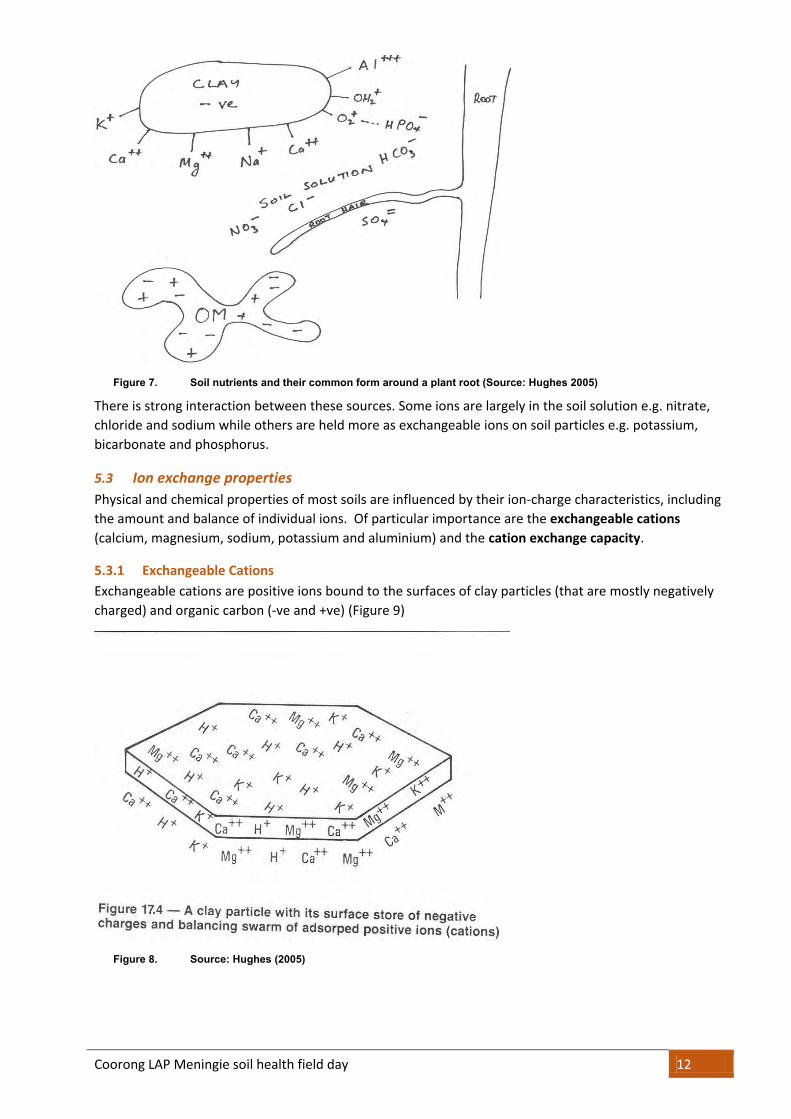
5.2 How do plants get their nutrients from the soil?
In legume crops nitrogen from the atmosphere is converted to nitrate in root nodules. However in all
other cases nutrients must enter the root from either (Figure 8);
Soil solution
Exchangeable ions – bind to soil particle.
Readily decomposable minerals
Coorong LAP Meningie soil health field day 12
Figure 7. Soil nutrients and their common form around a plant root (Source: Hughes 2005)
There is strong interaction between these sources. Some ions are largely in the soil solution e.g. nitrate,
chloride and sodium while others are held more as exchangeable ions on soil particles e.g. potassium,
bicarbonate and phosphorus.
5.3 Ion exchange properties
Physical and chemical properties of most soils are influenced by their ion-charge characteristics, including
the amount and balance of individual ions. Of particular importance are the exchangeable cations
(calcium, magnesium, sodium, potassium and aluminium) and the cation exchange capacity.
5.3.1 Exchangeable Cations
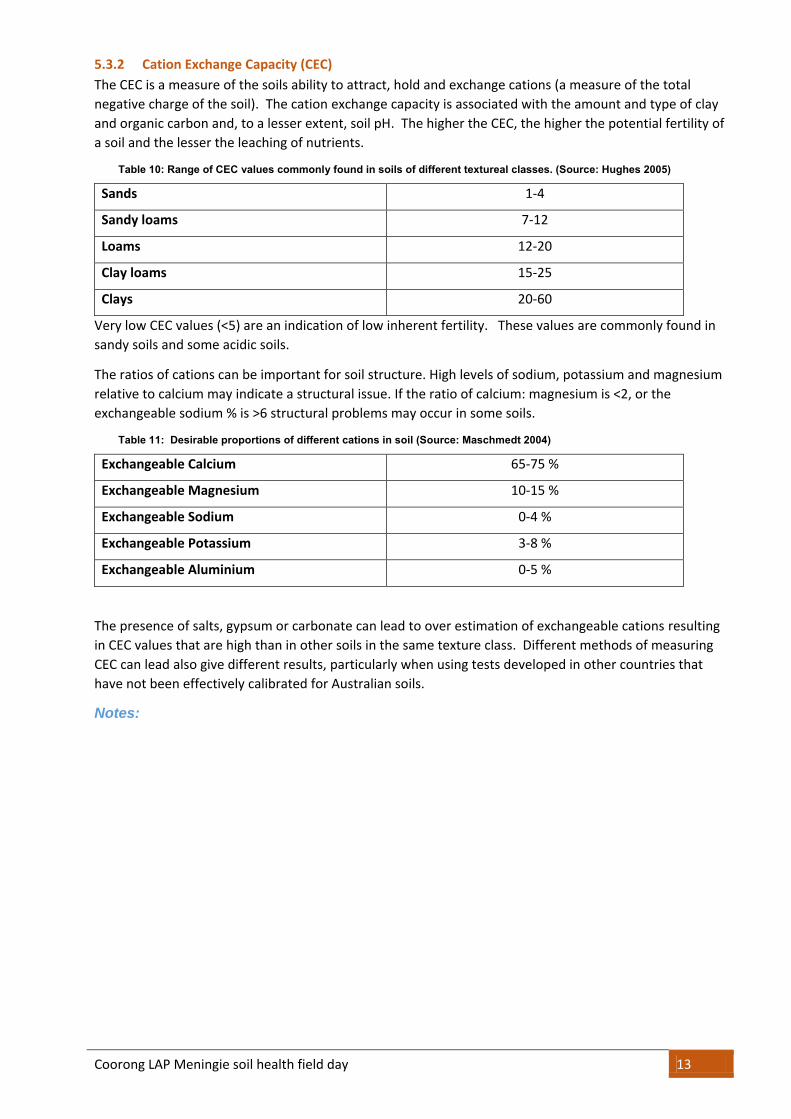
Exchangeable cations are positive ions bound to the surfaces of clay particles (that are mostly negatively
charged) and organic carbon (-ve and +ve) (Figure 9)
Figure 8. Source: Hughes (2005)
Coorong LAP Meningie soil health field day 13
5.3.2 Cation Exchange Capacity (CEC)
The CEC is a measure of the soils ability to attract, hold and exchange cations (a measure of the total
negative charge of the soil). The cation exchange capacity is associated with the amount and type of clay
and organic carbon and, to a lesser extent, soil pH. The higher the CEC, the higher the potential fertility of
a soil and the lesser the leaching of nutrients.
Table 10: Range of CEC values commonly found in soils of different textureal classes. (Source: Hughes 2005)
Sands 1-4
Sandy loams 7-12
Loams 12-20
Clay loams 15-25
Clays 20-60
Very low CEC values (<5) are an indication of low inherent fertility. These values are commonly found in
sandy soils and some acidic soils.
The ratios of cations can be important for soil structure. High levels of sodium, potassium and magnesium
relative to calcium may indicate a structural issue. If the ratio of calcium: magnesium is <2, or the
exchangeable sodium % is >6 structural problems may occur in some soils.
Table 11: Desirable proportions of different cations in soil (Source: Maschmedt 2004)
Exchangeable Calcium 65-75 %
Exchangeable Magnesium 10-15 %
Exchangeable Sodium 0-4 %
Exchangeable Potassium 3-8 %
Exchangeable Aluminium 0-5 %
The presence of salts, gypsum or carbonate can lead to over estimation of exchangeable cations resulting
in CEC values that are high than in other soils in the same texture class. Different methods of measuring
CEC can lead also give different results, particularly when using tests developed in other countries that
have not been effectively calibrated for Australian soils.
Notes:
Coorong LAP Meningie soil health field day 14
6. Critical Values for Major Nutrients for Dryland Agriculture
6.1 Colwell Phosphorus, Potassium and Sulphur
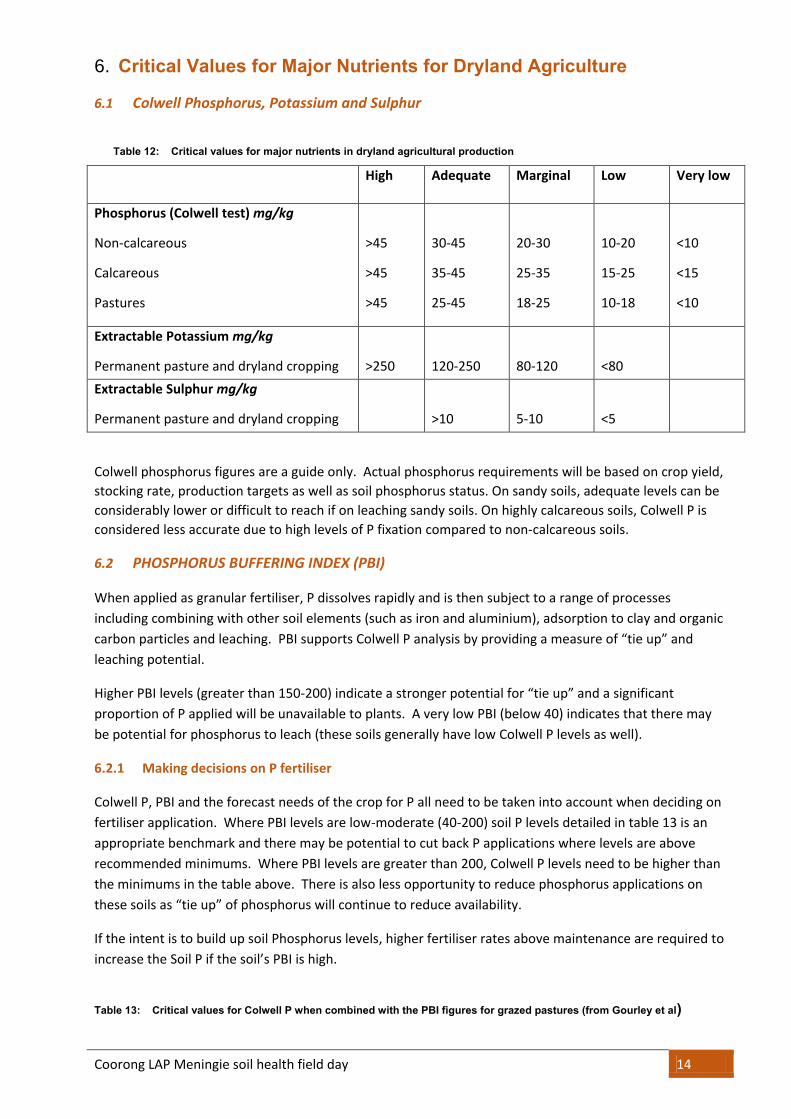
Table 12: Critical values for major nutrients in dryland agricultural production
High Adequate Marginal Low Very low
Phosphorus (Colwell test) mg/kg
Non-calcareous
Calcareous
Pastures
>45
>45
>45
30-45
35-45
25-45
20-30
25-35
18-25
10-20
15-25
10-18
<10
<15
<10
Extractable Potassium mg/kg
Permanent pasture and dryland cropping
>250
120-250
80-120
<80
Extractable Sulphur mg/kg
Permanent pasture and dryland cropping
>10
5-10
<5
Colwell phosphorus figures are a guide only. Actual phosphorus requirements will be based on crop yield,
stocking rate, production targets as well as soil phosphorus status. On sandy soils, adequate levels can be
considerably lower or difficult to reach if on leaching sandy soils. On highly calcareous soils, Colwell P is
considered less accurate due to high levels of P fixation compared to non-calcareous soils.
6.2 PHOSPHORUS BUFFERING INDEX (PBI)
When applied as granular fertiliser, P dissolves rapidly and is then subject to a range of processes
including combining with other soil elements (such as iron and aluminium), adsorption to clay and organic
carbon particles and leaching. PBI supports Colwell P analysis by providing a measure of “tie up” and
leaching potential.
Higher PBI levels (greater than 150-200) indicate a stronger potential for “tie up” and a significant
proportion of P applied will be unavailable to plants. A very low PBI (below 40) indicates that there may
be potential for phosphorus to leach (these soils generally have low Colwell P levels as well).
6.2.1 Making decisions on P fertiliser
Colwell P, PBI and the forecast needs of the crop for P all need to be taken into account when deciding on
fertiliser application. Where PBI levels are low-moderate (40-200) soil P levels detailed in table 13 is an
appropriate benchmark and there may be potential to cut back P applications where levels are above
recommended minimums. Where PBI levels are greater than 200, Colwell P levels need to be higher than
the minimums in the table above. There is also less opportunity to reduce phosphorus applications on
these soils as “tie up” of phosphorus will continue to reduce availability.
If the intent is to build up soil Phosphorus levels, higher fertiliser rates above maintenance are required to
increase the Soil P if the soil’s PBI is high.
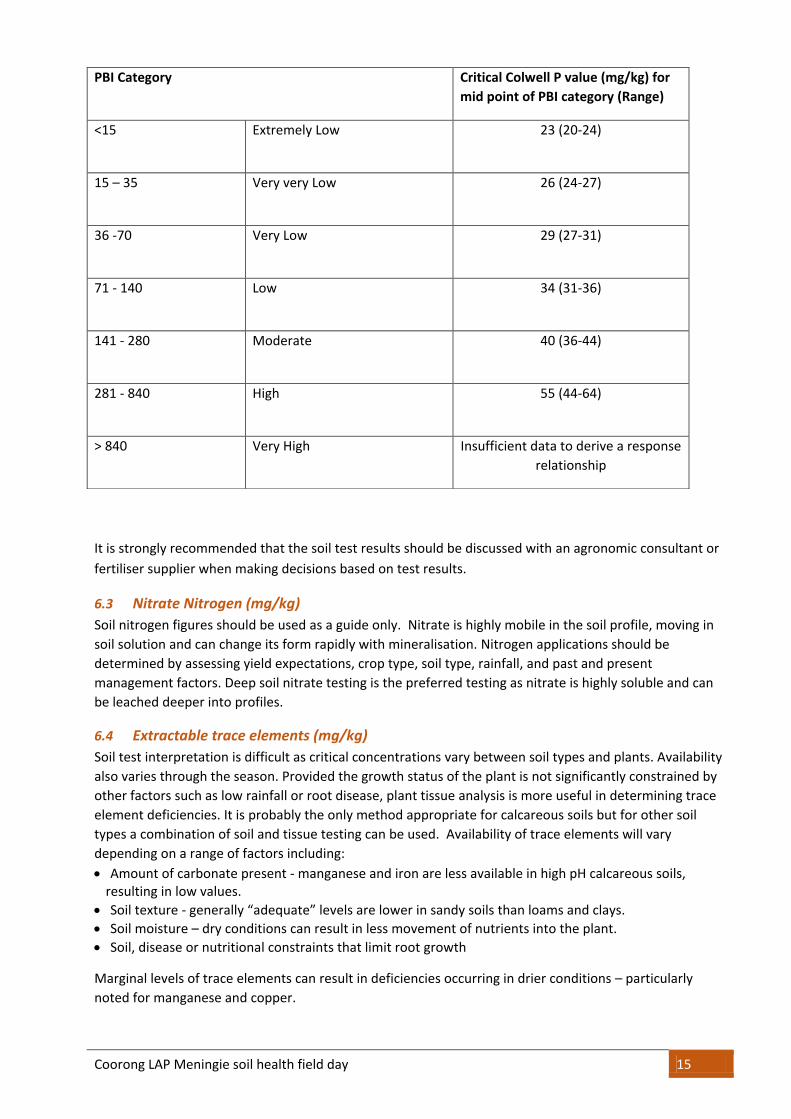
Table 13: Critical values for Colwell P when combined with the PBI figures for grazed pastures (from Gourley et al)
Coorong LAP Meningie soil health field day 15
It is strongly recommended that the soil test results should be discussed with an agronomic consultant or
fertiliser supplier when making decisions based on test results.
6.3 Nitrate Nitrogen (mg/kg)
Soil nitrogen figures should be used as a guide only. Nitrate is highly mobile in the soil profile, moving in
soil solution and can change its form rapidly with mineralisation. Nitrogen applications should be
determined by assessing yield expectations, crop type, soil type, rainfall, and past and present
management factors. Deep soil nitrate testing is the preferred testing as nitrate is highly soluble and can
be leached deeper into profiles.
6.4 Extractable trace elements (mg/kg)
Soil test interpretation is difficult as critical concentrations vary between soil types and plants. Availability
also varies through the season. Provided the growth status of the plant is not significantly constrained by
other factors such as low rainfall or root disease, plant tissue analysis is more useful in determining trace
element deficiencies. It is probably the only method appropriate for calcareous soils but for other soil
types a combination of soil and tissue testing can be used. Availability of trace elements will vary
depending on a range of factors including:
Amount of carbonate present - manganese and iron are less available in high pH calcareous soils, resulting in low values.
Soil texture - generally “adequate” levels are lower in sandy soils than loams and clays.
Soil moisture – dry conditions can result in less movement of nutrients into the plant.
Soil, disease or nutritional constraints that limit root growth
Marginal levels of trace elements can result in deficiencies occurring in drier conditions – particularly
noted for manganese and copper.
PBI Category Critical Colwell P value (mg/kg) for
mid point of PBI category (Range)
<15
Extremely Low 23 (20-24)
15 – 35
Very very Low 26 (24-27)
36 -70 Very Low 29 (27-31)
71 - 140 Low 34 (31-36)
141 - 280 Moderate 40 (36-44)
281 - 840 High 55 (44-64)
> 840 Very High Insufficient data to derive a response
relationship
Coorong LAP Meningie soil health field day 16
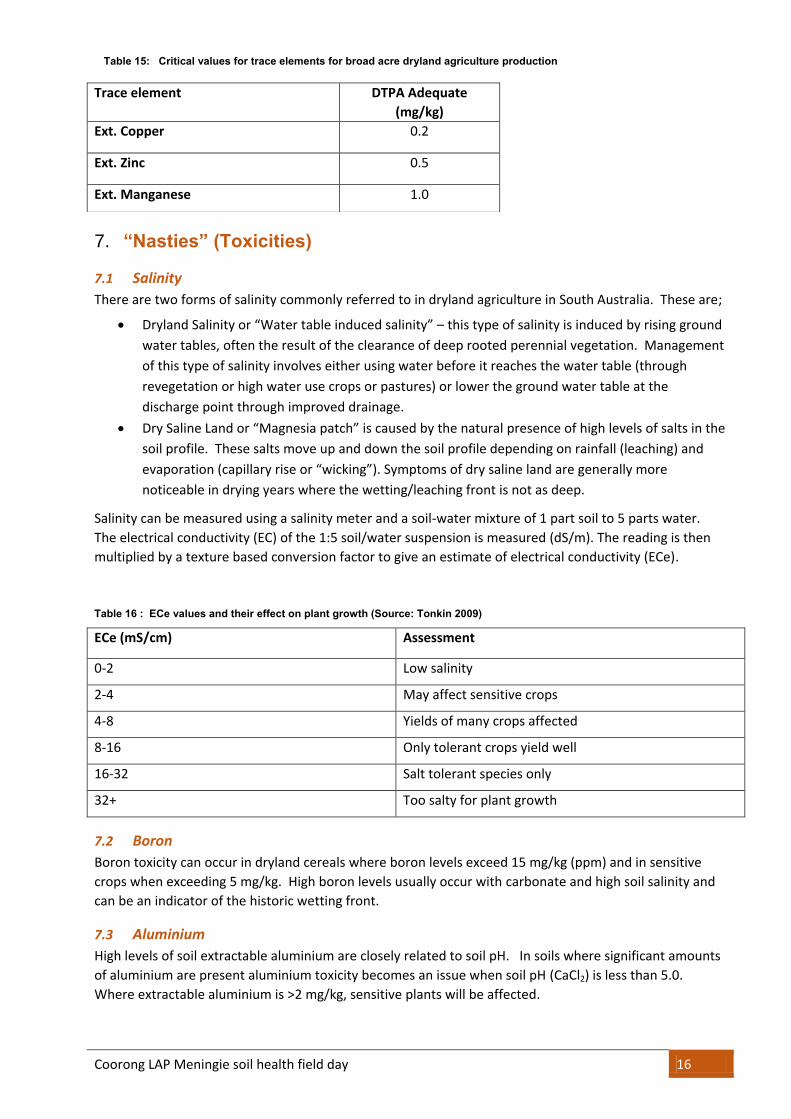
Table 15: Critical values for trace elements for broad acre dryland agriculture production
7. “Nasties” (Toxicities)
7.1 Salinity
There are two forms of salinity commonly referred to in dryland agriculture in South Australia. These are;
Dryland Salinity or “Water table induced salinity” – this type of salinity is induced by rising ground
water tables, often the result of the clearance of deep rooted perennial vegetation. Management
of this type of salinity involves either using water before it reaches the water table (through
revegetation or high water use crops or pastures) or lower the ground water table at the
discharge point through improved drainage.
Dry Saline Land or “Magnesia patch” is caused by the natural presence of high levels of salts in the
soil profile. These salts move up and down the soil profile depending on rainfall (leaching) and
evaporation (capillary rise or “wicking”). Symptoms of dry saline land are generally more
noticeable in drying years where the wetting/leaching front is not as deep.
Salinity can be measured using a salinity meter and a soil-water mixture of 1 part soil to 5 parts water.
The electrical conductivity (EC) of the 1:5 soil/water suspension is measured (dS/m). The reading is then
multiplied by a texture based conversion factor to give an estimate of electrical conductivity (ECe).
Table 16 : ECe values and their effect on plant growth (Source: Tonkin 2009)
ECe (mS/cm) Assessment
0-2 Low salinity
2-4 May affect sensitive crops
4-8 Yields of many crops affected
8-16 Only tolerant crops yield well
16-32 Salt tolerant species only
32+ Too salty for plant growth
7.2 Boron
Boron toxicity can occur in dryland cereals where boron levels exceed 15 mg/kg (ppm) and in sensitive
crops when exceeding 5 mg/kg. High boron levels usually occur with carbonate and high soil salinity and
can be an indicator of the historic wetting front.
7.3 Aluminium
High levels of soil extractable aluminium are closely related to soil pH. In soils where significant amounts
of aluminium are present aluminium toxicity becomes an issue when soil pH (CaCl2) is less than 5.0.
Where extractable aluminium is >2 mg/kg, sensitive plants will be affected.
Trace element DTPA Adequate
(mg/kg)
Ext. Copper 0.2
Ext. Zinc 0.5
Ext. Manganese 1.0
Coorong LAP Meningie soil health field day 17
7.4 Chloride
High levels of chloride are an indicator of salinity. Generally plant damage can occur where chloride
levels are in the range 120 mg/kg for sands to 300 mg/kg for clays.
Estimating Water Holding Capacity
The amount of water stored in the soil profile can be estimated by the depth of the rooting zone and the
textures of the layers of soil in that rooting zone.
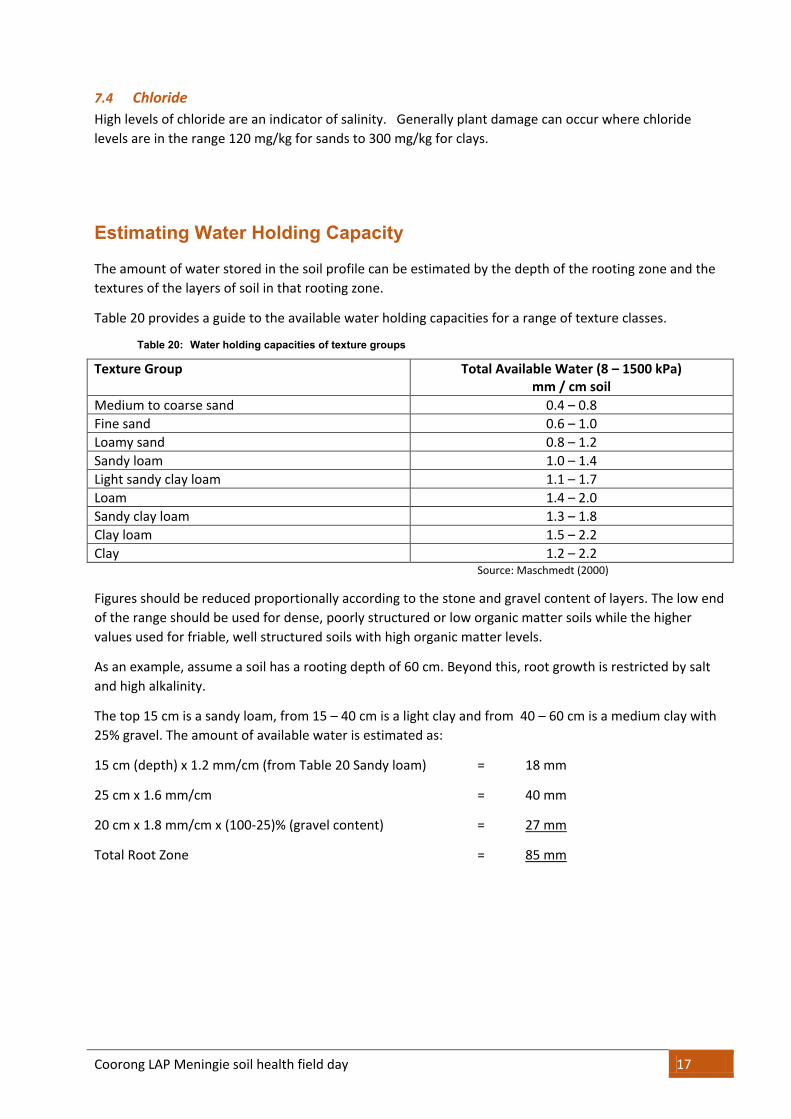
Table 20 provides a guide to the available water holding capacities for a range of texture classes.
Table 20: Water holding capacities of texture groups
Texture Group Total Available Water (8 – 1500 kPa) mm / cm soil
Medium to coarse sand 0.4 – 0.8
Fine sand 0.6 – 1.0
Loamy sand 0.8 – 1.2
Sandy loam 1.0 – 1.4
Light sandy clay loam 1.1 – 1.7
Loam 1.4 – 2.0
Sandy clay loam 1.3 – 1.8
Clay loam 1.5 – 2.2
Clay 1.2 – 2.2 Source: Maschmedt (2000)
Figures should be reduced proportionally according to the stone and gravel content of layers. The low end
of the range should be used for dense, poorly structured or low organic matter soils while the higher
values used for friable, well structured soils with high organic matter levels.
As an example, assume a soil has a rooting depth of 60 cm. Beyond this, root growth is restricted by salt
and high alkalinity.
The top 15 cm is a sandy loam, from 15 – 40 cm is a light clay and from 40 – 60 cm is a medium clay with
25% gravel. The amount of available water is estimated as:
15 cm (depth) x 1.2 mm/cm (from Table 20 Sandy loam) = 18 mm
25 cm x 1.6 mm/cm = 40 mm
20 cm x 1.8 mm/cm x (100-25)% (gravel content) = 27 mm
Total Root Zone = 85 mm

Coorong LAP Meningie soil health field day 18
8. Key References Used in this Document.
Gourley, C., Melland, A., Waller, R., Awty, I., Smith, A., Peverill, K. and Hannah, M. (2007) Making Better Fertiliser Decisions for Grazed Pastures in Australia, DPI Victoria
Forward, G. (2011) Soil erosion protection field survey manual. DEWR
Hazelton, P and Murphy, B (2007) Interpreting Soil Test Results- What do all the Numbers mean? NSW Department of Natural Resources.
Hughes, B., Jacka, J., Lewis, D. and Prance T. (2000) Soil test methods and guidelines for interpretation of soil test results, PIRSA Rural Solutions.
Hughes. B (2005) Understanding plant nutrients – Workshop notes
Maschmedt, D. (2000) Assessing Agricultural Land PIRSA Land Information
Maschmedt, D (2004) Describing and interpreting soil profiles. DWLBC Soil and Land Information
Price. G (2006) Australian Soil Fertility Manual (Third Edition), Australian Fertiliser Federation and CSIRO
Tonkin. R (2009) Simple soil tests for the paddock – Karoonda Clay Spreading and Delving Field Day Notes