Embed Size (px)
Citation preview

I N S T I T U T E O F W A T E R A C O U S T I C S,
S O N A R E N G I N E E R I N G A N DS I G N A L T H E O R Y
Chapter 4 / Sonar Signal Processing / Prof. Dr.-Ing. Dieter Kraus 1
Underwater Acoustics and Sonar Signal Processing
Contents1 Fundamentals of Ocean Acoustics2 Sound Propagation Modeling3 Sonar Antenna Design4 Sonar Signal Processing5 Array Processing
I N S T I T U T E O F W A T E R A C O U S T I C S,
S O N A R E N G I N E E R I N G A N DS I G N A L T H E O R Y
Chapter 4 / Sonar Signal Processing / Prof. Dr.-Ing. Dieter Kraus 2
4 Sonar Signal Processing4.1 IntroductionThe following diagram summarizes the components usually employed in Sonar systems for sound transmission.
• Waveform Generator- CW (continuous waveforms), e.g.
sinusoidal pulse with rectangular or Gaussian envelope
- FM (frequency modulated) waveforms, e.g. linear FM (LFM), hyperbolic (HFM), Doppler sensitive (DFM)
Waveform Generator
ArrayShading
Power Amplifier
1 K K
1
2
M
O
O
O
Transmitter ArrayK M, typical K = M/2

I N S T I T U T E O F W A T E R A C O U S T I C S,
S O N A R E N G I N E E R I N G A N DS I G N A L T H E O R Y
Chapter 4 / Sonar Signal Processing / Prof. Dr.-Ing. Dieter Kraus 3
• Array Shading- Amplitude shading for side-lobe suppression
- Complex shading (amplitude shading and phase shifting / time
delays) for main-lobe steering, shaping and broadening
• Power Amplifier / Impedance Matching- Switching amplifiers to achieve high source levels
- Linear amplifiers if moderate source levels are sufficient but an enhanced coherence of consecutive pulses is required, e.g. as in synthetic aperture sonar SAS applications
- Impedance matching networks that supplies an optimal coupling of the amplifiers to the transducers
The receiver electronic measuring and information processing chain consists of the following components.
I N S T I T U T E O F W A T E R A C O U S T I C S,
S O N A R E N G I N E E R I N G A N DS I G N A L T H E O R Y
Chapter 4 / Sonar Signal Processing / Prof. Dr.-Ing. Dieter Kraus 4
• Signal Conditioning- Preamplifier and Band Pass Filter- Automatic Gain Control (AGC) and/or (Adaptive) Time
variable Gain ((A)TVG)- Quadrature Demodulation (analog or digitally) - Anti-aliasing Filter and Analog-to-Digital Conversion with
16 up to 24 bits.
• Signal Processing- Matched Filtering / Pulse Compression
1
2
N
O
O
O
ReceiverArray
SignalConditioning
N Signal
Processing
N InformationProcessing
L Display
Processing

I N S T I T U T E O F W A T E R A C O U S T I C S,
S O N A R E N G I N E E R I N G A N DS I G N A L T H E O R Y
Chapter 4 / Sonar Signal Processing / Prof. Dr.-Ing. Dieter Kraus 5
- Conventional motion compensated near and far field beam-forming in time or frequency domain
- Synthetic aperture beamforming including micro-navigation and auto-focusing
- High resolution source localization techniques (MVDR, MUSIC, ESPRIT, etc.)
• Information Processing- Image Formation (range decimation, azimuth decimation and
interpolation, geo-coding) - Image Fusion (multi-ping and/or multi-aspect mode)- Computer aided detection and classification (CAD and CAC)
of Targets (semi-automatic for aiding an Operator or fully automatic for autonomous operations).
• Display Processing
I N S T I T U T E O F W A T E R A C O U S T I C S,
S O N A R E N G I N E E R I N G A N DS I G N A L T H E O R Y
Chapter 4 / Sonar Signal Processing / Prof. Dr.-Ing. Dieter Kraus 6
4.2 Matched Filtering4.2.1 Matched Filtering for Band Pass Signals
A typical Transmission/Reception Scenario is depicted below,
( )s t
( )
( ) ( ) ( ) ( )
n t
e a rx t s t n t n t
Receiver Array
Waveform Generator
ArrayShading
Power Amplifier
O
O
O
ReceiverFiltering
Signal Con-ditioning
O
O
O
r
Transmitter Array
( )y t

I N S T I T U T E O F W A T E R A C O U S T I C S,
S O N A R E N G I N E E R I N G A N DS I G N A L T H E O R Y
Chapter 4 / Sonar Signal Processing / Prof. Dr.-Ing. Dieter Kraus 7
where
denotes the transmitted band pass signalwith for and
, i.e. finite signal energy,
denotes the received echo signalwith , where a 0 models thepropagation and reflection losses and represents the travel time
denotes a wide sense stationary noise processwith , where and describe the ambient noise and receiver noise respectively.
( )s t],0[ Tt
2 2 ( )s s t dt ( ) 0s t
( ) ( ) ( )a rn t n t n t
( )es t( ) ( )es t a s t
2 c r
( )n t( )an t ( )rn t
I N S T I T U T E O F W A T E R A C O U S T I C S,
S O N A R E N G I N E E R I N G A N DS I G N A L T H E O R Y
Chapter 4 / Sonar Signal Processing / Prof. Dr.-Ing. Dieter Kraus 8
Now, we want to determine the impulse response of a stable receiver filter, i.e.
such that the output signal
possesses a maximum signal-to-noise ratio at t . Thus
has to be maximized, where
( ) ( ) ( ) ( ) ( ) ( ) ( )ey t h t x t t dt h t s t t dt h t n t t dt
22 2, ,
2 22
( ) ( ) ( ) ( )
E ( )E ( ) ( ) h
e e h e h
nh
h t s t dt s sh
nh t n t dt
( ) ,h t dt
( )h t

I N S T I T U T E O F W A T E R A C O U S T I C S,
S O N A R E N G I N E E R I N G A N DS I G N A L T H E O R Y
Chapter 4 / Sonar Signal Processing / Prof. Dr.-Ing. Dieter Kraus 9
and
The second order moment (correlation) function of the zero mean wide sense stationary process can be written as
,( ) ( ) ( ) ( ) ( )ee h
s h t s t dt a h t s t dt
( ) ( ) ( ) .h
n h t n t dt
( ) E ( ) ( )
E ( ) ( ) ( ) ( )
( ) ( ) E ( ) ( )
( ) ( ) ( ) .
h hn n h h
nn
r n t n t
h t n t t dt h t n t t dt
h t h t n t t n t t dt dt
h t h t r t t dt dt
( )h
n
I N S T I T U T E O F W A T E R A C O U S T I C S,
S O N A R E N G I N E E R I N G A N DS I G N A L T H E O R Y
Chapter 4 / Sonar Signal Processing / Prof. Dr.-Ing. Dieter Kraus 10
Applying the Wiener-Khintchine Theorem the power spectral density function of is given by
( )
( ) ( )
( ) ( ) ( )
( ) ( ) ( )
( ) ( ) ( )
( ) ( ) (
h h h h
jn n n n
jnn
jnn
j t tnn
j tnn
R r e d
h t h t r t t e dt dt d
h t h t r t t e d dt dt
h t h t R e dt dt
R h t e dt h t
2
)
( ) ( ) ( ) ( ) ( ).
j t
nn nn
e dt
R H H H R
( )h
n

I N S T I T U T E O F W A T E R A C O U S T I C S,
S O N A R E N G I N E E R I N G A N DS I G N A L T H E O R Y
Chapter 4 / Sonar Signal Processing / Prof. Dr.-Ing. Dieter Kraus 11
The variance (power) of can now be described in terms of the power spectral density function as follows.
Since is supposed to exhibit a constant power spectral density level
within the frequency band of interest, we finally obtain
2 2
2
1E ( ) (0) ( )
21
( ) ( )2
h h h h hn n n n nh
nn
n t r R d
H R d
0( ) 2nnR N
22 20
1E ( ) 2 ( ) .
2hn hn t N H d
( )n t
( )h
n ( )nnR
I N S T I T U T E O F W A T E R A C O U S T I C S,
S O N A R E N G I N E E R I N G A N DS I G N A L T H E O R Y
Chapter 4 / Sonar Signal Processing / Prof. Dr.-Ing. Dieter Kraus 12
Exploiting Parseval’s Formula, i.e.
we have to maximize
2 2 2 21 1( ) ( ) ( ) ,
2 2h h t dt H d H
2 22
22 2 2
00
22
22 2
0
2 2
( ) ( ) ( ) ( )
22 ( )
ˆ( ) ( )
2 ˆ
ˆ ˆwith ( ) ( ) and .
a h t s t dt h t s t dtsh a
NN h t dt h s
h t s t dtsa
N h s
s t s t s s

I N S T I T U T E O F W A T E R A C O U S T I C S,
S O N A R E N G I N E E R I N G A N DS I G N A L T H E O R Y
Chapter 4 / Sonar Signal Processing / Prof. Dr.-Ing. Dieter Kraus 13
Application of the Cauchy-Schwarz inequality
tells us, that the maximum is achieved for
Thus, the impulse response of the optimum receiver filter is matched to the transmitter signal. The optimum receiver filter is therefore called matched filter.
Finally, the maximum signal-to-noise ratio is given by
2 2 2
1 2 1 2( ) ( ) ( ) ( )f t f t dt f t dt f t dt
ˆ( ) ( ) ( ).opth t c s t c s t
2
2
0
.2opt
sh a
N
I N S T I T U T E O F W A T E R A C O U S T I C S,
S O N A R E N G I N E E R I N G A N DS I G N A L T H E O R Y
Chapter 4 / Sonar Signal Processing / Prof. Dr.-Ing. Dieter Kraus 14
For c 1 the matched filter output can be expressed by
where denotes the cross second order moment (cross correlation) function.
Hence, the matched filtering process can be interpreted as the correlation of the input signal with the expected (trans-mitted) signal .
The point target response of the receiver is defined by
( )s t
( ) ( ) ( ) ( ) ( )
( ) ( ) ( ),xs
y t h t x t t dt s t x t t dt
x t t s t dt r t
( )x t
( )xsr t
( ) ( ) ( ) ( ) ( ) .p t h t s t h t s t t dt

I N S T I T U T E O F W A T E R A C O U S T I C S,
S O N A R E N G I N E E R I N G A N DS I G N A L T H E O R Y
Chapter 4 / Sonar Signal Processing / Prof. Dr.-Ing. Dieter Kraus 15
Applying the matched filter, we obtain
Consequently, the point target response is determined by the autocorrelation function of the transmitter signal if matched filtering is employed.
Example: (CW-Pulse)
Signal waveform:
( ) ( ) ( ) ( ) ( )
( ) ( ) ( ) ( ) ( ).
opt opt
ss
p t h t s t s t s t
s t s t t dt s t t s t dt r t
2 2
1 2
( ) rect ( )cos( ) with rect ( ) 1 2 2
0 2T c T
t T
s t t t t t T
t T
I N S T I T U T E O F W A T E R A C O U S T I C S,
S O N A R E N G I N E E R I N G A N DS I G N A L T H E O R Y
Chapter 4 / Sonar Signal Processing / Prof. Dr.-Ing. Dieter Kraus 16
22 2
2
1 cos(2 )( ) 2
2
T
c
T
ts s t dt dt T
Signal energy:
Matched Filter:
Hence, the point target response can be expressed by
where the substitution with has been used.
( ) ( ) ( )opth t s t s t
2 2
2 2
( ) ( ) ( ) ( ) ( ) ( )
rect ( )rect ( )cos( )cos ( )
rect ( 2)rect ( 2)
cos ( 2) cos ( 2) ,
opt opt ss
T T c c
T T
c c
p t h t s t s t s t r t
t t t t t t dt
t t t t
t t t t dt
2t t t dt dt
I N S T I T U T E O F W A T E R A C O U S T I C S,
S O N A R E N G I N E E R I N G A N DS I G N A L T H E O R Y
Chapter 4 / Sonar Signal Processing / Prof. Dr.-Ing. Dieter Kraus 17
After exploiting the identity
the point target response becomes
where d(t ) denotes the triangular function
( ) 2.d t T t
2cos cos cos( ) cos( )x y x y x y
( )
( )
( ) ( )
( ) ( )
: ( ) cos(2 ) cos( ) 2
sin(2 ) (4 ) cos( ) 2
sin 2 ( ) (2 ) ( )cos( )
d t
opt c cd t
d t d t
c c cd t d t
c c c
t T p t t t dt
t t t
d t d t t
: ( ) 0,optt T p t
I N S T I T U T E O F W A T E R A C O U S T I C S,
S O N A R E N G I N E E R I N G A N DS I G N A L T H E O R Y
Chapter 4 / Sonar Signal Processing / Prof. Dr.-Ing. Dieter Kraus 18
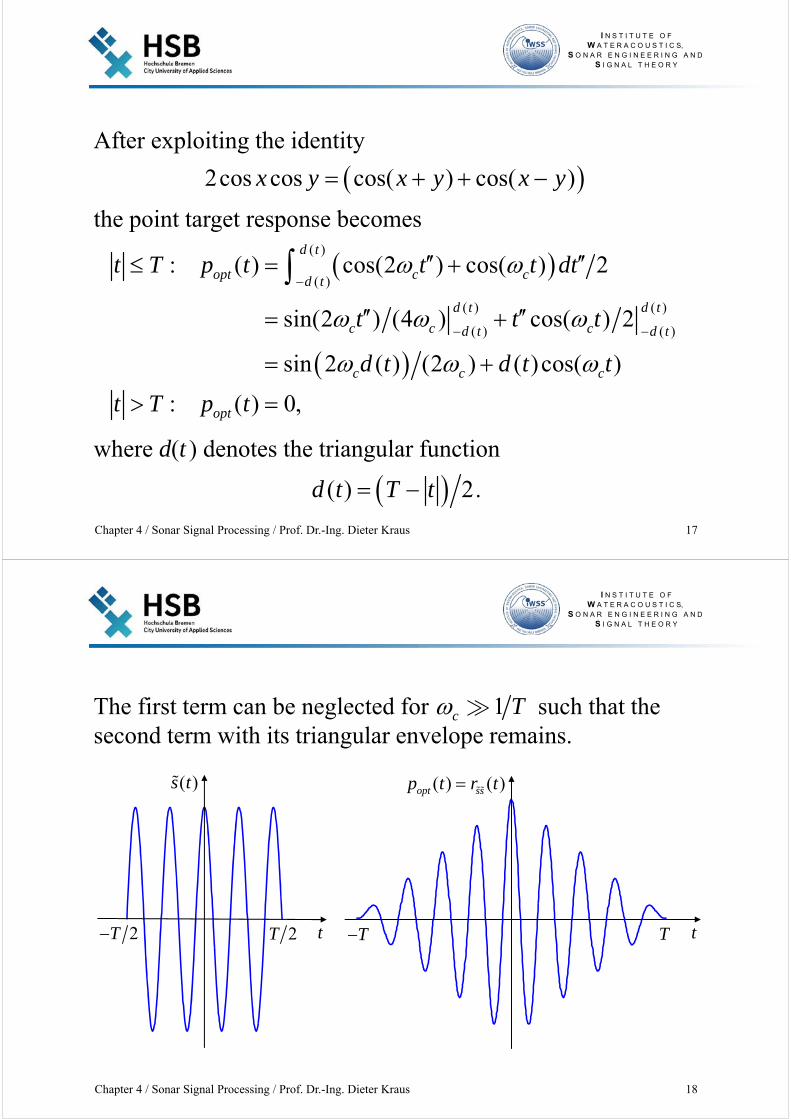
The first term can be neglected for such that the second term with its triangular envelope remains.
1c T
2T2T
( )s t
t TT
( ) ( )opt ssp t r t
t

I N S T I T U T E O F W A T E R A C O U S T I C S,
S O N A R E N G I N E E R I N G A N DS I G N A L T H E O R Y
Chapter 4 / Sonar Signal Processing / Prof. Dr.-Ing. Dieter Kraus 19
The Fourier transform of and are given by
and
( ) si ( ) si ( )2 2 2c c
T T TS
2( ) ( ) ( ) with si( ) sin( ) .opt SS
P R S x x x
( )s t ( )optp t
c c
( )S
c c
( )optP
I N S T I T U T E O F W A T E R A C O U S T I C S,
S O N A R E N G I N E E R I N G A N DS I G N A L T H E O R Y
Chapter 4 / Sonar Signal Processing / Prof. Dr.-Ing. Dieter Kraus 20
The power spectral density function of the matched filtered white noise can be expressed by
where
has been exploited.
Hence, the power spectral densityfunction of the output noise is pro-portional to the Fourier transformedpoint target response, i.e. it posses-ses the same shape.
22
0( ) ( ) ( ) 2 ( ) ( ),h hn n opt nn optR H R N S P
0( ) ( ) and ( ) 2opt nnH S R N
c c
( )h hn nR

I N S T I T U T E O F W A T E R A C O U S T I C S,
S O N A R E N G I N E E R I N G A N DS I G N A L T H E O R Y
Chapter 4 / Sonar Signal Processing / Prof. Dr.-Ing. Dieter Kraus 21
4.2.2 Quadrature Demodulation
Complex EnvelopeThe real signal can be expressed by
where c and s(t ) denote the carrier frequency and the com-plex envelope respectively.
The complex envelope is given by
with A(t ) and (t ) representing an over time varying
• amplitude (amplitude modulation)• phase (phase modulation).
( ) Re{ ( ) },cj ts t s t e
( )( ) ( ) j ts t A t e
( )s t
I N S T I T U T E O F W A T E R A C O U S T I C S,
S O N A R E N G I N E E R I N G A N DS I G N A L T H E O R Y
Chapter 4 / Sonar Signal Processing / Prof. Dr.-Ing. Dieter Kraus 22
Analytical SignalAlternatively, the real signal can be described by
where is called the analytic signal of .
The analytic signal is defined by
where denotes the Hilbert transform.
The Hilbert transform can be interpreted as filtering operation employing the non causal impulse response
1 ( )( ) ( ) ( ) with ( ) ( ) ,
ss t s t js t s t s t d
t
H
( )s t( ) Re{ ( )},s t s t
( )s t( )s t
H
1 1( ) with ( ) sgn( ),h t H j
t t
F
I N S T I T U T E O F W A T E R A C O U S T I C S,
S O N A R E N G I N E E R I N G A N DS I G N A L T H E O R Y
Chapter 4 / Sonar Signal Processing / Prof. Dr.-Ing. Dieter Kraus 23
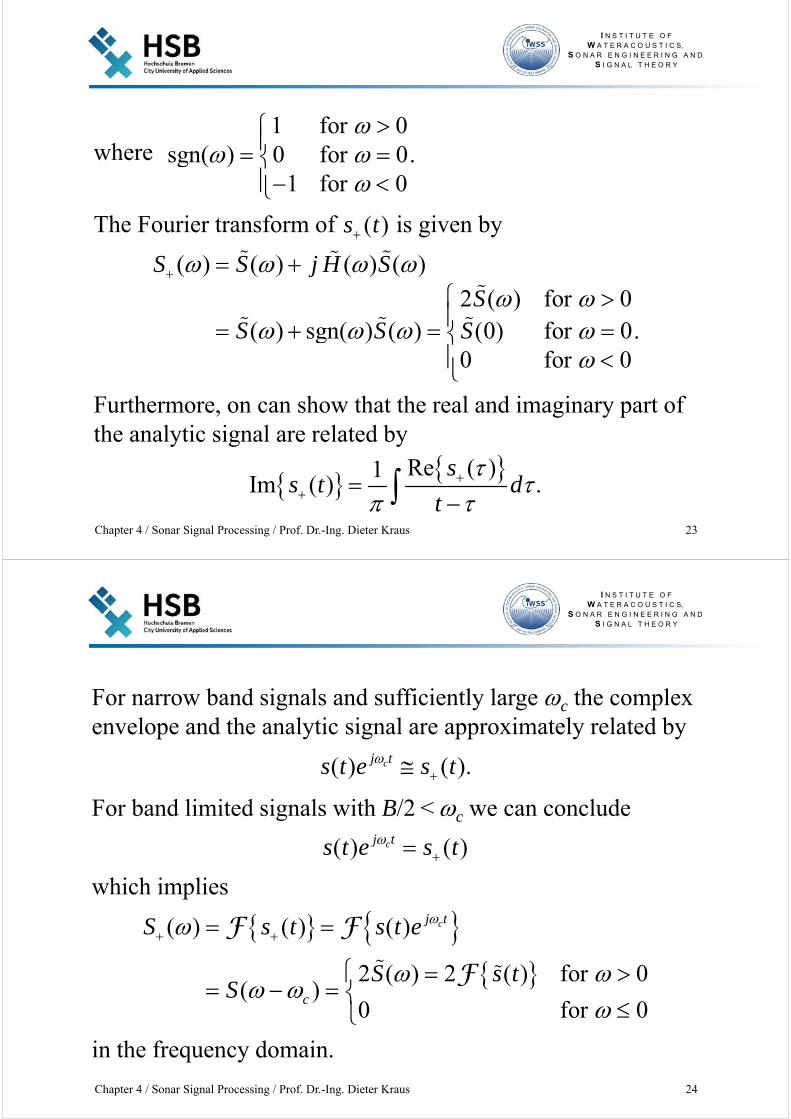
where
The Fourier transform of is given by
Furthermore, on can show that the real and imaginary part of the analytic signal are related by
Re ( )1Im ( ) .
ss t d
t
( ) ( ) ( ) ( )
2 ( ) for 0( ) sgn( ) ( ) (0) for 0.
0 for 0
S S j H S
SS S S
1 for 0sgn( ) 0 for 0.
1 for 0
( )s t
I N S T I T U T E O F W A T E R A C O U S T I C S,
S O N A R E N G I N E E R I N G A N DS I G N A L T H E O R Y
Chapter 4 / Sonar Signal Processing / Prof. Dr.-Ing. Dieter Kraus 24
For narrow band signals and sufficiently large c the complex envelope and the analytic signal are approximately related by
For band limited signals with B/2 < c we can conclude
which implies
in the frequency domain.
( ) ( ).cj ts t e s t
( ) ( )cj ts t e s t
( ) ( ) ( )
2 ( ) 2 ( ) for 0( )
0 for 0
cj t
c
S s t s t e
S s tS
F F
F

I N S T I T U T E O F W A T E R A C O U S T I C S,
S O N A R E N G I N E E R I N G A N DS I G N A L T H E O R Y
Chapter 4 / Sonar Signal Processing / Prof. Dr.-Ing. Dieter Kraus 25
Inphase and Quadrature ComponentsThe real and imaginary part of the complex envelope
are called quadrature components, where and de-note the inphase and quadrature component respectively.
The corresponding real band pass signal can be expressed by the inphase and quadrature components as follows.
)()()( tjststs QI )(tsI )(tsQ
( ) Re ( )
Re ( ) ( ) cos( ) sin( )
( )cos( ) ( )sin( )
cj t
I Q c c
I c Q c
s t s t e
s t js t t j t
s t t s t t
I N S T I T U T E O F W A T E R A C O U S T I C S,
S O N A R E N G I N E E R I N G A N DS I G N A L T H E O R Y
Chapter 4 / Sonar Signal Processing / Prof. Dr.-Ing. Dieter Kraus 26
If is a real band pass signal its inphase and quadrature components can be obtained by quadrature demodulation, i.e.
and
where LP denotes the system operator of a low pass filter.
( ) LP 2 ( )cos( )
LP ( )2cos( )cos( ) ( )2sin( )cos( )
LP ( ) 1 cos(2 ) ( )sin(2 )
I c
I c c Q c c
I c Q c
s t s t t
s t t t s t t t
s t t s t t
( )s t
( ) LP 2 ( )sin( )
LP ( )2cos( )sin( ) ( )2sin( )sin( )
LP ( )sin(2 ) ( ) 1 cos(2 ) ,
Q c
I c c Q c c
I c Q c
s t s t t
s t t t s t t t
s t t s t t

I N S T I T U T E O F W A T E R A C O U S T I C S,
S O N A R E N G I N E E R I N G A N DS I G N A L T H E O R Y
Chapter 4 / Sonar Signal Processing / Prof. Dr.-Ing. Dieter Kraus 27
Quadrature demodulator
LP
LP
( )s t 2cos( )ct
)(tsI
2sin( )ct
)(tsQ
( )u t
( )v t
( ) 2 ( )cos( )
( )( ) ( ) ( ) ( )c c
c
j t j tc c
u t s t t
s t e e U S S
( ) 2 ( )sin( )
( )( ) ( ) ( ) ( )c c
c
j t j tc c
jv t j s t t
s t e e jV S S
I N S T I T U T E O F W A T E R A C O U S T I C S,
S O N A R E N G I N E E R I N G A N DS I G N A L T H E O R Y
Chapter 4 / Sonar Signal Processing / Prof. Dr.-Ing. Dieter Kraus 28
( )S
c c
( )U
2 c 2 c
( )jV
2 c
2 c

I N S T I T U T E O F W A T E R A C O U S T I C S,
S O N A R E N G I N E E R I N G A N DS I G N A L T H E O R Y
Chapter 4 / Sonar Signal Processing / Prof. Dr.-Ing. Dieter Kraus 29
( ) ( ) ( )
( ) ( ) ( )
I LP
I LP
s t h u t d
S H U
( ) ( ) ( )
( ) ( ) ( )
Q LP
Q LP
js t h jv t d
jS H jV
( )QjS
( )IS
( ) ( ) ( )I QS S jS
I N S T I T U T E O F W A T E R A C O U S T I C S,
S O N A R E N G I N E E R I N G A N DS I G N A L T H E O R Y
Chapter 4 / Sonar Signal Processing / Prof. Dr.-Ing. Dieter Kraus 30
Complex Envelope of the noise process
The noise is supposed to be a wide sense stationary stochastic band pass process.
A band pass process can be expressed by
where n(t ) denotes the complex envelope.
The second order moment (correlation) function of can be written in terms of the complex envelope as
1( ) Re ( ) ( ) ( ) ,
2c c cj t j t j tn t n t e n t e n t e
( )n t
( )n t
( ) ( )1( ) E ( ) ( ) E ( ) ( )
4( ) ( )
c c
c c
j t j tnn
j t j t
r n t n t n t e n t e
n t e n t e

I N S T I T U T E O F W A T E R A C O U S T I C S,
S O N A R E N G I N E E R I N G A N DS I G N A L T H E O R Y
Chapter 4 / Sonar Signal Processing / Prof. Dr.-Ing. Dieter Kraus 31
Since is assumed to be wide sense stationary, we can conclude that the equations
must hold, that the second order moment (correlation) func-tion of the complex envelope possesses the property
E ( ) ( ) 0 and E ( ) ( ) 0n t n t n t n t
( ) E ( ) ( )
E ( ) ( ) E ( ) ( ) ( )
nn
nn
r n t n t
n t n t n t n t r
(2 )
(2 )
1E ( ) ( ) E ( ) ( )
4E ( ) ( ) E ( ) ( ) .
c c
c c
j t j
j j t
n t n t e n t n t e
n t n t e n t n t e
( )n t
I N S T I T U T E O F W A T E R A C O U S T I C S,
S O N A R E N G I N E E R I N G A N DS I G N A L T H E O R Y
Chapter 4 / Sonar Signal Processing / Prof. Dr.-Ing. Dieter Kraus 32
and that consequently, the second order moment (correlation) function of can be simplified to
The power spectral density function of , defined by the Fourier transform of , can be written as
where has been exploited.
)1( ) E ( ) ( ) E ( ) ( )
41
( ) ( ) .4
c c
c c
j jnn
j jnn nn
r n t n t e n t n t e
r e r e
( )n t
1( ) ( ) ( ) ( )
41
( ) ( ) ,4
nn nn nn c nn c
nn c nn c
R r R R
R R
F
( ) ( ) ( ) ( )nn nn nn nnr r R R
( )nnr
( )n t

I N S T I T U T E O F W A T E R A C O U S T I C S,
S O N A R E N G I N E E R I N G A N DS I G N A L T H E O R Y
Chapter 4 / Sonar Signal Processing / Prof. Dr.-Ing. Dieter Kraus 33
Finally, substituting the complex envelope of the noise, i.e. , in the following results
can be obtained.
( )nnR
c c
( )nnR
2B2B
E ( ) ( ) 0n t n t ( ) ( ) ( )I Qn t n t jn t
E ( ) ( ) E ( ) ( ) E ( ) ( )
E ( ) ( ) E ( ) ( ) 0
I I Q Q
I Q Q I
n t n t n t n t n t n t
j n t n t n t n t
( ) ( ) and
( ) ( ) ( ) (0) 0I I Q Q
I Q Q I I Q I Q
n n n n
n n n n n n n n
r r
r r r r
I N S T I T U T E O F W A T E R A C O U S T I C S,
S O N A R E N G I N E E R I N G A N DS I G N A L T H E O R Y
Chapter 4 / Sonar Signal Processing / Prof. Dr.-Ing. Dieter Kraus 34
Signal Energy and Noise Power before and after Quadrature Demodulation
Now, we would like to investigate whether the signal energy to noise power ratio is altered by quadrature demodulation.
Before quadrature demodulation the signal energy and noise power are given by
and
respectively.
2 22 2
0
1 1( ) ( ) ( )
2s s t dt S d S d
2
0
1 1(0) ( ) ( ) ,
2n nn nn nnr R d R d

I N S T I T U T E O F W A T E R A C O U S T I C S,
S O N A R E N G I N E E R I N G A N DS I G N A L T H E O R Y
Chapter 4 / Sonar Signal Processing / Prof. Dr.-Ing. Dieter Kraus 35
After quadrature demodulation we can derive
for the signal energy and
for the noise power.
Consequently, the quadrature demodulation does not change the signal energy to noise power ratio.
2 2
0
1 2(0) ( ) ( ) 2
2n nn nn nn nr R d R d
2 2 2
2 2 2
0 0
1( ) ( )
2
1 22 ( ) ( ) 2
2
s s t dt S d
S d S d s
I N S T I T U T E O F W A T E R A C O U S T I C S,
S O N A R E N G I N E E R I N G A N DS I G N A L T H E O R Y
Chapter 4 / Sonar Signal Processing / Prof. Dr.-Ing. Dieter Kraus 36
Implementation Variants of Quadrature Demodulation1) Analog Quadrature Demodulation
2) Digital Quadrature Demodulation
LP
( )x t2cos( )ct
( )Ix t
2sin( )ct( )Qx t
ADC
LP ADC
( )I Sx nT
( )Q Sx nT
1S Sf T b
LP
( )x t2cos( )c SnT
2sin( )c SnT
LP
max1 2S Sf T f
ADC
( )I Sx nT
( )Sx nT
( )I Sx nT
( )Q Sx nT
1S Sf T b
( )Q Sx nT
I N S T I T U T E O F W A T E R A C O U S T I C S,
S O N A R E N G I N E E R I N G A N DS I G N A L T H E O R Y
Chapter 4 / Sonar Signal Processing / Prof. Dr.-Ing. Dieter Kraus 37
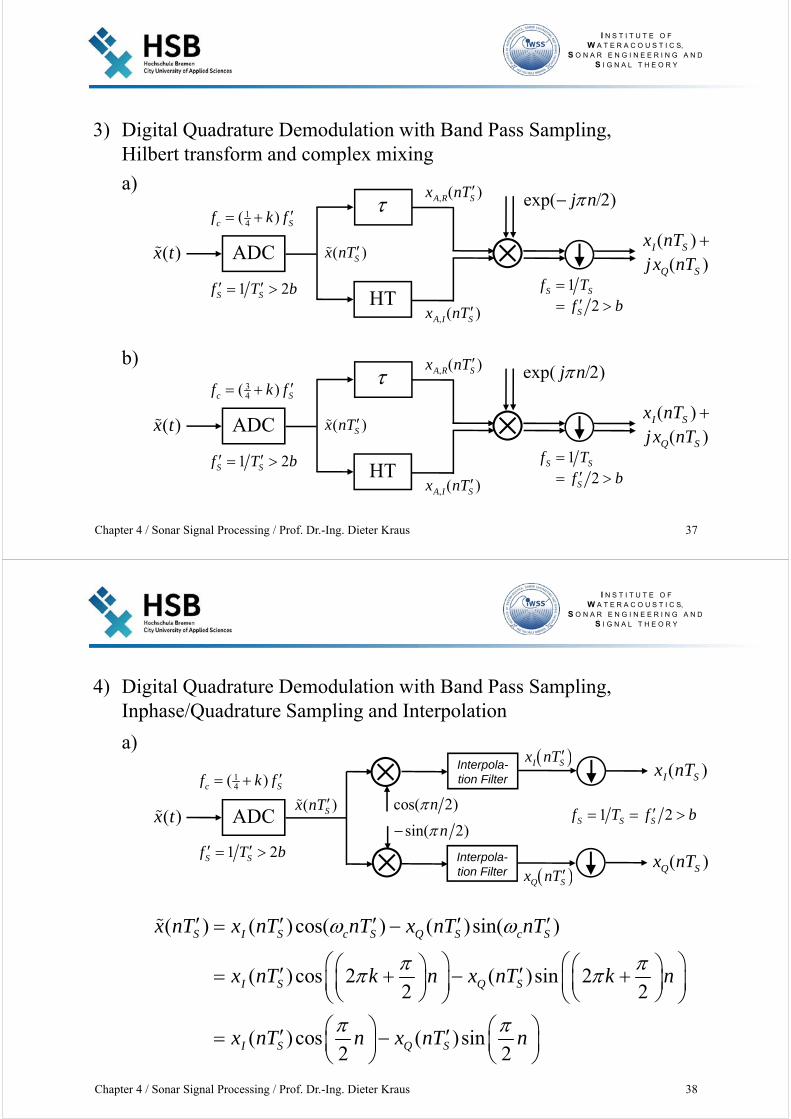
3) Digital Quadrature Demodulation with Band Pass Sampling, Hilbert transform and complex mixing
a)
b)
( )x t
HT
ADC
34( )
1 2
c S
S S
f k f
f T b
, ( )A R Sx nT
( )Sx nT
, ( )A I Sx nT
( )( )
I S
Q S
x nTjx nT
12
S S
S
f Tf b
exp( /2)j n
( )x t
HT
ADC
14( )
1 2
c S
S S
f k f
f T b
, ( )A R Sx nT
( )Sx nT
, ( )A I Sx nT
( )( )
I S
Q S
x nTjx nT
12
S S
S
f Tf b
exp( /2)j n
I N S T I T U T E O F W A T E R A C O U S T I C S,
S O N A R E N G I N E E R I N G A N DS I G N A L T H E O R Y
Chapter 4 / Sonar Signal Processing / Prof. Dr.-Ing. Dieter Kraus 38
4) Digital Quadrature Demodulation with Band Pass Sampling, Inphase/Quadrature Sampling and Interpolation
a)Interpola-tion Filter
( )x t ADC
14( )
1 2
c S
S S
f k f
f T b
( )I Sx nT
( )Q Sx nT
1 2S S Sf T f b
Interpola-tion Filter
I Sx nT
Q Sx nT
cos( 2)n
sin( 2)n
( )Sx nT
( ) ( )cos( ) ( )sin( )
( )cos 2 ( )sin 22 2
( )cos ( )sin2 2
S I S c S Q S c S
I S Q S
I S Q S
x nT x nT nT x nT nT
x nT k n x nT k n
x nT n x nT n

I N S T I T U T E O F W A T E R A C O U S T I C S,
S O N A R E N G I N E E R I N G A N DS I G N A L T H E O R Y
Chapter 4 / Sonar Signal Processing / Prof. Dr.-Ing. Dieter Kraus 39
b)
( ) ( )cos( ) ( )sin( )
3 3( )cos 2 ( )sin 2
2 2
( )cos ( )sin2 2
S I S c S Q S c S
I S Q S
I S Q S
x nT x nT nT x nT nT
x nT k n x nT k n
x nT n x nT n
Interpola-tion Filter
( )x t ADC
34( )
1 2
c S
S S
f k f
f T b
( )I Sx nT
( )Q Sx nT
1 2S S Sf T f b
Interpola-tion Filter
I Sx nT
Q Sx nT
cos( 2)n
sin( 2)n
( )Sx nT
I N S T I T U T E O F W A T E R A C O U S T I C S,
S O N A R E N G I N E E R I N G A N DS I G N A L T H E O R Y
Chapter 4 / Sonar Signal Processing / Prof. Dr.-Ing. Dieter Kraus 40
4.2.3 Matched Filtering after Quadrature Demodulation
The transmitted and received echo signal are described by
and
with denoting the travel time for a point target lo-cated in a distance r.
The complex envelop of the echo signal obtained by quadra-ture demodulation is given by
with
( ) Re ( ) cj ts t s t e
( )( ) Re ( ) cj tes t a s t e
2r c
2( ) ( ) ( )cj j kres t a s t e a s t e
2 and 2 .cc k

I N S T I T U T E O F W A T E R A C O U S T I C S,
S O N A R E N G I N E E R I N G A N DS I G N A L T H E O R Y
Chapter 4 / Sonar Signal Processing / Prof. Dr.-Ing. Dieter Kraus 41
Thus, the complex envelope of the echo signal differs from the transmitted signal in a
• time delay 2r/c• phase shift 2kr• complex constant factor a (modeling the propagation
and reflection conditions for a target at location r)
The received band pass noise is supposed to possess a constant spectral density over the band of interest, i.e.
Hence, the spectral density of the quadrature demodulated noise, i.e. the complex envelop n(t), is determined by
0R ( ) 2 for 2.nn cN B
( )n t
0R ( ) 2 for 2.nn N B
I N S T I T U T E O F W A T E R A C O U S T I C S,
S O N A R E N G I N E E R I N G A N DS I G N A L T H E O R Y
Chapter 4 / Sonar Signal Processing / Prof. Dr.-Ing. Dieter Kraus 42
Now, we want to determine the impulse response h(t) of a complex valued stable receiver filter, i.e.
such that for the input signal
the output signal
possesses a maximum signal-to-noise ratio at t . Thus,
( ) ( ) ( ) ( ) ( ) ( ) ( )ey t h t x t t dt h t s t t dt h t n t t dt
2 2 2
, ,
2 2 2
( ) ( ) ( ) ( )( )
E ( )E ( ) ( ) h
e e h e h
nh
h t s t dt s sh
nh t n t dt
( ) ,h t dt
( ) ( ) ( )ex t s t n t

I N S T I T U T E O F W A T E R A C O U S T I C S,
S O N A R E N G I N E E R I N G A N DS I G N A L T H E O R Y
Chapter 4 / Sonar Signal Processing / Prof. Dr.-Ing. Dieter Kraus 43
has to be maximized, where
and .
Using Parseval’s Formula the variance (power) of nh(t) can be expressed by
( ) ( ) ( )hn h t n t dt
2,
2
( ) ( ) ( ) ( ) ( )
( ) ( )
j kre h e
j kr
s h t s t dt a e h t s t dt
a e h t s t dt
22
2
2 2 2
0 0 0
E ( ) (0)
1 1( ) ( ) ( )
2 21
2 ( ) 2 ( ) 2 .2
h h h
h h
n h n n
n n nn
n t r
R d H R d
N H d N h t dt N h
I N S T I T U T E O F W A T E R A C O U S T I C S,
S O N A R E N G I N E E R I N G A N DS I G N A L T H E O R Y
Chapter 4 / Sonar Signal Processing / Prof. Dr.-Ing. Dieter Kraus 44
Hence, (h) can be write as
By means of the Cauchy Schwarz inequality
2 22 2
2
2 2 200
22
2
2 20
2 2
( ) ( ) ( ) ( )( )
22
ˆ( ) ( )
2 ˆ
ˆ ˆwith ( ) ( ) and .
j kra e h t s t dt h t s t dtsh a
NN h h s
h t s t dtsa
N h s
s t s t s s
2 2 2
1 2 1 2( ) ( ) ( ) ( )f t f t dt f t dt f t dt

I N S T I T U T E O F W A T E R A C O U S T I C S,
S O N A R E N G I N E E R I N G A N DS I G N A L T H E O R Y
Chapter 4 / Sonar Signal Processing / Prof. Dr.-Ing. Dieter Kraus 45
one can now prove, that (h) takes its maximum for
where, c denotes an arbitrary complex constant 0. The maximum signal-to-noise ratio is given by
If hopt(t) denotes the complex envelope of the two alternative approaches
• real filtering with followed by quadrature demodulation
• quadrature demodulation followed by complex filtering with hopt(t)
are equivalent.
ˆ( ) ( ) ( ),opth t c s t c s t
2
2
0
.2opt
sh a
N
( )opth t
( )opth t
I N S T I T U T E O F W A T E R A C O U S T I C S,
S O N A R E N G I N E E R I N G A N DS I G N A L T H E O R Y
Chapter 4 / Sonar Signal Processing / Prof. Dr.-Ing. Dieter Kraus 46
The complex filtering of quadrature demodulated signals can be implemented by real devices as depicted below.
LP
( )s t
2cos( )ct
2sin( )ct
BP
( )Iy t
( )Qy t
hI
hQ
hQ
hI
LP
( )n t
complex matched
filter
( )x t
( )Ix t
( )Qx t

I N S T I T U T E O F W A T E R A C O U S T I C S,
S O N A R E N G I N E E R I N G A N DS I G N A L T H E O R Y
Chapter 4 / Sonar Signal Processing / Prof. Dr.-Ing. Dieter Kraus 47
4.3 Range Resolution of a Sonar SystemA point target generates in the absence of noise the determi-nistic signal
at the output of the receiver, where p(t) denotes the point tar-get response, r the distance of the point target and q(r) incor-porates the range dependent echo amplitude and phase shift
.
For distributed or extended targets, we introduce the common reflectivity distribution .
Thus, due to the linearity, the output signal of the receiver filter is given by
( ) ( ) ( ) with 2y t q r p t r c
2kr
( )a r
I N S T I T U T E O F W A T E R A C O U S T I C S,
S O N A R E N G I N E E R I N G A N DS I G N A L T H E O R Y
Chapter 4 / Sonar Signal Processing / Prof. Dr.-Ing. Dieter Kraus 48
i.e. the superimposition of the echoes originated along the target extend by backscattering.
Substitution of in the convolution above provides
where
Thus, can be understood as a reconstruction of a(t) which is one of the main objectives of a sonar/radar imaging system.
ˆ( ) ( ) ( ) ( 2 ) ,a t a r q r p t r c dr
2cr
ˆ( ) ( ) ( ) ,a t a p t d
( ) .2 2 2
c c ca a q
)(ˆ ta

I N S T I T U T E O F W A T E R A C O U S T I C S,
S O N A R E N G I N E E R I N G A N DS I G N A L T H E O R Y
Chapter 4 / Sonar Signal Processing / Prof. Dr.-Ing. Dieter Kraus 49
A perfect reconstruction can only be achieved for
The notion range resolution shall describe a measure how far targets that provide equally strong echos have to be separated in range to be distinguishable in the received signal.
There does not exist a unique definition for the range resolu-tion measure.
1) Range resolution measures based on the duration of the point target response.
a) 3 dB width: t t+ t with
( ) ( ).p t t
2 2 21( ) ( ) (0)
2 2
c tp t p t p r
I N S T I T U T E O F W A T E R A C O U S T I C S,
S O N A R E N G I N E E R I N G A N DS I G N A L T H E O R Y
Chapter 4 / Sonar Signal Processing / Prof. Dr.-Ing. Dieter Kraus 50
Example:rectangular pulse of duration T triangular point target response of support 2T (matched filter output)
b) Distance to the first zero
22 1
1 0.592 2
t cr T
T
( )p t
ttt

I N S T I T U T E O F W A T E R A C O U S T I C S,
S O N A R E N G I N E E R I N G A N DS I G N A L T H E O R Y
Chapter 4 / Sonar Signal Processing / Prof. Dr.-Ing. Dieter Kraus 51
Example:rectangular pulse of duration T
c) Range resolution obtained with an energy equivalent rectangular pulse
Example:rectangular pulse of duration T triangular point target response of support 2T
( ) 0 for 2p t t T t T r cT
2
2 2 2 2
= energy of the point target response ( )
(0) (0)
p p t
p p t t p p
I N S T I T U T E O F W A T E R A C O U S T I C S,
S O N A R E N G I N E E R I N G A N DS I G N A L T H E O R Y
Chapter 4 / Sonar Signal Processing / Prof. Dr.-Ing. Dieter Kraus 52
2) Resolution measure based on the separability of signals
Two point targets generate the echo signal
where a1 and a2 as well as 1 and 2 denote the complex amplitudes and time delays of the echoes of target 1 and 2, respectively.
2 2
- 0
3
0
1 2 1
2 2 21
3 3 3 2 3
T T
T
T
t tt dt dt
T T
t cT cTT T r
T
1 1 2 2ˆ( ) ( ) ( ),a t a p t a p t
I N S T I T U T E O F W A T E R A C O U S T I C S,
S O N A R E N G I N E E R I N G A N DS I G N A L T H E O R Y
Chapter 4 / Sonar Signal Processing / Prof. Dr.-Ing. Dieter Kraus 53
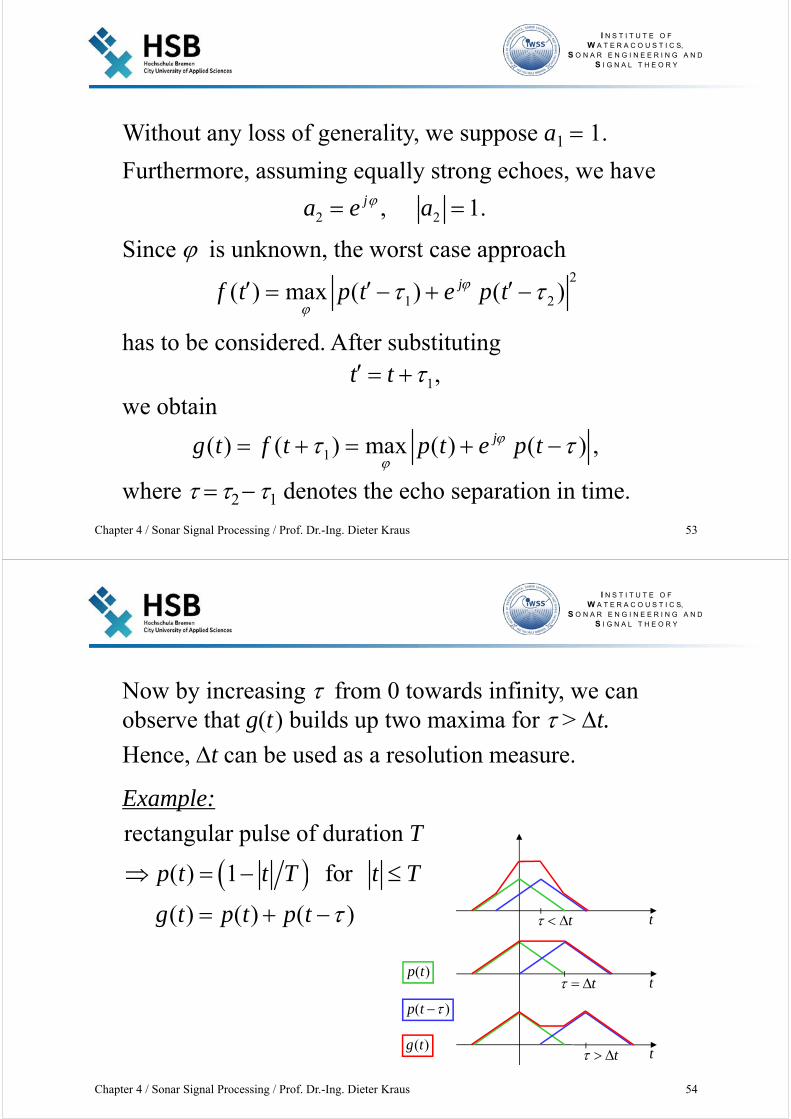
Without any loss of generality, we suppose a1 1.
Furthermore, assuming equally strong echoes, we have
Since is unknown, the worst case approach
has to be considered. After substituting
we obtain
where 21 denotes the echo separation in time.
2 2, 1.ja e a
2
1 2( ) max ( ) ( )jf t p t e p t
1,t t
1( ) ( ) max ( ) ( ) ,jg t f t p t e p t
I N S T I T U T E O F W A T E R A C O U S T I C S,
S O N A R E N G I N E E R I N G A N DS I G N A L T H E O R Y
Chapter 4 / Sonar Signal Processing / Prof. Dr.-Ing. Dieter Kraus 54
Now by increasing from 0 towards infinity, we can observe that g(t) builds up two maxima for > t.
Hence, t can be used as a resolution measure.
Example:
rectangular pulse of duration T
( ) 1 for
( ) ( ) ( )
p t t T t T
g t p t p t
t
t
t( )g t
( )p t
( )p t
t
t
t

I N S T I T U T E O F W A T E R A C O U S T I C S,
S O N A R E N G I N E E R I N G A N DS I G N A L T H E O R Y
Chapter 4 / Sonar Signal Processing / Prof. Dr.-Ing. Dieter Kraus 55
4.4 Doppler EffectMoving sonar platforms as well as moving targets change the frequency of the received echo signal due to the Doppler effect.
The geometry of the sonar and target motion is described in the figure below.
, ,transmitted sonar frequency received sonar frequency
frequency at target cos , cosS T S R
T S S S T T T
f f
f v v v v
Sv
Tv
Tr
TS
I N S T I T U T E O F W A T E R A C O U S T I C S,
S O N A R E N G I N E E R I N G A N DS I G N A L T H E O R Y
Chapter 4 / Sonar Signal Processing / Prof. Dr.-Ing. Dieter Kraus 56
The frequency of the signal one would measure with a hydro-phone placed on the target is given by
A sound wave of this frequency is emitted by the moving target and is received by the moving sonar platform.
Hence, the frequency of the received signal is determined by
, ,
2
, , 2
1 ( )( )
1 ( )( )
1 1 1 ( ).
1 1 1 ( )
S S T SS R T T S T
T T S T
T S T S T SS T S T
S T T S T S
v c c v c v c vf f f f
v c c v c v c v
v c v c v v c v v cf f
v c v c v v c v v c
, ,
1.
1T T
T S T S TS S
v c c vf f f
v c c v
I N S T I T U T E O F W A T E R A C O U S T I C S,
S O N A R E N G I N E E R I N G A N DS I G N A L T H E O R Y
Chapter 4 / Sonar Signal Processing / Prof. Dr.-Ing. Dieter Kraus 57
After supposing , we obtain
where
denotes the relative radial speed between the sonar platform and the target.
Remark: For Radar (electromagnetic waves) holds
, , , ,
1 ( ) 1,
1 ( ) 1T S r r
S R S T S T S TT S r r
v v c v c c vf f f f
v v c v c c v
2T Sv v c
r T Sv v v
, , ,r r
T R T R R R Tr r
c v c vf f f f
c v c v
, ,transmitted radar frequency received radar frequency
frequency at target speed of lightR T R R
T
f f
f c
I N S T I T U T E O F W A T E R A C O U S T I C S,
S O N A R E N G I N E E R I N G A N DS I G N A L T H E O R Y
Chapter 4 / Sonar Signal Processing / Prof. Dr.-Ing. Dieter Kraus 58
Example:Supposing
we obtain
For the subsequent considerations we suppose that only the target is moving, i.e.
Thus, the distance between the sonar platform and the moving
10 m s, 5 m s 15 m s
1500 m s,T S rv v v
c
, ,
,
1.02020157 (exact calculation)
1.02020202 (approximative calculation)S R S T
S T
f f
f
7relative error 5 10 .
, , ,
1.
1T T
S R S T S TT T
v c c vf f f
v c c v

I N S T I T U T E O F W A T E R A C O U S T I C S,
S O N A R E N G I N E E R I N G A N DS I G N A L T H E O R Y
Chapter 4 / Sonar Signal Processing / Prof. Dr.-Ing. Dieter Kraus 59
target can be expressed as a function of time by
The signal received at time t has been reflected by the target at time
where (t ) denotes the two-way travel time of the signal.
Consequently,
i.e. (t ) is only implicitly given.
The signal received (real bandpass signal) is therefore
where denotes the transmitted sonar signal.
0( ) ( ) .Tr t r v t t
( ) 2 ,t t t
( ) 2 ( ) 2 ( ) 2 ,t r t c r t t c
( ) ( ) ,es t a s t t ( )s t
I N S T I T U T E O F W A T E R A C O U S T I C S,
S O N A R E N G I N E E R I N G A N DS I G N A L T H E O R Y
Chapter 4 / Sonar Signal Processing / Prof. Dr.-Ing. Dieter Kraus 60
Assuming now
we obtain
which after some reformulations, i.e.
and
leads us to the expression
( ) .T Tv t v const
0 0
2 2( ) ( ) 2 ( ) ( )T
T T
vt r v t t r v t t
c c c
0
2( ) 1 ( )T Tt v c r v t
c
0 02( ) 2 ,
1T T
T T
r v t r v tt
c v c c v
I N S T I T U T E O F W A T E R A C O U S T I C S,
S O N A R E N G I N E E R I N G A N DS I G N A L T H E O R Y
Chapter 4 / Sonar Signal Processing / Prof. Dr.-Ing. Dieter Kraus 61
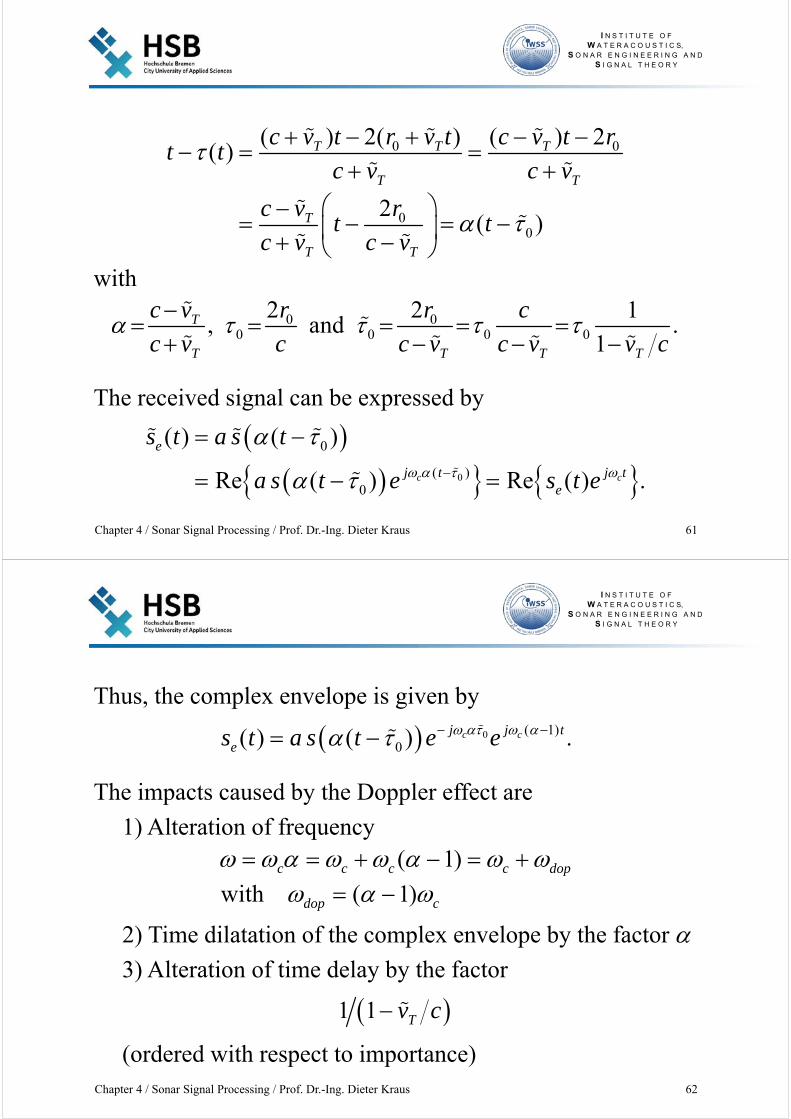
with
The received signal can be expressed by
0 0
00
( ) 2( ) ( ) 2( )
2( )
T T T
T T
T
T T
c v t r v t c v t rt t
c v c v
c v rt t
c v c v
0 00 0 0 0
2 2 1, and .
1T
T T T T
c v r r c
c v c c v c v v c
0
0
( )0
( ) ( )
Re ( ) Re ( ) .c c
e
j t j te
s t a s t
a s t e s t e
I N S T I T U T E O F W A T E R A C O U S T I C S,
S O N A R E N G I N E E R I N G A N DS I G N A L T H E O R Y
Chapter 4 / Sonar Signal Processing / Prof. Dr.-Ing. Dieter Kraus 62
Thus, the complex envelope is given by
The impacts caused by the Doppler effect are
1) Alteration of frequency
2) Time dilatation of the complex envelope by the factor 3) Alteration of time delay by the factor
(ordered with respect to importance)
0 ( 1)0( ) ( ) .c cj j t
es t a s t e e
( 1)
with ( 1)c c c c dop
dop c
1 1 Tv c

I N S T I T U T E O F W A T E R A C O U S T I C S,
S O N A R E N G I N E E R I N G A N DS I G N A L T H E O R Y
Chapter 4 / Sonar Signal Processing / Prof. Dr.-Ing. Dieter Kraus 63
The impacts can be approximately considered as follows.
1)
Example:
( 1) 1
2 2 2 1
1
Tdop c c
T
T T Tc c c
T T T
c v
c v
v v c v
c v c c v c v c
2 Tdop c
v
c
15 m s, 1500 m s1 1
0.9900 11 1 1 100
T
T
v c
v c
I N S T I T U T E O F W A T E R A C O U S T I C S,
S O N A R E N G I N E E R I N G A N DS I G N A L T H E O R Y
Chapter 4 / Sonar Signal Processing / Prof. Dr.-Ing. Dieter Kraus 64
2) The difference between 0 and
a) can be neglected with regard to the time shift of the complex envelope.
b) can not be neglected with regard to the phase shift provided by
However, since the initial phase is usually unknown in practice the impact of the phase shift does not re-quire additional attention.
3) Time dilatation of the complex envelope reduces the performance of matched filtering (correlation).
Its impact can be neglected if the phase shift for fmax
satisfies
0exp .cj
0

I N S T I T U T E O F W A T E R A C O U S T I C S,
S O N A R E N G I N E E R I N G A N DS I G N A L T H E O R Y
Chapter 4 / Sonar Signal Processing / Prof. Dr.-Ing. Dieter Kraus 65
with
Example:
After applying the three approximations, we finally can write
max
12
1 2 r
cf T T bT
v
max maximum frequency 2 pulse length
bandwidth 2 time bandwidth product.
f b T
b B bT
2.5 m s, 1500 m s 3002T
T
cv c bT
v
0 0( )0( ) ( ) .dop cj t j
es t a s t e e
I N S T I T U T E O F W A T E R A C O U S T I C S,
S O N A R E N G I N E E R I N G A N DS I G N A L T H E O R Y
Chapter 4 / Sonar Signal Processing / Prof. Dr.-Ing. Dieter Kraus 66
4.5 Pulse CompressionThe range resolution and signal energy are determined by
where c, T and P denote the sound speed, pulse length and transmitting power, respectively.
The power P is technically/physically limited by the capabili-ties of the power amplifiers and the power dependent occur-rence of cavitation at the transducers radiation surface.
The retention of signal energy ( SNR) and the enhancement of range resolution seem to be contradicting goals.
Therefore, how can the range resolution be enhanced without losing signal energy for a given maximum transmitting power?
22 and ,r cT s PT
I N S T I T U T E O F W A T E R A C O U S T I C S,
S O N A R E N G I N E E R I N G A N DS I G N A L T H E O R Y
Chapter 4 / Sonar Signal Processing / Prof. Dr.-Ing. Dieter Kraus 67
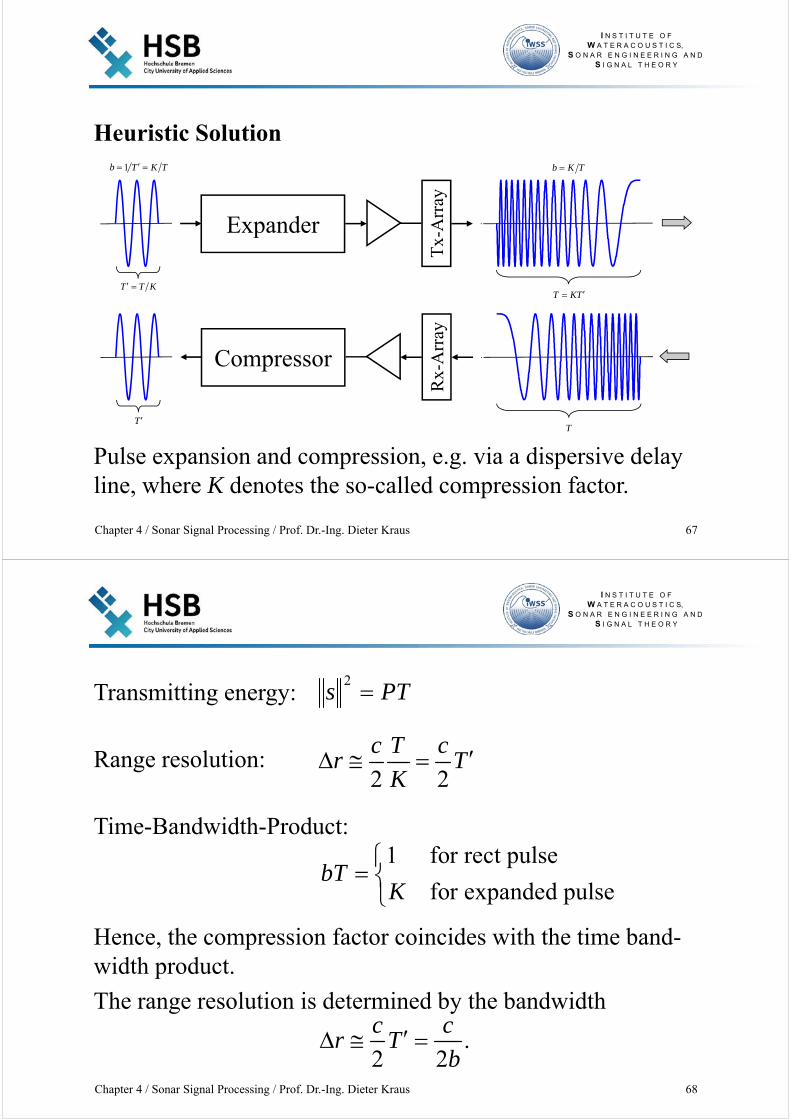
Heuristic Solution
Pulse expansion and compression, e.g. via a dispersive delay line, where K denotes the so-called compression factor.
T KT T T K
Expander
Tx-
Arr
ayT
T
Compressor
Rx-
Arr
ay
1b T K T b K T
I N S T I T U T E O F W A T E R A C O U S T I C S,
S O N A R E N G I N E E R I N G A N DS I G N A L T H E O R Y
Chapter 4 / Sonar Signal Processing / Prof. Dr.-Ing. Dieter Kraus 68
Transmitting energy:
Range resolution:
Time-Bandwidth-Product:
Hence, the compression factor coincides with the time band-width product.
The range resolution is determined by the bandwidth
PTs 2
2 2
c T cr T
K
1 for rect pulse
for expanded pulsebT
K
.2 2
c cr T
b
I N S T I T U T E O F W A T E R A C O U S T I C S,
S O N A R E N G I N E E R I N G A N DS I G N A L T H E O R Y
Chapter 4 / Sonar Signal Processing / Prof. Dr.-Ing. Dieter Kraus 69
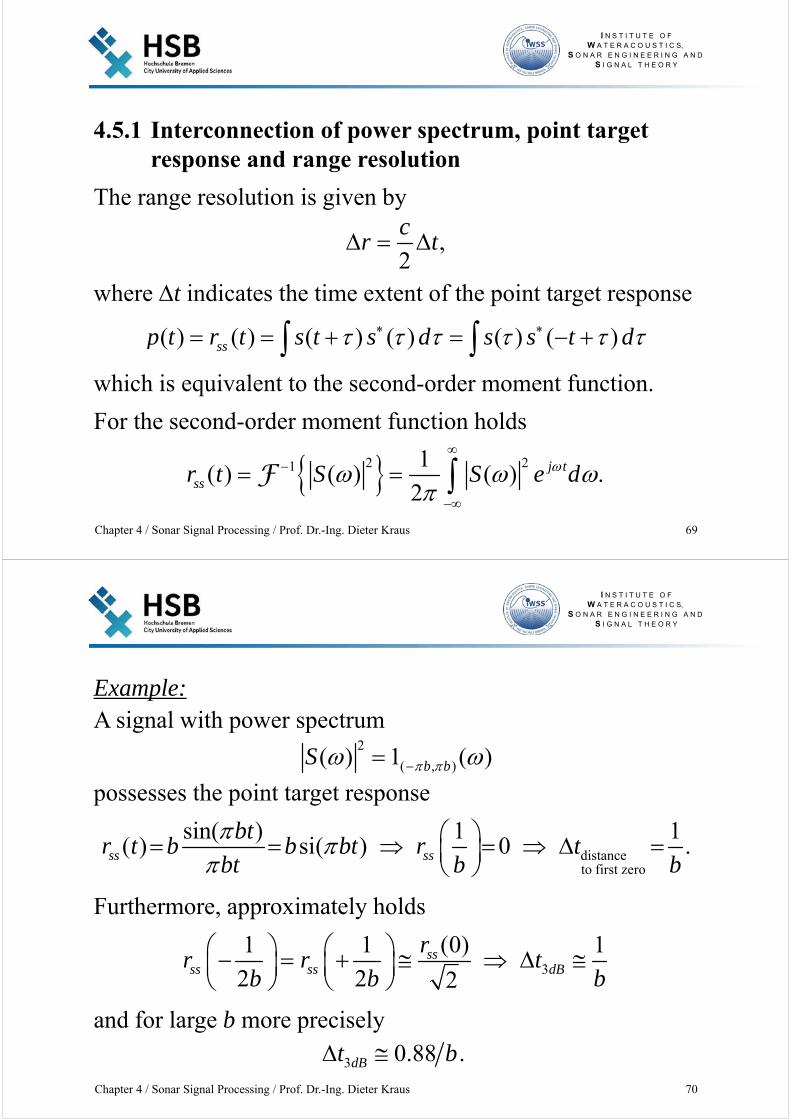
4.5.1 Interconnection of power spectrum, point target response and range resolution
The range resolution is given by
where t indicates the time extent of the point target response
which is equivalent to the second-order moment function.
For the second-order moment function holds
,2
cr t
( ) ( ) ( ) ( ) ( ) ( )ssp t r t s t s d s s t d
2 21 1( ) ( ) ( ) .
2j t
ssr t S S e d
F
I N S T I T U T E O F W A T E R A C O U S T I C S,
S O N A R E N G I N E E R I N G A N DS I G N A L T H E O R Y
Chapter 4 / Sonar Signal Processing / Prof. Dr.-Ing. Dieter Kraus 70
Example:A signal with power spectrum
possesses the point target response
Furthermore, approximately holds
and for large b more precisely
2
( , )( ) 1 ( )b bS
distance to first zero
sin( ) 1 1( ) si( ) 0 .ss ss
btr t b b bt r t
bt b b
3
1 1 (0) 1
2 2 2ss
ss ss dB
rr r t
b b b
3 0.88 .dBt b

I N S T I T U T E O F W A T E R A C O U S T I C S,
S O N A R E N G I N E E R I N G A N DS I G N A L T H E O R Y
Chapter 4 / Sonar Signal Processing / Prof. Dr.-Ing. Dieter Kraus 71
Remarks:
• The point target response / second order moment function is completely determined by the power spectrum of the signal.
• The bandwidth of the signal determines the range resolution.
4.5.2 Ambiguity function
The ambiguity function is defined by
It can be interpreted as the output of a matched filter designed for a Doppler frequency shift f0 if a signal with Doppler fre-quency shift f0 + is received.
* 2( , ) : ( ) ( ) .j ts t s t e dt
I N S T I T U T E O F W A T E R A C O U S T I C S,
S O N A R E N G I N E E R I N G A N DS I G N A L T H E O R Y
Chapter 4 / Sonar Signal Processing / Prof. Dr.-Ing. Dieter Kraus 72
Thus, (,) can be understood as the point target response in the Range/Doppler domain.
* 2
* ( ) 2
* ( 2 )2
*2
( , ) ( ) ( )
( ) ( )2 2
1 ( ) ( )
4
1 ( ) ( )
4
j t
j t j t j t
j j t
s t s t e dt
d dS e S e e dt
S S e e d d dt
S S e
*2
( 2 )
1 ( 2 ) ( )
4
j
j
d d
S S e d

I N S T I T U T E O F W A T E R A C O U S T I C S,
S O N A R E N G I N E E R I N G A N DS I G N A L T H E O R Y
Chapter 4 / Sonar Signal Processing / Prof. Dr.-Ing. Dieter Kraus 73
Ambiguity-Function of particular waveforms
a) Rectangular pulse
with . Hence, the ambiguity function is given by
( 2, 2)
1( ) 1 ( )T Ts t t
T
21s
* 2( , ) ( ) ( )
sin1 for
.
0 elsewhere
j t
j
s t s t e dt
Te T
T T
I N S T I T U T E O F W A T E R A C O U S T I C S,
S O N A R E N G I N E E R I N G A N DS I G N A L T H E O R Y
Chapter 4 / Sonar Signal Processing / Prof. Dr.-Ing. Dieter Kraus 74
Ambiguity function of a rectangular pulse

I N S T I T U T E O F W A T E R A C O U S T I C S,
S O N A R E N G I N E E R I N G A N DS I G N A L T H E O R Y
Chapter 4 / Sonar Signal Processing / Prof. Dr.-Ing. Dieter Kraus 75
b) LFM pulse with rectangular envelope
with .
In this case the ambiguity function can be expressed by
2( 2, 2)
1( ) 1 ( )expT Ts t t j kt
T
* 2( , ) ( ) ( )
sin ( )1 for
( )
0 elsewhere
j t
j
s t s t e dt
k Te T
T k T
Tbk
I N S T I T U T E O F W A T E R A C O U S T I C S,
S O N A R E N G I N E E R I N G A N DS I G N A L T H E O R Y
Chapter 4 / Sonar Signal Processing / Prof. Dr.-Ing. Dieter Kraus 76
Ambiguity function of a LFM pulse with rectangular envelope

I N S T I T U T E O F W A T E R A C O U S T I C S,
S O N A R E N G I N E E R I N G A N DS I G N A L T H E O R Y
Chapter 4 / Sonar Signal Processing / Prof. Dr.-Ing. Dieter Kraus 77
c) LFM pulse with Gaussian envelope
where (standard deviation) and the effective pulse dura-tion T are related by
and where k determines the slope of the LFM with .After some manipulations, we obtain
22
224
1( ) exp ,
2
ts t j kt
k b T
* 2
2 2 2 2
( , ) ( ) ( )
exp 4 ( ) .
j t
j
s t s t e dt
e k
2T
I N S T I T U T E O F W A T E R A C O U S T I C S,
S O N A R E N G I N E E R I N G A N DS I G N A L T H E O R Y
Chapter 4 / Sonar Signal Processing / Prof. Dr.-Ing. Dieter Kraus 78
Ambiguity function of a LFM pulse with Gaussian envelope
I N S T I T U T E O F W A T E R A C O U S T I C S,
S O N A R E N G I N E E R I N G A N DS I G N A L T H E O R Y
Chapter 4 / Sonar Signal Processing / Prof. Dr.-Ing. Dieter Kraus 79
Assignment 8:
1) Show, that the ambiguity function of an LFM pulse with rectangular envelope can be expressed as given on p. 75.
2) Develop a Matlab program for determining the
spectra of the waveforms a) – c), using the FFT
ambiguity functions given in a) – c) in analytical form
I N S T I T U T E O F W A T E R A C O U S T I C S,
S O N A R E N G I N E E R I N G A N DS I G N A L T H E O R Y
Chapter 4 / Sonar Signal Processing / Prof. Dr.-Ing. Dieter Kraus 80
Invariance of the Volume under the ambiguity surface
The following calculations show that the volume under the ambiguity surface does not depend on the waveform. The volume depends only on the signal energy.
2
2 2
( , )
( ) ( ) ( ) ( )
( ) ( ) ( ) ( ) ( )
( ) ( ) ( ) ( )
j t j t
d d
s t s t e s t s t e dtdt d d
s t s t s t s t t t dtdt d
s t s t s t s t dtd

I N S T I T U T E O F W A T E R A C O U S T I C S,
S O N A R E N G I N E E R I N G A N DS I G N A L T H E O R Y
Chapter 4 / Sonar Signal Processing / Prof. Dr.-Ing. Dieter Kraus 81
2
2 2 2 2
2
2 4 2
( , )
( ) ( ) ( ) ( )
( ) (0, 0) .
d d
s t s t dt dt s t dt s t dt
s t dt s
with ,t t dt d After substituting
we obtain
2 2( ) ( ) .s t s t d dt
I N S T I T U T E O F W A T E R A C O U S T I C S,
S O N A R E N G I N E E R I N G A N DS I G N A L T H E O R Y
Chapter 4 / Sonar Signal Processing / Prof. Dr.-Ing. Dieter Kraus 82
4.6 Signal DetectionIn the signal detection theory for sonar applications the fol-lowing cases are distinguished:
1) The signal is completely known.
2) The amplitude of the signal is known and the phase is modeled as an uniformly distributed random variable.
3) The amplitude and phase of the signal are modeled as a Rayleigh and an uniformly distributed random variable, respectively.
Furthermore, assuming white and normally distributed noise all cases lead to optimum detectors that mainly base on a matched filter approach.

I N S T I T U T E O F W A T E R A C O U S T I C S,
S O N A R E N G I N E E R I N G A N DS I G N A L T H E O R Y
Chapter 4 / Sonar Signal Processing / Prof. Dr.-Ing. Dieter Kraus 83
Since the detectors exploit test statistics with different statis-tical distributional properties they clearly do not possess the same detection capabilities.
For instance, a detector assuming 2) requires in comparison with a detector utilizing 1) an increased signal-to-noise ratio (SNR) of approximately 1dB.
Nevertheless, common to these detectors is that the perfor-mance can be parameterized by the SNR of the matched filter output.
The received signal can be described in discrete-time by
( ) ( ) ( ) with ( ) ( ),S e S S e S Sx lT s lT n lT s lT s lT
I N S T I T U T E O F W A T E R A C O U S T I C S,
S O N A R E N G I N E E R I N G A N DS I G N A L T H E O R Y
Chapter 4 / Sonar Signal Processing / Prof. Dr.-Ing. Dieter Kraus 84
where s, se and n denote the transmitted signal, the echo signal and the noise, and where and describe the propagation/tar-get scattering loss and the two-way travel time, respectively.
Supposing the noise variance to be known, we exemplarily solve case 2) of the aforementioned sonar target detection pro-blems by the following hypothesis test using the notation
, , ( 1)
, , ( 1)
0 , , ( 1) with 0,1, and .
T
l S S
T
l S S
T
S S
x lT x l K T
n lT n l K T
s s K T l K T T
x
n
s
2n

I N S T I T U T E O F W A T E R A C O U S T I C S,
S O N A R E N G I N E E R I N G A N DS I G N A L T H E O R Y
Chapter 4 / Sonar Signal Processing / Prof. Dr.-Ing. Dieter Kraus 85
Hypothesis Testing
1) Setting up of a hypothesis H0
xl does not contain the signal waveform s, i.e.
2) Setting up of an alternative H1
xl contains the signal waveform s, i.e.
where and the on [,) uniformly distributed phase of the echo signal.
20 : , ( , )l l l K nH x n x 0 I N
21 : , ( , )
with , , ,
l l l K n
j
H
e
x s n x s I
N
0
I N S T I T U T E O F W A T E R A C O U S T I C S,
S O N A R E N G I N E E R I N G A N DS I G N A L T H E O R Y
Chapter 4 / Sonar Signal Processing / Prof. Dr.-Ing. Dieter Kraus 86
3) The statistic t (xl) of the observation xl for testing the hy-pothesis H0 is given by the normalized magnitude of the matched filter output, i.e.
where ET = sHs denotes the transmitted signal energy.
4) Determination of the probability density function of the statistic T = t (xl) under H0 provides the Rayleigh density
1
0
2 2
( ) ( ) )( ) ,
KH
S Sk l
l
T n T n
s kT x l k Tt
E E
s x
x
20( | ) 2 exp .Tf t H t t

I N S T I T U T E O F W A T E R A C O U S T I C S,
S O N A R E N G I N E E R I N G A N DS I G N A L T H E O R Y
Chapter 4 / Sonar Signal Processing / Prof. Dr.-Ing. Dieter Kraus 87
5) Calculation of the threshold for discarding hypothesis H0. For a given probability of false alarm PFA the threshold can be determined as follows.
6) If t(xl) > one decides for H1, i.e. xl contains the wave-form s, with PFA = . If t (xl) one decides for H0, i.e. xl does not contain the waveform s.
7) Determination of the probability density function of the statistic T = t (xl) under H1 provides the Rice density
0
2 2
|
2 exp exp ln( )
FA
FA
P P T H
t t dt P
I N S T I T U T E O F W A T E R A C O U S T I C S,
S O N A R E N G I N E E R I N G A N DS I G N A L T H E O R Y
Chapter 4 / Sonar Signal Processing / Prof. Dr.-Ing. Dieter Kraus 88
where EE = (s)H(s) denotes the energy of the echo signal and where
is the Bessel-function of the first kind and order zero.
8) Calculation of the probability of detection PD. For a given threshold the probability of detection can be determined by
21 02 2
( | ) 2 exp 2 ,E ET
n n
E Ef t H t t I t
0
1( ) exp( cos )
2I x x d

I N S T I T U T E O F W A T E R A C O U S T I C S,
S O N A R E N G I N E E R I N G A N DS I G N A L T H E O R Y
Chapter 4 / Sonar Signal Processing / Prof. Dr.-Ing. Dieter Kraus 89
where Q is the so-called Marcum’s Q-function
1
202 2
202 2
|
2 exp 2
1 2 2exp ( , )
2
D
E E
n n
E E
n n
P P T H
E Et t I t dt
E Ez z I z dz Q d
22
with 2 2 and 2 2ln( ),EFA
outn
E Sd P
N
2 20
1( , ) exp .
2Q z z I z dz
I N S T I T U T E O F W A T E R A C O U S T I C S,
S O N A R E N G I N E E R I N G A N DS I G N A L T H E O R Y
Chapter 4 / Sonar Signal Processing / Prof. Dr.-Ing. Dieter Kraus 90
9) The evaluation of the PD as a function of SNR and para-meterized by various PFA provides the ROC-Curves de-picted in the following figure.

I N S T I T U T E O F W A T E R A C O U S T I C S,
S O N A R E N G I N E E R I N G A N DS I G N A L T H E O R Y
Chapter 4 / Sonar Signal Processing / Prof. Dr.-Ing. Dieter Kraus 91
Literature[1] Burdic, W.S: Underwater Acoustic System Analysis, Prentice-Hall,
2002
[2] Knight, W.C. et al: Digital signal processing for sonar, Proceedings of the IEEE, Nov. 1981, pp. 1451-1506
[3] Lurton, X.: An Introduction to Underwater Acoustics, Springer, 2004
[4] Nielson, R.O.: Sonar Signal Processing, Artech House, 1990
[5] Oppenheim, A.V.: Applications of Digital Signal Processing, Prentice-Hall, 1988
[6] Urick, R.I: Principles of Underwater sound, McGraw Hill, 1983
[7] Van Trees, H.L.: Detection, Estimation and Modulation Theory, Part 1: Detection, Estimation and Linear Modulation Theory,Part 3: Radar-Sonar Signal Processing and Gaussian Signals in Noise, Wiley, 1967 & 1969