Embed Size (px)
Citation preview
8/3/2019 Unempoyment Insurance and American Jobs Act Report
http://slidepdf.com/reader/full/unempoyment-insurance-and-american-jobs-act-report 1/28
Unemployment Insurance Extensions
and Reforms in the American Jobs Act
December 2011
Executive Office of the President

8/3/2019 Unempoyment Insurance and American Jobs Act Report
http://slidepdf.com/reader/full/unempoyment-insurance-and-american-jobs-act-report 2/28
This report was prepared by the President’s Council of Economic Advisers, the National
Economic Council, the Domestic Policy Council, and the Department of Labor.
8/3/2019 Unempoyment Insurance and American Jobs Act Report
http://slidepdf.com/reader/full/unempoyment-insurance-and-american-jobs-act-report 3/28
Unemployment Insurance Extensions andReforms in the American Jobs Act
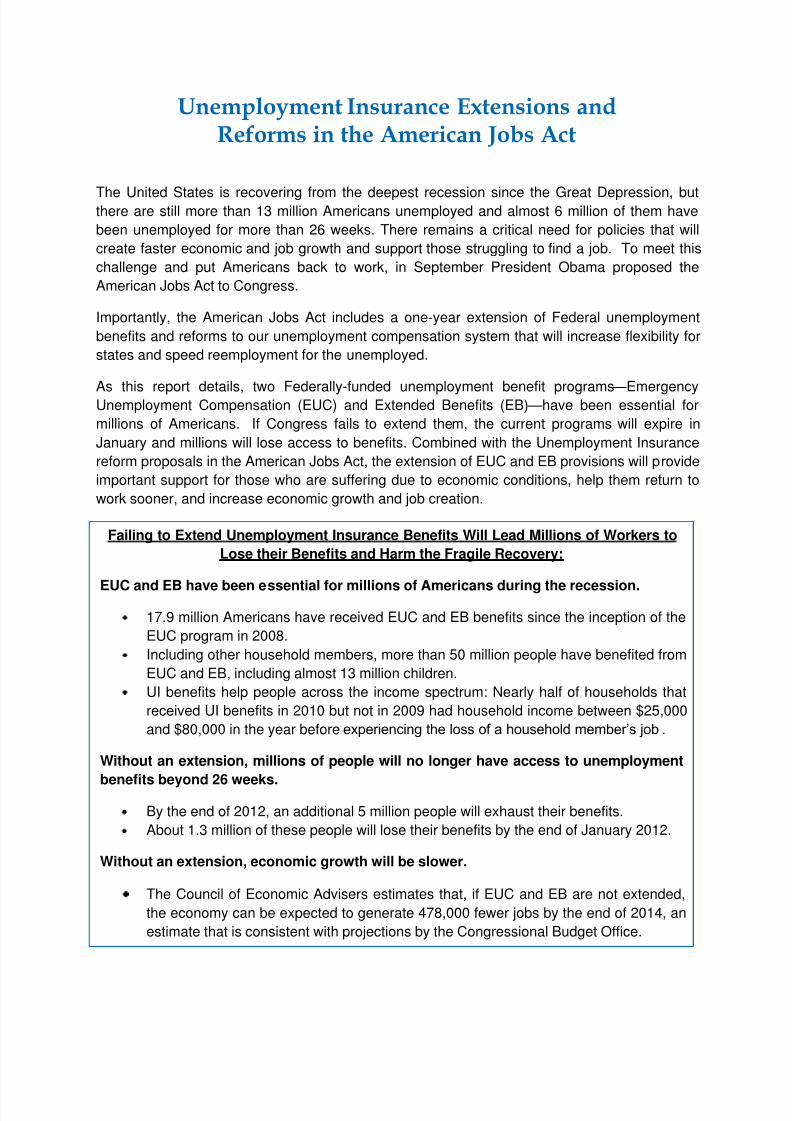
The United States is recovering from the deepest recession since the Great Depression, butthere are still more than 13 million Americans unemployed and almost 6 million of them have
been unemployed for more than 26 weeks. There remains a critical need for policies that will
create faster economic and job growth and support those struggling to find a job. To meet this
challenge and put Americans back to work, in September President Obama proposed the
American Jobs Act to Congress.
Importantly, the American Jobs Act includes a one-year extension of Federal unemployment
benefits and reforms to our unemployment compensation system that will increase flexibility for
states and speed reemployment for the unemployed.
As this report details, two Federally-funded unemployment benefit programs—EmergencyUnemployment Compensation (EUC) and Extended Benefits (EB)—have been essential for
millions of Americans. If Congress fails to extend them, the current programs will expire in
January and millions will lose access to benefits. Combined with the Unemployment Insurance
reform proposals in the American Jobs Act, the extension of EUC and EB provisions will provide
important support for those who are suffering due to economic conditions, help them return to
work sooner, and increase economic growth and job creation.
Failing to Extend Unemployment Insurance Benefits Will Lead Millions of Workers to
Lose their Benefits and Harm the Fragile Recovery:
EUC and EB have been essential for millions of Americans during the recession.
17.9 million Americans have received EUC and EB benefits since the inception of the
EUC program in 2008.
Including other household members, more than 50 million people have benefited from
EUC and EB, including almost 13 million children.
UI benefits help people across the income spectrum: Nearly half of households that
received UI benefits in 2010 but not in 2009 had household income between $25,000
and $80,000 in the year before experiencing the loss of a household member’s job.
Without an extension, millions of people will no longer have access to unemployment
benefits beyond 26 weeks.
By the end of 2012, an additional 5 million people will exhaust their benefits.
About 1.3 million of these people will lose their benefits by the end of January 2012.
Without an extension, economic growth will be slower.
The Council of Economic Advisers estimates that, if EUC and EB are not extended,
the economy can be expected to generate 478,000 fewer jobs by the end of 2014, an
estimate that is consistent with projections by the Congressional Budget Office.
8/3/2019 Unempoyment Insurance and American Jobs Act Report
http://slidepdf.com/reader/full/unempoyment-insurance-and-american-jobs-act-report 4/28
1
Unemployment Insurance Extensions and Reforms in the American Jobs Act
Background
Unemployment Insurance (UI) is a joint Federal-State program that provides income support
to workers who have lost a job. Nearly all full-time and some part-time workers who meet basic
criteria are eligible for UI. Weekly UI payments for eligible unemployed workers are determined
by their past wages, up to a maximum weekly benefit. Program parameters vary across states,
but weekly benefits in 2011 average about $300, replacing about half of UI recipients’ lost
earnings. Unemployed workers typically qualify for up to 26 weeks of benefits, as long as they
continue to search for work. In an economy with normal labor demand, one would expect most
unemployed workers to find a job within this time frame; in periods of high unemployment,
however, finding a job may take longer.
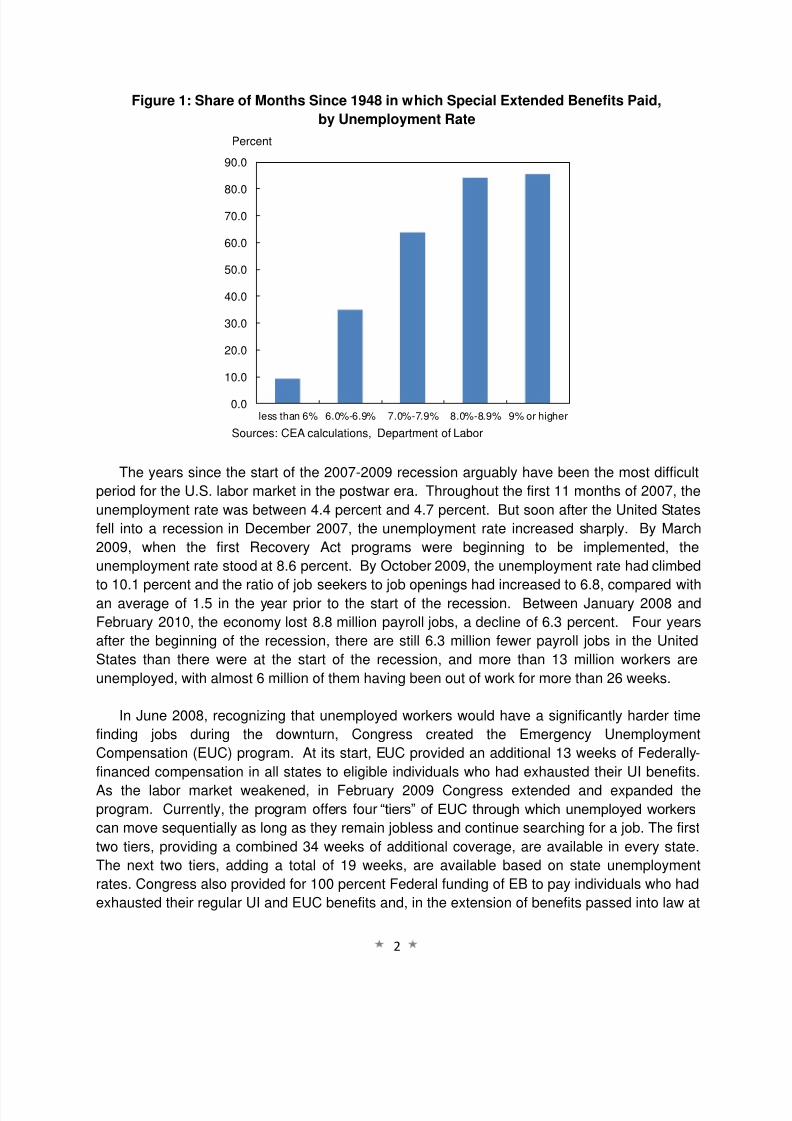
Since 1970, unemployment benefits have been extended in states experiencing high
unemployment through the Extended Benefits (EB) program, a joint Federal-State program.
When state unemployment rates reach specific thresholds, the EB program allows states to
provide 13 or 20 weeks of additional benefits with the Federal government paying one-half of
the cost. EB is a standing program; in addition, in every recession since 1957, the Federal
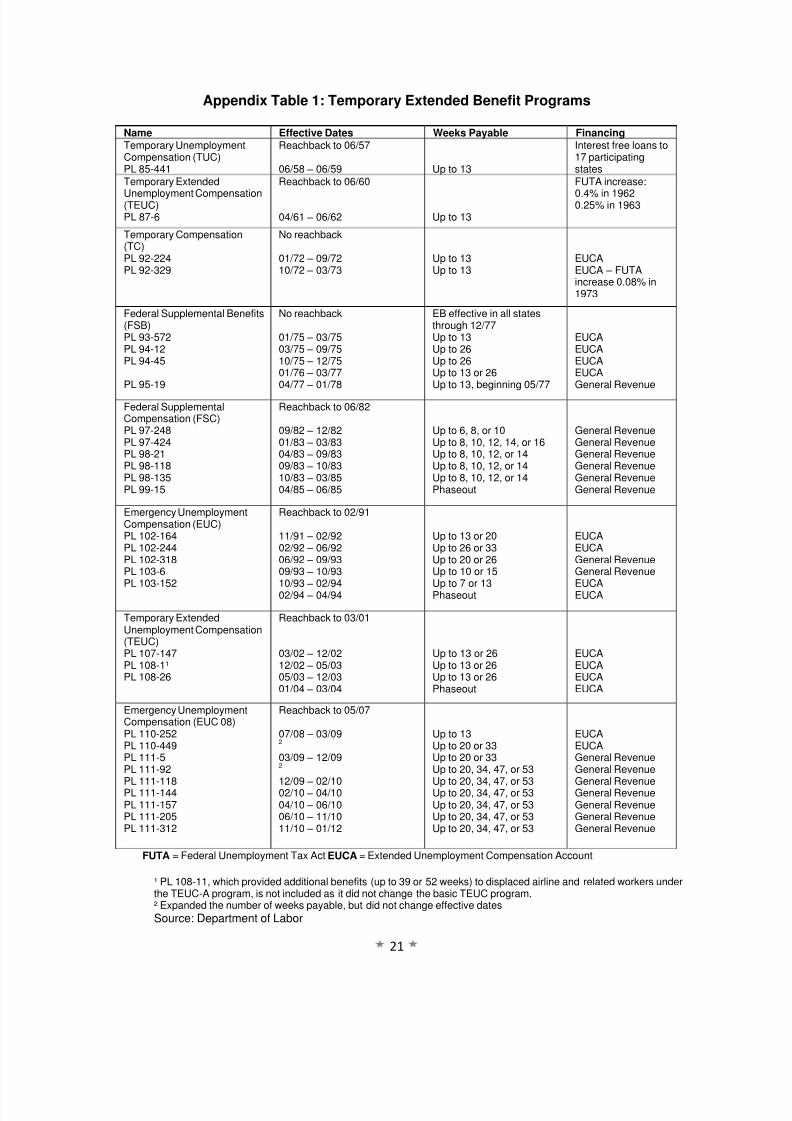
government has stepped in to provide additional support for unemployed workers.1 Appendix
Table 1 details all special extended benefits programs since the Temporary Unemployment
Compensation program of 1958. Since 1948, when official monthly unemployment rates first
became available, special extended benefits have been provided to long-term unemployed
workers in 85 percent of the months in which the national unemployment rate was 8 percent orhigher (see Figure 1).
1The only exception is the short recession during 1980, which was followed by a deeper recession beginning in July
1981. Congress passed an unemployment insurance extension in September 1982 that can be viewed as aresponse to the combined effects of the two recessions.
8/3/2019 Unempoyment Insurance and American Jobs Act Report
http://slidepdf.com/reader/full/unempoyment-insurance-and-american-jobs-act-report 5/28
2
Figure 1: Share of Months Since 1948 in which Special Extended Benefits Paid,
by Unemployment Rate
The years since the start of the 2007-2009 recession arguably have been the most difficult
period for the U.S. labor market in the postwar era. Throughout the first 11 months of 2007, the
unemployment rate was between 4.4 percent and 4.7 percent. But soon after the United States
fell into a recession in December 2007, the unemployment rate increased sharply. By March
2009, when the first Recovery Act programs were beginning to be implemented, the
unemployment rate stood at 8.6 percent. By October 2009, the unemployment rate had climbed
to 10.1 percent and the ratio of job seekers to job openings had increased to 6.8, compared withan average of 1.5 in the year prior to the start of the recession. Between January 2008 and
February 2010, the economy lost 8.8 million payroll jobs, a decline of 6.3 percent. Four years
after the beginning of the recession, there are still 6.3 million fewer payroll jobs in the United
States than there were at the start of the recession, and more than 13 million workers are
unemployed, with almost 6 million of them having been out of work for more than 26 weeks.
In June 2008, recognizing that unemployed workers would have a significantly harder time
finding jobs during the downturn, Congress created the Emergency Unemployment
Compensation (EUC) program. At its start, EUC provided an additional 13 weeks of Federally-
financed compensation in all states to eligible individuals who had exhausted their UI benefits.
As the labor market weakened, in February 2009 Congress extended and expanded theprogram. Currently, the program offers four “tiers” of EUC through which unemployed workers
can move sequentially as long as they remain jobless and continue searching for a job. The first
two tiers, providing a combined 34 weeks of additional coverage, are available in every state.
The next two tiers, adding a total of 19 weeks, are available based on state unemployment
rates. Congress also provided for 100 percent Federal funding of EB to pay individuals who had
exhausted their regular UI and EUC benefits and, in the extension of benefits passed into law at
0.0
10.0
20.0
30.0
40.0
50.0
60.0
70.0
80.0
90.0
less than 6% 6.0%-6.9% 7.0%-7.9% 8.0%-8.9% 9% or higher
Percent
Sources: CEA calculations, Department of Labor
8/3/2019 Unempoyment Insurance and American Jobs Act Report
http://slidepdf.com/reader/full/unempoyment-insurance-and-american-jobs-act-report 6/28
3
the end of 2010, loosened the triggers governing state eligibility for EB.2 Given their budget
situations, states had been reluctant to adopt EB programs that would pay benefits under less-
stringent optional triggers if they had to pay half the cost, but they began to offer such benefits
contingent on the availability of 100 percent Federal EB funding as provided in the Recovery
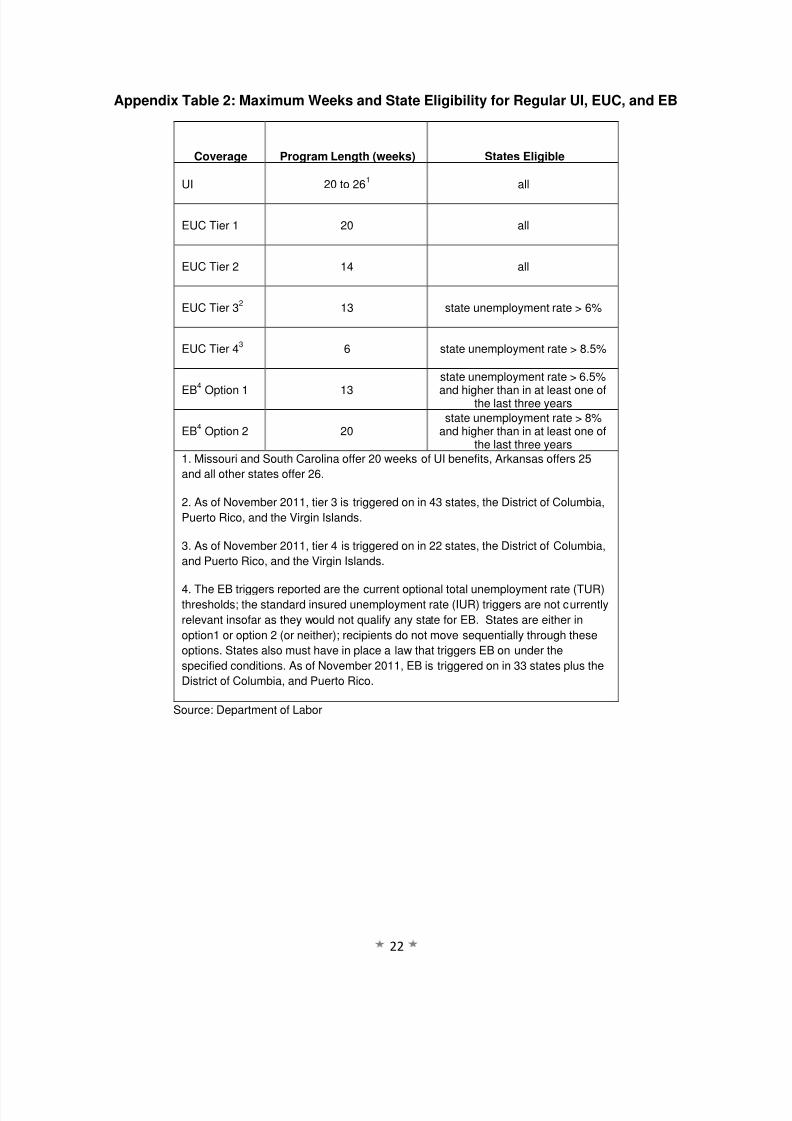
Act. Appendix Table 2 shows the different tiers of benefits for which workers may be eligible
under the regular UI program, EUC and EB, depending on state law and the unemployment ratein the state. All told, in those states with the highest rates of unemployment, an unemployed
worker could receive up to 99 weeks of benefits.
At the time EUC was initiated in June 2008, there were 1.6 million workers who had been
unemployed for longer than 26 weeks. Congress responded more quickly than in previous
recessions due to the speed with which the economy was weakening. By the time tiers 3 and 4
of EUC were added in November 2009, the number of long-term unemployed had risen to 5.9
million.
Although improved from a year ago, the job market continues to be difficult for workers
seeking employment. As of November 2011, the unemployment rate stood at 8.6 percent and
5.7 million workers had been out of work for more than 26 weeks; the average duration of
unemployment was 40.9 weeks. In October, the latest month for which job vacancy data are
available, there were more than four job seekers per job opening (versus 1.5 pre-recession).
Estimates based on flow data from the Bureau of Labor Statistics monthly Current Population
Survey (CPS) show that the probability that an unemployed worker finds a job in any given
month is roughly 17 percent. For those who have been unemployed for more than 26 weeks,
the monthly job-finding rate is closer to ten percent. In no prior case has Congress allowed
special extended benefits to expire when the unemployment rate was as high as it is today. For
example, during the recovery from the 1981-82 recession, the most severe postwar recession
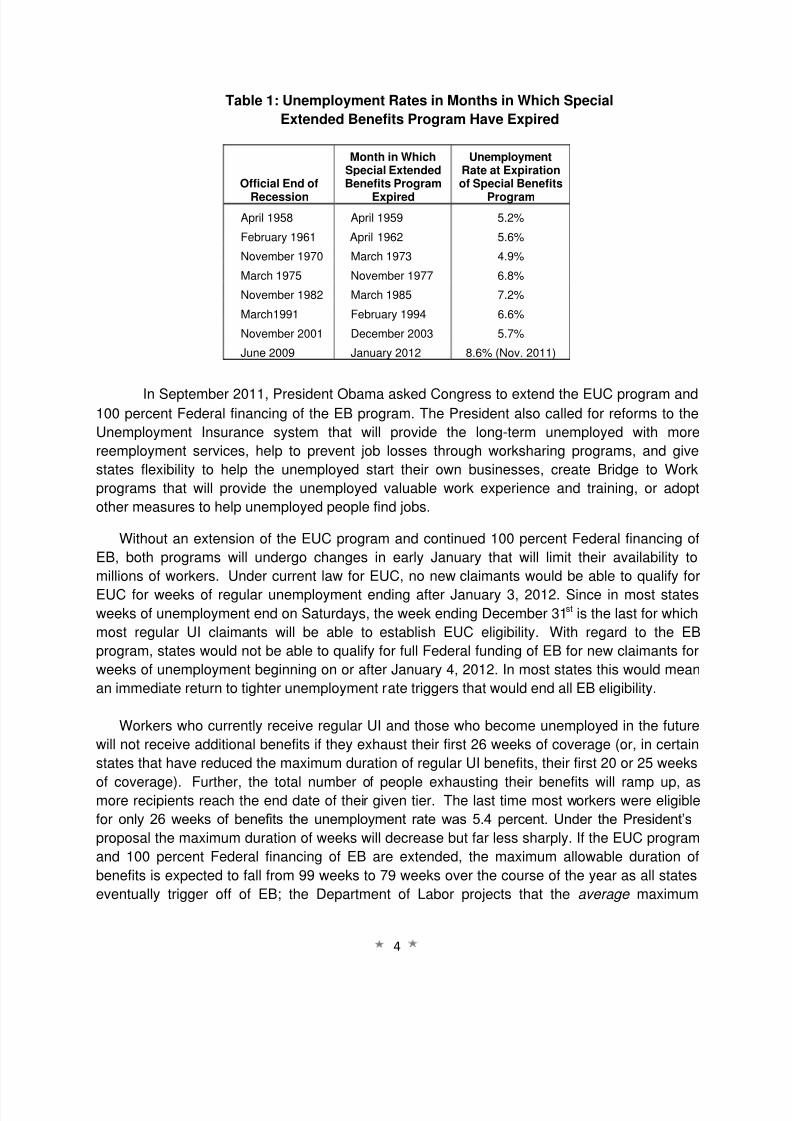
before 2007, the extensions passed under President Reagan lasted until March 1985, by whichtime the economy had made a sizeable recovery from its trough. Table 1 reports the eight times
since 1956 that special extended benefits have been offered. For each, it shows the month the
recession ended, the month the special extended benefits program expired, and the
unemployment rate in that month.
2A state is required to offer EB if its insured unemployment rate (IUR) exceeds 5 percent and is at least 20 percent
higher than in each of the last three years, but this condition is currently not satisfied in any state. The same is true ofthe alternative optional trigger that the state IUR exceeds 6 percent. In most cases, for a state to qualify for EB, itstotal unemployment rate (TUR) must exceed the trigger value shown in Appendix Table 2 and this state TUR must behigher than it was either one year or two years earlier. Under the most recent benefits extension, the “look back”period for EB was extended temporarily to three years rather than two years, making more states eligible to offer EBbenefits.
8/3/2019 Unempoyment Insurance and American Jobs Act Report
http://slidepdf.com/reader/full/unempoyment-insurance-and-american-jobs-act-report 7/28
4
Table 1: Unemployment Rates in Months in Which Special
Extended Benefits Program Have Expired
Official End of
Recession
Month in WhichSpecial ExtendedBenefits Program
Expired
UnemploymentRate at Expirationof Special Benefits
Program
April 1958 April 1959 5.2%
February 1961 April 1962 5.6%
November 1970 March 1973 4.9%
March 1975 November 1977 6.8%
November 1982 March 1985 7.2%
March1991 February 1994 6.6%
November 2001 December 2003 5.7%
June 2009 January 2012 8.6% (Nov. 2011)
In September 2011, President Obama asked Congress to extend the EUC program and100 percent Federal financing of the EB program. The President also called for reforms to the
Unemployment Insurance system that will provide the long-term unemployed with more
reemployment services, help to prevent job losses through worksharing programs, and give
states flexibility to help the unemployed start their own businesses, create Bridge to Work
programs that will provide the unemployed valuable work experience and training, or adopt
other measures to help unemployed people find jobs.
Without an extension of the EUC program and continued 100 percent Federal financing of
EB, both programs will undergo changes in early January that will limit their availability to
millions of workers. Under current law for EUC, no new claimants would be able to qualify for
EUC for weeks of regular unemployment ending after January 3, 2012. Since in most states
weeks of unemployment end on Saturdays, the week ending December 31st is the last for which
most regular UI claimants will be able to establish EUC eligibility. With regard to the EB
program, states would not be able to qualify for full Federal funding of EB for new claimants for
weeks of unemployment beginning on or after January 4, 2012. In most states this would mean
an immediate return to tighter unemployment rate triggers that would end all EB eligibility.
Workers who currently receive regular UI and those who become unemployed in the future
will not receive additional benefits if they exhaust their first 26 weeks of coverage (or, in certain
states that have reduced the maximum duration of regular UI benefits, their first 20 or 25 weeks
of coverage). Further, the total number of people exhausting their benefits will ramp up, asmore recipients reach the end date of their given tier. The last time most workers were eligible
for only 26 weeks of benefits the unemployment rate was 5.4 percent. Under the President’s
proposal the maximum duration of weeks will decrease but far less sharply. If the EUC program
and 100 percent Federal financing of EB are extended, the maximum allowable duration of
benefits is expected to fall from 99 weeks to 79 weeks over the course of the year as all states
eventually trigger off of EB; the Department of Labor projects that the average maximum
8/3/2019 Unempoyment Insurance and American Jobs Act Report
http://slidepdf.com/reader/full/unempoyment-insurance-and-american-jobs-act-report 8/28
5
duration of unemployment benefits across all states will decrease from 93 weeks at the present
time to 75 weeks at the end of 2012.
The remainder of this report examines the current EUC/EB program and the impact it
has had on individuals, the labor market, and the larger economy. The report then details
projections for benefit receipts and jobs if benefits are not extended. Finally, the report reviewsPresident Obama’s proposals to revamp the Unemployment Insurance system to help those
looking for work.
People Who Have Been Helped
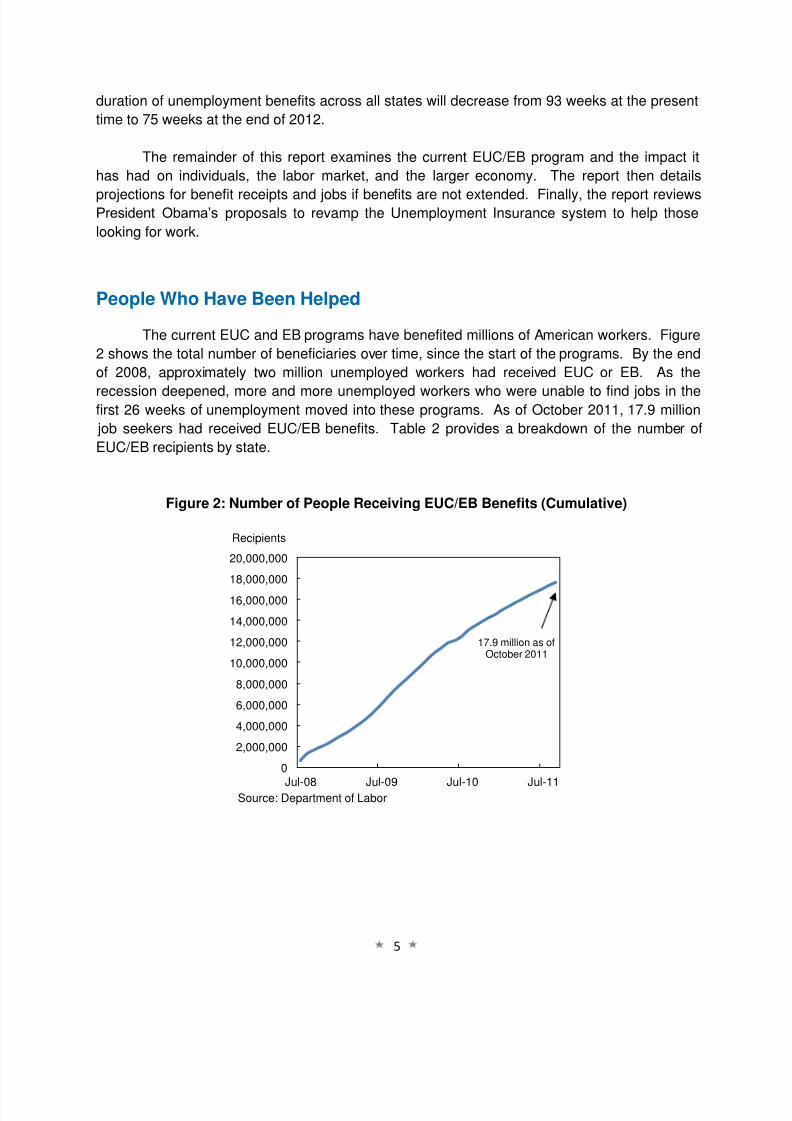
The current EUC and EB programs have benefited millions of American workers. Figure
2 shows the total number of beneficiaries over time, since the start of the programs. By the end
of 2008, approximately two million unemployed workers had received EUC or EB. As the
recession deepened, more and more unemployed workers who were unable to find jobs in thefirst 26 weeks of unemployment moved into these programs. As of October 2011, 17.9 million
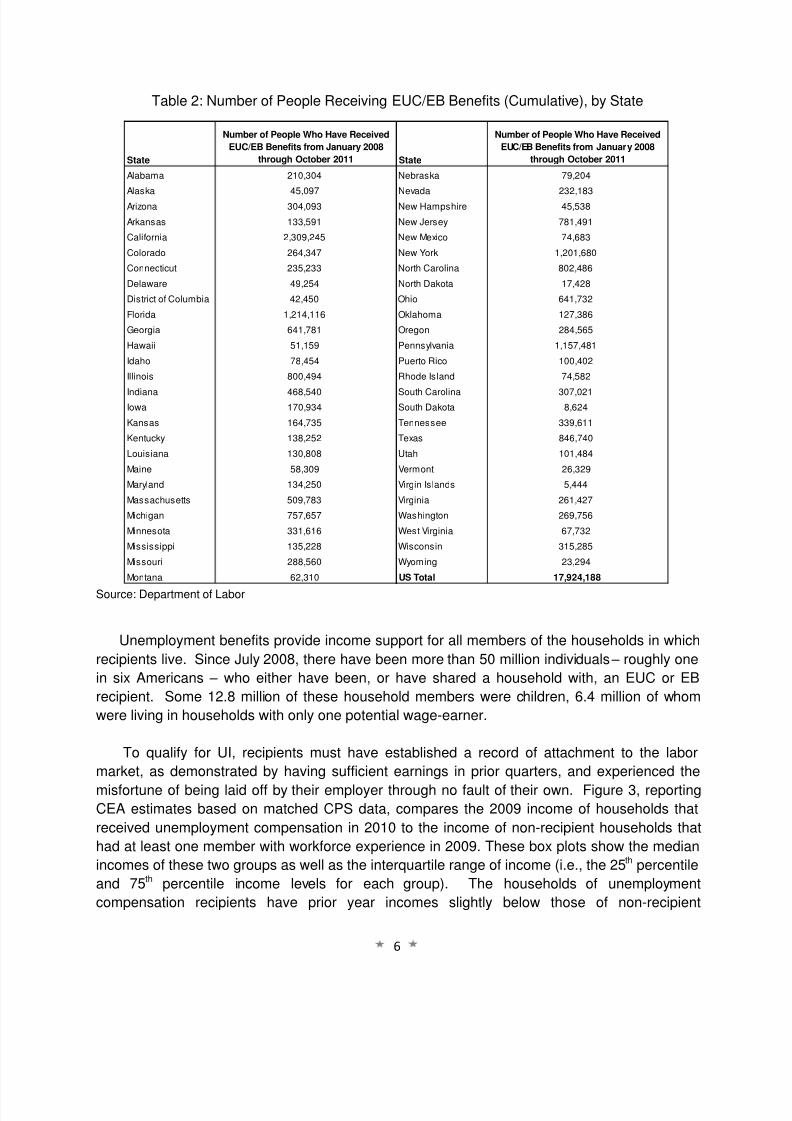
job seekers had received EUC/EB benefits. Table 2 provides a breakdown of the number of
EUC/EB recipients by state.
Figure 2: Number of People Receiving EUC/EB Benefits (Cumulative)
0
2,000,000
4,000,000
6,000,000
8,000,000
10,000,000
12,000,000
14,000,000
16,000,000
18,000,000
20,000,000
Jul-08 Jul-09 Jul-10 Jul-11
Recipients
17.9 million as ofOctober 2011
Source: Department of Labor
8/3/2019 Unempoyment Insurance and American Jobs Act Report
http://slidepdf.com/reader/full/unempoyment-insurance-and-american-jobs-act-report 9/28
6
Table 2: Number of People Receiving EUC/EB Benefits (Cumulative), by State
Source: Department of Labor
Unemployment benefits provide income support for all members of the households in which
recipients live. Since July 2008, there have been more than 50 million individuals – roughly one
in six Americans – who either have been, or have shared a household with, an EUC or EB
recipient. Some 12.8 million of these household members were children, 6.4 million of whom
were living in households with only one potential wage-earner.
To qualify for UI, recipients must have established a record of attachment to the labor
market, as demonstrated by having sufficient earnings in prior quarters, and experienced the
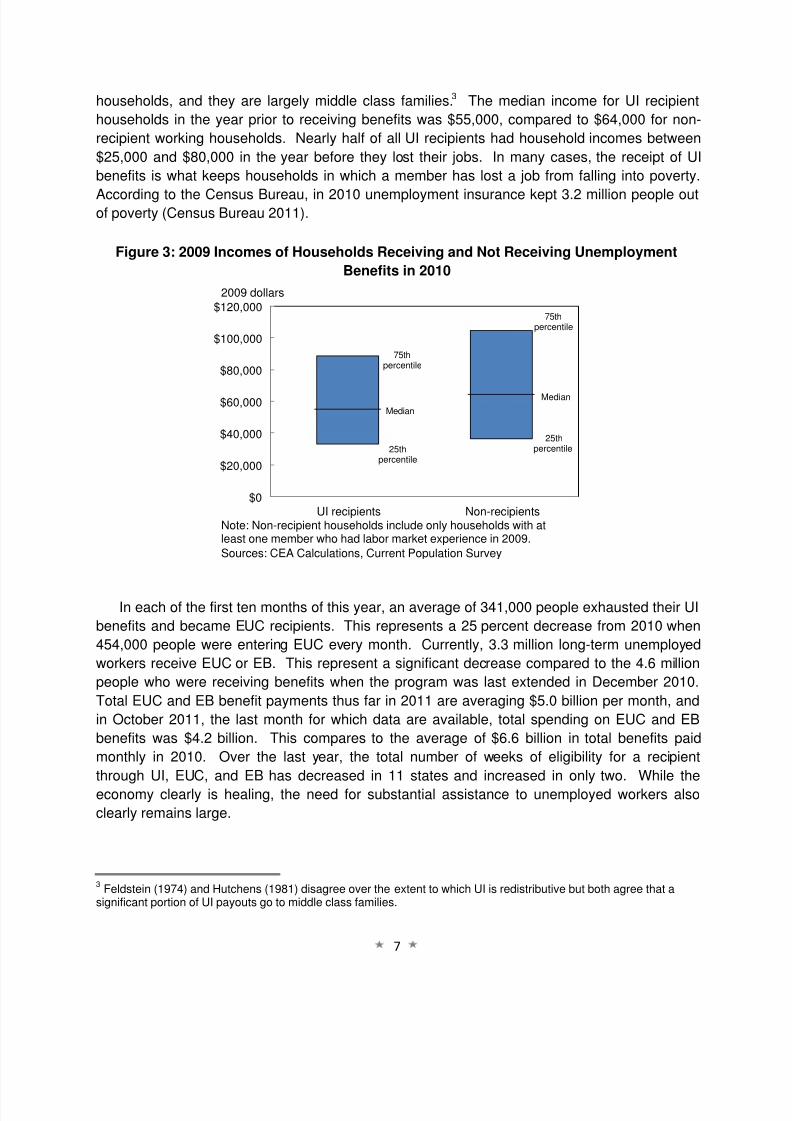
misfortune of being laid off by their employer through no fault of their own. Figure 3, reportingCEA estimates based on matched CPS data, compares the 2009 income of households that
received unemployment compensation in 2010 to the income of non-recipient households that
had at least one member with workforce experience in 2009. These box plots show the median
incomes of these two groups as well as the interquartile range of income (i.e., the 25 th percentile
and 75th percentile income levels for each group). The households of unemployment
compensation recipients have prior year incomes slightly below those of non-recipient
State
Number of People Who Have Received
EUC/EB Benefits from January 2008
through October 2011 State
Number of People Who Have Received
EUC/EB Benefits from January 2008
through October 2011
Alabama 210,304 Nebraska 79,204
Alaska 45,097 Nevada 232,183
Arizona 304,093 New Hampshire 45,538
Arkansas 133,591 New Jersey 781,491
California 2,309,245 New Mexico 74,683
Colorado 264,347 New York 1,201,680
Connecticut 235,233 North Carolina 802,486
Delaware 49,254 North Dakota 17,428
District of Columbia 42,450 Ohio 641,732
Florida 1,214,116 Oklahoma 127,386
Georgia 641,781 Oregon 284,565
Hawaii 51,159 Pennsylvania 1,157,481
Idaho 78,454 Puerto Rico 100,402
Illinois 800,494 Rhode Island 74,582
Indiana 468,540 South Carolina 307,021Iowa 170,934 South Dakota 8,624
Kansas 164,735 Tennessee 339,611
Kentucky 138,252 Texas 846,740
Louisiana 130,808 Utah 101,484
Maine 58,309 Vermont 26,329
Maryland 134,250 Virgin Islands 5,444
Massachusetts 509,783 Virginia 261,427
Michigan 757,657 Washington 269,756
Minnesota 331,616 West Virginia 67,732
Mississippi 135,228 Wisconsin 315,285
Missouri 288,560 Wyoming 23,294
Montana 62,310 US Total 17,924,188
8/3/2019 Unempoyment Insurance and American Jobs Act Report
http://slidepdf.com/reader/full/unempoyment-insurance-and-american-jobs-act-report 10/28
7
households, and they are largely middle class families.3 The median income for UI recipient
households in the year prior to receiving benefits was $55,000, compared to $64,000 for non-
recipient working households. Nearly half of all UI recipients had household incomes between
$25,000 and $80,000 in the year before they lost their jobs. In many cases, the receipt of UI
benefits is what keeps households in which a member has lost a job from falling into poverty.
According to the Census Bureau, in 2010 unemployment insurance kept 3.2 million people outof poverty (Census Bureau 2011).
Figure 3: 2009 Incomes of Households Receiving and Not Receiving Unemployment
Benefits in 2010
In each of the first ten months of this year, an average of 341,000 people exhausted their UI
benefits and became EUC recipients. This represents a 25 percent decrease from 2010 when
454,000 people were entering EUC every month. Currently, 3.3 million long-term unemployed
workers receive EUC or EB. This represent a significant decrease compared to the 4.6 million
people who were receiving benefits when the program was last extended in December 2010.
Total EUC and EB benefit payments thus far in 2011 are averaging $5.0 billion per month, and
in October 2011, the last month for which data are available, total spending on EUC and EB
benefits was $4.2 billion. This compares to the average of $6.6 billion in total benefits paid
monthly in 2010. Over the last year, the total number of weeks of eligibility for a recipient
through UI, EUC, and EB has decreased in 11 states and increased in only two. While the
economy clearly is healing, the need for substantial assistance to unemployed workers also
clearly remains large.
3Feldstein (1974) and Hutchens (1981) disagree over the extent to which UI is redistributive but both agree that a
significant portion of UI payouts go to middle class families.
$0
$20,000
$40,000
$60,000
$80,000
$100,000
$120,000
UI recipients Non-recipients
75thpercentile
25thpercentile
Sources: CEA Calculations, Current Population Survey
2009 dollars
Median
75thpercentile
Median
25thpercentile
Note: Non-recipient households include only households with atleast one member who had labor market experience in 2009.
8/3/2019 Unempoyment Insurance and American Jobs Act Report
http://slidepdf.com/reader/full/unempoyment-insurance-and-american-jobs-act-report 11/28
8
Effect on the Labor Market
Economic policies often involve tradeoffs. Unemployment compensation is no exception.
Unemployment compensation can potentially be a disincentive for some workers to search
intensively or to accept an offer if they receive one; however, unemployment compensation also
provides crucial income support for a vulnerable group of people after they have lost a jobthrough no fault of their own. These benefits enable the unemployed to search for jobs that
utilize their skills and help to stabilize the aggregate economy by providing income support to a
population with a high marginal propensity to consume during times when the economy is weak.
The extent of these tradeoffs can vary with the business cycle. The optimal policy takes into
account the nature of the tradeoffs involved.
The Congressional Budget Office (CBO) recently assessed the various effects of extended
unemployment benefits and came to the following conclusion:
[T]he various effects of extending additional unemployment benefits apart from the effects
on the overall demand for goods and services would, on balance, increase the measuredunemployment rate (primarily by keeping workers in the labor force) but have little effect onthe number of people employed. Accordingly, CBO’s estimates of the impact of this policyoption on output and employment include only the effects of boosting demand for goods andservices. (CBO 2011)
As explained below, this conclusion is consistent with available empirical research.
Economists long have studied the incentive effects of UI programs on job search behavior
(Meyer 1990). On the one hand, offering a cash benefit to unemployed workers may make
them less likely to search aggressively for employment or accept a job that is available—the so-
called “moral hazard” effect. On the other hand, providing UI to unemployed workers gives
them funds that can help them meet their basic needs as they search for work. In the parlanceof economics, workers who lack adequate savings are liquidity constrained, and UI benefits can
help to overcome those liquidity constraints that may force these workers to accept a job that is
a poor match for their talents. Chetty (2008) shows that the beneficial impact of helping liquidity
constrained unemployed workers more than outweighs the moral hazard effect. Indeed, he finds
hardly any evidence of a moral hazard effect once the liquidity effect is recognized. Moreover,
while economists have not estimated large impacts of UI on search behavior even in strong
labor markets (Card and Levine 2000), recent research shows that the effect of UI on job search
behavior is likely even smaller in recessions—when jobs are scarce, strategic considerations
often give way to the urgent need to find a job (Kroft and Notowidigdo 2011, Schmieder, von
Wachter, and Bender forthcoming).
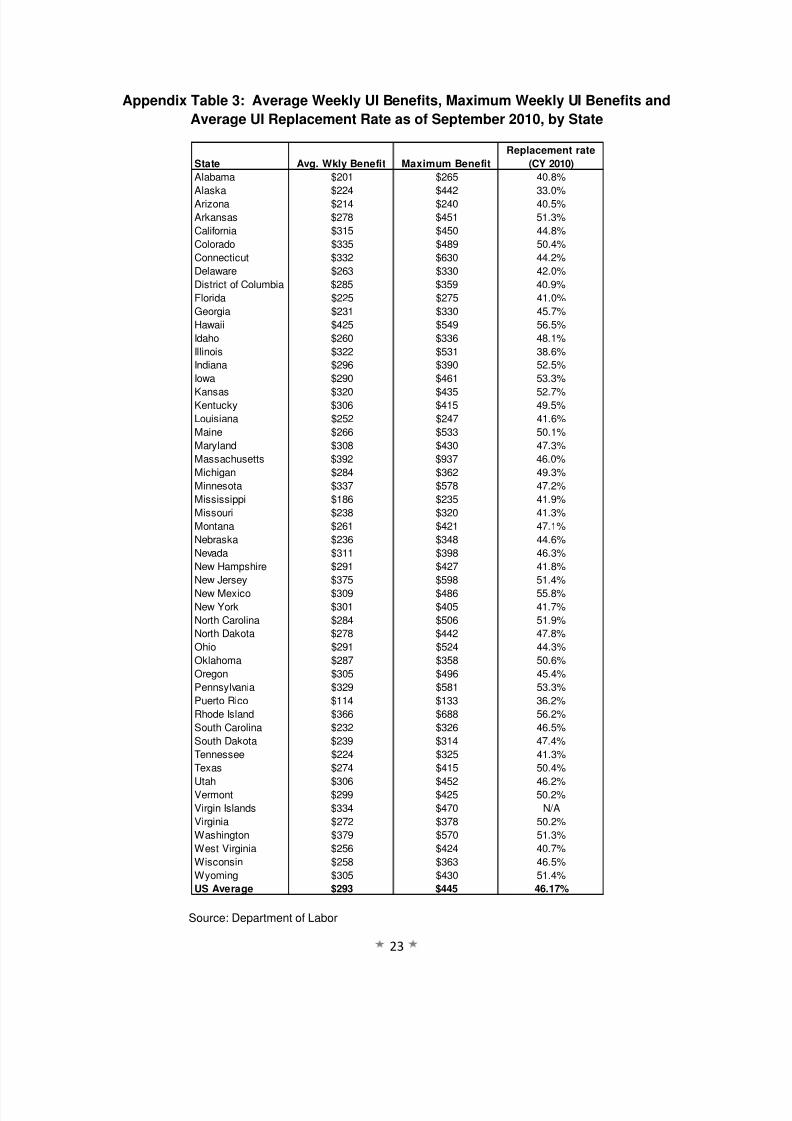
Even in normal times, any possible disincentive effect is muted because the average state
benefit is not large, only about $300 per week. Over a full year, this amounts to less than one
third of the average annual expenditures ($48,109 in 2010) for all households in the Consumer
Expenditure Survey. Even at the average state maximum benefit of $450 a week, a UI recipient
could cover only half of average expenditures. (See Appendix Table 3 for benefit levels by
state.)
8/3/2019 Unempoyment Insurance and American Jobs Act Report
http://slidepdf.com/reader/full/unempoyment-insurance-and-american-jobs-act-report 12/28
9
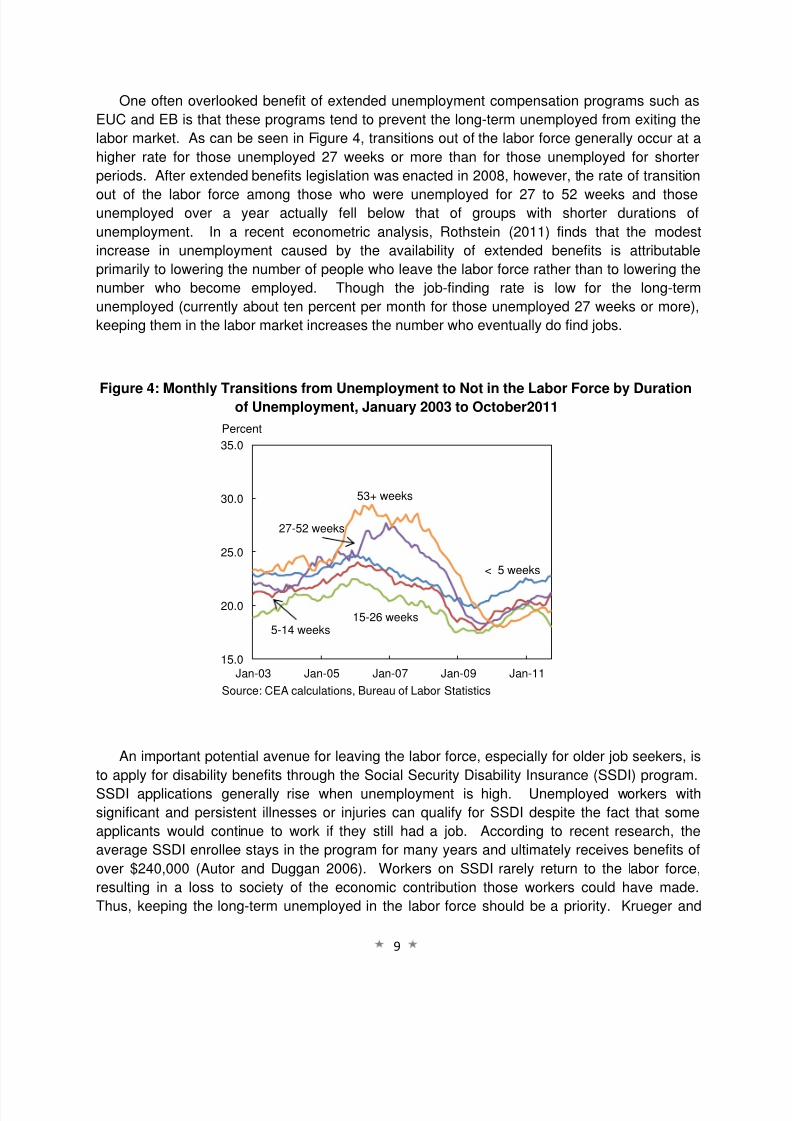
One often overlooked benefit of extended unemployment compensation programs such as
EUC and EB is that these programs tend to prevent the long-term unemployed from exiting the
labor market. As can be seen in Figure 4, transitions out of the labor force generally occur at a
higher rate for those unemployed 27 weeks or more than for those unemployed for shorter
periods. After extended benefits legislation was enacted in 2008, however, the rate of transition
out of the labor force among those who were unemployed for 27 to 52 weeks and thoseunemployed over a year actually fell below that of groups with shorter durations of
unemployment. In a recent econometric analysis, Rothstein (2011) finds that the modest
increase in unemployment caused by the availability of extended benefits is attributable
primarily to lowering the number of people who leave the labor force rather than to lowering the
number who become employed. Though the job-finding rate is low for the long-term
unemployed (currently about ten percent per month for those unemployed 27 weeks or more),
keeping them in the labor market increases the number who eventually do find jobs.
Figure 4: Monthly Transitions from Unemployment to Not in the Labor Force by Durationof Unemployment, January 2003 to October2011
An important potential avenue for leaving the labor force, especially for older job seekers, is
to apply for disability benefits through the Social Security Disability Insurance (SSDI) program.
SSDI applications generally rise when unemployment is high. Unemployed workers with
significant and persistent illnesses or injuries can qualify for SSDI despite the fact that some
applicants would continue to work if they still had a job. According to recent research, the
average SSDI enrollee stays in the program for many years and ultimately receives benefits of
over $240,000 (Autor and Duggan 2006). Workers on SSDI rarely return to the labor force,
resulting in a loss to society of the economic contribution those workers could have made.
Thus, keeping the long-term unemployed in the labor force should be a priority. Krueger and
15.0
20.0
25.0
30.0
35.0
Jan-03 Jan-05 Jan-07 Jan-09 Jan-11
Percent
Source: CEA calculations, Bureau of Labor Statistics
< 5 weeks
5-14 weeks15-26 weeks
27-52 weeks
53+ weeks
8/3/2019 Unempoyment Insurance and American Jobs Act Report
http://slidepdf.com/reader/full/unempoyment-insurance-and-american-jobs-act-report 13/28
10
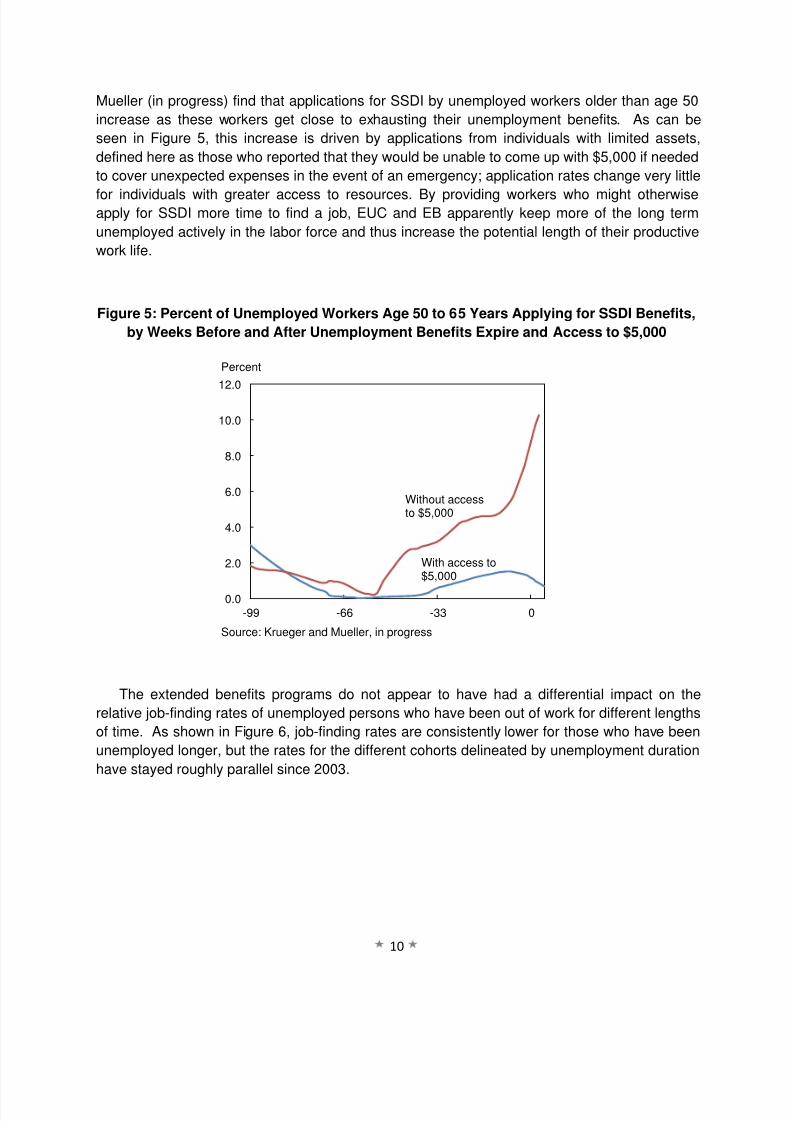
Mueller (in progress) find that applications for SSDI by unemployed workers older than age 50
increase as these workers get close to exhausting their unemployment benefits. As can be
seen in Figure 5, this increase is driven by applications from individuals with limited assets,
defined here as those who reported that they would be unable to come up with $5,000 if needed
to cover unexpected expenses in the event of an emergency; application rates change very little
for individuals with greater access to resources. By providing workers who might otherwiseapply for SSDI more time to find a job, EUC and EB apparently keep more of the long term
unemployed actively in the labor force and thus increase the potential length of their productive
work life.
Figure 5: Percent of Unemployed Workers Age 50 to 65 Years Applying for SSDI Benefits,
by Weeks Before and After Unemployment Benefits Expire and Access to $5,000
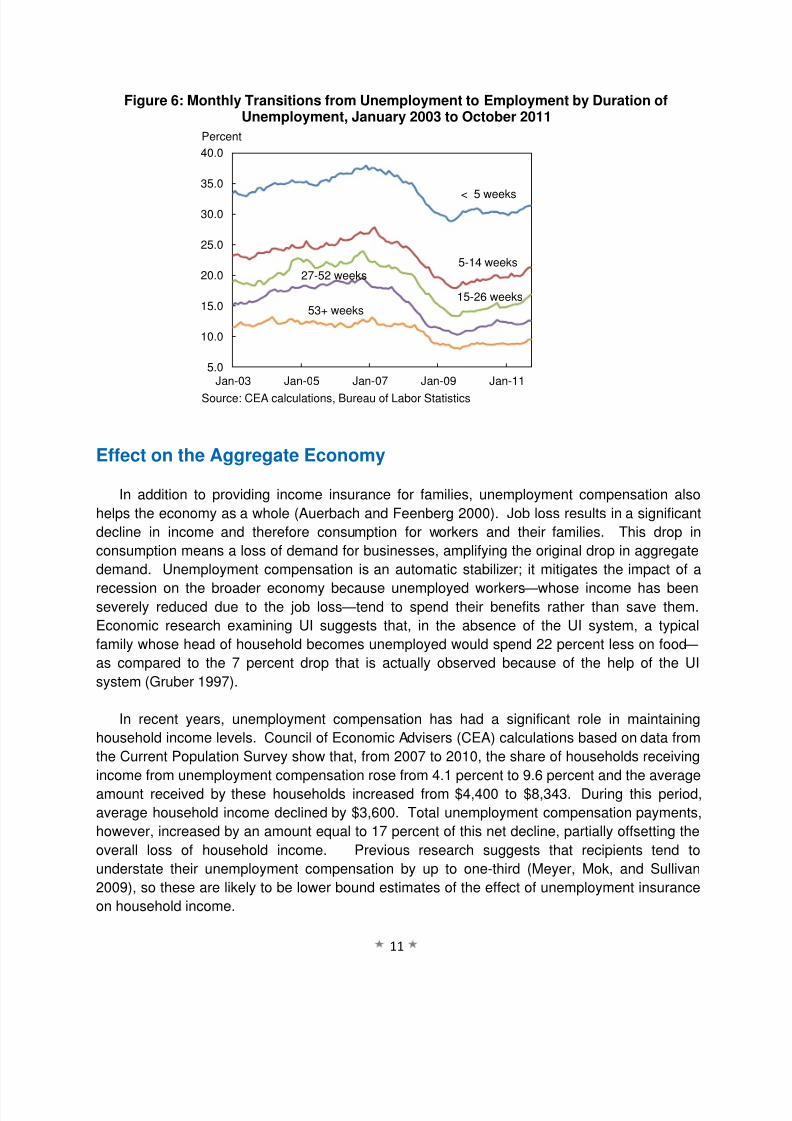
The extended benefits programs do not appear to have had a differential impact on the
relative job-finding rates of unemployed persons who have been out of work for different lengths
of time. As shown in Figure 6, job-finding rates are consistently lower for those who have been
unemployed longer, but the rates for the different cohorts delineated by unemployment duration
have stayed roughly parallel since 2003.
0.0
2.0
4.0
6.0
8.0
10.0
12.0
-99 -66 -33 0
Percent
Without accessto $5,000
With access to$5,000
Source: Krueger and Mueller, in progress
8/3/2019 Unempoyment Insurance and American Jobs Act Report
http://slidepdf.com/reader/full/unempoyment-insurance-and-american-jobs-act-report 14/28
11
Figure 6: Monthly Transitions from Unemployment to Employment by Duration ofUnemployment, January 2003 to October 2011
Effect on the Aggregate Economy
In addition to providing income insurance for families, unemployment compensation also
helps the economy as a whole (Auerbach and Feenberg 2000). Job loss results in a significant
decline in income and therefore consumption for workers and their families. This drop in
consumption means a loss of demand for businesses, amplifying the original drop in aggregate
demand. Unemployment compensation is an automatic stabilizer; it mitigates the impact of a
recession on the broader economy because unemployed workers—whose income has beenseverely reduced due to the job loss—tend to spend their benefits rather than save them.
Economic research examining UI suggests that, in the absence of the UI system, a typical
family whose head of household becomes unemployed would spend 22 percent less on food—
as compared to the 7 percent drop that is actually observed because of the help of the UI
system (Gruber 1997).
In recent years, unemployment compensation has had a significant role in maintaining
household income levels. Council of Economic Advisers (CEA) calculations based on data from
the Current Population Survey show that, from 2007 to 2010, the share of households receiving
income from unemployment compensation rose from 4.1 percent to 9.6 percent and the average
amount received by these households increased from $4,400 to $8,343. During this period,
average household income declined by $3,600. Total unemployment compensation payments,
however, increased by an amount equal to 17 percent of this net decline, partially offsetting the
overall loss of household income. Previous research suggests that recipients tend to
understate their unemployment compensation by up to one-third (Meyer, Mok, and Sullivan
2009), so these are likely to be lower bound estimates of the effect of unemployment insurance
on household income.
5.0
10.0
15.0
20.0
25.0
30.0
35.0
40.0
Jan-03 Jan-05 Jan-07 Jan-09 Jan-11
Percent
Source: CEA calculations, Bureau of Labor Statistics
< 5 weeks
5-14 weeks
15-26 weeks
27-52 weeks
53+ weeks
8/3/2019 Unempoyment Insurance and American Jobs Act Report
http://slidepdf.com/reader/full/unempoyment-insurance-and-american-jobs-act-report 15/28
12
Moreover, the CBO notes that extensions of unemployment benefit programs are “both
timely and cost-effective in spurring … economic activity and employment” (CBO 2011). The
evidence suggests that the additional spending from unemployment compensation happens
very soon after the outlay of Federal dollars. In contrast, many other job creation measures
have significantly longer lags between the Federal cost and the economic benefit. The CBOalso finds that increasing aid to the unemployed is among the policies that would have “the
largest effects on output and employment per dollar of budgetary cost” (CBO 2011).
In addition, unemployment is a leading cause of mortgage defaults, and the income
provided by unemployment insurance helps avert foreclosures—giving much needed support to
our housing market (Foote et al. 2009).
Because the EUC and EB programs support hundreds of thousands of jobs and increase
economic activity significantly, they also generate partially offsetting tax revenue for the Federal
government (through income and payroll taxes) and help state and local budgets by increasing
sales tax revenues. Additionally, without the income support from extended unemployment
compensation, many families would need to draw on other programs such as the Supplemental
Nutrition Assistance Program (SNAP, formerly known as food stamps), Temporary Assistance
to Needy Families (TANF) and SSDI.4
In short, as a form of insurance, the Federal unemployment compensation programs provide
important income support for workers and their families during periods of job loss, but they have
substantial benefits to the broader economy as well. As a result, the net cost to the Federal
government is less than the official cost that is scored for these programs when they are
considered in isolation.5
The Cost of Not Extending the EUC and EB Programs
Without Congressional action, the EUC program and full Federal funding of the EB program
will begin to phase out the first week of January 2012. Those currently in the EUC program will
continue to receive benefits until they exhaust their current EUC tier. Millions of long-term
unemployed workers will lose all their unemployment benefits by the end of January, and
millions more will have no benefits after their initial 26 weeks of UI payments are exhausted,
despite the fact that the unemployment rate still stands at 8.6 percent and the average currently
on-going spell of unemployment has lasted more than 40 weeks.
4Unemployment benefits are included in the income calculation used to determine SNAP eligibility. Therefore,
without unemployment benefits, more families would be eligible to receive SNAP. Further, Autor and Duggan (2003)document the relationship between disability insurance enrollment and the economy: When unemployment increasesso does the number of individuals who receive disability insurance. Thus, by providing a substitute for disabilityinsurance, unemployment insurance may reduce enrollment in the DI program.5
For example, the Congressional Budget Office (2008) noted this effect in its cost analysis of the EmergencyExtended Unemployment Compensation Act of 2008.
8/3/2019 Unempoyment Insurance and American Jobs Act Report
http://slidepdf.com/reader/full/unempoyment-insurance-and-american-jobs-act-report 16/28
13
As part of the American Jobs Act, President Obama has proposed extending unemployment
compensation benefits for another year. The provisions of the proposed Act call for a full
extension of the EUC program and of this year’s EB program parameters.6 Under current
projections, EB largely would be phased out, as there will be few states in which the current
unemployment rate exceeds the rate one, two or three years earlier – the current requirement
for states to be eligible to offer EB benefits. Full Federal funding for EB benefits would remainavailable, however, in the event the unemployment rate in any state were to rise.
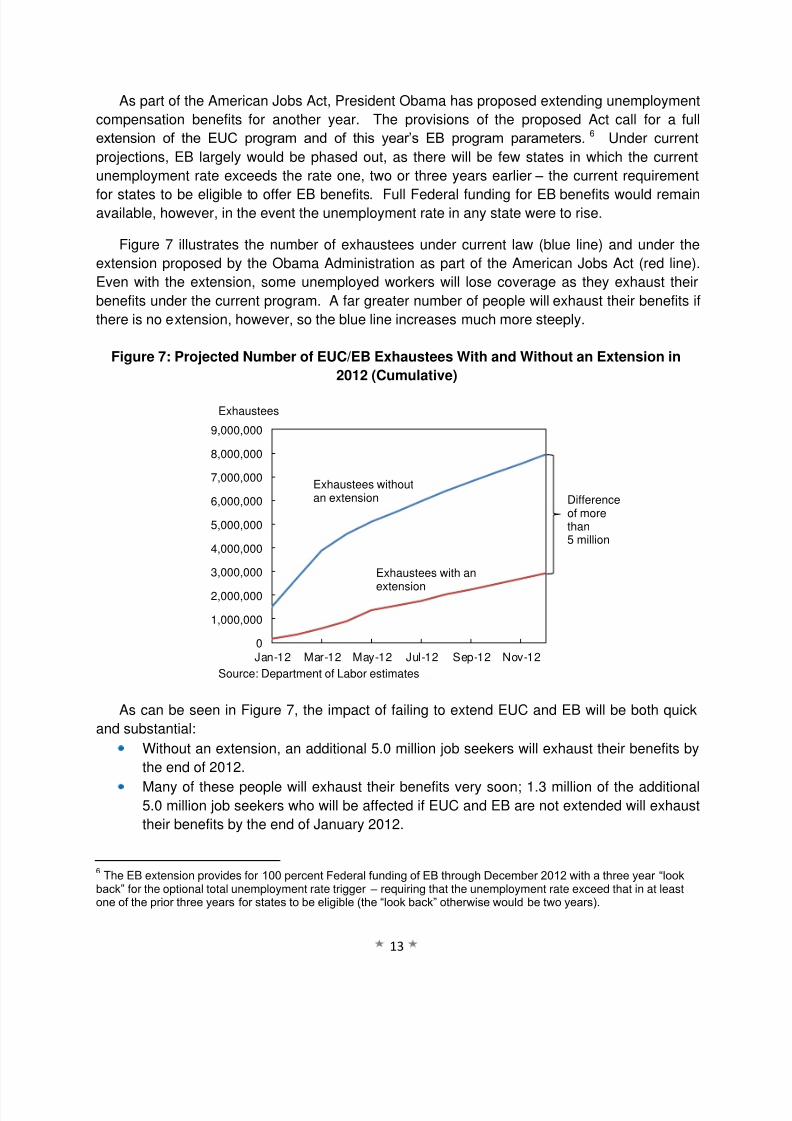
Figure 7 illustrates the number of exhaustees under current law (blue line) and under the
extension proposed by the Obama Administration as part of the American Jobs Act (red line).
Even with the extension, some unemployed workers will lose coverage as they exhaust their
benefits under the current program. A far greater number of people will exhaust their benefits if
there is no extension, however, so the blue line increases much more steeply.
Figure 7: Projected Number of EUC/EB Exhaustees With and Without an Extension in
2012 (Cumulative)
As can be seen in Figure 7, the impact of failing to extend EUC and EB will be both quick
and substantial:
Without an extension, an additional 5.0 million job seekers will exhaust their benefits by
the end of 2012.
Many of these people will exhaust their benefits very soon; 1.3 million of the additional5.0 million job seekers who will be affected if EUC and EB are not extended will exhaust
their benefits by the end of January 2012.
6The EB extension provides for 100 percent Federal funding of EB through December 2012 with a three year “look
back” for the optional total unemployment rate trigger – requiring that the unemployment rate exceed that in at leastone of the prior three years for states to be eligible (the “look back” otherwise would be two years).
0
1,000,000
2,000,000
3,000,000
4,000,000
5,000,000
6,000,000
7,000,000
8,000,000
9,000,000
Jan-12 Mar-12 May-12 Jul-12 Sep-12 Nov-12
Exhaustees
Differenceof morethan5 million
Exhaustees withoutan extension
Exhaustees with an
extension
Source: Department of Labor estimates
8/3/2019 Unempoyment Insurance and American Jobs Act Report
http://slidepdf.com/reader/full/unempoyment-insurance-and-american-jobs-act-report 17/28
14
Without an extension, an additional 1.2 million African Americans and an additional 900,000
Hispanics, two groups particularly affected by high incidence of unemployment and poverty, will
be among those exhausting their benefits by the end of 2012.
These benefit losses will have devastating consequences for many of the long-term
unemployed and their families. While the weekly benefit amount is not large, it is enough tokeep many families out of poverty. Almost 3.6 million children will be directly affected by the
loss of benefits by someone in their household.
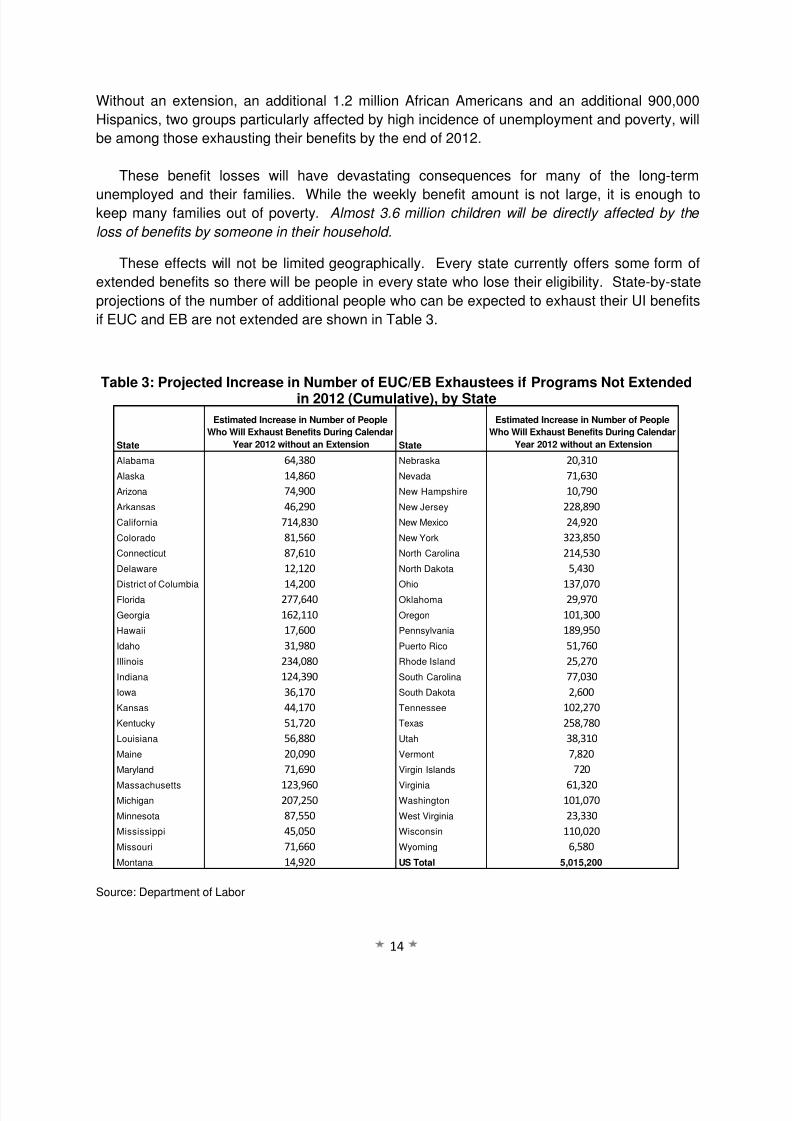
These effects will not be limited geographically. Every state currently offers some form of
extended benefits so there will be people in every state who lose their eligibility. State-by-state
projections of the number of additional people who can be expected to exhaust their UI benefits
if EUC and EB are not extended are shown in Table 3.
Table 3: Projected Increase in Number of EUC/EB Exhaustees if Programs Not Extendedin 2012 (Cumulative), by State
Source: Department of Labor
State
Estimated Increase in Number of People
Who Will Exhaust Benefits During Calendar
Year 2012 without an Extension State
Estimated Increase in Number of People
Who Will Exhaust Benefits During Calendar
Year 2012 without an Extension
Alabama 64,380 Nebraska 20,310
Alaska 14,860 Nevada 71,630
Arizona 74,900 New Hampshire 10,790
Arkansas 46,290 New Jersey 228,890
California 714,830 New Mexico 24,920
Colorado 81,560 New York 323,850
Connecticut 87,610 North Carolina 214,530
Delaware 12,120 North Dakota 5,430
District of Columbia14,200
Ohio137,070
Florida 277,640 Oklahoma 29,970
Georgia 162,110 Oregon 101,300
Hawaii 17,600 Pennsylvania 189,950
Idaho 31,980 Puerto Rico 51,760
Illinois 234,080 Rhode Island 25,270
Indiana 124,390 South Carolina 77,030
Iowa 36,170 South Dakota 2,600
Kansas 44,170 Tennessee 102,270
Kentucky 51,720 Texas 258,780
Louisiana 56,880 Utah 38,310
Maine 20,090 Vermont 7,820
Maryland 71,690 Virgin Islands 720
Massachusetts 123,960 Virginia 61,320Michigan 207,250 Washington 101,070
Minnesota 87,550 West Virginia 23,330
Mississippi 45,050 Wisconsin 110,020
Missouri 71,660 Wyoming 6,580
Montana 14,920 US Total 5,015,200
8/3/2019 Unempoyment Insurance and American Jobs Act Report
http://slidepdf.com/reader/full/unempoyment-insurance-and-american-jobs-act-report 18/28
15
The resulting decline in benefit payments will force millions of households to reduce
consumption in the short term, causing significant adverse effects on aggregate demand and
thus on employment. The CBO projection is that, compared to allowing extending benefits to
expire, an extension could have the cumulative effect in 2012 and 2013 of raising output by up
to $1.9 billion and employment by up to 19,000 full-time equivalent job-years for every billion
dollars of budgetary spending – the largest impact of any policy they examined. Using the samemethod as in an earlier report (CEA 2010), CEA has estimated the effect of extending benefits
as the President has proposed on the number of job-years, compared to what would happen if
benefits were allowed to expire. Like CBO, CEA uses a standard fiscal multiplier applied to the
total amount of anticipated benefit payments and considers only the effects of EUC and EB on
employment that operate through their effects on aggregate demand. While there is
unavoidable uncertainty about the precise effects, CEA’s best estimate is that the President’s
proposal for extended benefits would save 478,000 additional job-years cumulatively by the end
of 2014. The CBO, which only provides estimates for the next two years, projects that
extending benefits would generate between 176,000 and 836,000 additional job-years by the
end of 2013 compared to a scenario in which benefits were not extended; the CEA estimate of
441,000 job-years for the same time period lies squarely within the CBO range (CBO 2011).
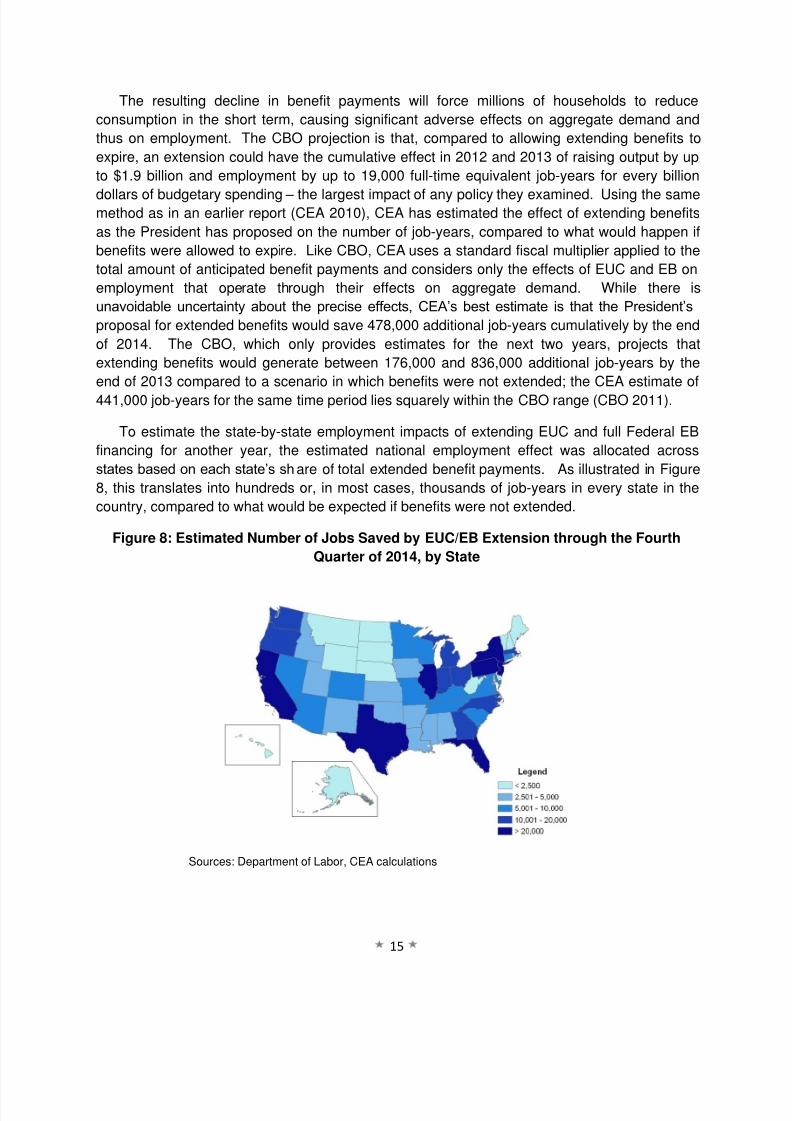
To estimate the state-by-state employment impacts of extending EUC and full Federal EB
financing for another year, the estimated national employment effect was allocated across
states based on each state’s share of total extended benefit payments. As illustrated in Figure
8, this translates into hundreds or, in most cases, thousands of job-years in every state in the
country, compared to what would be expected if benefits were not extended.
Figure 8: Estimated Number of Jobs Saved by EUC/EB Extension through the Fourth
Quarter of 2014, by State
Sources: Department of Labor, CEA calculations
8/3/2019 Unempoyment Insurance and American Jobs Act Report
http://slidepdf.com/reader/full/unempoyment-insurance-and-american-jobs-act-report 19/28
16
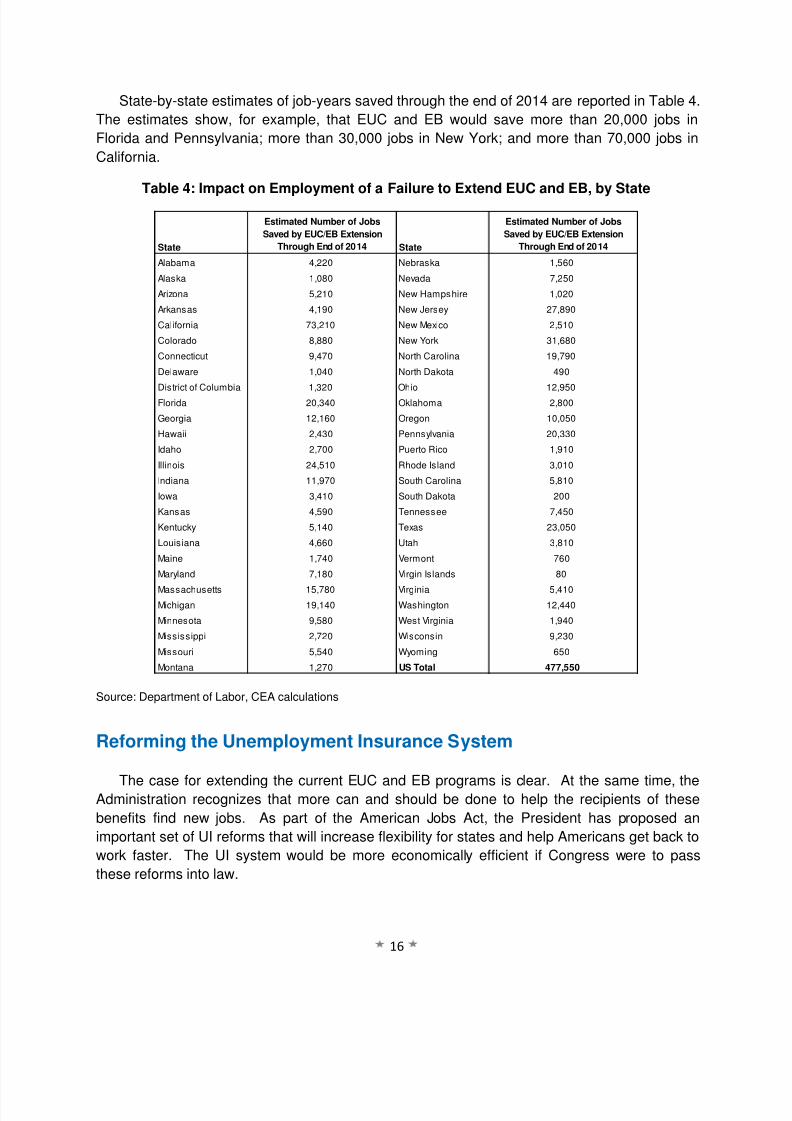
State-by-state estimates of job-years saved through the end of 2014 are reported in Table 4.
The estimates show, for example, that EUC and EB would save more than 20,000 jobs in
Florida and Pennsylvania; more than 30,000 jobs in New York; and more than 70,000 jobs in
California.
Table 4: Impact on Employment of a Failure to Extend EUC and EB, by State
Source: Department of Labor, CEA calculations
Reforming the Unemployment Insurance System
The case for extending the current EUC and EB programs is clear. At the same time, theAdministration recognizes that more can and should be done to help the recipients of these
benefits find new jobs. As part of the American Jobs Act, the President has proposed an
important set of UI reforms that will increase flexibility for states and help Americans get back to
work faster. The UI system would be more economically efficient if Congress were to pass
these reforms into law.
State
Estimated Number of Jobs
Saved by EUC/EB Extension
Through End of 2014 State
Estimated Number of Jobs
Saved by EUC/EB Extension
Through End of 2014
Alabama 4,220 Nebraska 1,560
Alaska 1,080 Nevada 7,250
Arizona 5,210 New Hampshire 1,020
Arkansas 4,190 New Jersey 27,890
California 73,210 New Mexico 2,510
Colorado 8,880 New York 31,680
Connecticut 9,470 North Carolina 19,790
Delaware 1,040 North Dakota 490
District of Columbia 1,320 Ohio 12,950
Florida 20,340 Oklahoma 2,800
Georgia 12,160 Oregon 10,050
Hawaii 2,430 Pennsylvania 20,330
Idaho 2,700 Puerto Rico 1,910
Illinois 24,510 Rhode Island 3,010
Indiana 11,970 South Carolina 5,810
Iowa 3,410 South Dakota 200
Kansas 4,590 Tennessee 7,450
Kentucky 5,140 Texas 23,050
Louisiana 4,660 Utah 3,810
Maine 1,740 Vermont 760
Maryland 7,180 Virgin Islands 80
Massachusetts 15,780 Virginia 5,410
Michigan 19,140 Washington 12,440
Minnesota 9,580 West Virginia 1,940
Mississippi 2,720 Wisconsin 9,230
Missouri 5,540 Wyoming 650
Montana 1,270 US Total 477,550
8/3/2019 Unempoyment Insurance and American Jobs Act Report
http://slidepdf.com/reader/full/unempoyment-insurance-and-american-jobs-act-report 20/28
17
The UI system was established in 1935 and remains essentially as it was 70 years ago,
despite major changes in the economy and workforce. Research from the 1980s suggested
that 60 percent of UI spells ended with the worker being recalled to his or her original job
(Corson and Nicholson 1983; Katz and Meyer 1990). Today, a smaller percentage of the
unemployed who lose a job are on temporary layoff than was the case in previous decades. In
December 1983, the peak month of unemployment in the 1980s, 34 percent of job losersexpected to return to their previous employer; in October 2009, the peak month of
unemployment in the recent recession, just half that percentage of job losers expected to be
recalled. With fewer people returning to their prior employers, it is increasingly important to
have a UI system that helps the unemployed explore their options and gain new skills.
The Administration has proposed a series of reforms to the unemployment compensation
system as a part of the American Jobs Act. Under the President’s proposals, most long-term
unemployed claimants would meet with UI staff and participate in Reemployment and Eligibility
Assessments (REA) and Reemployment Services (RES). Certain types of RES have been
found to be effective for a wide range of participants (Jacobson 2009). Calling claimants into
the UI office would provide an opportunity to help them develop a work search plan and referthem to One-Stop Career Services, as well as make sure that they are eligible for
unemployment benefits and reduce improper payments. Rigorous evidence has shown that
eligibility assessments can lower program costs by reducing the length of spells of benefit
receipt and eliminating payments to ineligible individuals (Black et al. 2003; Meyer 1995). A
demonstration project in Nevada that combined eligibility assessment and reemployment
services paid for itself by moving the unemployed into jobs more quickly and eliminating excess
payments (Hanna and Turney 1990). A recent evaluation of the Reemployment and Eligibility
Assessment Initiative found that eligibility assessments reduced unemployment compensation
payments and the one state that combined these assessments with reemployment services had
the largest reductions in weeks of payments, suggesting the combination may be the most
effective model (Poe-Yamagata et al. 2011).
The Reemployment NOW program would provide funds to states to create innovative
programs to help the long-term unemployed get back to work. First, states would have the
option of setting up Bridge to Work programs that would allow EUC recipients to obtain short-
term work-based experience, giving them the opportunity to maintain or enhance their skills.
This proposal builds and improves on programs in a number of states, including Georgia, New
Hampshire, Missouri, Pennsylvania, Texas and Utah. EUC recipients would be allowed to work
for a private employer for up to eight weeks, as much as 38 hours per week, while continuing to
collect EUC benefits. Under this program, important worker protections would apply. For
example, no worker would receive less than the applicable minimum wage for the hours theyworked and all participants would be covered by Workers’ Compensation Insurance. At the end
of the trial period, employers would be in a better position to assess the worker’s suitability for
their organization after having observed the individual’s work habits and productivity, and the
worker would be in a better position to assess whether the job is a good match.
Second, through Self-Employment Assistance (SEA) programs, states could allow continued
EUC benefit payments to EUC claimants who choose to work full-time to establish a new
8/3/2019 Unempoyment Insurance and American Jobs Act Report
http://slidepdf.com/reader/full/unempoyment-insurance-and-american-jobs-act-report 21/28
18
business and use Reemployment NOW funds to implement the program. Currently, there are
Self-Employment Assistance programs in seven states that permit a similar use of regular
unemployment insurance benefits. Importantly, under this program, entrepreneurship training
would be facilitated through One-Stop Centers in collaboration with the Small Business
Administration. Recent evidence from an evaluation of Project GATE found that this type of
training increased by more than 50 percent the likelihood of starting a business that was still inoperation five years later, as well as increasing participants’ employment rates and earnings
(Michaelides and Benus, 2010). Moreover, if the business fails, individuals would be allowed to
go back to claim benefits where they left off.
Third, Reemployment NOW funds could be used to support older workers to make a
transition into new industries and occupations. Many people who lose long-term jobs will have
difficulty finding jobs that pay as much because they have skill sets that are not easily
transferrable to other occupations or industries. Wage insurance would provide a fraction of the
lost earnings to workers who go back to work in a lower-paying job and would be targeted to
older workers who are more likely to suffer large salary reductions – and who might otherwise
leave the workforce early,
Fourth, the states would have the option to use their share of the Reemployment NOW
funding to provide a program of more intensive reemployment services to help long-term
unemployed workers successfully return to work in good jobs. Finally, to support state creativity
and flexibility, upon approval of the Secretary of Labor, states would be permitted to use
Reemployment NOW funds to implement their own innovative strategies for connecting the
long-term unemployed to employment opportunities.
In addition to the Reemployment Now reforms that build on the existing Federally-financed
unemployment compensation programs, the President also has proposed a new Pathways Back
to Work fund that would support training initiatives that have proved successful at helping youthand low-income adults to become employed.
It is important to note that a number of these reforms would benefit not just current
unemployment compensation recipients but also those who have exhausted their
unemployment compensation benefits. In particular, the more intensive reemployment services
and innovative strategies to connect the long-term unemployed with work could be used by
states to benefit both of these populations.
The American Jobs Act proposes in addition a change to the UI system that would help to
prevent workers from losing their jobs in the first place. Short-Time Compensation (STC)
programs, also known as worksharing, provide unemployment compensation for workers whosehours are reduced in lieu of a layoff. These programs allow employers to adjust payrolls and
reduce labor costs in response to temporary declines in demand. For example, an employer
could reduce the work hours of the entire workforce by 20 percent, essentially shortening the
workweek from five days to four days, rather than temporarily reducing the workforce by 20
percent. Participating workers then would receive pro-rated UI benefits for the days they are not
working. STC programs are on the books in 24 states (though not currently active in all of these
states) and could be expanded under this proposal. The American Jobs Act would provide
8/3/2019 Unempoyment Insurance and American Jobs Act Report
http://slidepdf.com/reader/full/unempoyment-insurance-and-american-jobs-act-report 22/28
19
administrative funds for these programs and also subsidize the benefits paid under the STC
programs.
Many of these initiatives are designed specifically to help recipients of unemployment
compensation move into new jobs. But while these initiatives are important – indeed, while they
hold the potential for transforming our decades-old unemployment insurance system – they
cannot be fully successful unless there are jobs for these workers to take. In addition to its UI-
related provisions, the American Jobs Act includes other key provisions designed to create jobs.
The Act would reduce payroll taxes, putting more money into the hands of American workers
and employers; create tax incentives for employers to hire new workers or raise the wages of
their existing workforce; and provide funding to rebuild our transportation infrastructure and
modernize our schools. Because they would add jobs and help to ensure that qualified
unemployment compensation recipients can find work, these measures are key complements to
the EUC and EB extensions and unemployment insurance reforms considered in this report.
Conclusion
Currently, some 13 million Americans are unemployed; almost 6 million of them have been
unemployed for more than 26 weeks. Since Congress enacted the EUC program and offered
100 percent Federal funding of EB in June 2008, almost 18 million workers have been direct
beneficiaries. These beneficiaries live in households that include more than 50 million people.
In September 2011, President Obama asked Congress to extend the EUC program and provide
100 percent Federal financing of EB to continue to support the unemployed through the coming
year. Historically, Congress has never failed to extend an extended benefits program when the
unemployment rate was as high as it is today.
If Congress fails to act, the current programs will expire in the first week of January 2012.More than a million long-term unemployed workers will lose their unemployment benefits by the
end of January, and millions more will have no benefits after their initial 26 weeks of UI
payments are exhausted. Without an extension, five million additional workers will exhaust their
benefits by the end of 2012.
Unemployment insurance provides income support for a vulnerable group after they have
lost their jobs through no fault of their own, enables the unemployed to search for jobs that
utilize their skills, encourages the long-term unemployed to remain in the workforce continuing
to search for work, and helps to stabilize the aggregate economy by providing income support to
a group with a high marginal propensity to consume. Extended benefits keep the long-term
unemployed in the labor market and out of other government programs such as SNAP, TANF,
and SSDI. Keeping unemployed workers engaged in the labor force will have long-term
benefits to the economy when the labor market strengthens and the demand for labor
increases.
Extending benefits also will provide needed support for the fragile economy. The CBO
estimates that, because extending UI would put money in the hands of those who will spend it
quickly, it is among the policies that would have the largest effects on output and employment.
8/3/2019 Unempoyment Insurance and American Jobs Act Report
http://slidepdf.com/reader/full/unempoyment-insurance-and-american-jobs-act-report 23/28
20
CBO projects that extending unemployment benefits could, cumulatively in 2012 and 2013,
raise output by up to $84 billion and employment by as much as 836,000 jobs, compared to the
levels of output and employment without an extension. Consistent with the CBO estimates,
CEA projects that almost 500,000 jobs will be lost before the end of 2014 if the benefit programs
are not extended.
Extending benefits is but one part of President Obama’s American Jobs Act. Other
provisions seek to reform our unemployment compensation system, making it more flexible and
responsive to the needs of today’s labor market. The Administration has proposed a series of
unemployment compensation reforms as a part of its Reemployment NOW program in the
American Jobs Act. These would ensure that all job seekers receive real job search assistance
and support innovative programs that seek to keep workers out of unemployment or get them
back into employment as quickly as possible.
8/3/2019 Unempoyment Insurance and American Jobs Act Report
http://slidepdf.com/reader/full/unempoyment-insurance-and-american-jobs-act-report 24/28
21
Appendix Table 1: Temporary Extended Benefit Programs
Name Effective Dates Weeks Payable FinancingTemporary UnemploymentCompensation (TUC)PL 85-441
Reachback to 06/57
06/58 – 06/59 Up to 13
Interest free loans to17 participatingstates
Temporary Extended
Unemployment Compensation(TEUC)PL 87-6
Reachback to 06/60
04/61 – 06/62 Up to 13
FUTA increase:
0.4% in 19620.25% in 1963
Temporary Compensation(TC)PL 92-224PL 92-329
No reachback
01/72 – 09/7210/72 – 03/73
Up to 13Up to 13
EUCAEUCA – FUTAincrease 0.08% in1973
Federal Supplemental Benefits(FSB)PL 93-572PL 94-12PL 94-45
PL 95-19
No reachback
01/75 – 03/7503/75 – 09/7510/75 – 12/7501/76 – 03/7704/77 – 01/78
EB effective in all statesthrough 12/77Up to 13Up to 26Up to 26Up to 13 or 26Up to 13, beginning 05/77
EUCAEUCAEUCAEUCAGeneral Revenue
Federal SupplementalCompensation (FSC)PL 97-248PL 97-424PL 98-21PL 98-118PL 98-135PL 99-15
Reachback to 06/82
09/82 – 12/8201/83 – 03/8304/83 – 09/8309/83 – 10/8310/83 – 03/8504/85 – 06/85
Up to 6, 8, or 10Up to 8, 10, 12, 14, or 16Up to 8, 10, 12, or 14Up to 8, 10, 12, or 14Up to 8, 10, 12, or 14Phaseout
General RevenueGeneral RevenueGeneral RevenueGeneral RevenueGeneral RevenueGeneral Revenue
Emergency UnemploymentCompensation (EUC)PL 102-164PL 102-244PL 102-318PL 103-6PL 103-152
Reachback to 02/91
11/91 – 02/9202/92 – 06/9206/92 – 09/9309/93 – 10/9310/93 – 02/9402/94 – 04/94
Up to 13 or 20Up to 26 or 33Up to 20 or 26Up to 10 or 15Up to 7 or 13Phaseout
EUCAEUCAGeneral RevenueGeneral RevenueEUCAEUCA
Temporary ExtendedUnemployment Compensation(TEUC)PL 107-147PL 108-1¹PL 108-26
Reachback to 03/01
03/02 – 12/0212/02 – 05/0305/03 – 12/0301/04 – 03/04
Up to 13 or 26Up to 13 or 26Up to 13 or 26Phaseout
EUCAEUCAEUCAEUCA
Emergency UnemploymentCompensation (EUC 08)PL 110-252PL 110-449PL 111-5PL 111-92
PL 111-118PL 111-144PL 111-157PL 111-205PL 111-312
Reachback to 05/07
07/08 – 03/092
03/09 – 12/092
12/09 – 02/1002/10 – 04/1004/10 – 06/1006/10 – 11/1011/10 – 01/12
Up to 13Up to 20 or 33Up to 20 or 33Up to 20, 34, 47, or 53
Up to 20, 34, 47, or 53Up to 20, 34, 47, or 53Up to 20, 34, 47, or 53Up to 20, 34, 47, or 53Up to 20, 34, 47, or 53
EUCAEUCAGeneral RevenueGeneral Revenue
General RevenueGeneral RevenueGeneral RevenueGeneral RevenueGeneral Revenue
FUTA = Federal Unemployment Tax Act EUCA = Extended Unemployment Compensation Account
¹ PL 108-11, which provided additional benefits (up to 39 or 52 weeks) to displaced airline and related workers underthe TEUC-A program, is not included as it did not change the basic TEUC program.² Expanded the number of weeks payable, but did not change effective dates
Source: Department of Labor
8/3/2019 Unempoyment Insurance and American Jobs Act Report
http://slidepdf.com/reader/full/unempoyment-insurance-and-american-jobs-act-report 25/28
22
Appendix Table 2: Maximum Weeks and State Eligibility for Regular UI, EUC, and EB
Coverage Program Length (weeks) States Eligible
UI 20 to 261
all
EUC Tier 1 20 all
EUC Tier 2 14 all
EUC Tier 32
13 state unemployment rate > 6%
EUC Tier 43
6 state unemployment rate > 8.5%
EB4
Option 1 13
state unemployment rate > 6.5%
and higher than in at least one ofthe last three years
EB4
Option 2 20state unemployment rate > 8%
and higher than in at least one ofthe last three years
1. Missouri and South Carolina offer 20 weeks of UI benefits, Arkansas offers 25
and all other states offer 26.
2. As of November 2011, tier 3 is triggered on in 43 states, the District of Columbia,
Puerto Rico, and the Virgin Islands.
3. As of November 2011, tier 4 is triggered on in 22 states, the District of Columbia,
and Puerto Rico, and the Virgin Islands.
4. The EB triggers reported are the current optional total unemployment rate (TUR)thresholds; the standard insured unemployment rate (IUR) triggers are not currently
relevant insofar as they would not qualify any state for EB. States are either in
option1 or option 2 (or neither); recipients do not move sequentially through these
options. States also must have in place a law that triggers EB on under the
specified conditions. As of November 2011, EB is triggered on in 33 states plus the
District of Columbia, and Puerto Rico.
Source: Department of Labor
8/3/2019 Unempoyment Insurance and American Jobs Act Report
http://slidepdf.com/reader/full/unempoyment-insurance-and-american-jobs-act-report 26/28
23
Appendix Table 3: Average Weekly UI Benefits, Maximum Weekly UI Benefits and
Average UI Replacement Rate as of September 2010, by State
Source: Department of Labor
Alabama $201 $265 40.8%
Alaska $224 $442 33.0%
Arizona $214 $240 40.5%
Arkansas $278 $451 51.3%
California $315 $450 44.8%
Colorado $335 $489 50.4%
Connecticut $332 $630 44.2%
Delaware $263 $330 42.0%
District of Columbia $285 $359 40.9%
Florida $225 $275 41.0%
Georgia $231 $330 45.7%
Hawaii $425 $549 56.5%
Idaho $260 $336 48.1%
Illinois $322 $531 38.6%
Indiana $296 $390 52.5%
Iowa $290 $461 53.3%
Kansas $320 $435 52.7%Kentucky $306 $415 49.5%
Louisiana $252 $247 41.6%
Maine $266 $533 50.1%
Maryland $308 $430 47.3%
Massachusetts $392 $937 46.0%
Michigan $284 $362 49.3%
Minnesota $337 $578 47.2%
Mississippi $186 $235 41.9%
Missouri $238 $320 41.3%
Montana $261 $421 47.1%
Nebraska $236 $348 44.6%
Nevada $311 $398 46.3%
New Hampshire $291 $427 41.8%
New Jersey $375 $598 51.4%
New Mexico $309 $486 55.8%
New York $301 $405 41.7%
North Carolina $284 $506 51.9%
North Dakota $278 $442 47.8%
Ohio $291 $524 44.3%
Oklahoma $287 $358 50.6%
Oregon $305 $496 45.4%
Pennsylvania $329 $581 53.3%
Puerto Rico $114 $133 36.2%
Rhode Island $366 $688 56.2%
South Carolina $232 $326 46.5%
South Dakota $239 $314 47.4%
Tennessee $224 $325 41.3%
Texas $274 $415 50.4%
Utah $306 $452 46.2%Vermont $299 $425 50.2%
Virgin Islands $334 $470 N/A
Virginia $272 $378 50.2%
Washington $379 $570 51.3%
West Virginia $256 $424 40.7%
Wisconsin $258 $363 46.5%
Wyoming $305 $430 51.4%
US Average $293 $445 46.17%
State Avg. Wkly Benefit Maximum Benefit
Replacement rate
(CY 2010)
8/3/2019 Unempoyment Insurance and American Jobs Act Report
http://slidepdf.com/reader/full/unempoyment-insurance-and-american-jobs-act-report 27/28
24
References
Auerbach, Alan and Daniel Feenberg. 2000. “The Significance of Federal Taxes as Automatic
Stabilizers.” Journal of Economic Perspectives 14, no. 3:37-56.
Autor, David H. and Mark G. Duggan. 2003. “The Rise in the Disability Rolls and the Decline in Unemployment.” Quarterly Journal of Economics 118, no. 1: 157-205.
Autor, David H., and Mark G. Duggan. 2006. “The Growth in the Social Security Disability Rolls:A Fiscal Crisis Unfolding.” Journal of Economic Perspectives 20, no. 3: 71-96.
Black, Dan A., Jeffrey A. Smith, Mark C. Berger and Brett J. Noel. 2003. “Is the Threat of Reemployment Services More Effective than the Services Themselves? Evidence fromRandom Assignment in the UI System.” American Economic Review 93, no. 4: 1313-1327.
Card, David and Phillip Levine. 2000. “Extended Benefits and the Duration of UI Spells:Evidence from the New Jersey Extended Benefit Program.” Journal of Public Economics 78: 107-38.
Census Bureau. 2011. Income, Poverty and Health Insurance Coverage in the United States: 2010.” Current Population Report. September.
Chetty, Raj. 2008. “Moral Hazard vs. Liquidity and Optimal Unemployment Insurance.” Journal of Political Economy 116, no. 2: 173-234.
Congressional Budget Office. 2011. “Policies for Increasing Economic Growth and Employment
in 2012 and 2013.” Testimony by Douglas W. Elmendorf, Director. Prepared for Committee on the Buget, United States Senate.
Council of Economic Advisers. 2010. “The Economic Impact of Recent TemporaryUnemployment Insurance Extensions,” December.
Corson, Walter and Walter Nicholson. 1983. “An Analysis of UI Recipients' UnemploymentSpells.” Unemployment Insurance Occasional Paper, No. 83-1, U.S. Department ofLabor, Employment and Training Administration.
Feldstein, Martin. 1974. “Unemployment Compensation: Adverse Incentives and DistributionalAnomalies.” National Tax Journal 27, no. 2: 231-244.
Foote, Christopher L., Kristopher S. Gerardi, Lorenz Goette, and Paul S. Willen. 2009.“Reducing Foreclosures.” Federal Reserve Bank of Boston working paper .
Gruber, Jonathan. 1997. “The Consumption Smoothing Benefits of Unemployment Insurance.”American Economic Review 87, no. 1: 192-205.
Hanna, James and Zina Turney. 1990. “UI Research Exchange: The Economic Impact of the
Nevada Claimant Employment Program.” UI Occasional Paper , no. 90-4. Washington,
8/3/2019 Unempoyment Insurance and American Jobs Act Report
http://slidepdf.com/reader/full/unempoyment-insurance-and-american-jobs-act-report 28/28
DC: U.S. Department of Labor, Employment and Training Administration, Unemployment
Insurance Service.
Hutchens, Robert. 1981. “Distributional Equity in the Unemployment Insurance System.” Industrial and Labor Relations Review 34, no. 3: 377-385.
Jacobson, Louis. 2009. “Strengthening One-Stop Career Centers: Helping More UnemployedWorkers Find Jobs and Build Skills.” Hamilton Project Discussion Paper.
Katz, Lawrence F. and Bruce D. Meyer. 1990. “Unemployment Insurance, Recall Expectations,and Unemployment Outcomes.” The Quarterly Journal of Economics 105, no. 4: 973-1002.
Kroft, Kory and Matthew Notowidigdo. 2011. “Should Unemployment Insurance Vary with theLocal Unemployment Rate? Theory and Evidence.” Working Paper
Krueger, Alan, and Andreas Mueller. In progress. “Applications for Disability Insurance and theExhaustion of Unemployment Insurance Benefits: New Evidence from a Survey of
Unemployed Workers.”
Meyer, Bruce D. 1990. “Unemployment Insurance and Unemployment Spells.” Econometrica 58, no.4: 757 –782.
Meyer, Bruce D. 1995. “Lessons from the U.S. Unemployment Insurance Experiments.” Journal of Economic Literature 33, no. 1: 91-131.
Meyer, Bruce D., Wallace K.C. Mok, James X. Sullivan. 2009. “The Under -Reporting ofTransfers in Household Surveys: Its Nature and Consequences.” NBER Working Paper15181. Cambridge, MA: National Bureau of Economic Research. July.
Michaelides, Marios and Jacob Benus. 2010. “Are Self -Employment Training ProgramsEffective? Evidence from Project GATE.” IMPAQ International and University of Maryland – College Park. Commissioned by the U.S. Department of Labor.
Poe-Yamagata, Eileen, Jacob Benus, Nicholas Bill, Hugh Carrington, Marios Michaelides, andTed Shen. 2011. “Impact of the Reemployment and Eligibility Assessment (REA)Initiative.” IMPAQ International. Commissioned by the U.S. Department of Labor.
Rothstein, Jesse. 2011. “Unemployment Insurance and Job Search in the Great Recession.”Brookings Papers on Economic Activity.
Schmieder, Johannes, Till von Wachter, and Stefan Bender. Forthcoming. “The Effects of
Extended Unemployment Insurance over the Business Cycle: Evidence fromRegression Discontinuity Estimates over Twenty Years.” Quarterly Journal of Economics .