Embed Size (px)
Citation preview
Unfunded Retiree Healthcare:The Elephant in the Room
By Robert C. Pozen Senior Lecturer, Harvard Business School
Senior Fellow, Brookings Institution
Agenda
I. Definitions and Accounting
II. Scope of the Problem
III. Retiree Health vs. Pensions
IV. Proposals for Change
2
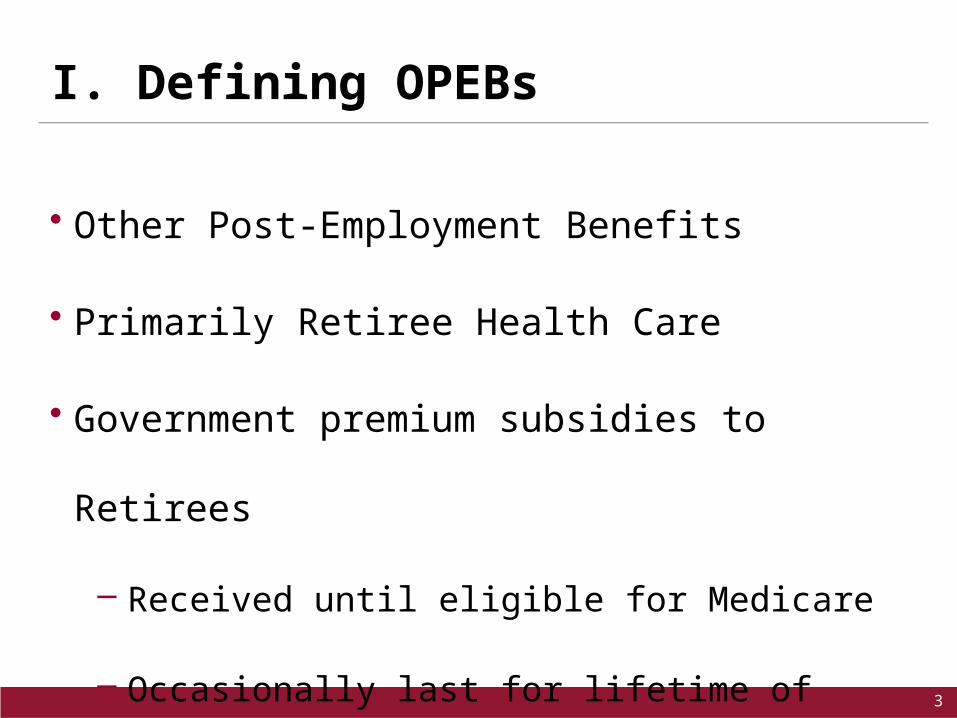
I. Defining OPEBs
• Other Post-Employment Benefits
• Primarily Retiree Health Care
• Government premium subsidies to Retirees
– Received until eligible for Medicare
– Occasionally last for lifetime of Retiree
3
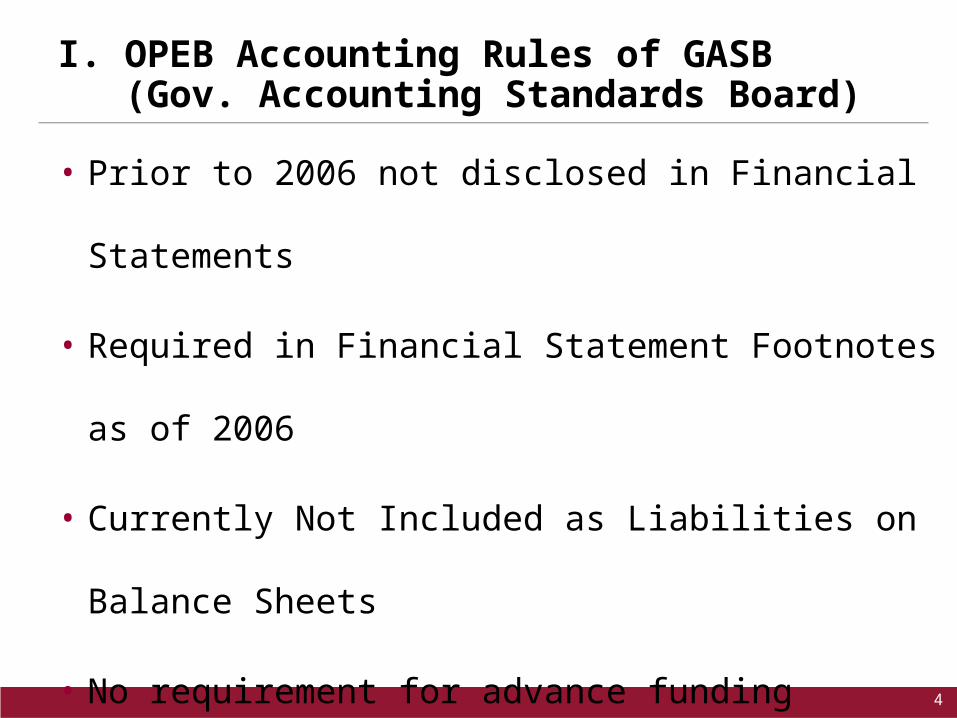
I. OPEB Accounting Rules of GASB (Gov. Accounting Standards Board)
• Prior to 2006 not disclosed in Financial Statements
• Required in Financial Statement Footnotes as of 2006
• Currently Not Included as Liabilities on Balance Sheets
• No requirement for advance funding
4
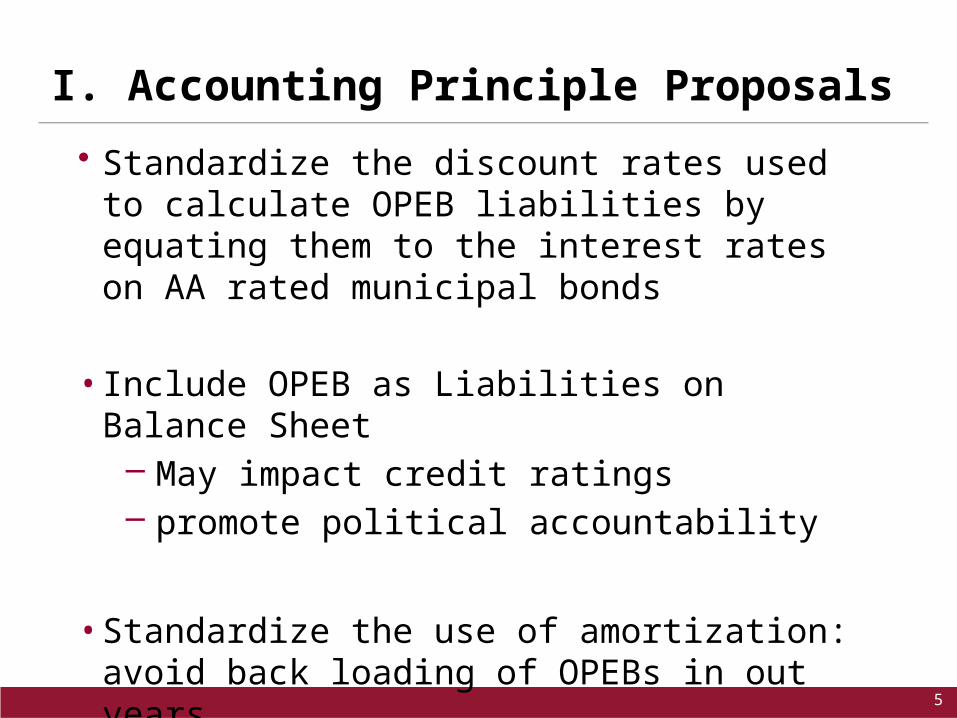
I. Accounting Principle Proposals
• Standardize the discount rates used to calculate OPEB liabilities by equating them to the interest rates on AA rated municipal bonds
• Include OPEB as Liabilities on Balance Sheet– May impact credit ratings – promote political accountability
• Standardize the use of amortization: avoid back loading of OPEBs in out years
5
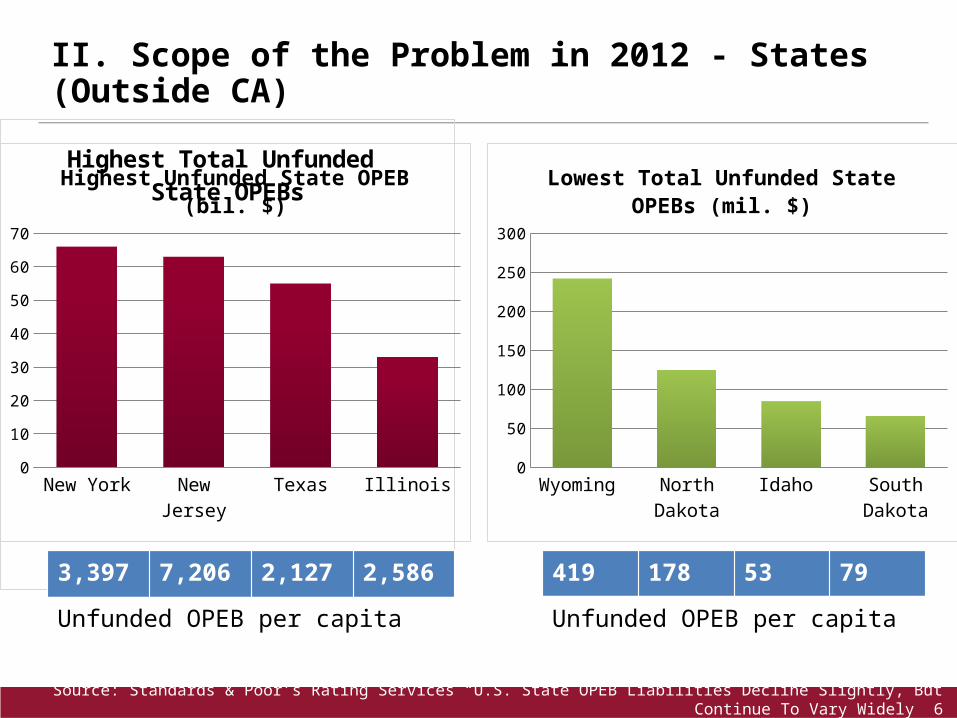
II. Scope of the Problem in 2012 - States (Outside CA)
Source: Standards & Poor’s Rating Services “U.S. State OPEB Liabilities Decline Slightly, But Continue To Vary Widely” 6
Highest Total Unfunded State OPEBs
New York New Jersey Texas Illinois0
10
20
30
40
50
60
70
Highest Unfunded State OPEB (bil. $)
Wyoming North Dakota Idaho South Dakota0
50
100
150
200
250
300
Lowest Total Unfunded State OPEBs (mil. $)
3,397 7,206 2,127 2,586 419 178 53 79
Unfunded OPEB per capita Unfunded OPEB per capita
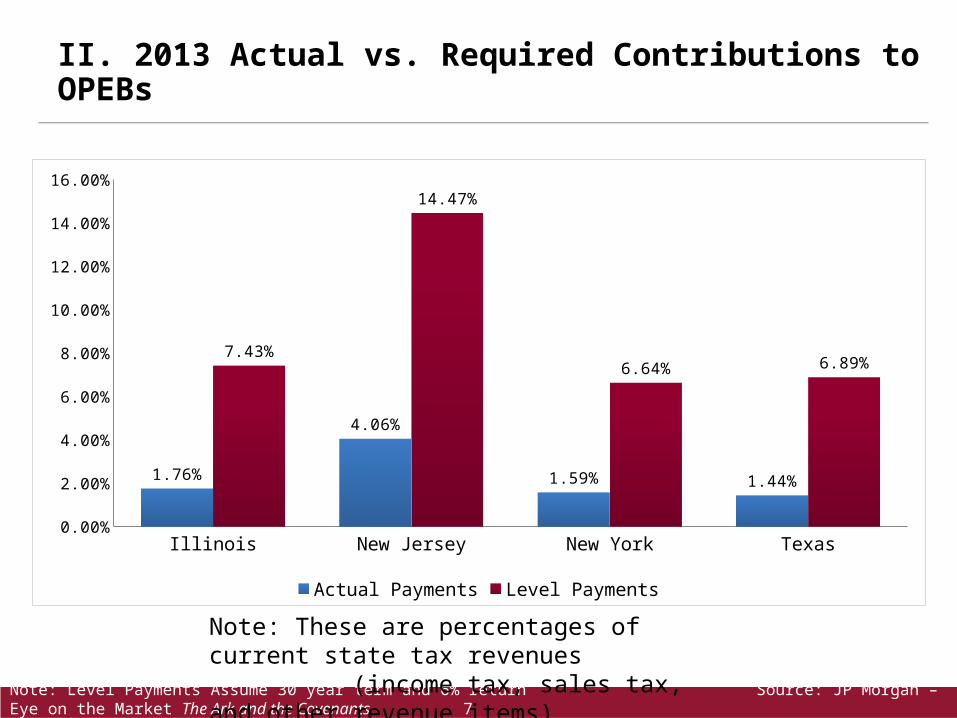
II. 2013 Actual vs. Required Contributions to OPEBs
Note: Level Payments Assume 30 year term and 6% return Source: JP Morgan – Eye on the Market The Ark and the Covenants 7
Illinois New Jersey New York Texas0.00%
2.00%
4.00%
6.00%
8.00%
10.00%
12.00%
14.00%
16.00%
1.76%
4.06%
1.59% 1.44%
7.43%
14.47%
6.64% 6.89%
Actual Payments Level Payments
Note: These are percentages of current state tax revenues (income tax, sales tax, and other revenue items)
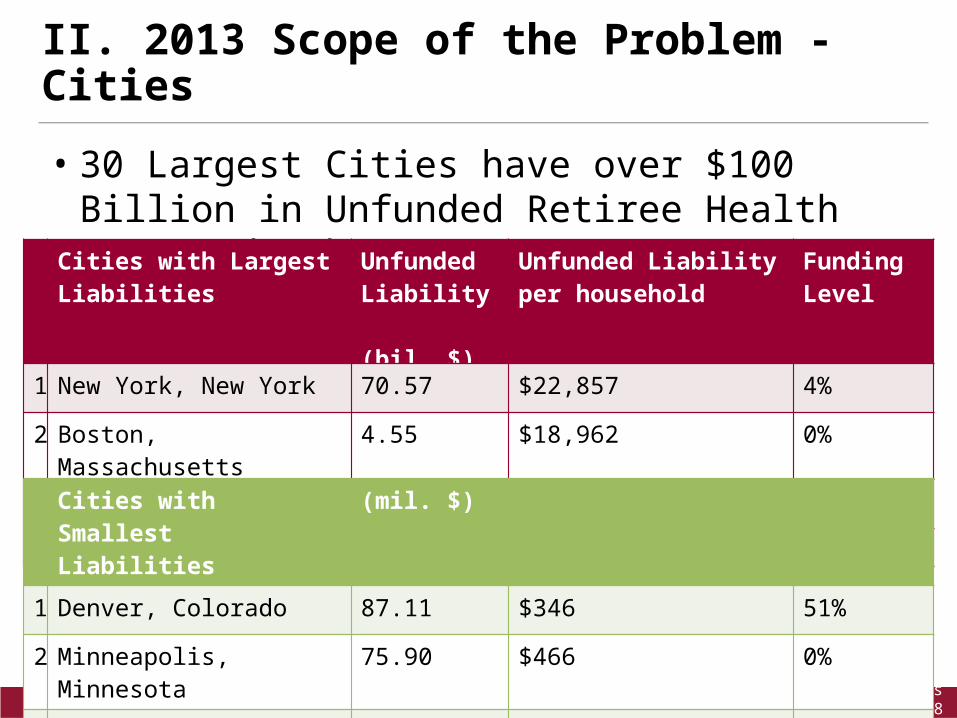
II. 2013 Scope of the Problem - Cities
• 30 Largest Cities have over $100 Billion in Unfunded Retiree Health Care and other OPEBs
Cities with Largest Liabilities Unfunded Liability (bil. $)
Unfunded Liability per household
Funding Level
1 New York, New York 70.57 $22,857 4%
2 Boston, Massachusetts 4.55 $18,962 0%
3 Detroit, Michigan 4.97 $15,682 <1%
Source: The Pew Charitable Trusts : American Cities 8
Cities with Smallest Liabilities (mil. $)1 Denver, Colorado 87.11 $346 51%
2 Minneapolis, Minnesota 75.90 $466 0%
3 Tampa, Florida 86.199 $613 0%
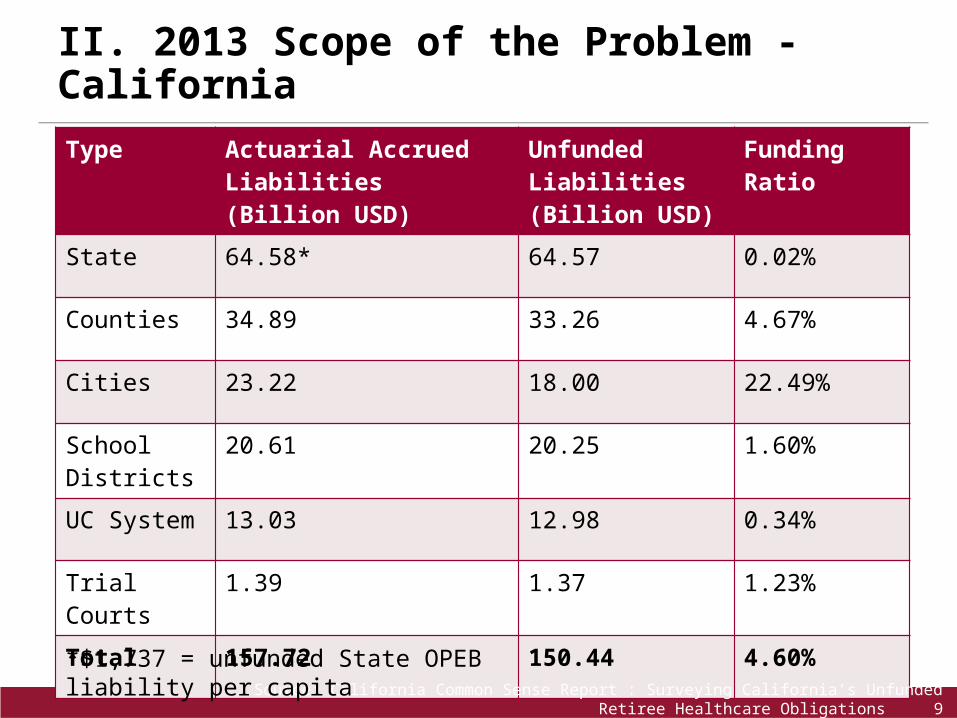
II. 2013 Scope of the Problem - CaliforniaType Actuarial Accrued Liabilities
(Billion USD)Unfunded Liabilities(Billion USD)
Funding Ratio
State 64.58* 64.57 0.02%
Counties 34.89 33.26 4.67%
Cities 23.22 18.00 22.49%
School Districts 20.61 20.25 1.60%
UC System 13.03 12.98 0.34%
Trial Courts 1.39 1.37 1.23%
Total 157.72 150.44 4.60%
Source: California Common Sense Report : Surveying California’s Unfunded Retiree Healthcare Obligations 9
*$1,737 = unfunded State OPEB liability per capita
III. OPEBs vs. Pensions
• Pensions require advance funding in separate trusts
• Minimal prefunding of OPEBS generally;
– Usually financed from current tax revenues
• Pensions often protected by statute or constitution
• OPEBs are legally easier to change, but still subject to
collective bargaining
10
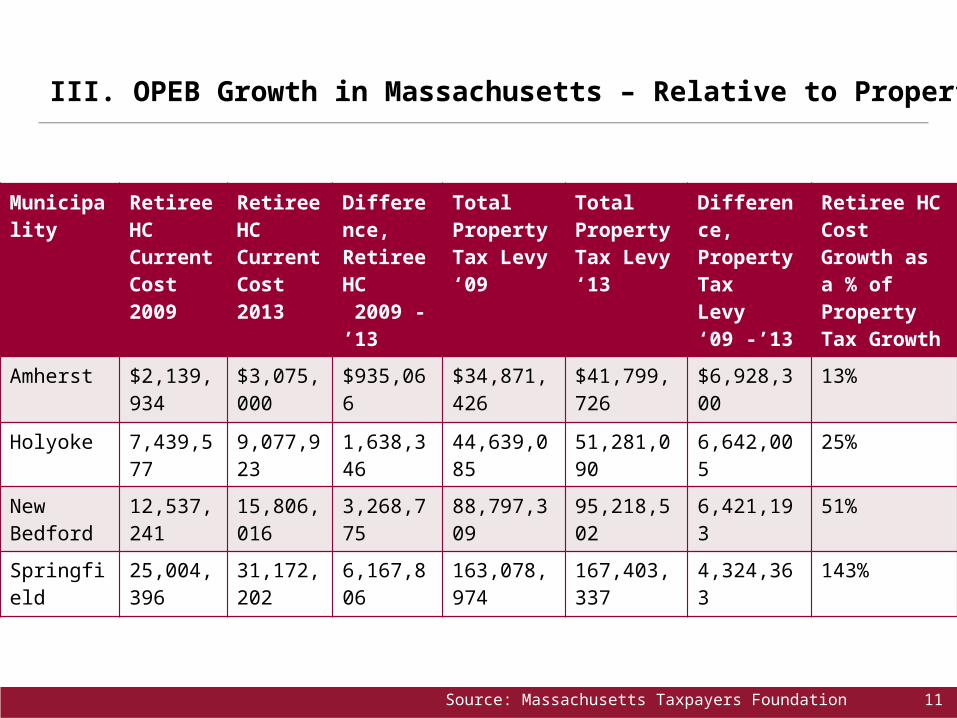
III. OPEB Growth in Massachusetts – Relative to Property Taxes
Municipality Retiree HC
Current Cost 2009
Retiree HC CurrentCost 2013
Difference,Retiree HC 2009 - ’13
Total Property Tax Levy ‘09
Total Property Tax Levy ‘13
Difference,Property TaxLevy ‘09 -’13
Retiree HC Cost Growth as a % of Property Tax Growth
Amherst $2,139,934 $3,075,000 $935,066 $34,871,426 $41,799,726 $6,928,300 13%
Holyoke 7,439,577 9,077,923 1,638,346 44,639,085 51,281,090 6,642,005 25%
New Bedford 12,537,241 15,806,016 3,268,775 88,797,309 95,218,502 6,421,193 51%
Springfield 25,004,396 31,172,202 6,167,806 163,078,974 167,403,337 4,324,363 143%
Source: Massachusetts Taxpayers Foundation 11
III. FY 2014 Impact of OPEBs – Newton, MA
• $21 million was spent on total retiree health care =$747 of each household’s annual property tax bill
• City proposed an override of proposition 2.5; Approved by voters for $8.4 million– $8.1 million went to pay Retiree Health Care
• $8.1 million translates to 79 additional teachers; an 8% increase over the number of current teachers
Source: Massachusetts Taxpayers Foundation 12
IV. Modifying Benefits & Premium Subsidies
• Increase future deductibles and copayments
• Reduce healthcare promises to new or recent municipal or state employees
• Reduce the scope of Healthcare provided– Require retirees to pay the full cost of dental and eye care
13
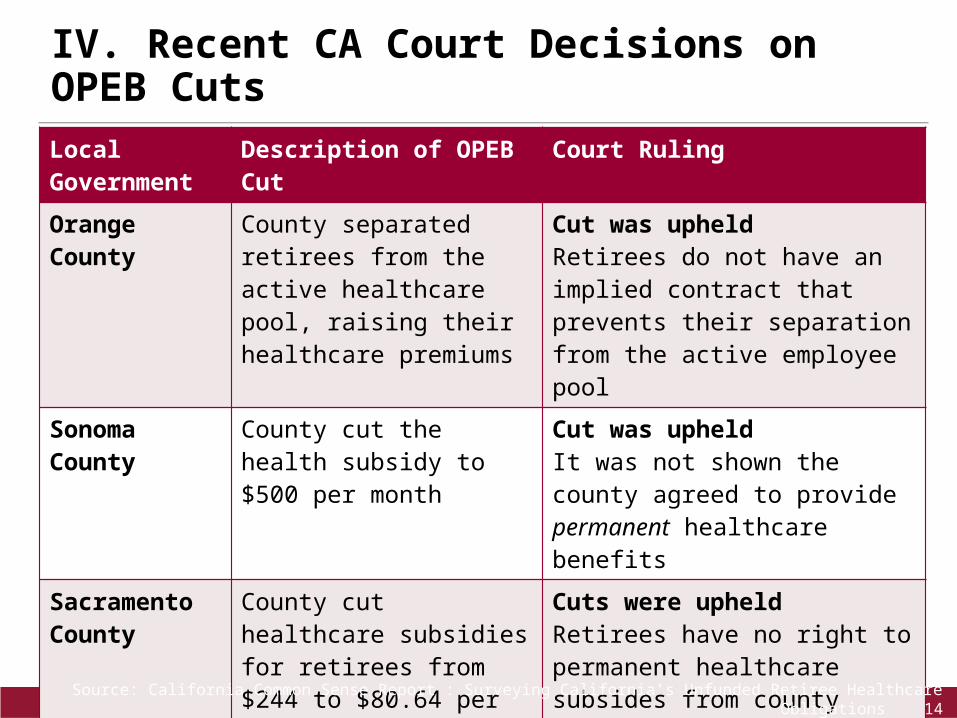
IV. Recent CA Court Decisions on OPEB CutsLocal Government Description of OPEB Cut Court Ruling
Orange County County separated retirees from the active healthcare pool, raising their healthcare premiums
Cut was upheldRetirees do not have an implied contract that prevents their separation from the active employee pool
Sonoma County County cut the health subsidy to $500 per month
Cut was upheldIt was not shown the county agreed to provide permanent healthcare benefits
Sacramento County
County cut healthcare subsidies for retirees from $244 to $80.64 per month
Cuts were upheldRetirees have no right to permanent healthcare subsides from county
Los Angeles City City gave the option of a frozen monthly subsidy at current benefit levels OR increasing employee contributions by 4% for normally rising benefits
Cut was rejectedThe cut was ruled an impairment of a vested right to a substantial benefit. Cited precedents for vested pensions
Source: California Common Sense Report : Surveying California’s Unfunded Retiree Healthcare Obligations 14
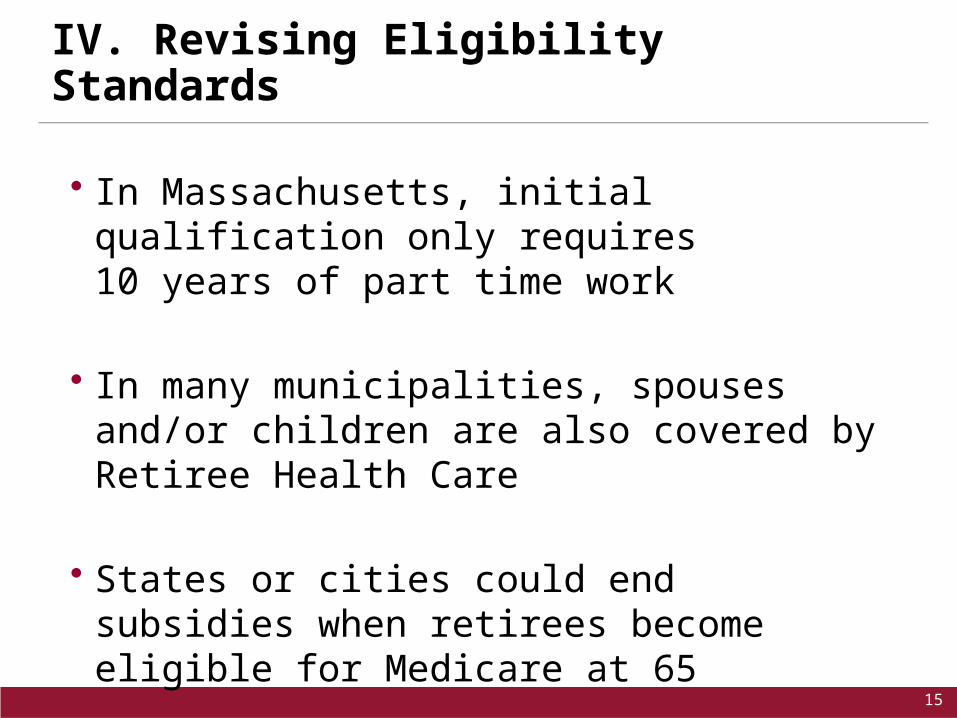
IV. Revising Eligibility Standards
• In Massachusetts, initial qualification only requires 10 years of part time work
• In many municipalities, spouses and/or children are also covered by Retiree Health Care
• States or cities could end subsidies when retirees become eligible for Medicare at 65
15
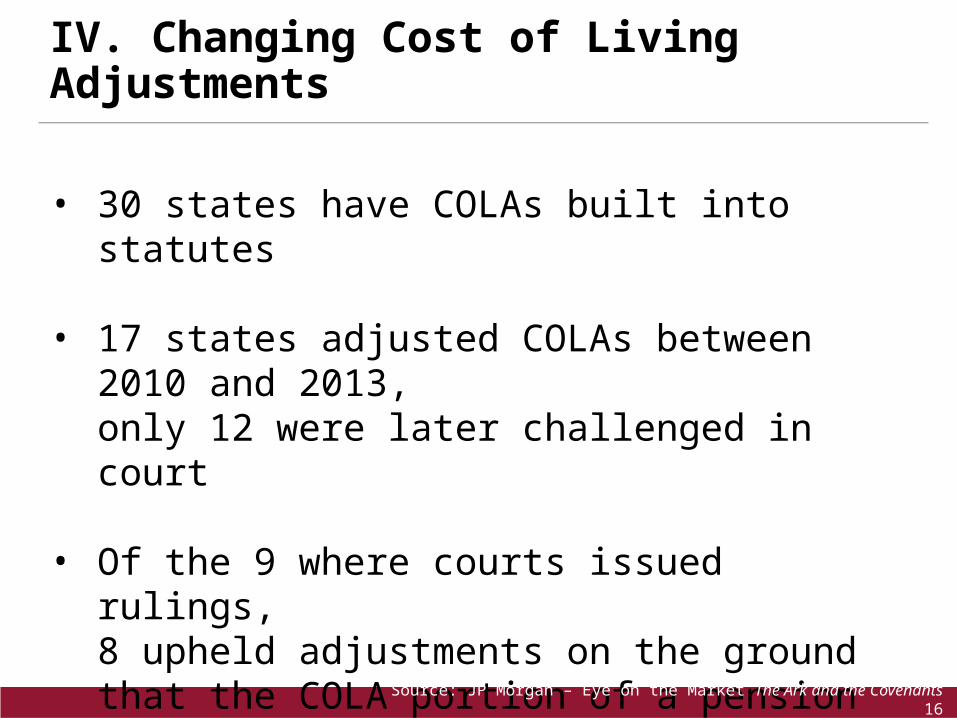
IV. Changing Cost of Living Adjustments
• 30 states have COLAs built into statutes
• 17 states adjusted COLAs between 2010 and 2013, only 12 were later challenged in court
• Of the 9 where courts issued rulings, 8 upheld adjustments on the ground that the COLA portion of a pension is not considered a contractual right
Source: JP Morgan – Eye on the Market The Ark and the Covenants 16
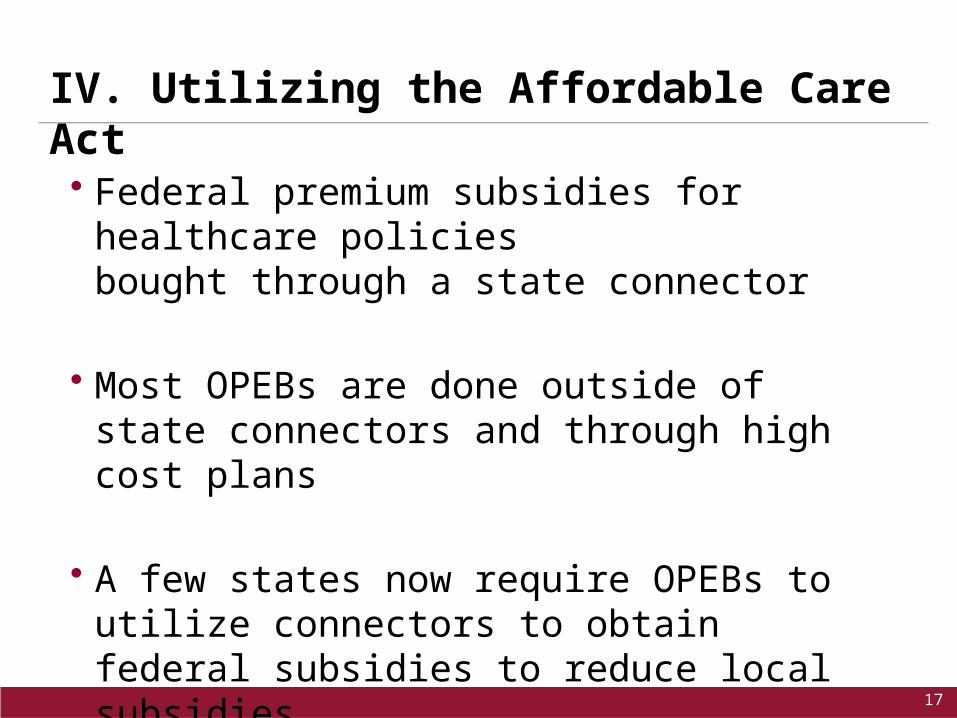
• Federal premium subsidies for healthcare policies bought through a state connector
• Most OPEBs are done outside of state connectors and through high cost plans
• A few states now require OPEBs to utilize connectors to obtain federal subsidies to reduce local subsidies
IV. Utilizing the Affordable Care Act
17
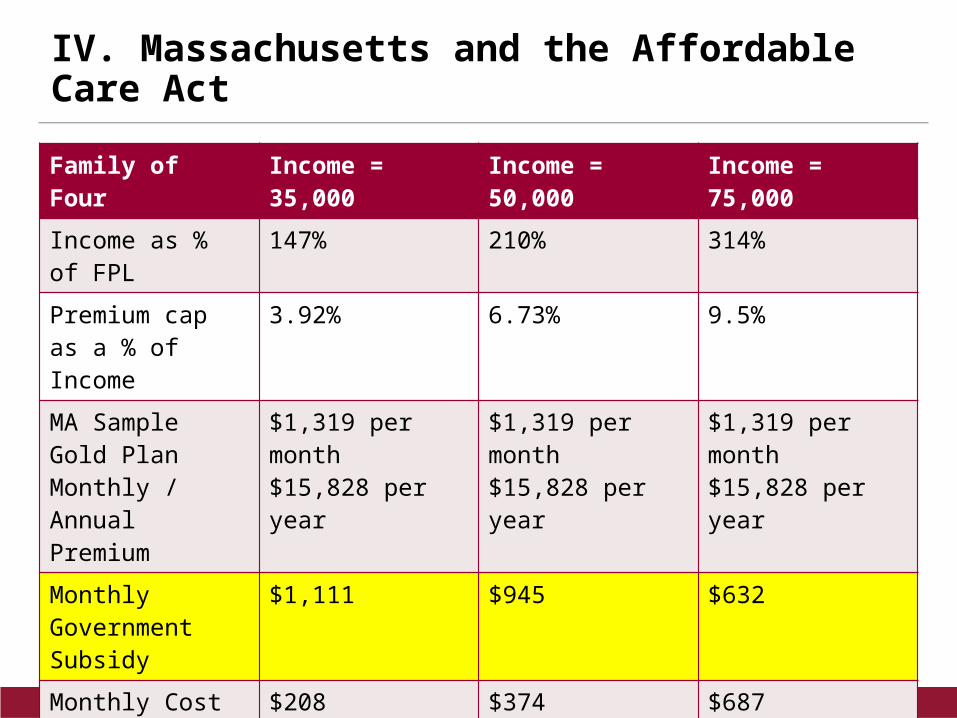
IV. Massachusetts and the Affordable Care Act
Note: Income used is the Marginal Adjusted Gross Income; Parents each 50 years of age Source: Making Care Easier Foundation 18
Family of Four Income = 35,000 Income = 50,000 Income = 75,000
Income as % of FPL 147% 210% 314%
Premium cap as a % of Income
3.92% 6.73% 9.5%
MA Sample Gold Plan Monthly / Annual Premium
$1,319 per month$15,828 per year
$1,319 per month$15,828 per year
$1,319 per month$15,828 per year
Monthly Government Subsidy
$1,111 $945 $632
Monthly Cost to Family $208 $374 $687
Annual Deductible $1000 per family $1000 per family $1000 per family
Annual Out-of-pocket Maximum
$6000 per family $6000 per family $6000 per family
Conclusion• Unfunded OPEBs are rising quickly and quietly,
often faster than unfunded pension liabilities
• But the new accounting rules will require unfunded OPEBs to be included on state and municipal balance sheets.
• OPEBs have much less legal protection than pension promises, though they can still be subject to collective bargaining
• So the public debate should focus on how OPEBs can be reasonably revised, for whom and when
19