Embed Size (px)
Citation preview
Unified Improvement Planning: COVID update
2020-2021
Jessica Welch, Assessment and Improvement Planning Specialist
1
Contents About............................................................................................................................................................. 2
Timeline..................................................................................................................................................... 3
Online UIP System: Overview ....................................................................................................................... 4
Accessing Online UIP System .................................................................................................................... 4
Tool Logistics ............................................................................................................................................. 5
Section I: Summary of School ....................................................................................................................... 5
Section II: UIP Info ......................................................................................................................................... 6
Section III: Data Narrative ............................................................................................................................. 7
Section III, Tab 1: UIP Narrative ................................................................................................................ 7
Section III, Tab 1: Brief Description ........................................................................................................... 7
Section III Tab 4: Prior Year Targets .......................................................................................................... 9
Section III Tab 4: Current Performance................................................................................................... 12
Section III Tab 5, Trend Analysis ............................................................................................................. 15
Section III Tab 6: Priority Performance Challenges ................................................................................. 16
Section III Tab 7: Root Cause Analysis ..................................................................................................... 17
Section IV: Action Plans .............................................................................................................................. 19
Section IV Tab 1: Major Improvement Strategies ................................................................................... 19
Section IV Tab 2: Planning Form (Action Steps and Implementation Benchmarks) ............................... 21
Implementation Benchmarks .............................................................................................................. 21
Action Steps ........................................................................................................................................ 22
Section IV Tab 3: Full Plan ....................................................................................................................... 23
Section IV Tab 4: Target Setting .............................................................................................................. 23
Appendix ..................................................................................................................................................... 26
Background ............................................................................................................................................. 26
UIP and Authorization ............................................................................................................................. 26
School Accountability Committee (SAC) and the UIP ............................................................................. 26
ESSA and the UIP ..................................................................................................................................... 26
Targeted Support and Comprehensive Support schools ........................................................................ 27
Performance Concern ............................................................................................................................. 27
Priority Improvement and Turnaround .................................................................................................. 27
Accreditation contract requirements ..................................................................................................... 27
2
About The Education Accountability Act of 2009 requires each Colorado district and school to create an annual improvement plan. Furthermore, the federal Elementary and Secondary Education Act (ESEA) – including Titles IA, IIA and III – requires improvement planning to focus on ensuring that all students in the state reach proficiency in English language arts/reading and mathematics.
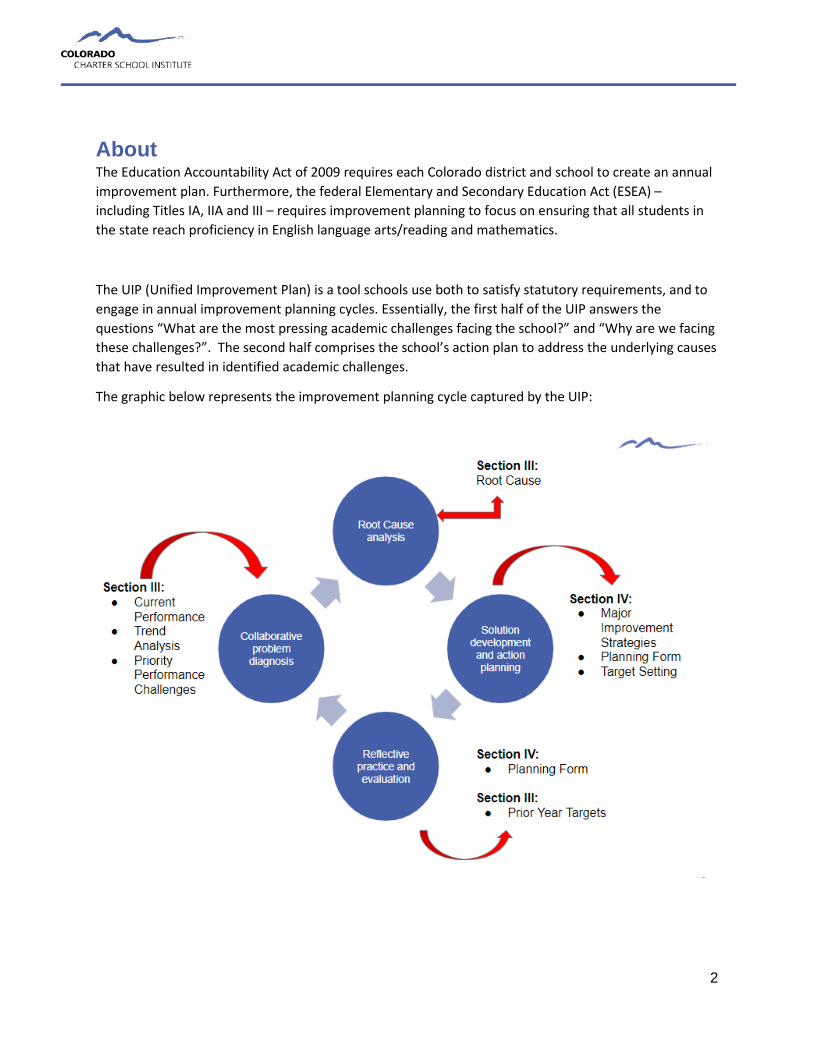
The UIP (Unified Improvement Plan) is a tool schools use both to satisfy statutory requirements, and to engage in annual improvement planning cycles. Essentially, the first half of the UIP answers the questions “What are the most pressing academic challenges facing the school?” and “Why are we facing these challenges?”. The second half comprises the school’s action plan to address the underlying causes that have resulted in identified academic challenges.
The graphic below represents the improvement planning cycle captured by the UIP:
3
Making the 20-21 UIP Relevant
The core purpose of the UIP remains the same: identify academic challenges and create a plan to address those challenges. In a typical year, schools modify and update prior plans, and occasionally start from scratch. It is unlikely that continuing with plans created in 19-20 will be feasible during the 20-21 school year. At a minimum, priorities have shifted drastically since schooling was interrupted in March and new student/school needs have arisen. We continue to ask schools to use the UIP to reflect the planning that is going on at the school level. As such, the bulk of the guidance in this document is focused on the Action Planning section of the UIP. The 20-21 UIP should serve as an implementation plan for how each school will return to learning in the fall.
Please note: updates due to COVID are in red text throughout the handbook.
CDE has released some additional UIP requirements for the 2020-2021 school year. These changes are throughout this handbook in green text.
Timeline
CDE has not lifted the UIP requirement for the 20-21 school year. In fact, they are requiring schools that did not submit in 19-20 due to the pandemic submit their 20-21 UIP in October.
These deadlines are draft deadlines. There will be ample opportunity for support and feedback between draft deadlines and the final deadline in October.
February - May: UIP trainings
March: Everything goes out the window
June 8: UIP tool rolls over (20-21 form available)
July 15: Completed first draft of UIP due for renewal schools
August 15th: Completed first draft of UIP in online tool
September 1st - October 15th: Feedback from CSI, make any required updates based on SPF
October 15th: Final draft of UIP due
November: Final UIPs submitted to CDE for public posting
Priority Improvement/Turnaround schools only: Additional CDE feedback received in March
4
Online UIP System: Overview Accessing Online UIP System
To log on, go to: https://www.cde.state.co.us/idm/uip
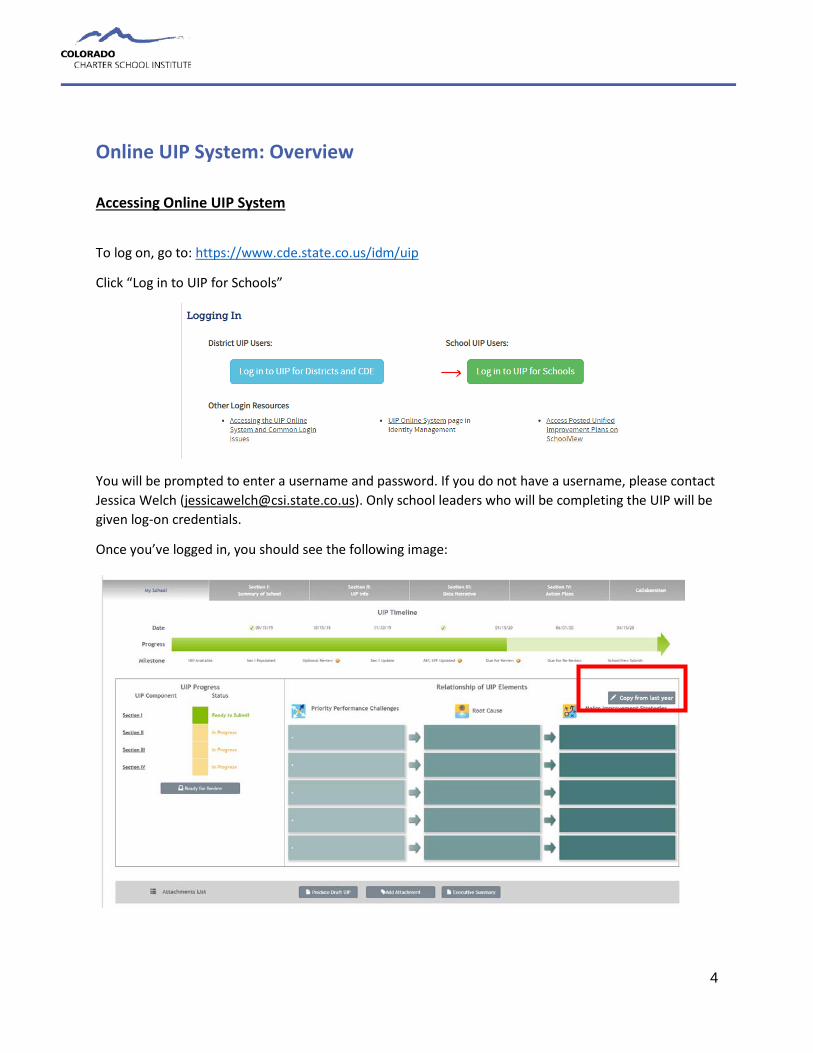
Click “Log in to UIP for Schools”
You will be prompted to enter a username and password. If you do not have a username, please contact Jessica Welch ([email protected]). Only school leaders who will be completing the UIP will be given log-on credentials.
Once you’ve logged in, you should see the following image:
5
Tool Logistics
Order of completion
The online system is designed to be edited in order from start to finish. Working in non-consecutive order through the tabs will result in loss of functionality. Be sure to work through the tabs in order as your complete your UIP.
Save frequently
This system does not automatically save as you complete each section. If you lose internet collection or accidentally click out of a tab, any work that has not been saved will be lost.
“Copy from last year” button
Because the CSI timeline differs from the state timeline, schools will begin their work on the UIP in the prior year UIP form. Once the state system rolls over in June, schools must use the “Copy from last year” button (highlight in image above) to transfer their work into the new blank UIP form.
Due to the unique circumstances of the 20-21 UIP, schools may choose to start from scratch in the UIP system rather than building on their prior UIP. If that is the case, we recommend waiting until the June 8 rollover date to begin work in the UIP tool. Once the system has rolled over to the 20-21 UIP, schools will not use the copy from last year button.
UIP as a public document
Final draft UIPs are submitted to CDE for public posting each year. As such, when creating your UIP avoid:
• Reporting any achievement data for student groups smaller than 16 students (n<16) and growth data for student groups smaller than 20 students (n<20).
• Making any references that could be construed as negative about the student or family school population (i.e., “students lack motivation”, “parents failed to submit xxx documentation”).
• Focusing on any aspect or issue that is outside the control of the school and/or adult actions. For example, rather than focusing on the lack of academic readiness of incoming students, focus on improving systems that can remediate gaps in student learning.
Section I: Summary of School
This section has NO REQUIRED ACTION. It contains a summary of the school’s current plan type which will not be populated until the release of the State Performance Framework (SPF) in the fall.
6
Section II: UIP Info
This section contains three subsections: Context, Improvement Plan Information, and School Contact Information.
Context: OPTIONAL. This section is duplicative, as it contains the same information included in the Brief Description tab of Section III.
Improvement Plan Information: CSI schools will select “State Accreditation”
School Contact Information: Add Contact information of the staff members responsible for the completion of the UIP. At a minimum, this should include the School Leader and School Accountability Committee Chair.
7
Section III: Data Narrative
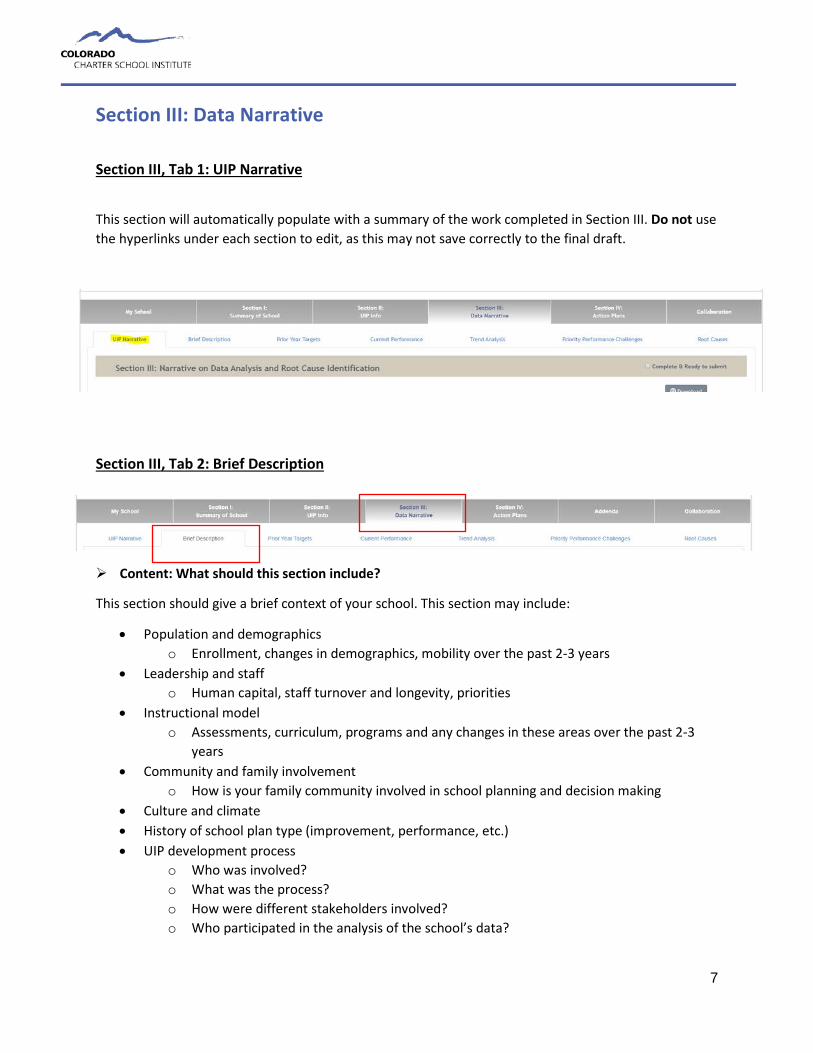
Section III, Tab 1: UIP Narrative
This section will automatically populate with a summary of the work completed in Section III. Do not use the hyperlinks under each section to edit, as this may not save correctly to the final draft.
Section III, Tab 2: Brief Description
Content: What should this section include?
This section should give a brief context of your school. This section may include:
• Population and demographics o Enrollment, changes in demographics, mobility over the past 2-3 years
• Leadership and staff o Human capital, staff turnover and longevity, priorities
• Instructional model o Assessments, curriculum, programs and any changes in these areas over the past 2-3
years • Community and family involvement
o How is your family community involved in school planning and decision making • Culture and climate • History of school plan type (improvement, performance, etc.) • UIP development process
o Who was involved? o What was the process? o How were different stakeholders involved? o Who participated in the analysis of the school’s data?
8
o How was analysis conducted (try to include detail beyond “staff determined” or “based on data we concluded”)
In addition to the information above, for the 20-21 UIP, consider including the instructional approach the school will take for the 20-21 school year. Will the school plan on beginning the year with remote learning and phasing back into in-person learning, or will in-person learning begin immediately? This section should align with the fall learning plan each school submits to CSI.
Required: Schools must include information on how the SAC (school accountability committee) OR “return to school committee” was included in the planning process for the 20-21 school year.
Common Pitfalls: What common issues can be avoided?
• Make sure to include descriptions of unique programming (Dual Language, Montessori, Core Knowledge, etc.) Don’t assume the reader knows what makes your model unique, and avoid using model-specific jargon.
• Delving into data analysis. Save this for the “Current Performance” section.
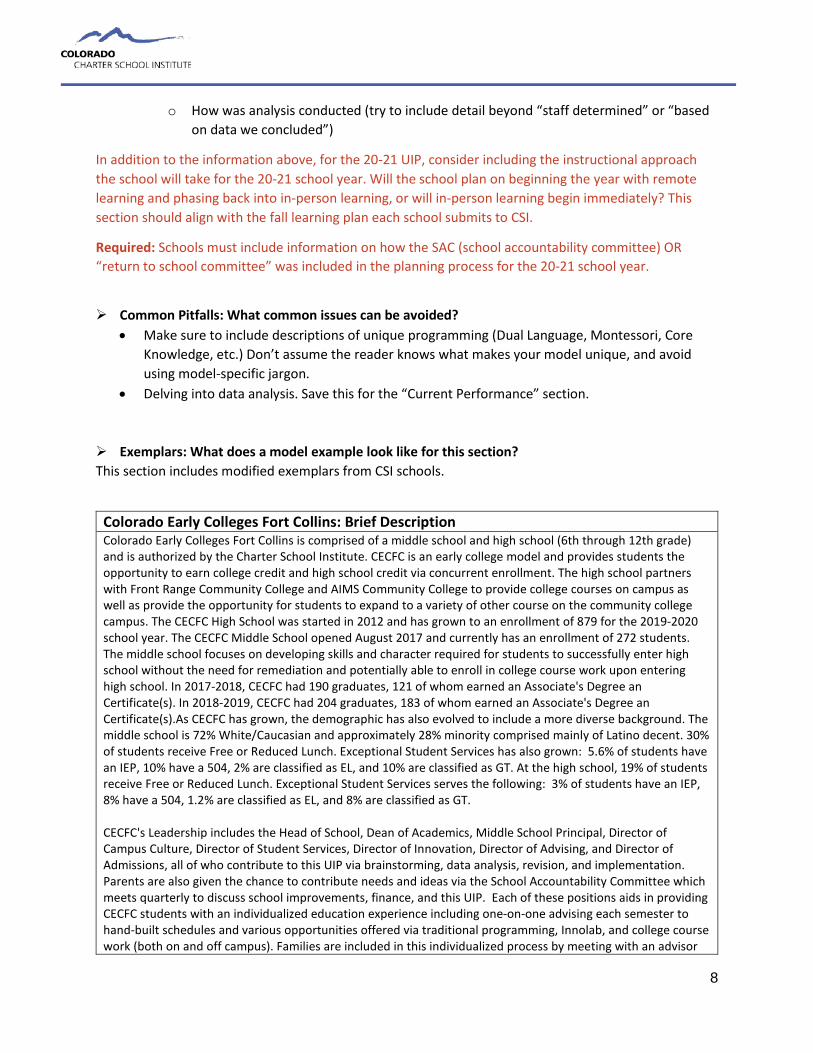
Exemplars: What does a model example look like for this section? This section includes modified exemplars from CSI schools.
Colorado Early Colleges Fort Collins: Brief Description Colorado Early Colleges Fort Collins is comprised of a middle school and high school (6th through 12th grade) and is authorized by the Charter School Institute. CECFC is an early college model and provides students the opportunity to earn college credit and high school credit via concurrent enrollment. The high school partners with Front Range Community College and AIMS Community College to provide college courses on campus as well as provide the opportunity for students to expand to a variety of other course on the community college campus. The CECFC High School was started in 2012 and has grown to an enrollment of 879 for the 2019-2020 school year. The CECFC Middle School opened August 2017 and currently has an enrollment of 272 students. The middle school focuses on developing skills and character required for students to successfully enter high school without the need for remediation and potentially able to enroll in college course work upon entering high school. In 2017-2018, CECFC had 190 graduates, 121 of whom earned an Associate's Degree an Certificate(s). In 2018-2019, CECFC had 204 graduates, 183 of whom earned an Associate's Degree an Certificate(s).As CECFC has grown, the demographic has also evolved to include a more diverse background. The middle school is 72% White/Caucasian and approximately 28% minority comprised mainly of Latino decent. 30% of students receive Free or Reduced Lunch. Exceptional Student Services has also grown: 5.6% of students have an IEP, 10% have a 504, 2% are classified as EL, and 10% are classified as GT. At the high school, 19% of students receive Free or Reduced Lunch. Exceptional Student Services serves the following: 3% of students have an IEP, 8% have a 504, 1.2% are classified as EL, and 8% are classified as GT. CECFC's Leadership includes the Head of School, Dean of Academics, Middle School Principal, Director of Campus Culture, Director of Student Services, Director of Innovation, Director of Advising, and Director of Admissions, all of who contribute to this UIP via brainstorming, data analysis, revision, and implementation. Parents are also given the chance to contribute needs and ideas via the School Accountability Committee which meets quarterly to discuss school improvements, finance, and this UIP. Each of these positions aids in providing CECFC students with an individualized education experience including one-on-one advising each semester to hand-built schedules and various opportunities offered via traditional programming, Innolab, and college course work (both on and off campus). Families are included in this individualized process by meeting with an advisor
9
each semester along with their students and the opportunity to participate in the School Accountability Committee meetings and events to learn more and contribute to decision making about school functions, offerings, and the implementation of this UIP. CECFC uses the ACCUPLACER assessment at the high school and NWEA MAPS testing at the middle to determine placement and scheduling for each student. As CECFC has expanded, course work has been added to better meet the needs of the various demographics being enrolled including additional SPED, ELL, and MTSS programming at the middle school and high school as well as adding various elective opportunities on campus when interest is expressed by families and students.
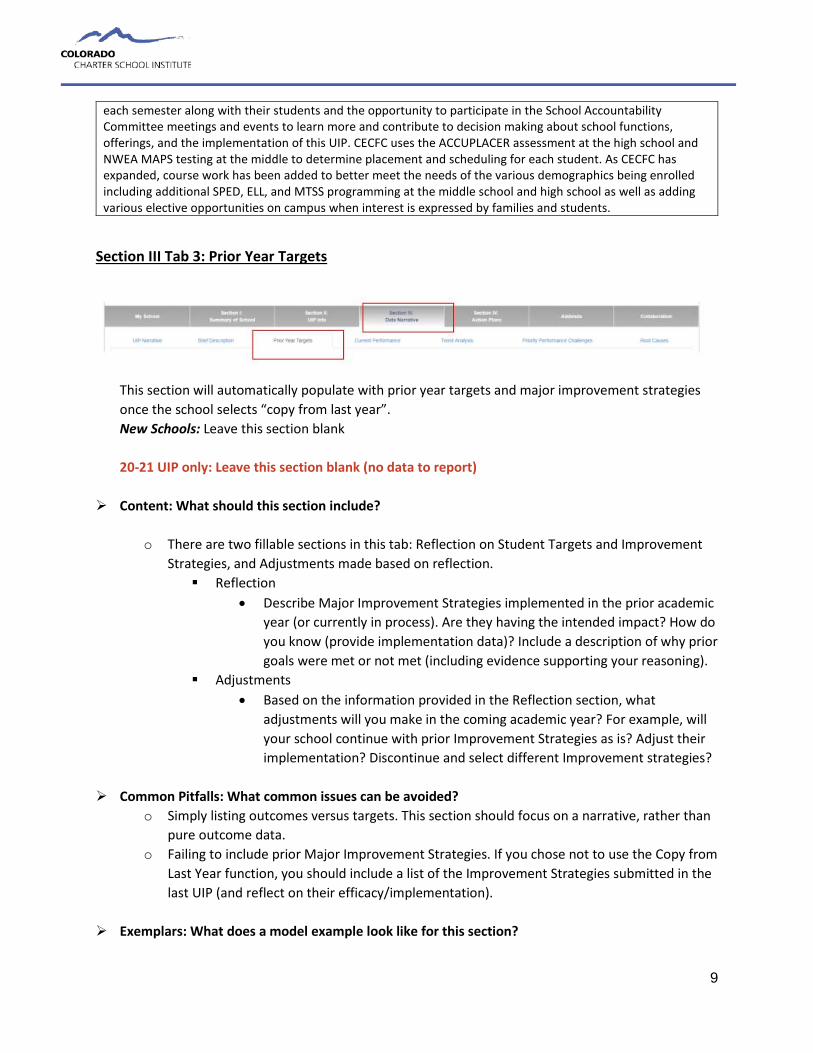
Section III Tab 3: Prior Year Targets
This section will automatically populate with prior year targets and major improvement strategies once the school selects “copy from last year”. New Schools: Leave this section blank 20-21 UIP only: Leave this section blank (no data to report)
Content: What should this section include? o There are two fillable sections in this tab: Reflection on Student Targets and Improvement
Strategies, and Adjustments made based on reflection. Reflection
• Describe Major Improvement Strategies implemented in the prior academic year (or currently in process). Are they having the intended impact? How do you know (provide implementation data)? Include a description of why prior goals were met or not met (including evidence supporting your reasoning).
Adjustments • Based on the information provided in the Reflection section, what
adjustments will you make in the coming academic year? For example, will your school continue with prior Improvement Strategies as is? Adjust their implementation? Discontinue and select different Improvement strategies?
Common Pitfalls: What common issues can be avoided? o Simply listing outcomes versus targets. This section should focus on a narrative, rather than
pure outcome data. o Failing to include prior Major Improvement Strategies. If you chose not to use the Copy from
Last Year function, you should include a list of the Improvement Strategies submitted in the last UIP (and reflect on their efficacy/implementation).
Exemplars: What does a model example look like for this section?
10
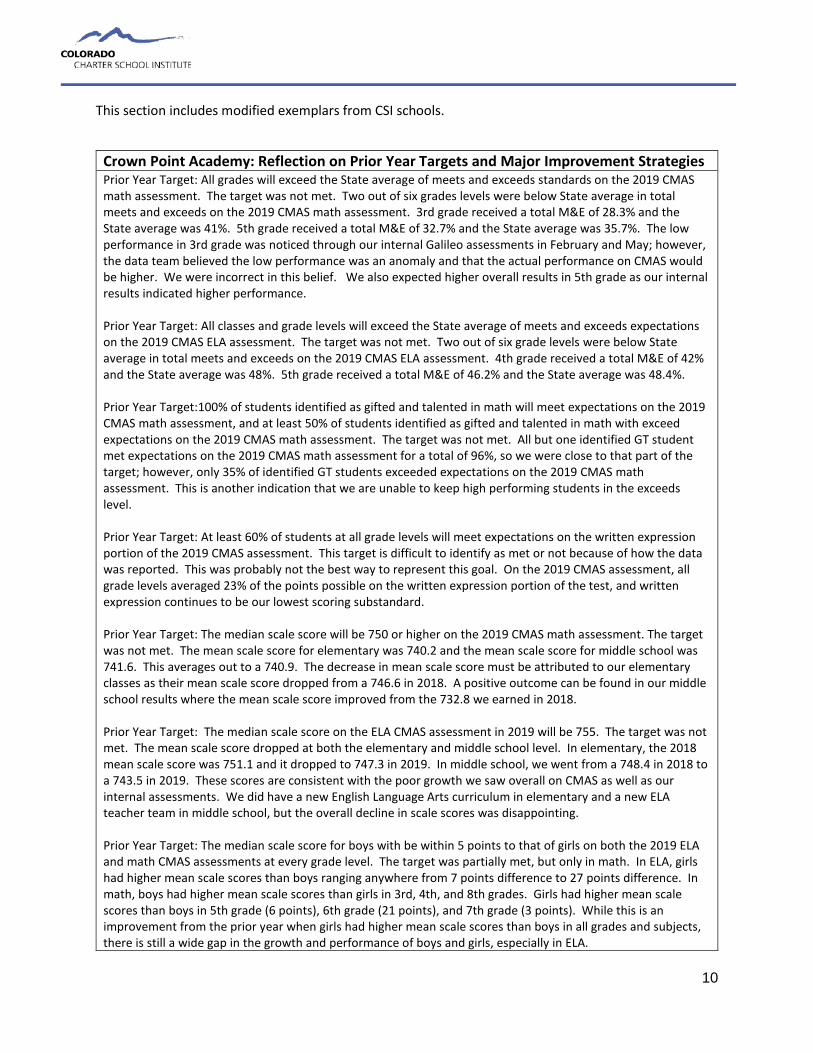
This section includes modified exemplars from CSI schools.
Crown Point Academy: Reflection on Prior Year Targets and Major Improvement Strategies Prior Year Target: All grades will exceed the State average of meets and exceeds standards on the 2019 CMAS math assessment. The target was not met. Two out of six grades levels were below State average in total meets and exceeds on the 2019 CMAS math assessment. 3rd grade received a total M&E of 28.3% and the State average was 41%. 5th grade received a total M&E of 32.7% and the State average was 35.7%. The low performance in 3rd grade was noticed through our internal Galileo assessments in February and May; however, the data team believed the low performance was an anomaly and that the actual performance on CMAS would be higher. We were incorrect in this belief. We also expected higher overall results in 5th grade as our internal results indicated higher performance. Prior Year Target: All classes and grade levels will exceed the State average of meets and exceeds expectations on the 2019 CMAS ELA assessment. The target was not met. Two out of six grade levels were below State average in total meets and exceeds on the 2019 CMAS ELA assessment. 4th grade received a total M&E of 42% and the State average was 48%. 5th grade received a total M&E of 46.2% and the State average was 48.4%. Prior Year Target:100% of students identified as gifted and talented in math will meet expectations on the 2019 CMAS math assessment, and at least 50% of students identified as gifted and talented in math with exceed expectations on the 2019 CMAS math assessment. The target was not met. All but one identified GT student met expectations on the 2019 CMAS math assessment for a total of 96%, so we were close to that part of the target; however, only 35% of identified GT students exceeded expectations on the 2019 CMAS math assessment. This is another indication that we are unable to keep high performing students in the exceeds level. Prior Year Target: At least 60% of students at all grade levels will meet expectations on the written expression portion of the 2019 CMAS assessment. This target is difficult to identify as met or not because of how the data was reported. This was probably not the best way to represent this goal. On the 2019 CMAS assessment, all grade levels averaged 23% of the points possible on the written expression portion of the test, and written expression continues to be our lowest scoring substandard. Prior Year Target: The median scale score will be 750 or higher on the 2019 CMAS math assessment. The target was not met. The mean scale score for elementary was 740.2 and the mean scale score for middle school was 741.6. This averages out to a 740.9. The decrease in mean scale score must be attributed to our elementary classes as their mean scale score dropped from a 746.6 in 2018. A positive outcome can be found in our middle school results where the mean scale score improved from the 732.8 we earned in 2018. Prior Year Target: The median scale score on the ELA CMAS assessment in 2019 will be 755. The target was not met. The mean scale score dropped at both the elementary and middle school level. In elementary, the 2018 mean scale score was 751.1 and it dropped to 747.3 in 2019. In middle school, we went from a 748.4 in 2018 to a 743.5 in 2019. These scores are consistent with the poor growth we saw overall on CMAS as well as our internal assessments. We did have a new English Language Arts curriculum in elementary and a new ELA teacher team in middle school, but the overall decline in scale scores was disappointing. Prior Year Target: The median scale score for boys with be within 5 points to that of girls on both the 2019 ELA and math CMAS assessments at every grade level. The target was partially met, but only in math. In ELA, girls had higher mean scale scores than boys ranging anywhere from 7 points difference to 27 points difference. In math, boys had higher mean scale scores than girls in 3rd, 4th, and 8th grades. Girls had higher mean scale scores than boys in 5th grade (6 points), 6th grade (21 points), and 7th grade (3 points). While this is an improvement from the prior year when girls had higher mean scale scores than boys in all grades and subjects, there is still a wide gap in the growth and performance of boys and girls, especially in ELA.
11
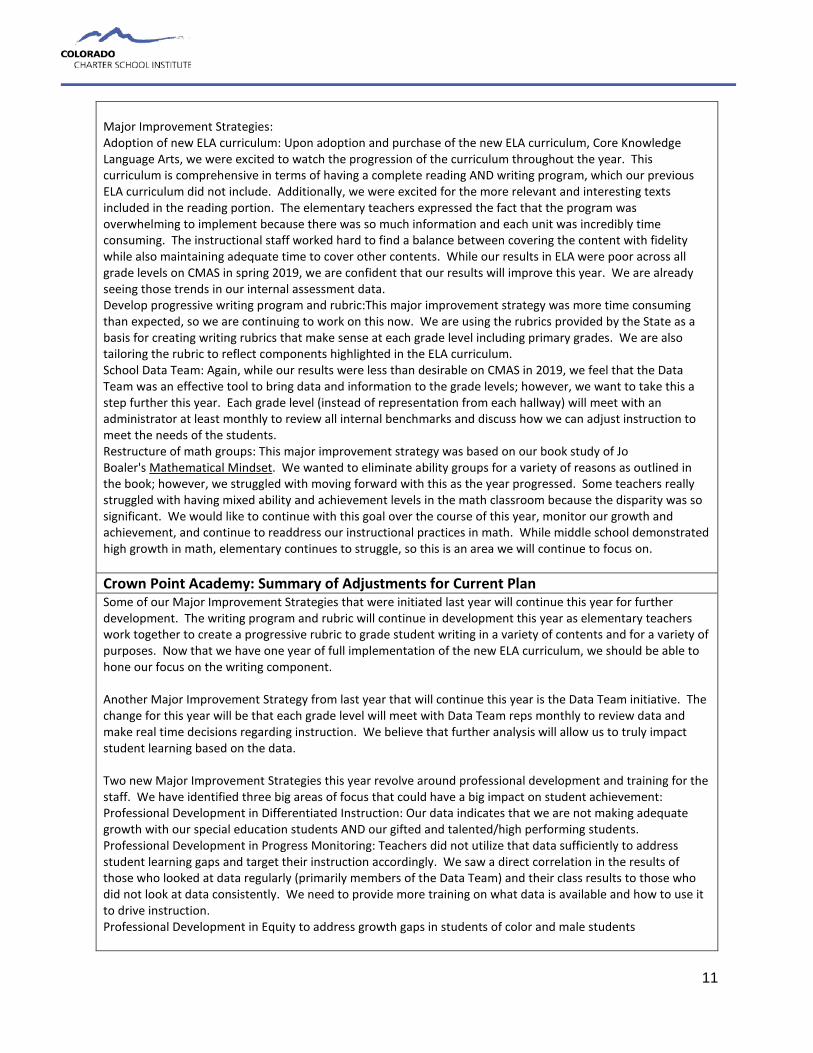
Major Improvement Strategies: Adoption of new ELA curriculum: Upon adoption and purchase of the new ELA curriculum, Core Knowledge Language Arts, we were excited to watch the progression of the curriculum throughout the year. This curriculum is comprehensive in terms of having a complete reading AND writing program, which our previous ELA curriculum did not include. Additionally, we were excited for the more relevant and interesting texts included in the reading portion. The elementary teachers expressed the fact that the program was overwhelming to implement because there was so much information and each unit was incredibly time consuming. The instructional staff worked hard to find a balance between covering the content with fidelity while also maintaining adequate time to cover other contents. While our results in ELA were poor across all grade levels on CMAS in spring 2019, we are confident that our results will improve this year. We are already seeing those trends in our internal assessment data. Develop progressive writing program and rubric:This major improvement strategy was more time consuming than expected, so we are continuing to work on this now. We are using the rubrics provided by the State as a basis for creating writing rubrics that make sense at each grade level including primary grades. We are also tailoring the rubric to reflect components highlighted in the ELA curriculum. School Data Team: Again, while our results were less than desirable on CMAS in 2019, we feel that the Data Team was an effective tool to bring data and information to the grade levels; however, we want to take this a step further this year. Each grade level (instead of representation from each hallway) will meet with an administrator at least monthly to review all internal benchmarks and discuss how we can adjust instruction to meet the needs of the students. Restructure of math groups: This major improvement strategy was based on our book study of Jo Boaler's Mathematical Mindset. We wanted to eliminate ability groups for a variety of reasons as outlined in the book; however, we struggled with moving forward with this as the year progressed. Some teachers really struggled with having mixed ability and achievement levels in the math classroom because the disparity was so significant. We would like to continue with this goal over the course of this year, monitor our growth and achievement, and continue to readdress our instructional practices in math. While middle school demonstrated high growth in math, elementary continues to struggle, so this is an area we will continue to focus on. Crown Point Academy: Summary of Adjustments for Current Plan Some of our Major Improvement Strategies that were initiated last year will continue this year for further development. The writing program and rubric will continue in development this year as elementary teachers work together to create a progressive rubric to grade student writing in a variety of contents and for a variety of purposes. Now that we have one year of full implementation of the new ELA curriculum, we should be able to hone our focus on the writing component. Another Major Improvement Strategy from last year that will continue this year is the Data Team initiative. The change for this year will be that each grade level will meet with Data Team reps monthly to review data and make real time decisions regarding instruction. We believe that further analysis will allow us to truly impact student learning based on the data. Two new Major Improvement Strategies this year revolve around professional development and training for the staff. We have identified three big areas of focus that could have a big impact on student achievement: Professional Development in Differentiated Instruction: Our data indicates that we are not making adequate growth with our special education students AND our gifted and talented/high performing students. Professional Development in Progress Monitoring: Teachers did not utilize that data sufficiently to address student learning gaps and target their instruction accordingly. We saw a direct correlation in the results of those who looked at data regularly (primarily members of the Data Team) and their class results to those who did not look at data consistently. We need to provide more training on what data is available and how to use it to drive instruction. Professional Development in Equity to address growth gaps in students of color and male students
12
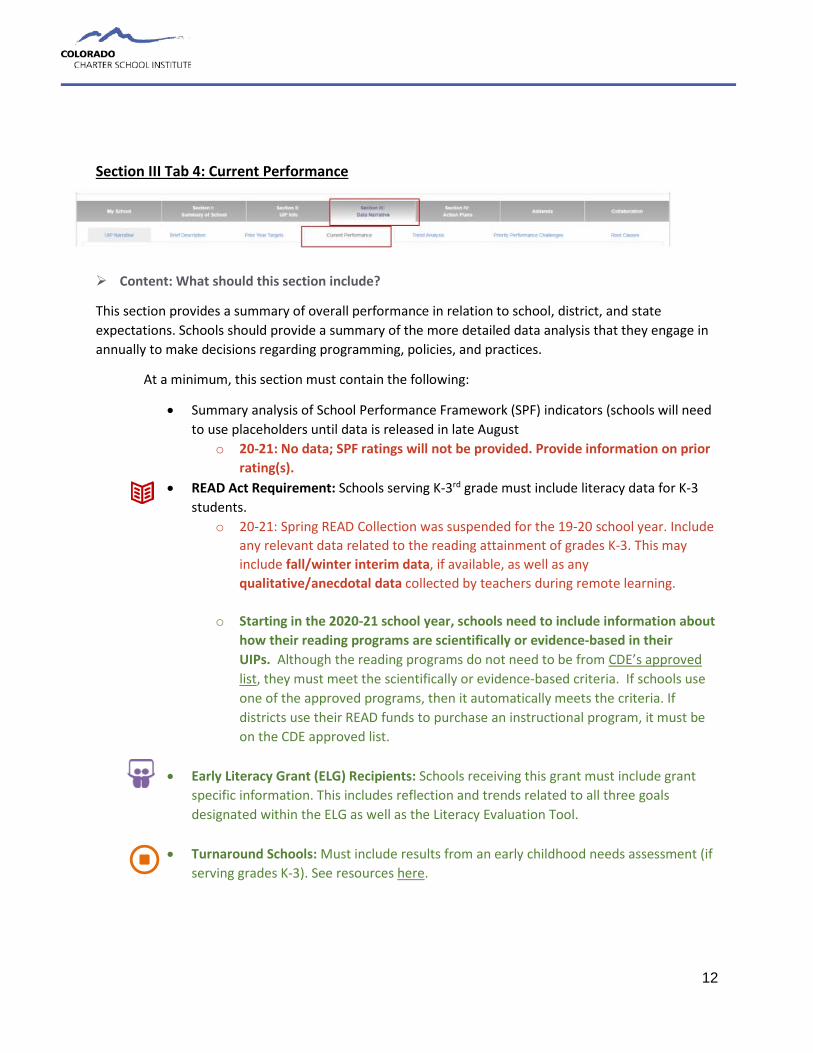
Section III Tab 4: Current Performance
Content: What should this section include?
This section provides a summary of overall performance in relation to school, district, and state expectations. Schools should provide a summary of the more detailed data analysis that they engage in annually to make decisions regarding programming, policies, and practices.
At a minimum, this section must contain the following:
• Summary analysis of School Performance Framework (SPF) indicators (schools will need to use placeholders until data is released in late August
o 20-21: No data; SPF ratings will not be provided. Provide information on prior rating(s).
• READ Act Requirement: Schools serving K-3rd grade must include literacy data for K-3 students.
o 20-21: Spring READ Collection was suspended for the 19-20 school year. Include any relevant data related to the reading attainment of grades K-3. This may include fall/winter interim data, if available, as well as any qualitative/anecdotal data collected by teachers during remote learning.
o Starting in the 2020-21 school year, schools need to include information about how their reading programs are scientifically or evidence-based in their UIPs. Although the reading programs do not need to be from CDE’s approved list, they must meet the scientifically or evidence-based criteria. If schools use one of the approved programs, then it automatically meets the criteria. If districts use their READ funds to purchase an instructional program, it must be on the CDE approved list.
• Early Literacy Grant (ELG) Recipients: Schools receiving this grant must include grant
specific information. This includes reflection and trends related to all three goals designated within the ELG as well as the Literacy Evaluation Tool.
• Turnaround Schools: Must include results from an early childhood needs assessment (if serving grades K-3). See resources here.
13
• ESSA identification: Schools identified under ESSA must include an analysis of data related to category of identification (see appendix for more information)
Schools should consider including the following
• Interim data that is aligned or not aligned with SPF indicator ratings • Qualitative and/or process data related to school climate and culture • Implementation data from prior year’s improvement efforts ( this may also be included
in the Prior Year Targets section)
So, what should schools include for the 20-21 UIP?
Schools should provide a summary of the data they considered for planning purposes moving into the 20-21 school year. This may include:
• Engagement data: What did student/family engagement look like after the switch to remote learning? What metric did your school use for engagement? What interventions did your school employ for families with low engagement? What was the result? How will you gauge engagement and/or attendance in the fall?
• ACCESS data: If your school serves ELLs; you may include ACCESS test results (keeping n-size guidelines in mind). How is your team using the ACCESS data to support ELLs this fall?
• Instructional data: What instructional gaps occurred due to the switch to online learning? Are there content areas that worked well/didn’t work as well in the switch to online learning?
• Formative data: What additional data was collected by teachers that is useful for the fall? • Interim data: What data did your school collect prior to the switch to online learning? What
does it tell you about where to focus your attention for the fall? • Staff/family survey data: How did your community cope with the transition to online learning,
and how will your school incorporate that into fall planning? • Historical data: Based on most recent state and interim data, what are/were the most
concerning outcomes?
Exemplars: What does a model example look like for this section? This section includes modified exemplars from CSI schools.
Two Rivers Community School: Current Performance In 2018, Two Rivers Community School received a rating of Improvement School on the CARS report. Our Preliminary 2019 School Performance Framework (SPF) shows a Performance rating with 64.7/100 possible points. This is up significantly from 2018's Improvement rating and score of 46.6/100. TRCS scored 67.9% for Academic Achievement and 62.5% for Academic Growth compared to 58.3% and 38.8% in 2018, respectively. When looking at enrollment over time, there are some important trends worthy of noting while considering the school's current performance. When the school opened in 2014, we had just 172 students enrolled. Since then, we have expanded our student population over time to 350 students and a complete remodel and expansion of our facility. While the growth has come with some challenges, our student population continues to look more and more like the demographics of our local community. In 2014, our Free or Reduced Lunch (FRL) population was just 11.6% while in 2018 it was up to 28.3%. The number of students we serve with IEPs has increased from
14
1.7% in 2014 to 9.7% in 2018. English Learners (EL) made up just 11.6% of students in 2014 and are now up to 17.6%. The increasing trends in each of these sub-populations reflect our commitment to serving a population representative of our community. This is notable as these sub-populations are often comprised of students who have a greater chance of being ''at-risk'' academically. Median Scale Scores (MSS) for grades 3, 4, and 5 in ELA were 742, 747, and 737 respectively, equating to an elementary ELA MSS of 742. This MSS is down slightly from 744 in 2018. Though these numbers show strength in achievement scores when compared to state and district performance figures, they continue a downward trend in performance at the elementary level that must be addressed. While the Median Scale Scores went down slightly, the elementary Median Growth Percentiles increased significantly. The ELA MGP in 4th-grade increased from 25 to 36 and 5th-grade increased from 21 to 45 when comparing 2018 to 2019. Neither 4th-grade or 5th-grade ELA MGP scores met our expectations, but they are a significant improvement nonetheless. MSS for grades 6, 7, and 8 in ELA were 753, 746, and 752 respectively, equating to a middle school ELA MSS of 751. This MSS is up significantly from 743 in 2018. This change is significant as it breaks a downward trend in middle school performance for ELA and indicates that improvement strategies are on the right track. When looking at growth, the results are also favorable. In grades 6, 7, and 8, the MGP scores for ELA were 53.5, 52, and 76, respectively. MSS for grades 3, 4, and 5 in math were 744, 731, and 736 respectively, equating to an elementary math MSS of 737. This MSS is up slightly from 734 in 2018. This change indicates that improvement strategies put in place for the 2018-2019 school year are having a positive impact on student achievement. Growth scores were mixed. In 5th-grade, the MGP for math increased from 22 in 2018 to 69 in 2019, while in 4th-grade, the MGP for math decreased from 36 to 34.5. While the 5th-grade improvements are excellent, we must continue our work to ensure all students are growing at appropriate levels. MSS for grades 6, 7, and 8 in math were 738, 732, and 741respectively, equating to a middle school math MSS of 737. This MSS is up from 731 in 2018. This change indicates that improvement strategies put in place for the 2018-2019 school year are having a positive impact on student achievement. Growth scores for middle school students were impressive, with each grade level demonstrating improved MGP scores when compared to 2018. Growth scores were 46, 60, and 55 for grades 6, 7, and 8, respectively. When looking at current performance for sub-populations, there was a notable improvement in every category for both ELA and math when comparing achievement scores from 2018 and 2019 CMAS data. Students eligible for Free/Reduced Lunch increased ELA achievement scores from 722 to 735 and math achievement scores from 723 to 726. Minority student scores improved from 732 to 741 in ELA and from 725 to 731 in math. Students with IEPs also saw improvement in both math and ELA, increasing from 705 to 714 in ELA and from 707 to 716 in math. English Learner scores increased from 749 to 751 in ELA and from 717 to 721 in math. Gifted students scores increased from 741 to 745 in ELA. There was not a high enough population tested to show a score in math. These results indicate that major improvement strategies from the 2018 school year have had a very favorable impact on our subgroup students' achievement scores for ELA and math. READ Data According to our results from the interim iReady Reading Diagnostic testing, in the fall of 2018, the number of students at risk for Tier 3 intervention was, 0% in kindergarten, 9% in grade 1, 23% in grade 2, and 26% in grade 3. By the spring of 2019, the number of students at-risk for Tier 3 intervention was, 0% in kindergarten, 2% in grade 1, 7% in grade 2, and 8% in grade 3. This decrease of the number of students at risk for Tier 3 intervention is significant and indicative of a strong reading program. In the fall of 2018, 29.5% of students in K-3 were identified as being at grade-level on the iReady reading diagnostic. By spring of 2019, that number increased to 77.3% based on the end-of-year reading diagnostic. In the fall of 2018, 11 students were identified as SRD and put on READ plans. In the spring of 2019, that number was up to 15. This increase in number is in
15
large part due to an error in the identification process of SRD students who also qualify for special education services and are on an IEP.
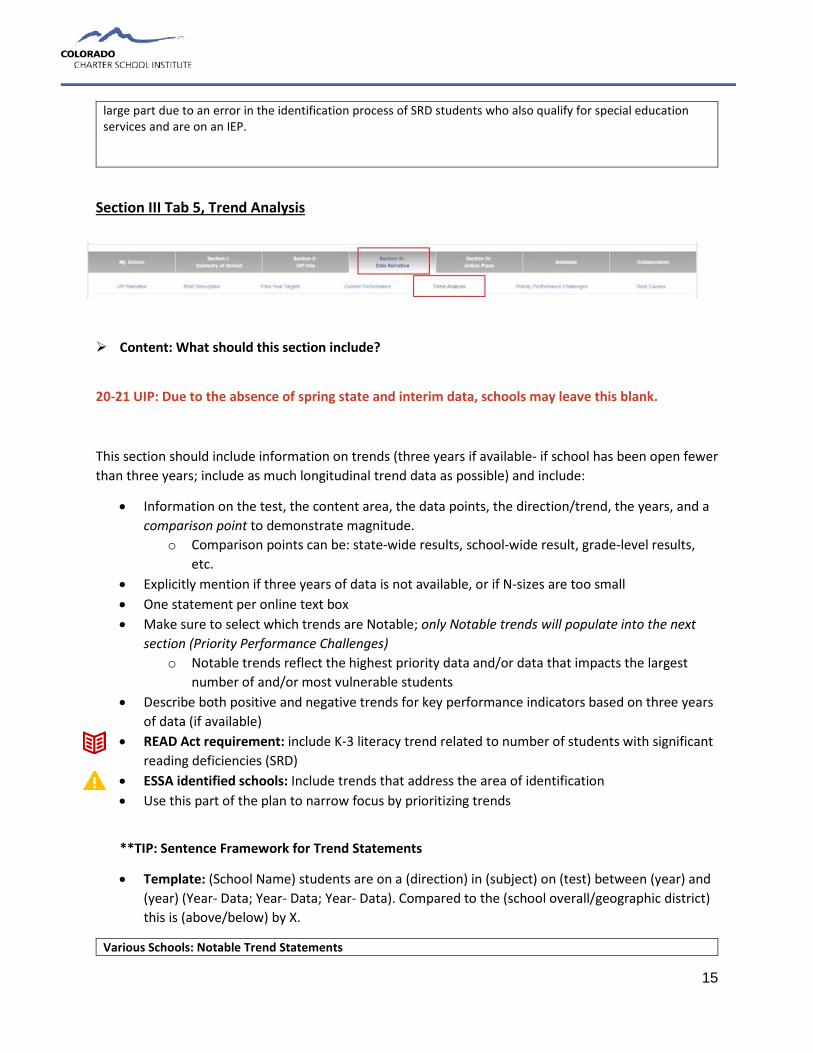
Section III Tab 5, Trend Analysis
Content: What should this section include?
20-21 UIP: Due to the absence of spring state and interim data, schools may leave this blank.
This section should include information on trends (three years if available- if school has been open fewer than three years; include as much longitudinal trend data as possible) and include:
• Information on the test, the content area, the data points, the direction/trend, the years, and a comparison point to demonstrate magnitude.
o Comparison points can be: state-wide results, school-wide result, grade-level results, etc.
• Explicitly mention if three years of data is not available, or if N-sizes are too small • One statement per online text box • Make sure to select which trends are Notable; only Notable trends will populate into the next
section (Priority Performance Challenges) o Notable trends reflect the highest priority data and/or data that impacts the largest
number of and/or most vulnerable students • Describe both positive and negative trends for key performance indicators based on three years
of data (if available) • READ Act requirement: include K-3 literacy trend related to number of students with significant
reading deficiencies (SRD) • ESSA identified schools: Include trends that address the area of identification • Use this part of the plan to narrow focus by prioritizing trends
**TIP: Sentence Framework for Trend Statements
• Template: (School Name) students are on a (direction) in (subject) on (test) between (year) and (year) (Year- Data; Year- Data; Year- Data). Compared to the (school overall/geographic district) this is (above/below) by X.
Various Schools: Notable Trend Statements
16
Montessori del Mundo students are on an increase in ELA on CMAS between 2017 and 2019 (2017 = Mean scale score 709, 2018 = Mean scale score 718, 2019 Mean scale score 717). The 2019 Mean scale score remains below the geographic district Mean scale score of 727. SCCS students with SRDs have been relatively stable as seen on the percent of students placed on READ plans between 2016 and 2018 (2016=8.1%, 2017=10.3%, 2018=10.1%). By the end of the year, percent of students on READ Plans between 2016-2018 (2016-2017= 5.3%, 2017-2018= 5.8% 2018-2019= 7.6%. This trend is notable as an indicator of success in early elementary reading programming, progress monitoring through STAR early literacy & DIBELS and intervention strategies through BURST. Gifted Students at CECFC consistently score lower on all measures (CMAS, PSAT, and SAT) than the geographical district. CECFC has also consistently has served fewer Gifted students (2017- 5.4%, 2018- 7.2%, 2019- 6.5%) compared to the geographical district which tends to be closer to 8%. This trend is notable because CECFC's early college model should provide a helpful system for GT students, but instead, this population appears to be consistently under-performing and potentially under-identified.
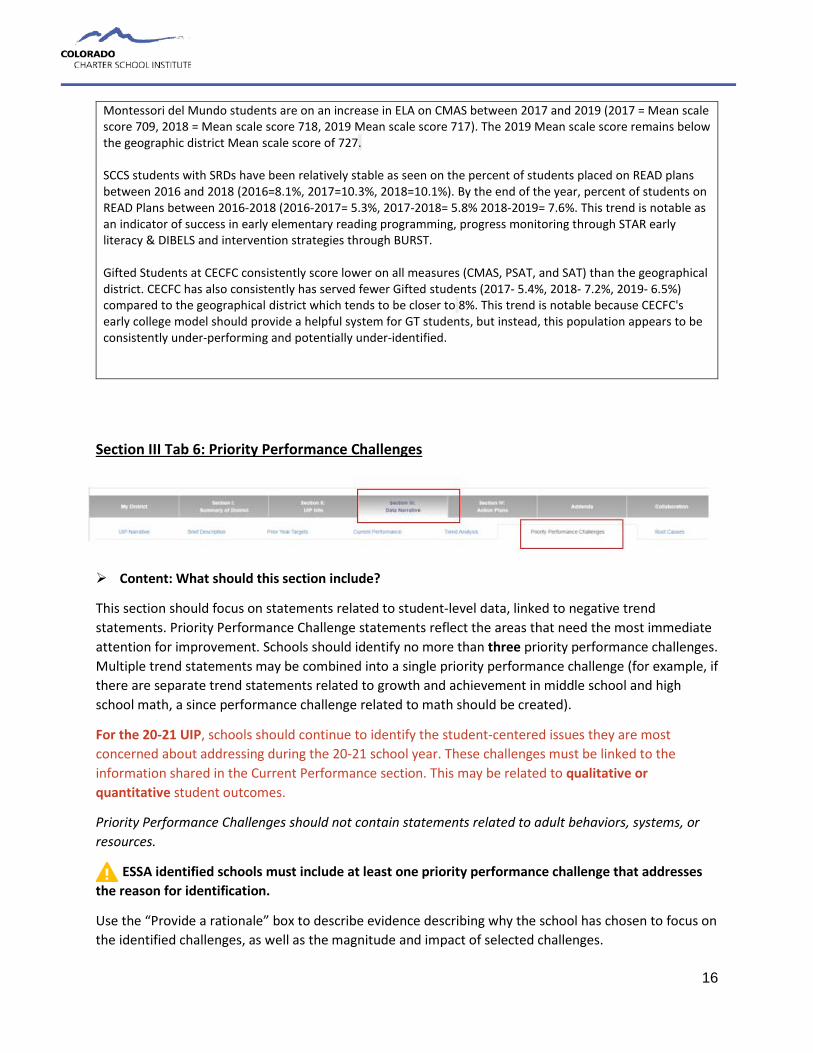
Section III Tab 6: Priority Performance Challenges
Content: What should this section include?
This section should focus on statements related to student-level data, linked to negative trend statements. Priority Performance Challenge statements reflect the areas that need the most immediate attention for improvement. Schools should identify no more than three priority performance challenges. Multiple trend statements may be combined into a single priority performance challenge (for example, if there are separate trend statements related to growth and achievement in middle school and high school math, a since performance challenge related to math should be created).
For the 20-21 UIP, schools should continue to identify the student-centered issues they are most concerned about addressing during the 20-21 school year. These challenges must be linked to the information shared in the Current Performance section. This may be related to qualitative or quantitative student outcomes.
Priority Performance Challenges should not contain statements related to adult behaviors, systems, or resources.
ESSA identified schools must include at least one priority performance challenge that addresses the reason for identification.
Use the “Provide a rationale” box to describe evidence describing why the school has chosen to focus on the identified challenges, as well as the magnitude and impact of selected challenges.
17
Exemplars: What does a model example look like for this section?
This section includes modified exemplars from CSI schools.
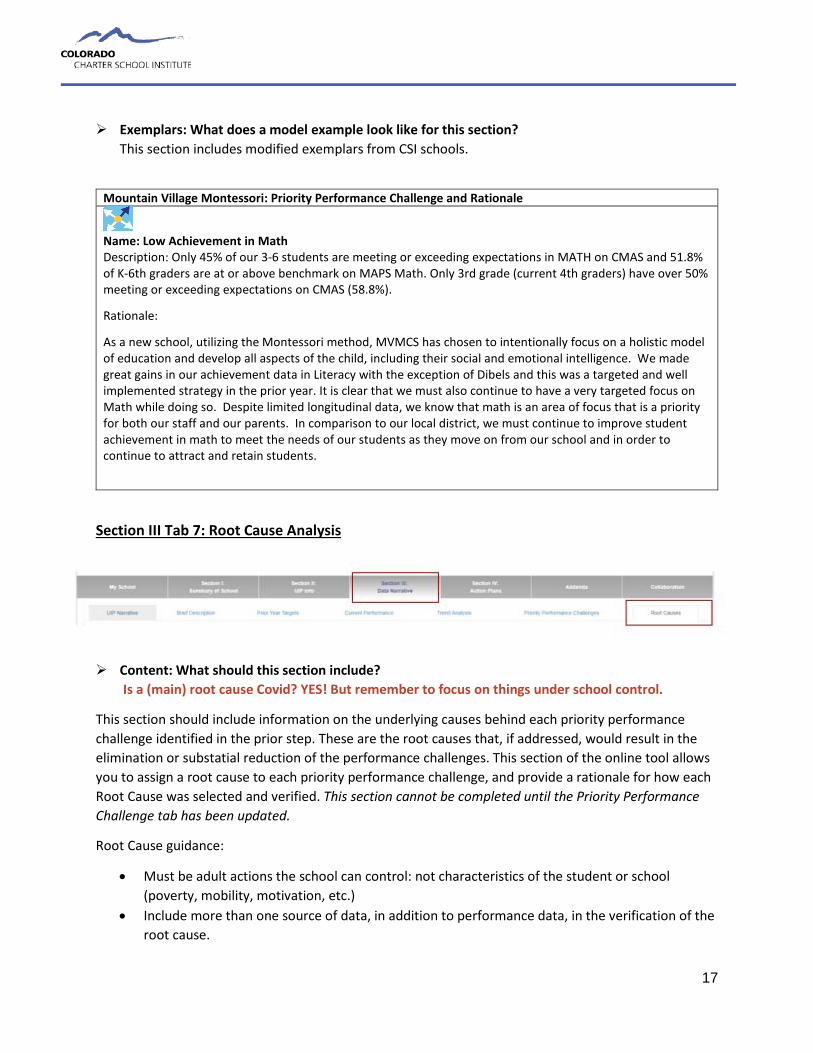
Mountain Village Montessori: Priority Performance Challenge and Rationale
Name: Low Achievement in Math Description: Only 45% of our 3-6 students are meeting or exceeding expectations in MATH on CMAS and 51.8% of K-6th graders are at or above benchmark on MAPS Math. Only 3rd grade (current 4th graders) have over 50% meeting or exceeding expectations on CMAS (58.8%).
Rationale:
As a new school, utilizing the Montessori method, MVMCS has chosen to intentionally focus on a holistic model of education and develop all aspects of the child, including their social and emotional intelligence. We made great gains in our achievement data in Literacy with the exception of Dibels and this was a targeted and well implemented strategy in the prior year. It is clear that we must also continue to have a very targeted focus on Math while doing so. Despite limited longitudinal data, we know that math is an area of focus that is a priority for both our staff and our parents. In comparison to our local district, we must continue to improve student achievement in math to meet the needs of our students as they move on from our school and in order to continue to attract and retain students.
Section III Tab 7: Root Cause Analysis
Content: What should this section include? Is a (main) root cause Covid? YES! But remember to focus on things under school control.
This section should include information on the underlying causes behind each priority performance challenge identified in the prior step. These are the root causes that, if addressed, would result in the elimination or substatial reduction of the performance challenges. This section of the online tool allows you to assign a root cause to each priority performance challenge, and provide a rationale for how each Root Cause was selected and verified. This section cannot be completed until the Priority Performance Challenge tab has been updated.
Root Cause guidance:
• Must be adult actions the school can control: not characteristics of the student or school (poverty, mobility, motivation, etc.)
• Include more than one source of data, in addition to performance data, in the verification of the root cause.
18
• Must be aligned with other plan elements including the current performance narrative and the priority performance challenges.
Common Pitfalls: What common issues can be avoided? • Avoid wording root causes as desired outcomes. For example, use “Implement evidence-based
reading instruction” rather than “Improve reading instruction”. • Overly simplistic issue identified; lack of a deep analysis of the underlying problem(s). • Including items out of the schools’ control. • Root causes written blaming staff; deeper analysis should be conducted to identify the systems
failure that led to staff members not meeting expectations.
Exemplars: What does a model example look like for this section? This section includes modified exemplars from CSI schools.
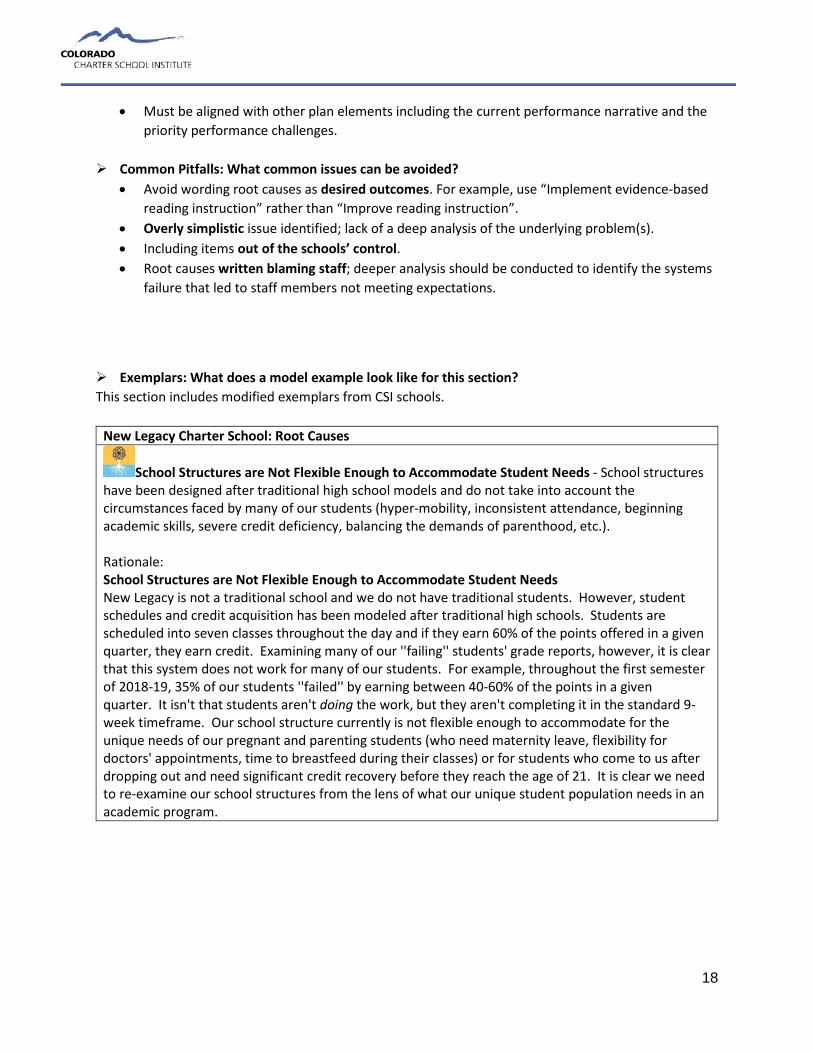
New Legacy Charter School: Root Causes
School Structures are Not Flexible Enough to Accommodate Student Needs - School structures have been designed after traditional high school models and do not take into account the circumstances faced by many of our students (hyper-mobility, inconsistent attendance, beginning academic skills, severe credit deficiency, balancing the demands of parenthood, etc.). Rationale: School Structures are Not Flexible Enough to Accommodate Student Needs New Legacy is not a traditional school and we do not have traditional students. However, student schedules and credit acquisition has been modeled after traditional high schools. Students are scheduled into seven classes throughout the day and if they earn 60% of the points offered in a given quarter, they earn credit. Examining many of our ''failing'' students' grade reports, however, it is clear that this system does not work for many of our students. For example, throughout the first semester of 2018-19, 35% of our students ''failed'' by earning between 40-60% of the points in a given quarter. It isn't that students aren't doing the work, but they aren't completing it in the standard 9-week timeframe. Our school structure currently is not flexible enough to accommodate for the unique needs of our pregnant and parenting students (who need maternity leave, flexibility for doctors' appointments, time to breastfeed during their classes) or for students who come to us after dropping out and need significant credit recovery before they reach the age of 21. It is clear we need to re-examine our school structures from the lens of what our unique student population needs in an academic program.
19
Section IV: Action Plans
Section IV Tab 1: Major Improvement Strategies
Content: What should this section include?
This section includes detailed information on your Major Improvement Strategies. This section of the online tool should be completely filled in. Using the Copy from Last Year button on the home page will case all Major Improvement Strategies from prior UIP(s) to be copied over. You must either delete or update each existing strategy, and add new ones as appropriate.
Clicking the Add Major Improvement Strategy will open a text box with 4 sections:
• Name: Clear description of the strategy (NOT the outcome) that will be implemented • Describe success: Key components of strategy and a description of what will be different about
programs or practices once the strategy is fully implemented (not a target for student outcomes)
• Research supporting strategy: CDE and ESSA require a research or evidence base for selected Major Improvement Strategies. Describe the research that the school used to guide the selection of each improvement strategy.
• Accountability Provisions: Select State Accreditation
Additional Considerations
• Be sure to associate at least one Root Cause with each Major Improvement Strategy • ESSA identified schools must clearly select a strategy that directly addresses the reason(s) for
ESSA identification • Turnaround schools must select at least one of the state-identified turnaround strategies (see
Appendix). • READ Act requirement: Schools serving K-3 must identify a Major Improvement Strategy which
addresses students with Significant Reading Deficiencies (SRD).
Common Pitfalls: What common issues can be avoided? • Written as a goal, not a strategy • Not clearly aligned to identified root cause • No evidence provided for why the strategy will postively impact the root cause identified
20
Exemplars: What does a model example look like for this section? This section includes modified exemplars from CSI schools.
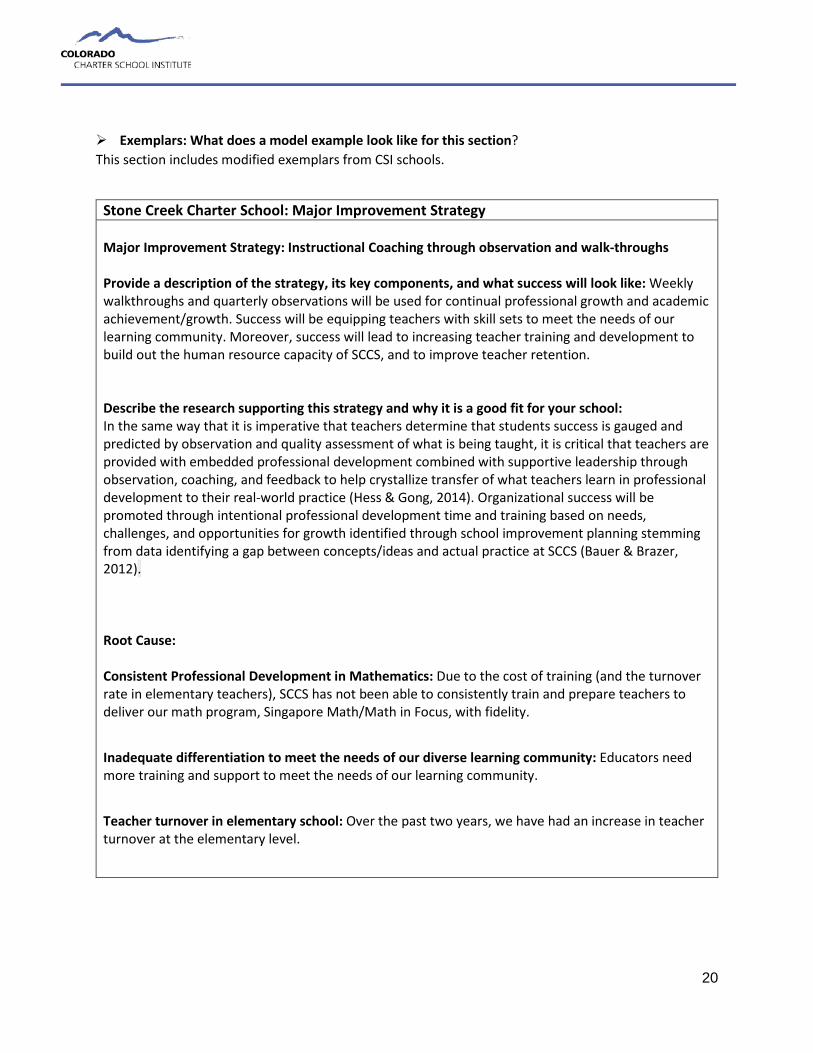
Stone Creek Charter School: Major Improvement Strategy Major Improvement Strategy: Instructional Coaching through observation and walk-throughs Provide a description of the strategy, its key components, and what success will look like: Weekly walkthroughs and quarterly observations will be used for continual professional growth and academic achievement/growth. Success will be equipping teachers with skill sets to meet the needs of our learning community. Moreover, success will lead to increasing teacher training and development to build out the human resource capacity of SCCS, and to improve teacher retention. Describe the research supporting this strategy and why it is a good fit for your school: In the same way that it is imperative that teachers determine that students success is gauged and predicted by observation and quality assessment of what is being taught, it is critical that teachers are provided with embedded professional development combined with supportive leadership through observation, coaching, and feedback to help crystallize transfer of what teachers learn in professional development to their real-world practice (Hess & Gong, 2014). Organizational success will be promoted through intentional professional development time and training based on needs, challenges, and opportunities for growth identified through school improvement planning stemming from data identifying a gap between concepts/ideas and actual practice at SCCS (Bauer & Brazer, 2012). Root Cause: Consistent Professional Development in Mathematics: Due to the cost of training (and the turnover rate in elementary teachers), SCCS has not been able to consistently train and prepare teachers to deliver our math program, Singapore Math/Math in Focus, with fidelity.
Inadequate differentiation to meet the needs of our diverse learning community: Educators need more training and support to meet the needs of our learning community.
Teacher turnover in elementary school: Over the past two years, we have had an increase in teacher turnover at the elementary level.
21
Section IV Tab 2: Planning Form (Action Steps and Implementation Benchmarks)
This section outlines how the schools will implement each Major Improvement Strategy (action steps) and how schools will know the improvement strategy is being implemented with fidelity (implementation benchmarks). Please note that in order to complete Implementation Benchmarks and action Steps for each Major Improvement Strategy, schools must click the “Next Major Improvement Strategy” button in the online tool.
20-21 UIP: This section may serve as your implementation plan for your return to school plan for 20-21. This may include as much detail as you like, but at a minimum should give a cohesive plan for each of the Major Improvement Strategies outlined on the prior tab.
Implementation Benchmarks Content: What should this section include?
Implementation benchmarks represent indicators that will allow schools to gauge whether improvement strategies are being implemented with fidelity. These will include shifts in adult behavior (changes in teaching practice, classroom management, etc.), systems, and policies.
Each Implementation Benchmark must include:
IB Name: Name your Implementation Benchmark –what behavior or system change does it address?
Description: What is the measurable benchmark for this behavior or systems change? Which staff members/systems will be exhibiting the change?
Start/End Date: Set a time from for the implementation benchmark to occur.
Frequency: How often will this benchmark be observed/measured?
Key Personnel: Who will be in charge of monitoring this implementation benchmark?
**Reminder- the adults in your building will have varying levels of capacity to implement new programs; consider creating differentiated Implementation Benchmarks.**
Exemplars: What does a model example look like for this section?
New Legacy Charter School: Implementation Benchmarks Improvement Strategy: Implement Advisory Model for Student Support IB Name: Family Contact
22
Description: All Advisors call or contact student families at least twice per quarter Start/End Date: 8/14/2019- 5/9-2020 Frequency: Quarterly Key Personnel: Advisors and Principal Crown Pointe Academy: Implementation Benchmarks Improvement Strategy: Professional Development with focus on progress monitoring and differentiation IB Name: Classroom Observations Description: Classroom observations will show intentional differentiated instruction in at least 50% of classes during the fall and 100% of classes by the end of the year. Start/End Date: 8/13/2019- 5/20/2020 Frequency: Monthly Key Personnel: Administration
Action Steps Content: What should this section include?
The UIP is a planning document that spans two years. Action steps should outline what must occur to fully implement a Major Improvement Strategy over a two (or more) year span. This section differs from the Implementation Benchmarks in that it represents a checklist of to-dos rather than changes in adult behavior. Additional Requirements
• The UIP serves as each school’s comprehensive needs assessment for the distribution of Title funds via the consolidated application. The Activities submitted in each school’s title budget MUST also appear in and align with the school’s UIP. (See appendix for brief overview of allowable uses for Title funds).
• To fulfill ESSA requirements, school should include at least one action step for one (ideally all) Major improvement Strategy that details how the school/family community will be engaged in the strategy. See exemplars below for an example of a family engagement action step.
• READ Act: Include Action Steps that address K-3 students identified as having significant reading deficiencies.
Each Action Step must include the following information:
Name: Name your action step
Description: What does this action step entail? If this is an action step funded by Title, this should match the “Description of Activity” submitted in Title budget.
Start/End Date: Timeline for completion
Resources: This is the funding source used for this action step. This may be Title funds, grant funds (specify grant), or General Funds.
Key Personnel: Who is in charge of ensuring this action step is completed?
23
Exemplars: What does a model example look like for this section? Crown Pointe Academy: Action Step Major Improvement Strategy: Restructure Math Groups Action Step Name: Parent Engagement Activity to Support Mathematics Description: CPA will host a parent engagement night in late winter/early spring of 2020 that will focus specifically on mathematics. This will provide us the opportunity to "train" parents on our curriculum so they can help their children at home. Title funds will be used to provide activities and take home items for attendees Start/End Date: 1/13/2020-3/20/2020 Resources: Title I Parent Budget for Parent Engagement. $644.00 will be dedicated to elementary students and $317.00 will be dedicated for middle school students. Key Personnel: Elementary teachers, middle school math teachers, administration
Section IV Tab 3: Full Plan
NO ACTION REQUIRED: This is simply a sortable summary of the Action Plan.
Section IV Tab 4: Target Setting
Content: What should this section include?
Schools must set at least one target (associated with an indicator included on the School Performance Framework) associated with each priority performance challenge. Targets must be set for two years. In addition, schools must set associated interim measures for multiple times within a year that will help measure progress towards attainment of the annual target.
During the 20-21 school year, this may include setting non-traditional targets, including targets around engagement, student/staff health and wellbeing, and interim/formative assessment targets. Please note, all targets must still be associated with a Priority Performance Challenge.
Additional Requirements
READ Act: Schools serving K-3 students must set a target for either reducing the number of students with significant reading deficiencies or for increasing the number of students reading on grade level by grade 3.
24
ESSA Identification: Schools identified under ESSA (CS/TS) must set a target for the indicator that caused identification (for example, if a school was identified for low achievement/growth for FRL students, set a target for the FRL sub-group).
Exemplars: What does a model example look like for this section?
Crown Pointe Academy: Target Setting Priority Performance Challenge: High Achieving and Gifted and Talented Students Declining in Math Performance Indicator Academic Achievement (Status) Measures/Metrics M Annual Performance Target 2019-2020 100% of students identified as gifted and talented
in math will meet expectations on the 2019 CMAS math assessment, and at least 50% of students identified as gifted and talented in math with exceed expectations on the 2019 CMAS math assessment.
Annual Performance Target 2020-2021 100% of students identified as gifted and talented in math will meet expectations on the 2020 CMAS math assessment, and at least 75% of students identified as gifted and talented in math with exceed expectations on the 2020 CMAS math assessment.
Interim Measures for 2019-2020 Galileo math assessments; classroom assessments. On the MOY Galileo assessments, at least 90% of students identified as GT in math will meet expectations.
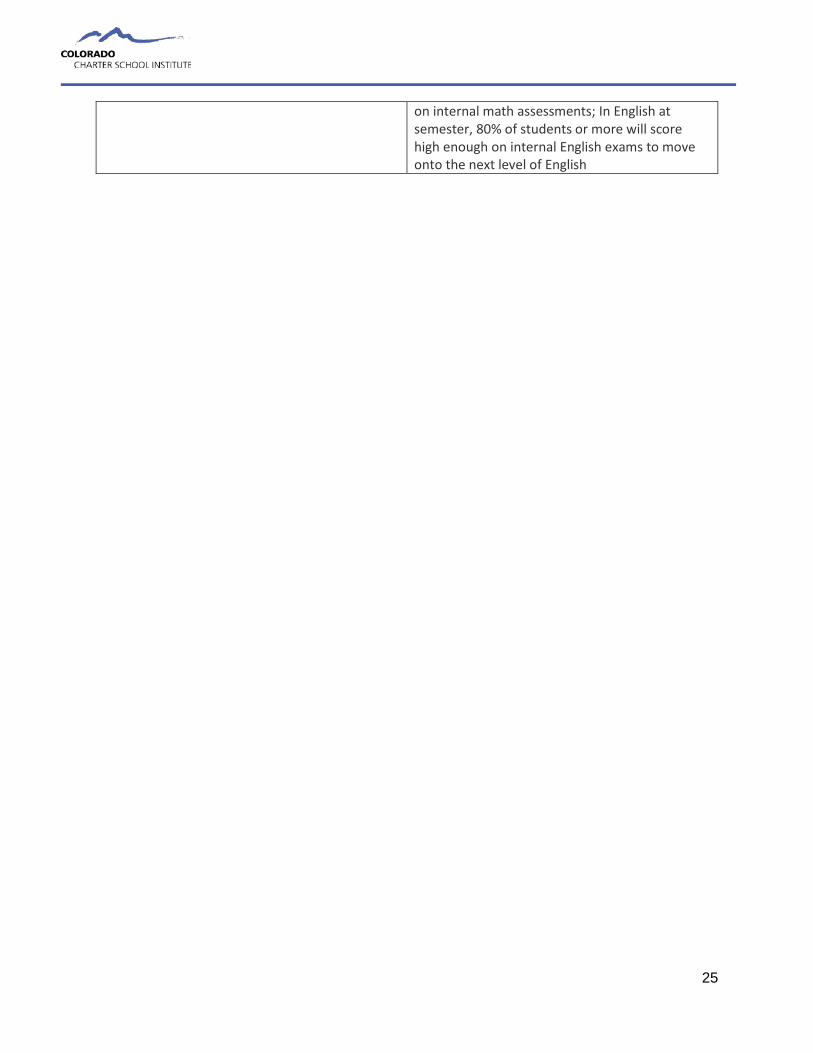
Colorado Early Colleges Fort Collins: Target Setting Priority Performance Challenge: Lower SAT and PSAT Achievement and growth for sub-populations Performance Indicator Disaggregated Achievement Measures/Metrics M and RW Annual Performance Target 2019-2020 Less than 15% of high school students will fall
into the "Strengthen Skill" category in both the Reading and Writing and the Math PSAT and SAT tests.
Annual Performance Target 2020-2021 Less than 10% of high school students will fall into the "Strengthen Skill" category in both the Reading and Writing and the Math PSAT and SAT tests.
Interim Measures for 2019-2020 In math at semester, 90% of students in college prep level math courses will score a 75% or above
25
on internal math assessments; In English at semester, 80% of students or more will score high enough on internal English exams to move onto the next level of English
26
Appendix
Background The Colorado Achievement Plan for Kids (S.B. 08-212) established the primary purpose of improvement planning as aligning efforts to ensure all students exit the K-12 education system ready for postsecondary education, and/or to be successful in the workforce, earning a living wage immediately upon graduation. Furthermore, the federal Elementary and Secondary Education Act (ESEA) – including Titles IA, IIA and III – requires improvement planning to focus on ensuring that all students in the state reach proficiency in English language arts/reading and mathematics. All schools/districts must use a common online format to document and publicly report their improvement efforts. Each year, schools and districts are required to consider newly available state and local performance data to write, rewrite, or update a two-year UIP (one that spans the current and subsequent school year), and submit their plan to the state. In 2016, the Colorado legislature expanded flexibility around biennial (every other year) submission of the Unified Improvement Plan (UIP) through HB 16-1440. This flexibility is now available to all schools with a Performance plan type assignment.
UIP and Authorization During a renewal year, schools may choose to submit their UIP to satisfy the Academic Narrative requirement of the charter renewal application. In addition to satisfying the Academic Narrative requirement, a school’s Major Improvement Strategies will be used to inform the CSI site visit associated with charter renewal. Schools may also be asked to present their UIP and progress made towards UIP goals to the CSI Performance Management Committee during the charter renewal process.
School Accountability Committee (SAC) and the UIP Per state law (see CRS 22-11-402), schools are required to involve the SAC in the creation of the UIP. Specifically, the SAC must “advise” the school leader(s) on the creation and contents of the UIP. Additionally, the SAC must monitor the implementation of the UIP over the course of the school year.
ESSA and the UIP Under ESSA, all schools are required to perform a comprehensive needs assessment as part of their Consolidated Grant Application for Title funds. The UIP may be used to satisfy this requirement. Schools must align their Action Plan with their Consolidated Application (see Section IX for more information).
In addition to aligning the Action Plan, schools must indicate how they involved stakeholders (in addition to the SAC) in the creation of the UIP. ESSA requires the involvement of the following stakeholders in the development of a comprehensive needs assessment:
“teachers, principals, other school leaders, paraprofessionals, specialized instructional support personnel, charter school leaders, parents, community partners, and other organizations or partners”
27
§§ 1003a(d)(4), 1112(a)(1)(A), 1112(a)(5), 1114(b)(6), 1115(a), 2102(b)(3), 2102(b)(2)(D), 3116(b)(4)(A), 3116(b)(4)(c), 4106(c), 8306(a)(7
Targeted Support and Comprehensive Support schools Per ESSA requirements, CSI must monitor and evaluate the impact of the improvement plans CSI and TS schools. As such, CSI staff will perform a quarterly review of the Action Plan component of each CS/TS school’s UIP. CSI staff will work with school leaders to verify that the Action Steps identified in the UIP have been completed by their target date, and will request verification that Implementation Benchmarks have been met. If necessary, CSI staff will provide technical support in order to adjust improvement plans that are falling short of planned benchmarks.
Additionally, any funds received by schools as a result of CS/TS status must be allocated in the Resource column of the school’s Action Plan.
Performance Concern Schools that see decline in student outcomes year to year may be asked to attend a CSI Board of Directors meeting in order to discuss academic performance. School leaders and school board members will be asked to discuss current levels of performance at their school and the strategies that have been implemented to improve student outcomes. These discussions will be based in the school’s most recent Unified Improvement Plan.
Priority Improvement and Turnaround For schools with a Priority Improvement or Turnaround (PI or T) rating, there are unique requirements in addition to the UIP requirements for all schools. These include:
• Schools with a PI or T rating must provide written notice to families of the school within 30 days of receiving the initial plan type assignment. This must include:
o Type of plan required o Performance results that led to the plan assignment o Timeline for developing and adopting the required improvement plan o Data, time, and location of the public meeting of the School Accountability Committee
(SAC) to draft the plan o Date, time, and location of the public hearing held by the school board to review the
plan prior to adoption (this must be at least 30 days after the date on which the school provides written notice of hearing).
• Turnaround schools must selecting a state required strategy, and incorporating this strategy into the improvement plan.
• Schools with a PI or T rating will receive additional UIP review from the CDE State Review Panel. This may include required feedback that must be addressed prior to public posting.
Accreditation contract requirements In the event that the School is in the accreditation category of either Accredited with Priority Improvement Plan or Accredited with Turnaround Plan in subsequent academic school years, the Institute staff may take one or more of the following actions:
28
• Institute Executive Director meeting with the School's board and leadership for the purpose of discussing continued low performance;
• Requiring the dissemination of parent letters and/or public hearings on the topic of the School's performance;
• Requiring the setting of annual additional performance targets by subgroup; • Requiring the use of interim assessment analysis and monitoring; • Requiring a third-party, subject to approval by CSI, to review and assist with the School's
Unified Improvement Plan; • Requiring targeted School board training and development; and
• Taking additional actions, to be determined under the circumstances of a particular situation.