Embed Size (px)
Citation preview
UNIFORM SAMPLING PROTOCOLS FOR SINGLE- AND DOUBLE-COMPRESSED
HAY AND DETECTION OF A GMO TRAIT
Daniel H. Putnam, Christopher DeBen, Vonny Barlow, Jamshaid Ahmed,
Murad Ali Khan, and Steve Orloff1
ABSTRACT
Forage quality has large economic influences on the price of alfalfa hay as well as animal
performance. Although visual inspection for weeds, mold, and texture remain important to judge
quality, laboratory analysis is a critical component of quality prediction. Thus, there is a need
for uniform and standardized sampling protocols for testing for forage quality. Long-distance
transport, use of large bales, increased import-exports, and introduction of Genetically-
Engineered (GE) crops have provided increased emphasis on sampling and testing, especially for
highly-compressed bales. Experiments were conducted to examine the ability to test highly
compressed bales, and to measure the differences between pre- and post- compression hay. We
found little to no differences between pre- and post-compression tests at three commercial hay
press facilities in the US. However, individual probe-to-probe differences were large, similar to
the differences observed in non-compressed bales, emphasizing the need for multiple composite
samples. Principles for standardized sampling include 1) Proper identification of hay lots, 2)
Random method of bale sampling, 3) selection of a proper coring device, 4) Correct sampling
procedure, 5) Taking sufficient numbers of cores for a composited cored hay sample, and 6)
correct handling of samples before analysis. Sampling for a low level presence (LLP) of a GE
trait distributed throughout the crop mass requires methods that utilize similar principles as for
quality sampling, but with additional samples required, depending upon desired level of
detection. Practitioners should consider the large effect of sampling on both hay quality
determination as well as detection of LLP in hay masses.
INTRODUCTION
Hay sampling principles have been worked out over decades of experience by university
scientists and industry members. The objective has been to obtain a representative sample for
lab analysis (e.g. ADF, NDF, CP, NDFD) to estimate feeding value and economic worth. The
concept is that the sample must fairly represent the average quality of the hay mass. The
principles of proper sampling have been promoted by representative hay groups, National Forage
Testing Association (NFTA, National Alfalfa and Forage Alliance, National Hay Association
and American Forage and Grasslands Council, as well as state hay groups, and a ‘certification of
methods’ protocol is available on-line (see www.foragetesting.org. and http://alfalfa.ucdavis.edu,
and Putnam, 2002). Sampling must represent the variation in leaf, stem, weeds, as well field
variation due to soil and environmental effects. Proper sampling technique is generally the most
important determinant of accuracy and repeatability of hay quality tests.
1 D. H. Putnam ([email protected]), Forage Specialist, Department of Plant Sciences, MS#1, University of California, One
Shields Ave., Davis, CA 95616. Chris DeBen ([email protected] ) is an SRA at UC Davis, and Steve Orloff:
[email protected]; Vonny Barlow ([email protected]) are UCCE Farm Advisors. Jamshaid Ahmad and Murad Ali Khan
were visiting scientists from Pakistan. In: Proceedings, 2015 Western Alfalfa and Forage Symposium, Reno, NV, 2-4 December,
2015. UC Cooperative Extension, Plant Sciences Department, University of California, Davis, CA 95616. (See
http://alfalfa.ucdavis.edu for this and other Alfalfa Symposium Proceedings.)
Long-distance transport, use of large bales, increased import-export activity, and introduction of
genetically-engineered (GE) crops have provided new challenges to hay testing, especially for
highly-compressed bales. There have been a series of questions about the reliability of
compressed vs. non-compressed hay sampling methods. Further, sampling for detection of a GE
trait may require different considerations. In this paper, we report on a study of sampling of
double compressed hay bales, and we discuss the implications for sampling for forage quality as
well as sampling for Low Level Presence (LLP) of a genetically modified trait.
SAMPLING DOUBLE-COMPRESSED BALES
In the past 10 years, international trade in alfalfa and grass hays has become commonplace on
the west coast of the US, with exports exceeding 11% of production of alfalfa hay and over 30%
of grass hays in the 7 western US states (N. Gombos, 2011; Putnam et al., 2015). Long distance
trade in other regions (e.g. EU, Middle East, Australia, Argentina, and China) is also becoming
more common. Long-distance sales of hay within countries have increased, with buyers often
purchasing based upon test alone.
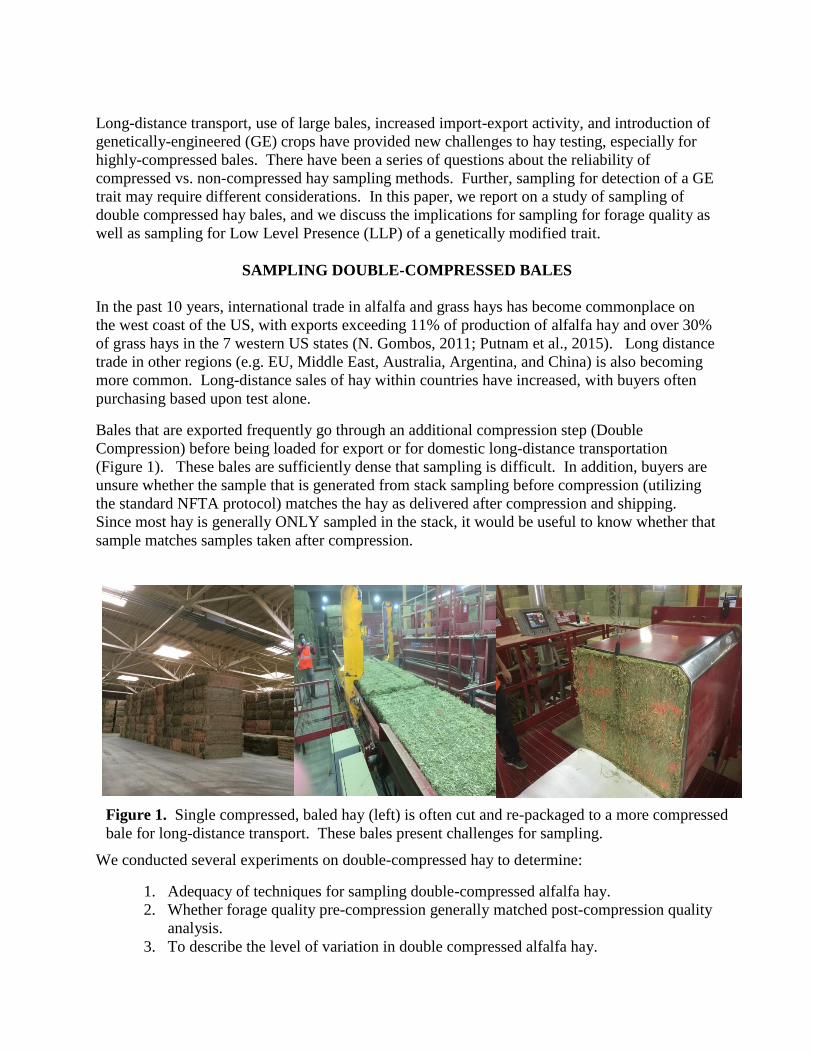
Bales that are exported frequently go through an additional compression step (Double
Compression) before being loaded for export or for domestic long-distance transportation
(Figure 1). These bales are sufficiently dense that sampling is difficult. In addition, buyers are
unsure whether the sample that is generated from stack sampling before compression (utilizing
the standard NFTA protocol) matches the hay as delivered after compression and shipping.
Since most hay is generally ONLY sampled in the stack, it would be useful to know whether that
sample matches samples taken after compression.
We conducted several experiments on double-compressed hay to determine:
1. Adequacy of techniques for sampling double-compressed alfalfa hay.
2. Whether forage quality pre-compression generally matched post-compression quality
analysis.
3. To describe the level of variation in double compressed alfalfa hay.
Figure 1. Single compressed, baled hay (left) is often cut and re-packaged to a more compressed
bale for long-distance transport. These bales present challenges for sampling.
Hay was sampled at each of three locations: HayDay Farms in Blythe, CA, and ACX and
Anderson Hay located in Long Beach, CA. The authors are grateful for the cooperation of these
businesses in assisting in this project. Two alfalfa lots per compression unit (high quality and
medium quality) were chosen. Two large bales (approximately 3500 lbs. total) were used as
starting material as the sample from each of these lots to minimize the range of variation for the
before vs. after compression comparison. Hay probes tested at ACX and Anderson Hay were
Star Quality drill-driven hay sampler with 16” stainless steel probe, and two push-type probes
(long probe with a length of 18” and short probe at approx. 12-14”).
In each trial, 20 individual cores plus 1 additional composite sample made up of 20 cores
combined were taken from the high and medium quality lots both before and after compression.
A composite of 10 cores were used to compare forage quality between the push-driven and drill-
driven hay samplers. Samples were then ground in a Cyclotec grinding machine with a 1.0 mm
screen, and analyzed using NIRS for crude protein, Acid Detergent Fiber (ADF), Neutral
Detergent Fiber (NDF), Digestible NDF at 30 hrs. (dNDF30), Relative Feed Value (RFV) and
Total Digestible Nutrients (TDN).
RESULTS OF COMPRESSED BALE TESTS
One of the key questions in this set of trials was to compare pre- with post-compression forage
quality results. Forage quality results were obtained from two different quality lots before and
after compression at three locations in California. These represent a large number of samples –
20 samples (10 in each of 2 bales) taken before compression and 20 samples taken after
compression at each of three locations, with two types of bales (high and medium quality) at
each location. Bales were marked carefully so that we sampled the same bales that were
sampled previously (before and after compression).
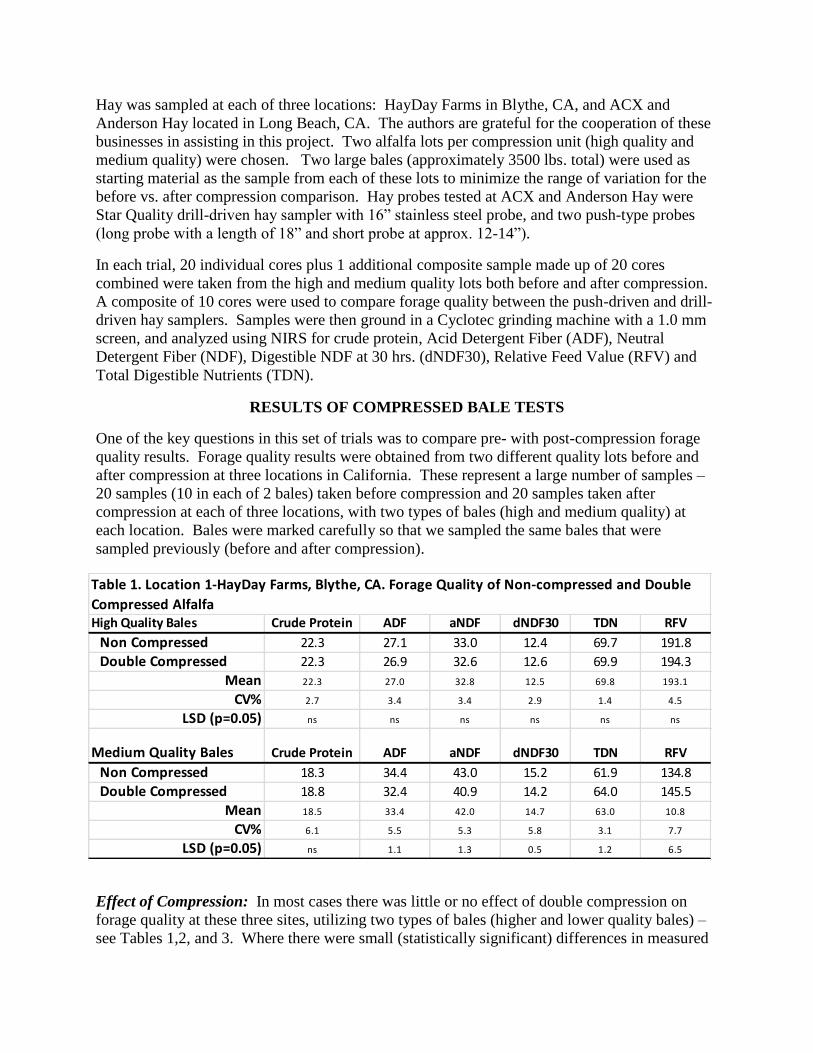
Effect of Compression: In most cases there was little or no effect of double compression on
forage quality at these three sites, utilizing two types of bales (higher and lower quality bales) –
see Tables 1,2, and 3. Where there were small (statistically significant) differences in measured
High Quality Bales Crude Protein ADF aNDF dNDF30 TDN RFV
Non Compressed 22.3 27.1 33.0 12.4 69.7 191.8
Double Compressed 22.3 26.9 32.6 12.6 69.9 194.3
Mean 22.3 27.0 32.8 12.5 69.8 193.1
CV% 2.7 3.4 3.4 2.9 1.4 4.5
LSD (p=0.05) ns ns ns ns ns ns
Medium Quality Bales Crude Protein ADF aNDF dNDF30 TDN RFV
Non Compressed 18.3 34.4 43.0 15.2 61.9 134.8
Double Compressed 18.8 32.4 40.9 14.2 64.0 145.5
Mean 18.5 33.4 42.0 14.7 63.0 10.8
CV% 6.1 5.5 5.3 5.8 3.1 7.7
LSD (p=0.05) ns 1.1 1.3 0.5 1.2 6.5
Table 1. Location 1-HayDay Farms, Blythe, CA. Forage Quality of Non-compressed and Double
Compressed Alfalfa
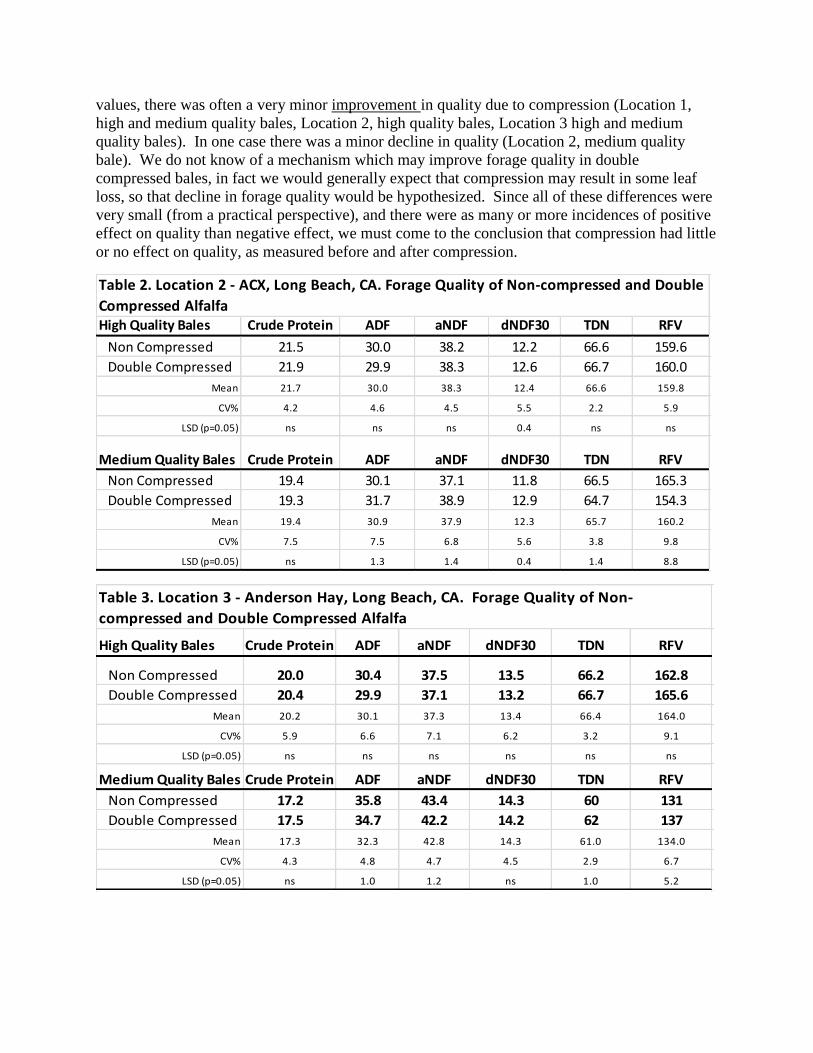
values, there was often a very minor improvement in quality due to compression (Location 1,
high and medium quality bales, Location 2, high quality bales, Location 3 high and medium
quality bales). In one case there was a minor decline in quality (Location 2, medium quality
bale). We do not know of a mechanism which may improve forage quality in double
compressed bales, in fact we would generally expect that compression may result in some leaf
loss, so that decline in forage quality would be hypothesized. Since all of these differences were
very small (from a practical perspective), and there were as many or more incidences of positive
effect on quality than negative effect, we must come to the conclusion that compression had little
or no effect on quality, as measured before and after compression.
High Quality Bales Crude Protein ADF aNDF dNDF30 TDN RFV
Non Compressed 21.5 30.0 38.2 12.2 66.6 159.6
Double Compressed 21.9 29.9 38.3 12.6 66.7 160.0
Mean 21.7 30.0 38.3 12.4 66.6 159.8
CV% 4.2 4.6 4.5 5.5 2.2 5.9
LSD (p=0.05) ns ns ns 0.4 ns ns
Medium Quality Bales Crude Protein ADF aNDF dNDF30 TDN RFV
Non Compressed 19.4 30.1 37.1 11.8 66.5 165.3
Double Compressed 19.3 31.7 38.9 12.9 64.7 154.3
Mean 19.4 30.9 37.9 12.3 65.7 160.2
CV% 7.5 7.5 6.8 5.6 3.8 9.8
LSD (p=0.05) ns 1.3 1.4 0.4 1.4 8.8
Table 2. Location 2 - ACX, Long Beach, CA. Forage Quality of Non-compressed and Double
Compressed Alfalfa
High Quality Bales Crude Protein ADF aNDF dNDF30 TDN RFV
Non Compressed 20.0 30.4 37.5 13.5 66.2 162.8
Double Compressed 20.4 29.9 37.1 13.2 66.7 165.6
Mean 20.2 30.1 37.3 13.4 66.4 164.0
CV% 5.9 6.6 7.1 6.2 3.2 9.1
LSD (p=0.05) ns ns ns ns ns ns
Medium Quality Bales Crude Protein ADF aNDF dNDF30 TDN RFV
Non Compressed 17.2 35.8 43.4 14.3 60 131
Double Compressed 17.5 34.7 42.2 14.2 62 137
Mean 17.3 32.3 42.8 14.3 61.0 134.0
CV% 4.3 4.8 4.7 4.5 2.9 6.7
LSD (p=0.05) ns 1.0 1.2 ns 1.0 5.2
Table 3. Location 3 - Anderson Hay, Long Beach, CA. Forage Quality of Non-
compressed and Double Compressed Alfalfa
In the types of compression processes in these plants, utilizing these methods, tests obtained
before compression should adequately predict forage quality results after double compression
process.
Caveats and discussion. A few caveats should be added here. These compression methods were
different from each other in that different equipment was used—they were different machines—
but generally were similar in their handling and processing of the bales. Each one of these
machines resulted in wrapped ‘large’ bales. In these cases, it appears as if minimal disruption in
the leaf-stem ratio occurred. One would normally expect that if double compression occurred,
that some leaf loss would lead to reductions in quality due to the loosening, cutting, and re-
cutting and packaging that occurred. However, this did not occur, at least the data does not
reflect that. To the contrary, if there was a trend, sometimes it was towards an improvement in
quality. Since these differences were so minor, these slight trends appear to be simply random
trends, we come to the conclusion that the effects of compression were negligible.
However, in some systems, compression steps may involve additional chopping or mixing steps
(for example to blend different forages), or repackaging methods which have additional impacts
on leaf-stem ratio. In those cases, we would expect that pre-testing would not reflect the forage
quality of post-compression steps and that sampling the compressed hay after compression
would be warranted.
An additional caveat is the difference between the effects of compression and the (more random)
effects of sampling large lots. In this experiment, we deliberately chose a limited number of
bales (2 bales for each quality category, high and medium). This was done to isolate the effects
of compression, vs other sources of random variation which reduced the need of comparing large
number of non-compressed bales to an equally large number of compressed bales.. Before
compression and after compression samples may differ to a greater degree in that case simply
due to the random sources of variation sampling large lots.
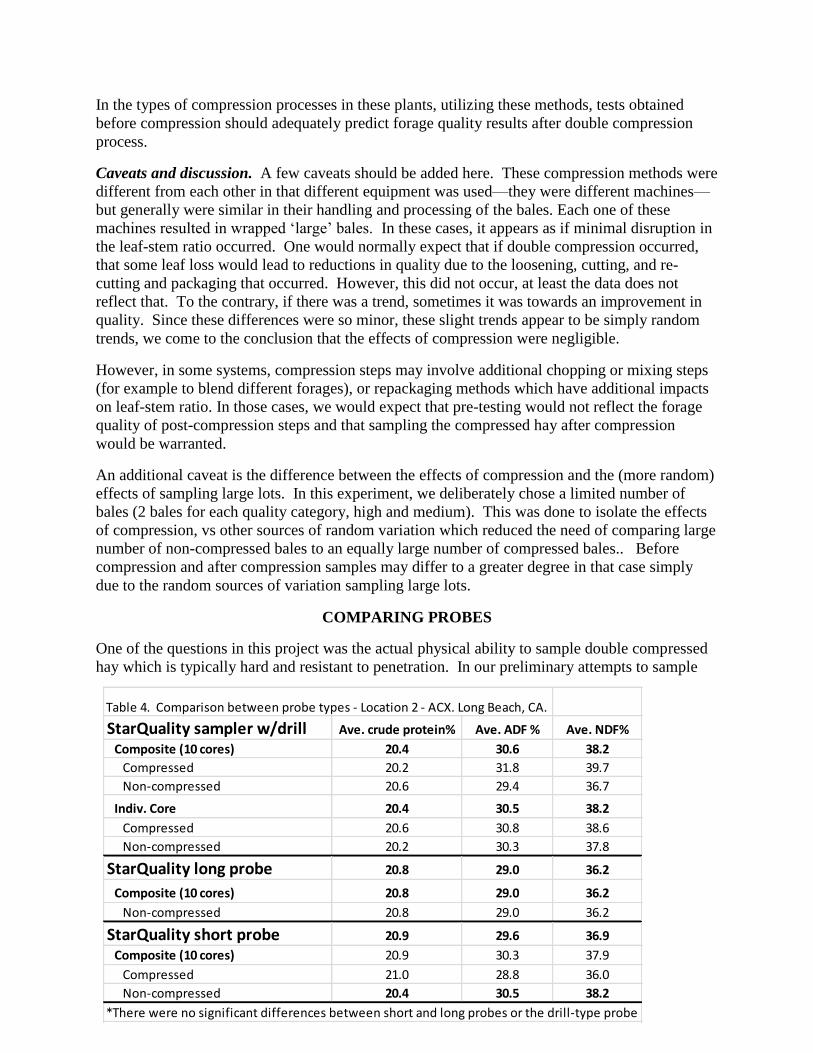
COMPARING PROBES
One of the questions in this project was the actual physical ability to sample double compressed
hay which is typically hard and resistant to penetration. In our preliminary attempts to sample
Table 4. Comparison between probe types - Location 2 - ACX. Long Beach, CA.
StarQuality sampler w/drill Ave. crude protein% Ave. ADF % Ave. NDF%
Composite (10 cores) 20.4 30.6 38.2
Compressed 20.2 31.8 39.7
Non-compressed 20.6 29.4 36.7
Indiv. Core 20.4 30.5 38.2
Compressed 20.6 30.8 38.6
Non-compressed 20.2 30.3 37.8
StarQuality long probe 20.8 29.0 36.2
Composite (10 cores) 20.8 29.0 36.2
Non-compressed 20.8 29.0 36.2
StarQuality short probe 20.9 29.6 36.9
Composite (10 cores) 20.9 30.3 37.9
Compressed 21.0 28.8 36.0
Non-compressed 20.4 30.5 38.2
*There were no significant differences between short and long probes or the drill-type probe
double compressed hay, several types of probes did not work, and so we selected several probes
of the 10 commercially available . The ‘Penn State’ probe heated quickly and became quickly
ineffective. The ‘Colorado’ slanted-tip probe effectively penetrated the double compressed
bales, but has the disadvantage of a slanted tip which may result in a non-representative leaf-
stem ratio.
At all three locations we tested the power-driven spiral assist type of probe (Star Quality
samplers). This proved to be effective in penetrating both non-compressed and compressed
bales. If a power-assist type of probe is used, we highly recommend a gas-powered type of drill,
which has considerably more torque than electric-type drills.
At two locations we compared a short-probe and a long probe with the drill-type spiral assist
probe. The long probe was unable to penetrate the double compressed bales. The short type of
probe (12-14”) was able to penetrate the double compressed bales as was the drill-type probe.
We found no significant differences between probe-types in the forage quality results at the two
locations (Table 4 and 5). This suggests that probe selection may be a purely practical issue – as
to which probes are most effective at penetrating bales and correctly representing the leaf-stem
ratio. It is possible that other ‘long’ probes could work to adequately penetrate large compacted
bales, but this may depend upon the sharpness of the tip and other design features.
CHARACTERIZING VARIATION IN HAY LOTS
One of the key issues is to try to understand the level of variation that occurs in hay lots.
Variation comes from several sources. First, the leaf-stem ratio within individual cores is an
important source of variation, since leaves and stems are very different in quality. Secondly,
there is usually bale-to-bale variation which may reflect across-field variation in soil, irrigation,
etc. Thirdly, the random distribution of weeds creates variation in quality across and within
bales.
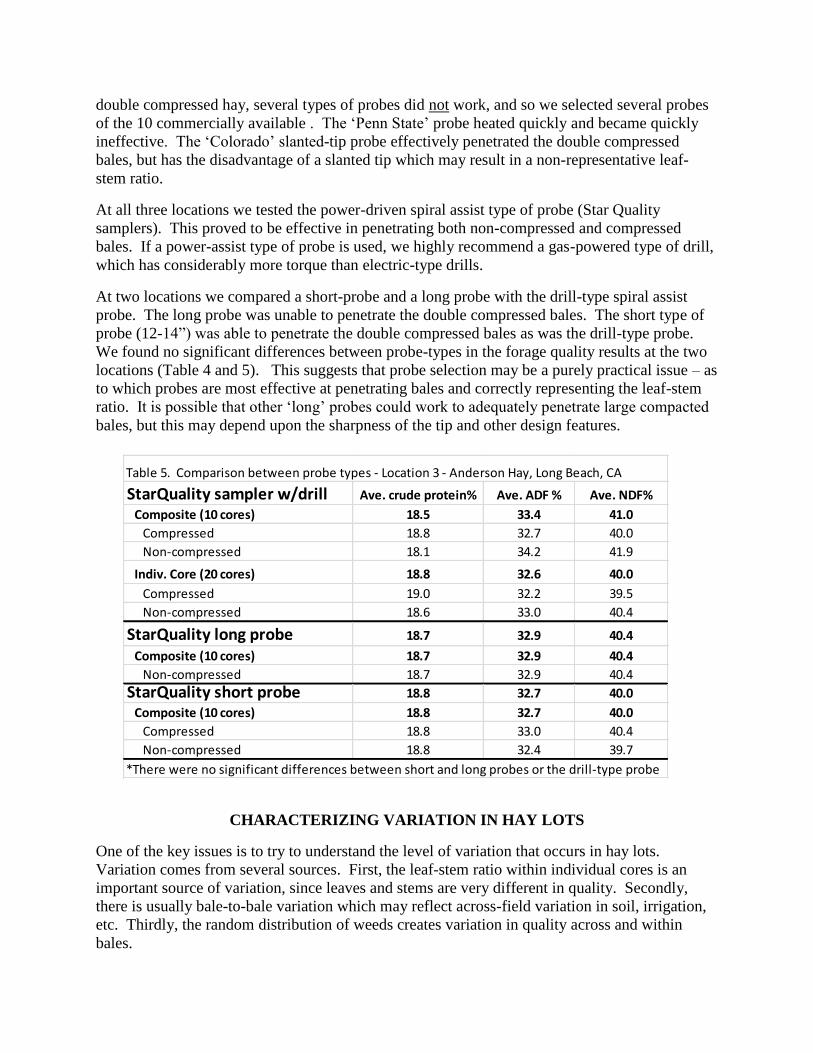
Table 5. Comparison between probe types - Location 3 - Anderson Hay, Long Beach, CA
StarQuality sampler w/drill Ave. crude protein% Ave. ADF % Ave. NDF%
Composite (10 cores) 18.5 33.4 41.0
Compressed 18.8 32.7 40.0
Non-compressed 18.1 34.2 41.9
Indiv. Core (20 cores) 18.8 32.6 40.0
Compressed 19.0 32.2 39.5
Non-compressed 18.6 33.0 40.4
StarQuality long probe 18.7 32.9 40.4
Composite (10 cores) 18.7 32.9 40.4
Non-compressed 18.7 32.9 40.4
StarQuality short probe 18.8 32.7 40.0
Composite (10 cores) 18.8 32.7 40.0
Compressed 18.8 33.0 40.4
Non-compressed 18.8 32.4 39.7
*There were no significant differences between short and long probes or the drill-type probe

The level of variation in a single-compressed typical set of samples is shown in Figure 2.
Although average Crude Protein (CP) was 20.5%, the range of protein levels varied from 17.8%
to 23.2%, and greater variability in NDF (34.5 to 48.2%) was observed (Figure 2). When the
optimum number of samples is modelled, it is apparent that taking only a few cores as a
composite sample results in a very high level of variation (Figure 3) with greater sampling
significantly lowering the variability in the composite sample (2 samples results in 1.7%
Standard deviation while
20 cores results in 0.25%
standard deviation
(Figure 3).
Such variation is also
apparent in both
compressed and non-
compressed hay bales
(Figure 4). Bale-to-bale
variation can be seen in
this data set, as well as
probe-to-probe variation.
Small trends (in this case
positive) with
compression should be
compared with the amount
of variation that is
commonly seen from
probe-to-probe and from
bale to bale. Relative
Feed Value is calculated
from NDF and ADF, and
the RFV results are widely
divergent in this data set, with the worst case scenario of 112 to 180 RFV (max and min) when
only a few samples are taken (Figure 5). Again, as sample number increased (20 cores) standard
deviation is reduced to only 4.2 points, not 17 points. This illustrates that differentiating hay lots
by only a few points RFV is nearly impossible, and the danger of only taking a few cores to
represent a hay lot.
Figure 2. Variation in Crude Protein and NDF of an alfalfa hay lot from UC Davis, CA. Similar levels of variation
were seen in ADF, TDN, and RFV.
Figure 3. Effect of sample number on the variation in mean results. When
fewer samples are taken, the danger of widely varied results is greater. In
the case of CP, 20 cores limits variation to approximately SD of 0.25% but
doesn’t eliminate variation.
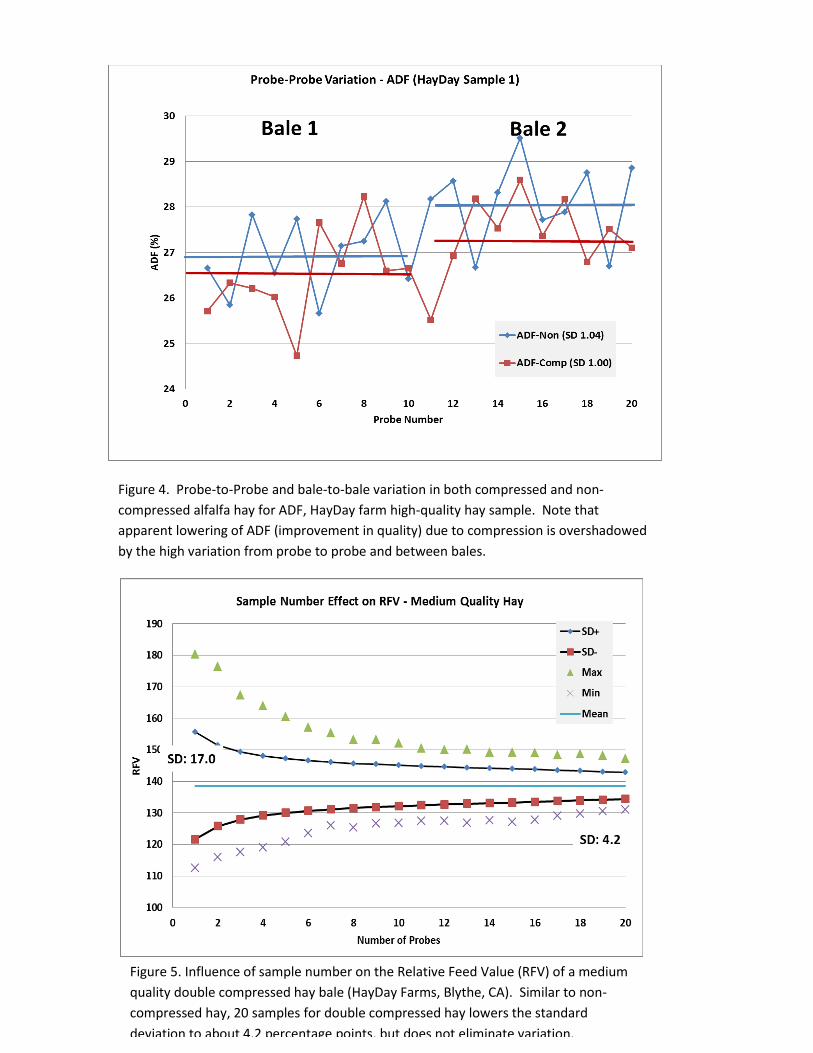
Figure 4. Probe-to-Probe and bale-to-bale variation in both compressed and non-
compressed alfalfa hay for ADF, HayDay farm high-quality hay sample. Note that
apparent lowering of ADF (improvement in quality) due to compression is overshadowed
by the high variation from probe to probe and between bales.
Figure 5. Influence of sample number on the Relative Feed Value (RFV) of a medium
quality double compressed hay bale (HayDay Farms, Blythe, CA). Similar to non-
compressed hay, 20 samples for double compressed hay lowers the standard
deviation to about 4.2 percentage points, but does not eliminate variation.
CONCLUSIONS: COMPRESSED HAY SAMPLING
From this work we come to the following conclusions:
Sampling of double compressed alfalfa hay is feasible utilizing either very sharp hand-
driven probes, or power-driven type probes capable of penetrating a hay bale 12-14”.
Such probes are available.
We did not observe significant differences between probes tested. Requirements for
optimum probe types are provided by http://foragetesting.org
Measurements of before- and after-compression lab tests showed either very minor or
non-existent differences. We conclude that compression does not change the forage
quality of alfalfa hay due to compression utilizing the types of machines utilized at three
sites.
Hay quality tests taken before double compression are likely to accurately reflect post-
compression tests, unless high levels of variation due to large lots or more intensive
processing factors occur.
Compression processes which significantly chop, mix, disrupt significantly or manipulate
particles would likely effect quality – thus post-compression tests would be necessary,
and pre-compression data is likely to be unreliable.
The level of probe-to-probe variation in sampling is very large. Recommendations to
include a minimum of 20 cores to contribute to a composite sample should be followed
for both compressed and non-compressed hay.
The principles of proper hay sampling, including identification of hay lots, and sampling
protocols should be followed for compressed as well as non-compressed hay. See
protocol below.
PRINCIPLES FOR PROPER HAY SAMPLING FOR DETECTION OF LOW LEVEL
PRESENCE OF GE TRAITS IN ALFALFA HAY
Hay sampling for detection of a GE trait was covered by Putnam (2014), and is re-stated briefly
here. The principles of sampling for a low level presence (LLP) of a GE trait are similar in many
respects to sampling for forage
quality (see
http://foragetesting.org)
Sampling must attempt to
provide a subsample which truly
represents the entire mass of a
‘lot’. But there are some
important differences. The
most important difference is that
the objective of GE sampling is
to determine a specific (small)
concentration of a gene or gene
product, not the average
characteristic of the hay. While
representing the leaf-stem ratio,
or the weed-crop mix is an
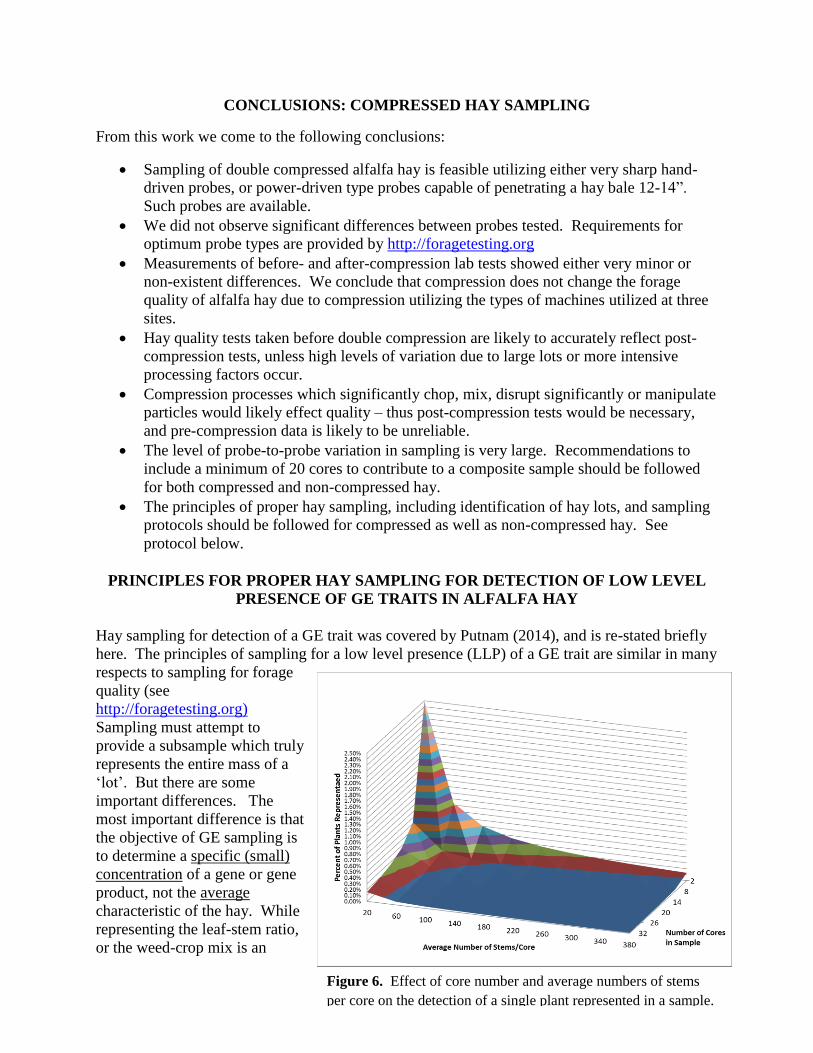
Figure 6. Effect of core number and average numbers of stems
per core on the detection of a single plant represented in a sample.
important consideration for quality, this is not important for GE traits. A more important
consideration is to represent a large number of plants – since LLP in an alfalfa field will be
present only in a few plants in the field. Additionally, the desirable threshold level of detection
must be established for GE traits, since a smaller detection threshold will require a greater
number of stems for detection.
Figure 6 indicates the percentage of the sample represented by a single stem at various
combinations of numbers of probes and numbers of stems per probe. We assume that a single
stem per probe represents a single plant for the purposes of detection of LLP. Our research has
shown that the numbers of stems present in 14” deep cored samples ranges from t 100 - 500 with
an average of 269 (Figure 7). In this example using the average stems/probe, a single stem
would represent approximately 0.013% of the mass collected in 30 probes given these
assumptions. If PCR analysis is used, with detection limits at approximately 0.1, this sampling
method should be capable of detecting about 8 stems in over 8,000 stems sampled using 30
cores, or about 0.1% of the DM of the hay. More compacted bales or deeper sampling methods
(that sample a greater number of stems) would be expected to increase the total stem count in a
composite sample. Keep in mind that any systematic sampling method for LLP must assume a
random distribution of the trait throughout the mass.
The Impossibility of Zero Tolerance in Analysis. Some governments have not approved some
GE traits, and thus have essentially zero tolerance for the importation of that trait in any
agricultural products containing that trait. Likewise, some buyers or consumers wish to have
‘GE-Free’ crops. However, the practicality of declaring an agricultural product as containing
none of a trait or ‘GE Free’ is an absolute impossibility. In order to assure a hay mass ‘GE Free’,
every last gram of that mass must be tested, leaving none for its intended use! Furthermore,
there is a prescribed limit of detection for any lab method, including PCR. A single stem present
in a 200 ton hay crop would constitute ‘contamination’ in a technical sense– but it’s highly
unlikely that any sampling or analytical method would detect this (since the LLP is likely to be
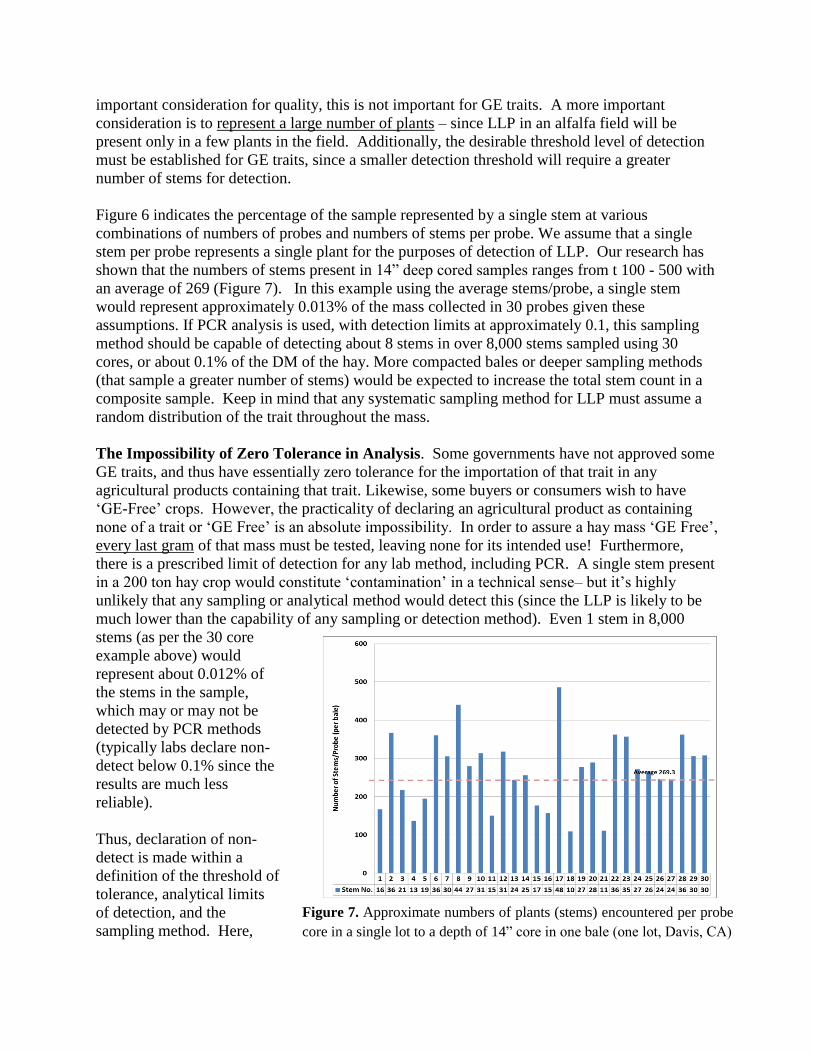
much lower than the capability of any sampling or detection method). Even 1 stem in 8,000
stems (as per the 30 core
example above) would
represent about 0.012% of
the stems in the sample,
which may or may not be
detected by PCR methods
(typically labs declare non-
detect below 0.1% since the
results are much less
reliable).
Thus, declaration of non-
detect is made within a
definition of the threshold of
tolerance, analytical limits
of detection, and the
sampling method. Here,
Figure 7. Approximate numbers of plants (stems) encountered per probe
core in a single lot to a depth of 14” core in one bale (one lot, Davis, CA)
sampling methods are used to supplement a declaration of “Non-GE” hay which may include
other stewardship methods, such as care in labelling, management of inventory, and prevention
of contamination in the field.
PROTOCOLS FOR HAY SAMPLING
The protocols for sampling hay for forage quality of either single-compressed or double
compressed hay exports are remarkably similar. The major differences are related to the ability
to penetrate double-compressed bales. Thus it is highly recommended that those involved with
hay analysis should read the hay protocols and take the hay sampling certification offered by the
National Forage Testing Association (NFTA) – and become a certified hay sampler. Over 2,000
people have done so, and improved their sampling techniques. (http://foragetesting.org)
For detection of a GE trait randomly distributed in the hay (an important distinction), sampling
protocols are remarkably similar to those for forage quality. However, it is very likely that
larger numbers of samples would be needed to detect low levels of an unwanted GE trait in an
otherwise non-GE hay crop. Here we recommend a composite sample of 30 cores as a
minimum, but the number of cores required will depend upon the level of tolerance for Low
Level Presence. For example if 100% of the hay is GE, a single sample (without replication)
will identify the crop as containing the GE trait (no sampling protocol is needed). If low level
presence of 0.1% randomly distributed throughout the mass, a 30 core sample, with 12-14” depth
should contain about 8 stems out of 8,000 stems (0.1%), so if a method is capable of detecting
the trait at that level, this sampling method should suffice.
Here are the important principles of hay sampling for alfalfa for single- and double-compressed
hay for quality, and for detection of a GE trait:
1. Identify a single “lot” of hay. This is a key first step to proper hay sampling, and one
frequently ignored. Normally, a hay lot should be identified which is a single cutting, a
single field and variety, and generally be less than 200 tons. For exports, a hay lot can be
considered a single container or group of
containers. However, in principle, the lot
should consist of hay originating from a
single field, single cutting, and as uniform
as possible. For exports, identification of
grower(s) and source of hay is important.
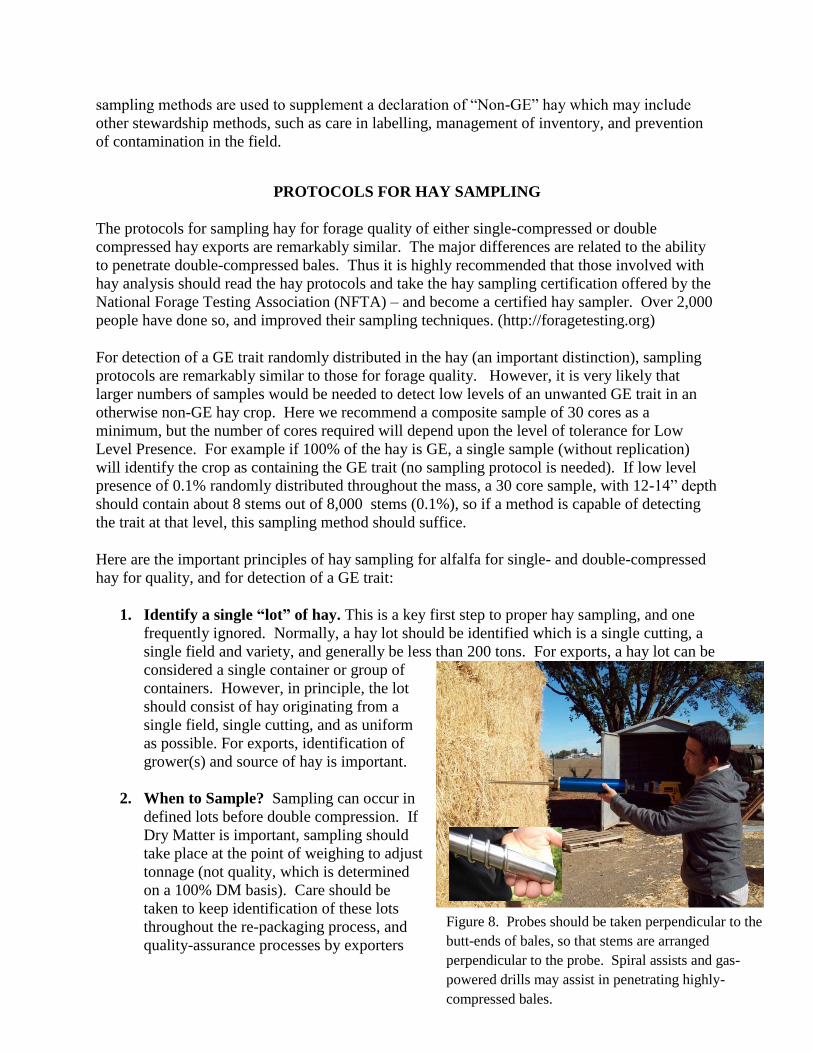
2. When to Sample? Sampling can occur in
defined lots before double compression. If
Dry Matter is important, sampling should
take place at the point of weighing to adjust
tonnage (not quality, which is determined
on a 100% DM basis). Care should be
taken to keep identification of these lots
throughout the re-packaging process, and
quality-assurance processes by exporters
Figure 8. Probes should be taken perpendicular to the
butt-ends of bales, so that stems are arranged
perpendicular to the probe. Spiral assists and gas-
powered drills may assist in penetrating highly-
compressed bales.
(including spot-checking compressed bales). This may assist confirming the
determination of non-GE status in the final double-compressed product. Sampling can
also occur after double compression to confirm quality results.
3. Choose a sharp, well-designed coring device. We generally recommend a sharp coring
device 3/8-3/4” in diameter, approximately 16-24” length, which is capable of
penetrating a bale 12-14” (Figure 3). Do not use flakes or grab samples. The probe
should be capable of penetration (whether single- or double-compressed), and fairly
represent the leaf stem ratio (*see note below for double-compressed bales). Probes
larger than ¾” are acceptable for GE testing, but may inadvertently create samples which
are too large to be handled by a laboratory, or make the sampler stop before the
prescribed number of samples is obtained. Thus, smaller diameter probes are preferred,
as long as they are capable of obtaining a cross-section of stem and leaf. The number of
samples is likely more important than the diameter or depth. The principle is to sample as
many stems as possible, not maximize the size of the sample – larger diameter probes are
not likely to sample a greater number of stems than a smaller diameter probe at 12-14”.
A range of probe tip designs have been successfully used, from serrated to non-serrated
tips. It is probably most important that the tip be sharp (and maintained sharp), and
create a clean cut across a cross-section of hay, and not heat during the sampling
process. Not all probes meet the criteria. Note: only a few probes can be practically used
for double compressed hay. Gas-powered drills utilizing a spiral-assist probe (like the
Star-Quality Sampler, Edmonton, AB) have been shown to work, as have some punch-
type probes which require strength. In both cases, tips must be sharp. We have found
serrated-type probes (e.g. Penn State probe) to heat too fast to be practical.
4. Take enough cores. For forage quality, 20 cores are still recommended, although greater
may be needed for highly variable hay lots. For GE sampling, 30 cores, composited to a
single sample is likely to provide a sample which represents LLP (if present) at about
0.1%, if the number of stems in each probe is above about 250 per probe (Figure 6). In
practice we have found the range of stems to be from about 100-400 per probe. This is
greater than the 20 probes recommended for forage quality testing – since in this case we
are looking for low level presence, not the average quality of the sample. This is the
same recommendation for larger (e.g. 1 ton), or smaller packages, as long as these group
of bales fit the definition of a ‘lot’ (see step #1). The key aspect of sampling hay bales
is number of samples composited, not necessarily the mass of the sample collected, as
long as the mass is sufficient to represent discrete stems in each probed sample.
5. Sample at random. Cores should be taken without bias. Ideally, the sampler should
sample bales at random from all sides, including both ends of the bales. This is
sometimes difficult since all of the bales are not available to the sampler (they may be
against walls of a barn, present only on one face of a container, or up too high for
practical sampling). However, the sampler should make every attempt to sample in a
random fashion. This means not to bias either for or against any bales in the stack. For
example, the sampler may walk 15 steps, sample, walk 20 steps, sample, walk 5 steps,
sample, while walking around stack, trying to represent all areas of the stack. Don’t avoid or choose bales because they look especially bad or good--If 20 or 30 cores are
taken, they won’t make much difference anyway. Avoiding or choosing bales introduces
bias. Note for bales in a container: 25-30 Cores can be taken from the face presented to
the sampler, even multiple samples taken from the same bale, since there is often as much
variation within bales as between bales. The key is to make sure that 20-30 cores are
taken, and that each core is at least 30” (0.7 meter) away from other sample cores to
assure that the same plants are not sampled.
6. Use proper technique. Sample butt ends of hay bale, near the center in the compacted
area between strings or wires, not near the edge. The butt ends of the bales should have
the stems of the product perpendicular to the probe. Probe should be inserted at 90o
angle, 12-14” deep (Figure 8). Sample multiple bales if possible, but if sampling the
same bales, assure that samples are at least 30” apart. The sides or the top of the bale
should not be sampled, since these cores will only represent one flake from a single area
of the field, and the stems will not be perpendicular to the probe. With round bales,
sample towards middle of bale on an angle directly towards the center of the bale.
7. Sample amount: not too big, not too small. Sampling should be done so that about ½
lb. (226 g) to 1 lb. (454 g) of sample is produced-taking a minimum of 20 cores (for
forage quality) and 30 cores for GE detection. For LLP testing, larger is better – but
make sure the laboratory grinds the entire sample. Too-small samples don’t fairly
represent the full range of variation in the hay lot. Very big samples (common with large
length or diameter probes) are excellent at representing the hay but have practical
disadvantages. Large samples are difficult to handle and are often sub-sampled by the
lab since only ¼ of a gram is often used for actually analysis. The sampler should ensure
that the entire sample is ground by the lab. But you should also assure that you are
providing a reasonable weight sample, so that it can be practically handled by the lab.
8. Handle samples correctly. Seal Composite 20- or 30-core sample in a well-sealed
plastic bag and protect from heat. Double bagging is beneficial, especially for DM
measurements. Deliver to lab as soon as possible. Do not allow samples to be exposed to
excess sun (e.g. in the cab of a pickup truck). Refrigeration of hay samples is helpful,
however, dry hay samples (about 90% DM) are considered fairly stable. Note: this is
more important for quality analysis than for GE analysis.
9. Choose Labs with Established Methods. For forage quality testing, we recommend
labs that participate in the NFTA proficiency certification program
(www.foragetesting.org). For PCR testing, consult recommendations of the regulatory
agencies for labs which have been approved.
ABBREVIATIONS: ADF = Acid Detergent Fiber, NDF = Neutral Detergent Fiber, CP=Crude
Protein, TDN = Total Digestible Nutrients, RFV = Relative Feed Value.
REFERENCES
Gombos, N. 2011. The Dynamic World of Hay Exports: How Increasing Populations and Scarce
Resources will Shape the Industry. In: Proceedings, 2011 Western Alfalfa & Forage
Conference, Las Vegas, NV, 11-13 December, 2011. UC Cooperative Extension, Plant Sciences
Department, University of California, Davis, CA 95616. (See http://alfalfa.ucdavis.edu for this
and other alfalfa symposium Proceedings.)
National Forage Testing Association (NFTA). 2002 Hay Sampling Certification Exam.
http://www.foragetesting.org/index.php?page=exam_info
Putnam, D.H. 2014. Sampling Considerations For Detection Of Genetically Engineered (Ge)
Traits In Alfalfa Hay In: Proceedings, 2014 California Alfalfa, Forage, and Grain Symposium,
Long Beach, CA, 10-12 December, 2014. UC Cooperative Extension, Plant Sciences
Department, University of California, Davis, CA 95616. (See http://alfalfa.ucdavis.edu for this
and other Alfalfa Symposium Proceedings.)
Putnam, D.H. and S.B. Orloff. 2002. Hay Sampling Protocols and a Hay Sampling Certification
Program. IN Western Alfalfa & Forage Conference, Reno, NV, Univ. of California
Cooperative Extension, University of California, Davis, CA 95616. see: http://alfalfa.ucdavis.edu
Putnam, D.H. B. Matthews, and D. Sumner. 2015. Alfalfa and Grass Hay Exports Decline after
Sever Years of Dramatic Growth. Alfalfa & Forage News Blog. On-line.
http://ucanr.edu/blogs/blogcore/postdetail.cfm?postnum=17566
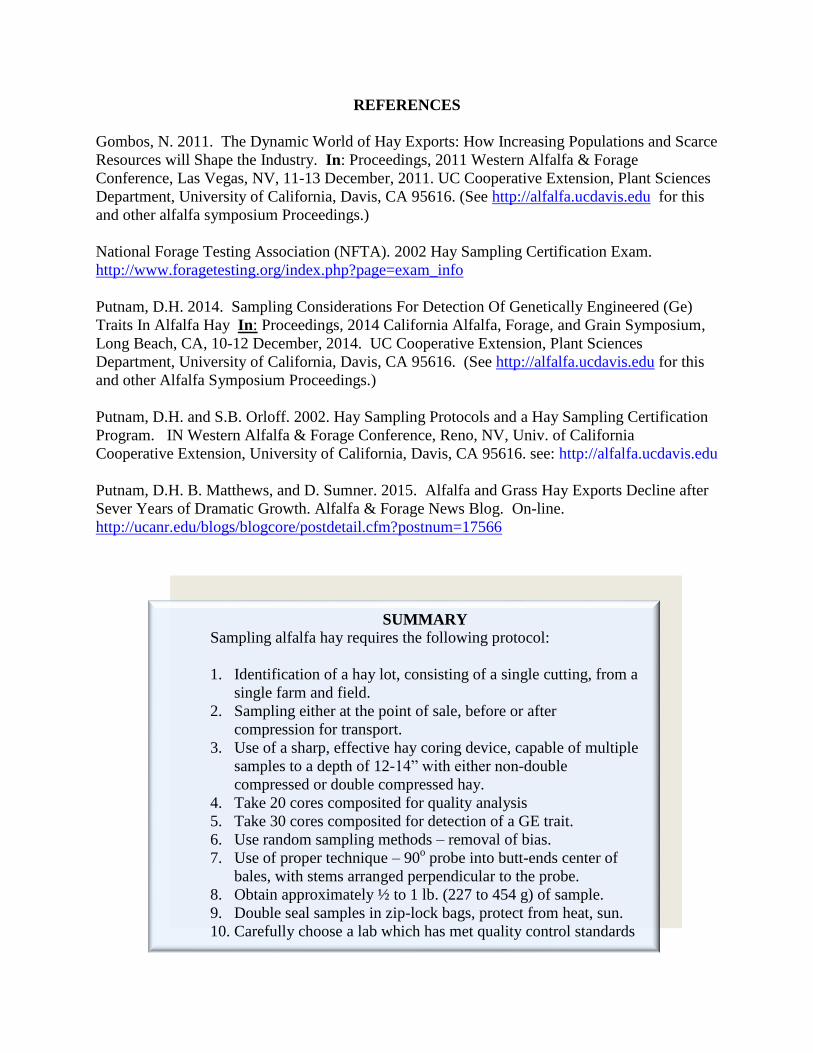
SUMMARY
Sampling alfalfa hay requires the following protocol:
1. Identification of a hay lot, consisting of a single cutting, from a
single farm and field.
2. Sampling either at the point of sale, before or after
compression for transport.
3. Use of a sharp, effective hay coring device, capable of multiple
samples to a depth of 12-14” with either non-double
compressed or double compressed hay.
4. Take 20 cores composited for quality analysis
5. Take 30 cores composited for detection of a GE trait.
6. Use random sampling methods – removal of bias.
7. Use of proper technique – 90o probe into butt-ends center of
bales, with stems arranged perpendicular to the probe.
8. Obtain approximately ½ to 1 lb. (227 to 454 g) of sample.
9. Double seal samples in zip-lock bags, protect from heat, sun.
10. Carefully choose a lab which has met quality control standards
and has been approved for GE analysis.