Embed Size (px)
Citation preview
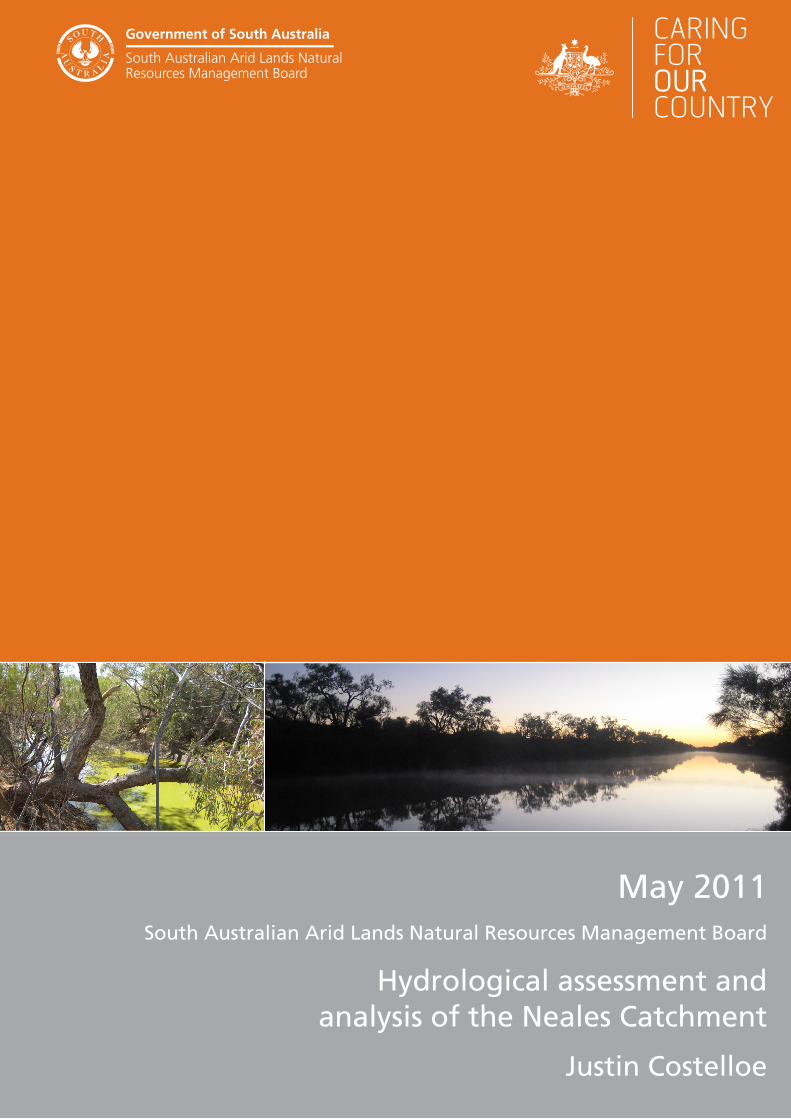
Government of South Australia
South Australian Arid Lands NaturalResources Management Board
May 2011South Australian Arid Lands Natural Resources Management Board
Hydrological assessment and analysis of the Neales Catchment
Justin Costelloe
Hydrological assessment and analysis of the Neales Catchment
Justin Costelloe
May 2011
Report to the South Australian Arid Lands Natural Resources Management Board
1 Department of Civil and Environmental Engineering, University of Melbourne,
[email protected]; 03 8344 7238
DISCLAIMER The South Australian Arid Lands Natural Resources Management Board, and its
employees do not warrant or make any representation regarding the use, or results
of use of the information contained herein as to its correctness, accuracy, reliability,
currency or otherwise. The South Australian Arid Lands Natural Resources
Management Board and its employees expressly disclaim all liability or responsibility
to any person using the information or advice.
© South Australian Arid Lands Natural Resources Management Board 2011
This report may be cited as:
Costelloe, J.F. 2011. Hydrological assessment and analysis of the Neales
Catchment. Report by the University of Melbourne to the South Australian Arid Lands
NRM Board, Port Augusta.
© South Australian Arid Lands Natural Resources Management Board, May 2011
Cover image(s) – South Stewart (L) and Algebuckina Waterhole (R)
This work is copyright. Apart from any use permitted under the Copyright Act 1968
(Commonwealth), no part may be reproduced by any process without prior written
permission obtained from the South Australian Arid Lands Natural Resources
Management Board. Requests and enquiries concerning reproduction and rights
should be directed to the Regional Manager, South Australian Arid Lands Natural
Resources Management Board, Railway Station Building, PO Box 2227, Port
Augusta, SA, 5700
3 | P a g e
Table of Contents
Introduction ....................................................................................................................... 4
Hydrological context of study period ................................................................................ 5
Methods ............................................................................................................................ 11
Water level logger network ............................................................................................ 11
Waterbody surveying ..................................................................................................... 12
Water quality measurements ......................................................................................... 12
Key Findings .................................................................................................................... 13
Flow patterns ................................................................................................................. 13
Refugia - fluvial .............................................................................................................. 15
Refugia - springs ............................................................................................................ 19
Refugia – bore drains and dams .................................................................................... 21
Waterhole persistence - introduction ............................................................................. 22
Waterhole persistence: surface-fed ............................................................................... 23
Waterhole persistence: groundwater-fed ....................................................................... 30
Waterhole geomorphic change ...................................................................................... 31
Distribution of saline waterholes .................................................................................... 37
Waterhole salinity processes ......................................................................................... 39
Future monitoring ........................................................................................................... 41
Water level logger network ............................................................................................ 41
Waterhole morphology ................................................................................................... 43
Unconfined groundwater monitoring .............................................................................. 43
Management plan ............................................................................................................ 45
References ....................................................................................................................... 46
4 | P a g e
Executive Summary
This report presents the findings of a regional-scale investigation of the Neales River
catchment hydrology, as part of the South Australian Arid Lands Natural Resources
Management Board project "Understanding and managing critical refugia in the arid lands of
central northern Australia" (the Critical Refugia project). Funding was granted through the
Australian Government’s Caring for Our Country 2009/10 Program. This work contributes to
the SAAL Regional NRM Plan Resource Condition Target (RCT) 8: “By 2020 flow regimes
and water quality in surface water systems are maintained or improved”.
5 | P a g e
Introduction An inventory of the location and persistence of waterholes of arid zone rivers is a major gap
in our understanding of the hydrology and ecology of these systems. Refugial waterholes are
critical for many aquatic fauna during periods of no flow (Bunn et al., 2003; Hamilton et al.,
2005). Water extraction from waterholes during periods of no flow and low flow can
potentially have serious effects on the persistence of waterholes and subsequently on the
ecology of a reach or catchment. The persistence of a waterhole is controlled by three
factors;
1. Frequency of surface inflow (or conversely, the length of the no-flow period), 2. Degree of interaction with the unconfined groundwater table, 3. Maximum depth of the waterhole at the cease-to-flow stage.
One aim of the Critical Refugia project is to determine the characteristics of waterholes in the
Neales River catchment of the western Lake Eyre Basin. The project is lead by the South
Australian Arid Lands Natural Resource Management Board and funded by the
Commonwealth Government Caring for our Country (CfoC) program. The Hydrology sub-
project was undertaken by Dr Justin Costelloe with assistance in the field from Peter
Richards and Graeme Tomlinson.
Hydrological context of study period
The Critical Refugia project (July 2009 – June 2010) coincided with a relatively wet period
compared to the last ten years (Figure 1), particularly in terms of the number of flow events.
The flow events during the past year were not the largest in the recent record but resulted in
frequent connection between waterbodies. Another important aspect of the frequency of
flows was that the salinity of the highly saline reaches of the Neales and Peake were
suppressed, allowing movement of the more saline intolerant fish species.
The material in this section is an updated version of a section taken from Costelloe (2008).
Flow occurs over a continuum of events with differing magnitude but the following classes
are useful for summarising flows in the Neales catchment:
1. Catchment floods – flows that occur in all reaches of the catchment with
connectivity established over much of the length of the main rivers and tributaries.
These floods utilise most of the available floodplain and generally contribute some
flow into Lake Eyre North.
2. Sub-catchment floods – flows with considerable downstream extent and
longitudinal connectivity that result in upstream-downstream connectivity in at least
one of the major tributaries (Neales River or Peake Creek). Not all available
6 | P a g e
floodplain is utilised and no, or minor, inflow to Lake Eyre North occurs. These floods
reset the hydrologic conditions at most waterholes within a subcatchment and enable
substantial opportunities for migration of fish within the subcatchment.
3. Local flows – flows derived mostly from convective thunderstorms that initiate flow
only into some reaches with limited downstream extent and little floodplain
inundation.
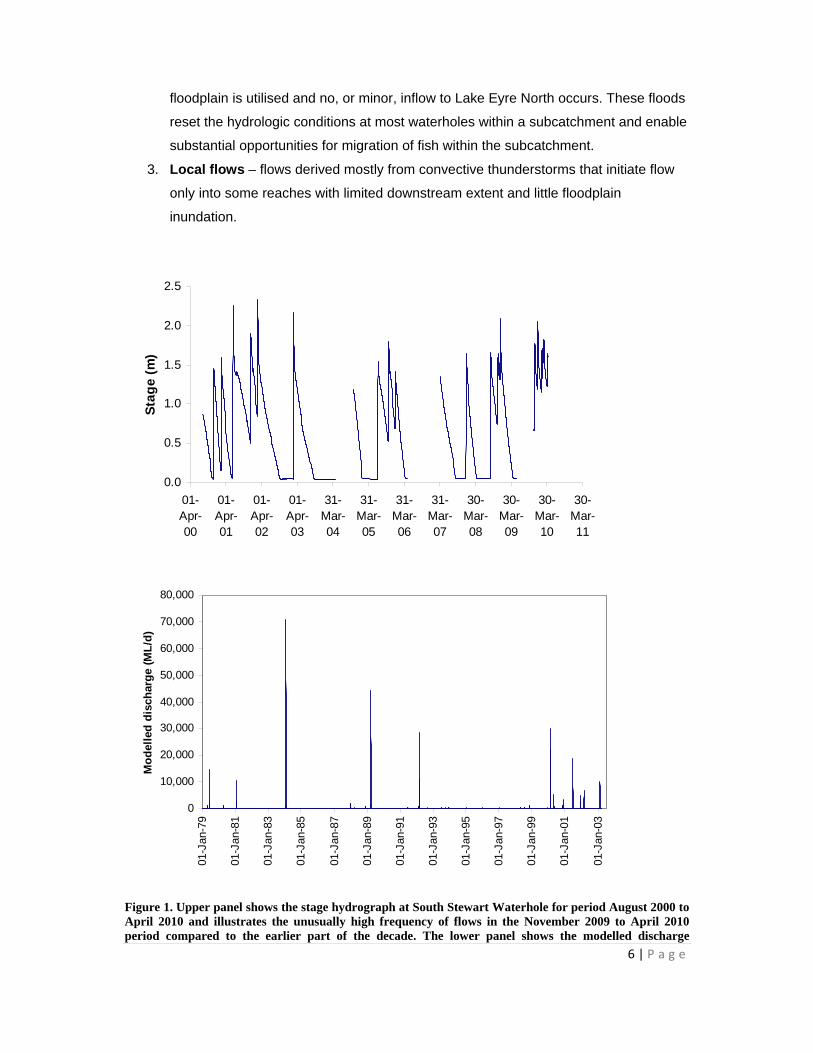
Figure 1. Upper panel shows the stage hydrograph at South Stewart Waterhole for period August 2000 to April 2010 and illustrates the unusually high frequency of flows in the November 2009 to April 2010 period compared to the earlier part of the decade. The lower panel shows the modelled discharge
0.0
0.5
1.0
1.5
2.0
2.5
01-Apr-00
01-Apr-01
01-Apr-02
01-Apr-03
31-Mar-04
31-Mar-05
31-Mar-06
31-Mar-07
30-Mar-08
30-Mar-09
30-Mar-10
30-Mar-11
Sta
ge
(m
)
0
10,000
20,000
30,000
40,000
50,000
60,000
70,000
80,000
01-J
an-7
9
01-J
an-8
1
01-J
an-8
3
01-J
an-8
5
01-J
an-8
7
01-J
an-8
9
01-J
an-9
1
01-J
an-9
3
01-J
an-9
5
01-J
an-9
7
01-J
an-9
9
01-J
an-0
1
01-J
an-0
3
Mo
del
led
dis
char
ge
(ML
/d)
7 | P a g e
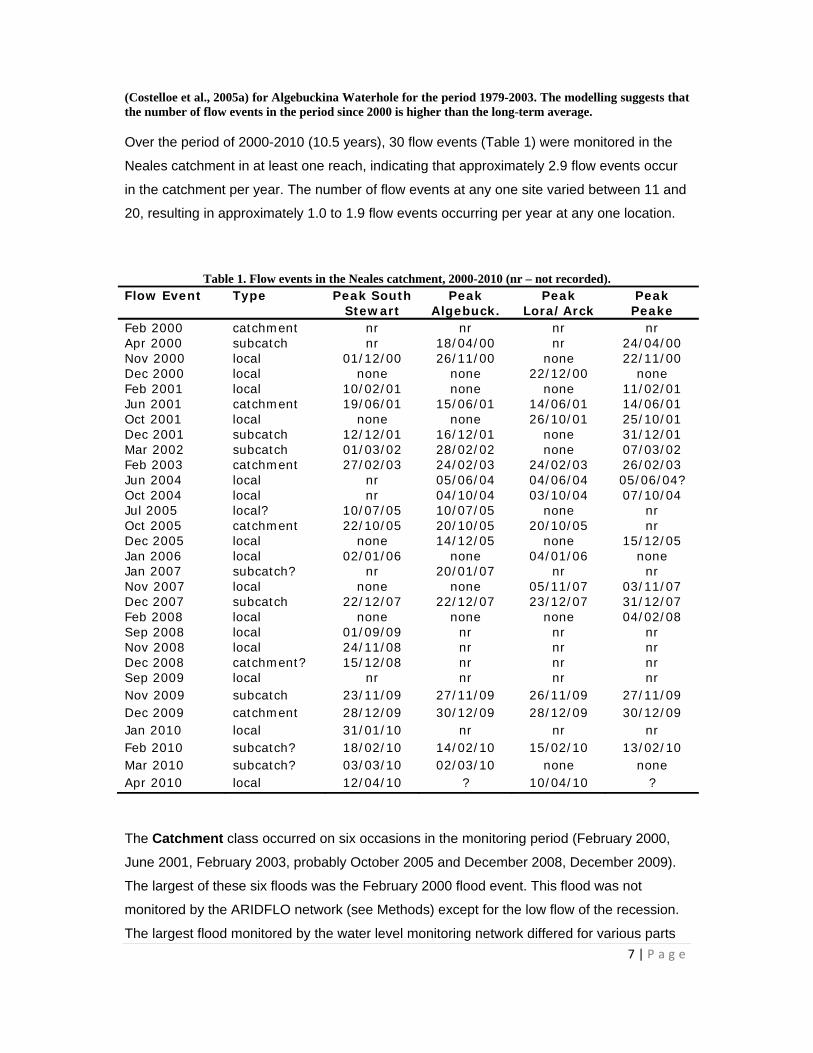
(Costelloe et al., 2005a) for Algebuckina Waterhole for the period 1979-2003. The modelling suggests that the number of flow events in the period since 2000 is higher than the long-term average. Over the period of 2000-2010 (10.5 years), 30 flow events (Table 1) were monitored in the
Neales catchment in at least one reach, indicating that approximately 2.9 flow events occur
in the catchment per year. The number of flow events at any one site varied between 11 and
20, resulting in approximately 1.0 to 1.9 flow events occurring per year at any one location.
Table 1. Flow events in the Neales catchment, 2000-2010 (nr – not recorded). Flow Event Type Peak South
Stewart Peak
Algebuck. Peak
Lora/Arck Peak Peake
Feb 2000 catchment nr nr nr nr Apr 2000 subcatch nr 18/04/00 nr 24/04/00 Nov 2000 local 01/12/00 26/11/00 none 22/11/00 Dec 2000 local none none 22/12/00 none Feb 2001 local 10/02/01 none none 11/02/01 Jun 2001 catchment 19/06/01 15/06/01 14/06/01 14/06/01 Oct 2001 local none none 26/10/01 25/10/01 Dec 2001 subcatch 12/12/01 16/12/01 none 31/12/01 Mar 2002 subcatch 01/03/02 28/02/02 none 07/03/02 Feb 2003 catchment 27/02/03 24/02/03 24/02/03 26/02/03 Jun 2004 local nr 05/06/04 04/06/04 05/06/04? Oct 2004 local nr 04/10/04 03/10/04 07/10/04 Jul 2005 local? 10/07/05 10/07/05 none nr Oct 2005 catchment 22/10/05 20/10/05 20/10/05 nr Dec 2005 local none 14/12/05 none 15/12/05 Jan 2006 local 02/01/06 none 04/01/06 none Jan 2007 subcatch? nr 20/01/07 nr nr Nov 2007 local none none 05/11/07 03/11/07 Dec 2007 subcatch 22/12/07 22/12/07 23/12/07 31/12/07 Feb 2008 local none none none 04/02/08 Sep 2008 local 01/09/09 nr nr nr Nov 2008 local 24/11/08 nr nr nr Dec 2008 catchment? 15/12/08 nr nr nr Sep 2009 local nr nr nr nr Nov 2009 subcatch 23/11/09 27/11/09 26/11/09 27/11/09 Dec 2009 catchment 28/12/09 30/12/09 28/12/09 30/12/09 Jan 2010 local 31/01/10 nr nr nr Feb 2010 subcatch? 18/02/10 14/02/10 15/02/10 13/02/10 Mar 2010 subcatch? 03/03/10 02/03/10 none none Apr 2010 local 12/04/10 ? 10/04/10 ?
The Catchment class occurred on six occasions in the monitoring period (February 2000,
June 2001, February 2003, probably October 2005 and December 2008, December 2009).
The largest of these six floods was the February 2000 flood event. This flood was not
monitored by the ARIDFLO network (see Methods) except for the low flow of the recession.
The largest flood monitored by the water level monitoring network differed for various parts
8 | P a g e
of the catchment. The June 2001 flood was the largest flood in the lower Neales at
Algebuckina Waterhole while the February 2002 was the largest recorded in the upper
Neales at South Stewart Waterhole. In the lower Peake, the December 2009 flood had the
highest stage at Peake Crossing. Modelling indicates that there have been eight probable
catchment scale floods (i.e. similar or higher magnitude than the February 2003 flood) in the
period 1979-2003. The monitored period of 2000-2010 has experienced relatively more
catchment class floods than the remainder of the modelled period. The monitoring data
illustrate the variability in magnitude and timing of flow within the catchment even for the
large floods. For instance, the June 2001 flood was significantly larger in the Neales
subcatchment compared to the Peake subcatchment. In the Peake subcatchment the flood
peak occurred on the same day at the upstream (Lora and Arckaringa) and downstream
(Peake Bridge) sites, with the Peake Bridge site commencing to flow a day earlier than
upstream sites. A small peak at the downstream site six days after the major flow peak may
indicate the flow time between the upstream and downstream sites on Peake Creek.
However, this flood did result in substantial connection between the upstream and
downstream reaches, significant floodplain inundation and a resetting of the water levels in
all of the monitored waterholes. The peak of the June 2001 flood at South Stewart occurred
four days later than the peak at Algebuckina Waterhole.
The Subcatchment Flood class occurred on eight occasions in the monitoring period and
flows of this size and larger have an approximate annual occurrence frequency. However,
modelling suggests that the 2000-2003 period had a higher frequency of subcatchment to
catchment class floods than the period 1979-1999 (Figure 1). The ARIDFLO logger data also
shows that the 2000-2003 period contained six subcatchment to catchment class flows while
there were only three in the 2004-2008 period but five since December 2008. Flow times
between pairs of loggers in the same subcatchment were difficult to determine because flow
peaks in the lower catchment could precede flow peaks in the upper catchment. However,
travel times of between 2-4 days were noted in the flow events more obviously sourced from
the upper catchment. The inconsistency in the timing of flow peaks demonstrates that storm
events can have variable spatial patterns of rainfall that activate different parts of the
catchment at different times. This variability contributes to the difficulty in modelling flow in
these ungauged western rivers and emphasises the usefulness of widespread water level
monitoring data when interpreting biological monitoring data.
The Local flow class is typified by either being recorded at only one of the upstream or
downstream reaches, or having independent flow events in both reaches. There were 14
local flows recorded over the monitoring period and these varied from small flows that were
9 | P a g e
measured at only one logger to widespread but ‘spotty’ storm events that generated
independent flow events in several reaches (verified by field observations, e.g. November
2000). The Local flow class comprises the majority of flow events measured in the Neales
catchment and therefore make a substantial contribution to the overall flow frequency and
that of individual sites. These flows are difficult to model (Costelloe et al. 2005a) because of
the sparse raingauge network in the Neales catchment and generally require at least a pair
of upstream-downstream loggers to identify whether an event was ’local’ or ‘subcatchment’.
The local flows can make important contributions to maintaining water levels and flushing
saline water from individual waterholes. However, on an individual basis they can have
detrimental effects on the ecology of a waterhole. For instance, small local flows can cue
some fish species to migrate upstream and be stranded by the lack of longitudinal
connectivity of the flow event, resulting in a reduction in fish species richness in the
waterhole (Costelloe et al., 2004). Due to the lack of connection between pairs of loggers, it
is not possible to estimate travel times for the local flows, although field observations and
modelling suggest that the travel times are significantly slower than for regional flows. An
example of the slow travel times of this flow class is from a flow event in November 2000. A
rainfall event on the 23/11/00 resulted in strong flow at Algebuckina by the 25/11/00. Flow
was observed in the upper catchment at Hookey Waterhole (near Oodnadatta) on the
24/11/00 but did not commence into South Stewart (approximately 20 km downstream) until
28/11/00. The streamflow peak at Algebuckina was on 26/11/00 but the upstream logger at
South Stewart did not peak until 01/12/00 and it is likely that there was no connecting flow
between the upper and lower catchment.
April 2011 field data
All but one of the loggers installed in the Neales catchment were downloaded and
maintained in April 2011. The exception was a logger installed in the lower reaches
of the Neales that was not accessible due to recent flooding. The loggers installed
during the Critical Refugia project were generally working well. However, four of the
six older, ARIDFLO loggers were malfunctioning and were removed from the field.
The logger data provided further evidence of the remarkably wet period of November
2009 to April 2011 and that a major (probably 1:10 year) flood occurred in February
2011 in response to rainfall from a rain depression associated with Cyclone Yasi.
This flood was approximately the same size as the most recent large flood in the
catchment in February 2000. Over the period of 2000-2011 (11 years), 46 flow
events were monitored in the Neales catchment in at least one reach, indicating that
approximately 4.2 flow events occur in the catchment per year. However, this
10 | P a g e
frequency was highly skewed by the large number of flow events in the period
November 2009 to April 2011. In this latter 18-month period, 22 of the flow events
occurred, while the annual frequency of flow prior to November 2011 was 2.5 events.
The number of flow events at any one site over 2000-2011 varied between 28 and
38, resulting in approximately 2.5 to 3.5 flow events occurring per year at any one
location, but with a frequency of only 1.0 to 1.9 flow events prior to November 2009.
One wet transect was measured at the logger site on Algebuckina Waterhole and
found that the February 2011 flood (probably about a 1:10 year flood) had scoured
the waterhole and the current maximum depth (4.8 m) was slightly deeper than found
during the 2000-2003 period and substantially deeper than the 3.45 m measured
during 2009-2010.
11 | P a g e
Methods This report draws upon hydrologic and geomorphic monitoring data collected over four
periods. The first phase of data collection occurred from April 2000 to February 2003 as part
of the ARIDFLO project. The second phase occurred during the period 2004-2006 as part of
a University of Melbourne research project that examined salinity processes in the Neales
River catchment. The third phase occurred over 2007-2008 and involved maintenance of the
water level logger network installed as part of the ARIDFLO project. This phase was
supported by the Lake Eyre Basin River Assessment, DWLBC and University of Melbourne.
The fourth phase occurred from November 2009 to April 2010 as part of the current Critical
Refugia project.
Water level logger network
The most critical feature in characterising the hydrology of a catchment is to collect data on
flow events. Prior to 2000, there had been no systematically recorded flow data for the
Neales River catchment, but there has been important anecdotal observations, both
published (e.g. Kotwicki 1986) and the observations and local knowledge of residents in the
catchment.
As part of the ARIDFLO project, nine water level loggers were installed around the Neales
catchment. Originally, a cluster of three loggers each were installed around Algebuckina
Waterhole and Peake Creek (Peake Crossing) but some of these loggers were moved to
new sites during the course of the project. These loggers recorded water level variations
each hour and provided the first recorded time-series data of flow events in the catchment.
The history and analysis of this dataset over the 2000-2008 period is described in Costelloe
(2008).
As part of the Critical Refugia project, a new generation of low cost water level loggers were
installed. These loggers were placed in positions that filled in some gaps in the ARIDFLO
network, provided greater upstream and downstream coverage, and also provided
information on flow events in tributaries that drained areas with artesian groundwater
springs.
Water level time series data have also been used to determine if the waterhole drawdown
rates in the absence of flow match expected open-water evaporation rates (Costelloe et al.,
2007).
12 | P a g e
Waterbody surveying
The maximum depth of a waterhole when flow ceases (cease-to-flow depth; CTFD) has
been found to be an important measure of how long water will persist in the waterhole
(Costelloe et al., 2007), and hence if the waterhole is capable of being a critical refugia in the
catchment. As part of this project, key waterholes were identified from local knowledge,
1:250,000 scale topographical maps and previous work (ARIDFLO). The dimensions of
these waterholes were measured using simple ‘wet survey’ techniques and surveying using
a total station. The wet surveys involved measuring a number of transects across the
waterhole with a surveying tape to measure length and a weighted tape to measure depth
along the transect. This allowed the characterisation of the dimensions of the waterhole.
Surveys by total station were used to characterise the out-of-water morphology for the
remainder of the waterhole survey (i.e. from water level to top of bank and onto the
surrounding floodplain). The surveys utilised riparian vegetation zonation (particularly the
base of the lignum zone) and downstream levees to identify cease-to-flow levels.
Some surveys to determine levels and hydraulic gradients were also carried out using
differential geographic positioning system (DGPS) instruments. These surveys provided
relative vertical height accuracies of <5 cm over scales of kilometres.
Water quality measurements
Water quality data were collected (particularly salinity) to identify waterholes that may be
subject to groundwater inflow. Some information was also collected from piezometers
installed as part of an earlier University of Melbourne project. The earlier water quality
measurements also included major ion analysis of selected surface water and groundwater
samples.
13 | P a g e
Key Findings
Flow patterns
Observations of flow events during 2000-2010 (Table 1) have shown that flow events can be
independently generated in the upper and lower reaches of the Neales catchment and there
may not be connection between reaches during a series of flows generated from the same
rainfall event. This is a consequence of a number of factors. For instance, the middle
reaches of the Neales and Peake are low gradient and poorly channelised, so that flow
transmission is slow and losses are high and this can hinder connectivity between runoff
generated in different parts of the catchment. In addition, both the Neales and Peake have
tributaries in the middle to lower reaches that can supply flow independently of runoff
generated in the upper catchment. The spatial patchiness of rain and the lack of a well-
defined rainfall gradient over the catchment also contribute to the patchiness of flow events.
16 of the 30 flow events in the catchment have been classified as ‘Local’ flows with no
connection between the upper and lower catchments. Local flows will refill waterholes and
provide some connectivity between clusters of nearby waterholes but will not allow
widespread connectivity and migration of most aquatic fauna between the upper and lower
catchments. The main clusters of waterholes on the Neales River are the Angle Pole to
Cramps Camp cluster in the upper Neales and the Algebuckina to Cliff cluster on the lower
Neales. The upper reach cluster seems to be influenced by the tributary junction of the North
and South Branches (e.g. Angle Pole) and by the change in channel direction and
constriction where the Neales cuts through some higher ground (e.g. Stewart to Cramps
Camp, see Figure 2). The lower reach cluster seems to be influenced by the constriction of
the Neales as it passes through the northern extension of the Peake-Denison Ranges.
Similarly, on Peake Creek (although there are fewer waterholes), there is a small cluster
near the junction of Lora and Arckaringa Creeks (Birribiana and Cootanoorina (Big Hole))
and a cluster around the constriction through the Peake-Denison Ranges (e.g. Baltucoodna
and Warrarawoona). On both the Neales and Peake branches, further downstream of the
Peake-Denison Ranges, the reach becomes poorly channelised with few residual pools,
before becoming channelised again (with waterholes, e.g. Tardetakarinna) at the junction
between the Neales and Peake.
This project has not examined which flow events have resulted in significant flow into Lake
Eyre North so that it is uncertain if any flows in the monitoring period have connected with
flow entering Lake Eyre North from the other tributaries. However, it is possible that the large
February 2000 flood had some hydraulic connection with a significant flood entering Lake
14 | P a g e
Eyre North from the Warburton River. Prior to that, the most probable chance of connection
between flow in the Neales catchment and water in Lake Eyre North was during the period of
large floods during 1974-1977.
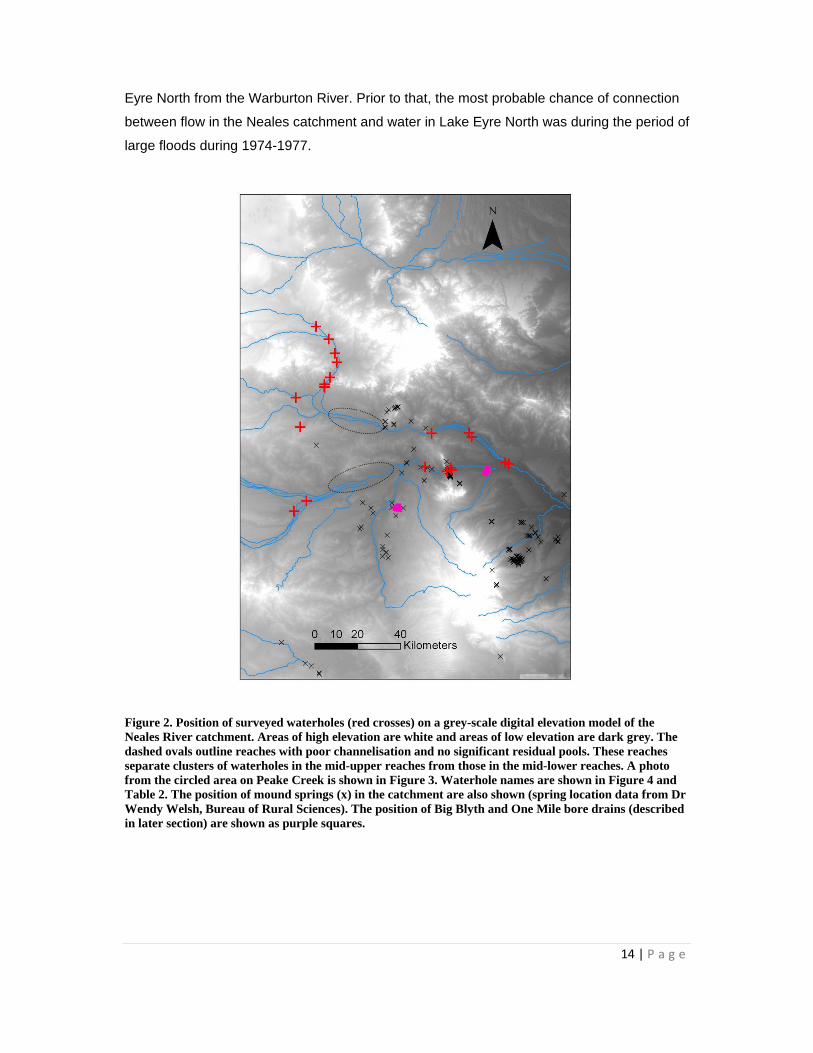
Figure 2. Position of surveyed waterholes (red crosses) on a grey-scale digital elevation model of the Neales River catchment. Areas of high elevation are white and areas of low elevation are dark grey. The dashed ovals outline reaches with poor channelisation and no significant residual pools. These reaches separate clusters of waterholes in the mid-upper reaches from those in the mid-lower reaches. A photo from the circled area on Peake Creek is shown in Figure 3. Waterhole names are shown in Figure 4 and Table 2. The position of mound springs (x) in the catchment are also shown (spring location data from Dr Wendy Welsh, Bureau of Rural Sciences). The position of Big Blyth and One Mile bore drains (described in later section) are shown as purple squares.
15 | P a g e
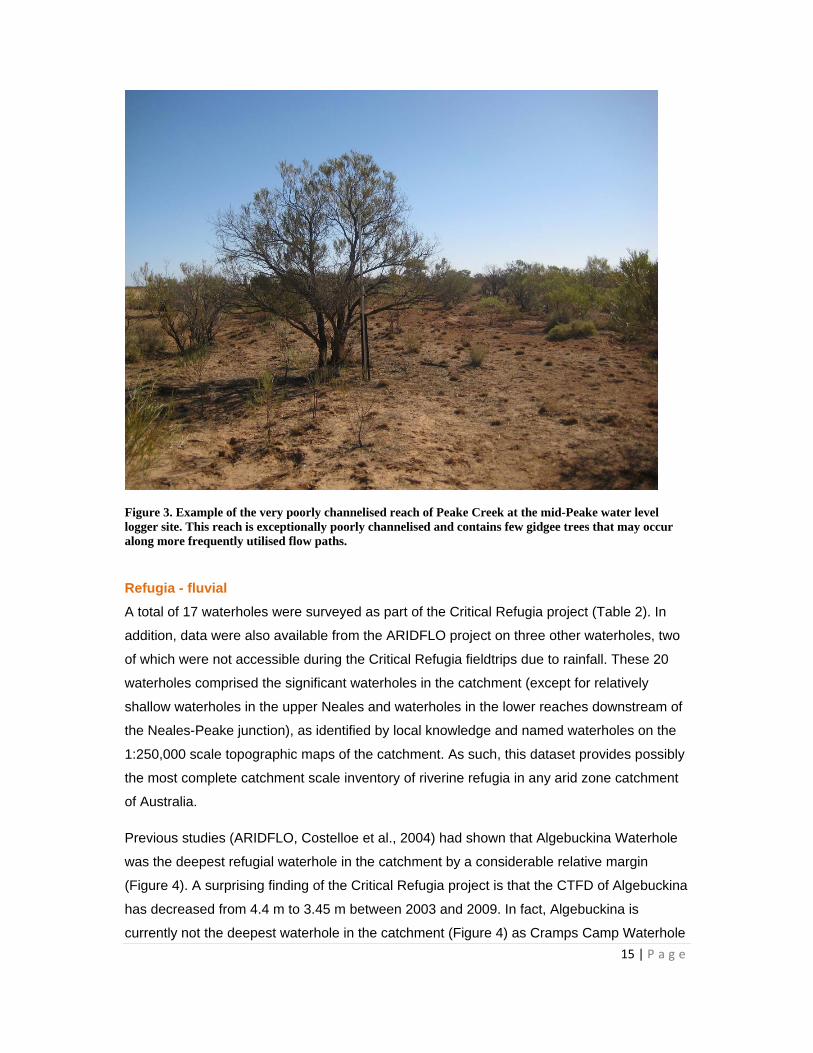
Figure 3. Example of the very poorly channelised reach of Peake Creek at the mid-Peake water level logger site. This reach is exceptionally poorly channelised and contains few gidgee trees that may occur along more frequently utilised flow paths.
Refugia - fluvial
A total of 17 waterholes were surveyed as part of the Critical Refugia project (Table 2). In
addition, data were also available from the ARIDFLO project on three other waterholes, two
of which were not accessible during the Critical Refugia fieldtrips due to rainfall. These 20
waterholes comprised the significant waterholes in the catchment (except for relatively
shallow waterholes in the upper Neales and waterholes in the lower reaches downstream of
the Neales-Peake junction), as identified by local knowledge and named waterholes on the
1:250,000 scale topographic maps of the catchment. As such, this dataset provides possibly
the most complete catchment scale inventory of riverine refugia in any arid zone catchment
of Australia.
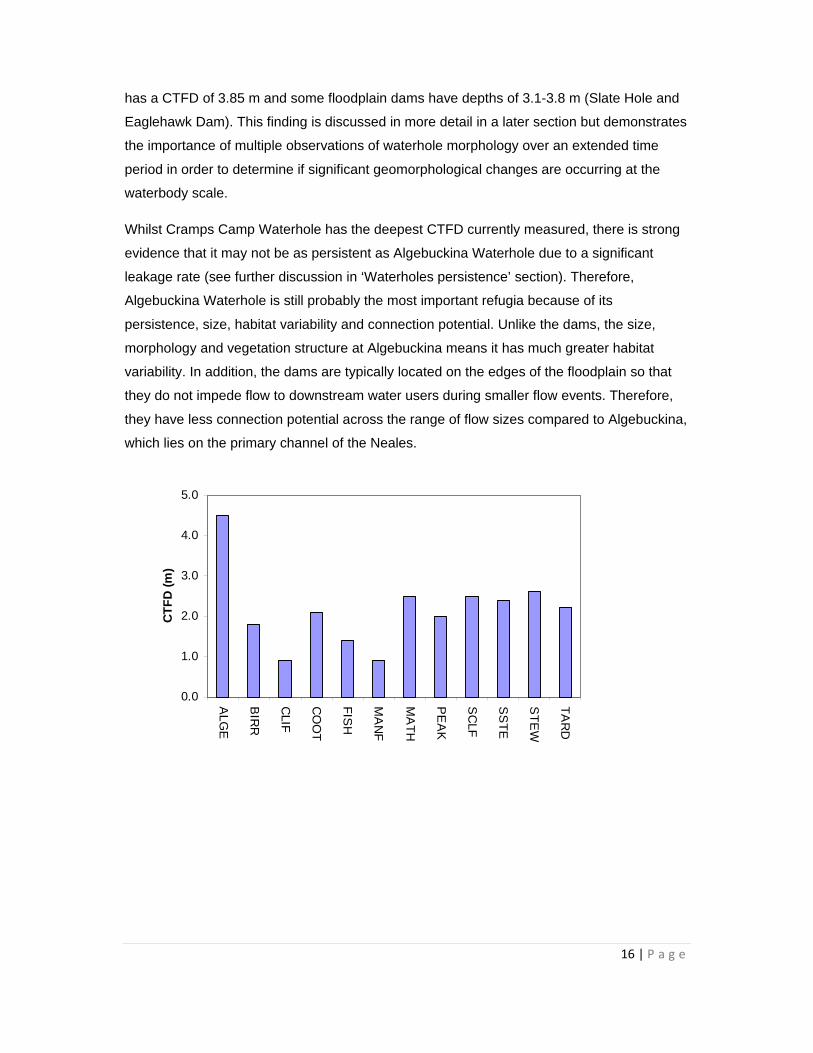
Previous studies (ARIDFLO, Costelloe et al., 2004) had shown that Algebuckina Waterhole
was the deepest refugial waterhole in the catchment by a considerable relative margin
(Figure 4). A surprising finding of the Critical Refugia project is that the CTFD of Algebuckina
has decreased from 4.4 m to 3.45 m between 2003 and 2009. In fact, Algebuckina is
currently not the deepest waterhole in the catchment (Figure 4) as Cramps Camp Waterhole
16 | P a g e
has a CTFD of 3.85 m and some floodplain dams have depths of 3.1-3.8 m (Slate Hole and
Eaglehawk Dam). This finding is discussed in more detail in a later section but demonstrates
the importance of multiple observations of waterhole morphology over an extended time
period in order to determine if significant geomorphological changes are occurring at the
waterbody scale.
Whilst Cramps Camp Waterhole has the deepest CTFD currently measured, there is strong
evidence that it may not be as persistent as Algebuckina Waterhole due to a significant
leakage rate (see further discussion in ‘Waterholes persistence’ section). Therefore,
Algebuckina Waterhole is still probably the most important refugia because of its
persistence, size, habitat variability and connection potential. Unlike the dams, the size,
morphology and vegetation structure at Algebuckina means it has much greater habitat
variability. In addition, the dams are typically located on the edges of the floodplain so that
they do not impede flow to downstream water users during smaller flow events. Therefore,
they have less connection potential across the range of flow sizes compared to Algebuckina,
which lies on the primary channel of the Neales.
0.0
1.0
2.0
3.0
4.0
5.0
ALG
E
BIR
R
CLIF
CO
OT
FIS
H
MA
NF
MA
TH
PE
AK
SC
LF
SS
TE
ST
EW
TA
RD
CT
FD
(m
)
17 | P a g e
0
1
2
3
4
5
AF
GH
AN
GL
ALG
E
BA
LT
BIR
R
CLIF
CO
OT
CR
AM
FIS
H
HA
GA
HO
OK
MA
NF
MA
TH
PE
AK
SC
LF
SH
EP
SS
TE
ST
EW
TA
RD
WA
RR
CT
FD
(m
)
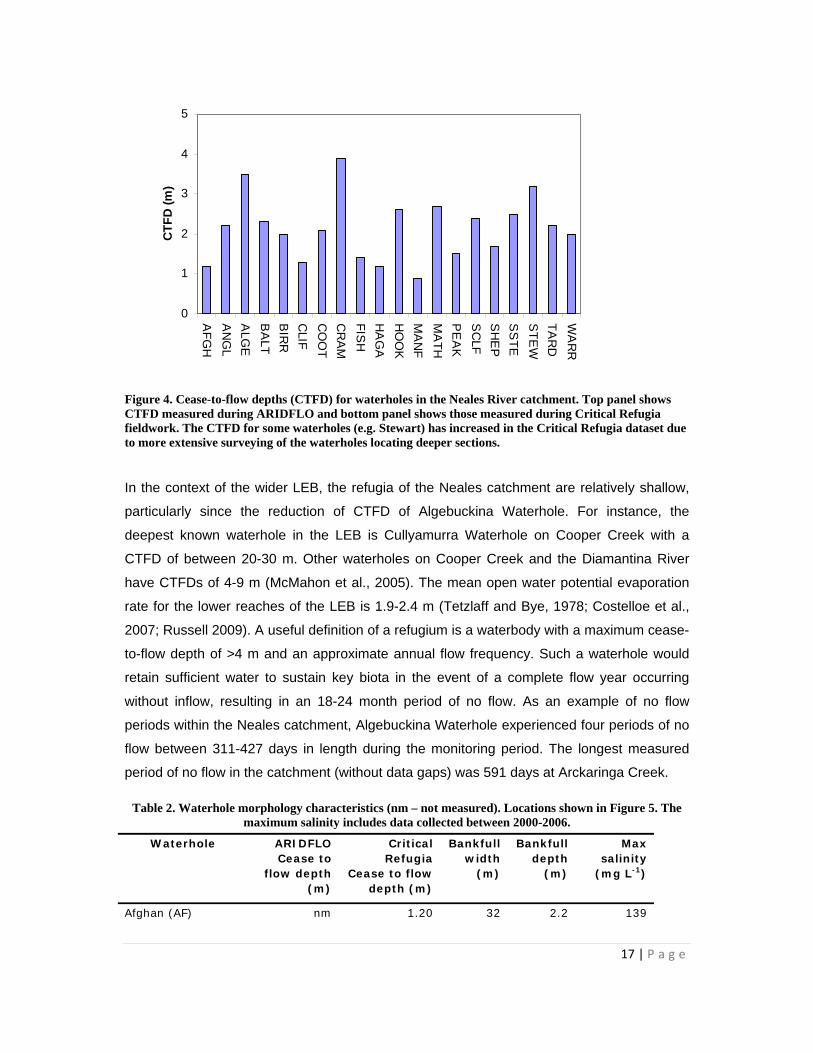
Figure 4. Cease-to-flow depths (CTFD) for waterholes in the Neales River catchment. Top panel shows CTFD measured during ARIDFLO and bottom panel shows those measured during Critical Refugia fieldwork. The CTFD for some waterholes (e.g. Stewart) has increased in the Critical Refugia dataset due to more extensive surveying of the waterholes locating deeper sections.
In the context of the wider LEB, the refugia of the Neales catchment are relatively shallow,
particularly since the reduction of CTFD of Algebuckina Waterhole. For instance, the
deepest known waterhole in the LEB is Cullyamurra Waterhole on Cooper Creek with a
CTFD of between 20-30 m. Other waterholes on Cooper Creek and the Diamantina River
have CTFDs of 4-9 m (McMahon et al., 2005). The mean open water potential evaporation
rate for the lower reaches of the LEB is 1.9-2.4 m (Tetzlaff and Bye, 1978; Costelloe et al.,
2007; Russell 2009). A useful definition of a refugium is a waterbody with a maximum cease-
to-flow depth of >4 m and an approximate annual flow frequency. Such a waterhole would
retain sufficient water to sustain key biota in the event of a complete flow year occurring
without inflow, resulting in an 18-24 month period of no flow. As an example of no flow
periods within the Neales catchment, Algebuckina Waterhole experienced four periods of no
flow between 311-427 days in length during the monitoring period. The longest measured
period of no flow in the catchment (without data gaps) was 591 days at Arckaringa Creek.
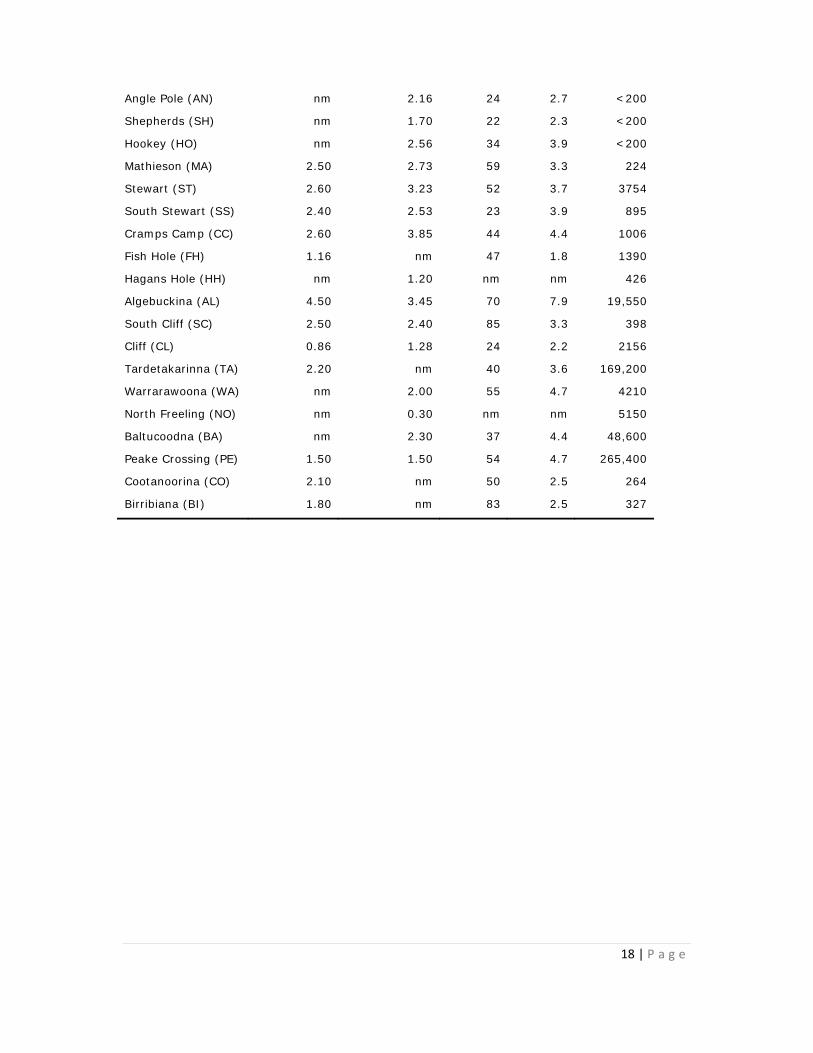
Table 2. Waterhole morphology characteristics (nm – not measured). Locations shown in Figure 5. The maximum salinity includes data collected between 2000-2006.
Waterhole ARIDFLO Cease to
flow depth (m)
Critical Refugia
Cease to flow depth (m)
Bankfull width
(m)
Bankfull depth
(m)
Max salinity
(mg L-1)
Afghan (AF) nm 1.20 32 2.2 139
18 | P a g e
Angle Pole (AN) nm 2.16 24 2.7 <200
Shepherds (SH) nm 1.70 22 2.3 <200
Hookey (HO) nm 2.56 34 3.9 <200
Mathieson (MA) 2.50 2.73 59 3.3 224
Stewart (ST) 2.60 3.23 52 3.7 3754
South Stewart (SS) 2.40 2.53 23 3.9 895
Cramps Camp (CC) 2.60 3.85 44 4.4 1006
Fish Hole (FH) 1.16 nm 47 1.8 1390
Hagans Hole (HH) nm 1.20 nm nm 426
Algebuckina (AL) 4.50 3.45 70 7.9 19,550
South Cliff (SC) 2.50 2.40 85 3.3 398
Cliff (CL) 0.86 1.28 24 2.2 2156
Tardetakarinna (TA) 2.20 nm 40 3.6 169,200
Warrarawoona (WA) nm 2.00 55 4.7 4210
North Freeling (NO) nm 0.30 nm nm 5150
Baltucoodna (BA) nm 2.30 37 4.4 48,600
Peake Crossing (PE) 1.50 1.50 54 4.7 265,400
Cootanoorina (CO) 2.10 nm 50 2.5 264
Birribiana (BI) 1.80 nm 83 2.5 327
19 | P a g e
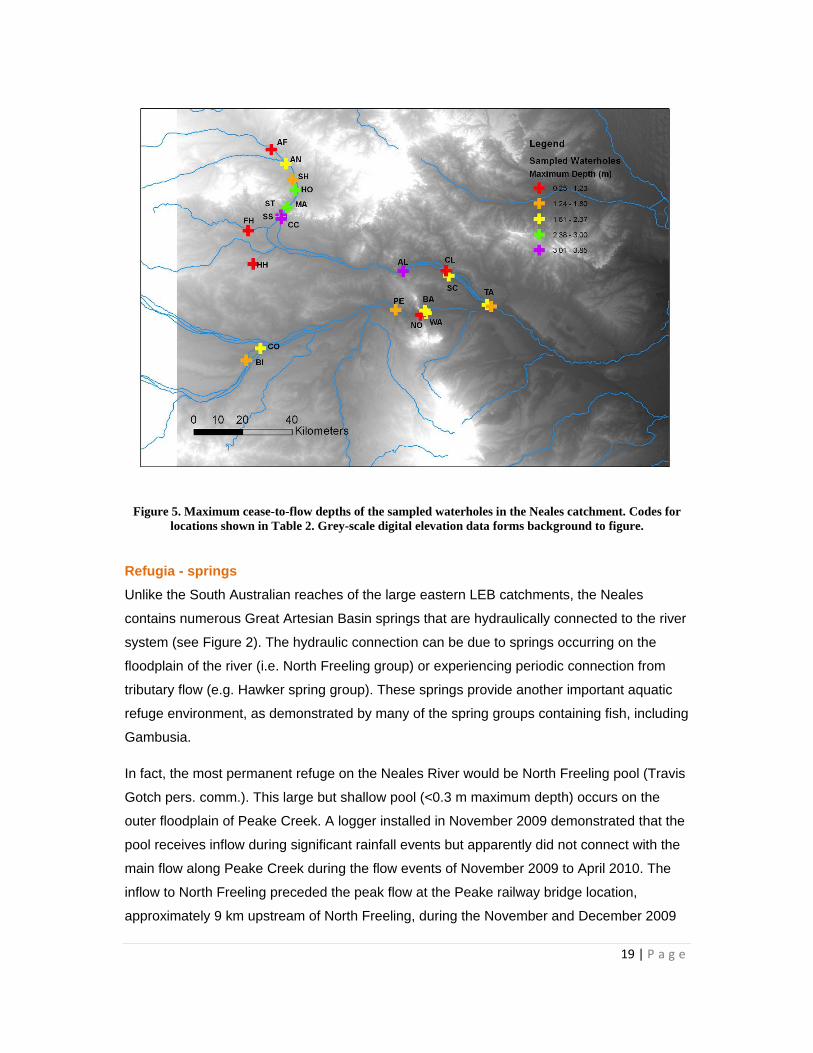
Figure 5. Maximum cease-to-flow depths of the sampled waterholes in the Neales catchment. Codes for locations shown in Table 2. Grey-scale digital elevation data forms background to figure.
Refugia - springs
Unlike the South Australian reaches of the large eastern LEB catchments, the Neales
contains numerous Great Artesian Basin springs that are hydraulically connected to the river
system (see Figure 2). The hydraulic connection can be due to springs occurring on the
floodplain of the river (i.e. North Freeling group) or experiencing periodic connection from
tributary flow (e.g. Hawker spring group). These springs provide another important aquatic
refuge environment, as demonstrated by many of the spring groups containing fish, including
Gambusia.
In fact, the most permanent refuge on the Neales River would be North Freeling pool (Travis
Gotch pers. comm.). This large but shallow pool (<0.3 m maximum depth) occurs on the
outer floodplain of Peake Creek. A logger installed in November 2009 demonstrated that the
pool receives inflow during significant rainfall events but apparently did not connect with the
main flow along Peake Creek during the flow events of November 2009 to April 2010. The
inflow to North Freeling preceded the peak flow at the Peake railway bridge location,
approximately 9 km upstream of North Freeling, during the November and December 2009
20 | P a g e
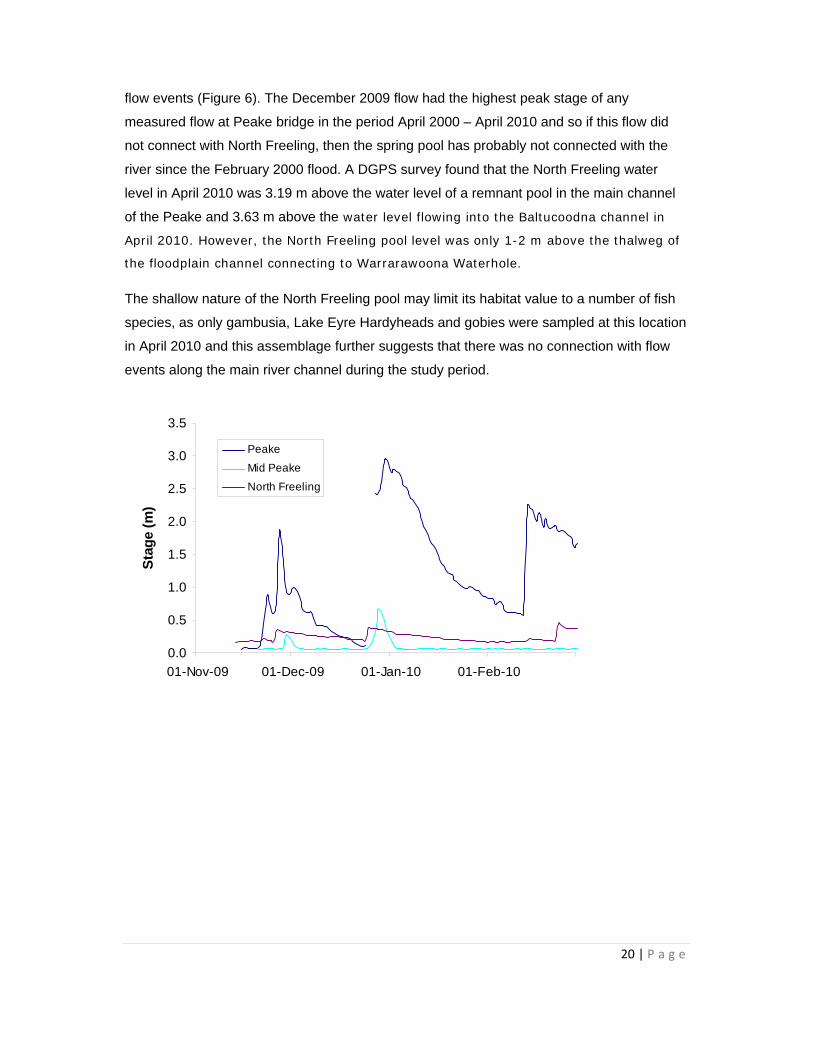
flow events (Figure 6). The December 2009 flow had the highest peak stage of any
measured flow at Peake bridge in the period April 2000 – April 2010 and so if this flow did
not connect with North Freeling, then the spring pool has probably not connected with the
river since the February 2000 flood. A DGPS survey found that the North Freeling water
level in April 2010 was 3.19 m above the water level of a remnant pool in the main channel
of the Peake and 3.63 m above the water level flowing into the Baltucoodna channel in
April 2010. However, the North Freeling pool level was only 1-2 m above the thalweg of
the floodplain channel connecting to Warrarawoona Waterhole.
The shallow nature of the North Freeling pool may limit its habitat value to a number of fish
species, as only gambusia, Lake Eyre Hardyheads and gobies were sampled at this location
in April 2010 and this assemblage further suggests that there was no connection with flow
events along the main river channel during the study period.
0.0
0.5
1.0
1.5
2.0
2.5
3.0
3.5
01-Nov-09 01-Dec-09 01-Jan-10 01-Feb-10
Sta
ge
(m)
Peake
Mid Peake
North Freeling
21 | P a g e
Peake
0.0
0.5
1.0
1.5
2.0
2.5
3.0
3.5
01-Apr-00
01-Apr-01
01-Apr-02
01-Apr-03
01-Apr-04
01-Apr-05
01-Apr-06
01-Apr-07
01-Apr-08
01-Apr-09
01-Apr-10
Sta
ge
(m
)
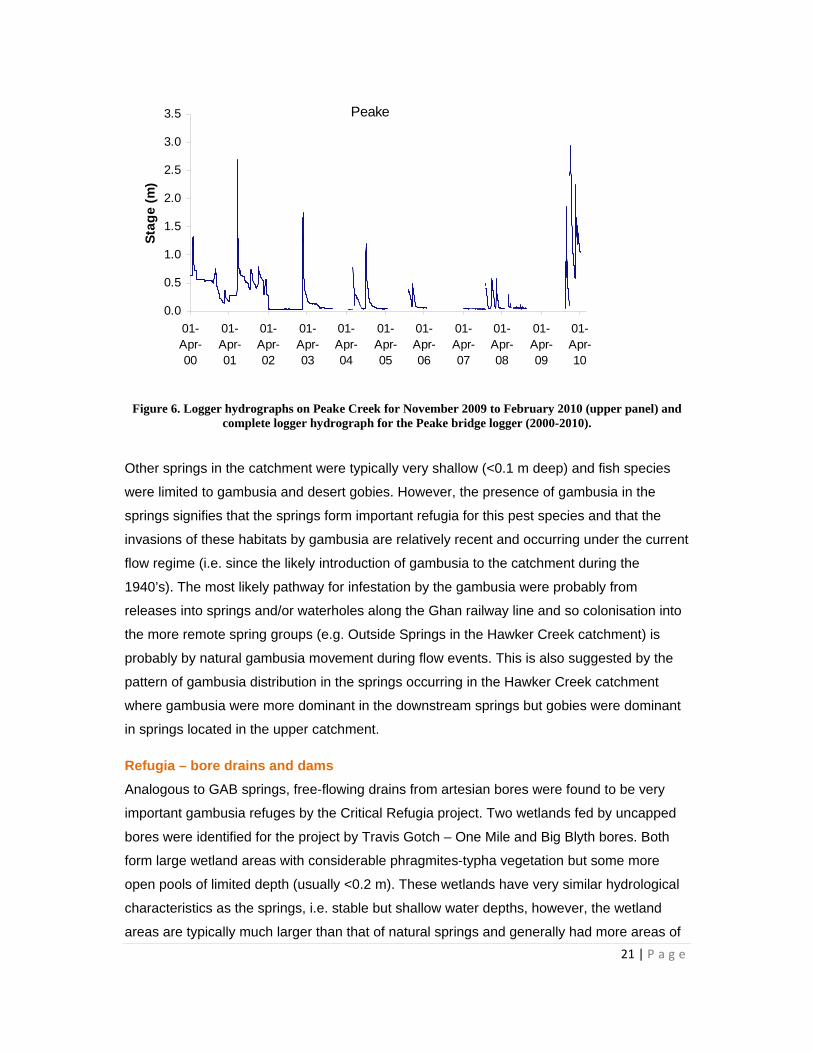
Figure 6. Logger hydrographs on Peake Creek for November 2009 to February 2010 (upper panel) and complete logger hydrograph for the Peake bridge logger (2000-2010).
Other springs in the catchment were typically very shallow (<0.1 m deep) and fish species
were limited to gambusia and desert gobies. However, the presence of gambusia in the
springs signifies that the springs form important refugia for this pest species and that the
invasions of these habitats by gambusia are relatively recent and occurring under the current
flow regime (i.e. since the likely introduction of gambusia to the catchment during the
1940’s). The most likely pathway for infestation by the gambusia were probably from
releases into springs and/or waterholes along the Ghan railway line and so colonisation into
the more remote spring groups (e.g. Outside Springs in the Hawker Creek catchment) is
probably by natural gambusia movement during flow events. This is also suggested by the
pattern of gambusia distribution in the springs occurring in the Hawker Creek catchment
where gambusia were more dominant in the downstream springs but gobies were dominant
in springs located in the upper catchment.
Refugia – bore drains and dams
Analogous to GAB springs, free-flowing drains from artesian bores were found to be very
important gambusia refuges by the Critical Refugia project. Two wetlands fed by uncapped
bores were identified for the project by Travis Gotch – One Mile and Big Blyth bores. Both
form large wetland areas with considerable phragmites-typha vegetation but some more
open pools of limited depth (usually <0.2 m). These wetlands have very similar hydrological
characteristics as the springs, i.e. stable but shallow water depths, however, the wetland
areas are typically much larger than that of natural springs and generally had more areas of
22 | P a g e
open water. Big Blyth bore occurs close to the outer edge of the Peake floodplain and bore
tails that drain onto the floodplain may connect during large flood events. For instance, the
end of the Big Blyth bore tail with open water in April 2010 was around 1.7 m above the
base of the Peake Channel and this would take a large flood to connect, particularly
given the very flat nature of the Peake floodplain in this reach. Of course, increased bore
tail flow with local rainfall could also enhance the connectivity with the Peake channel
and floodplain, particularly as the bore drain tails connect with drainage channels that
are probably part of Big Blyth Creek. One Mile bore occurs on an upper, small tributary
of Nilpinna Creek (a large tributary of Peake Creek) and would possibly connect less
frequently with flow in the main river system.
Dams are occasionally situated on the outer floodplain of the Neales and Peake Rivers.
These typically capture some flow from outer floodplain channels and also from local runoff
from gibber plains. Two of these were surveyed (Slate Hole – upper Neales, Eaglehawk
Dam – lower Neales). Their depths were 3.1-3.8 m in April 2010 after recent filling, making
them important fluvial refuges. Both dams had large abundances of a number of fish
species, demonstrating their connectivity with the river system.
Waterhole persistence - introduction
The persistence of a waterhole between flow events is the major differentiating feature of
refugia. Persistence can be a function of groundwater discharge maintaining the water level
or depth of the waterhole being great enough to exceed evaporative demand between flow
events. A third factor is the frequency of surface inflow, such that a moderately shallow
waterhole shows refugial-type persistence because it receives surface inflow more often
than other parts of the catchment. The factors controlling the persistence of a waterhole also
have a major bearing on the water quality, particularly salinity, of a refuge and this is
discussed further below. In terms of identifying the controls on persistence, a range of data
are required to characterise the waterhole behaviour;
Morphological survey to determine depth of waterhole at the cease-to-flow stage.
Information on inflow events – observed time-series of stage data is best but also can use modelled discharges. Time series of stage data can also be used in conjunction with evaporation modelling to identify if groundwater discharge is significantly contributing to persistence.
Time series of observed water salinities to identify water salinity behaviour.
The two main types of refugia can be considered as surface-fed refugia and groundwater-fed
refugia. The surface-fed refugia encompass deep waterholes and those with moderate depth
23 | P a g e
and frequent inflow but do not receive any significant groundwater discharge. The
groundwater-fed refugia encompass waterholes that receive surface inflow and significant
contribution from the unconfined groundwater table, and those that receive artesian
groundwater discharge and are less/not reliant on surface inflow.
Waterhole persistence: surface-fed
Surface-fed refugial waterholes are typically deeper than most other fluvial waterholes and
residual pools in the river system and remain relatively fresh (i.e. <5000 mgL-1 TDS). This
latter characteristic is not always diagnostic as Algebuckina Waterhole has been observed at
salinities up to approximately 20,000 mgL-1 TDS as a result of inflow of very saline surface
flow during the flow recession of large floods (Costelloe et al., 2005b).
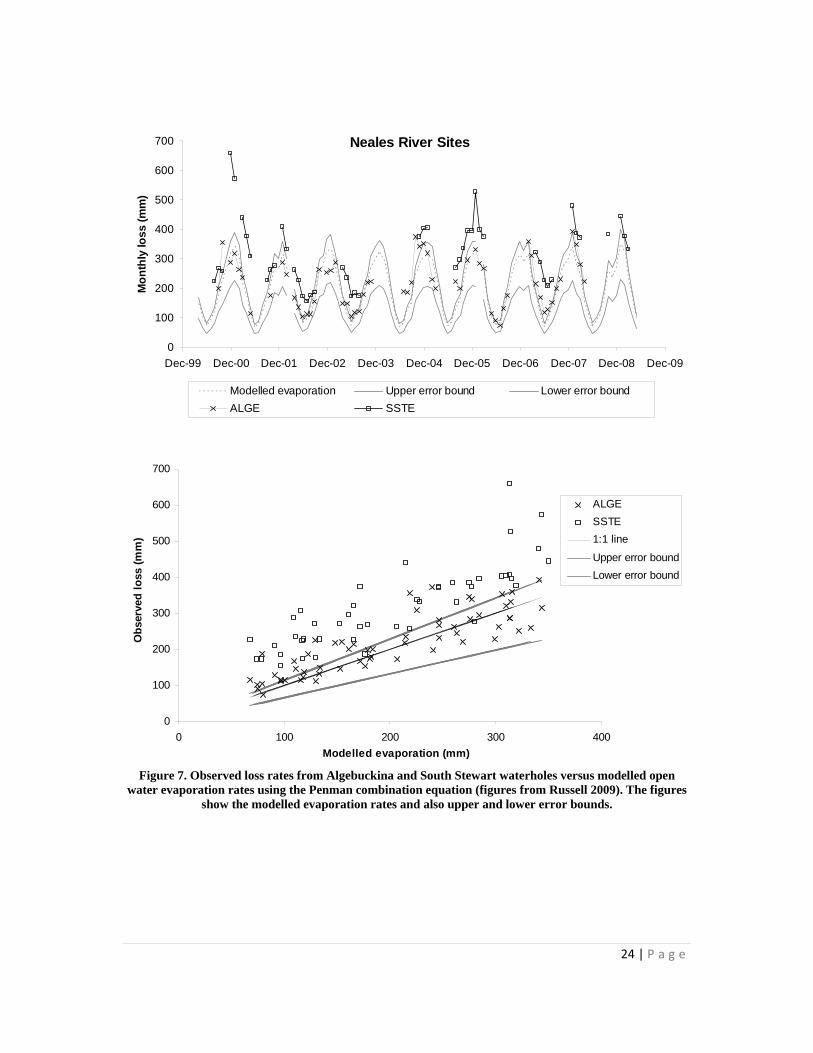
Drawdown rates for the period 2000-2008 from two instrumented waterholes in the Neales
catchment (Algebuckina and South Stewart, see Figure 5) were analysed as part of a
student research project (Russell 2009) that extended an earlier study by Costelloe et al.
(2007). This analysis (Figure 7) confirmed that Algebuckina Waterhole largely loses water at
the potential evapotranspiration (ET) rate and shows that there is no measurable
groundwater discharge into the waterhole. South Stewart experiences drawdown rates
higher than the potential ET rates, indicating that it is a ‘leaky’ waterhole (discussed below)
and has deeper groundwater levels than at Algebuckina.
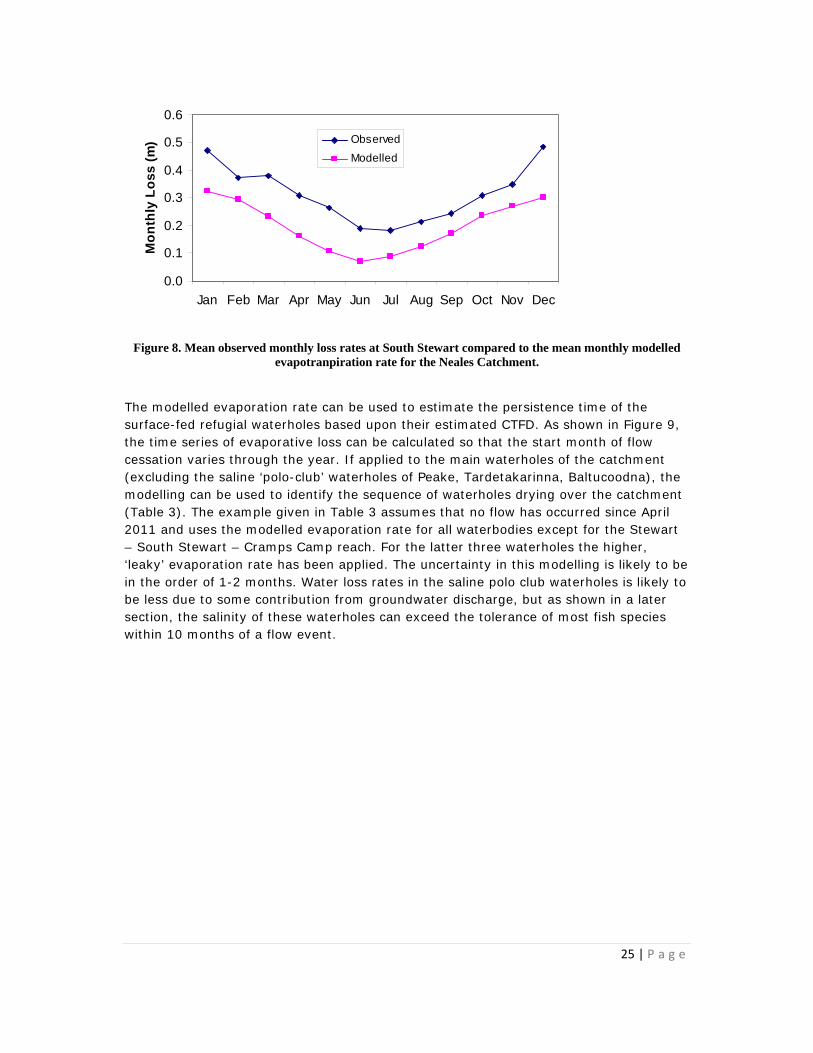
The mean monthly observed loss rates for South Stewart are plotted in Figure 8 along with
the mean modelled ET rates. The South Stewart data show a similar pattern to the modelled
ET rates but with a relatively consistent offset. This suggests that the observed loss rates
are driven by ET losses in conjunction with a relatively consistent constant loss rate from
leakage to the groundwater (although this ‘constant’ rate will vary with the depth of water in
the waterhole). The South Stewart waterhole is within a few hundred meters of Cramps
Camp waterhole and a few kilometres downstream of Stewarts Waterhole. Periodic
observations of water levels at Stewarts and Cramps Camp waterholes suggest that they
may lose water at a rate faster than the modelled ET rate. For instance, Stewarts Waterhole
consisted of a couple of pools of <0.2 m depth in April 2004 when the modelled ET loss rate
suggested that it should have a depth of approximately 0.7 m. Therefore, it is probable that
Stewarts and Cramps Camp experience loss rates similar to those of South Stewart, which
are, on average, 1.4 m greater per year than the modelled ET rates that fit the Algebuckina
data. This possible difference is extremely significant when considering the refugia value of
Cramps Camp and Stewarts Waterholes and suggests that Algebuckina is still the most
important refugium in the catchment despite the observed reduction in its CTFD.
24 | P a g e
Neales River Sites
0
100
200
300
400
500
600
700
Dec-99 Dec-00 Dec-01 Dec-02 Dec-03 Dec-04 Dec-05 Dec-06 Dec-07 Dec-08 Dec-09
Mo
nth
ly lo
ss
(m
m)
Modelled evaporation Upper error bound Lower error bound
ALGE SSTE
0
100
200
300
400
500
600
700
0 100 200 300 400
Modelled evaporation (mm)
Ob
serv
ed l
oss
(m
m)
ALGE
SSTE
1:1 line
Upper error bound
Lower error bound
Figure 7. Observed loss rates from Algebuckina and South Stewart waterholes versus modelled open
water evaporation rates using the Penman combination equation (figures from Russell 2009). The figures show the modelled evaporation rates and also upper and lower error bounds.
25 | P a g e
0.0
0.1
0.2
0.3
0.4
0.5
0.6
Jan Feb Mar Apr May Jun Jul Aug Sep Oct Nov Dec
Mo
nth
ly L
os
s (
m) Observed
Modelled
Figure 8. Mean observed monthly loss rates at South Stewart compared to the mean monthly modelled evapotranpiration rate for the Neales Catchment.
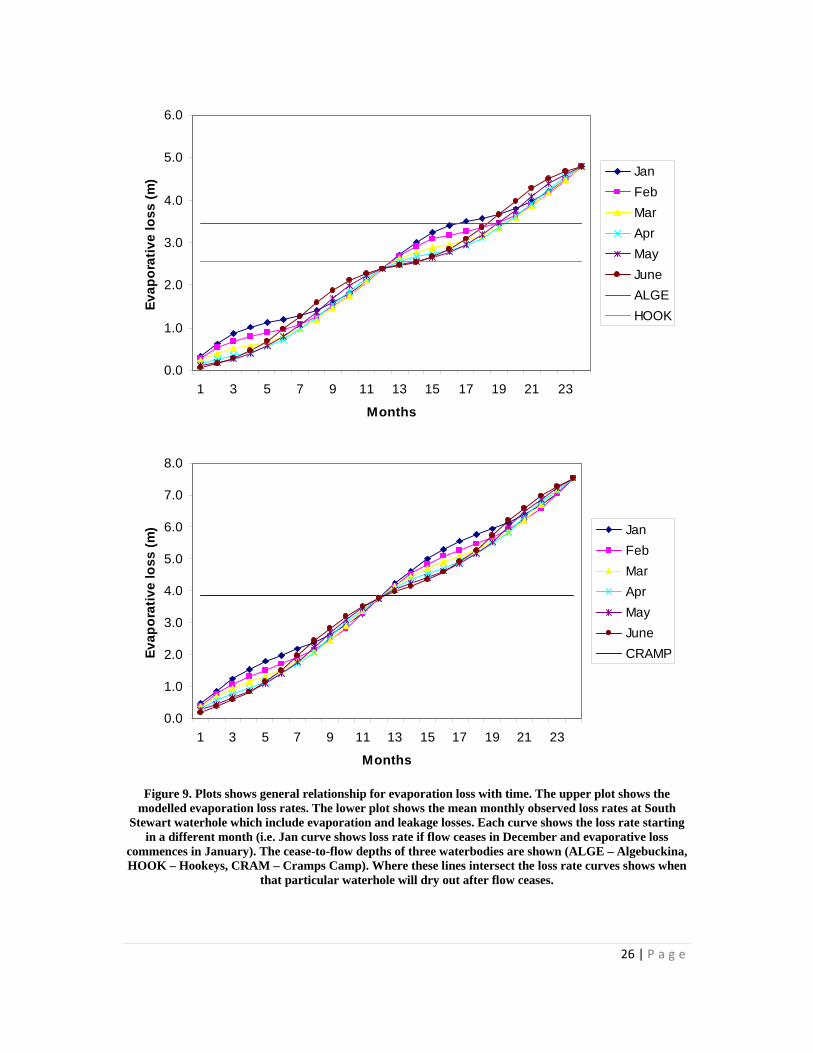
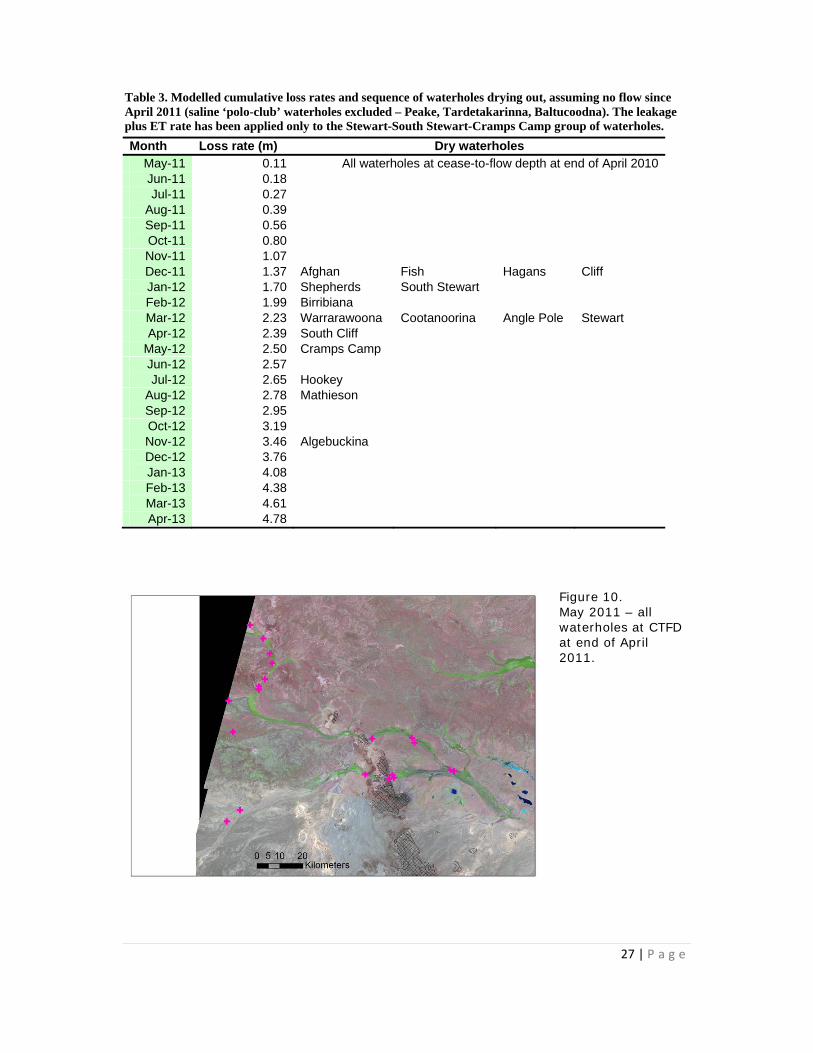
The modelled evaporation rate can be used to estimate the persistence time of the surface-fed refugial waterholes based upon their estimated CTFD. As shown in Figure 9, the time series of evaporative loss can be calculated so that the start month of flow cessation varies through the year. If applied to the main waterholes of the catchment (excluding the saline ‘polo-club’ waterholes of Peake, Tardetakarinna, Baltucoodna), the modelling can be used to identify the sequence of waterholes drying over the catchment (Table 3). The example given in Table 3 assumes that no flow has occurred since April 2011 and uses the modelled evaporation rate for all waterbodies except for the Stewart – South Stewart – Cramps Camp reach. For the latter three waterholes the higher, ‘leaky’ evaporation rate has been applied. The uncertainty in this modelling is likely to be in the order of 1-2 months. Water loss rates in the saline polo club waterholes is likely to be less due to some contribution from groundwater discharge, but as shown in a later section, the salinity of these waterholes can exceed the tolerance of most fish species within 10 months of a flow event.
26 | P a g e
0.0
1.0
2.0
3.0
4.0
5.0
6.0
1 3 5 7 9 11 13 15 17 19 21 23
Months
Ev
ap
ora
tiv
e l
os
s (
m)
Jan
Feb
Mar
Apr
May
June
ALGE
HOOK
0.0
1.0
2.0
3.0
4.0
5.0
6.0
7.0
8.0
1 3 5 7 9 11 13 15 17 19 21 23
Months
Ev
ap
ora
tiv
e l
os
s (
m) Jan
Feb
Mar
Apr
May
June
CRAMP
Figure 9. Plots shows general relationship for evaporation loss with time. The upper plot shows the
modelled evaporation loss rates. The lower plot shows the mean monthly observed loss rates at South Stewart waterhole which include evaporation and leakage losses. Each curve shows the loss rate starting
in a different month (i.e. Jan curve shows loss rate if flow ceases in December and evaporative loss commences in January). The cease-to-flow depths of three waterbodies are shown (ALGE – Algebuckina, HOOK – Hookeys, CRAM – Cramps Camp). Where these lines intersect the loss rate curves shows when
that particular waterhole will dry out after flow ceases.
27 | P a g e
Table 3. Modelled cumulative loss rates and sequence of waterholes drying out, assuming no flow since April 2011 (saline ‘polo-club’ waterholes excluded – Peake, Tardetakarinna, Baltucoodna). The leakage plus ET rate has been applied only to the Stewart-South Stewart-Cramps Camp group of waterholes.
Month Loss rate (m) Dry waterholesMay-11 0.11 All waterholes at cease-to-flow depth at end of April 2010Jun-11 0.18 Jul-11 0.27
Aug-11 0.39 Sep-11 0.56 Oct-11 0.80 Nov-11 1.07 Dec-11 1.37 Afghan Fish Hagans Cliff Jan-12 1.70 Shepherds South Stewart Feb-12 1.99 Birribiana Mar-12 2.23 Warrarawoona Cootanoorina Angle Pole Stewart Apr-12 2.39 South Cliff
May-12 2.50 Cramps Camp Jun-12 2.57 Jul-12 2.65 Hookey
Aug-12 2.78 Mathieson Sep-12 2.95 Oct-12 3.19 Nov-12 3.46 Algebuckina Dec-12 3.76 Jan-13 4.08 Feb-13 4.38 Mar-13 4.61 Apr-13 4.78
Figure 10. May 2011 – all waterholes at CTFD at end of April 2011.
28 | P a g e
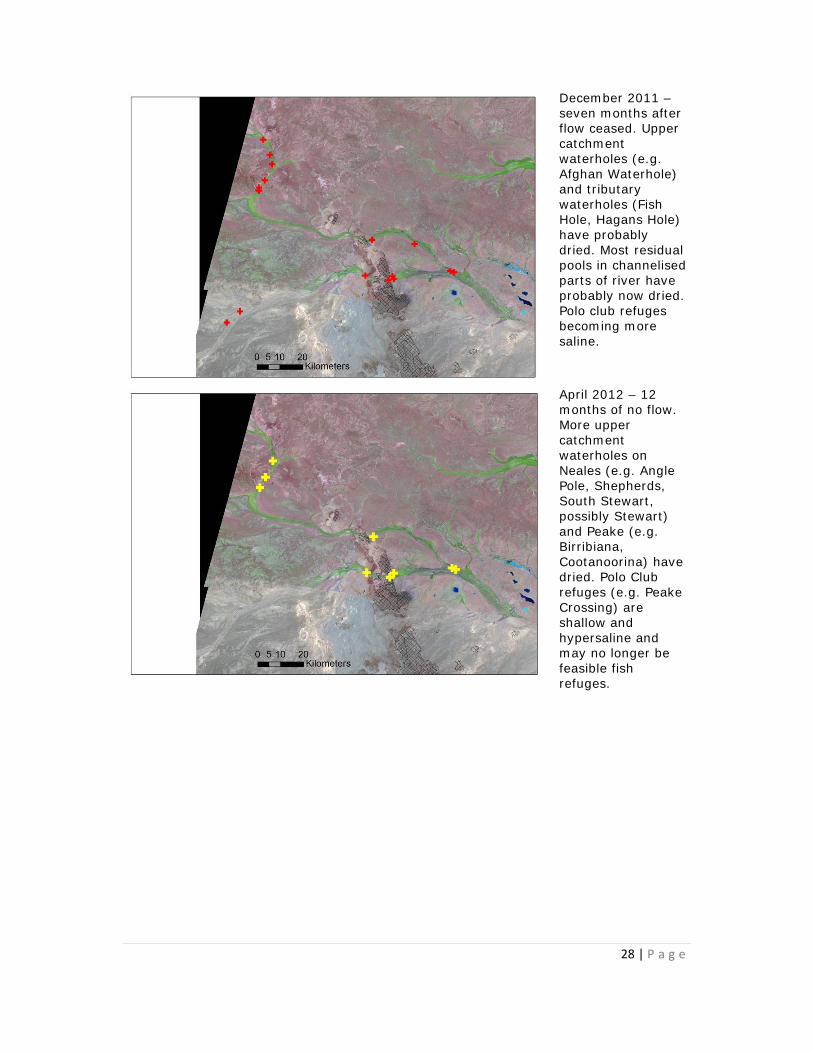
December 2011 – seven months after flow ceased. Upper catchment waterholes (e.g. Afghan Waterhole) and tributary waterholes (Fish Hole, Hagans Hole) have probably dried. Most residual pools in channelised parts of river have probably now dried. Polo club refuges becoming more saline.
April 2012 – 12 months of no flow. More upper catchment waterholes on Neales (e.g. Angle Pole, Shepherds, South Stewart, possibly Stewart) and Peake (e.g. Birribiana, Cootanoorina) have dried. Polo Club refuges (e.g. Peake Crossing) are shallow and hypersaline and may no longer be feasible fish refuges.
29 | P a g e
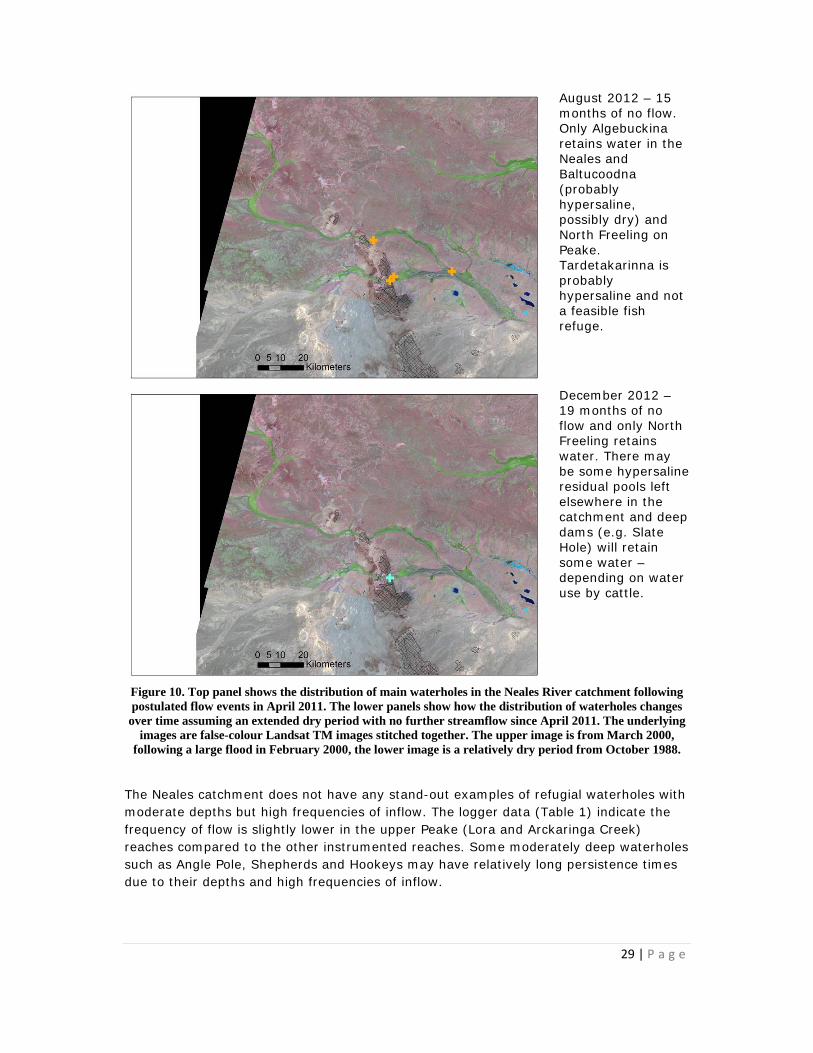
August 2012 – 15 months of no flow. Only Algebuckina retains water in the Neales and Baltucoodna (probably hypersaline, possibly dry) and North Freeling on Peake. Tardetakarinna is probably hypersaline and not a feasible fish refuge.
December 2012 – 19 months of no flow and only North Freeling retains water. There may be some hypersaline residual pools left elsewhere in the catchment and deep dams (e.g. Slate Hole) will retain some water – depending on water use by cattle.
Figure 10. Top panel shows the distribution of main waterholes in the Neales River catchment following postulated flow events in April 2011. The lower panels show how the distribution of waterholes changes
over time assuming an extended dry period with no further streamflow since April 2011. The underlying images are false-colour Landsat TM images stitched together. The upper image is from March 2000,
following a large flood in February 2000, the lower image is a relatively dry period from October 1988.
The Neales catchment does not have any stand-out examples of refugial waterholes with moderate depths but high frequencies of inflow. The logger data (Table 1) indicate the frequency of flow is slightly lower in the upper Peake (Lora and Arckaringa Creek) reaches compared to the other instrumented reaches. Some moderately deep waterholes such as Angle Pole, Shepherds and Hookeys may have relatively long persistence times due to their depths and high frequencies of inflow.
30 | P a g e
Waterhole persistence: groundwater-fed
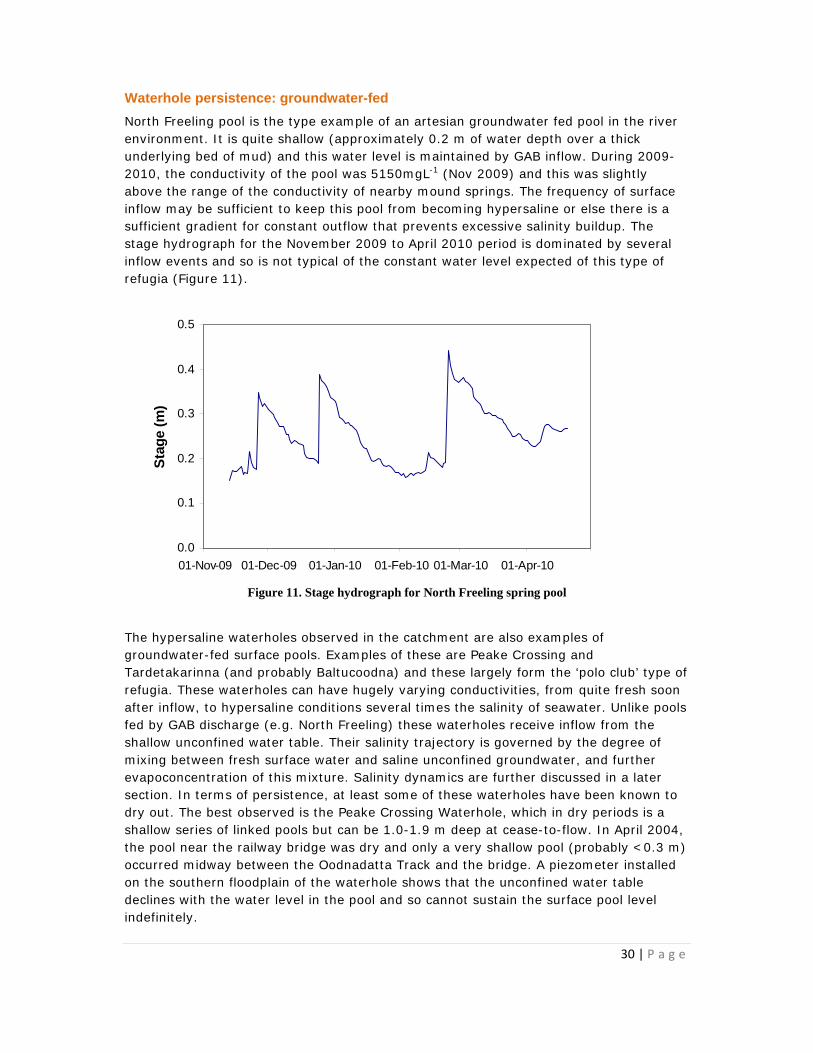
North Freeling pool is the type example of an artesian groundwater fed pool in the river environment. It is quite shallow (approximately 0.2 m of water depth over a thick underlying bed of mud) and this water level is maintained by GAB inflow. During 2009-2010, the conductivity of the pool was 5150mgL-1 (Nov 2009) and this was slightly above the range of the conductivity of nearby mound springs. The frequency of surface inflow may be sufficient to keep this pool from becoming hypersaline or else there is a sufficient gradient for constant outflow that prevents excessive salinity buildup. The stage hydrograph for the November 2009 to April 2010 period is dominated by several inflow events and so is not typical of the constant water level expected of this type of refugia (Figure 11).
0.0
0.1
0.2
0.3
0.4
0.5
01-Nov-09 01-Dec-09 01-Jan-10 01-Feb-10 01-Mar-10 01-Apr-10
Sta
ge
(m)
Figure 11. Stage hydrograph for North Freeling spring pool
The hypersaline waterholes observed in the catchment are also examples of groundwater-fed surface pools. Examples of these are Peake Crossing and Tardetakarinna (and probably Baltucoodna) and these largely form the ‘polo club’ type of refugia. These waterholes can have hugely varying conductivities, from quite fresh soon after inflow, to hypersaline conditions several times the salinity of seawater. Unlike pools fed by GAB discharge (e.g. North Freeling) these waterholes receive inflow from the shallow unconfined water table. Their salinity trajectory is governed by the degree of mixing between fresh surface water and saline unconfined groundwater, and further evapoconcentration of this mixture. Salinity dynamics are further discussed in a later section. In terms of persistence, at least some of these waterholes have been known to dry out. The best observed is the Peake Crossing Waterhole, which in dry periods is a shallow series of linked pools but can be 1.0-1.9 m deep at cease-to-flow. In April 2004, the pool near the railway bridge was dry and only a very shallow pool (probably <0.3 m) occurred midway between the Oodnadatta Track and the bridge. A piezometer installed on the southern floodplain of the waterhole shows that the unconfined water table declines with the water level in the pool and so cannot sustain the surface pool level indefinitely.
31 | P a g e
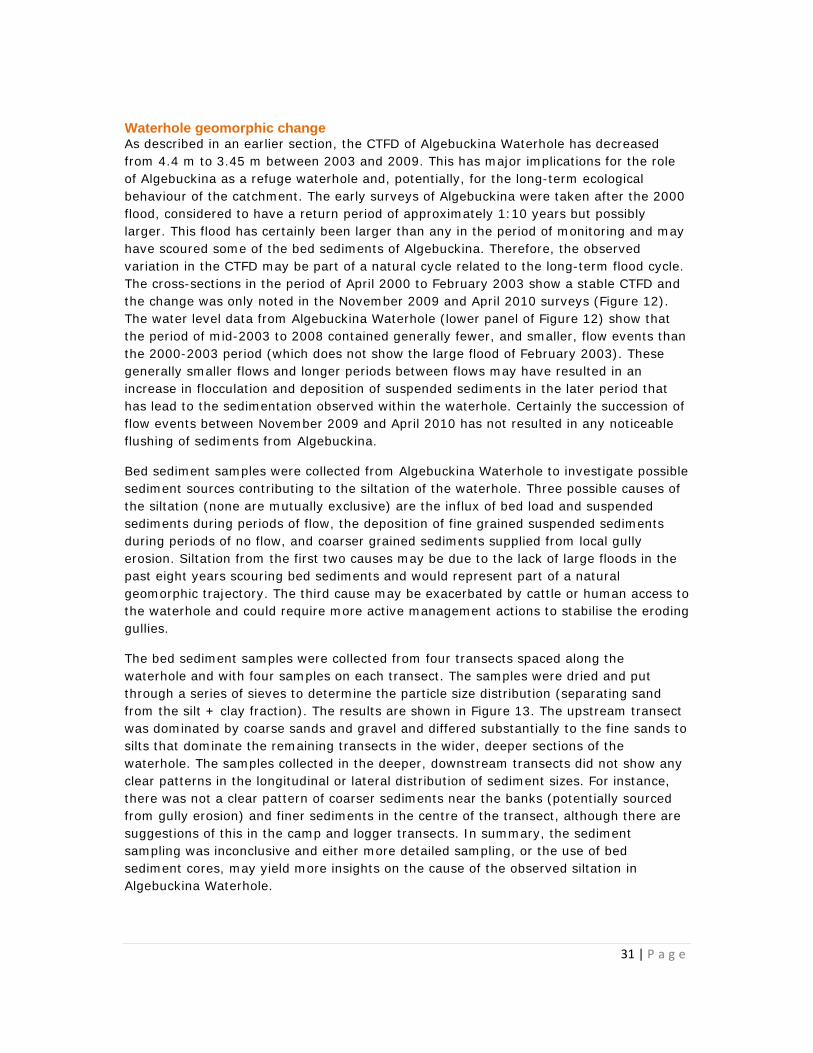
Waterhole geomorphic change As described in an earlier section, the CTFD of Algebuckina Waterhole has decreased from 4.4 m to 3.45 m between 2003 and 2009. This has major implications for the role of Algebuckina as a refuge waterhole and, potentially, for the long-term ecological behaviour of the catchment. The early surveys of Algebuckina were taken after the 2000 flood, considered to have a return period of approximately 1:10 years but possibly larger. This flood has certainly been larger than any in the period of monitoring and may have scoured some of the bed sediments of Algebuckina. Therefore, the observed variation in the CTFD may be part of a natural cycle related to the long-term flood cycle. The cross-sections in the period of April 2000 to February 2003 show a stable CTFD and the change was only noted in the November 2009 and April 2010 surveys (Figure 12). The water level data from Algebuckina Waterhole (lower panel of Figure 12) show that the period of mid-2003 to 2008 contained generally fewer, and smaller, flow events than the 2000-2003 period (which does not show the large flood of February 2003). These generally smaller flows and longer periods between flows may have resulted in an increase in flocculation and deposition of suspended sediments in the later period that has lead to the sedimentation observed within the waterhole. Certainly the succession of flow events between November 2009 and April 2010 has not resulted in any noticeable flushing of sediments from Algebuckina.
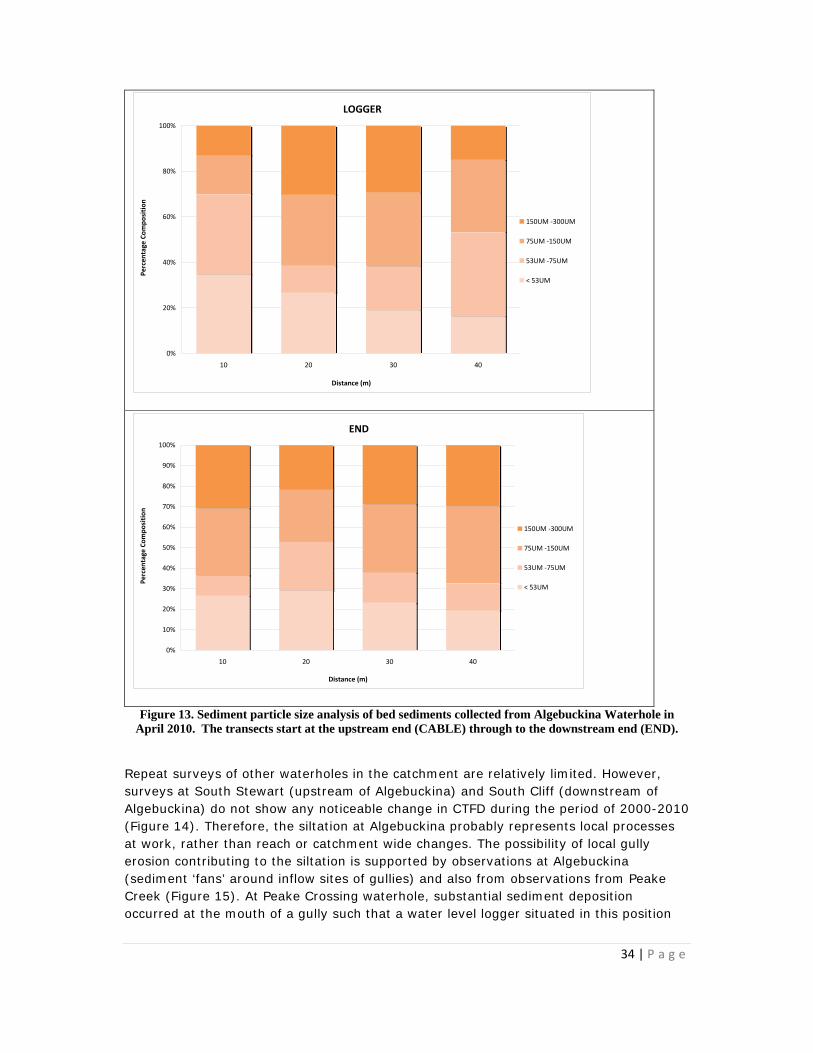
Bed sediment samples were collected from Algebuckina Waterhole to investigate possible sediment sources contributing to the siltation of the waterhole. Three possible causes of the siltation (none are mutually exclusive) are the influx of bed load and suspended sediments during periods of flow, the deposition of fine grained suspended sediments during periods of no flow, and coarser grained sediments supplied from local gully erosion. Siltation from the first two causes may be due to the lack of large floods in the past eight years scouring bed sediments and would represent part of a natural geomorphic trajectory. The third cause may be exacerbated by cattle or human access to the waterhole and could require more active management actions to stabilise the eroding gullies.
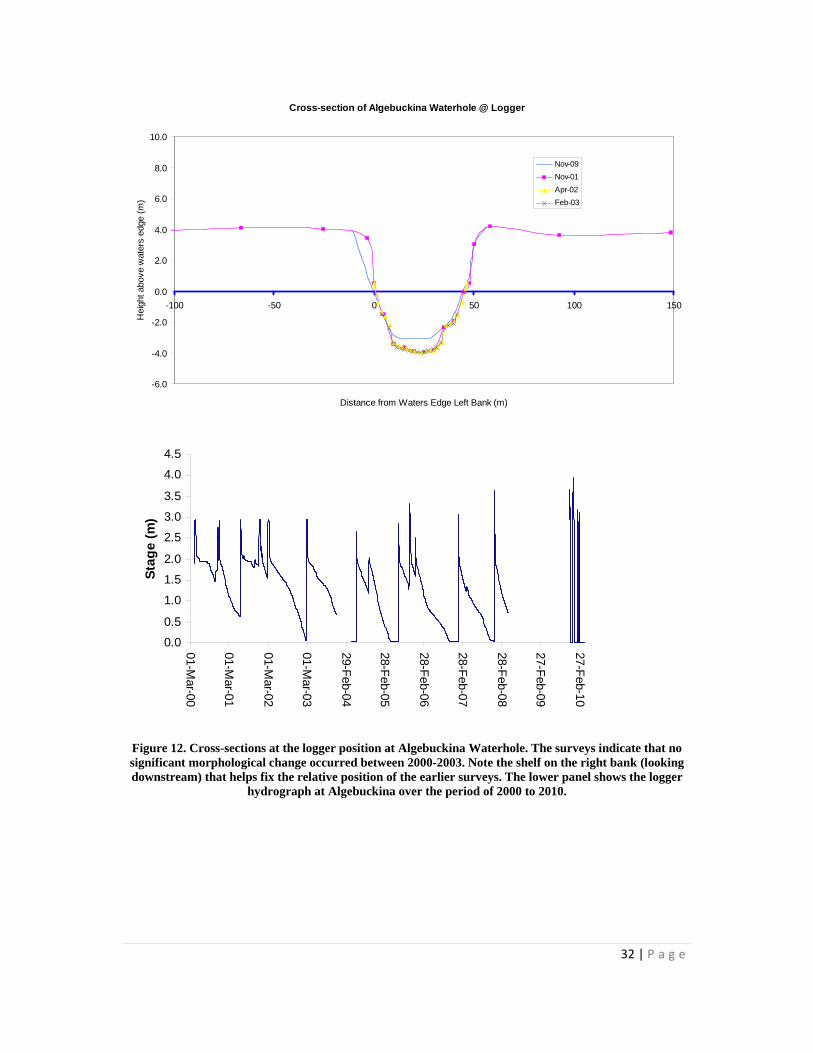
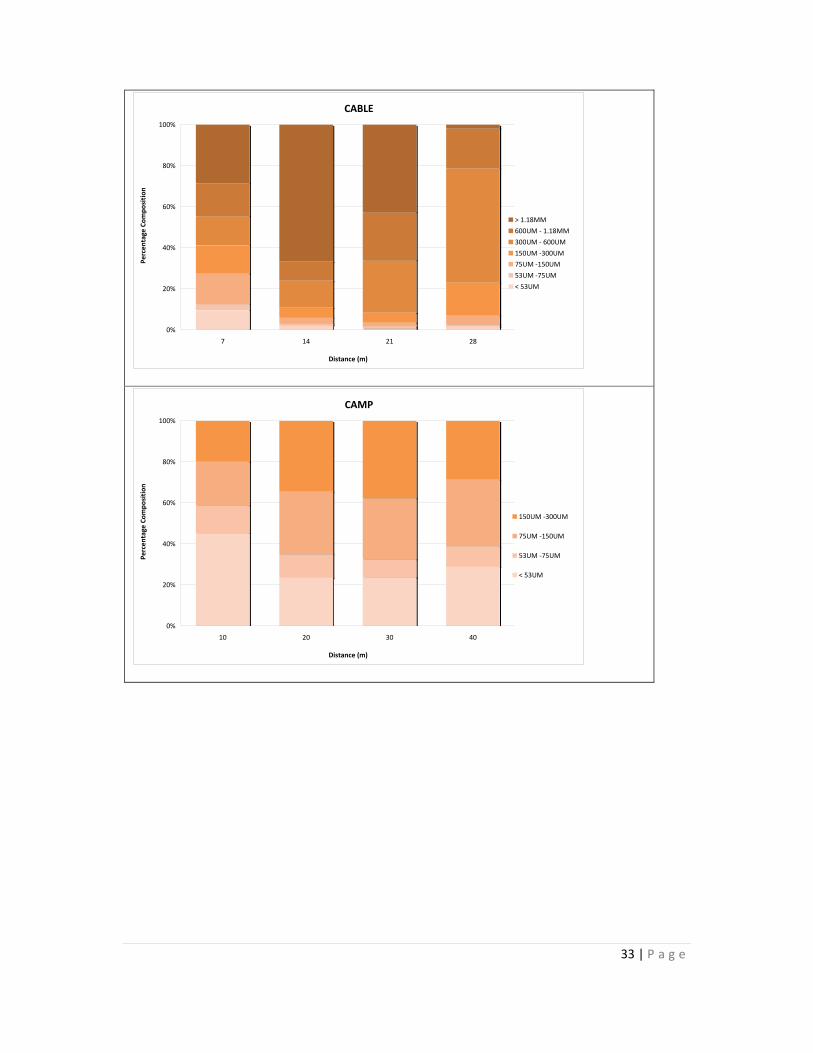
The bed sediment samples were collected from four transects spaced along the waterhole and with four samples on each transect. The samples were dried and put through a series of sieves to determine the particle size distribution (separating sand from the silt + clay fraction). The results are shown in Figure 13. The upstream transect was dominated by coarse sands and gravel and differed substantially to the fine sands to silts that dominate the remaining transects in the wider, deeper sections of the waterhole. The samples collected in the deeper, downstream transects did not show any clear patterns in the longitudinal or lateral distribution of sediment sizes. For instance, there was not a clear pattern of coarser sediments near the banks (potentially sourced from gully erosion) and finer sediments in the centre of the transect, although there are suggestions of this in the camp and logger transects. In summary, the sediment sampling was inconclusive and either more detailed sampling, or the use of bed sediment cores, may yield more insights on the cause of the observed siltation in Algebuckina Waterhole.
32 | P a g e
Cross-section of Algebuckina Waterhole @ Logger
-6.0
-4.0
-2.0
0.0
2.0
4.0
6.0
8.0
10.0
-100 -50 0 50 100 150
Distance from Waters Edge Left Bank (m)
Hei
ght a
bove
wat
ers
edge
(m
)
Nov-09
Nov-01
Apr-02
Feb-03
0.0
0.5
1.0
1.5
2.0
2.5
3.0
3.5
4.0
4.5
01-Mar-00
01-Mar-01
01-Mar-02
01-Mar-03
29-Feb-04
28-Feb-05
28-Feb-06
28-Feb-07
28-Feb-08
27-Feb-09
27-Feb-10
Sta
ge
(m
)
Figure 12. Cross-sections at the logger position at Algebuckina Waterhole. The surveys indicate that no significant morphological change occurred between 2000-2003. Note the shelf on the right bank (looking downstream) that helps fix the relative position of the earlier surveys. The lower panel shows the logger
hydrograph at Algebuckina over the period of 2000 to 2010.
33 | P a g e
CABLE
0%
20%
40%
60%
80%
100%
7 14 21 28
Distance (m)
Percentage Composition
> 1.18MM
600UM ‐ 1.18MM
300UM ‐ 600UM
150UM ‐300UM
75UM ‐150UM
53UM ‐75UM
< 53UM
CAMP
0%
20%
40%
60%
80%
100%
10 20 30 40
Distance (m)
Percentage Composition
150UM ‐300UM
75UM ‐150UM
53UM ‐75UM
< 53UM
34 | P a g e
LOGGER
0%
20%
40%
60%
80%
100%
10 20 30 40
Distance (m)
Percentage Composition
150UM ‐300UM
75UM ‐150UM
53UM ‐75UM
< 53UM
END
0%
10%
20%
30%
40%
50%
60%
70%
80%
90%
100%
10 20 30 40
Distance (m)
Percentage Composition
150UM ‐300UM
75UM ‐150UM
53UM ‐75UM
< 53UM
Figure 13. Sediment particle size analysis of bed sediments collected from Algebuckina Waterhole in April 2010. The transects start at the upstream end (CABLE) through to the downstream end (END).
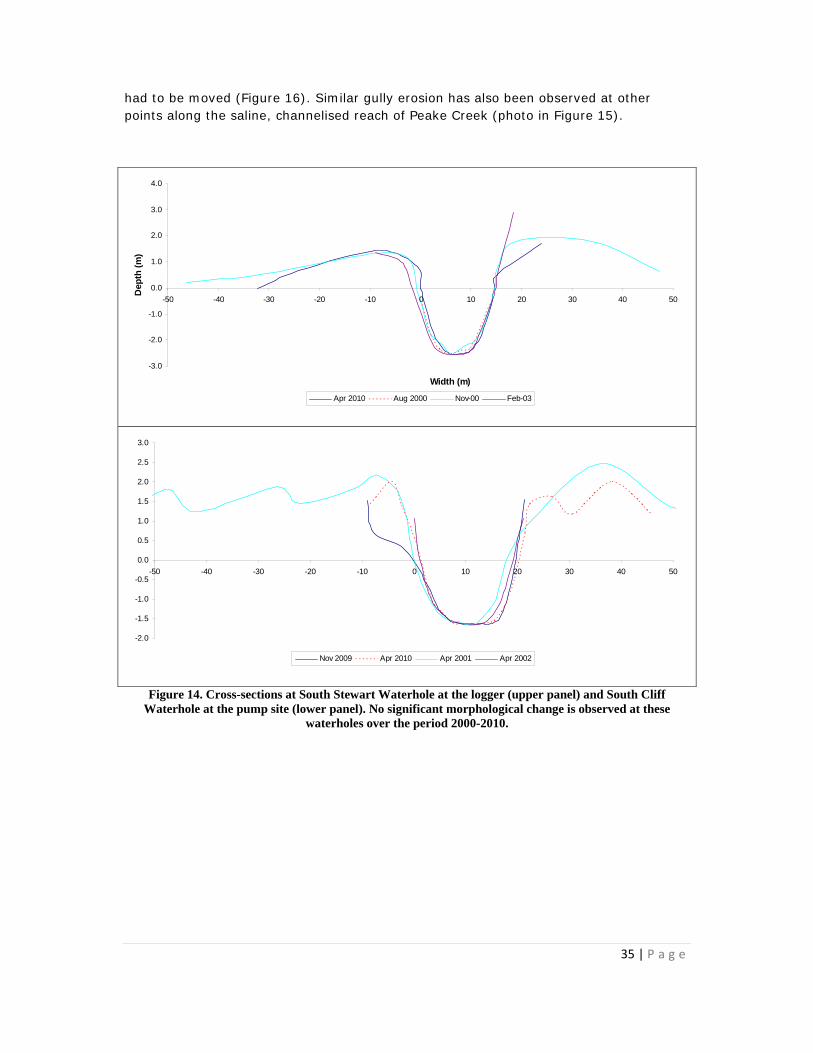
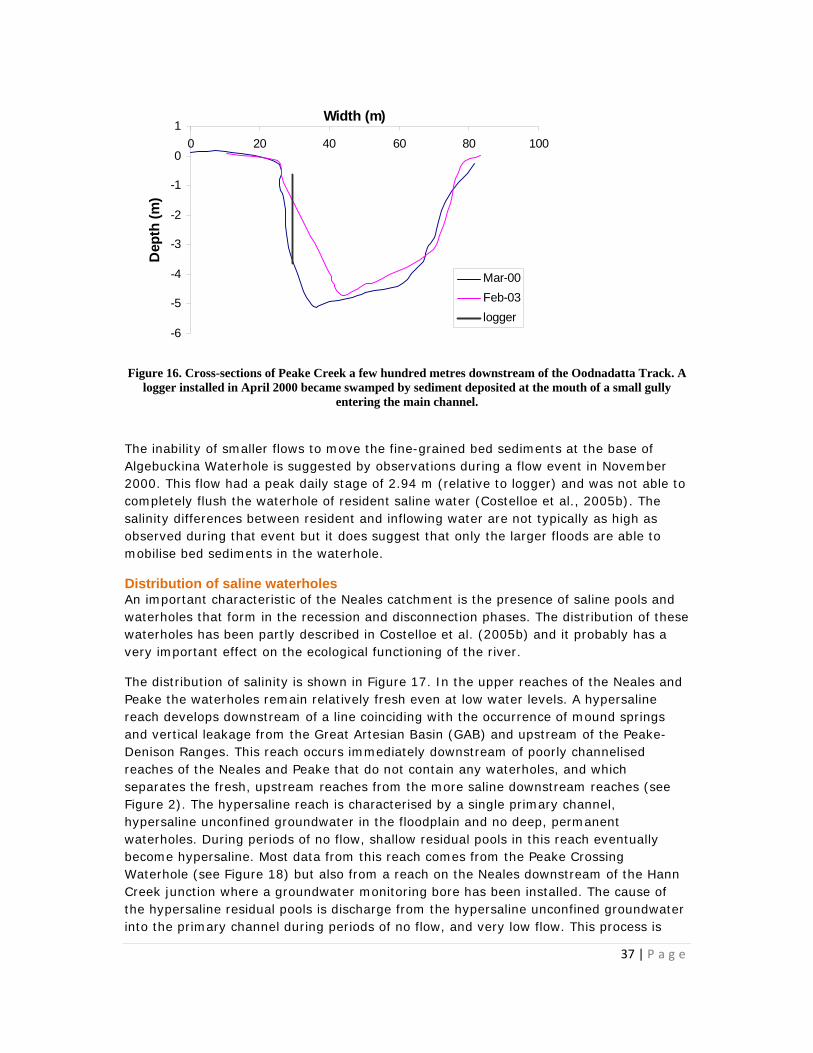
Repeat surveys of other waterholes in the catchment are relatively limited. However, surveys at South Stewart (upstream of Algebuckina) and South Cliff (downstream of Algebuckina) do not show any noticeable change in CTFD during the period of 2000-2010 (Figure 14). Therefore, the siltation at Algebuckina probably represents local processes at work, rather than reach or catchment wide changes. The possibility of local gully erosion contributing to the siltation is supported by observations at Algebuckina (sediment ‘fans’ around inflow sites of gullies) and also from observations from Peake Creek (Figure 15). At Peake Crossing waterhole, substantial sediment deposition occurred at the mouth of a gully such that a water level logger situated in this position
35 | P a g e
had to be moved (Figure 16). Similar gully erosion has also been observed at other points along the saline, channelised reach of Peake Creek (photo in Figure 15).
-3.0
-2.0
-1.0
0.0
1.0
2.0
3.0
4.0
-50 -40 -30 -20 -10 0 10 20 30 40 50
Width (m)
Dep
th (
m)
Apr 2010 Aug 2000 Nov-00 Feb-03
-2.0
-1.5
-1.0
-0.5
0.0
0.5
1.0
1.5
2.0
2.5
3.0
-50 -40 -30 -20 -10 0 10 20 30 40 50
Nov 2009 Apr 2010 Apr 2001 Apr 2002
Figure 14. Cross-sections at South Stewart Waterhole at the logger (upper panel) and South Cliff Waterhole at the pump site (lower panel). No significant morphological change is observed at these
waterholes over the period 2000-2010.
36 | P a g e
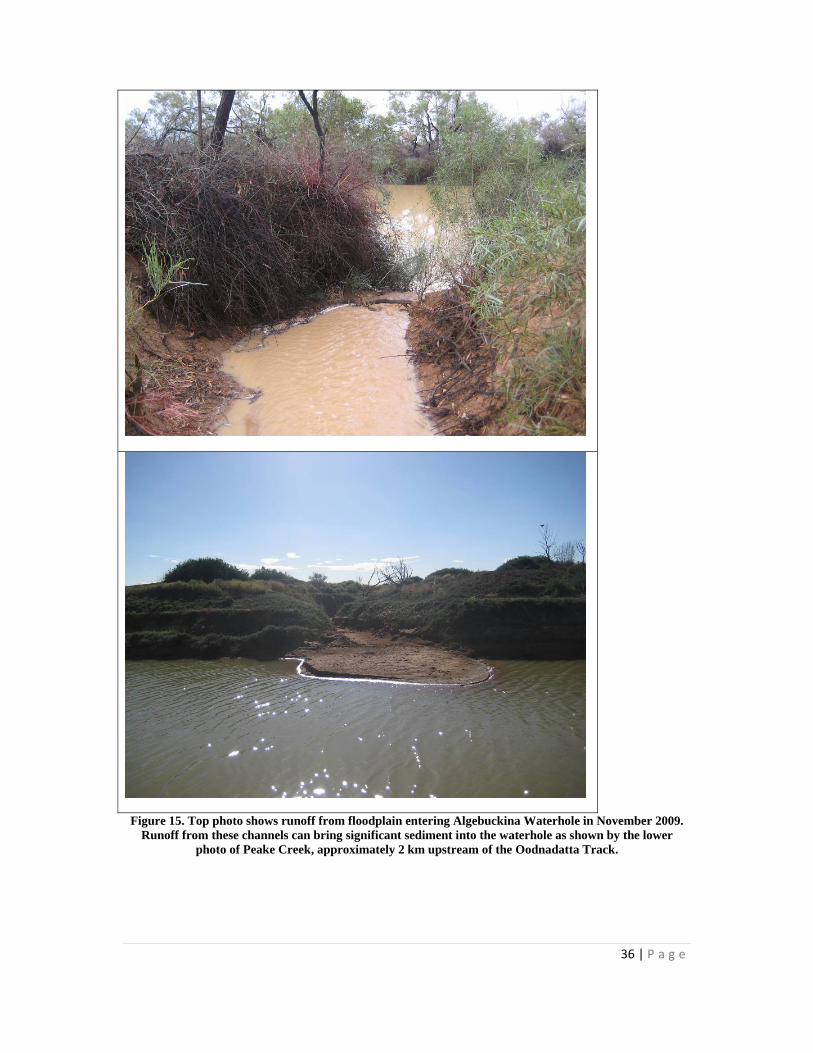
Figure 15. Top photo shows runoff from floodplain entering Algebuckina Waterhole in November 2009. Runoff from these channels can bring significant sediment into the waterhole as shown by the lower
photo of Peake Creek, approximately 2 km upstream of the Oodnadatta Track.
37 | P a g e
-6
-5
-4
-3
-2
-1
0
1
0 20 40 60 80 100
Width (m)
Dep
th (
m)
Mar-00
Feb-03
logger
Figure 16. Cross-sections of Peake Creek a few hundred metres downstream of the Oodnadatta Track. A logger installed in April 2000 became swamped by sediment deposited at the mouth of a small gully
entering the main channel.
The inability of smaller flows to move the fine-grained bed sediments at the base of Algebuckina Waterhole is suggested by observations during a flow event in November 2000. This flow had a peak daily stage of 2.94 m (relative to logger) and was not able to completely flush the waterhole of resident saline water (Costelloe et al., 2005b). The salinity differences between resident and inflowing water are not typically as high as observed during that event but it does suggest that only the larger floods are able to mobilise bed sediments in the waterhole.
Distribution of saline waterholes An important characteristic of the Neales catchment is the presence of saline pools and waterholes that form in the recession and disconnection phases. The distribution of these waterholes has been partly described in Costelloe et al. (2005b) and it probably has a very important effect on the ecological functioning of the river.
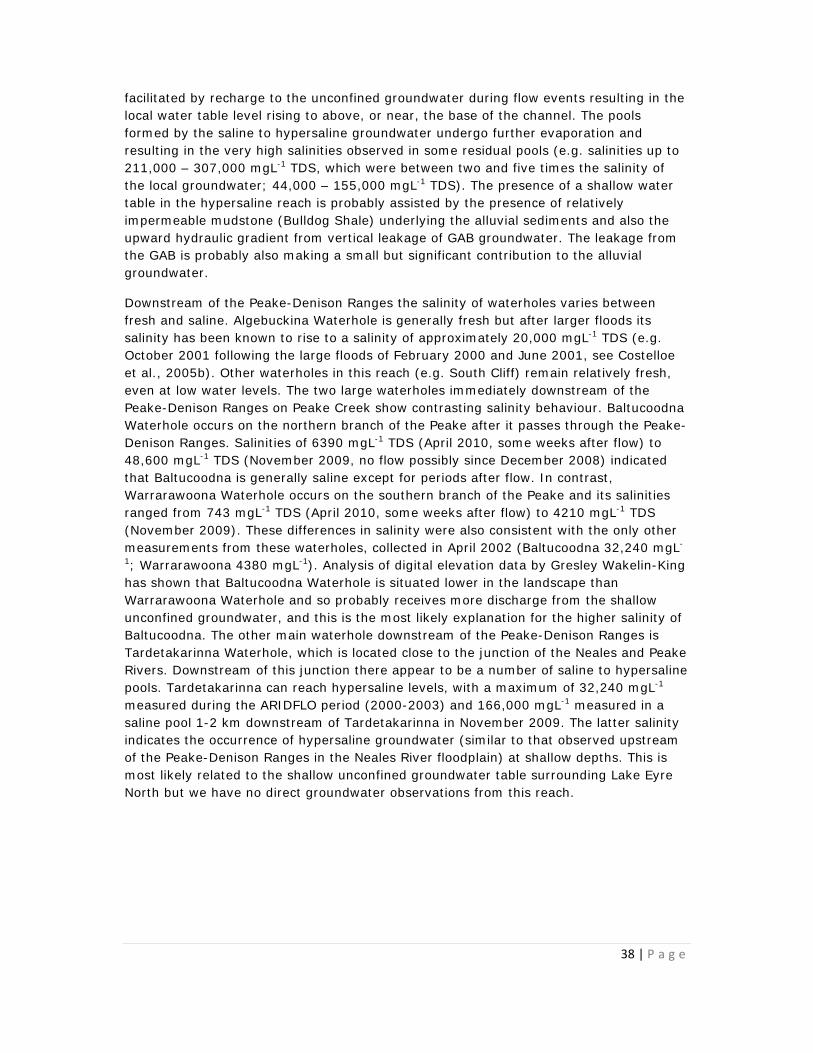
The distribution of salinity is shown in Figure 17. In the upper reaches of the Neales and Peake the waterholes remain relatively fresh even at low water levels. A hypersaline reach develops downstream of a line coinciding with the occurrence of mound springs and vertical leakage from the Great Artesian Basin (GAB) and upstream of the Peake-Denison Ranges. This reach occurs immediately downstream of poorly channelised reaches of the Neales and Peake that do not contain any waterholes, and which separates the fresh, upstream reaches from the more saline downstream reaches (see Figure 2). The hypersaline reach is characterised by a single primary channel, hypersaline unconfined groundwater in the floodplain and no deep, permanent waterholes. During periods of no flow, shallow residual pools in this reach eventually become hypersaline. Most data from this reach comes from the Peake Crossing Waterhole (see Figure 18) but also from a reach on the Neales downstream of the Hann Creek junction where a groundwater monitoring bore has been installed. The cause of the hypersaline residual pools is discharge from the hypersaline unconfined groundwater into the primary channel during periods of no flow, and very low flow. This process is
38 | P a g e
facilitated by recharge to the unconfined groundwater during flow events resulting in the local water table level rising to above, or near, the base of the channel. The pools formed by the saline to hypersaline groundwater undergo further evaporation and resulting in the very high salinities observed in some residual pools (e.g. salinities up to 211,000 – 307,000 mgL-1 TDS, which were between two and five times the salinity of the local groundwater; 44,000 – 155,000 mgL-1 TDS). The presence of a shallow water table in the hypersaline reach is probably assisted by the presence of relatively impermeable mudstone (Bulldog Shale) underlying the alluvial sediments and also the upward hydraulic gradient from vertical leakage of GAB groundwater. The leakage from the GAB is probably also making a small but significant contribution to the alluvial groundwater.
Downstream of the Peake-Denison Ranges the salinity of waterholes varies between fresh and saline. Algebuckina Waterhole is generally fresh but after larger floods its salinity has been known to rise to a salinity of approximately 20,000 mgL-1 TDS (e.g. October 2001 following the large floods of February 2000 and June 2001, see Costelloe et al., 2005b). Other waterholes in this reach (e.g. South Cliff) remain relatively fresh, even at low water levels. The two large waterholes immediately downstream of the Peake-Denison Ranges on Peake Creek show contrasting salinity behaviour. Baltucoodna Waterhole occurs on the northern branch of the Peake after it passes through the Peake-Denison Ranges. Salinities of 6390 mgL-1 TDS (April 2010, some weeks after flow) to 48,600 mgL-1 TDS (November 2009, no flow possibly since December 2008) indicated that Baltucoodna is generally saline except for periods after flow. In contrast, Warrarawoona Waterhole occurs on the southern branch of the Peake and its salinities ranged from 743 mgL-1 TDS (April 2010, some weeks after flow) to 4210 mgL-1 TDS (November 2009). These differences in salinity were also consistent with the only other measurements from these waterholes, collected in April 2002 (Baltucoodna 32,240 mgL-
1; Warrarawoona 4380 mgL-1). Analysis of digital elevation data by Gresley Wakelin-King has shown that Baltucoodna Waterhole is situated lower in the landscape than Warrarawoona Waterhole and so probably receives more discharge from the shallow unconfined groundwater, and this is the most likely explanation for the higher salinity of Baltucoodna. The other main waterhole downstream of the Peake-Denison Ranges is Tardetakarinna Waterhole, which is located close to the junction of the Neales and Peake Rivers. Downstream of this junction there appear to be a number of saline to hypersaline pools. Tardetakarinna can reach hypersaline levels, with a maximum of 32,240 mgL-1 measured during the ARIDFLO period (2000-2003) and 166,000 mgL-1 measured in a saline pool 1-2 km downstream of Tardetakarinna in November 2009. The latter salinity indicates the occurrence of hypersaline groundwater (similar to that observed upstream of the Peake-Denison Ranges in the Neales River floodplain) at shallow depths. This is most likely related to the shallow unconfined groundwater table surrounding Lake Eyre North but we have no direct groundwater observations from this reach.
39 | P a g e
Figure 17. Salinity range of waterbodies in the Neales catchment. Waterholes that remain fresh occur upstream of the dashed line. The reach between the dashed line and the Peake-Denison Ranges is
typically hypersaline between flow events. The reaches downstream of the Peake-Denison Ranges are variably saline. Data are limited on the salinity of waterbodies downstream of the junction between the
Neales and Peake but they are suspected to be saline to hypersaline.
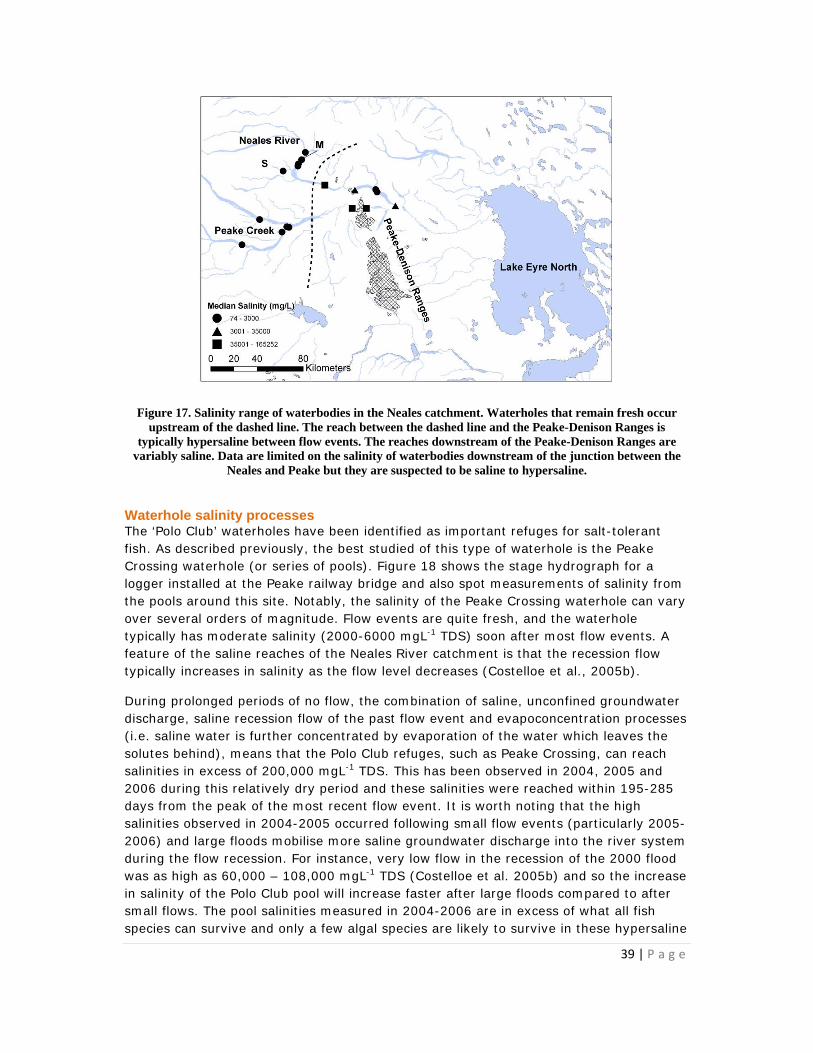
Waterhole salinity processes The ‘Polo Club’ waterholes have been identified as important refuges for salt-tolerant fish. As described previously, the best studied of this type of waterhole is the Peake Crossing waterhole (or series of pools). Figure 18 shows the stage hydrograph for a logger installed at the Peake railway bridge and also spot measurements of salinity from the pools around this site. Notably, the salinity of the Peake Crossing waterhole can vary over several orders of magnitude. Flow events are quite fresh, and the waterhole typically has moderate salinity (2000-6000 mgL-1 TDS) soon after most flow events. A feature of the saline reaches of the Neales River catchment is that the recession flow typically increases in salinity as the flow level decreases (Costelloe et al., 2005b).
During prolonged periods of no flow, the combination of saline, unconfined groundwater discharge, saline recession flow of the past flow event and evapoconcentration processes (i.e. saline water is further concentrated by evaporation of the water which leaves the solutes behind), means that the Polo Club refuges, such as Peake Crossing, can reach salinities in excess of 200,000 mgL-1 TDS. This has been observed in 2004, 2005 and 2006 during this relatively dry period and these salinities were reached within 195-285 days from the peak of the most recent flow event. It is worth noting that the high salinities observed in 2004-2005 occurred following small flow events (particularly 2005-2006) and large floods mobilise more saline groundwater discharge into the river system during the flow recession. For instance, very low flow in the recession of the 2000 flood was as high as 60,000 – 108,000 mgL-1 TDS (Costelloe et al. 2005b) and so the increase in salinity of the Polo Club pool will increase faster after large floods compared to after small flows. The pool salinities measured in 2004-2006 are in excess of what all fish species can survive and only a few algal species are likely to survive in these hypersaline
40 | P a g e
pools. As a result, probably all of the recognised Polo Club refuges would not function as long-term refuges, even for salt-tolerant fish species.
0.0
0.5
1.0
1.5
2.0
2.5
3.0
3.5
1-Apr-00
1-Apr-01
1-Apr-02
1-Apr-03
31-Mar-04
31-Mar-05
31-Mar-06
31-Mar-07
30-Mar-08
30-Mar-09
30-Mar-10
Sta
ge
(m)
0
50,000
100,000
150,000
200,000
250,000
300,000
Sal
init
y (m
g/L
)
Figure 18. Stage hydrograph and water salinity measurements at the Peake Creek crossing pool
The role of saline groundwater in the hydrology and ecology of a waterhole also extends to its effects on riparian vegetation. A shallow water table can lead to upward evaporative discharge and consequent salinisation of the soil profile. An extreme example of this occurs at the mid-Neales site (just downstream of the Hann Creek junction) where halite (salt) is deposited at the surface within 50 m of the channel and the riparian vegetation is restricted to a very narrow band next to the channel (Costelloe et al., 2008). At Algebuckina Waterhole, floodplain profiles within 50-100 m of the channel also show quite high chloride concentrations at depths below 1 m. It is likely that the floodplain south of Algebuckina Waterhole is characterised by high salinity, sodic soil and this probably has a large influence on vegetation characteristics of this area (dominated by bare soil with nitre bush growing on hummocks). These groundwater and soil characteristics are part of natural processes but can have an important effect on the riparian vegetation. For instance, in these areas the coolibah riparian zone is very narrow and restricted to the bank top. As a result, harvesting of dead trees and branches for firewood has a comparably larger impact then upon areas with thicker riparian zones. The presence of sodic soils may also be more sensitive to disturbance by cattle, rabbits and human traffic, and needs to be taken into account if considering replanting of gullies to limit erosion. Some of the more extensive evidence of local gullying delivering sediment to the channel have been observed in the saline reaches (e.g. Peake crossing and upstream reach – see Figures 15 and 16).
41 | P a g e
Future monitoring Water level logger network The Department for Water installed a telemetered water level monitoring station at Algebuckina Waterhole during 2011 and intends to install a second station at Stewart Waterhole in April 2012. These provide an ongoing commitment to monitoring flow events in the Neales catchment. In addition, the LEBRA fish monitoring has installed a logger at Warrawaroona Waterhole on Peake Creek. The ARIDFLO and Critical Refugia network of loggers have provided an excellent overview of spatial patterns of flow in the catchment but maintenance of this network is not viable over the medium term. In light of the failure of most of the old ARIDFLO loggers, the following steps are recommended for the water level logger network.
Download the Neales loggers as part of the third Cooper project field trip in April 2012, if time permits. As part of this, remove the Critical Refugia loggers.
Transfer one of the Critical Refugia loggers into the Peake Bridge site (currently not monitored due to the failure of the old ARIDFLO logger installed here). The downloading and maintenance of this logger will then be handed over to SARDI to be incorporated into their LEBRA work.
This will mean that going into the future there will be two high quality, telemetered sites on the Neales and two low cost LEBRA sites on the Peake.
All data will also be handed over to Department for Water to incorporate into their publically available data archive.
There are currently 14 water level loggers operating in the Neales catchment (Table 4, Figure 19). This represents the most intensive monitoring network per unit area for any catchment in the Lake Eyre Basin, and probably for the arid zone of Australia. For instance, catchments to the north (Macumba River) and south (Lake Eyre South catchment) have no monitoring network at all. Cooper Creek has 9 active gauging stations and 10 Bureau of Meteorology flood monitoring sites over a catchment area of approximately 300,000 km2 (nearly 10x larger than the Neales catchment).
Table 4. Water level logger network in Neales catchment. Code shows location in Figure 19.
Waterhole Installed Current status Code
South Stewart WH ARIDFLO 2000 Operating 1
Algebuckina WH ARIDFLO 2000 Operating (CR logger, ARIDFLO defunct) 2
Algebuckina Bank 2004 CR logger moved to waterhole position 3
Lora Ck ARIDFLO 2000 Significant operational problems 4
Arckaringa Ck ARIDFLO 2000 Operating 5
Mid-Peake ARIDFLO 2000 Operating 6
Nilpinna Ck ARIDFLO 2000 Operating 7
Peake Crossing ARIDFLO 2000 Operating, some data quality issues 8
Afghan WH Critical Refugia 2010 New 9
Neales South Branch Critical Refugia 2010 New 10
42 | P a g e
Mid-Neales Critical Refugia 2009 Damaged in 2009 and replaced 11
Ockenden Ck Critical Refugia 2009 Operating 12
Tardetakarina Critical Refugia 2009 Not downloaded yet 13
North Freeling Critical Refugia 2009 Operating 14
Lambing Creek Critical Refugia 2009 Not downloaded yet 15
The current network was designed for relatively short term monitoring (i.e. 2-10 years). The original ARIDFLO loggers were installed in 2000 and have greatly exceeded their expected life-span but these loggers are deteriorating. South Australian Department for Water (DFW) have BoM funding to install high quality, telemetred water level loggers at two locations in the Neales catchment; Algebuckina Waterhole and either Stewarts or Hookeys Waterholes. These should be installed in 2010 and provide a long-term commitment to a minimal level of monitoring in the catchment. The current logger network, and particularly its associated database, adds significant value to the DFW monitoring. In terms of the future of the ARIDFLO-Critical Refugia logger network, the following scenarios are explored:
1. DFW takes on the downloading and maintenance of some, or all, of the logger network. It is unlikely that DFW would be interested in all of the sites, particularly those on smaller tributaries (e.g. Ockenden, Nilpinna, Lambing Creeks) and in remoter areas (e.g. Tardetakarinna, Lambing Creek). In this scenario, it would be sensible for DFW to replace the old ARIDFLO loggers with low cost, newer loggers.
2. The SAAL NRMB – University of Melbourne partnership maintains the full logger network in the period to 2013 by incorporating a Neales catchment visit as part of proposed fieldwork in the Cooper Creek catchment. This would require assigning 3-4 days of field trips to downloading and maintaining the Neales logger network. This scenario would involve a relatively minor adjustment to the proposed monitoring in the Cooper catchment. At the end of the period (i.e. June 2013), a decision would need to be made about the ongoing status of the logger network. This scenario may not include replacing old, failed loggers with new loggers, in which case some of the newer loggers in the current network may be reassigned to higher priority sites in consultation with SAAL NRMB.
3. Some of the logger network is maintained by local parties. These are most likely to be pastoralists who are interested in maintaining a flow record from loggers located on their properties. This would require some support from SAAL NRMB for training but the loggers are relatively simple to download.
4. The current logger network ceases and the monitoring is pared back to the DFW permanent sites. Unless the logger sites are abandoned, this scenario still requires a further field trip for final downloading and removal of loggers. This would occur in December 2010 as part of the planned fieldwork in the Cooper catchment.
In all of these scenarios, it is planned that the logger data are provided to DFW for storage and incorporation into the publicly available State hydrological database.
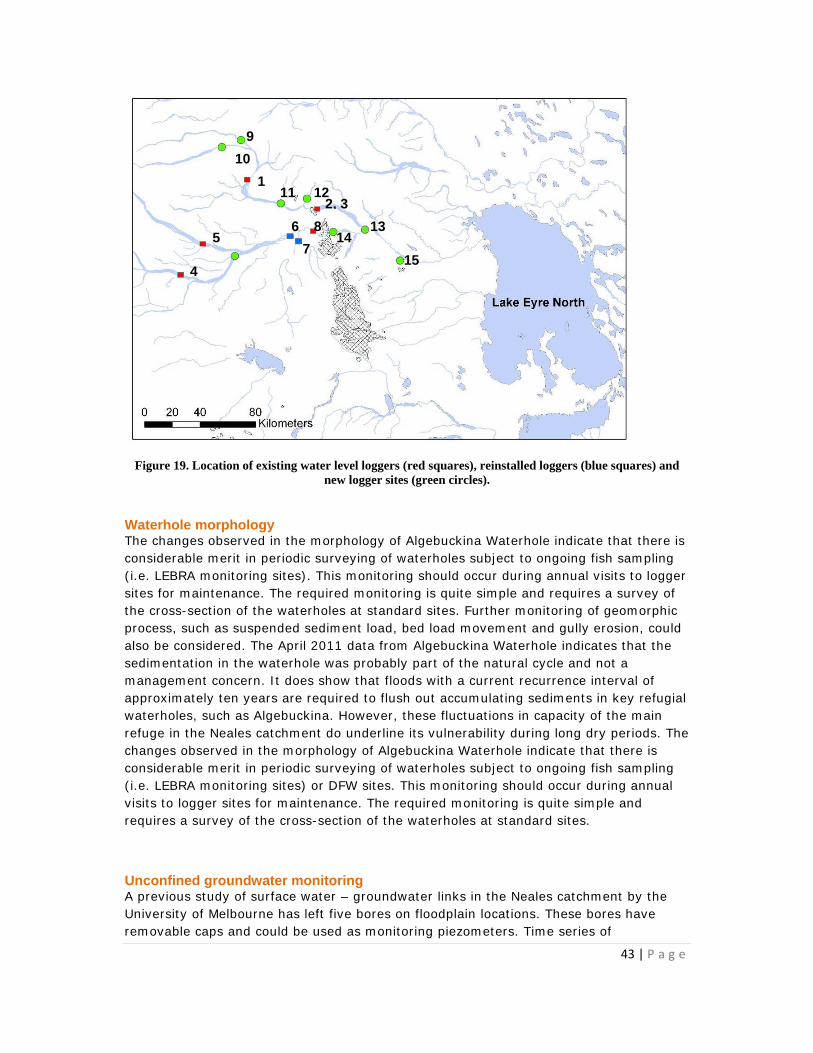
43 | P a g e
Figure 19. Location of existing water level loggers (red squares), reinstalled loggers (blue squares) and new logger sites (green circles).
Waterhole morphology The changes observed in the morphology of Algebuckina Waterhole indicate that there is considerable merit in periodic surveying of waterholes subject to ongoing fish sampling (i.e. LEBRA monitoring sites). This monitoring should occur during annual visits to logger sites for maintenance. The required monitoring is quite simple and requires a survey of the cross-section of the waterholes at standard sites. Further monitoring of geomorphic process, such as suspended sediment load, bed load movement and gully erosion, could also be considered. The April 2011 data from Algebuckina Waterhole indicates that the sedimentation in the waterhole was probably part of the natural cycle and not a management concern. It does show that floods with a current recurrence interval of approximately ten years are required to flush out accumulating sediments in key refugial waterholes, such as Algebuckina. However, these fluctuations in capacity of the main refuge in the Neales catchment do underline its vulnerability during long dry periods. The changes observed in the morphology of Algebuckina Waterhole indicate that there is considerable merit in periodic surveying of waterholes subject to ongoing fish sampling (i.e. LEBRA monitoring sites) or DFW sites. This monitoring should occur during annual visits to logger sites for maintenance. The required monitoring is quite simple and requires a survey of the cross-section of the waterholes at standard sites.
Unconfined groundwater monitoring A previous study of surface water – groundwater links in the Neales catchment by the University of Melbourne has left five bores on floodplain locations. These bores have removable caps and could be used as monitoring piezometers. Time series of
1
2, 3
4
5 6
7
8
9
10
11 12
1314
15

44 | P a g e
groundwater level fluctuations were measured at these bores between 2004 and 2007 and water samples were periodically collected for analysis. The interaction between the unconfined, saline groundwater and the surface water system is important for salinity dynamics in the waterholes and has likely consequences on riparian vegetation patterns. Monitoring of these bores has a relatively low priority but the opportunity exists if data on groundwater behaviour are required.
45 | P a g e
Management plan The following recommendations are made for the management plan being developed for the Neales catchment by the Critical Refugia project.
1. Algebuckina Waterhole will be maintained as the key flow monitoring site within the catchment with the BoM funded site. The ARIDFLO and Critical Refugia logger network provides an important record of flows that should be maintained for as long as possible and continue to be integrated into the DFW monitoring network. The ongoing monitoring sites are reduced to the two DFW sites (Algebuckina, Stewarts) and two LEBRA sites (Peake Bridge, Warrawaroona). The remaining Critical Refugia loggers are to be removed in April 2012. In light of proposed mining operations in the catchment (e.g. Linc Energy and Altona Energy projects) it may be worth asking DFW and PIRSA if there is any value in maintaining any of the existing sites.
2. Further investigations are required into the causes of the reduction of the Algebuckina CTFD. This may require coring of bed sediments and monitoring of erosion and sedimentation rates around gully sites, as well as detailed mapping of the morphology of the waterhole. In terms of management actions, the following should be considered; (i) earthworks or replanting to stabilise gullies leading into waterhole; (ii) restricting access of cattle to waterhole by installing watering points on the floodplain using pumped water from the waterhole; (iii) restricting access points for tourists to the waterhole and perhaps providing ramps to the water to restrict gullying. Further investigations or management actions are no longer are warranted but ongoing monitoring of depths of key refugial waterholes at standard sites is recommended on an annual or multi-annual basis.
3. Understanding the context of Algebuckina Waterhole in the context of the catchment as a whole assists in determining the sensitivity of the aquatic ecosystem to anthropogenic pressures. If Algebuckina’s reduction in CTFD is part of a natural geomorphic trajectory in response to a lack of large floods, then the ecological importance of other waterholes with large CTFD values increases. For instance, Cramps Camp is currently the deepest refugia waterhole in the catchment and experiences virtually no pressure from tourists due to its poor accessibility. However, it appears that Cramps Camp waterhole (along with neighbouring South Stewart waterhole) have significantly higher loss rates than Algebuckina Waterhole due to a high leakage rate to the unconfined water table. The flushing of Algebuckina Waterhole by the February 2011 flood again makes this waterhole the most important fluvial refugia in the catchment and should be the focus of management plans.
4. The funded capping of Big Blyth bore will assist in the management of gambusia within the catchment. However, the capping of One Mile bore is also required and some investigation is required into feasible eradication methods of gambusia in North Freeling pool and associated spring groups. Big Blyth has been successfully capped and the other recommendations still stand.
46 | P a g e
References Bunn SE, Davies PM, Winning M. 2004. Sources of organic carbon supporting the food
web of an arid zone floodplain river. Freshwater Biology 48: 619-635. DOI:10.1046/j.1365-2427.2003.01031.x.
Costelloe JF, Hudson PJ, Pritchard JC, Puckridge JT, Reid JRW. 2004. ARIDFLO scientific report: environmental flow requirements of arid zone rivers with particular reference to the Lake Eyre Drainage Basin. Final Report to South Australian Department of Water, Land and Biodiversity Conservation and Commonwealth Department of Environment and Heritage.
Costelloe JF, Grayson RB, McMahon TA. 2005a. Modelling streamflow for use in
ecological studies in a large, arid zone river, central Australia. Hydrological Processes 19: 1165-1183.
Costelloe JF, Grayson RB, McMahon TA, Argent RM. 2005b. Spatial and temporal
variability of water salinity in an ephemeral arid-zone river, central Australia. Hydrological Processes 19:3147-3166.
Costelloe JF, Shields A, Grayson RB, McMahon TA. 2007. Determining loss characteristics
of arid zone river waterbodies. River Research and Applications 23, 715-731. Costelloe JF. 2008. Updating and analysis of the ARIDFLO water level data in the Lake
Eyre Basin. Final Report to the South Australian Department of Water, Land and Biodiversity Conservation, Adelaide, July 2008.
Costelloe JF, Payne EG, Woodrow IE, Irvine EC, Western AW, Leaney F. 2008. Water use
by arid zone riparian trees in highly saline environments, Australia. Oecologia 156: 43-52. doi 10.1007/s00442-008-0975-4.
Hamilton SK, Bunn SE, Thoms MC, Marshall JC. 2005. Persistence of aquatic refugia
between flow pulses in a dryland river system (Cooper Creek, Australia). Limnology and Oceanography 50 (3): 743-754.
Kotwicki, V., 1986. Floods of Lake Eyre. Engineering and Water Supply Department,
Adelaide, 99 pp. McMahon TA, Murphy R, Little P, Costelloe JF, Peel MC, Chiew FHS, Hayes S, Nathan R,
Kandel DD. 2005. Hydrology of the Lake Eyre Basin. Final Report to Department of Environment and Heritage, Canberrra, September 2005.
Russell K. 2009. Determining loss characteristics of arid zone river waterbodies – final
report. 4th year undergraduate research report, University of Melbourne. Tetzlaff G, Bye JAT. 1978. Water balance of Lake Eyre for the flooded period January
1974 - June 1976. Transactions of the Royal Society of Australia 102: 91–96.


![Studio Air Journal [Unimelb Yr3Sem1]](https://img.pdfslide.net/doc/110x75/579056f21a28ab900c9b5379/studio-air-journal-unimelb-yr3sem1.jpg)
![Studio Air Algorithmic Sketch Book [Unimelb Yr3Sem1]](https://img.pdfslide.net/doc/110x75/579056f81a28ab900c9b6d4c/studio-air-algorithmic-sketch-book-unimelb-yr3sem1.jpg)