Embed Size (px)
Citation preview
Unión Andina de Cementos S.A.A. and Subsidiaries
Consolidated financial statements as of December 31, 2014 and 2013 together with the Independent Auditor’s Report
Unión Andina de Cementos S.A.A. and Subsidiaries
Consolidated financial statements as of December 31, 2014 and 2013
together with the Independent Auditor’s Report
Content
Independent Auditor’s Report
Consolidated financial statements
Consolidated statement of financial position
Consolidated statement of income
Consolidated statement of comprehensive income
Consolidated statement of changes in equity
Consolidated statement of cash flows
Notes to the consolidated financial statements
Inscrita en la partida 11396556 del Registro de Personas Jurídicas de Lima y Callao
Miembro de Ernst & Young Global
Independent Auditors’ Report
Paredes, Zaldívar, Burga & Asociados Sociedad Civil de Responsabilidad Limitada
To the Shareholders of Unión Andina de Cementos S.A.A. and Subsidiaries
We have audited the accompanying consolidated financial statements of Unión Andina de Cementos
S.A.A. (a Peruvian corporation), which comprise the consolidated statements of financial position as
of December 31, 2014 and 2013, and the related consolidated statements of income,
comprehensive income, changes in equity and cash flows for the years ended December 31, 2014
and 2013, and a summary of significant accounting policies and other explanatory notes.
Management responsibility for the Consolidated Financial Statements
Management is responsible for the preparation and fair presentation of these consolidated financial
statements in accordance with International Financial Reporting Standards and for the internal
control that Management determines is appropriate to the preparation of consolidated financial
statements that are free from material misstatement, whether due fraud or error.
Auditor’s Responsibility
Our responsibility is to express an opinion on these consolidated financial statements based on our
audits. We conducted our audit in accordance with International Standards on Auditing approved for
application in Peru by the Board of Deans of Institutes of Peruvian Certified Public Accountants.
Those standards require that we comply with ethical standards, and to plan and perform the audit to
obtain reasonable assurance about whether the consolidated financial statements are free from
material misstatements.
An audit involves performing procedures to obtain audit evidence about the amounts and
disclosures in the consolidated financial statements. The procedures selected depend on the
auditor’s judgment, including the assessment of the risks of material misstatement of the
consolidated financial statements, whether due to fraud or error. In making those risk assessments,
the auditor considers internal control relevant to the entity’s preparation and fair presentation of
the consolidated financial statements in order to design audit procedures that are appropriate in the
circumstances, but not for the purpose of expressing an opinion on the effectiveness of the entity’s
internal control. An audit also includes evaluating the appropriateness of accounting policies used
and the reasonableness of accounting estimates made by Management, as well as evaluating the
overall presentation of the consolidated financial statements.
Independent Auditors’ Report (continued)
We believe that the audit evidence we have obtained is sufficient and appropriate to provide a basis
for our audit opinion.
Opinion
In our opinion, the accompanying consolidated financial statements, present fairly, in all material
aspects, the consolidated financial position of Unión Andina de Cementos S.A.A. and Subsidiaries as
of December 31, 2014 and 2013, and its financial performance and cash flows for the years ended
December 31, 2014 and 2013, in accordance with International Financial Reporting Standards.
Lima, Peru,
March 26, 2015
Countersigned by:
__________________________
Mayerling Zambrano R.
C.P.C.C. Registration No. 23765
The accompanying notes are an integral part of this consolidated statement.
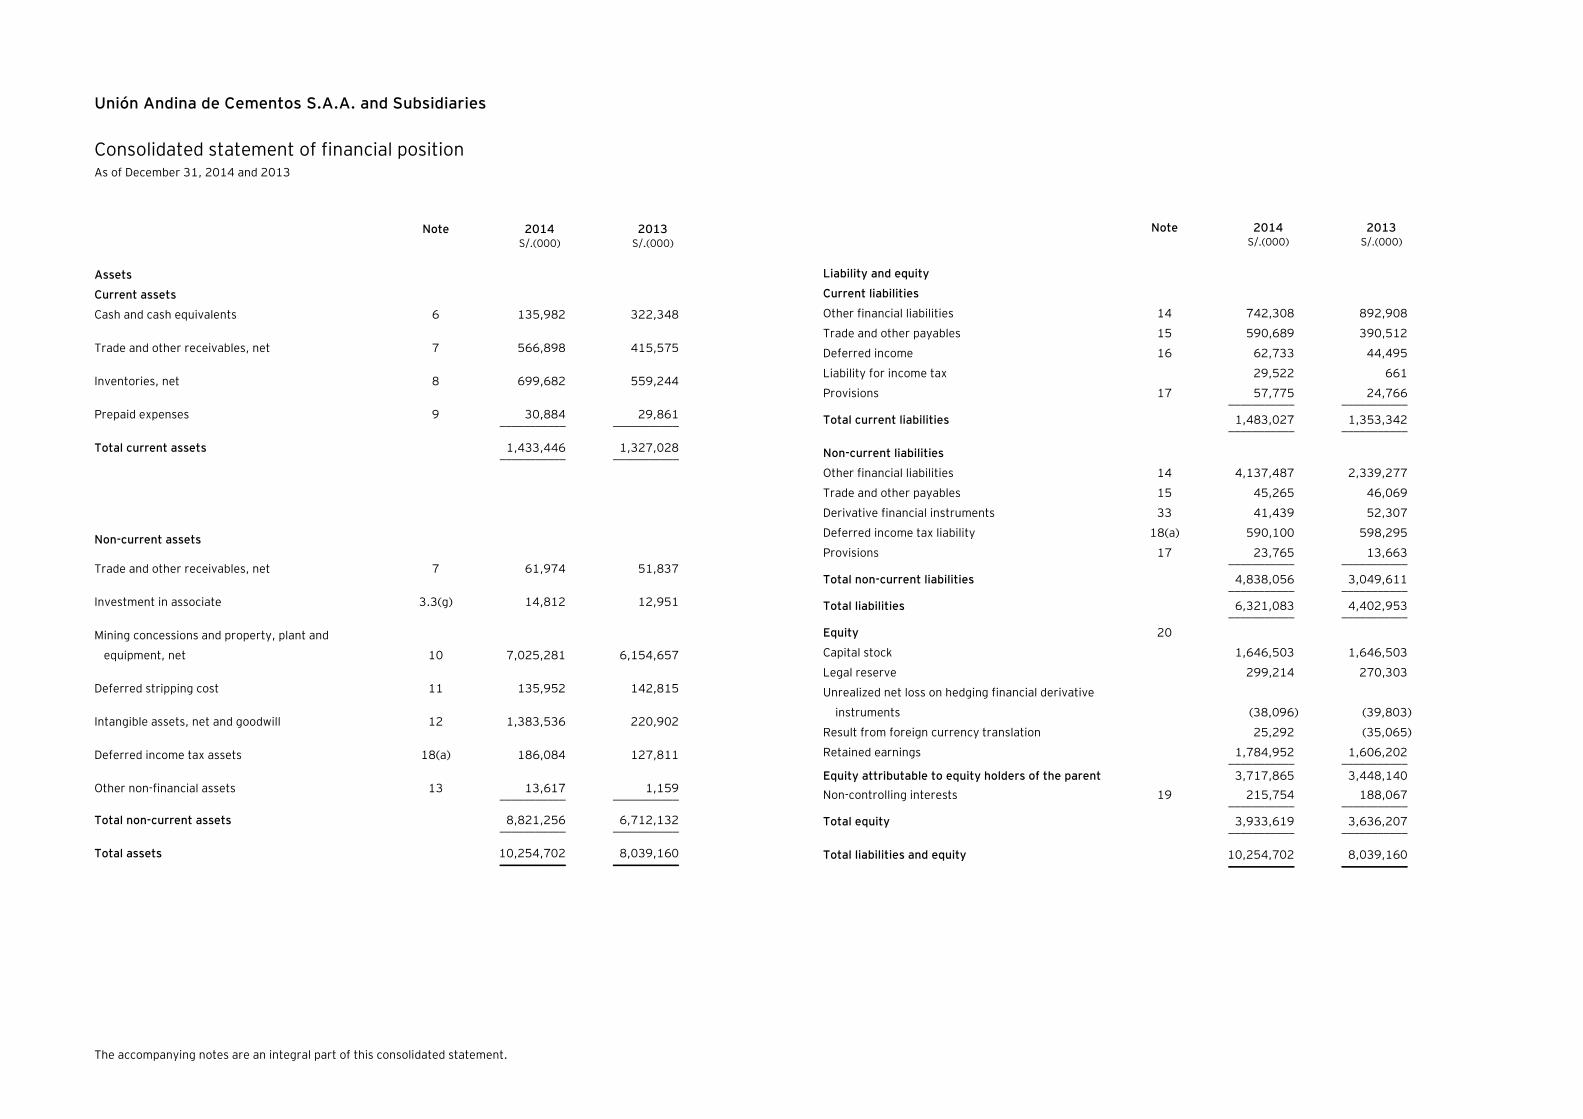
Unión Andina de Cementos S.A.A. and Subsidiaries
Consolidated statement of financial position As of December 31, 2014 and 2013
Note 2014 2013 S/.(000) S/.(000)
Assets
Current assets
Cash and cash equivalents 6 135,982 322,348
Trade and other receivables, net 7 566,898 415,575
Inventories, net 8 699,682 559,244
Prepaid expenses 9 30,884 29,861
___________ ___________
Total current assets 1,433,446 1,327,028 ___________ ___________
Non-current assets
Trade and other receivables, net 7 61,974 51,837
Investment in associate 3.3(g) 14,812 12,951
Mining concessions and property, plant and
equipment, net 10 7,025,281 6,154,657
Deferred stripping cost 11 135,952 142,815
Intangible assets, net and goodwill 12 1,383,536 220,902
Deferred income tax assets 18(a) 186,084 127,811
Other non-financial assets 13 13,617 1,159
___________ ___________
Total non-current assets 8,821,256 6,712,132 ___________ ___________
Total assets 10,254,702 8,039,160
___________ ___________
Note 2014 2013 S/.(000) S/.(000)
Liability and equity
Current liabilities
Other financial liabilities 14 742,308 892,908
Trade and other payables 15 590,689 390,512
Deferred income 16 62,733 44,495
Liability for income tax 29,522 661
Provisions 17 57,775 24,766 ___________ ___________
Total current liabilities 1,483,027 1,353,342 ___________ ___________
Non-current liabilities
Other financial liabilities 14 4,137,487 2,339,277
Trade and other payables 15 45,265 46,069
Derivative financial instruments 33 41,439 52,307
Deferred income tax liability 18(a) 590,100 598,295
Provisions 17 23,765 13,663 ___________ ___________
Total non-current liabilities 4,838,056 3,049,611 ___________ ___________
Total liabilities 6,321,083 4,402,953 ___________ ___________
Equity 20
Capital stock 1,646,503 1,646,503
Legal reserve 299,214 270,303
Unrealized net loss on hedging financial derivative
instruments (38,096) (39,803)
Result from foreign currency translation 25,292 (35,065)
Retained earnings 1,784,952 1,606,202 ___________ ___________
Equity attributable to equity holders of the parent 3,717,865 3,448,140
Non-controlling interests 19 215,754 188,067 ___________ ___________
Total equity 3,933,619 3,636,207 ___________ ___________
Total liabilities and equity 10,254,702 8,039,160 ___________ ___________
The accompanying notes are an integral part of this consolidated statement.
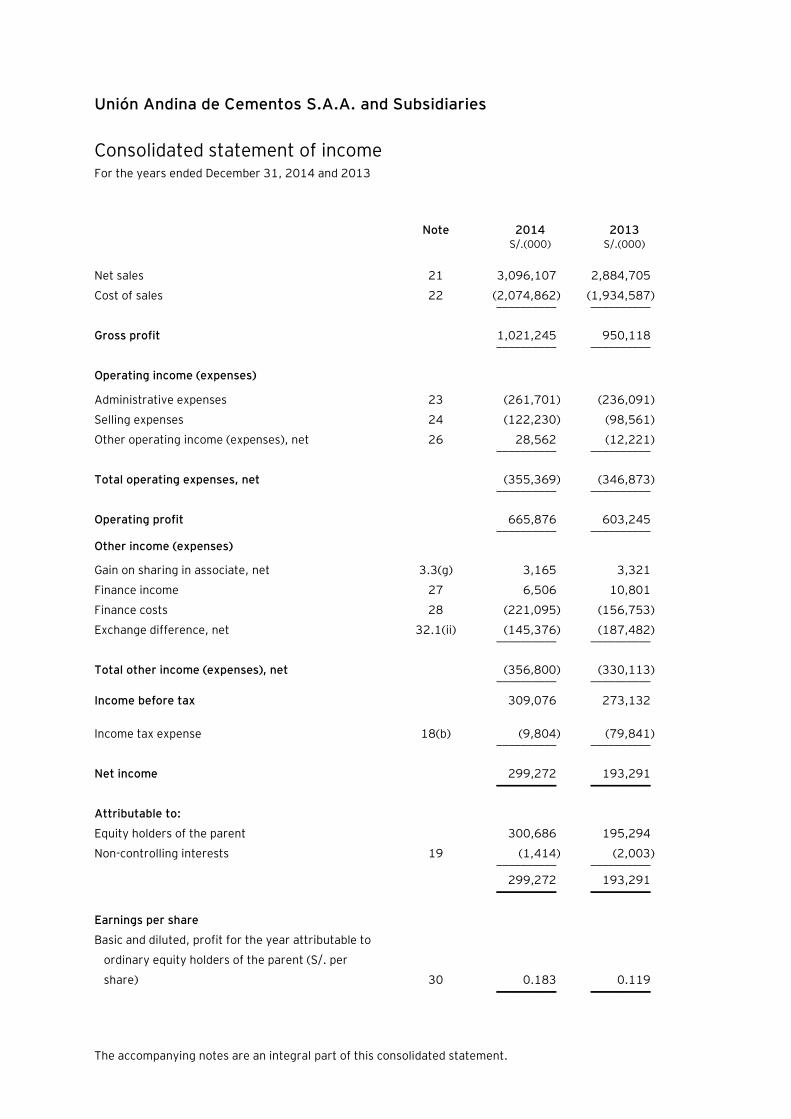
Unión Andina de Cementos S.A.A. and Subsidiaries
Consolidated statement of income For the years ended December 31, 2014 and 2013
Note 2014 2013 S/.(000) S/.(000)
Net sales 21 3,096,107 2,884,705
Cost of sales 22 (2,074,862) (1,934,587) __________ __________
Gross profit 1,021,245 950,118 __________ __________
Operating income (expenses)
Administrative expenses 23 (261,701) (236,091)
Selling expenses 24 (122,230) (98,561)
Other operating income (expenses), net 26 28,562 (12,221) __________ __________
Total operating expenses, net (355,369) (346,873) __________ __________
Operating profit 665,876 603,245 __________ __________
Other income (expenses)
Gain on sharing in associate, net 3.3(g) 3,165 3,321
Finance income 27 6,506 10,801
Finance costs 28 (221,095) (156,753)
Exchange difference, net 32.1(ii) (145,376) (187,482) __________ __________
Total other income (expenses), net (356,800) (330,113) __________ __________
Income before tax 309,076 273,132
Income tax expense 18(b) (9,804) (79,841) __________ __________
Net income 299,272 193,291 __________ __________
Attributable to:
Equity holders of the parent 300,686 195,294
Non-controlling interests 19 (1,414) (2,003) __________ __________
299,272 193,291 __________ __________
Earnings per share
Basic and diluted, profit for the year attributable to
ordinary equity holders of the parent (S/. per
share) 30 0.183 0.119 __________ __________
The accompanying notes are an integral part of this consolidated statement.
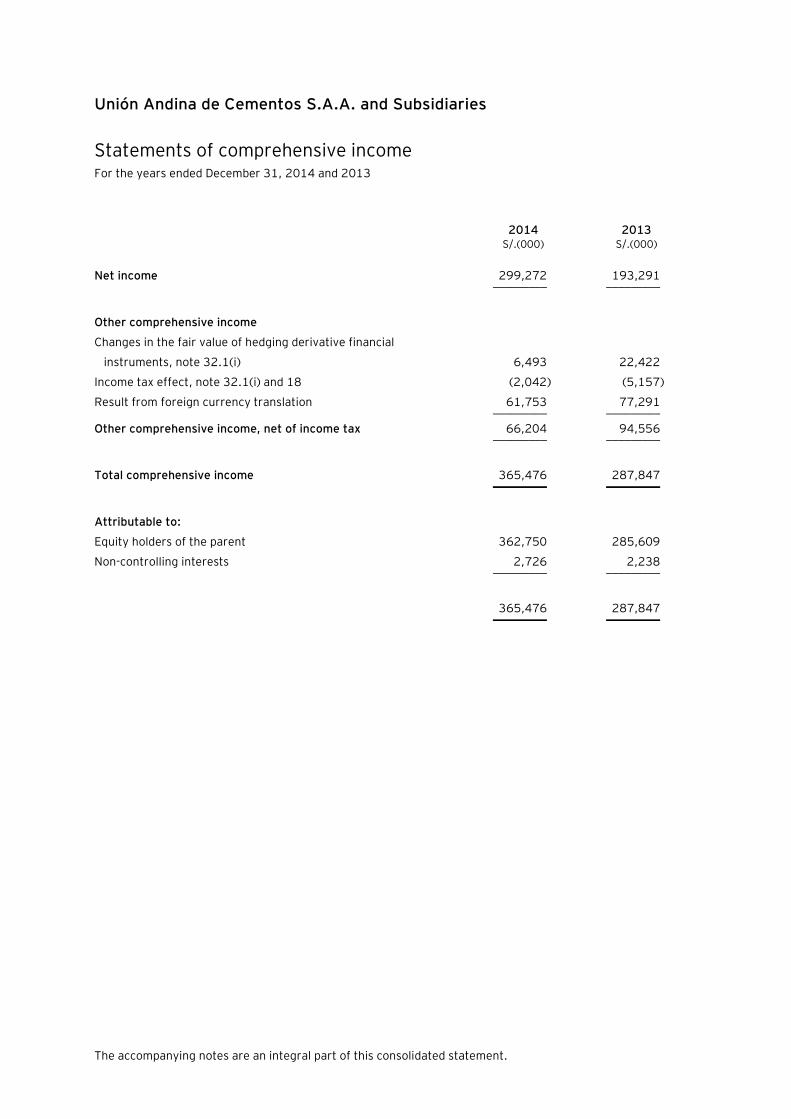
Unión Andina de Cementos S.A.A. and Subsidiaries
Statements of comprehensive income For the years ended December 31, 2014 and 2013
2014 2013 S/.(000) S/.(000)
Net income 299,272 193,291 _________ _________
Other comprehensive income
Changes in the fair value of hedging derivative financial
instruments, note 32.1(i) 6,493 22,422
Income tax effect, note 32.1(i) and 18 (2,042) (5,157)
Result from foreign currency translation 61,753 77,291 _________ _________
Other comprehensive income, net of income tax 66,204 94,556 _________ _________
Total comprehensive income 365,476 287,847 _________ _________
Attributable to:
Equity holders of the parent 362,750 285,609
Non-controlling interests 2,726 2,238 _________ _________
365,476 287,847 _________ _________
Las Notas a los estados financieros consolidados adjuntos son parte integrante de este estado.
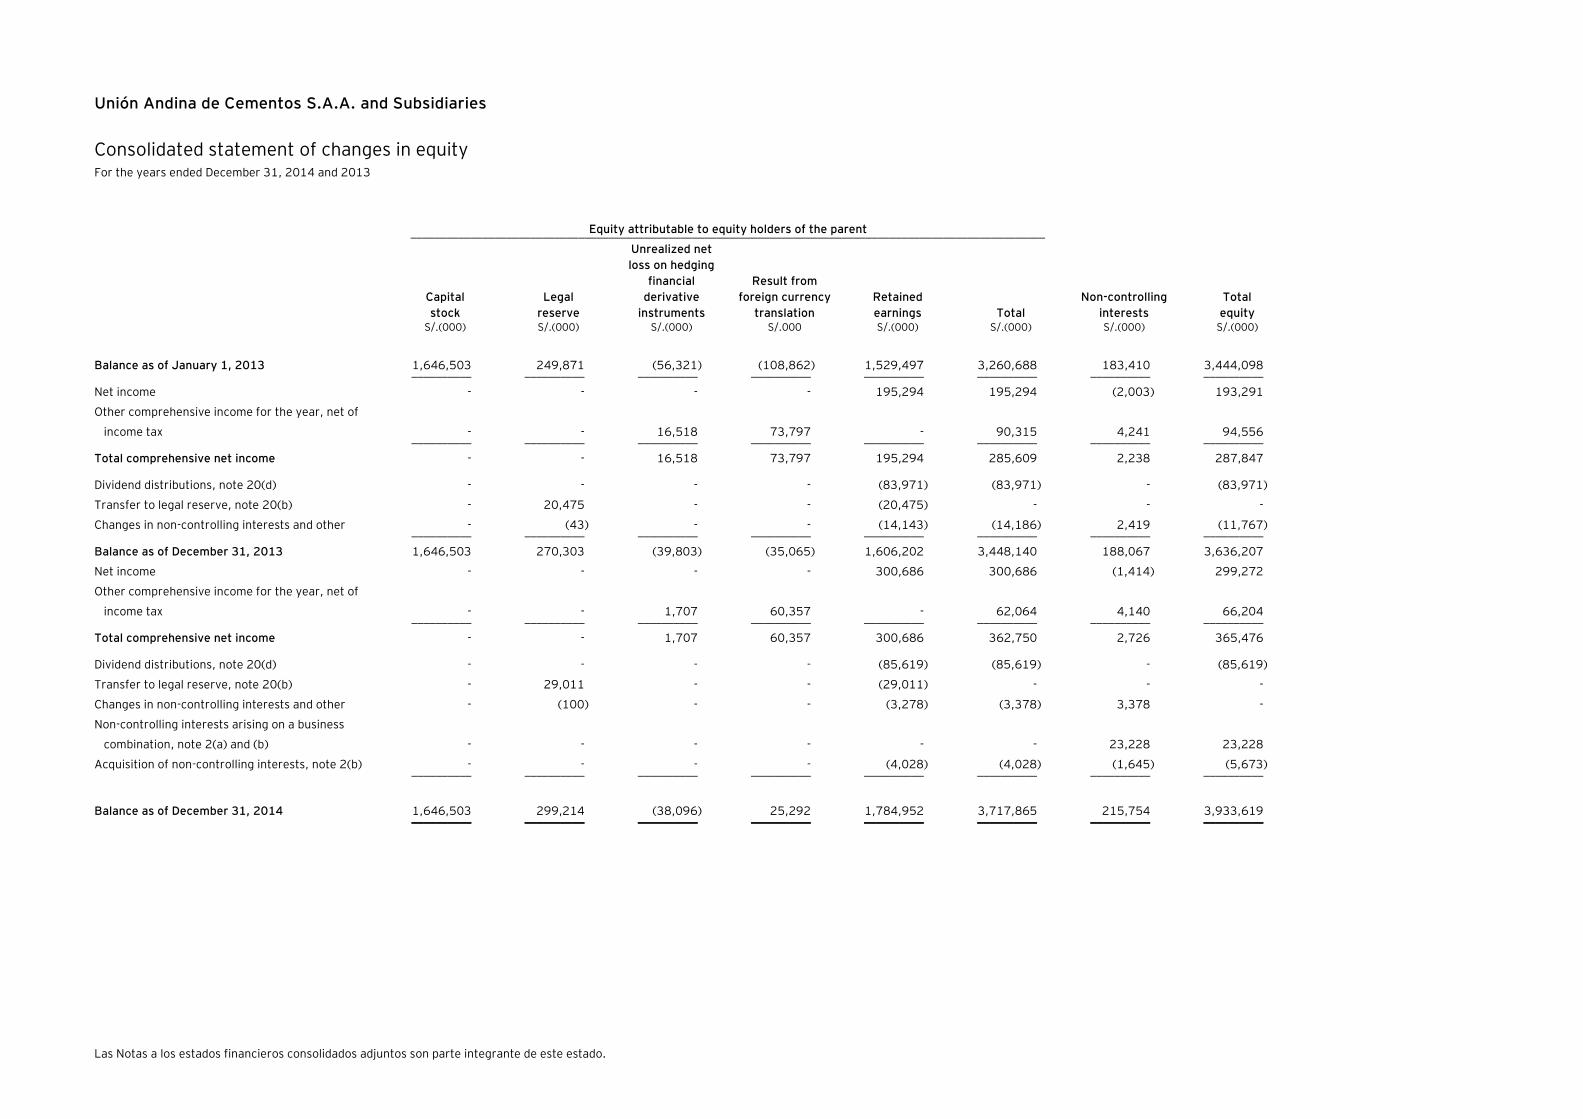
Unión Andina de Cementos S.A.A. and Subsidiaries
Consolidated statement of changes in equity For the years ended December 31, 2014 and 2013
Equity attributable to equity holders of the parent __________________________________________________________________________________________________________
Capital
stock
Legal
reserve
Unrealized net
loss on hedging
financial
derivative
instruments
Result from
foreign currency
translation
Retained
earnings Total
Non-controlling
interests
Total
equity S/.(000) S/.(000) S/.(000) S/.000 S/.(000) S/.(000) S/.(000) S/.(000)
Balance as of January 1, 2013 1,646,503 249,871 (56,321) (108,862) 1,529,497 3,260,688 183,410 3,444,098 __________ __________ __________ __________ __________ __________ __________ __________
Net income - - - - 195,294 195,294 (2,003) 193,291
Other comprehensive income for the year, net of
income tax - - 16,518 73,797 - 90,315 4,241 94,556 __________ __________ __________ __________ __________ __________ __________ __________
Total comprehensive net income - - 16,518 73,797 195,294 285,609 2,238 287,847
Dividend distributions, note 20(d) - - - - (83,971) (83,971) - (83,971)
Transfer to legal reserve, note 20(b) - 20,475 - - (20,475) - - -
Changes in non-controlling interests and other - (43) - - (14,143) (14,186) 2,419 (11,767) __________ __________ __________ __________ __________ __________ __________ __________
Balance as of December 31, 2013 1,646,503 270,303 (39,803) (35,065) 1,606,202 3,448,140 188,067 3,636,207
Net income - - - - 300,686 300,686 (1,414) 299,272
Other comprehensive income for the year, net of
income tax - - 1,707 60,357 - 62,064 4,140 66,204 __________ __________ __________ __________ __________ __________ __________ __________
Total comprehensive net income - - 1,707 60,357 300,686 362,750 2,726 365,476
Dividend distributions, note 20(d) - - - - (85,619) (85,619) - (85,619)
Transfer to legal reserve, note 20(b) - 29,011 - - (29,011) - - -
Changes in non-controlling interests and other - (100) - - (3,278) (3,378) 3,378 -
Non-controlling interests arising on a business
combination, note 2(a) and (b) - - - -
-
-
23,228
23,228
Acquisition of non-controlling interests, note 2(b) - - - - (4,028) (4,028) (1,645) (5,673) __________ __________ __________ __________ __________ __________ __________ __________
Balance as of December 31, 2014 1,646,503 299,214 (38,096) 25,292 1,784,952 3,717,865 215,754 3,933,619 __________ __________ __________ __________ __________ __________ __________ __________
The accompanying notes are an integral part of this consolidated statement.
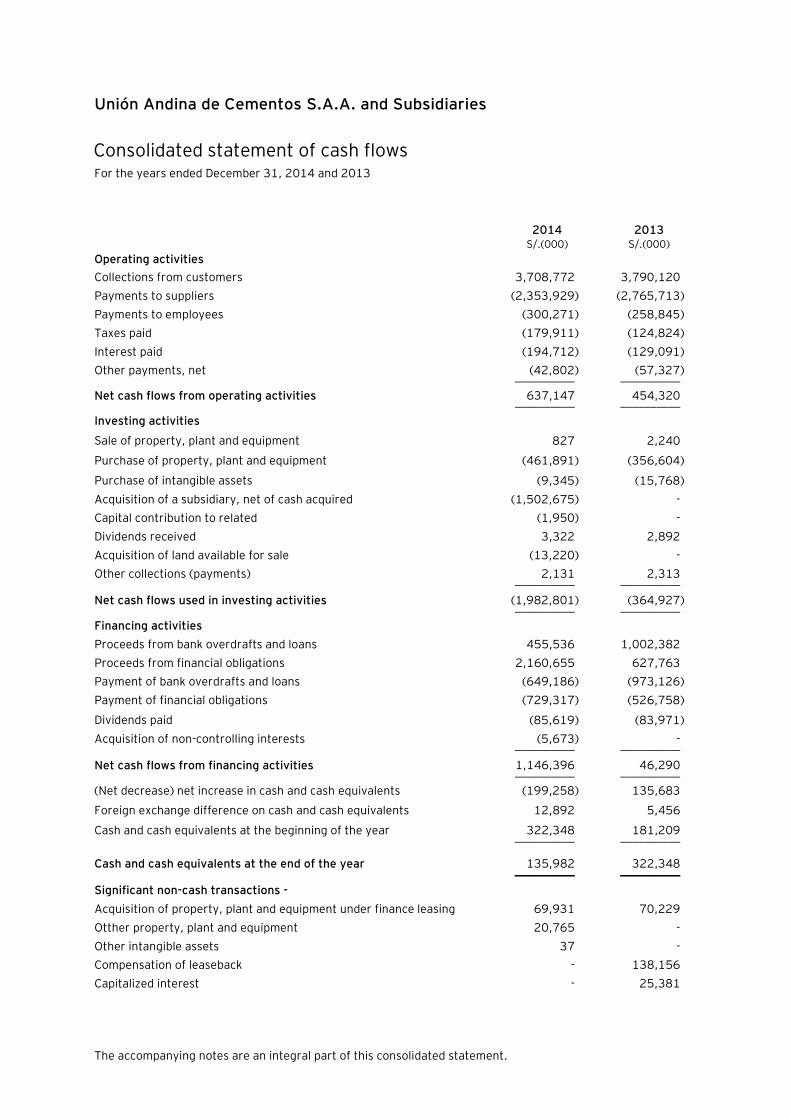
Unión Andina de Cementos S.A.A. and Subsidiaries
Consolidated statement of cash flows For the years ended December 31, 2014 and 2013
2014 2013 S/.(000) S/.(000)
Operating activities
Collections from customers 3,708,772 3,790,120
Payments to suppliers (2,353,929) (2,765,713)
Payments to employees (300,271) (258,845)
Taxes paid (179,911) (124,824)
Interest paid (194,712) (129,091)
Other payments, net (42,802) (57,327) __________ __________
Net cash flows from operating activities 637,147 454,320 __________ __________
Investing activities
Sale of property, plant and equipment 827 2,240
Purchase of property, plant and equipment (461,891) (356,604)
Purchase of intangible assets (9,345) (15,768)
Acquisition of a subsidiary, net of cash acquired (1,502,675) -
Capital contribution to related (1,950) -
Dividends received 3,322 2,892
Acquisition of land available for sale (13,220) -
Other collections (payments) 2,131 2,313 __________ __________
Net cash flows used in investing activities (1,982,801) (364,927) __________ __________
Financing activities
Proceeds from bank overdrafts and loans 455,536 1,002,382
Proceeds from financial obligations 2,160,655 627,763
Payment of bank overdrafts and loans (649,186) (973,126)
Payment of financial obligations (729,317) (526,758)
Dividends paid (85,619) (83,971)
Acquisition of non-controlling interests (5,673) - __________ __________
Net cash flows from financing activities 1,146,396 46,290 __________ __________
(Net decrease) net increase in cash and cash equivalents (199,258) 135,683
Foreign exchange difference on cash and cash equivalents 12,892 5,456
Cash and cash equivalents at the beginning of the year 322,348 181,209 __________ __________
Cash and cash equivalents at the end of the year 135,982 322,348 __________ __________
Significant non-cash transactions -
Acquisition of property, plant and equipment under finance leasing 69,931 70,229
Otther property, plant and equipment 20,765 -
Other intangible assets 37 -
Compensation of leaseback - 138,156
Capitalized interest - 25,381
Unión Andina de Cementos S.A.A. and Subsidiaries
Note to the consolidated financial statements As of December 31, 2014 and 2013
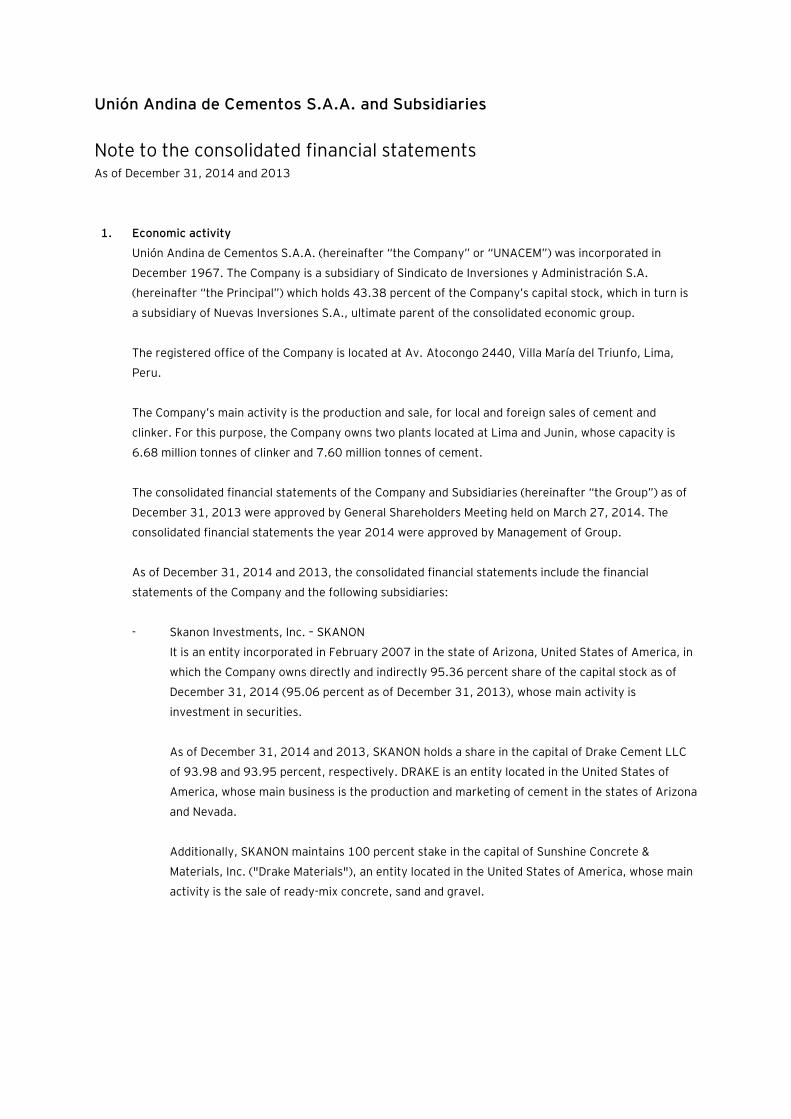
1. Economic activity
Unión Andina de Cementos S.A.A. (hereinafter “the Company” or “UNACEM”) was incorporated in
December 1967. The Company is a subsidiary of Sindicato de Inversiones y Administración S.A.
(hereinafter “the Principal”) which holds 43.38 percent of the Company’s capital stock, which in turn is
a subsidiary of Nuevas Inversiones S.A., ultimate parent of the consolidated economic group.
The registered office of the Company is located at Av. Atocongo 2440, Villa María del Triunfo, Lima,
Peru.
The Company’s main activity is the production and sale, for local and foreign sales of cement and
clinker. For this purpose, the Company owns two plants located at Lima and Junin, whose capacity is
6.68 million tonnes of clinker and 7.60 million tonnes of cement.
The consolidated financial statements of the Company and Subsidiaries (hereinafter “the Group”) as of
December 31, 2013 were approved by General Shareholders Meeting held on March 27, 2014. The
consolidated financial statements the year 2014 were approved by Management of Group.
As of December 31, 2014 and 2013, the consolidated financial statements include the financial
statements of the Company and the following subsidiaries:
- Skanon Investments, Inc. – SKANON
It is an entity incorporated in February 2007 in the state of Arizona, United States of America, in
which the Company owns directly and indirectly 95.36 percent share of the capital stock as of
December 31, 2014 (95.06 percent as of December 31, 2013), whose main activity is
investment in securities.
As of December 31, 2014 and 2013, SKANON holds a share in the capital of Drake Cement LLC
of 93.98 and 93.95 percent, respectively. DRAKE is an entity located in the United States of
America, whose main business is the production and marketing of cement in the states of Arizona
and Nevada.
Additionally, SKANON maintains 100 percent stake in the capital of Sunshine Concrete &
Materials, Inc. ("Drake Materials"), an entity located in the United States of America, whose main
activity is the sale of ready-mix concrete, sand and gravel.
Notes to the consolidated financial statements (continued)
2
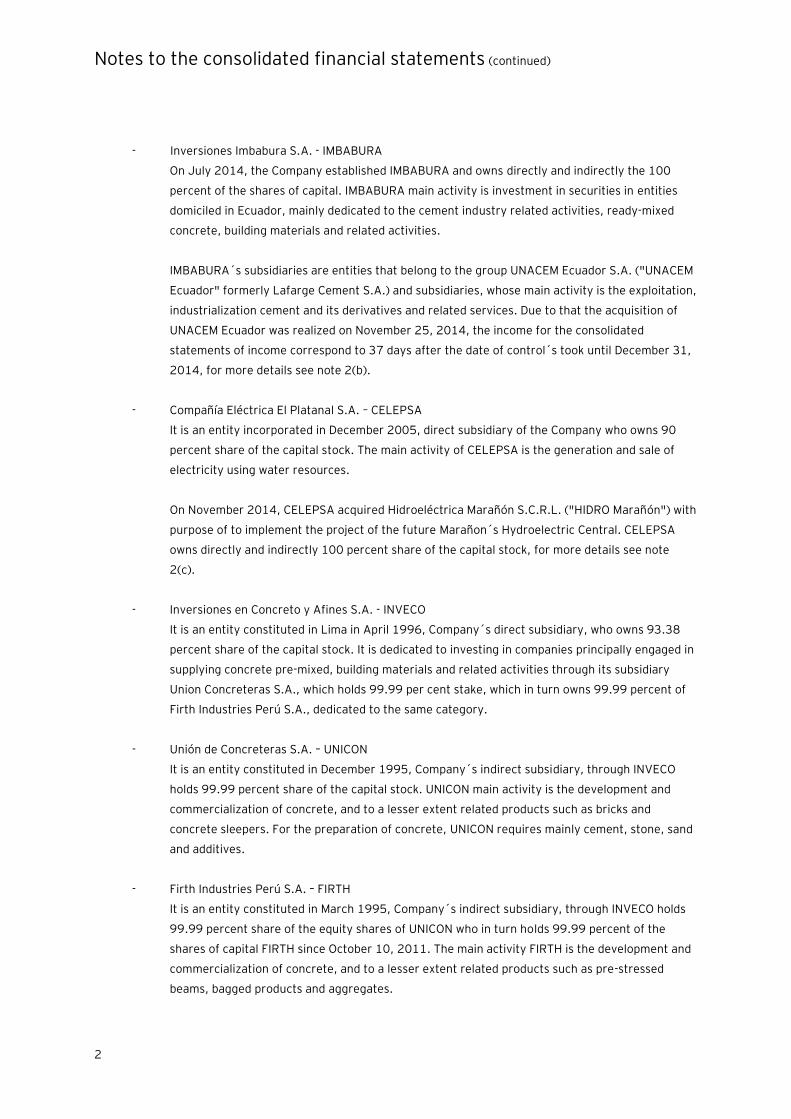
- Inversiones Imbabura S.A. - IMBABURA
On July 2014, the Company established IMBABURA and owns directly and indirectly the 100
percent of the shares of capital. IMBABURA main activity is investment in securities in entities
domiciled in Ecuador, mainly dedicated to the cement industry related activities, ready-mixed
concrete, building materials and related activities.
IMBABURA´s subsidiaries are entities that belong to the group UNACEM Ecuador S.A. ("UNACEM
Ecuador" formerly Lafarge Cement S.A.) and subsidiaries, whose main activity is the exploitation,
industrialization cement and its derivatives and related services. Due to that the acquisition of
UNACEM Ecuador was realized on November 25, 2014, the income for the consolidated
statements of income correspond to 37 days after the date of control´s took until December 31,
2014, for more details see note 2(b).
- Compañía Eléctrica El Platanal S.A. – CELEPSA
It is an entity incorporated in December 2005, direct subsidiary of the Company who owns 90
percent share of the capital stock. The main activity of CELEPSA is the generation and sale of
electricity using water resources.
On November 2014, CELEPSA acquired Hidroeléctrica Marañón S.C.R.L. ("HIDRO Marañón") with
purpose of to implement the project of the future Marañon´s Hydroelectric Central. CELEPSA
owns directly and indirectly 100 percent share of the capital stock, for more details see note
2(c).
- Inversiones en Concreto y Afines S.A. - INVECO
It is an entity constituted in Lima in April 1996, Company´s direct subsidiary, who owns 93.38
percent share of the capital stock. It is dedicated to investing in companies principally engaged in
supplying concrete pre-mixed, building materials and related activities through its subsidiary
Union Concreteras S.A., which holds 99.99 per cent stake, which in turn owns 99.99 percent of
Firth Industries Perú S.A., dedicated to the same category.
- Unión de Concreteras S.A. – UNICON
It is an entity constituted in December 1995, Company´s indirect subsidiary, through INVECO
holds 99.99 percent share of the capital stock. UNICON main activity is the development and
commercialization of concrete, and to a lesser extent related products such as bricks and
concrete sleepers. For the preparation of concrete, UNICON requires mainly cement, stone, sand
and additives.
- Firth Industries Perú S.A. – FIRTH
It is an entity constituted in March 1995, Company´s indirect subsidiary, through INVECO holds
99.99 percent share of the equity shares of UNICON who in turn holds 99.99 percent of the
shares of capital FIRTH since October 10, 2011. The main activity FIRTH is the development and
commercialization of concrete, and to a lesser extent related products such as pre-stressed
beams, bagged products and aggregates.
Notes to the consolidated financial statements (continued)
3
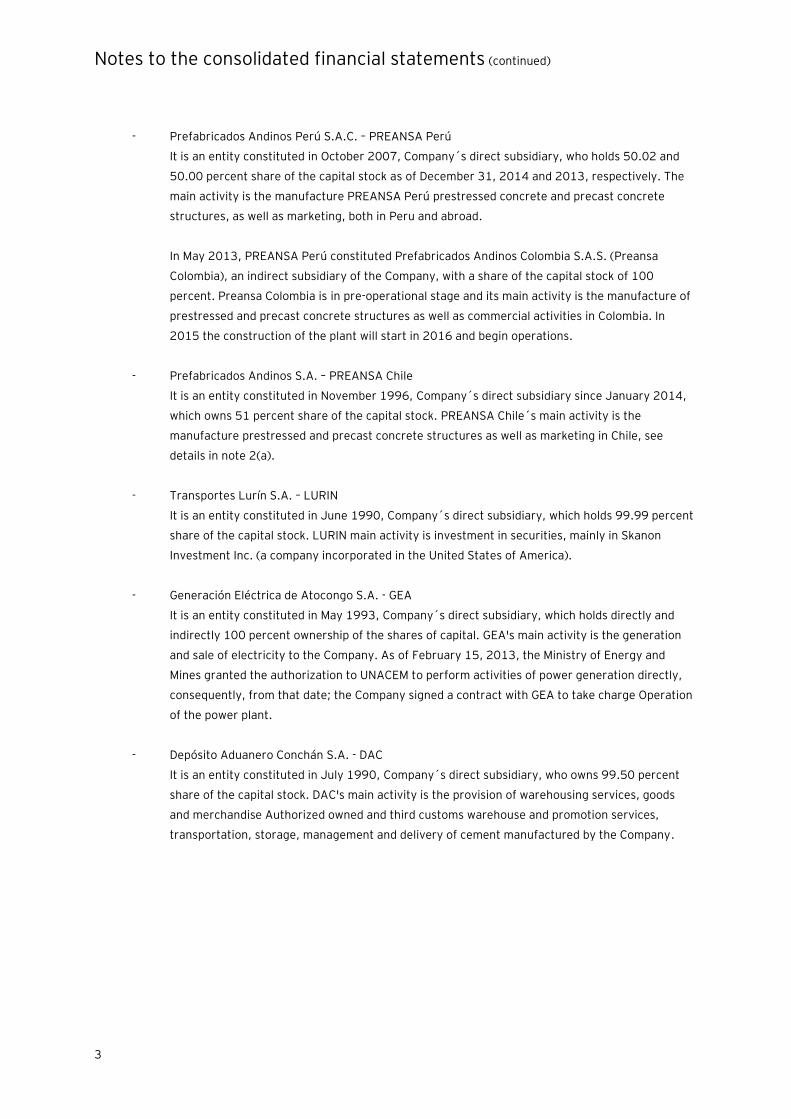
- Prefabricados Andinos Perú S.A.C. – PREANSA Perú
It is an entity constituted in October 2007, Company´s direct subsidiary, who holds 50.02 and
50.00 percent share of the capital stock as of December 31, 2014 and 2013, respectively. The
main activity is the manufacture PREANSA Perú prestressed concrete and precast concrete
structures, as well as marketing, both in Peru and abroad.
In May 2013, PREANSA Perú constituted Prefabricados Andinos Colombia S.A.S. (Preansa
Colombia), an indirect subsidiary of the Company, with a share of the capital stock of 100
percent. Preansa Colombia is in pre-operational stage and its main activity is the manufacture of
prestressed and precast concrete structures as well as commercial activities in Colombia. In
2015 the construction of the plant will start in 2016 and begin operations.
- Prefabricados Andinos S.A. – PREANSA Chile
It is an entity constituted in November 1996, Company´s direct subsidiary since January 2014,
which owns 51 percent share of the capital stock. PREANSA Chile´s main activity is the
manufacture prestressed and precast concrete structures as well as marketing in Chile, see
details in note 2(a).
- Transportes Lurín S.A. – LURIN
It is an entity constituted in June 1990, Company´s direct subsidiary, which holds 99.99 percent
share of the capital stock. LURIN main activity is investment in securities, mainly in Skanon
Investment Inc. (a company incorporated in the United States of America).
- Generación Eléctrica de Atocongo S.A. - GEA
It is an entity constituted in May 1993, Company´s direct subsidiary, which holds directly and
indirectly 100 percent ownership of the shares of capital. GEA's main activity is the generation
and sale of electricity to the Company. As of February 15, 2013, the Ministry of Energy and
Mines granted the authorization to UNACEM to perform activities of power generation directly,
consequently, from that date; the Company signed a contract with GEA to take charge Operation
of the power plant.
- Depósito Aduanero Conchán S.A. - DAC
It is an entity constituted in July 1990, Company´s direct subsidiary, who owns 99.50 percent
share of the capital stock. DAC's main activity is the provision of warehousing services, goods
and merchandise Authorized owned and third customs warehouse and promotion services,
transportation, storage, management and delivery of cement manufactured by the Company.
Notes to the consolidated financial statements (continued)
4
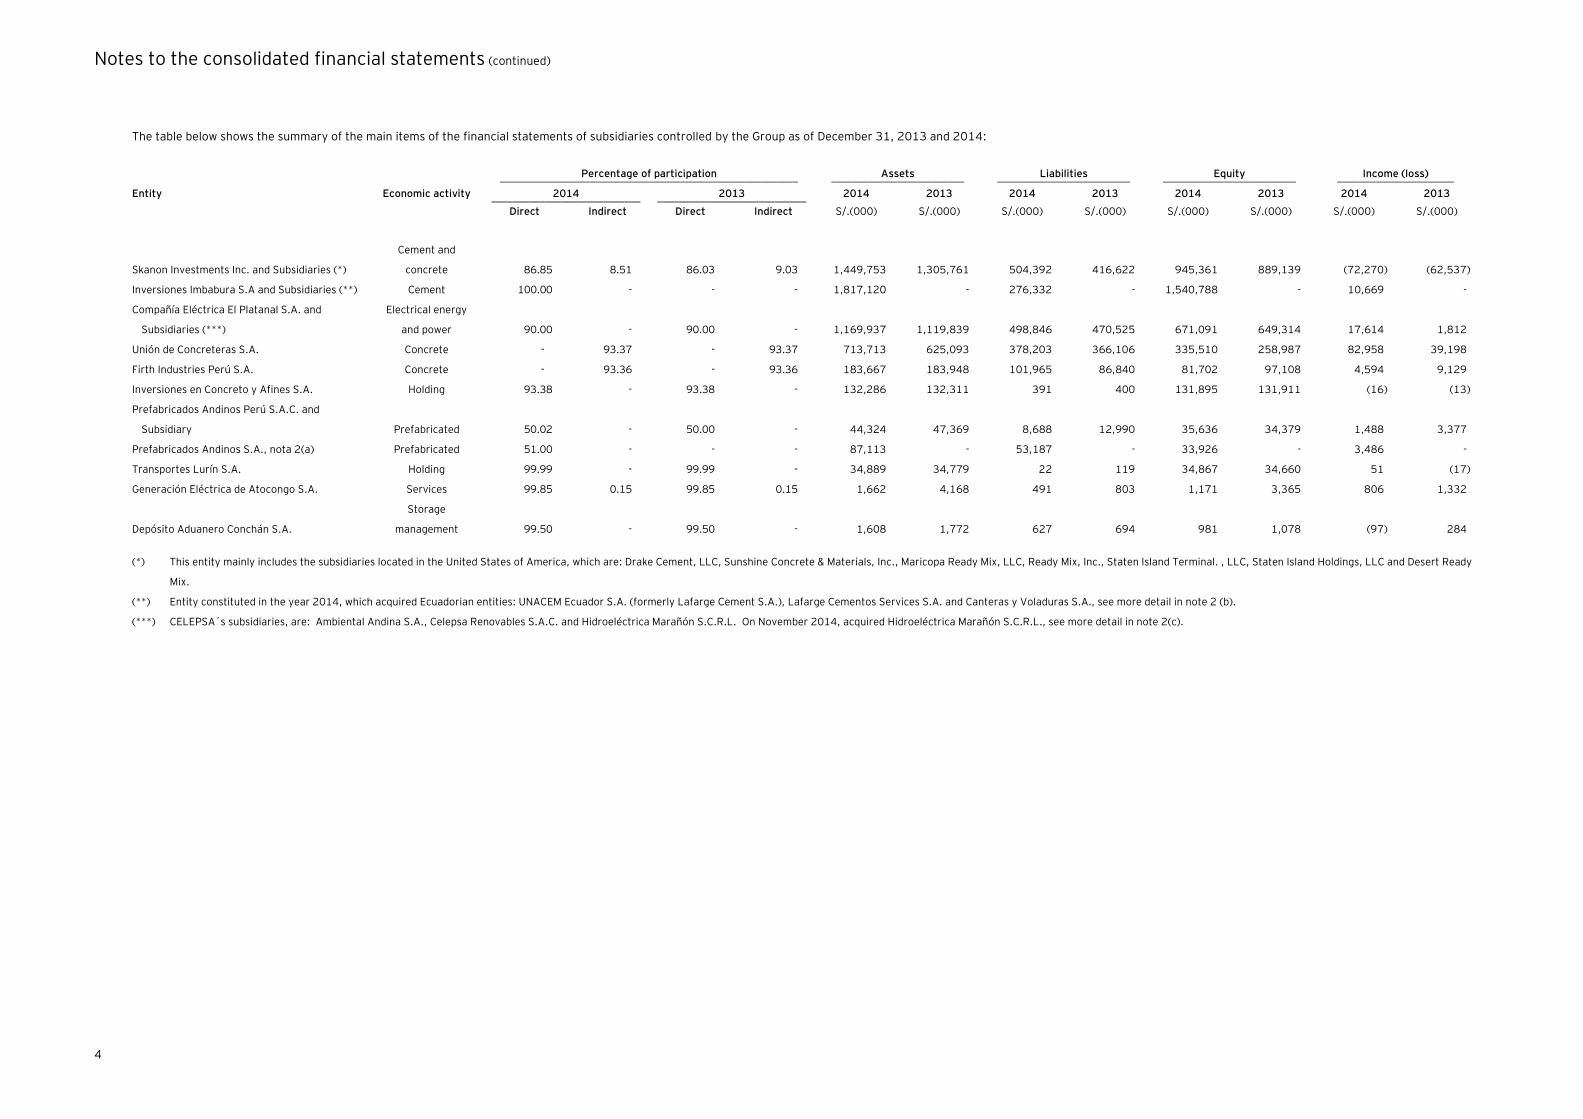
The table below shows the summary of the main items of the financial statements of subsidiaries controlled by the Group as of December 31, 2013 and 2014:
Percentage of participation Assets Liabilities Equity Income (loss) ________________________________________________________ _________________________ _________________________ _________________________ ______________________
Entity Economic activity 2014 2013 2014 2013 2014 2013 2014 2013 2014 2013 ____________________________ ____________________________
Direct Indirect Direct Indirect S/.(000) S/.(000) S/.(000) S/.(000) S/.(000) S/.(000) S/.(000) S/.(000)
Skanon Investments Inc. and Subsidiaries (*)
Cement and
concrete 86.85 8.51 86.03 9.03 1,449,753 1,305,761 504,392 416,622 945,361 889,139 (72,270) (62,537)
Inversiones Imbabura S.A and Subsidiaries (**) Cement 100.00 - - - 1,817,120 - 276,332 - 1,540,788 - 10,669 -
Compañía Eléctrica El Platanal S.A. and
Subsidiaries (***)
Electrical energy
and power 90.00 - 90.00 - 1,169,937 1,119,839 498,846 470,525 671,091 649,314 17,614 1,812
Unión de Concreteras S.A. Concrete - 93.37 - 93.37 713,713 625,093 378,203 366,106 335,510 258,987 82,958 39,198
Firth Industries Perú S.A. Concrete - 93.36 - 93.36 183,667 183,948 101,965 86,840 81,702 97,108 4,594 9,129
Inversiones en Concreto y Afines S.A. Holding 93.38 - 93.38 - 132,286 132,311 391 400 131,895 131,911 (16) (13)
Prefabricados Andinos Perú S.A.C. and
Subsidiary
Prefabricated 50.02 - 50.00 - 44,324 47,369 8,688 12,990 35,636 34,379 1,488 3,377
Prefabricados Andinos S.A., nota 2(a) Prefabricated 51.00 - - - 87,113 - 53,187 - 33,926 - 3,486 -
Transportes Lurín S.A. Holding 99.99 - 99.99 - 34,889 34,779 22 119 34,867 34,660 51 (17)
Generación Eléctrica de Atocongo S.A. Services 99.85 0.15 99.85 0.15 1,662 4,168 491 803 1,171 3,365 806 1,332
Depósito Aduanero Conchán S.A.
Storage
management 99.50 - 99.50 - 1,608 1,772 627 694 981 1,078 (97) 284
(*) This entity mainly includes the subsidiaries located in the United States of America, which are: Drake Cement, LLC, Sunshine Concrete & Materials, Inc., Maricopa Ready Mix, LLC, Ready Mix, Inc., Staten Island Terminal. , LLC, Staten Island Holdings, LLC and Desert Ready
Mix.
(**) Entity constituted in the year 2014, which acquired Ecuadorian entities: UNACEM Ecuador S.A. (formerly Lafarge Cement S.A.), Lafarge Cementos Services S.A. and Canteras y Voladuras S.A., see more detail in note 2 (b).
(***) CELEPSA´s subsidiaries, are: Ambiental Andina S.A., Celepsa Renovables S.A.C. and Hidroeléctrica Marañón S.C.R.L. On November 2014, acquired Hidroeléctrica Marañón S.C.R.L., see more detail in note 2(c).
Notes to the consolidated financial statements (continued)
5
2. Business combinations and acquisition of non-controlling interests
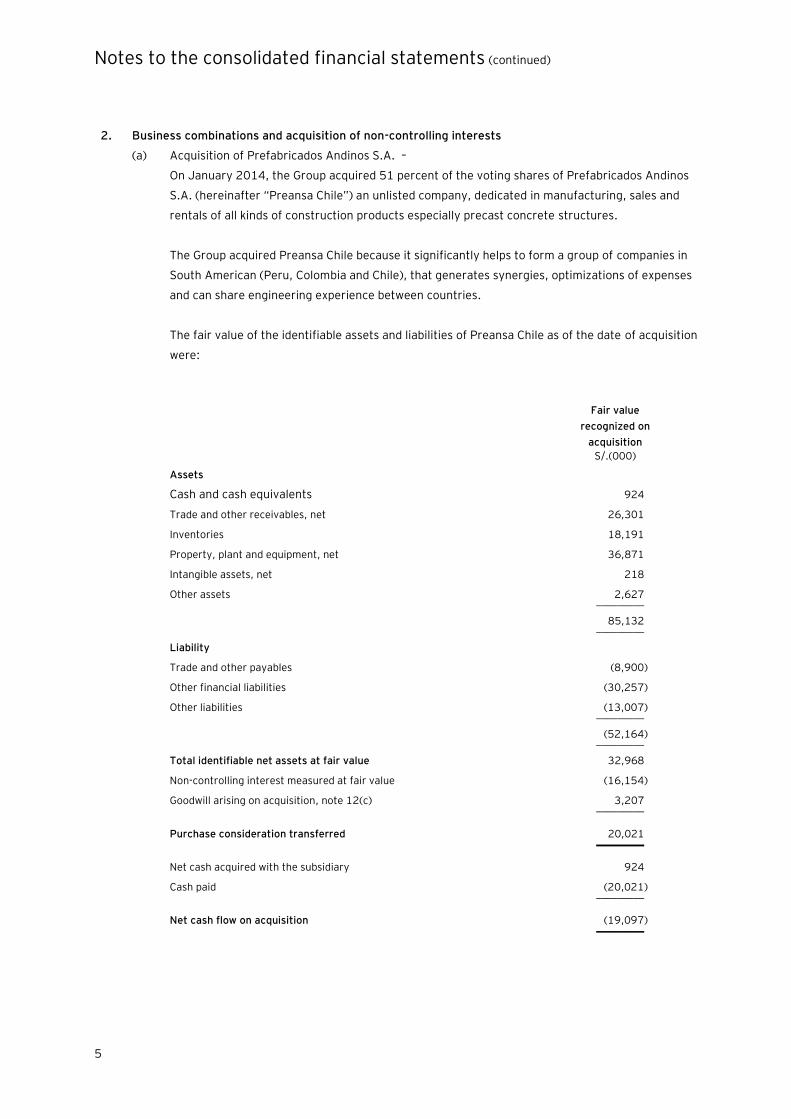
(a) Acquisition of Prefabricados Andinos S.A. –
On January 2014, the Group acquired 51 percent of the voting shares of Prefabricados Andinos
S.A. (hereinafter “Preansa Chile”) an unlisted company, dedicated in manufacturing, sales and
rentals of all kinds of construction products especially precast concrete structures.
The Group acquired Preansa Chile because it significantly helps to form a group of companies in
South American (Peru, Colombia and Chile), that generates synergies, optimizations of expenses
and can share engineering experience between countries.
The fair value of the identifiable assets and liabilities of Preansa Chile as of the date of acquisition
were:
Fair value
recognized on
acquisition
S/.(000)
Assets
Cash and cash equivalents 924
Trade and other receivables, net 26,301
Inventories 18,191
Property, plant and equipment, net 36,871
Intangible assets, net 218
Other assets 2,627 _________
85,132 _________
Liability
Trade and other payables (8,900)
Other financial liabilities (30,257)
Other liabilities (13,007) _________
(52,164) _________
Total identifiable net assets at fair value 32,968
Non-controlling interest measured at fair value (16,154)
Goodwill arising on acquisition, note 12(c) 3,207 _________
Purchase consideration transferred 20,021 _________
Net cash acquired with the subsidiary 924
Cash paid (20,021) _________
Net cash flow on acquisition (19,097) _________
Notes to the consolidated financial statements (continued)
6
The Group elected to measure the non-controlling interest in the acquiree at the proportionate
share of its interest in the acquiree’s identifiable net assets.
At the date of the acquisition, the fair value of the trade receivables was S/.26,301,000. The
gross amount of trade receivables is S/.27,007,000. The difference between the fair value and
the gross amount is the result of discounting over the expected timing of the cash collection and
an adjustment for counterparty credit risk. As of December 31, 2014, none of the trade
receivables have been impaired.
As of December 31, 2014, the valuation was completed and was determined the final fair value
of the identifiable net assets of Preansa Chile.
Since the acquisition date, has contributed Preansa Chile S/.61,630,000 and S/.3,486,000 for
income and income before income taxes, respectively, for continuing operations.
The goodwill recognized is mainly attributed to the expected synergies and other benefits from
combining the assets and activities of Preansa Chile with the Group.
The transaction costs of buying Preansa Chile for approximately S/.109,000 are included in
administrative expenses in the consolidated statement of income and are part of operating cash
flows in the consolidated statement of cash flows.
(b) Acquisition of UNACEM Ecuador S.A. (formerly Lafarge Cementos S.A.) and Subsidiaries -
On July 16, 2014, the Company constituted Inversiones Imbabura S.A. with the purpose of which
is the vehicle to purchase shares of UNACEM Ecuador S.A. (formerly Lafarge Cement S.A.)
On November 25, 2014, IMBABURA acquired 98.57 percent of total shares representing of
Lafarge´s capital and took control of the operations thereof, whose economic activity is the
production and sale of cement in Ecuador with a capacity of production of 1.4 million tonnes of
cement per year. At the date of acquisition, UNACEM Ecuador are:
(i) Lafarge Cementos Services S.A., dedicated to the activity of advice in accounting,
advertising, audit and legal; and
(ii) Canteras y Voladuras S.A. which is dedicated to conducting mining activities, operation
and sales of all kinds of mineral, smelting, refining and alloys of non-ferrous metals such
as copper, lead, chromium, magnesium, zinc, aluminum, nickel, and tin.
The Group acquired UNACEM Ecuador and Subsidiaries, as part of the strategy of consolidation
and diversification of our cement and prefabricated in the region. It also seeks to generate
synergies, cost optimization and engineering experience sharing among countries.

Notes to the consolidated financial statements (continued)
7
The fair value of the assets and liabilities of UNACEM Ecuador and Subsidiaries as of the date of
acquisition were:
Fair value
recognized on
acquisition
S/.(000)
Assets
Cash and cash equivalents 41,328
Trade and other receivables, net 29,199
Inventories, net 70,053
Property, plant and equipment 529,875
Intangible assets, net 129,373
Deferred income tax asset 101
Other assets 88 _________
800,017 _________
Liabilities
Other financial liabilities (147,347)
Trade and other payables (91,685)
Deferred income tax liability (57,335)
Provisions (10,591) _________
(306,958) _________
Total identifiable net assets at fair value 493,059
Non-controlling interest measured at fair value (7,074)
Goodwill arising on acquisition, note 12(c) 1,029,058 _________
Purchase consideration transferred 1,515,043 ________
Net cash acquired with the subsidiary 41,328
Cash paid (1,515,043) _________
Net cash flow on acquisition (1,473,715) ________
As of December 31, 2014, the Group´s Management has made its best estimate regarding this
transaction; however, according to IFRS 3, the Group´s Management has a period of one year
from the date of purchase to establish the final asset and liability fair values of UNACEM Ecuador.
In the opinion Group´s Management, significant changes in its initial assessment should not exist.
The Group decided to measure the non-controlling interest at its proportionate interest in the
identifiable net assets acquired.
Notes to the consolidated financial statements (continued)
8
Since the date of acquisition, UNACEM Ecuador and Subsidiaries have contributed
S/.52,041,000 and S/.10,756,000 of income and income before income taxes, respectively,
from continuing operations. If the combination had taken place at the beginning of the year,
income from continuing operations would have been S/.558,311,000 and income before tax
from continuing operations would have been S/.167,583,000.
The goodwill is mainly attributable to the expected synergies and other benefits from combining
the assets and activities UNACEM Ecuador and Subsidiaries with the Group.
Acquisition of an additional interest in UNACEM Ecuador and Subsidiaries –
In December 2014, the Group acquired an additional 0.32 percent of the shares with right to
vote of UNACEM Ecuador and increasing its ownership interest to 98.89 percent. Non-controlling
shareholders received a cash payment of US$1,916,000 (equivalent to S/.5,673,000). The
carrying amount of the net assets of UNACEM Ecuador (excluding the gain arising on the original
acquisition) at that date was S/.514,072,000. Then the additional interest acquired is as follows:
S/.(000)
Cash consideration paid to non-controlling shareholders 5,673
Carrying value of the additional interest (1,645) _________
Difference recognized in retained earnings 4,028 ________
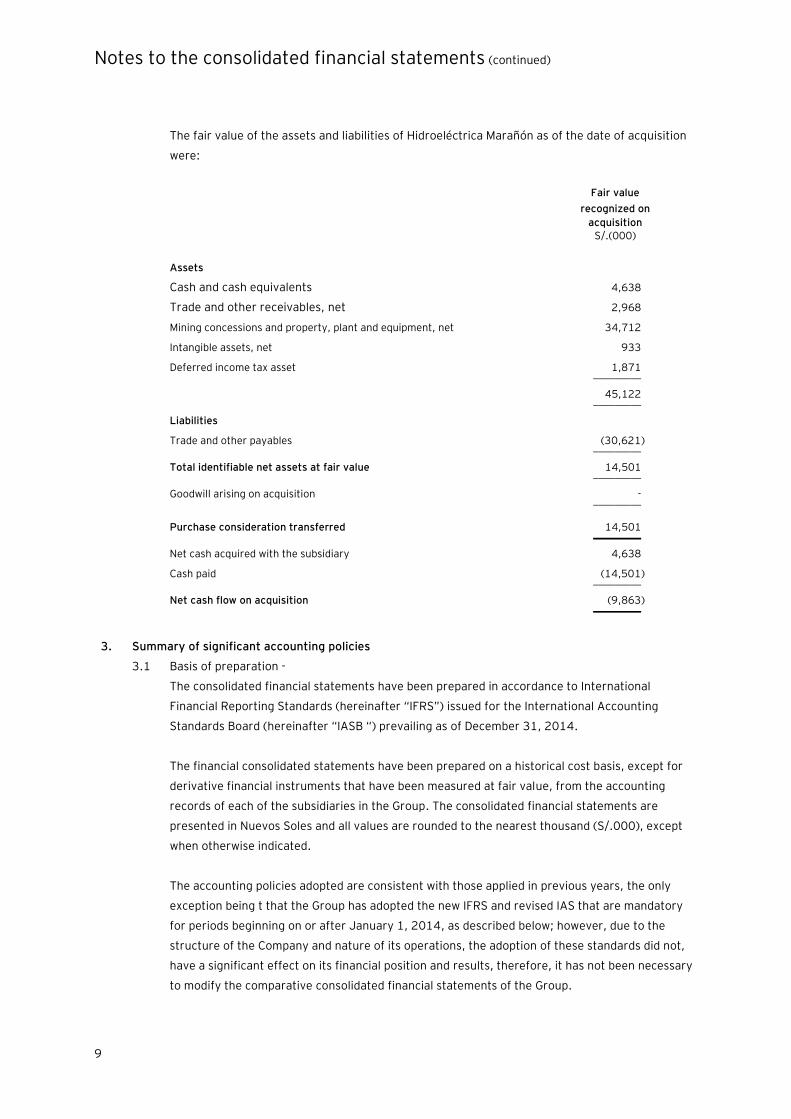
(c) Acquisition of Hidroeléctrica Marañón S.C.R.L. –
On November 2014, CELEPSA and its subsidiary Celepsa Renovables S.A.C. acquired 100
percent of the shares of Hidroeléctrica Marañón S.C.R.L. with the purpose of implement the
future project Hydroelectric Central´s Marañon, with waters of the Marañon River to 2,900
m.s.n.m., near the town of Nuevas Flores, Huamalíes province, Huanuco city, Peru.
The project, with a final generation concession to 88 MW, has been recast in 20 MW to increase
factor of firm ground, while reducing construction (geological), environmental and social risks.
The work is already underway and is expected to be operating the plant on December 2016.
Notes to the consolidated financial statements (continued)
9
The fair value of the assets and liabilities of Hidroeléctrica Marañón as of the date of acquisition
were:
Fair value
recognized on
acquisition S/.(000)
Assets
Cash and cash equivalents 4,638
Trade and other receivables, net 2,968
Mining concessions and property, plant and equipment, net 34,712
Intangible assets, net 933
Deferred income tax asset 1,871 _________
45,122 _________
Liabilities
Trade and other payables (30,621) _________
Total identifiable net assets at fair value 14,501 _________
Goodwill arising on acquisition - _________
Purchase consideration transferred 14,501 _________
Net cash acquired with the subsidiary 4,638
Cash paid (14,501) _________
Net cash flow on acquisition (9,863) _________
3. Summary of significant accounting policies
3.1 Basis of preparation -
The consolidated financial statements have been prepared in accordance to International
Financial Reporting Standards (hereinafter “IFRS”) issued for the International Accounting
Standards Board (hereinafter “IASB “) prevailing as of December 31, 2014.
The financial consolidated statements have been prepared on a historical cost basis, except for
derivative financial instruments that have been measured at fair value, from the accounting
records of each of the subsidiaries in the Group. The consolidated financial statements are
presented in Nuevos Soles and all values are rounded to the nearest thousand (S/.000), except
when otherwise indicated.
The accounting policies adopted are consistent with those applied in previous years, the only
exception being t that the Group has adopted the new IFRS and revised IAS that are mandatory
for periods beginning on or after January 1, 2014, as described below; however, due to the
structure of the Company and nature of its operations, the adoption of these standards did not,
have a significant effect on its financial position and results, therefore, it has not been necessary
to modify the comparative consolidated financial statements of the Group.
Notes to the consolidated financial statements (continued)
10
- Investment entities. Amendments to IFRS 10, IFRS 12 and IAS 27
These amendments provide an exception to the consolidation requirement for entities that
meet the definition of an “investment entity” under IFRS 10 Consolidated Financial
Statements and must be applied retrospectively, subject to certain transition relief. The
exception to consolidation requires investment entities to account for subsidiaries at fair
value through profit or loss. These amendments have no impact on the Company, since
none of the entities in the Group qualifies to be an investment entity under IFRS 10.
- Offsetting financial assets and financial liabilities. Amendments to IAS 32
These amendments clarify the meaning of “currently has a legally enforceable right to set-
off” and the criteria for non-simultaneous settlement mechanisms of clearing houses to
qualify for offsetting and is applied retrospectively. These amendments have no impact on
the Group, since none of the entities in the Company has any offsetting arrangements.
- Novation of derivatives and continuation of hedge accounting. Amendments to IAS 39
These amendments provide relief from discontinuing hedge accounting when novation of
a derivative designated as a hedging instrument meets certain criteria and retrospective
application is required. These amendments have no impact on the Group since it has not
novated its derivatives during the current or prior periods.
- IFRIC 21 Levies
IFRIC 21 clarifies that an entity recognizes a liability for a levy when the activity that
triggers payment, as identified by the relevant legislation, occurs. For a levy that is
triggered upon reaching a minimum threshold, the interpretation clarifies that no liability
should be anticipated before the specified minimum threshold is reached. Retrospective
application is required for IFRIC 21. This interpretation has no impact on the Group as it
has applied the recognition principles under IAS 37 Provisions, Contingent Liabilities and
Contingent Assets consistent with the requirements of IFRIC 21 in prior years.
- Annual Improvements 2010-2012 Cycle
In the 2010-2012 annual improvements cycle, the IASB issued seven amendments to six
standards, which included an amendment to IFRS 13 Fair Value Measurement. The
amendment to IFRS 13 is effective immediately and, thus, for periods beginning on
January 1st, 2014, and it clarifies in the Basis for Conclusions that short-term receivables
and payables with no stated interest rates can be measured at invoice amounts when the
effect of discounting is immaterial. This amendment to IFRS 13 has no impact on the
Group.
- Annual Improvements 2011-2013 Cycle
In the 2011-2013 annual improvements cycle, the IASB issued four amendments to four
standards, which included an amendment to IFRS 1 First-time Adoption of International
Financial Reporting Standards. The amendment to IFRS 1 is effective immediately and,
thus, for periods beginning a on January 1st, 2014, and clarifies in the Basis for
Conclusions that an entity may choose to apply either a current standard or a new
standard that is not yet mandatory, but permits early application, provided either
Notes to the consolidated financial statements (continued)
11
standard is applied consistently throughout the periods presented in the entity’s first IFRS
financial statements. This amendment to IFRS 1 has no impact on the Group, since it
already prepares its financial statements consistent with IFRS and is not a first-time
adopter of IFRS.
3.2 Basis of consolidation -
The consolidated financial statements comprise the financial statements of the Group and its
subsidiaries as of December 31, 2014. Control is achieved when the Group is exposed, or has
rights, to variable returns from its involvement with the investee and has the ability to affect
those returns through its power over the investee.
Specifically, the Group controls an investee if, and only if, the Group has:
- Power over the investee (i.e., existing rights that give it the current ability to direct the
relevant activities of the investee).
- Exposure, or rights, to variable returns from its involvement with the investee.
- The ability to use its power over the investee to affect its returns.
When the Group has less than a majority of the voting or similar rights of an investee, the Group
considers all relevant facts and circumstances in assessing whether it has power over an
investee, including:
- The contractual arrangement with the other vote holders of the investee.
- Rights arising from other contractual arrangements.
- The Group’s voting rights and potential voting rights.
The Group re-assesses whether or not it controls an investee if facts and circumstances indicate
that there are changes to one or more of the three elements of control. Consolidation of a
subsidiary begins when the Group obtains control over the subsidiary and ceases when the Group
loses control of the subsidiary. Assets, liabilities, income and expenses of a subsidiary acquired
or disposed of during the year are included in the consolidated financial statements from the date
the Group gains control until the date the Group ceases to control the subsidiary.
Profit or loss and each component of other comprehensive income (OCI) are attributed to the
equity holders of the parent of the Group and to the non-controlling interests, even if this results
in the non-controlling interests having a deficit balance. When necessary, adjustments are made
to the financial statements of subsidiaries to bring their accounting policies into line with the
Group’s accounting policies. All intra-group assets and liabilities, equity, income, expenses and
cash flows relating to transactions between members of the Group are eliminated in full on
consolidation.
A change in the ownership interest of a subsidiary, without a loss of control, is accounted for as
an equity transaction.
Notes to the consolidated financial statements (continued)
12
If the Group loses control over a subsidiary, it derecognizes the related assets (including
goodwill), liabilities, non-controlling interest and other components of equity while any resultant
gain or loss is recognized in profit or loss. Any investment retained is recognized at fair value.
3.3 Summary of significant accounting policies -
The following are the significant accounting policies applied by the Group’s Management in
preparing its consolidated financial statements:
(a) Business combinations and goodwill -
Business combinations
Business combinations are accounted for using the acquisition method. The cost of an
acquisition is measured as the aggregate of the consideration transferred measured at
acquisition date fair value and the amount of any non-controlling interests in the acquiree.
For each business combination, the Group elects whether to measure the non-controlling
interests in the acquiree at fair value or at the proportionate share of the acquiree’s
identifiable net assets. Acquisition-related costs are expensed as incurred and included in
the caption “Administrative expenses” in the consolidated statement of income.
When the Group acquires a business, it assesses the financial assets and liabilities
assumed for appropriate classification and designation in accordance with the contractual
terms, economic circumstances and pertinent conditions as at the acquisition date.
If the business combination is achieved in stages, any previously held equity interest is re-
measured at its acquisition date fair value and any resulting gain or loss is recognized in
profit or loss.
Any contingent consideration to be transferred by the acquirer will be recognized at fair
value at the acquisition date. Contingent consideration classified as an asset or liability
that is a financial instrument and within the scope of IAS 39 “Financial Instruments:
Recognition and Measurement”, is measured at fair value with changes in fair value
recognized either in either profit or loss or as a change to OCI. Contingent consideration
that is classified as equity is not re-measured and subsequent settlement is accounted for
within equity.
Goodwill
Goodwill is initially measured at cost, being the excess of the aggregate of the
consideration transferred and the amount recognized for non-controlling interests, and
any previous interest held, over the net identifiable assets acquired and liabilities
assumed. If the fair value of the net assets acquired is in excess of the aggregate
consideration transferred, the Group re-assesses whether it has correctly identified all of
the assets acquired and all of the liabilities assumed and reviews the procedures used to
measure the amounts to be recognized at the acquisition date.
If the re-assessment still results in an excess of the fair value of net assets acquired over
the aggregate consideration transferred, then the gain is recognized in profit or loss.

Notes to the consolidated financial statements (continued)
13
After initial recognition, goodwill is measured at cost less any accumulated impairment
losses. For the purpose of impairment testing, goodwill acquired in a business combination
is, from the acquisition date, allocated to each of the Group’s cash-generating units that
are expected to benefit from the combination, irrespective of whether other assets or
liabilities of the acquire are assigned to those units.
Where goodwill has been allocated to a cash-generating unit and part of the operation
within that unit is disposed of, the goodwill associated with the disposed operation is
included in the carrying amount of the operation when determining the gain or loss on
disposal. Goodwill disposed in these circumstances is measured based on the relative
values of the disposed operation and the portion of the cash-generating unit retained.
(b) Cash and cash equivalents -
Cash and cash equivalents in the consolidated statement of financial position comprise
petty cash, funds to deposit, demand deposits and time deposits with a maturity of three
month or less. For the purpose of the consolidated statement of cash flows, cash and cash
equivalents consist of cash and short–term deposits as defined above.
(c) Financial instruments: initial recognition and subsequent measurement -
(i) Financial assets -
Initial recognition and measurement –
Financial assets within the scope of the International Accounting Standard (IAS) 39
"Financial Instruments: Recognition and Measurement", at the moment of initial
recognition, as financial assets at fair value through profit or loss, loans and
receivables, held-to-maturity investments, available-for-sale financial investments,
or as derivatives designated as hedging instruments in an effective hedge, as
appropriate.
All financial assets are recognized initially at fair value plus, in the case of assets
not at fair value with changes through profit or loss, the transaction costs are
attributable to the acquisition of the financial asset.
Purchases or sales of financial assets that require delivery of assets within a time
frame established by regulation or convention in the market place are recognized
on the date that the Group commits to purchase or sell such assets.
The Group financial assets include cash and cash equivalents, trade and other
receivables and derivative financial instruments.
Notes to the consolidated financial statements (continued)
14
Subsequent measurement -
For purposes of subsequent measurement, financial assets are classified in four
categories:
- Financial assets at fair value through profit or loss;
- Loans and receivables;
- Held-to-maturity investments; and
- Available-for-sale financial investments
Financial assets at fair value through profit or loss -
Financial assets at fair value through profit or loss includes financial assets held for
trading and financial assets designated upon initial recognition as at fair value
through profit or loss. Financial assets are classified as held for trading if they are
acquired for the purpose of selling or repurchasing in the near term.
This category includes derivative financial instruments entered into by the
Company that are not designated as hedging instruments in hedge relationships as
defined by IAS 39.
Loans and receivables -
Loans and receivables are non-derivative financial assets with fixed or
determinable payments that are not quoted in an active market. After initial
measurement, such financial assets are subsequently measured at amortized cost
using the effective interest rate method (EIR), less impairment provisions. The
amortized cost is calculated by taking into account any discount or premium on
acquisition and fees or costs that are an integral part of the EIR. The amortization
of EIR is included in the finance income in the income statement. The losses arising
from impairment are recognized as finance cost in the consolidated statements of
income.
Held-to-maturity investments -
Non-derivative financial assets with fixed or determinable payments and fixed
maturities are classified as held-to-maturity investments when the Group has the
positive intention and ability to hold them to maturity.
The Group did not have any held-to-maturity investments as of December 31, 2014
and 2013.
Available-for-sale financial assets -
Are those designated as such, as they are kept indefinitely and may be sold due to
liquidity needs or changes in interest rates, exchange rates or equity prices; or not
qualified to be classified as at fair value through the income statement or held to
maturity.
Notes to the consolidated financial statements (continued)
15
After initial recognition, available-for-sale financial investments are measured at
fair value. The unrealized gains or losses are recognized directly in the equity,
under caption “unrealized gains or losses”, net of deferred income tax. When the
financial investment is sold, the cumulative gain or loss previously recognized
under net equity is now recognized in the income statement under caption “Finance
costs” or “Finance income”, accordingly.
Dividends earned throughout the investment timeframe are recognized in the
consolidated income statement when the right to collect is established.
The Group has not classified any financial asset as an available-for-sale financial
assets as of December 31, 2014 and 2013.
Derecognition -
A financial asset (or, where applicable, a part of a financial asset or part of a group
of similar financial assets) is derecognized when:
- The rights to receive cash flow from such asset have expired;
- The Group has transferred its rights to receive cash flows from the asset or
has assumed an obligation to pay the received cash flows in full without
material delay to a third party under a “pass through” agreement; and
either (a) the Group has transferred substantially all the risks and rewards of
the asset, or (b) the Group has neither transferred nor retained substantially
all the risks and rewards of the asset, but has transferred control of the
asset.
When the Group has transferred its contractual rights to receive cash flows from an
asset or has entered into a pass-through arrangement, and has neither transferred
nor retained substantially all of the risks and rewards of the asset nor transferred
control of it, the asset is recognized to the extent of the Company’s continuing
involvement in it. In that case, the Group also recognizes an associated liability.
The transferred asset and the associated liability are measured on a basis that
reflects the rights and obligations that the Group has retained.
(ii) Impairment of financial assets -
The Group assess at each reporting date whether there is any objective evidence
that a financial asset or a group of financial assets is impaired. A financial asset or
a group of financial assets is deemed to be impaired if, and only if, there is
objective evidence of impairment as a result of one or more events that has
occurred after the initial recognition of the asset (an incurred “loss event”) and
that loss event has an impact on the estimated future cash flows of the financial
asset or the group of financial assets that can be reliably estimated. Evidence of
impairment may include indications that the debtors or a group of debtors is
experiencing significant financial difficulty, default or delinquency in interest or
principal payments, the probability that they will enter bankruptcy or other
Notes to the consolidated financial statements (continued)
16
financial reorganization and where observable data indicate that there is a
measurable decrease in the estimated future cash flows, such as changes in arrears
or economic conditions that correlate with defaults.
Financial assets carried at amortized cost -
For financial assets carried at amortized cost, the Group first assesses whether
objective evidence of impairment exists individually for financial assets that are
individually significant, or collectively for financial assets that are not individually
significant. If the Group determines that no objective evidence of impairment for an
individually assessed financial asset, whether significant or not, it includes the
asset in a group of financial assets with similar credit risk characteristics and
collectively assesses them for impairment. Assets that are individually assessed for
impairment and for which an impairment loss is, or continues to be, recognized are
not included in a collective assessment of impairment.
If there is objective evidence that an impairment loss has been incurred, the
amount of the loss is measured as the difference between the assets carrying
amount and the present value of estimated future cash flows (excluding future
expected credit losses that have not yet been incurred). The present value of the
estimated future cash flows is discounted at the financial asset’s original effective
interest rate. If a loan has a variable interest rate, the discount rate for measuring
any impairment loss is the current effective interest rate.
The carrying amount of the asset is reduced through the use of an allowance
account and the amount of the loss is recognized in the consolidated income
statement. Interest income continues to be accrued on the reduced carrying
amount and is accrued using the interest rate used to discount the future cash
flows for the purpose of measuring the impairment loss.
The interest income is recorded as part of finance income in the consolidated
statement of income. Loans together with the associated allowance are written off
when there is no realistic prospect of future recovery and all collateral has been
realized or has been transferred to the Group. If, in a subsequent year, the amount
of the estimated impairment loss increases or decreases because of an event
occurring after the impairment was recognized, the previously recognized
impairment loss is increased or reduced by adjusting the allowance account. If the
estimated loss decreases, the reversal shall not result in a carrying amount of the
financial asset that exceeds what the amortized cost would have been had the
impairment not been recognized at the date the impairment is reversed. If a future
write-off is later recovered, the recovery is credited to finance costs in the
consolidated statement of income.
Notes to the consolidated financial statements (continued)
17
(iii) Financial liabilities -
Initial recognition and measurement -
Financial liabilities within the scope of IAS 39 are classified as financial liabilities at
fair value through profit or loss, loans and borrowings, or as derivatives designated
as hedging instruments in an effective hedge, as appropriate. The Group
determines the classification of its financial liabilities at initial recognition.
All financial liabilities are recognized initially at fair value and, in the case of loans
and borrowings, carried at amortized cost. This includes directly attributable
transaction costs.
As of December 31, 2014 and 2013, the Group’s financial liabilities include other
financial liabilities, trade and other payables and derivative financial instruments.
Subsequent measurement -
The subsequent measurement of financial liabilities depends on their classification
as follows:
Financial liabilities at fair value through profit or loss -
Financial liabilities at fair value through profit or loss include financial liabilities held
for trading and financial liabilities designated upon initial recognition as at fair
value through profit or loss.
Financial liabilities are classified as held for trading if they are acquired for the
purpose of selling in the near term. This category includes financial derivative
instruments which are not designated as hedge instruments as required by IAS 39.
The embedded derivatives are also classified as negotiable, unless they are
designated as effective hedge instruments. Gains or losses on liabilities held for
trading are recognized in the consolidated statement of income.
Loans and borrowings -
After their initial recognition, interest-bearing loans and borrowings are
subsequently measured at amortized cost using the effective interest rate method.
Gains and loss are recognized in the statement of income when the liabilities are
derecognized as well as through the effective interest rate method (EIR)
amortization process. Amortized cost is calculated by taking into account any
discount or premium on acquisition and fees or costs that are an integral part of
the EIR. The EIR amortization is included in the finance costs in the statement of
income.
Derecognition -
A financial liability is derecognized when the obligation under the liability is
discharged or cancelled or expired. When an existing financial liability is replaced
by another one from the same lender on substantially different terms, or the terms
are substantially modified, such replacement or amendment is treated as a
derecognition of the original liability and the recognition of a new liability, and the
Notes to the consolidated financial statements (continued)
18
difference in the respective carrying amount is recognized in the consolidated
statement of income.
(iv) Offsetting of financial instruments -
Financial assets and financial liabilities are offset and the net amount reported in
the consolidated statement of financial position if, and only if, there is a currently
enforceable legal right to offset the recognized amounts and there is an intention
to settle on a net basis, or to realize the assets and settle the liabilities
simultaneously.
(v) Fair value of financial instruments -
The Group measures financial instruments, such as, derivatives at fair value at
each consolidated statement of financial position date.
Fair value is the price that would be received to sell an asset or paid to transfer a
liability in an orderly transaction between market participants at the measurement
date. The fair value measurement is based on the presumption that the transaction
to sell the asset or transfer the liability takes place either:
- In the principal market for the asset or liability, or
- In the absence of a principal market, in the most advantageous market for
the asset or liability.
The principal or the most advantageous market must be accessible by the Group.
The fair value of an asset or a liability is measured using the assumptions that
market participants would use when pricing the asset or liability, assuming that
market participants act in their economic best interest.
A fair value measurement of a non-financial asset takes into account a market
participant's ability to generate economic benefits by using the asset in its highest
and best use or by selling it to another market participant that would use the asset
in its highest and best use.
The Group uses valuation techniques that are appropriate in the circumstances and
for which sufficient data are available to measure fair value, maximizing the use of
relevant observable inputs and minimizing the use of unobservable inputs.
All assets and liabilities for which fair value is measured or disclosed in the
consolidated financial statements are categorized within the fair value hierarchy,
described as follows, based on the lowest level input that is significant to the fair
value measurement as a whole:
- — Quoted (unadjusted) market prices in active markets for identical
assets or liabilities.

Notes to the consolidated financial statements (continued)
19
- — Valuation techniques for which the lowest level input that is
significant to the fair value measurement is directly or indirectly observable.
- vel 3 — Valuation techniques for which the lowest level input that is
significant to the fair value measurement is unobservable.
For assets and liabilities that are recognized in the consolidated financial
statements on a recurring basis, the Group determines whether transfers have
occurred between Levels in the hierarchy by re-assessing categorization (based on
the lowest level input that is significant to the fair value measurement as a whole)
at the end of each reporting period.
The Group’s Management determines the policies and procedures for both
recurring fair value measurement. At each reporting date, the Group’s
Management analyses the movements in the values of assets and liabilities which
are required to be re-measured or re-assessed as per the Group’s accounting
policies.
For the purpose of fair value disclosures, the Group has determined classes of
assets and liabilities on the basis of the nature, characteristics and risks of the
asset or liability and the level of the fair value hierarchy as explained above.
An analysis of fair values of financial instruments and further details as to how they
are measured are provided in Note 33.
Derivative financial instruments -
Initial recognition and subsequent measurement -
The Group uses derivative financial instruments, such as forward currency
contracts and interest rate swaps contracts, to hedge its foreign currency risks and
interest rate risks, respectively. Such derivative financial instruments are initially
recognized at fair value on the date on which a derivative contract is entered into
and are subsequently re-measured at fair value. Derivatives are carried as financial
assets when the fair value is positive and as financial liabilities when the fair value
is negative.
The purchase contracts that meet the definition of a derivative under IAS 39 are
recognized in the consolidated statement of income as costs. Commodity contracts
that are entered into and continue to be held for the purpose of the receipt or
delivery of a non-financial item in accordance with the Group’s expected purchase,
sale or usage requirements are held at cost.
Any gains or losses arising from changes in the fair value of derivatives are taken
directly to consolidated profit or loss, except for the effective portion of cash flow
hedges, which is recognized in consolidated of other comprehensive income and
later reclassified to profit or loss when the hedge item affects profit or loss.
Notes to the consolidated financial statements (continued)
20
For the purpose of hedge accounting, hedges are classified as:
- Fair value hedges when hedging the exposure to changes in the fair value of
a recognized asset or liability or an unrecognized firm commitment;
- Cash flow hedges when hedging the exposure to variability in cash flows that
is either attributable to a particular risk associated with a recognized asset
or liability or a highly probable forecast transaction or the foreign currency
risk in an unrecognized firm commitment; or
- Hedges of a net investment in a foreign operation.
At the inception of a hedge relationship, the Group formally designates and
documents the hedge relationship to which the Company wishes to apply hedge
accounting, the risk management objective and strategy for undertaking the hedge.
The documentation includes identification of the hedging instrument, the hedged
item or transaction, the nature of the risk being hedged and how the Group will
assess the effectiveness of changes in the hedging instrument’s fair value in
offsetting the exposure to changes in the hedged item’s fair value or cash flows
attributable to the hedged risk.
The Group expects that such hedges are to be highly effective in achieving
offsetting changes in fair value or cash flows. The Group assessed on an ongoing
basis to determine that they actually have been highly effective throughout the
financial reporting periods for which they were designated.
Hedges that meet the strict criteria for hedge accounting are accounted for, as
described below:
Fair value hedges -
The change in the fair value of a hedging derivative is recognized in the
consolidated statement of profit or loss as finance costs. The change in the fair
value of the hedged item attributable to the risk hedged is recorded as part of the
carrying value of the hedged item and is also recognized in the consolidated
statement of income as finance costs.
For fair value hedges relating to items carried at amortized cost, any adjustment to
carrying value is amortized through profit or loss over the remaining term of the
hedge using the EIR method. EIR amortization may begin as soon as an adjustment
exists and no later than when the hedged item ceases to be adjusted for changes in
its fair value attributable to the risk being hedged.
If the hedged item is derecognized, the unamortized fair value is recognized
immediately in consolidated profit or loss.
Notes to the consolidated financial statements (continued)
21
When an unrecognized firm commitment is designated as a hedged item, the
subsequent cumulative change in the fair value of the firm commitment
attributable to the hedged risk is recognized as an asset or liability with a
corresponding gain or loss recognized in consolidated profit and loss.
Cash flow hedges -
The effective portion of the gain or loss on the hedging instrument is recognized in
OCI in the cash flow hedge reserve, while any ineffective portion is recognized
immediately in the consolidated statement of profit or loss as finance costs.
The Group uses swaps contracts as hedges of its risk exposure to the exchange rate
and interest rate expected transactions. The ineffective portion relating to swaps
contracts of exchange and /or interest rate is recognized as finance costs.
Amounts recognized as OCI are transferred to profit or loss when the hedged
transaction affects profit or loss, such as when the hedged finance income or
financial expense is recognized or when a forecast sale occurs. When the hedged
item is the cost of a non-financial asset or non-financial liability, the amounts
recognized as OCI are transferred to the initial carrying amount of the non-financial
asset or liability.
If the hedging instrument expires or is sold, terminated or exercised without
replacement or rollover (as part of the hedging strategy), or if its designation as a
hedge is revoked, or when the hedge no longer meets the criteria for hedge
accounting, any cumulative gain or loss previously recognized in OCI remains
consolidated in equity until the forecast transaction occurs or the foreign currency
firm commitment is met.
Hedges of a net investment in a foreign operation -
Hedges of a net investment in a foreign operation, including a hedge of a monetary
item that is accounted for as part of the net investment, are accounted for in a way
similar to cash flow hedges.
As of December 31, 2014 and 2013, the Group has no hedging instruments of a
net investment in a foreign operation.
(d) Current versus non-current classification -
The Group presents assets and liabilities in consolidated statement of financial position
based on current/non-current classification. An asset is current when it is:
- It is expected to be realized or intended to be sold or consumed within a normal
operating cycle;
- It is held primarily for trading purposes;
- Expected to be realized within twelve months after the reporting period;
Notes to the consolidated financial statements (continued)
22
- It is cash or cash equivalent, unless it is restricted from being exchanged or used to
settle a liability for, at least, twelve months after the reporting period.
All other assets are classified as non-current. A liability is current when it is:
- Expected to be settled within a normal operating cycle;
- Held primarily for trading purposes;
A liability is current when:
- It is expected to be settled in normal operating cycle;
- It is held primarily for the purpose of trading
- It is due to be settled within twelve months after the reporting period
- There is no unconditional right to defer the settlement of the liability for at least
twelve months after the reporting period.
The Group classifies all other liabilities as non-current.
Deferred tax assets and liabilities are classified as non-current assets and liabilities.
(e) Foreign currency translation -
The Group’s consolidated financial statements are presented in Nuevos Soles, which is
also the parent company’s functional currency. For each entity the Group determines the
functional currency and items included in the financial statements of each entity are
measured using that functional currency.
The accompanying consolidated financial statements have been prepared to show the
joint activity of the companies comprising the Group; so it has been established as the
presentation currency used by the Company, the Nuevo Sol. Accordingly, the balances of
the financial statements of companies operating in countries with a functional currency
other than the Nuevo Sol have been converted in accordance with the methodologies set
out in IAS 21 "The Effects of Changes in exchange rates of foreign currency".
Balances and transactions in foreign currency -
Balances or transactions in foreign currency are made in a currency other than the
functional currency. Transactions in foreign currency are initially recorded in the
functional currency using the exchange rates prevailing at the dates of the transactions in
which initially qualify for recognition. Monetary assets and liabilities denominated in
foreign currencies are subsequently translated into the functional currency using the
exchange rates prevailing at the date of the consolidated statement of financial position.
The differences between the exchange rates prevailing at the dates of the consolidated
financial statements presented and the exchange rate initially used to record transactions
are recognized in the consolidated income statement in the period in which they occur, in
the "Exchange difference, net".
Notes to the consolidated financial statements (continued)
23
Non-monetary assets and liabilities acquired in foreign currency are converted at the
exchange rate at the dates of the initial transactions.
As required by IAS 21, exchange differences arising from transactions between related
parties eliminated on consolidation and are not included as part of the net investment in a
foreign operation, should be recorded in profit or loss in the consolidated financial
statements.
Group companies -
On consolidation, the assets and liabilities of foreign operations are translated into Nuevos
Soles at the rate of exchange prevailing at the reporting date and their income statements
are translated at exchange rates prevailing at the dates of the transactions. The exchange
differences arising on translation for consolidation are recognized in other comprehensive
income.
Any goodwill arising on the acquisition of a foreign operation and any fair value
adjustments to the carrying amounts of assets and liabilities arising on the acquisition are
treated as assets and liabilities of the foreign operation and translated at the spot rate of
exchange at the reporting date.
(f) Inventories -
Inventories are valued at the lower of cost and net realizable value. Costs incurred in
bringing each product to its present location and conditions are accounted for as follows:
- Raw materials and supplies, packages and packing –
Purchase cost, using the weighted average method.
- Finished goods and work in progress -
At the cost of direct materials and supplies, services provided by third parties, raw
material, direct labor cost, other direct cost, general manufacturing expenses and
an overhead based on fixed and variable cost based on normal operating capacity,
using the weighted average method, but excluding borrowing costs and exchange
currency differences.
- Inventory in transit purchase cost.
Net realizable value is the sales price obtained in the ordinary course of business, less the
estimated costs of placing the inventories into a ready-for-sale condition and the
commercialization and distribution expenses.
The Group´s management periodically evaluates the impairment and obsolescence of
these assets. The estimation for impairment and obsolescence, if any, is recognized with
charge to the profit and loss.
Notes to the consolidated financial statements (continued)
24
(g) Investments in associate -
The Group’s investment in BASF Construction Chemicals Perú S.A. and Preinco Ltda. with
a 30 and 50 percent as of December 31, 2014, respectively (as of December 31, 2013, a
30 percent of BASF Construction Chemicals Peru S.A.) and are accounted for using the
equity method. An associate is an entity over which the Group has significant influence.
The considerations made in determining significant influence or joint control is similar to
those necessary to determine control over subsidiaries.
Under the equity method, the investment in an associate or a joint venture is initially
recognized at cost. The carrying amount of the investment is adjusted to recognize
changes in the Group’s share of net assets of the associate or joint venture since the
acquisition date. Goodwill relating to the associate or joint venture is included in the
carrying amount of the investment and is neither amortized nor individually tested for
impairment.
The statement of profit or loss reflects the Group’s share of the results of operations of
the associate. Any change in OCI of those investees is presented as part of the Group’s
OCI. In addition, when there has been a change recognized directly in the equity of the
associate, the Group recognizes its share of any changes, when applicable, in the
statement of changes in equity. Unrealized gains and losses resulting from transactions
between the Group and the associate are eliminated to the extent of the interest in the
associate or joint venture.
The Group's share of results of the associate is presented in a single line on the
consolidated income statement, operating profit outside. This participation includes the
net of tax and non-controlling interests in subsidiaries of the associate.
The financial statements of the associate are prepared for the same reporting period as
the Group. When necessary, adjustments are made to bring the accounting policies in line
with those of the Group.
After application of the equity method, the Group determines whether it is necessary to
recognize an impairment loss on its investment in its associate or joint venture. At each
reporting date, the Group determines whether there is objective evidence that the
investment in the associate is impaired. If there is such evidence, the Group calculates the
amount of impairment as the difference between the recoverable amount of the associate
and its carrying value, and then recognizes the loss as ‘Share of profit of an associate and
a joint venture’ in the consolidated statement of income.
Upon loss of significant influence over the associate, the Group measures and recognizes
any retained investment at its fair value. Any difference between the carrying amount of
the associate and the fair value of the retained investment and proceeds from disposal is
recognized in profit or loss.

Notes to the consolidated financial statements (continued)
25
(h) Borrowing costs -
Borrowing costs directly attributable to the acquisition, construction or production of an
asset that necessarily takes a substantial period of time to get ready for its intended use
or sale are capitalized as part of the cost of the respective assets. All other borrowing
costs are expensed in the period they occur. Borrowing costs consist of interest and other
costs that an entity incurs in connection with the contract of borrowing of funds.
(i) Leases -
The determination of whether an agreement is, or contains, a lease is based on the
substance of the arrangement at the inception date, whether fulfillment of the
arrangement is dependent on the use of a specific asset or the arrangement conveys a
right to use the asset, even it that right is not explicitly specified in an arrangement.
Finance leases which transfer to the Group substantially all the risks and benefits
incidental to ownership of the leased asset, are capitalized at the commencement of the
lease at the fair value of the leased property or, if lower, at the present value of the
minimum lease payments. Lease payments are apportioned between financial charges and
reduction of the lease liability so as to achieve a constant rate of interest on the remaining
balance of the liability. Finance charges are recognized in the finance costs in the
consolidated statement of income.
A leased asset is depreciated over the useful life of the asset. However, if there is no
reasonable certainty that the Group will obtain ownership by the end of the lease term,
the asset is depreciated over the shorter of the estimated useful life of the asset and the
lease term.
Operating lease payments are recognized as an operating expense in the consolidated
statement of income on a straight-line basis over the lease term.
(j) Property, plant and equipment -
Property, plant and equipment are stated at cost, net of accumulated depreciation and/or
accumulated impairment losses, if any. The initial cost of an asset comprises its purchase
price or construction cost, any costs directly attributable to bringing the asset into
operation. Such cost includes the cost of replacing component parts of the property, plant
and equipment and borrowing costs for long-term construction projects if the recognition
criteria are met. The present value of the estimate cost of dismantling the asset and
rehabilitating the site where it is located, is included in the cost of the respective assets,
see note 3.3(p). When significant parts of property, plant and equipment are required to
be replaced at intervals, the Group derecognizes the replaced part, and recognizes the
new part with its own associated useful life and depreciation. Likewise, when major
inspection is performed, its cost is recognized in the carrying amount of the plant and
equipment as a replacement if the recognition criteria are satisfied. All other maintenance
and repair costs are recognized in the consolidated statement of income in the period on
which they are incurred.

Notes to the consolidated financial statements (continued)
26
Depreciation is calculated using a straight-line-basis method over the estimated useful
lives of such assets as follows:
Years
Entities’ Peru
Buildings and constructions 10 a 50
Other installations 3 a 10
Machinery and equipment 7 a 25
Leasehold improvements 5 a 50
Transportation units 5 a 10
Furniture and fixtures 6 a 10
Other equipments 4 a 10
Years
Entities’ Ecuador
Buildings 10 a 30
Machinery and equipment 10 a 30
Mobile machinery 8 a 30
Light vehicles 5
Furniture and fixtures 10 a 30
Computer equipment 3
Other equipments 10 a 30
Entities’ United States of America
Buildings 20 a 40
Machinery and equipment 3 a 20
Transportation units 2 a 7
Furniture and fixtures 3 a 5
Computer equipment 2 a 3
An item of property, plant and equipment and any significant part initially recognized is
derecognized upon disposal or when no future economic benefits are expected from its
use or disposal. Any gain or loss arising on derecognition of the asset (calculated as the
difference between the net disposal proceeds and the carrying amount of the asset) is
included in the consolidated statement of income when the asset is derecognized.
The asset’s residual value, useful lives and methods of depreciation/amortization are
reviewed at each reporting date, and adjusted prospectively if appropriate.
Notes to the consolidated financial statements (continued)
27
(k) Mining concessions -
Mining concessions correspond to the exploration rights in areas of interest acquired in
previous years. Mining concessions are stated at cost, net of accumulated amortization
and/or accumulated impairment losses, if any, and are presented within the property,
plant and equipment caption. Those mining concessions are amortized starting from the
production phase following the units-of-production method based on proved reserves to
which they relate. If the Group abandons the concession, the costs associated are written-
off in the consolidated statement of income.
(l) Intangible assets –
Intangible assets acquired separately are measured on initial recognition at cost. The cost
of intangible assets acquired in a business combination is their fair value at the date of
acquisition. Following initial recognition, intangible assets are carried at cost less any
accumulated amortization and accumulated impairment losses. Internally generated
intangibles, excluding capitalized development costs, are not capitalized and the related
expenditure is reflected in the consolidated of income in the period in which the
expenditure is incurred.
The useful lives of intangible assets are assessed as either finite or indefinite.
Intangible assets with finite lives are amortized over the useful economic life and assessed
for impairment whenever there is an indication that the intangible asset may be impaired.
The amortization period and the amortization method for an intangible asset with a finite
useful life are reviewed at least at the end of each reporting period. Changes in the
expected useful life or the expected pattern of consumption of future economic benefits
embodied in the asset are considered to modify the amortization period or method, as
appropriate, and are treated as changes in accounting estimates. The amortization
expense on intangible assets with finite lives is recognized in the statement of profit or
loss as the expense category that is consistent with the function of the intangible assets.
Intangible assets with indefinite useful lives are not amortized, but are tested for
impairment annually, either individually or at the cash-generating unit level. The
assessment of indefinite life is reviewed annually to determine whether the indefinite life
continues to be supportable. If not, the change in useful life from indefinite to finite is
made on a prospective basis.
Gains or losses arising from de-recognition of an intangible asset are measured as the
difference between the net disposal proceeds and the carrying amount of the asset and
are recognized in the statement of profit or loss when the asset is derecognized.
Licenses -
The licenses of computer software are at cost and include expenditures directly related to
the acquisition or entry into use of specific software. These costs are amortized over their
estimated useful life of three years.

Notes to the consolidated financial statements (continued)
28
Trademarks, customer lists -
Correspond to limited life intangible assets identified at the time of procurement. The
trademarks shall be amortized over a period of 4 to 6 years and the list of customers in a
period of 7 years.
(m) Deferred stripping costs -
The Group incurs waste removal costs (stripping costs) during the development and
production phases of its surface operations. During the production phase, stripping costs
(production stripping costs) can be incurred both in relation to the production of inventory
in that period and the creation of improved access and operational flexibility in relation to
the mineral expected to be mined in the future. The former are included as part of the
costs of production, while the latter are capitalized as a stripping activity asset, when
certain criteria are met. Significant judgment is required to distinguish between
development stripping and production stripping and to distinguish between the production
stripping that relates to the extraction of inventory and what relates to the creation of a
stripping activity asset.
Once the Group has identified its production stripping for each surface mining operation, it
identifies the separate components of the ore bodies for each of its mining operations for
the purposes of accumulating costs for each component and pay off based on their
respective useful lives. An identifiable component is a specific volume of the ore body that
is made more accessible by the stripping activity. Significant judgment is required to
identify and define these components, and also to determine the expected volumes (e.g.,
in tonnes) of waste to be stripped and ore to be mined in each of these components.
These assessments are undertaken for each individual mining operation based on the
information available in the mine plan. The mine plans and, therefore, the identification of
components, will vary between mines for a number of reasons. These include, but are not
limited to, the type of commodity, the geological characteristics of the ore body, the
geographical location and/or financial considerations.
The political of depreciation of the Group for asset stripping activity in the production
phase use calculated by the method of production units.
(n) Estimates of resources and reserves -
The mineral reserves are estimates of the amount of ore that can be economically and
legally extracted from the Company’s mining properties and concessions. The Group
estimates its ore reserves and mineral resources, based on information compiled by
appropriately qualified persons relating to the geological data on the size, depth and
shape of the ore body, and require complex geological judgments to interpret the data.
The estimation of recoverable reserves is based upon factors such as estimates of foreign
exchange rates, ore prices, future capital requirements, and production costs along with
geological assumptions and judgments made in estimating the size and grade of the ore
body.

Notes to the consolidated financial statements (continued)
29
Changes in the reserve or resource estimates may impact upon the carrying value of
property, plant and equipment, provision for rehabilitation and depreciation and
amortization charges.
(o) Impairment of non-financial assets -
The Group assesses at each reporting date whether there is an indication that an asset
may be impaired. If any indication exists, or when annual impairment testing for an asset
is required, the Group estimates the asset’s recoverable amount. An asset’s recoverable
amount is the higher of a fair value less the sales costs and its value in use and said value
is determined for an individual asset, unless the asset does not generate cash inflows that
are largely independent of those from other assets or groups of assets, in that case it is
considered the cash generating unit (CGU) related to those assets. When the carrying
amount of an asset of CGU exceeds its recoverable amount, the asset is considered
impaired and is written down to its recoverable amount. In assessing value in use, the
estimated future cash flows are discounted to their present value using a pre-tax discount
rate that reflects current market assessments of the time value of money and the risks
specific to the asset. In determining fair value less costs to sell, recent market
transactions are taken into account by the Group, if available. If no such transactions can
be identified, the Group can use an appropriate valuation model.
Impairment losses of continuing operations, including impairment on inventories, are
recognized in the consolidated statement of income in those expense categories
consistent with the function of the impaired asset.
For assets excluding goodwill, the Company assesses an impairment test to each reporting
date as to whether there is any indication that previously recognized impairment losses
may no longer exist or may have decreased. If such indication exists, the Group estimates
the recoverable amount of the asset or CGU.
A previously recognized impairment loss is reversed only if there has been a change in the
assumptions used to determine the asset’s recoverable amount since the last impairment
loss was recognized. The reversal is limited so that the carrying amount of the asset does
not exceed its recoverable amount, nor exceed the carrying amount that would have been
determined, net of corresponding depreciation, had no impairment loss been recognized
for the asset in prior years. Such reversal is recognized in the consolidated statement of
income, unless the asset is carried at a revalued amount, in which case the reversal is
treated as a revaluation increase.
The following criteria are also applied in assessing impairment of goodwill:
Goodwill is tested for impairment annually (as of December 31). Impairment is determined
by assessing the recoverable amount of each cash generating unit which the goodwill
relates. When the recoverable amount of each cash generating unit is less than its
carrying amount, an impairment loss is recognized. Impairment losses relating to goodwill
cannot be reversed in future periods.
Notes to the consolidated financial statements (continued)
30
(p) Provisions -
General -
Provisions are recognized when the Group has a present obligation (legal or constructive)
as a result of a past event, it is probable that an outflow of resources embodying economic
benefits will be required to settle the obligation and a reliable estimate can be made of the
amount of the obligation. Where the Group expects some or all of a provision to be
reimbursed, for example under an insurance contract, the reimbursement is recognized as
a separate asset but only when the reimbursement is virtually certain. The expense
relating to any provision is presented in the consolidated statement of income net of any
reimbursement. If the effect of the time value of money is material, provisions are
discounted using a current pre-tax rate that reflects where appropriate, the risks specific
to the liability. Where discounting is used, the increase in the provision due to the passage
of time is recognized as finance cost.
Mine closure provision -
The Group records the present value of estimated costs of legal and constructive
obligations required to restore operating locations in the period in which the obligation is
incurred. Mine closure costs are provided at the present value of expected costs to settle
the obligation using estimated cash flows and are recognized as part of the cost of that
particular asset. The cash flows are discounted at a current pre-tax rate that reflects the
risk specific to the rehabilitation provision.
The unwinding of the discount is expensed as incurred and recognized in the consolidated
statement of income as a finance cost. The estimated future costs of rehabilitation are
reviewed annually and adjusted as appropriate. Changes in the estimated future costs or
in the discount rate applied are added to or deducted from the cost of the asset.
(q) Contingencies –
Contingent liabilities are disclosed when the existence of the liability is confirmed by
future events or when the amount of the liability cannot be measured reasonably.
Contingent assets are not recognized in the financial statements, but they are disclosed
when it is probable that economic benefits flow to the Group.
(r) Employees’ benefits -
The Group has short-term obligations for employees’ benefits that include salaries, social
contributions, gratifications, bonuses for performance, and workers’ sharing profit. These
liabilities are recorded monthly with charge to consolidated statement of income, as they
are accrued.
(s) Revenue recognition –
Revenues of ordinary activities are recognized to the extent it is probable that the
economic benefits will flow to the Group and the revenue can be reliably measured,
regardless of when the payment is being made. Revenue is measured at the fair value of
Notes to the consolidated financial statements (continued)
31
the consideration received or receivable, taking into account contractually defined terms
of payment and excluding taxes or duty.
The following specific recognition criteria must be also met before revenue is recognized:
Sales of goods -
Revenue from sales of goods is recognized when the significant risks and rewards of
ownership have been transferred to the buyer, on delivery of the goods.
Sales of energy and power –
Revenues of ordinary activities of sales energy and power are recognized monthly on
basic to cyclic metering of energy and are completely recognized in the period in which
they are provided.
Services -
Revenues of ordinary activities related to rental portal cranes, bridge cranes and
hydroelectric station are recognized in the period in which they are provided.
Interest income -
The revenue is recognized when the interest accrues using the effective interest rate.
Interest income is included in finance income in the consolidated statement of income.
Dividends income -
Dividends from investments are credited in the consolidated statement of income when
declared.
(t) Taxes -
Current income tax -
The income tax for the current period is calculated according to the legal regulations in
each country, based on non-consolidated financial statements, and current income tax
assets and liabilities are measured at the amount expected to be recovered from or paid to
the taxation authority. The tax rates and tax laws used to compute the amount of tax are
those that are enacted or substantively enacted, at the close of the reporting period under
review.
Current income taxes related to items that are directly recognized in net equity are also
recognized in net equity and not in the statement of income. The Group´s management
periodically evaluates positions taken in the tax returns with respect to situations in which
applicable tax regulations are subject to interpretation and establishes provisions where
appropriate.
Notes to the consolidated financial statements (continued)
32
Deferred income tax -
Deferred tax is provided using the liability method on temporary differences at the
reporting date between the tax bases of assets and liabilities and their carrying amounts
for date of the consolidated statement of financial position.
Deferred tax liabilities are recognized for all taxable temporary differences, except:
- Where the liabilities for deferred income taxes arises from the initial recognition of
goodwill, or from an asset or liability in a transaction that is not a business
combination and that, at the time of the transaction, does not affects neither the
accounting profit nor taxable profit or loss; or
- Where the timing of the reversal of the temporary differences can be controlled
and it is probable that the temporary differences will not reverse in the foreseeable
future.
Deferred tax assets are recognized for all deductible temporary differences and for the
future compensation of unused tax credits and unused tax losses, to the extent that it is
probable that future taxable profit will be available to offset such unused tax credits and
unused tax losses, except:
- When the deferred tax asset relating to deductible temporary difference arises
from the initial recognition of an asset or liability in a transaction that is not a
business combination and, at the time of the transaction, affects neither the
accounting profit nor taxable profit or loss, or
- In respect of deductible temporary differences associated with investments in
subsidiaries and associates, where deferred assets are recognized only to the
extent that it is probable that the temporary differences will reverse in the
foreseeable future and taxable profit will be available against which the temporary
differences can be utilized.
The carrying amount of deferred tax assets is reviewed at each reporting date and
reduced to the extent that it is no longer probable that sufficient taxable profit will be
available to allow all or part of the deferred tax asset to be utilized. Unrecognized deferred
tax assets are reassessed at each reporting date and are recognized to the extent that it
has become probable that future taxable profits will allow the deferred tax asset to be
recovered.
Deferred tax assets and liabilities are measured at the tax rates that are expected to apply
in the year when the asset is realized or the liability is settled, based on tax rates and tax
laws that have been enacted at the reporting date consolidated statement of financial
position, or substantively enacted.

Notes to the consolidated financial statements (continued)
33
Deferred tax assets and deferred tax liabilities are offset if a legally enforceable right
exists to set off current tax assets against current income tax liabilities and the deferred
taxes relate to the same taxable entity and the same tax authority.
Value added tax -
Revenues, expenses and assets of ordinary activities are recognized net of the general
sales tax, except:
- Where value added tax incurred on when a purchase of assets or services is not
recoverable from the tax authority, in which case the general sales tax is
recognized as part of the cost of acquisition of the asset or as part of the expense
item as applicable;
- Receivables and payables are stated with the value added tax included.
The net amount of VAT recoverable from, or payable to, the tax authority is included as
part of receivables or payables in the consolidated statement of financial position.
(u) Earnings per share -
Basic and diluted earnings per share have been calculated based on weighted average of
common shares at the date of the consolidated statement of financial position. As of
December 31, 2014 and 2013, the Group has no dilutive financial instruments; therefore
the basic and diluted earnings per share are the same.
(v) Reclassifications -
We have made the following reclassifications on the balances as of December 31, 2013 to
make them comparable with the consolidated financial statements as of December 31,
2014, the most significant are following:
S/.(000)
Consolidated statement of financial position
Reclassification of the caption “Other asset non-financial” to the caption
“Mining concessions and property, plant and equipment, net” for the major
value of assets relative to leaseback finance. 23,016
Reclassification of the caption “Trade and other payables, current” to the
caption “Deferred income” for the reclassification of concrete and
premixed billed and unpaid. 34,563
Consolidated statement of income-
Reclassification of the caption “Sales net” to the caption “Cost of sales” for
the freight of cement. 9,970
Reclassification of the caption “Administrative expenses” to the caption
“Other expenses” for amortization and dock service. 6,111

Notes to the consolidated financial statements (continued)
34
4. Significant accounting judgments, estimates and assumptions
Many of the amounts included in the consolidated financial statements involve the use of criteria and/or
estimates. These judgments and estimates are made based at best knowledge of relevant facts and
circumstances, taking into account previous experience; however, actual results could differ from the
estimates included in the consolidated financial statements. The details of these policies and estimates
are included in the accounting policies and/or the notes to the consolidated financial statements.
The preparation of the consolidated financial statements includes criteria and/or estimates used by the
Group´s Management, following:
- Estimation useful lives of assets, by depreciation and amortization - Note 3.3(j) and (l).
- Fair value of derivatives financial instruments - Note 3.3(c)(v).
- Estimation for impairment of inventories - Note 3.3(f).
- Cost and depreciation of stripping assets - Note 3.3(m).
- Estimates of resources and reserves – Note 3.3(n).
- Estimation for impairment of non-financial assets - Note 3.3(o).
- Provisions – Note 3.3(q).
- Income tax – Note 3.3(t).
5. New accounting standards
The IASB issued the following International Financial Reporting Standards, which are not yet in effect on
the date of the consolidated financial statements of the Group. The Group will adopt these standards, if
applicable, when they are in force:
- IFRS 9 ”Financial Instruments”: Classification and Measurement
In July 2014, the IASB issued the final version of IFRS 9 Financial Instruments which reflects all
phases of the financial instruments project and replaces IAS 39 Financial Instruments:
Recognition and Measurement and all previous versions of IFRS 9. The standard introduces new
requirements for classification and measurement, impairment, and hedge accounting. IFRS 9 is
effective for annual periods beginning on or after January 1st 2018, with early application
permitted. Retrospective application is required, but comparative information is not compulsory.
Early application of previous versions of IFRS 9 (2009, 2010 and 2013) is permitted if the date
of initial application is before 1 February 2015. The adoption of IFRS 9 will have an effect on the
classification and measurement of the Group’s financial assets, but no impact on the
classification and measurement of the Group’s financial liabilities.
- IFRS 14”Regulatory Deferral Accounts”
IFRS 14 is an optional standard that allows an entity, whose activities are subject to rate-
regulation, to continue applying most of its existing accounting policies for regulatory deferral
account balances upon its first-time adoption of IFRS. Entities that adopt IFRS 14 must present
the regulatory deferral accounts as separate line items on the statement of financial position and
present movements in these account balances as separate line items in the statement of profit or
loss and other comprehensive income. The standard requires disclosures on the nature of, and
risks associated with, the entity’s rate-regulation and the effects of that rate-regulation on its

Notes to the consolidated financial statements (continued)
35
financial statements. IFRS 14 is effective for annual periods beginning on or after January 1st
2016. Since the Group is an existing IFRS preparer, this standard would not apply.
- Amendments to IAS 19”Defined Benefit Plans: Employee Contributions”
IAS 19 requires an entity to consider contributions from employees or third parties when
accounting for defined benefit plans. Where the contributions are linked to service, they should
be attributed to periods of service as a negative benefit. These amendments clarify that, if the
amount of the contributions is independent of the number of years of service, an entity is
permitted to recognize such contributions as a reduction in the service cost in the period in which
the service is rendered, instead of allocating the contributions to the periods of service. This
amendment is effective for annual periods beginning on or after July 1st 2014. It is not expected
that this amendment would be relevant to the Group.
- Annual improvements 2010-2012 Cycle
These improvements are effective from July 1st 2014 and are not expected to have a material
impact on the Group. They include:
IFRS 2” Share-based Payment”
This improvement is applied prospectively and clarifies various issues relating to the definitions
of performance and service conditions which are vesting conditions, including:
- A performance condition must contain a service condition
- A performance target must be met while the counterparty is rendering service
- A performance target may relate to the operations or activities of an entity, or to those of
another entity in the same group
- A performance condition may be a market or non-market condition if the counterparty,
regardless of the reason, ceases to provide service during the vesting period, the service
condition is not satisfied.
- IFRS 3”Business Combinations”
The amendment is applied prospectively and clarifies that all contingent consideration
arrangements classified as liabilities (or assets) arising from a business combination should be
subsequently measured at fair value through profit or loss whether or not they fall within the
scope of IFRS 9 (or IAS 39, as applicable).
- IFRS 8”Operating Segments”
The amendments are applied retrospectively and clarify that:
- An entity must disclose the Management’s judgments when applying the aggregation
criteria in paragraph 12 of IFRS 8, including a brief description of operating segments that
have been aggregated and the economic characteristics (e.g., sales and gross margins)
used to assess whether the segments are ‘similar’.
- The disclosure of the reconciliation of segment assets to total assets is only required if the
reconciliation is reported to the chief operating decision maker, similar to the required
disclosure for segment liabilities.
Notes to the consolidated financial statements (continued)
36
- IAS 16”Property, Plant and Equipment” and IAS 38”Intangible Assets”
The amendment is applied retrospectively and clarifies in IAS 16 and IAS 38 that the asset may
be revalued by reference to observable data on either the gross or the net carrying amount. In
addition, the accumulated depreciation or amortization is the difference between the gross and
the carrying amounts of the asset.
- IAS 24”Related Party Disclosures”
The amendment is applied retrospectively and clarifies that a management entity (an entity that
provides key management personnel services) is a related party subject to the related party
disclosures. In addition, an entity that uses a management entity is required to disclose the
expenses incurred for management services.
- Annual improvements 2011-2013 Cycle
These improvements are effective from July 1st, 2014 and are not expected to have a material
impact on the Group. They include:
IFRS 3”Business Combinations”
The amendment is applied prospectively and clarifies for the scope exceptions within IFRS 3 that:
- Joint arrangements, not just joint ventures, are outside the scope of IFRS 3.
- This scope exception applies only to the accounting in the financial statements of the joint
arrangement itself.
- IFRS 13”Fair Value Measurement”
The amendment is applied prospectively and clarifies that the portfolio exception in IFRS 13 can
be applied not only to financial assets and financial liabilities, but also to other contracts within
the scope of IFRS 9 (or IAS 39, as applicable).
- IAS 40”Investment Property”
The description of ancillary services in IAS 40 differentiates between investment property and
owner-occupied property (i.e., property, plant and equipment). The amendment is applied
prospectively and clarifies that IFRS 3, and not the description of ancillary services in IAS 40, is
used to determine if the transaction is the purchase of an asset or business combination.
- IFRS 15”Revenue from Contracts with Customers”
IFRS 15 was issued in May 2014 and establishes a new five-step model that will apply to revenue
arising from contracts with customers. Under IFRS 15 revenue is recognized at an amount that
reflects the consideration to which an entity expects to be entitled in exchange for transferring
goods or services to a customer.
The principles in IFRS 15 provide a more structured approach to measuring and recognizing
revenue. The new revenue standard is applicable to all entities and will supersede all current
revenue recognition requirements under IFRS. Either a full or modified retrospective application
is required for annual periods beginning on or after January 1st 2017 with early adoption
Notes to the consolidated financial statements (continued)
37
permitted. The Group is currently assessing the impact of IFRS 15 and plans to adopt the new
standard on the required effective date.
- Amendments to IFRS 11”Joint Arrangements: Accounting for Acquisitions of Interests”
The amendments to IFRS 11 require that a joint operator accounting for the acquisition of an
interest in a joint operation, in which the activity of the joint operation constitutes a business
must apply the relevant IFRS 3 principles for business combinations accounting. The
amendments also clarify that a previously held interest in a joint operation is not re measured on
the acquisition of an additional interest in the same joint operation while joint control is retained.
In addition, scope exclusion has been added to IFRS 11 to specify that the amendments do not
apply when the parties sharing joint control, including the reporting entity, are under common
control of the same ultimate controlling party.
The amendments apply to both the acquisition of the initial interest in a joint operation and the
acquisition of any additional interests in the same joint operation and are prospectively effective
for annual periods beginning on or after January 1st, 2016, with early adoption permitted. These
amendments are not expected to have any impact to the Group.
- Amendments to IAS 16 and IAS 38: “Clarification of Acceptable Methods of Depreciation and
Amortization”
The amendments clarify the principle in IAS 16 and IAS 38 that revenue reflects a pattern of
economic benefits that are generated from operating a business (of which the asset is part)
rather than the economic benefits that are consumed through use of the asset. As a result, a
revenue-based method cannot be used to depreciate property, plant and equipment and may
only be used in very limited circumstances to amortize intangible assets.
The amendments are effective prospectively for annual periods beginning on or after January 1st
2016, with early adoption permitted. These amendments are not expected to have any impact to
the Group given that the Group has not used a revenue-based method to depreciate its non-
current assets.
- Amendments to IAS 16 and IAS 41 Agriculture: “Bearer Plants”
The amendments change the accounting requirements for biological assets that meet the
definition of bearer plants. Under the amendments, biological assets that meet the definition of
bearer plants will no longer be within the scope of IAS 41. , IAS 16 will apply instead. After initial
recognition, bearer plants will be measured under IAS 16 at accumulated cost (before maturity)
and using either the cost model or revaluation model (after maturity). The amendments also
require that produce that grows on bearer plants will remain in the scope of IAS 41 measured at
fair value less costs to sell. For government grants related to bearer plants, IAS 20 Accounting
for Government Grants and Disclosure of Government Assistance will apply. The amendments are
retrospectively effective for annual periods beginning on or after January 1st 2016, with early
adoption permitted. These amendments are not expected to have any impact to the Group as the
Group does not have any bearer plants.
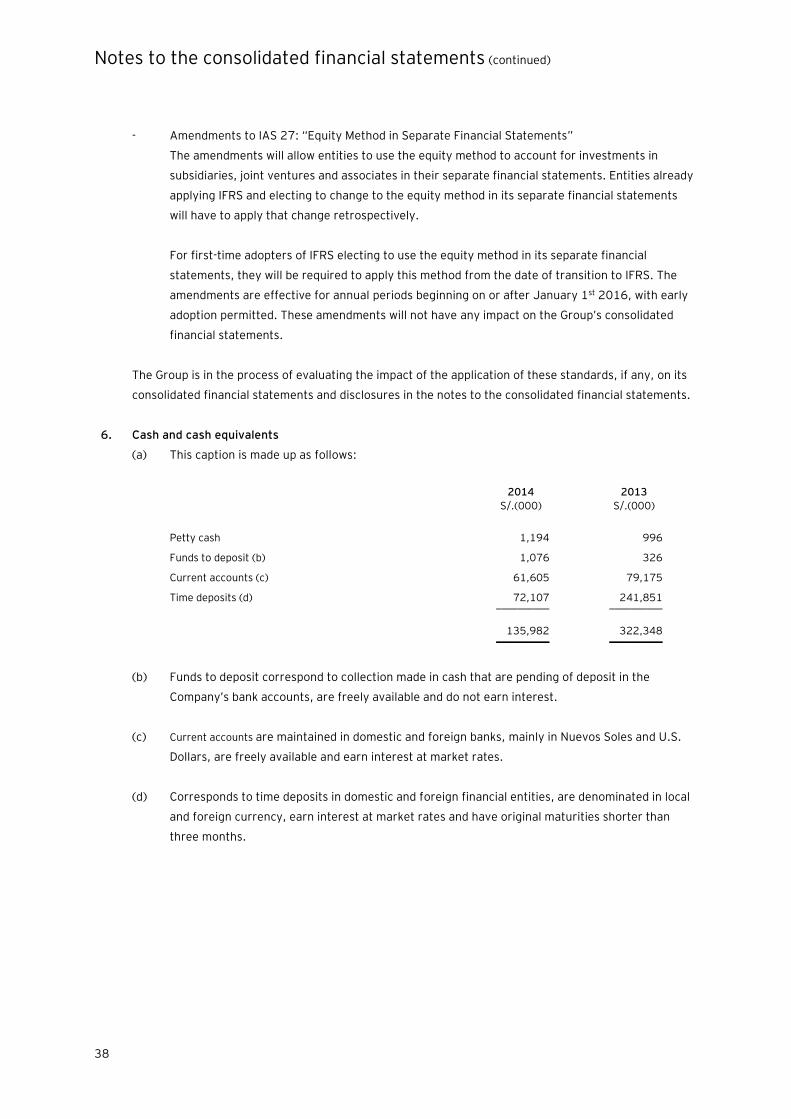
Notes to the consolidated financial statements (continued)
38
- Amendments to IAS 27: “Equity Method in Separate Financial Statements”
The amendments will allow entities to use the equity method to account for investments in
subsidiaries, joint ventures and associates in their separate financial statements. Entities already
applying IFRS and electing to change to the equity method in its separate financial statements
will have to apply that change retrospectively.
For first-time adopters of IFRS electing to use the equity method in its separate financial
statements, they will be required to apply this method from the date of transition to IFRS. The
amendments are effective for annual periods beginning on or after January 1st 2016, with early
adoption permitted. These amendments will not have any impact on the Group’s consolidated
financial statements.
The Group is in the process of evaluating the impact of the application of these standards, if any, on its
consolidated financial statements and disclosures in the notes to the consolidated financial statements.
6. Cash and cash equivalents
(a) This caption is made up as follows:
2014 2013
S/.(000) S/.(000)
Petty cash 1,194 996
Funds to deposit (b) 1,076 326
Current accounts (c) 61,605 79,175
Time deposits (d) 72,107 241,851 __________ __________
135,982 322,348 __________ __________
(b) Funds to deposit correspond to collection made in cash that are pending of deposit in the
Company’s bank accounts, are freely available and do not earn interest.
(c) Current accounts are maintained in domestic and foreign banks, mainly in Nuevos Soles and U.S.
Dollars, are freely available and earn interest at market rates.
(d) Corresponds to time deposits in domestic and foreign financial entities, are denominated in local
and foreign currency, earn interest at market rates and have original maturities shorter than
three months.
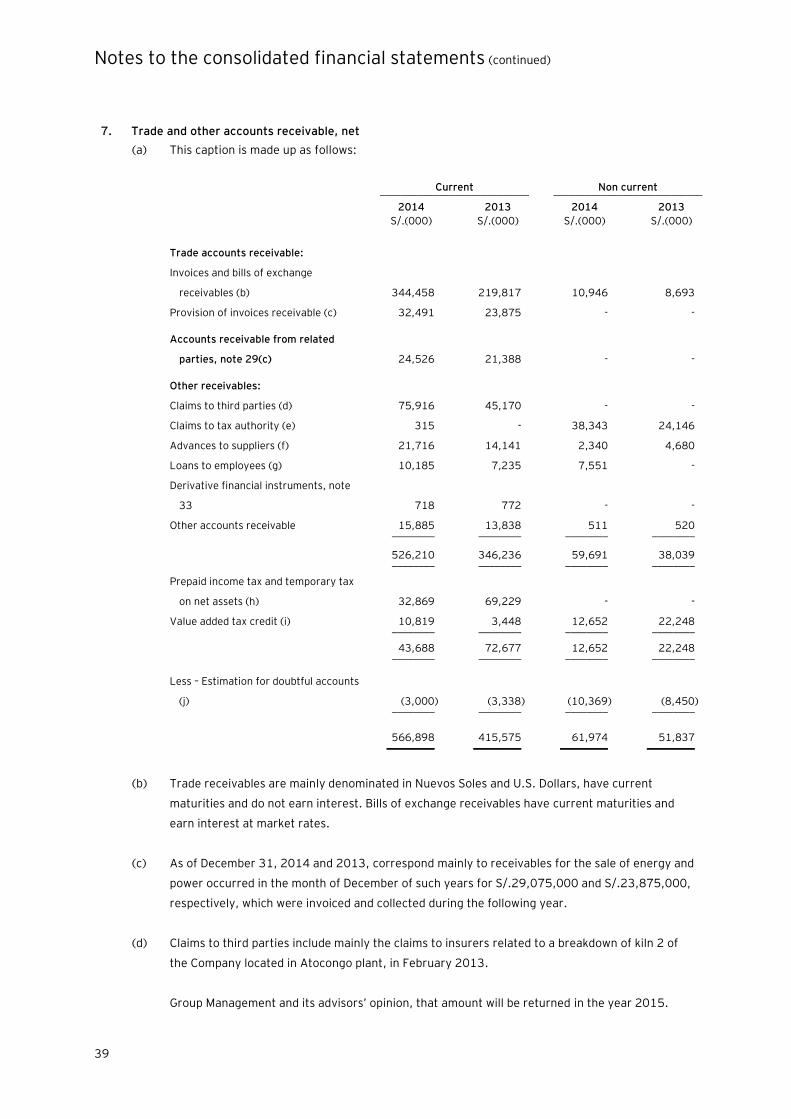
Notes to the consolidated financial statements (continued)
39
7. Trade and other accounts receivable, net
(a) This caption is made up as follows:
Current Non current ____________________________ ____________________________
2014 2013 2014 2013
S/.(000) S/.(000) S/.(000) S/.(000)
Trade accounts receivable:
Invoices and bills of exchange
receivables (b) 344,458 219,817 10,946 8,693
Provision of invoices receivable (c) 32,491 23,875 - -
Accounts receivable from related
parties, note 29(c) 24,526 21,388 - -
Other receivables:
Claims to third parties (d) 75,916 45,170 - -
Claims to tax authority (e) 315 - 38,343 24,146
Advances to suppliers (f) 21,716 14,141 2,340 4,680
Loans to employees (g) 10,185 7,235 7,551 -
Derivative financial instruments, note
33 718 772 - -
Other accounts receivable 15,885 13,838 511 520 - ________ ________ ________ ________
526,210 346,236 59,691 38,039 - ________ ________ ________ ________
Prepaid income tax and temporary tax
on net assets (h) 32,869 69,229 - -
Value added tax credit (i) 10,819 3,448 12,652 22,248 - ________ ________ ________ ________
43,688 72,677 12,652 22,248 - ________ ________ ________ ________
Less – Estimation for doubtful accounts
(j) (3,000) (3,338) (10,369) (8,450) - ________ ________ ________ ________
566,898 415,575 61,974 51,837 _________ _________ _________ _________
(b) Trade receivables are mainly denominated in Nuevos Soles and U.S. Dollars, have current
maturities and do not earn interest. Bills of exchange receivables have current maturities and
earn interest at market rates.
(c) As of December 31, 2014 and 2013, correspond mainly to receivables for the sale of energy and
power occurred in the month of December of such years for S/.29,075,000 and S/.23,875,000,
respectively, which were invoiced and collected during the following year.
(d) Claims to third parties include mainly the claims to insurers related to a breakdown of kiln 2 of
the Company located in Atocongo plant, in February 2013.
Group Management and its advisors’ opinion, that amount will be returned in the year 2015.
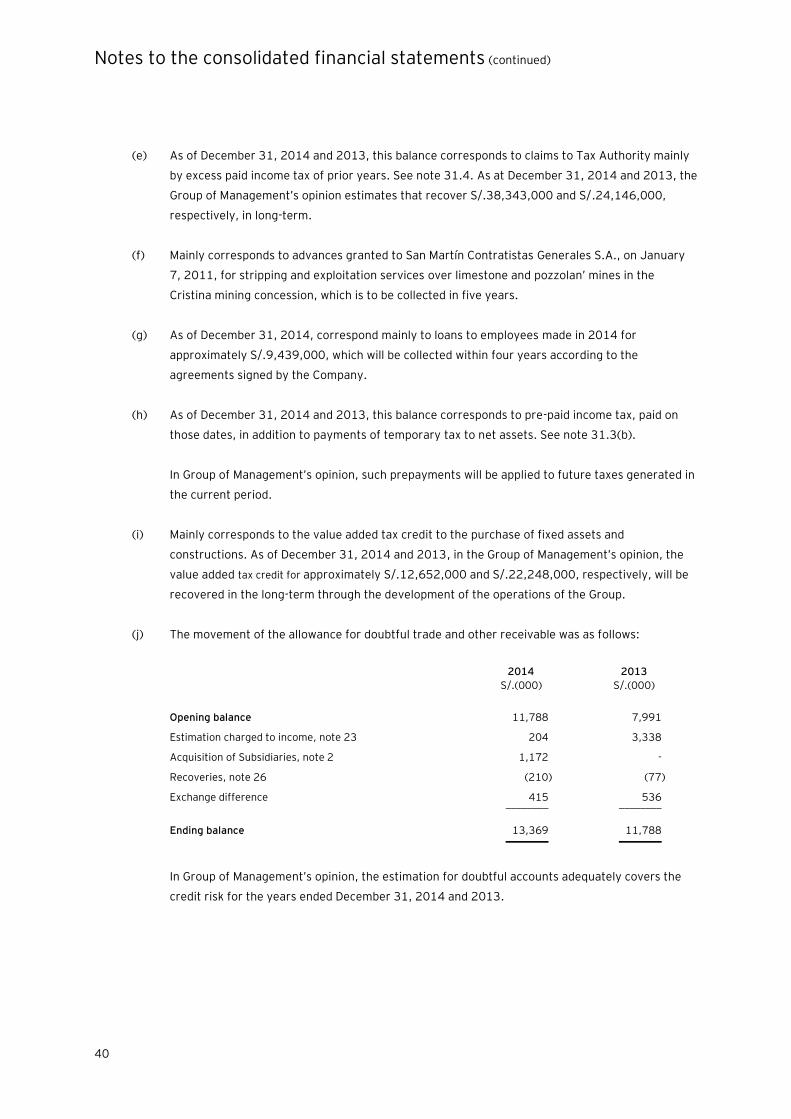
Notes to the consolidated financial statements (continued)
40
(e) As of December 31, 2014 and 2013, this balance corresponds to claims to Tax Authority mainly
by excess paid income tax of prior years. See note 31.4. As at December 31, 2014 and 2013, the
Group of Management’s opinion estimates that recover S/.38,343,000 and S/.24,146,000,
respectively, in long-term.
(f) Mainly corresponds to advances granted to San Martín Contratistas Generales S.A., on January
7, 2011, for stripping and exploitation services over limestone and pozzolan’ mines in the
Cristina mining concession, which is to be collected in five years.
(g) As of December 31, 2014, correspond mainly to loans to employees made in 2014 for
approximately S/.9,439,000, which will be collected within four years according to the
agreements signed by the Company.
(h) As of December 31, 2014 and 2013, this balance corresponds to pre-paid income tax, paid on
those dates, in addition to payments of temporary tax to net assets. See note 31.3(b).
In Group of Management’s opinion, such prepayments will be applied to future taxes generated in
the current period.
(i) Mainly corresponds to the value added tax credit to the purchase of fixed assets and
constructions. As of December 31, 2014 and 2013, in the Group of Management’s opinion, the
value added tax credit for approximately S/.12,652,000 and S/.22,248,000, respectively, will be
recovered in the long-term through the development of the operations of the Group.
(j) The movement of the allowance for doubtful trade and other receivable was as follows:
2014 2013
S/.(000) S/.(000)
Opening balance 11,788 7,991
Estimation charged to income, note 23 204 3,338
Acquisition of Subsidiaries, note 2 1,172 -
Recoveries, note 26 (210) (77)
Exchange difference 415 536 ________ ________
Ending balance 13,369 11,788
________ ________
In Group of Management’s opinion, the estimation for doubtful accounts adequately covers the
credit risk for the years ended December 31, 2014 and 2013.
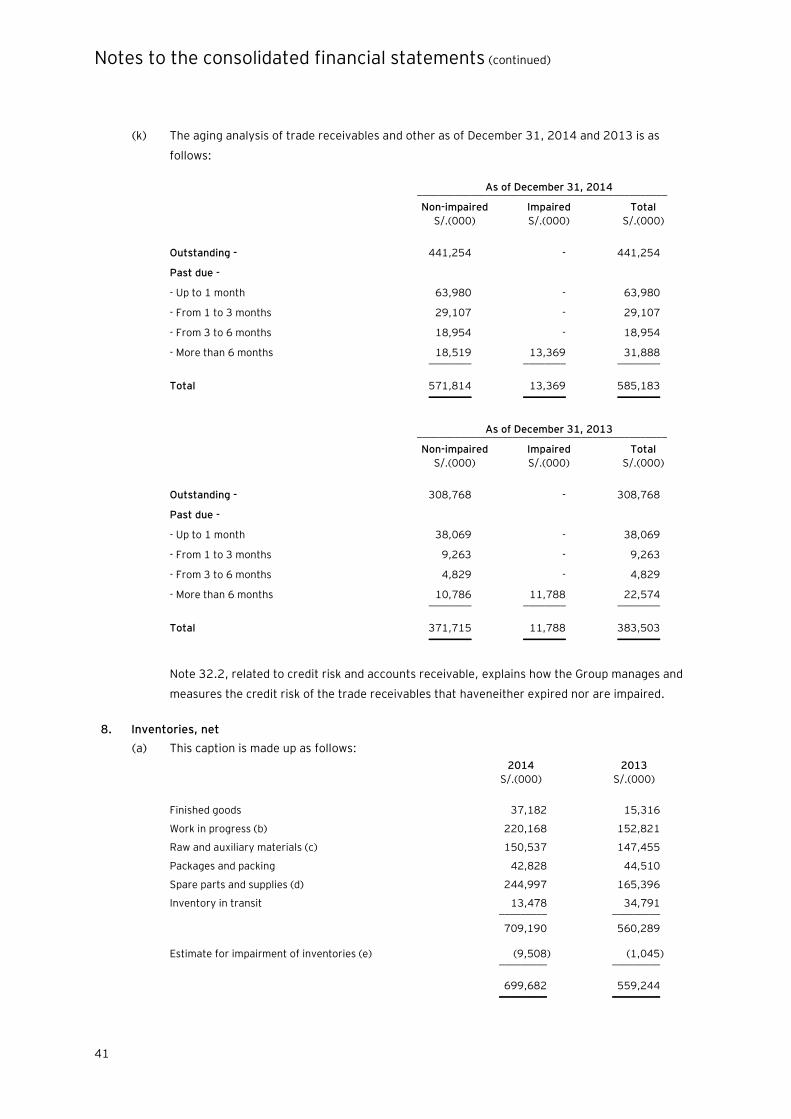
Notes to the consolidated financial statements (continued)
41
(k) The aging analysis of trade receivables and other as of December 31, 2014 and 2013 is as
follows:
As of December 31, 2014 _______________________________________________
Non-impaired Impaired Total
S/.(000) S/.(000) S/.(000)
Outstanding - 441,254 - 441,254
Past due -
- Up to 1 month 63,980 - 63,980
- From 1 to 3 months 29,107 - 29,107
- From 3 to 6 months 18,954 - 18,954
- More than 6 months 18,519 13,369 31,888 ________ ________ ________
Total 571,814 13,369 585,183 ________ ________ ________
As of December 31, 2013 _______________________________________________
Non-impaired Impaired Total
S/.(000) S/.(000) S/.(000)
Outstanding - 308,768 - 308,768
Past due -
- Up to 1 month 38,069 - 38,069
- From 1 to 3 months 9,263 - 9,263
- From 3 to 6 months 4,829 - 4,829
- More than 6 months 10,786 11,788 22,574 ________ ________ ________
Total 371,715 11,788 383,503 ________ ________ ________
Note 32.2, related to credit risk and accounts receivable, explains how the Group manages and
measures the credit risk of the trade receivables that haveneither expired nor are impaired.
8. Inventories, net
(a) This caption is made up as follows:
2014 2013
S/.(000) S/.(000)
Finished goods 37,182 15,316
Work in progress (b) 220,168 152,821
Raw and auxiliary materials (c) 150,537 147,455
Packages and packing 42,828 44,510
Spare parts and supplies (d) 244,997 165,396
Inventory in transit 13,478 34,791 _________ _________
709,190 560,289
Estimate for impairment of inventories (e) (9,508) (1,045) _________ _________
699,682 559,244 _________ _________
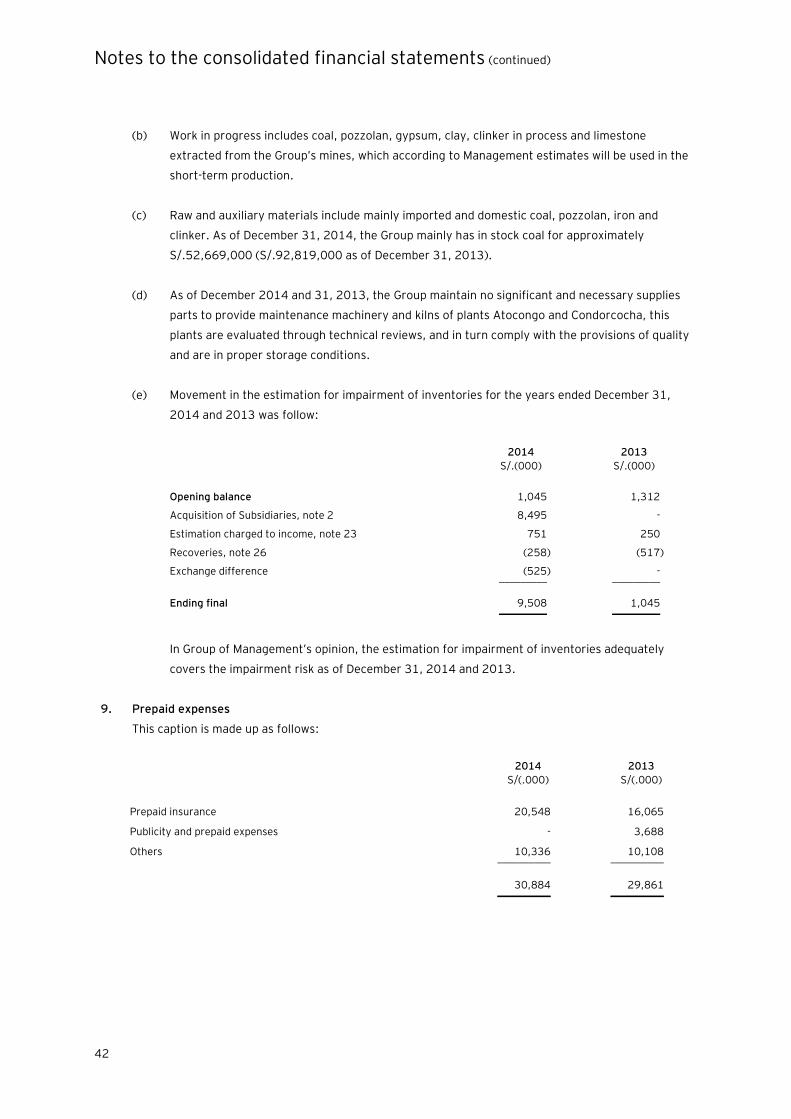
Notes to the consolidated financial statements (continued)
42
(b) Work in progress includes coal, pozzolan, gypsum, clay, clinker in process and limestone
extracted from the Group’s mines, which according to Management estimates will be used in the
short-term production.
(c) Raw and auxiliary materials include mainly imported and domestic coal, pozzolan, iron and
clinker. As of December 31, 2014, the Group mainly has in stock coal for approximately
S/.52,669,000 (S/.92,819,000 as of December 31, 2013).
(d) As of December 2014 and 31, 2013, the Group maintain no significant and necessary supplies
parts to provide maintenance machinery and kilns of plants Atocongo and Condorcocha, this
plants are evaluated through technical reviews, and in turn comply with the provisions of quality
and are in proper storage conditions.
(e) Movement in the estimation for impairment of inventories for the years ended December 31,
2014 and 2013 was follow:
2014 2013
S/.(000) S/.(000)
Opening balance 1,045 1,312
Acquisition of Subsidiaries, note 2 8,495 -
Estimation charged to income, note 23 751 250
Recoveries, note 26 (258) (517)
Exchange difference (525) - _________ _________
Ending final 9,508 1,045 _________ _________
In Group of Management’s opinion, the estimation for impairment of inventories adequately
covers the impairment risk as of December 31, 2014 and 2013.
9. Prepaid expenses
This caption is made up as follows:
2014 2013
S/(.000) S/(.000)
Prepaid insurance 20,548 16,065
Publicity and prepaid expenses - 3,688
Others 10,336 10,108 __________ __________
30,884 29,861 __________ __________
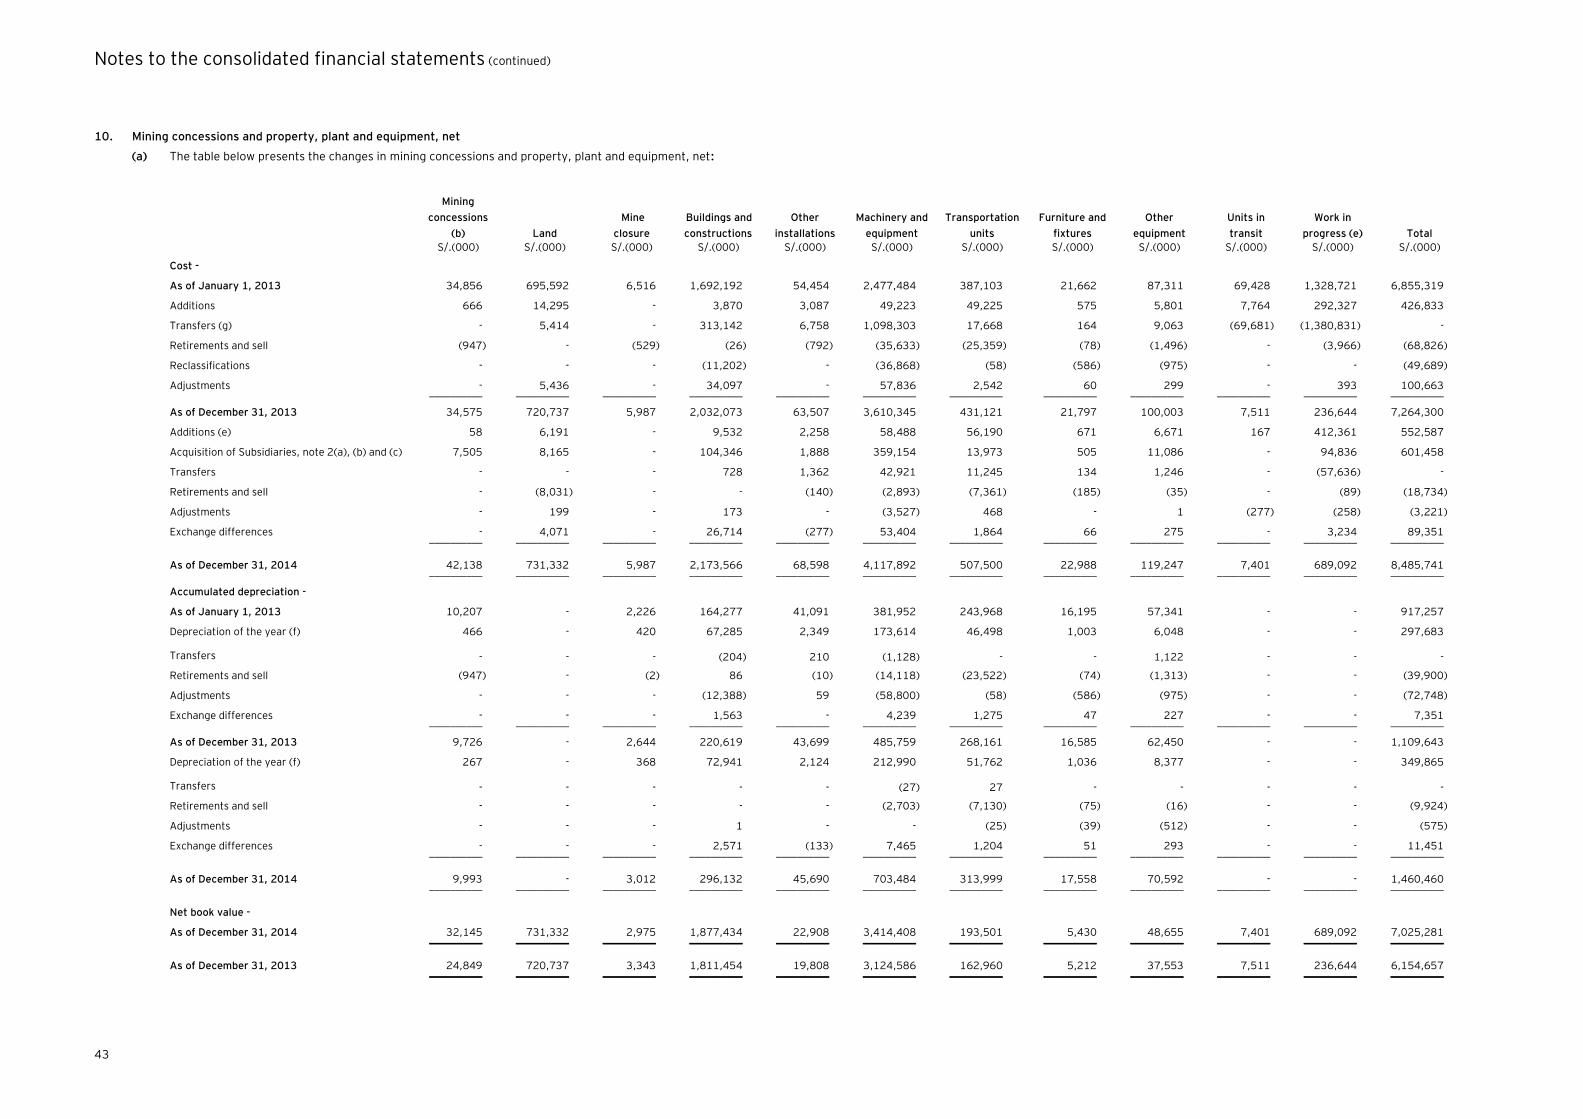
Notes to the consolidated financial statements (continued)
43
10. Mining concessions and property, plant and equipment, net
(a) The table below presents the changes in mining concessions and property, plant and equipment, net:
Mining
concessions
(b) Land
Mine
closure
Buildings and
constructions
Other
installations
Machinery and
equipment
Transportation
units
Furniture and
fixtures
Other
equipment
Units in
transit
Work in
progress (e) Total
S/.(000) S/.(000) S/.(000) S/.(000) S/.(000) S/.(000) S/.(000) S/.(000) S/.(000) S/.(000) S/.(000) S/.(000)
Cost -
As of January 1, 2013 34,856 695,592 6,516 1,692,192 54,454 2,477,484 387,103 21,662 87,311 69,428 1,328,721 6,855,319
Additions 666 14,295 - 3,870 3,087 49,223 49,225 575 5,801 7,764 292,327 426,833
Transfers (g) - 5,414 - 313,142 6,758 1,098,303 17,668 164 9,063 (69,681) (1,380,831) -
Retirements and sell (947) - (529) (26) (792) (35,633) (25,359) (78) (1,496) - (3,966) (68,826)
Reclassifications - - - (11,202) - (36,868) (58) (586) (975) - - (49,689)
Adjustments - 5,436 - 34,097 - 57,836 2,542 60 299 - 393 100,663
__________ __________ __________ __________ __________ __________ __________ __________ __________ __________ __________ __________
As of December 31, 2013 34,575 720,737 5,987 2,032,073 63,507 3,610,345 431,121 21,797 100,003 7,511 236,644 7,264,300
Additions (e) 58 6,191 - 9,532 2,258 58,488 56,190 671 6,671 167 412,361 552,587
Acquisition of Subsidiaries, note 2(a), (b) and (c) 7,505 8,165 - 104,346 1,888 359,154 13,973 505 11,086 - 94,836 601,458
Transfers - - - 728 1,362 42,921 11,245 134 1,246 - (57,636) -
Retirements and sell - (8,031) - - (140) (2,893) (7,361) (185) (35) - (89) (18,734)
Adjustments - 199 - 173 - (3,527) 468 - 1 (277) (258) (3,221)
Exchange differences - 4,071 - 26,714 (277) 53,404 1,864 66 275 - 3,234 89,351
__________ __________ __________ __________ __________ __________ __________ __________ __________ __________ __________ __________
As of December 31, 2014 42,138 731,332 5,987 2,173,566 68,598 4,117,892 507,500 22,988 119,247 7,401 689,092 8,485,741
__________ __________ __________ __________ __________ __________ __________ __________ __________ __________ __________ __________
Accumulated depreciation -
As of January 1, 2013 10,207 - 2,226 164,277 41,091 381,952 243,968 16,195 57,341 - - 917,257
Depreciation of the year (f) 466 - 420 67,285 2,349 173,614 46,498 1,003 6,048 - - 297,683
Transfers - - - (204) 210 (1,128) - - 1,122 - - -
Retirements and sell (947) - (2) 86 (10) (14,118) (23,522) (74) (1,313) - - (39,900)
Adjustments - - - (12,388) 59 (58,800) (58) (586) (975) - - (72,748)
Exchange differences - - - 1,563 - 4,239 1,275 47 227 - - 7,351 __________ __________ __________ __________ __________ __________ __________ __________ __________ __________ __________ __________
As of December 31, 2013 9,726 - 2,644 220,619 43,699 485,759 268,161 16,585 62,450 - - 1,109,643
Depreciation of the year (f) 267 - 368 72,941 2,124 212,990 51,762 1,036 8,377 - - 349,865
Transfers - - - - - (27) 27 - - - - -
Retirements and sell - - - - - (2,703) (7,130) (75) (16) - - (9,924)
Adjustments - - - 1 - - (25) (39) (512) - - (575)
Exchange differences - - - 2,571 (133) 7,465 1,204 51 293 - - 11,451
__________ __________ __________ __________ __________ __________ __________ __________ __________ __________ __________ __________
As of December 31, 2014 9,993 - 3,012 296,132 45,690 703,484 313,999 17,558 70,592 - - 1,460,460
__________ __________ __________ __________ __________ __________ __________ __________ __________ __________ __________ __________
Net book value -
As of December 31, 2014 32,145 731,332 2,975 1,877,434 22,908 3,414,408 193,501 5,430 48,655 7,401 689,092 7,025,281
__________ __________ __________ __________ __________ __________ __________ __________ __________ __________ __________ __________
As of December 31, 2013 24,849 720,737 3,343 1,811,454 19,808 3,124,586 162,960 5,212 37,553 7,511 236,644 6,154,657
__________ __________ __________ __________ __________ __________ __________ __________ __________ __________ __________ __________
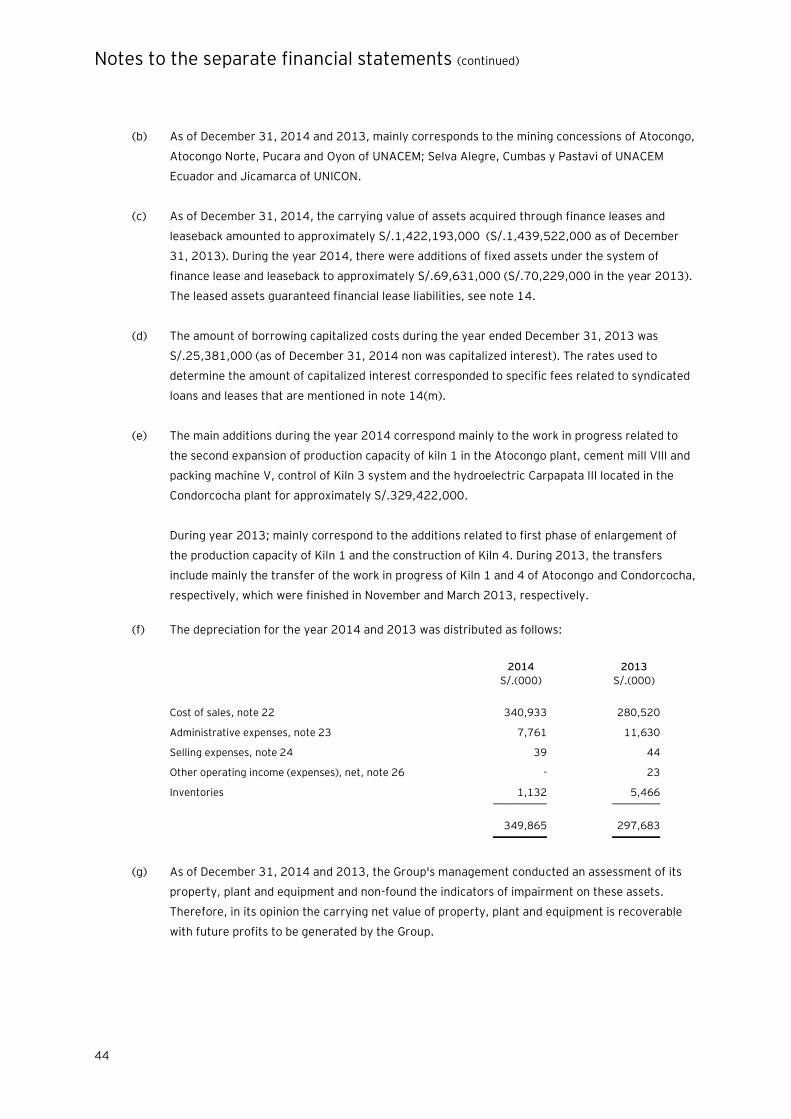
Notes to the separate financial statements (continued)
44
(b) As of December 31, 2014 and 2013, mainly corresponds to the mining concessions of Atocongo,
Atocongo Norte, Pucara and Oyon of UNACEM; Selva Alegre, Cumbas y Pastavi of UNACEM
Ecuador and Jicamarca of UNICON.
(c) As of December 31, 2014, the carrying value of assets acquired through finance leases and
leaseback amounted to approximately S/.1,422,193,000 (S/.1,439,522,000 as of December
31, 2013). During the year 2014, there were additions of fixed assets under the system of
finance lease and leaseback to approximately S/.69,631,000 (S/.70,229,000 in the year 2013).
The leased assets guaranteed financial lease liabilities, see note 14.
(d) The amount of borrowing capitalized costs during the year ended December 31, 2013 was
S/.25,381,000 (as of December 31, 2014 non was capitalized interest). The rates used to
determine the amount of capitalized interest corresponded to specific fees related to syndicated
loans and leases that are mentioned in note 14(m).
(e) The main additions during the year 2014 correspond mainly to the work in progress related to
the second expansion of production capacity of kiln 1 in the Atocongo plant, cement mill VIII and
packing machine V, control of Kiln 3 system and the hydroelectric Carpapata III located in the
Condorcocha plant for approximately S/.329,422,000.
During year 2013; mainly correspond to the additions related to first phase of enlargement of
the production capacity of Kiln 1 and the construction of Kiln 4. During 2013, the transfers
include mainly the transfer of the work in progress of Kiln 1 and 4 of Atocongo and Condorcocha,
respectively, which were finished in November and March 2013, respectively.
(f) The depreciation for the year 2014 and 2013 was distributed as follows:
2014 2013
S/.(000) S/.(000)
Cost of sales, note 22 340,933 280,520
Administrative expenses, note 23 7,761 11,630
Selling expenses, note 24 39 44
Other operating income (expenses), net, note 26 - 23
Inventories 1,132 5,466 _________ ________
349,865 297,683 _________ ________
(g) As of December 31, 2014 and 2013, the Group's management conducted an assessment of its
property, plant and equipment and non-found the indicators of impairment on these assets.
Therefore, in its opinion the carrying net value of property, plant and equipment is recoverable
with future profits to be generated by the Group.

Notes to the separate financial statements (continued)
45
(h) As of December 31, 2014 and 2013, the Company has established two mortgages on its mining
concession Atocongo and a mortgage on its mining concession Cristina up to S/.149,400,000
and US$94,000,000, respectively, to guarantee loans obtained with the BBVA Banco
Continental, see note 14.
In December 2014, the Company signed off the contract of the lifting of the mortgage on the
mining concession Atocongo by S/.149,400,000, which remained in force until the related loan
repayment in January 2015.
It has been a mortgage on their mining concession Atocongo up to US$75,000,000, to guarantee
the loan obtained with the Bank of Nova Scotia, and a mortgage on their property sub-lot 1 at
Pachacamac and Lurin district, sub-lot 2 Lurin district and sub-lot 3 Pachacamac district up to
US$50,000,000 to guarantee the loan obtained with the Bank of Nova Scotia, see note 14.
On the other hand its subsidiaries maintain trust as security for the production line 2 (located in
Ecuador), mortgage contract Plant San Javier (located in Chile), plant, vehicles and equipment
(located in the United States of America) guaranteeing bank loans, see note 14.
(i) In Management’s opinion, the Group has insurance policies to adequately cover all of its fixed
assets.
11. Deferred stripping cost
(a) This caption is made up as follows:
S/.(000)
Cost -
As of January 1, 2013 149,297
Additions 15,205 _________
As of December 31, 2013 164,502
Additions - _________
As of December 31, 2014 164,502 _________
Accumulated depreciation -
As of January 1, 2013 (16,911)
Additions, note 22 (4,776) _________
As of December 31, 2013 (21,687)
Additions, note 22 (6,863) _________
As of December 31, 2014 (28,550) _________
Importe neto en libros -
As of December 31,2014 135,952 _________
As of December 31,2013 142,815 _________
Notes to the separate financial statements (continued)
46
As of December 31, 2014 and 2013, the Company has three identifiable components that allow a
specific volume of limestone quarries and waste: Atocongo quarry; North Atocongo and Pucara
quarry.
During 2014, the Company did not recognize deferred stripping asset additions due to; the
stripping costs in the year were required to access the limestone produced in the same period
and were recorded in the consolidated statement of income and are reclassified as "Cost of
sales", see note 22.
As of December 31, 2014, the Company and its technical advisors determined 148,428,584 and
91,323,415 tonnes of limestone reserves and related waste limestone to be extracted in the
future, respectively (153,153,537 and 93,755,871 tonnes at December 31, 2013, respectively),
which are determined and controlled by identifiable component.
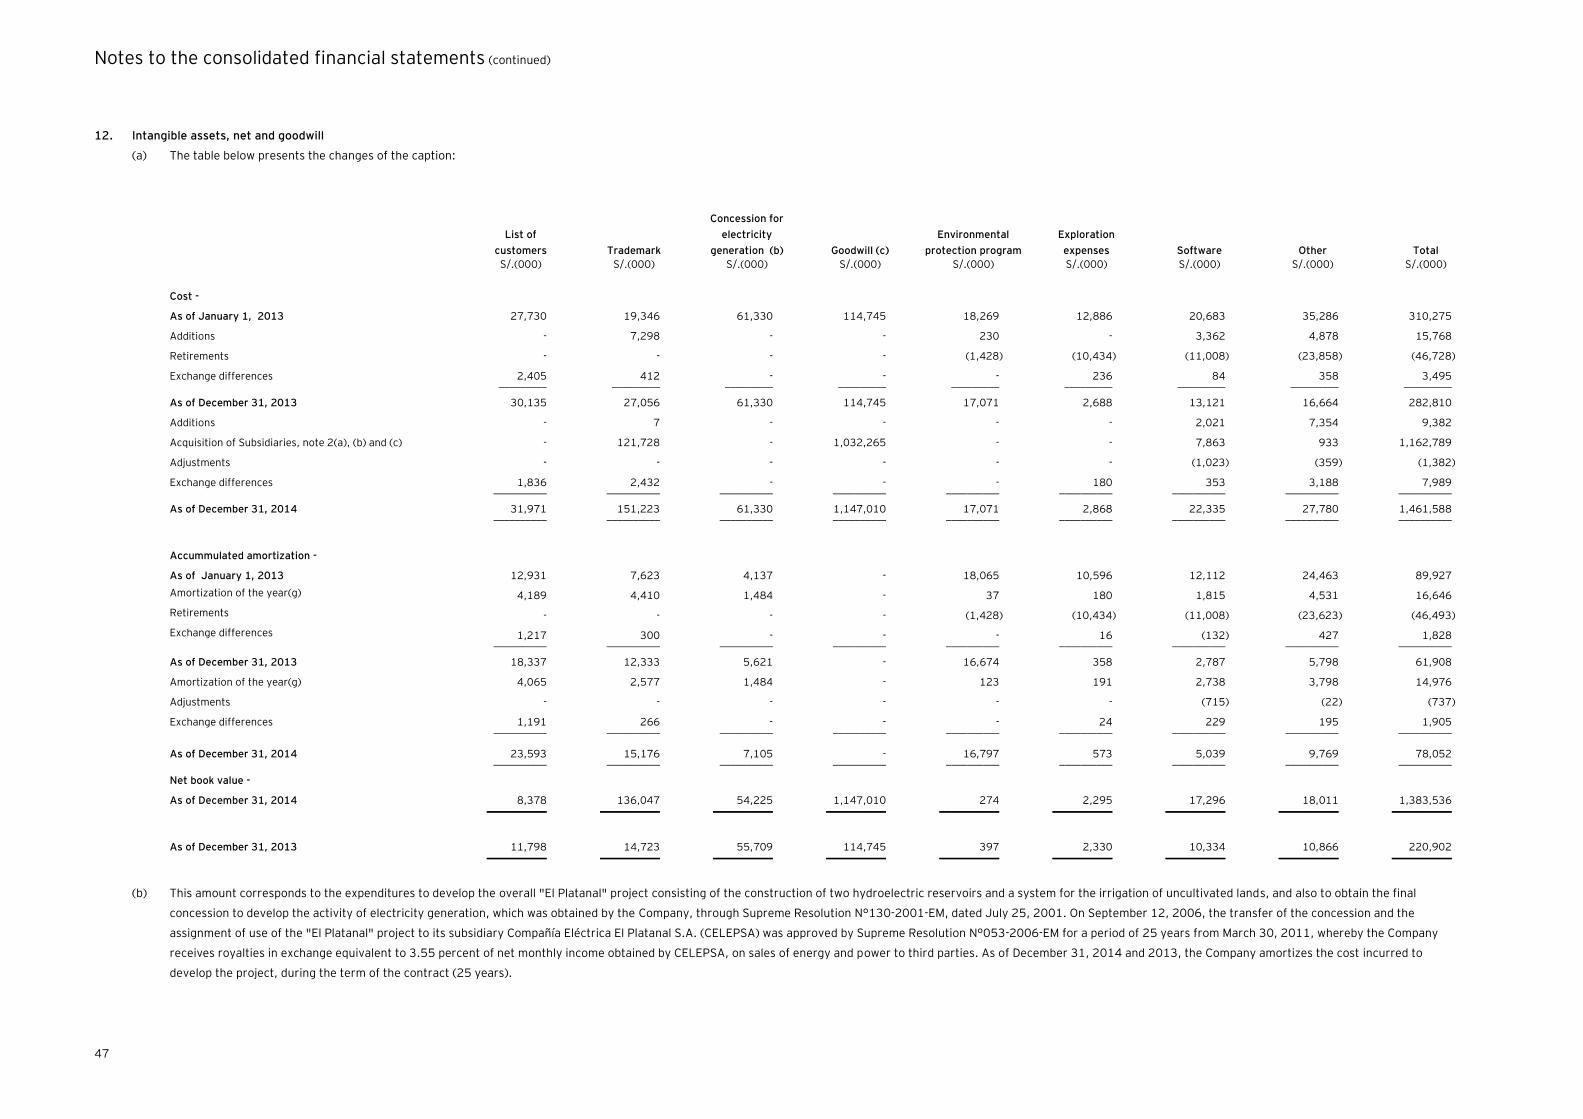
Notes to the consolidated financial statements (continued)
47
12. Intangible assets, net and goodwill
(a) The table below presents the changes of the caption:
(b) This amount corresponds to the expenditures to develop the overall "El Platanal" project consisting of the construction of two hydroelectric reservoirs and a system for the irrigation of uncultivated lands, and also to obtain the final
concession to develop the activity of electricity generation, which was obtained by the Company, through Supreme Resolution N°130-2001-EM, dated July 25, 2001. On September 12, 2006, the transfer of the concession and the
assignment of use of the "El Platanal" project to its subsidiary Compañía Eléctrica El Platanal S.A. (CELEPSA) was approved by Supreme Resolution N°053-2006-EM for a period of 25 years from March 30, 2011, whereby the Company
receives royalties in exchange equivalent to 3.55 percent of net monthly income obtained by CELEPSA, on sales of energy and power to third parties. As of December 31, 2014 and 2013, the Company amortizes the cost incurred to
develop the project, during the term of the contract (25 years).
List of
customers Trademark
Concession for
electricity
generation (b) Goodwill (c)
Environmental
protection program
Exploration
expenses Software Other Total
S/.(000) S/.(000) S/.(000) S/.(000) S/.(000) S/.(000) S/.(000) S/.(000) S/.(000)
Cost -
As of January 1, 2013 27,730 19,346 61,330 114,745 18,269 12,886 20,683 35,286 310,275
Additions - 7,298 - - 230 - 3,362 4,878 15,768
Retirements - - - - (1,428) (10,434) (11,008) (23,858) (46,728)
Exchange differences 2,405 412 - - - 236 84 358 3,495
_________ _________ _________ _________ _________ _________ _________ _________ _________
As of December 31, 2013 30,135 27,056 61,330 114,745 17,071 2,688 13,121 16,664 282,810
Additions - 7 - - - - 2,021 7,354 9,382
Acquisition of Subsidiaries, note 2(a), (b) and (c) - 121,728 - 1,032,265 - - 7,863 933 1,162,789
Adjustments - - - - - - (1,023) (359) (1,382)
Exchange differences 1,836 2,432 - - - 180 353 3,188 7,989
__________ __________ __________ __________ __________ __________ __________ __________ __________
As of December 31, 2014 31,971 151,223 61,330 1,147,010 17,071 2,868 22,335 27,780 1,461,588
__________ __________ __________ __________ __________ __________ __________ __________ __________
Accummulated amortization -
As of January 1, 2013 12,931 7,623 4,137 - 18,065 10,596 12,112 24,463 89,927
Amortization of the year(g) 4,189 4,410 1,484 - 37 180 1,815 4,531 16,646
Retirements - - - - (1,428) (10,434) (11,008) (23,623) (46,493)
Exchange differences 1,217 300 - - - 16 (132) 427 1,828
__________ __________ __________ __________ __________ __________ __________ __________ __________
As of December 31, 2013 18,337 12,333 5,621 - 16,674 358 2,787 5,798 61,908
Amortization of the year(g) 4,065 2,577 1,484 - 123 191 2,738 3,798 14,976
Adjustments - - - - - - (715) (22) (737)
Exchange differences 1,191 266 - - - 24 229 195 1,905
__________ __________ __________ __________ __________ __________ __________ __________ __________
As of December 31, 2014 23,593 15,176 7,105 - 16,797 573 5,039 9,769 78,052
__________ __________ __________ __________ __________ __________ __________ __________ __________
Net book value -
As of December 31, 2014 8,378 136,047 54,225 1,147,010 274 2,295 17,296 18,011 1,383,536
__________ __________ __________ __________ __________ __________ __________ __________ __________
As of December 31, 2013 11,798 14,723 55,709 114,745 397 2,330 10,334 10,866 220,902
__________ __________ __________ __________ __________ __________ __________ __________ __________
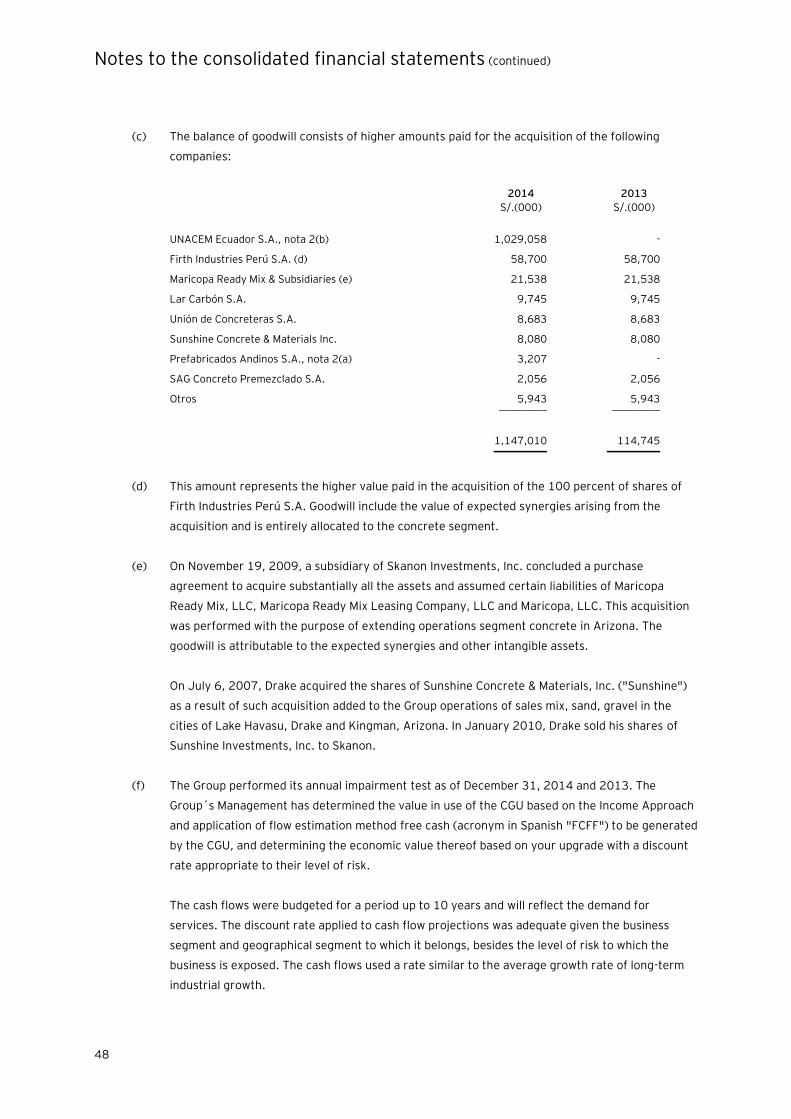
Notes to the consolidated financial statements (continued)
48
(c) The balance of goodwill consists of higher amounts paid for the acquisition of the following
companies:
2014 2013
S/.(000) S/.(000)
UNACEM Ecuador S.A., nota 2(b) 1,029,058 -
Firth Industries Perú S.A. (d) 58,700 58,700
Maricopa Ready Mix & Subsidiaries (e) 21,538 21,538
Lar Carbón S.A. 9,745 9,745
Unión de Concreteras S.A. 8,683 8,683
Sunshine Concrete & Materials Inc. 8,080 8,080
Prefabricados Andinos S.A., nota 2(a) 3,207 -
SAG Concreto Premezclado S.A. 2,056 2,056
Otros 5,943 5,943 _________ _________
1,147,010 114,745 __________ __________
(d) This amount represents the higher value paid in the acquisition of the 100 percent of shares of
Firth Industries Perú S.A. Goodwill include the value of expected synergies arising from the
acquisition and is entirely allocated to the concrete segment.
(e) On November 19, 2009, a subsidiary of Skanon Investments, Inc. concluded a purchase
agreement to acquire substantially all the assets and assumed certain liabilities of Maricopa
Ready Mix, LLC, Maricopa Ready Mix Leasing Company, LLC and Maricopa, LLC. This acquisition
was performed with the purpose of extending operations segment concrete in Arizona. The
goodwill is attributable to the expected synergies and other intangible assets.
On July 6, 2007, Drake acquired the shares of Sunshine Concrete & Materials, Inc. ("Sunshine")
as a result of such acquisition added to the Group operations of sales mix, sand, gravel in the
cities of Lake Havasu, Drake and Kingman, Arizona. In January 2010, Drake sold his shares of
Sunshine Investments, Inc. to Skanon.
(f) The Group performed its annual impairment test as of December 31, 2014 and 2013. The
Group´s Management has determined the value in use of the CGU based on the Income Approach
and application of flow estimation method free cash (acronym in Spanish "FCFF") to be generated
by the CGU, and determining the economic value thereof based on your upgrade with a discount
rate appropriate to their level of risk.
The cash flows were budgeted for a period up to 10 years and will reflect the demand for
services. The discount rate applied to cash flow projections was adequate given the business
segment and geographical segment to which it belongs, besides the level of risk to which the
business is exposed. The cash flows used a rate similar to the average growth rate of long-term
industrial growth.
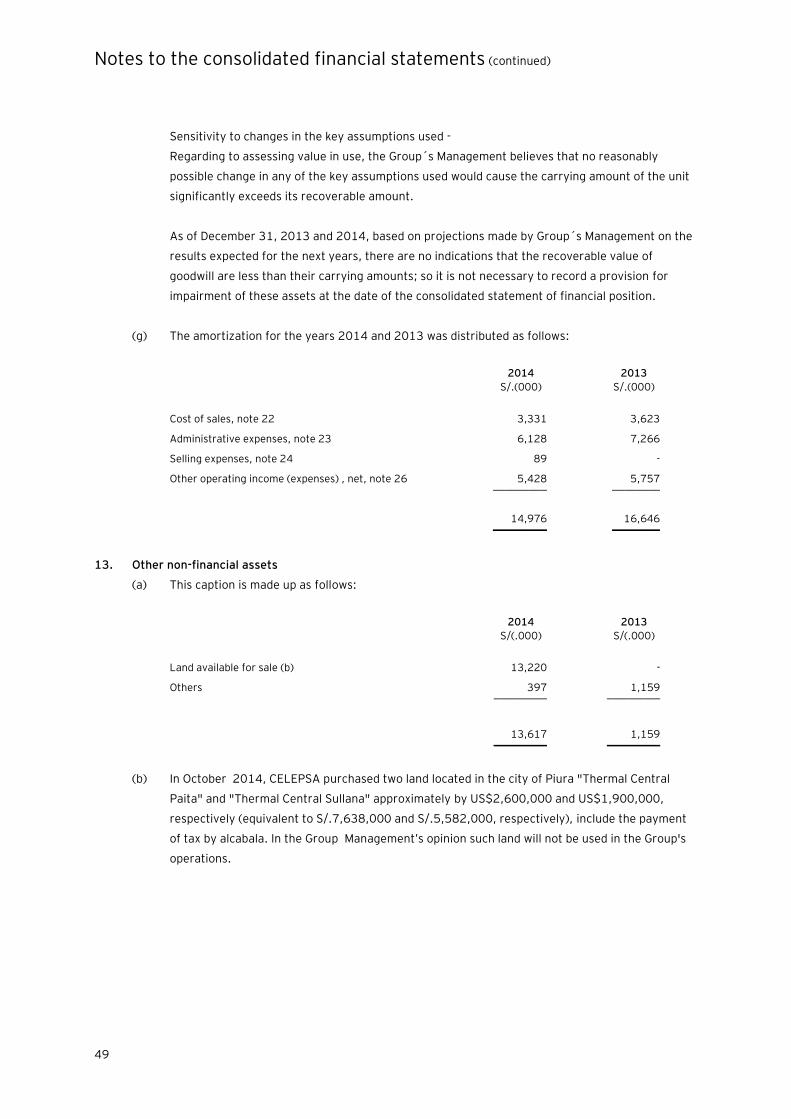
Notes to the consolidated financial statements (continued)
49
Sensitivity to changes in the key assumptions used -
Regarding to assessing value in use, the Group´s Management believes that no reasonably
possible change in any of the key assumptions used would cause the carrying amount of the unit
significantly exceeds its recoverable amount.
As of December 31, 2013 and 2014, based on projections made by Group´s Management on the
results expected for the next years, there are no indications that the recoverable value of
goodwill are less than their carrying amounts; so it is not necessary to record a provision for
impairment of these assets at the date of the consolidated statement of financial position.
(g) The amortization for the years 2014 and 2013 was distributed as follows:
13. Other non-financial assets
(a) This caption is made up as follows:
2014 2013
S/(.000) S/(.000)
Land available for sale (b) 13,220 -
Others 397 1,159 __________ __________
13,617 1,159 __________ __________
(b) In October 2014, CELEPSA purchased two land located in the city of Piura "Thermal Central
Paita" and "Thermal Central Sullana" approximately by US$2,600,000 and US$1,900,000,
respectively (equivalent to S/.7,638,000 and S/.5,582,000, respectively), include the payment
of tax by alcabala. In the Group Management’s opinion such land will not be used in the Group's
operations.
2014 2013
S/.(000) S/.(000)
Cost of sales, note 22 3,331 3,623
Administrative expenses, note 23 6,128 7,266
Selling expenses, note 24 89 -
Other operating income (expenses) , net, note 26 5,428 5,757 _________ ________
14,976 16,646 _________ ________
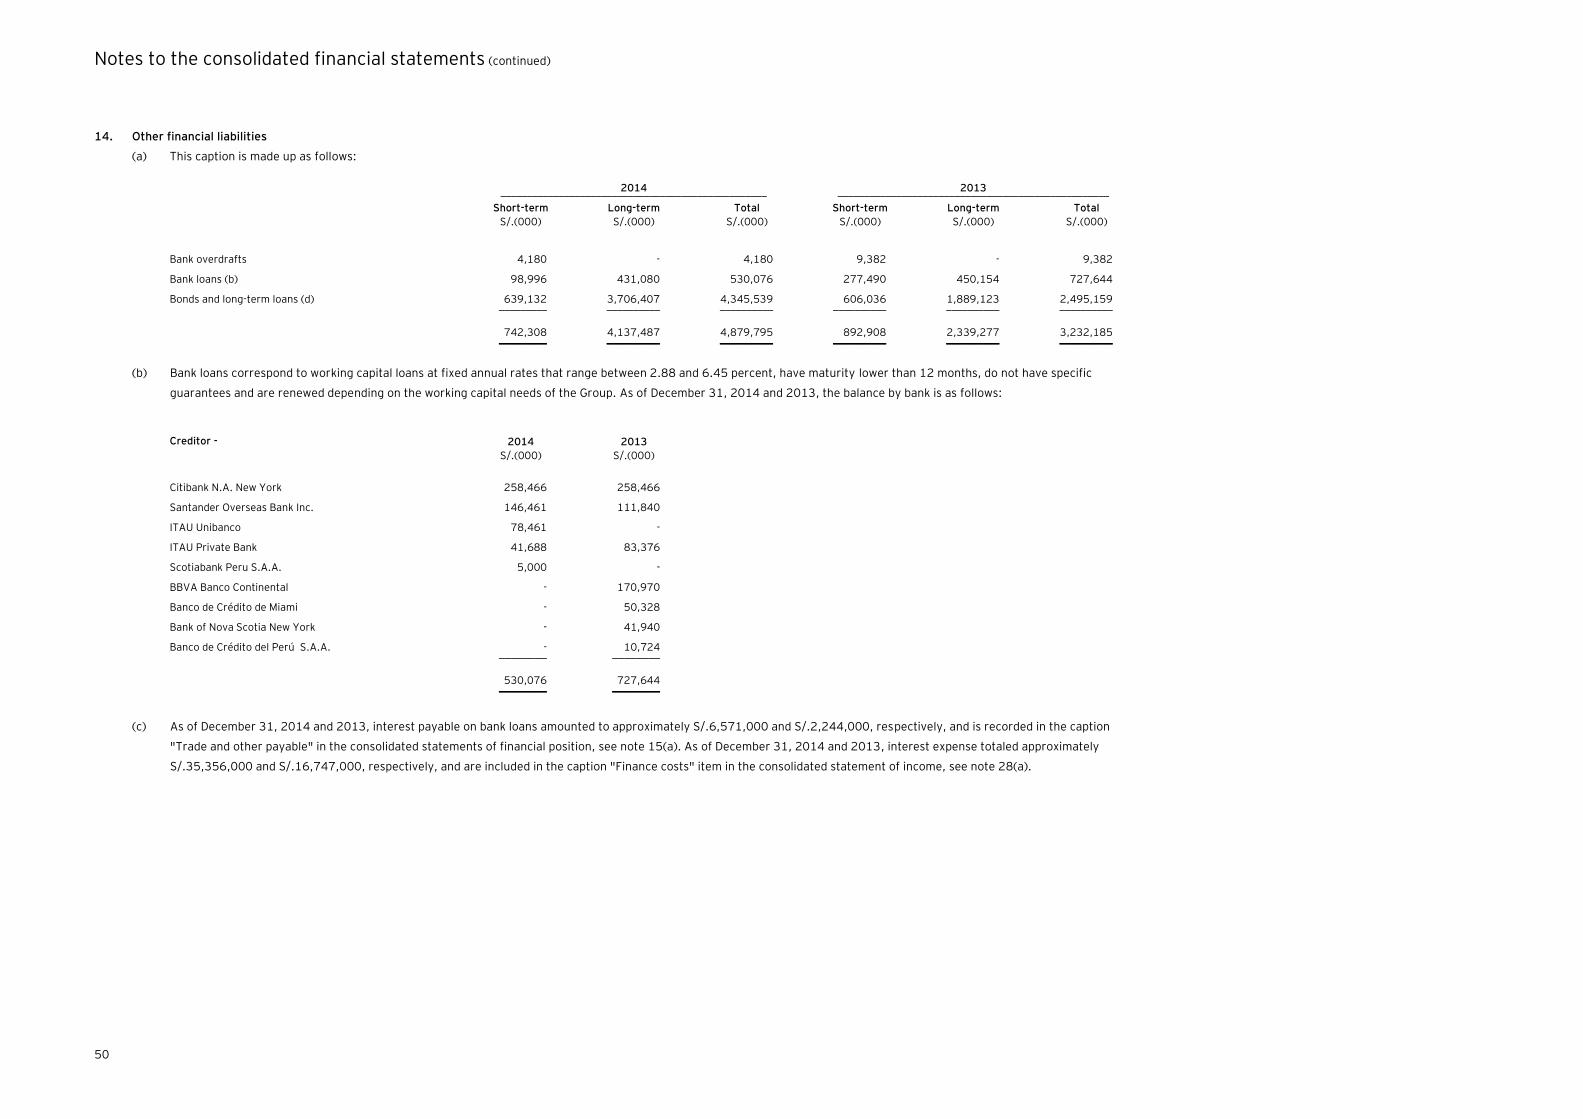
Notes to the consolidated financial statements (continued)
50
14. Other financial liabilities
(a) This caption is made up as follows:
2014 2013 __________________________________________________ ___________________________________________________
Short-term Long-term Total Short-term Long-term Total
S/.(000) S/.(000) S/.(000) S/.(000) S/.(000) S/.(000)
Bank overdrafts 4,180 - 4,180 9,382 - 9,382
Bank loans (b) 98,996 431,080 530,076 277,490 450,154 727,644
Bonds and long-term loans (d) 639,132 3,706,407 4,345,539 606,036 1,889,123 2,495,159
_________ __________ __________ __________ __________ __________
742,308 4,137,487 4,879,795 892,908 2,339,277 3,232,185
_________ __________ __________ __________ __________ __________
(b) Bank loans correspond to working capital loans at fixed annual rates that range between 2.88 and 6.45 percent, have maturity lower than 12 months, do not have specific
guarantees and are renewed depending on the working capital needs of the Group. As of December 31, 2014 and 2013, the balance by bank is as follows:
Creditor - 2014 2013
S/.(000) S/.(000)
Citibank N.A. New York 258,466 258,466
Santander Overseas Bank Inc. 146,461 111,840
ITAU Unibanco 78,461 -
ITAU Private Bank 41,688 83,376
Scotiabank Peru S.A.A. 5,000 -
BBVA Banco Continental - 170,970
Banco de Crédito de Miami - 50,328
Bank of Nova Scotia New York - 41,940
Banco de Crédito del Perú S.A.A. - 10,724 ________ ________
530,076 727,644 _________ _________
(c) As of December 31, 2014 and 2013, interest payable on bank loans amounted to approximately S/.6,571,000 and S/.2,244,000, respectively, and is recorded in the caption
"Trade and other payable" in the consolidated statements of financial position, see note 15(a). As of December 31, 2014 and 2013, interest expense totaled approximately
S/.35,356,000 and S/.16,747,000, respectively, and are included in the caption "Finance costs" item in the consolidated statement of income, see note 28(a).

Notes to the consolidated financial statements (continued)
51
(d) The composition of the caption “Bonds and long-term loans” is as follows:
Annual interest rate Maturity Guarantee 2014 2013
% S/.(000) S/.(000)
Corporate Bonds -
International Bonds (e) 5.875 October 2021 No guarantees 1,868,125 -
Corporate bonds (f)
Between 4.93 and 6.25
Between January 2015 and March
2023 No guarantees 338,584 520,459
Bonds of Arizona State (g) Between 3.245 and 12 September 2035 Letter of Credit Bank 119,560 111,840 __________ __________
2,326,269 632,299
Amortized cost (31,858) (3,568) __________ __________
2,294,411 628,731 __________ __________
Syndicated loans -
Banco de Crédito del Perú S.A.A. – BCP (h) Libor to 3 months + 2.375 December 2016 Several guarantee by shareholders 3,795 4,734
Banco Scotiabank del Perú S.A.A. (h) Libor to 3 months + 2.375 December 2016 Several guarantee by shareholders 166 207 __________ __________
3,961 4,941 __________ __________
Bank loans -
Bank of Nova Scotia
Libor to 3 months +2.35 ,1.95 and
2.40
Between September 2015 and
September 2018
Property and mining concessions, note
10(h) 237,999 303,249
Banco Internacional del Perú S.A.A. – INTERBANK Between 5.25 and 6.24 Between July 2017 and March 2019 No guarantees 271,216 168,421
BBVA Compass
Libor to 3 months +1.35, Libor + 3
min 4 and Libor +4 min 4.25
Between June 2016 and May 2018
Plant, land and equipment 170,018 179,496
Banco de Crédito e Inversiones (BCI) 2.45 July 2016 No guarantees 156,923 -
Bank of Nova Scotia (i) Libor to 3 months + 2.25 January and April 2019 Guarantee on property 116,870 128,594
BBVA Banco Continental
Libor to 3 months + 2.90 ,4.35
and 6.0
Between January 2015 and June 2017
Mining concessions, see note 10(h) 113,358 154,890
Banco Internacional S.A.
8.0
5 to 7 years
Guarantee trust (machinery production
line 2) 88,848 -
Banco de Crédito del Perú S.A.A. – BCP Between 5.57 and 5.80 Between July and October 2016 No guarantees 39,853 42,859
Mack (mixers) 6.59 Between July 2019 and October 2019 Equipment 13,651 -
Citibank 6.65 - No guarantees 12,853 -
Other less than S/.10,000,000 32,614 13,497 __________ __________
1,254,203 991,006
Amortized cost (5,401) (5,248) __________ __________
1,248,802 985,758 __________ __________
Finance leasebacks -
Banco de Crédito del Perú S.A.A. (h) 7.21 December 2020 Leased goods 104,299 97,564
Scotiabank del Perú S.A.C. (h) 7.21 December 2020 Leased goods 45,151 42,236
Banco Internacional del Perú – INTERBANK 5.4 November 2016 Leased goods 5,372 7,419 __________ __________
154,822 147,219 __________ __________
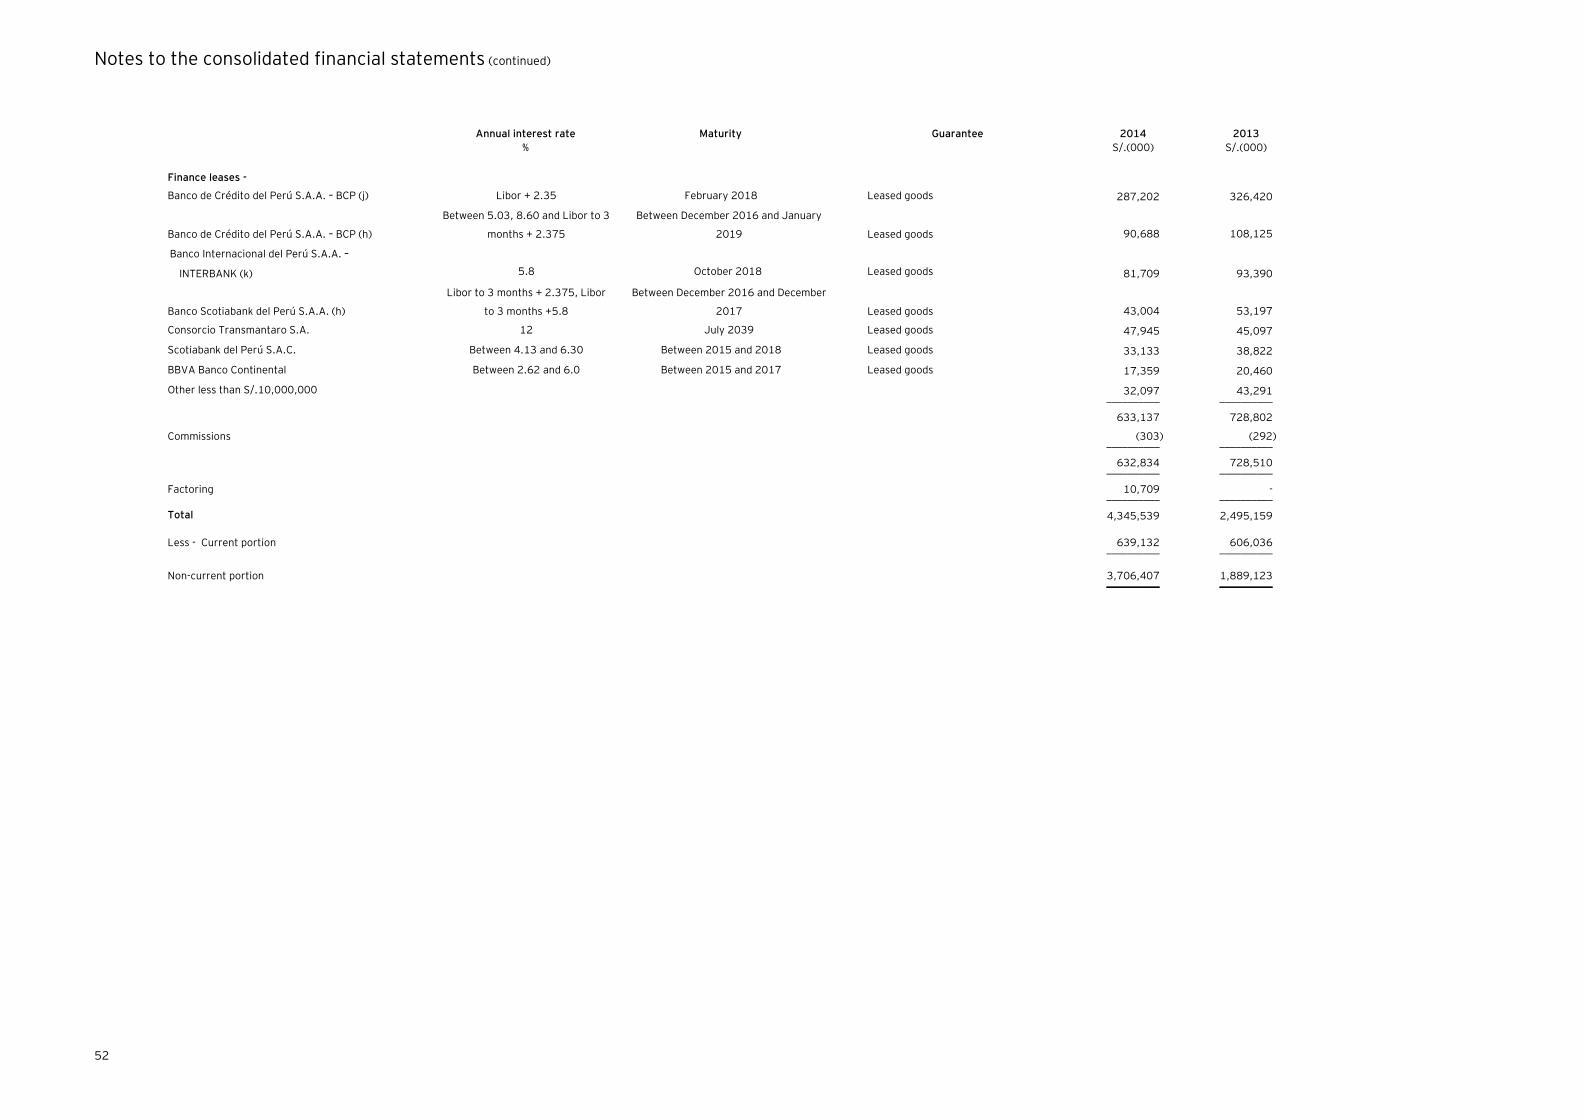
Notes to the consolidated financial statements (continued)
52
Annual interest rate Maturity Guarantee 2014 2013
% S/.(000) S/.(000)
Finance leases -
Banco de Crédito del Perú S.A.A. – BCP (j) Libor + 2.35 February 2018 Leased goods 287,202 326,420
Banco de Crédito del Perú S.A.A. – BCP (h)
Between 5.03, 8.60 and Libor to 3
months + 2.375
Between December 2016 and January
2019
Leased goods 90,688 108,125
Banco Internacional del Perú S.A.A. –
INTERBANK (k)
5.8
October 2018
Leased goods 81,709 93,390
Banco Scotiabank del Perú S.A.A. (h)
Libor to 3 months + 2.375, Libor
to 3 months +5.8
Between December 2016 and December
2017
Leased goods 43,004 53,197
Consorcio Transmantaro S.A. 12 July 2039 Leased goods 47,945 45,097
Scotiabank del Perú S.A.C. Between 4.13 and 6.30 Between 2015 and 2018 Leased goods 33,133 38,822
BBVA Banco Continental Between 2.62 and 6.0 Between 2015 and 2017 Leased goods 17,359 20,460
Other less than S/.10,000,000 32,097 43,291 __________ __________
633,137 728,802
Commissions (303) (292) __________ __________
632,834 728,510 __________ __________
Factoring 10,709 - __________ __________
Total 4,345,539 2,495,159
Less - Current portion 639,132 606,036 __________ __________
Non-current portion 3,706,407 1,889,123 __________ __________
Notes to the consolidated financial statements (continued)
53
(e) On May 26, 2014, the Board of Meeting of the company approved the acquisition of 98.57
percent of the shares of UNACEM Ecuador S.A. (formerly Lafarge Cementos S.A.) (a public
company located in Quito, Ecuador, subsidiary of Lafarge S.A. of France. On October 20, 2014
the Board of Meeting agreed the international bond issue (“Senior Notes”) under the Rule 144A
of the US Securities and under the regulation S of the US Securities Act of 1933, on the
Luxembourg Stock Exchange for a nominal value of US$625 million, at a nominal interest rate of
5.875 percent with maturity on 2021, resulting a total net collection of fees and expenses of
US$615 million (approximately equivalent to S/.1,839 million).
The Company used the funds to purchase the shares of UNACEM Ecuador S.A. (formerly Lafarge
Cementos S.A.) and Subsidiaries through its subsidiary Imbabura for a total amount of US$519
million (equivalent to S/.1,520.7 million), see note 2(b). On November 25, 2014, Imbabura took
control UNACEM Ecuador´s operations.
(f) Also includes the "First Program of Corporate Bonds Cemento Andino S.A." (transferred later as
result of the merger with the Company) up to the amount of issuance of US$40,000,000 or its
equivalent in Nuevos Soles. As of December 31, 2014, the balance amounted to approximately
S/.280,000,000 and S/.58,584,000, respectively (as of December 31, 2013, approximately
S/.450,000,000 and S/.70,459,000, respectively).
The purpose of issuances was raise funds to finance medium-term investments.
(g) On November 18, 2010, Drake Cement, LLC obtained a bond financing of the Development
Authority of Yavapai County, Arizona, for the purpose of finance part of the investment in the
cement plant of the subsidiary amounting to US$40,000,000, maturing in September 2035 and
a monthly interest payments on the basis a variable interest rate (Securities Industry and
Financial Markets Association Index rate) currently at 0.38 percent from 3.245 percent, up to a
maximum interest rate 12 percent). The bonds are secured by a letter of credit from the bank.
(h) On April 12, 2007, Banco de Crédito del Perú - BCP, Scotiabank del Perú S.A.A. (Scotiabank) and
CELEPSA signed leasing agreement and syndicated loan for that the designated financial
institutions are charge of finance civil works construction of the hydroelectric G-1 Platanal, up to
an amount of US$120,000,000, to nominal annual interest rate equal to LIBOR (3 months) plus
2.375 percent, structured as follows: US$80,000,000 and US$40,000,000 financed by BCP and
Scotiabank, respectively.
Due to the increased value of the work generated during the development of project, on June 30,
2009, the creditors agreed to extend financing; in that sense, the BCP and Scotiabank agreed to
give to CELEPSA a new financing through finance leases by US$60,000,000 of which
US$40,000,000 corresponded to BCP with an annual fixed rate of 8.6 percent and
US$20,000,000 corresponded to Scotiabank with a variable rate LIBOR plus 5.8 annual nominal
percent.
Notes to the consolidated financial statements (continued)
54
On December 20, 2013, CELEPSA signed leaseback contracts to pre-pay the syndicated loans. In
that sense, BCP and Scotiabank agreed to give US$51,000,000 of which US$36,000,000
corresponded to BCP and US$15,000,000 corresponded to Scotiabank, both loans to annual
fixed rate of 7.21 percent.
(i) Corresponds to UNICON's loan granted by Bank of Nova Scotia, on December 2011, which
mature in the year 2019 and has two years of grace loan. The loan’s recourses were used to
acquire 99.9 percent of the shares of Firth Industries S.A.
(j) On December 17, 2008, UNACEM signed with BCP a contract of terms and conditions of financial
leasing for the extension of the production capacity through the installment of a new line of
production (Kiln 4) in the plant of Condorcocha. The financing ascends to US$162,000,000,
which were disbursed in three parts: US$25,000,000, US$85,000,000 and US$52,000,000. On
March 2013 was disbursed the third part.
The Company completed this expansion project in year 2013. As of December 31, 2014, the net
carrying value of the assets of the kiln 4 is approximately S/.565,369,000 (S/.602,225,000 as
of December 31, 2013) which guarantee the financing described, see note 10(e).
(k) In General Shareholders Meeting dated May 19, 2010, approved the sign of the lease agreement
to increase the production capacity with Banco Internacional del Perú (Interbank), this project
increase the production capacity of Kiln 1 from 3,200 to 7,500 tones clinker/day, located in
Atocongo´s plant. The Company completed the project in the year 2013. As of December 31,
2014, the net carrying value of the assets is approximately S/.614,766,000 (S/.644,037,000 as
of December 31, 2013), which guarantee the described financing, see note 10(e).
(l) As of December 31, 2014 and 2013, interests payable related to bonds and long-term debt are
amounted to approximately S/.29,967,000 and S/.15,692,000, respectively and are recorded in
the caption “Trade and other accounts payable”, of the consolidated statement of financial
position, note 15.
(m) In 2014, no was capitalized interest. In 2013 was capitalized interest by approximately
S/.25,381,000 and recorded in the caption "Property, plant and equipment, net" in the
consolidated statement of financial position, see note 10(d). The balance ascend approximately
S/.129,797,000 and S/.105,267,000 as of December 31, 2014 and 2013, respectively, is
included in the caption "Finance costs" in the consolidated statement of income, note 28(a).
(n) The financial covenants are monitored quarterly and must be calculated on the basis of separate
financial information and calculation methodologies required by each financial institution.
Compliance with financial covenants is monitored by the Group Management and the
Representative of the Noteholders. In case of deafault of the above safeguards will be incurred in
the event of early termination. In the opinion of management, the Group has complied with the
financial covenants required by financial institutions with which maintains funding at December
31, 2014.
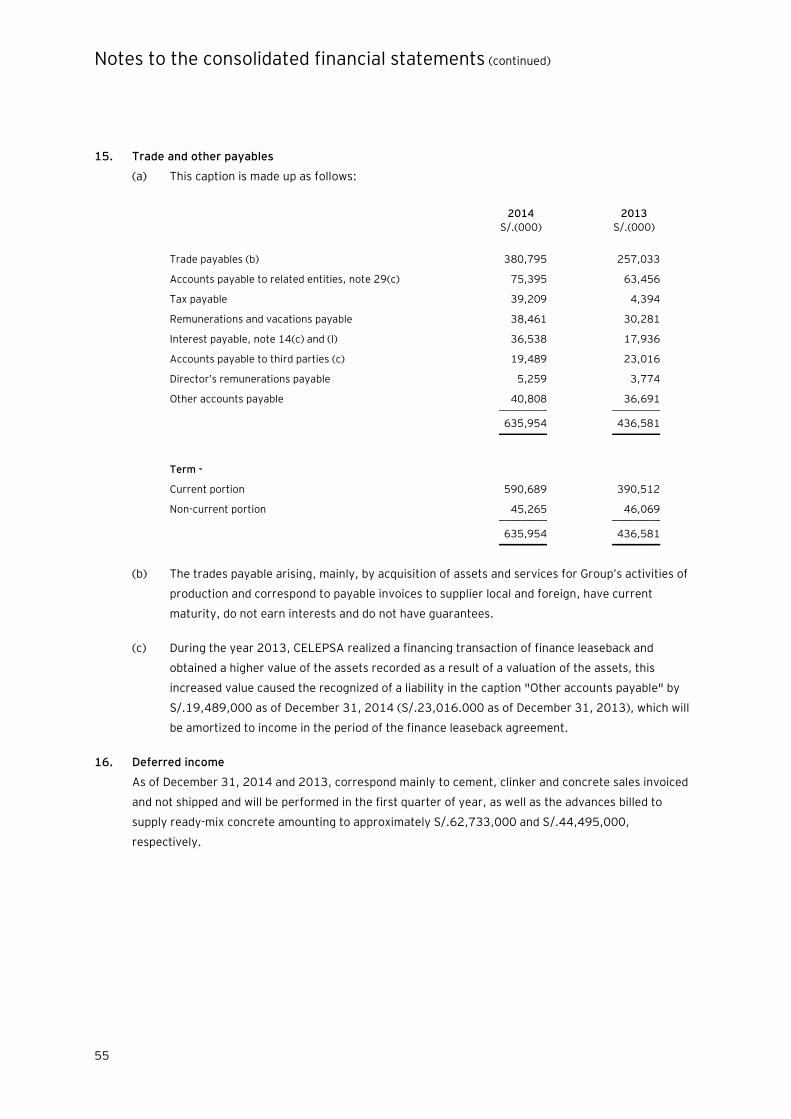
Notes to the consolidated financial statements (continued)
55
15. Trade and other payables
(a) This caption is made up as follows:
2014 2013
S/.(000) S/.(000)
Trade payables (b) 380,795 257,033
Accounts payable to related entities, note 29(c) 75,395 63,456
Tax payable 39,209 4,394
Remunerations and vacations payable 38,461 30,281
Interest payable, note 14(c) and (l) 36,538 17,936
Accounts payable to third parties (c) 19,489 23,016
Director’s remunerations payable 5,259 3,774
Other accounts payable 40,808 36,691 _________ _________
635,954 436,581 _________ _________
Term -
Current portion 590,689 390,512
Non-current portion 45,265 46,069 _________ _________
635,954 436,581 _________ _________
(b) The trades payable arising, mainly, by acquisition of assets and services for Group’s activities of
production and correspond to payable invoices to supplier local and foreign, have current
maturity, do not earn interests and do not have guarantees.
(c) During the year 2013, CELEPSA realized a financing transaction of finance leaseback and
obtained a higher value of the assets recorded as a result of a valuation of the assets, this
increased value caused the recognized of a liability in the caption "Other accounts payable" by
S/.19,489,000 as of December 31, 2014 (S/.23,016.000 as of December 31, 2013), which will
be amortized to income in the period of the finance leaseback agreement.
16. Deferred income
As of December 31, 2014 and 2013, correspond mainly to cement, clinker and concrete sales invoiced
and not shipped and will be performed in the first quarter of year, as well as the advances billed to
supply ready-mix concrete amounting to approximately S/.62,733,000 and S/.44,495,000,
respectively.
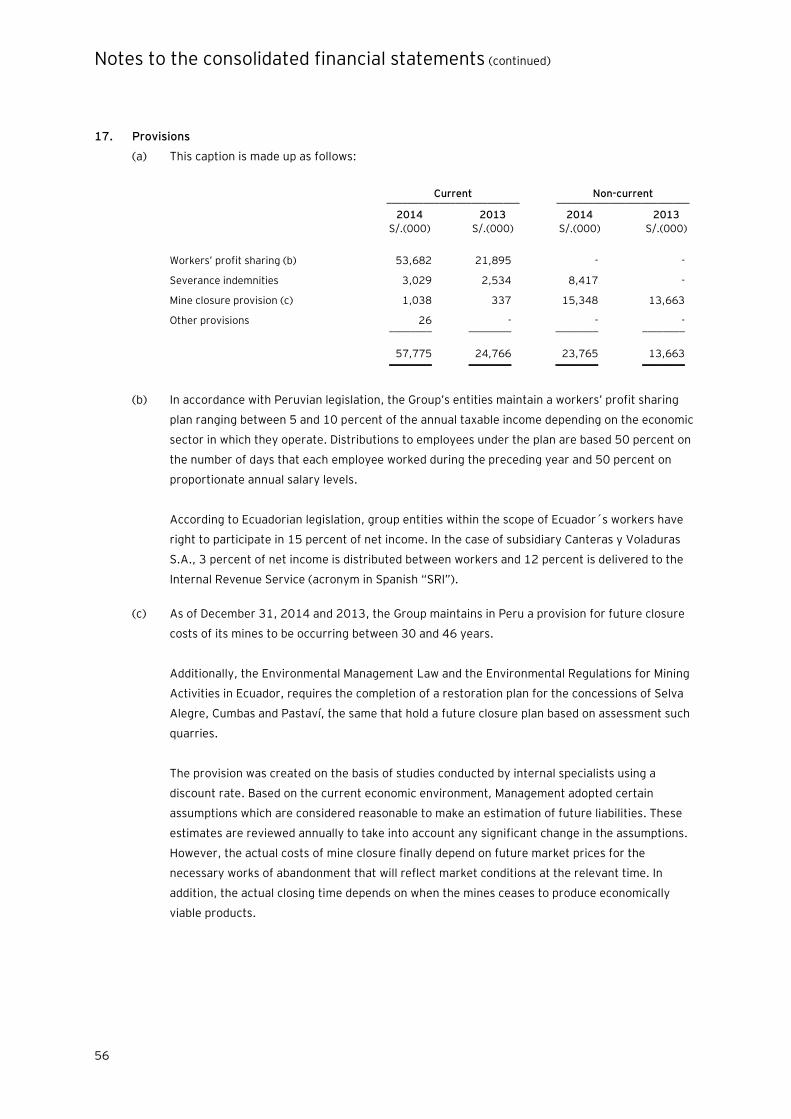
Notes to the consolidated financial statements (continued)
56
17. Provisions
(a) This caption is made up as follows:
Current Non-current _________________________ _________________________
2014 2013 2014 2013
S/.(000) S/.(000) S/.(000) S/.(000)
Workers’ profit sharing (b) 53,682 21,895 - -
Severance indemnities 3,029 2,534 8,417 -
Mine closure provision (c) 1,038 337 15,348 13,663
Other provisions 26 - - - - ________ ________ ________ ________
57,775 24,766 23,765 13,663 ________ ________ ________ ________
(b) In accordance with Peruvian legislation, the Group’s entities maintain a workers’ profit sharing
plan ranging between 5 and 10 percent of the annual taxable income depending on the economic
sector in which they operate. Distributions to employees under the plan are based 50 percent on
the number of days that each employee worked during the preceding year and 50 percent on
proportionate annual salary levels.
According to Ecuadorian legislation, group entities within the scope of Ecuador´s workers have
right to participate in 15 percent of net income. In the case of subsidiary Canteras y Voladuras
S.A., 3 percent of net income is distributed between workers and 12 percent is delivered to the
Internal Revenue Service (acronym in Spanish “SRI”).
(c) As of December 31, 2014 and 2013, the Group maintains in Peru a provision for future closure
costs of its mines to be occurring between 30 and 46 years.
Additionally, the Environmental Management Law and the Environmental Regulations for Mining
Activities in Ecuador, requires the completion of a restoration plan for the concessions of Selva
Alegre, Cumbas and Pastaví, the same that hold a future closure plan based on assessment such
quarries.
The provision was created on the basis of studies conducted by internal specialists using a
discount rate. Based on the current economic environment, Management adopted certain
assumptions which are considered reasonable to make an estimation of future liabilities. These
estimates are reviewed annually to take into account any significant change in the assumptions.
However, the actual costs of mine closure finally depend on future market prices for the
necessary works of abandonment that will reflect market conditions at the relevant time. In
addition, the actual closing time depends on when the mines ceases to produce economically
viable products.
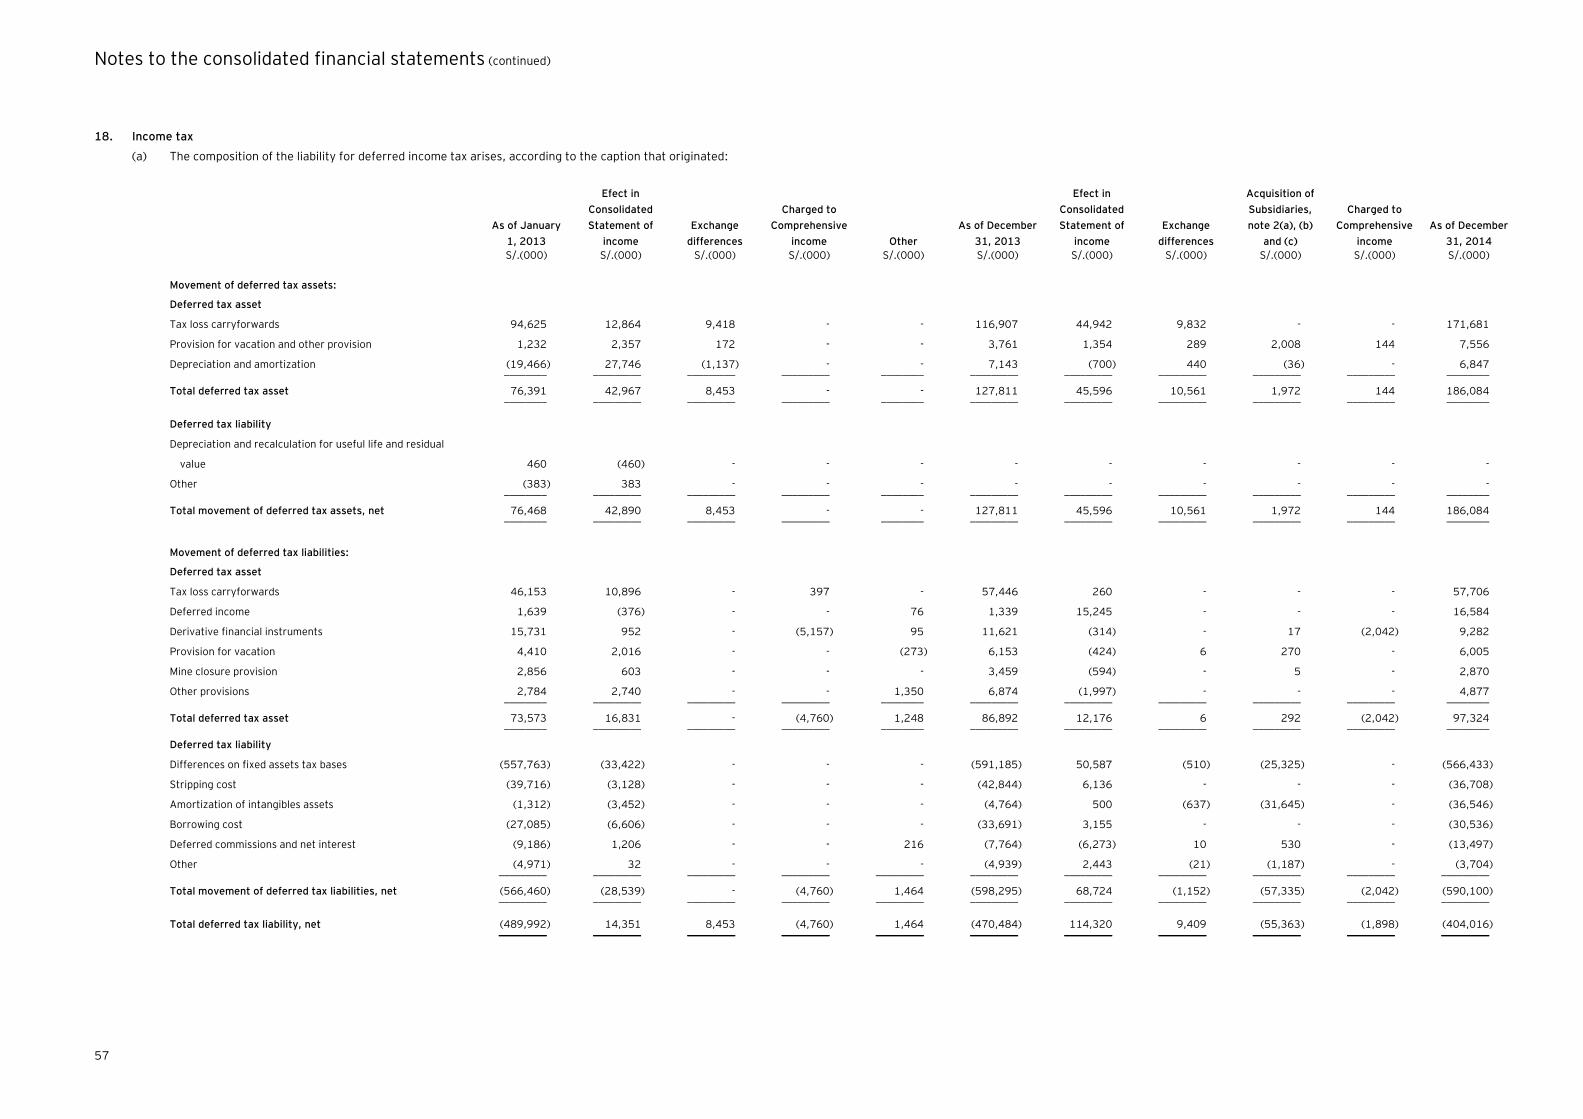
Notes to the consolidated financial statements (continued)
57
18. Income tax
(a) The composition of the liability for deferred income tax arises, according to the caption that originated:
As of January
1, 2013
Efect in
Consolidated
Statement of
income
Exchange
differences
Charged to
Comprehensive
income Other
As of December
31, 2013
Efect in
Consolidated
Statement of
income
Exchange
differences
Acquisition of
Subsidiaries,
note 2(a), (b)
and (c)
Charged to
Comprehensive
income
As of December
31, 2014
S/.(000) S/.(000) S/.(000) S/.(000) S/.(000) S/.(000) S/.(000) S/.(000) S/.(000) S/.(000) S/.(000)
Movement of deferred tax assets:
Deferred tax asset
Tax loss carryforwards 94,625 12,864 9,418 - - 116,907 44,942 9,832 - - 171,681
Provision for vacation and other provision 1,232 2,357 172 - - 3,761 1,354 289 2,008 144 7,556
Depreciation and amortization (19,466) 27,746 (1,137) - - 7,143 (700) 440 (36) - 6,847 ________ _________ _________ _________ ________ _________ _________ _________ _________ _________ ________
Total deferred tax asset 76,391 42,967 8,453 - - 127,811 45,596 10,561 1,972 144 186,084 ________ _________ _________ _________ ________ _________ _________ _________ _________ _________ ________
Deferred tax liability
Depreciation and recalculation for useful life and residual
value 460 (460) - - - - - - - - -
Other (383) 383 - - - - - - - - - ________ _________ _________ _________ ________ _________ _________ _________ _________ _________ ________
Total movement of deferred tax assets, net 76,468 42,890 8,453 - - 127,811 45,596 10,561 1,972 144 186,084 ________ _________ _________ _________ ________ _________ _________ _________ _________ _________ ________
Movement of deferred tax liabilities:
Deferred tax asset
Tax loss carryforwards 46,153 10,896 - 397 - 57,446 260 - - - 57,706
Deferred income 1,639 (376) - - 76 1,339 15,245 - - - 16,584
Derivative financial instruments 15,731 952 - (5,157) 95 11,621 (314) - 17 (2,042) 9,282
Provision for vacation 4,410 2,016 - - (273) 6,153 (424) 6 270 - 6,005
Mine closure provision 2,856 603 - - - 3,459 (594) - 5 - 2,870
Other provisions 2,784 2,740 - - 1,350 6,874 (1,997) - - - 4,877 ________ _________ _________ _________ ________ _________ _________ _________ _________ _________ ________
Total deferred tax asset 73,573 16,831 - (4,760) 1,248 86,892 12,176 6 292 (2,042) 97,324 ________ _________ _________ _________ ________ _________ _________ _________ _________ _________ ________
Deferred tax liability
Differences on fixed assets tax bases (557,763) (33,422) - - - (591,185) 50,587 (510) (25,325) - (566,433)
Stripping cost (39,716) (3,128) - - - (42,844) 6,136 - - - (36,708)
Amortization of intangibles assets (1,312) (3,452) - - - (4,764) 500 (637) (31,645) - (36,546)
Borrowing cost (27,085) (6,606) - - - (33,691) 3,155 - - - (30,536)
Deferred commissions and net interest (9,186) 1,206 - - 216 (7,764) (6,273) 10 530 - (13,497)
Other (4,971) 32 - - - (4,939) 2,443 (21) (1,187) - (3,704) _________ _________ _________ _________ _________ _________ _________ _________ _________ _________ _________
Total movement of deferred tax liabilities, net (566,460) (28,539) - (4,760) 1,464 (598,295) 68,724 (1,152) (57,335) (2,042) (590,100) _________ _________ _________ _________ _________ _________ _________ _________ _________ _________ _________
Total deferred tax liability, net (489,992) 14,351 8,453 (4,760) 1,464 (470,484) 114,320 9,409 (55,363) (1,898) (404,016) _________ _________ _________ _________ _________ _________ _________ _________ _________ _________ _________
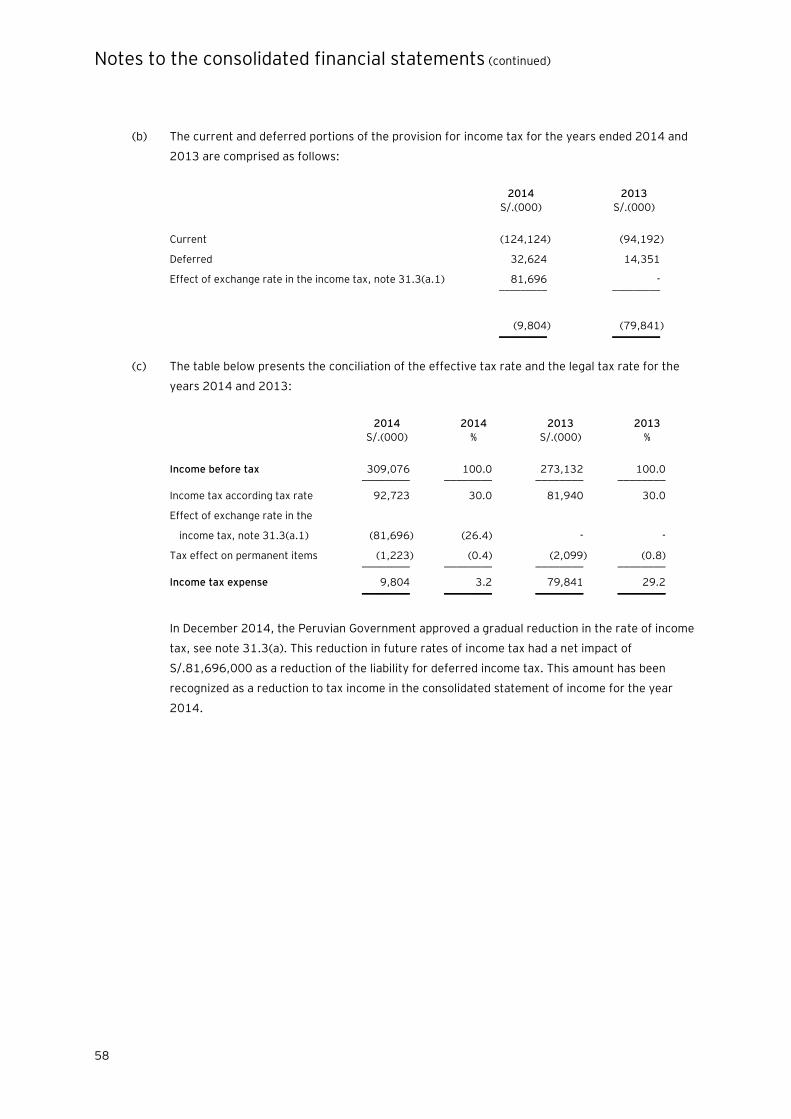
Notes to the consolidated financial statements (continued)
58
(b) The current and deferred portions of the provision for income tax for the years ended 2014 and
2013 are comprised as follows:
2014 2013
S/.(000) S/.(000)
Current (124,124) (94,192)
Deferred 32,624 14,351
Effect of exchange rate in the income tax, note 31.3(a.1) 81,696 - _________ _________
(9,804) (79,841) _________ _________
(c) The table below presents the conciliation of the effective tax rate and the legal tax rate for the
years 2014 and 2013:
2014 2014 2013 2013
S/.(000) % S/.(000) %
Income before tax 309,076 100.0 273,132 100.0 ________ ________ ________ ________
Income tax according tax rate 92,723 30.0 81,940 30.0
Effect of exchange rate in the
income tax, note 31.3(a.1) (81,696) (26.4) - -
Tax effect on permanent items (1,223) (0.4) (2,099) (0.8) ________ ________ ________ ________
Income tax expense 9,804 3.2 79,841 29.2 ________ ________ ________ ________
In December 2014, the Peruvian Government approved a gradual reduction in the rate of income
tax, see note 31.3(a). This reduction in future rates of income tax had a net impact of
S/.81,696,000 as a reduction of the liability for deferred income tax. This amount has been
recognized as a reduction to tax income in the consolidated statement of income for the year
2014.

Notes to the consolidated financial statements (continued)
59
19. Non-controlling interests
Non-controlling interests are included in the consolidated statement of financial position, consolidated statement of changes in equity and consolidated statement of income according to the table presented
below:
Percentage of participation of third
Income (loss) of the Company Equity of the Company
Participation of non-controlling interests in the income of the
Company Non-controlling interests in
equity of the Company
_____________________________ _____________________________ _____________________________ _____________________________ _____________________________
Company 2014 2013 2014 2013 2014 2013 2014 2013 2014 2013
% % S/.(000) S/.(000) S/.(000) S/.(000) S/.(000) S/.(000) S/.(000) S/.(000)
Skanon Investments Inc. and Subsidiaries 4.64 4.94 (72,270) (62,537) 945,362 889,139 (11,542) (7,184) 78,568 80,547
Compañía Eléctrica El Platanal S.A. and Subsidiaries 10.00 10.00 17,614 1,812 671,091 649,314 1,827 181 67,476 64,951
Inversiones en Concreto y Afines S.A. and Subsidiaries 6.62 6.62 68,244 44,298 405,279 344,837 5,731 3,754 29,598 25,019
Prefabricados Andinos Perú S.A.C. and Subsidiaries 49.98 50.00 1,488 3,374 35,636 34,381 744 1,687 17,811 17,190
Prefabricados Andinos S.A. 49.00 - 3,486 - 33,926 - 1,708 - 16,623 -
Inversiones Imbabura S.A. and Subsidiaries - - 10,670 - 1,540,789 - 119 - 5,674 -
Other
(1) (441) 4 360
_______ _______ ________ ________
(1,414) (2,003) 215,754 188,067
_______ _______ ________ ________
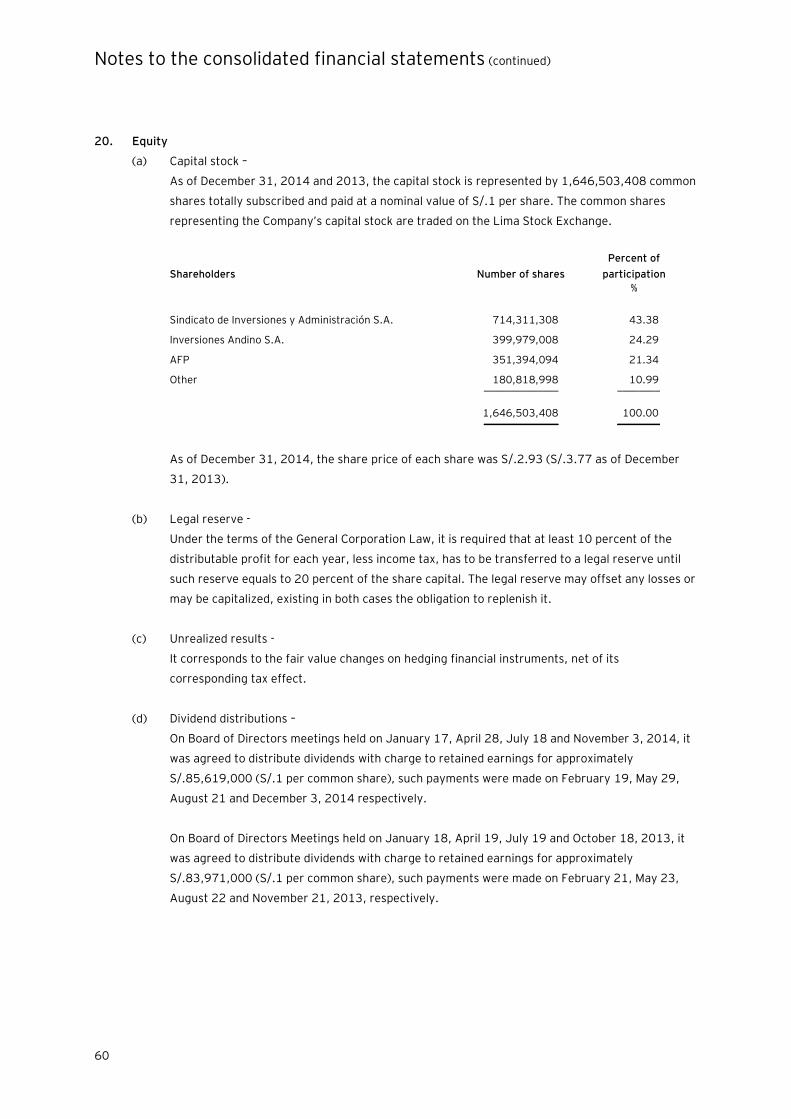
Notes to the consolidated financial statements (continued)
60
20. Equity
(a) Capital stock –
As of December 31, 2014 and 2013, the capital stock is represented by 1,646,503,408 common
shares totally subscribed and paid at a nominal value of S/.1 per share. The common shares
representing the Company’s capital stock are traded on the Lima Stock Exchange.
Shareholders Number of shares
Percent of
participation
%
Sindicato de Inversiones y Administración S.A. 714,311,308 43.38
Inversiones Andino S.A. 399,979,008 24.29
AFP 351,394,094 21.34
Other 180,818,998 10.99 ______________ ________
1,646,503,408 100.00 ______________ ________
As of December 31, 2014, the share price of each share was S/.2.93 (S/.3.77 as of December
31, 2013).
(b) Legal reserve -
Under the terms of the General Corporation Law, it is required that at least 10 percent of the
distributable profit for each year, less income tax, has to be transferred to a legal reserve until
such reserve equals to 20 percent of the share capital. The legal reserve may offset any losses or
may be capitalized, existing in both cases the obligation to replenish it.
(c) Unrealized results -
It corresponds to the fair value changes on hedging financial instruments, net of its
corresponding tax effect.
(d) Dividend distributions –
On Board of Directors meetings held on January 17, April 28, July 18 and November 3, 2014, it
was agreed to distribute dividends with charge to retained earnings for approximately
S/.85,619,000 (S/.1 per common share), such payments were made on February 19, May 29,
August 21 and December 3, 2014 respectively.
On Board of Directors Meetings held on January 18, April 19, July 19 and October 18, 2013, it
was agreed to distribute dividends with charge to retained earnings for approximately
S/.83,971,000 (S/.1 per common share), such payments were made on February 21, May 23,
August 22 and November 21, 2013, respectively.
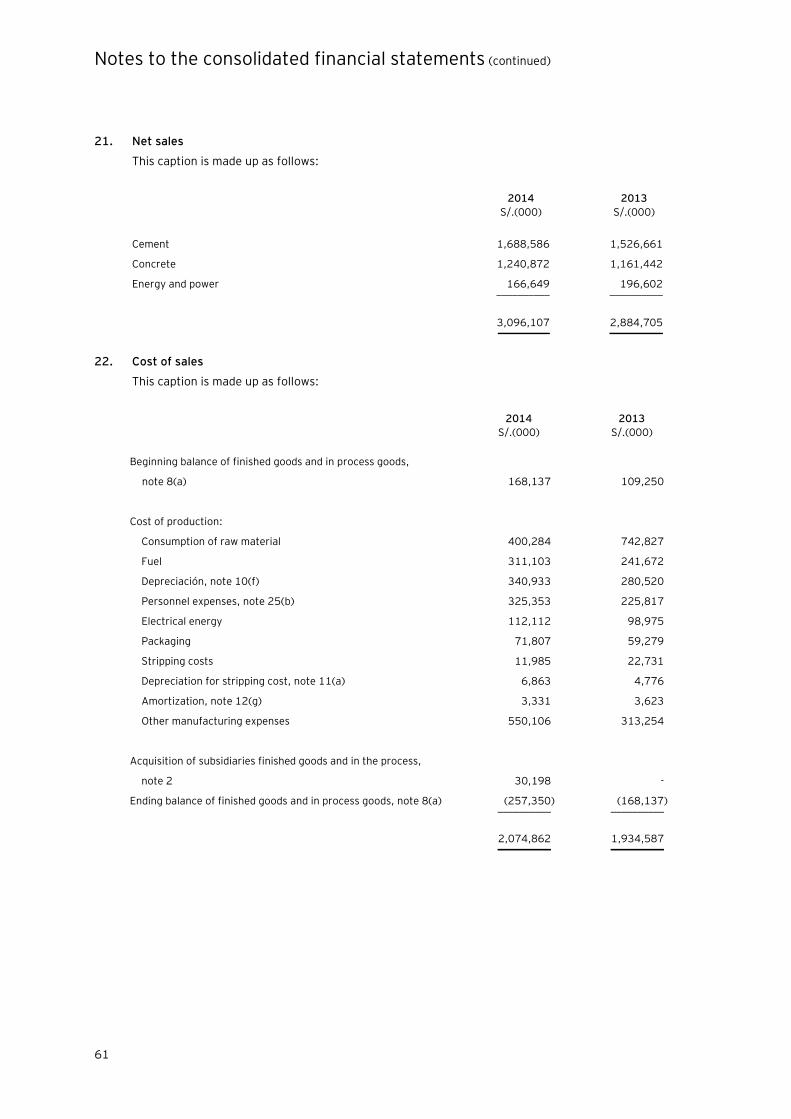
Notes to the consolidated financial statements (continued)
61
21. Net sales
This caption is made up as follows:
2014 2013
S/.(000) S/.(000)
Cement 1,688,586 1,526,661
Concrete 1,240,872 1,161,442
Energy and power 166,649 196,602 __________ __________
3,096,107 2,884,705 ________-_ __________
22. Cost of sales
This caption is made up as follows:
2014 2013
S/.(000) S/.(000)
Beginning balance of finished goods and in process goods,
note 8(a) 168,137 109,250
Cost of production:
Consumption of raw material 400,284 742,827
Fuel 311,103 241,672
Depreciación, note 10(f) 340,933 280,520
Personnel expenses, note 25(b) 325,353 225,817
Electrical energy 112,112 98,975
Packaging 71,807 59,279
Stripping costs 11,985 22,731
Depreciation for stripping cost, note 11(a) 6,863 4,776
Amortization, note 12(g) 3,331 3,623
Other manufacturing expenses 550,106 313,254
Acquisition of subsidiaries finished goods and in the process,
note 2 30,198 -
Ending balance of finished goods and in process goods, note 8(a) (257,350) (168,137) __________ __________
2,074,862 1,934,587 __________ __________
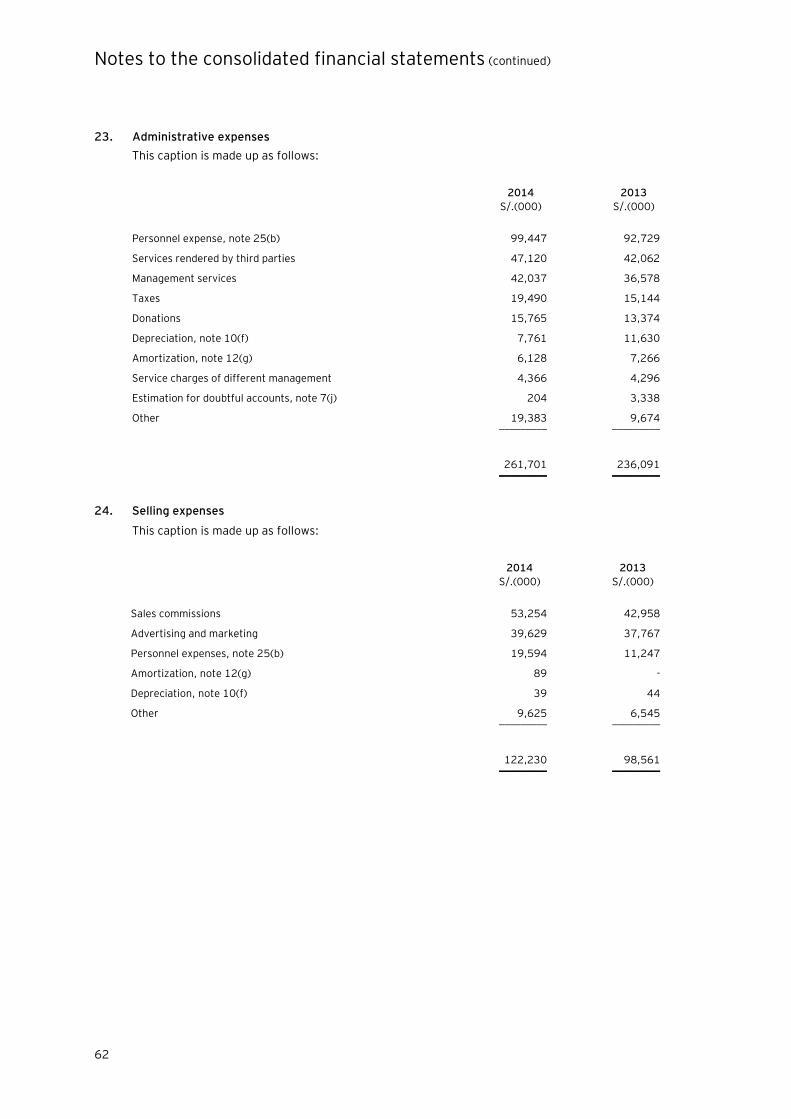
Notes to the consolidated financial statements (continued)
62
23. Administrative expenses
This caption is made up as follows:
2014 2013
S/.(000) S/.(000)
Personnel expense, note 25(b) 99,447 92,729
Services rendered by third parties 47,120 42,062
Management services 42,037 36,578
Taxes 19,490 15,144
Donations 15,765 13,374
Depreciation, note 10(f) 7,761 11,630
Amortization, note 12(g) 6,128 7,266
Service charges of different management 4,366 4,296
Estimation for doubtful accounts, note 7(j) 204 3,338
Other 19,383 9,674 _________ _________
261,701 236,091 _________ _________
24. Selling expenses
This caption is made up as follows:
2014 2013
S/.(000) S/.(000)
Sales commissions 53,254 42,958
Advertising and marketing 39,629 37,767
Personnel expenses, note 25(b) 19,594 11,247
Amortization, note 12(g) 89 -
Depreciation, note 10(f) 39 44
Other 9,625 6,545 _________ _________
122,230 98,561 _________ _________
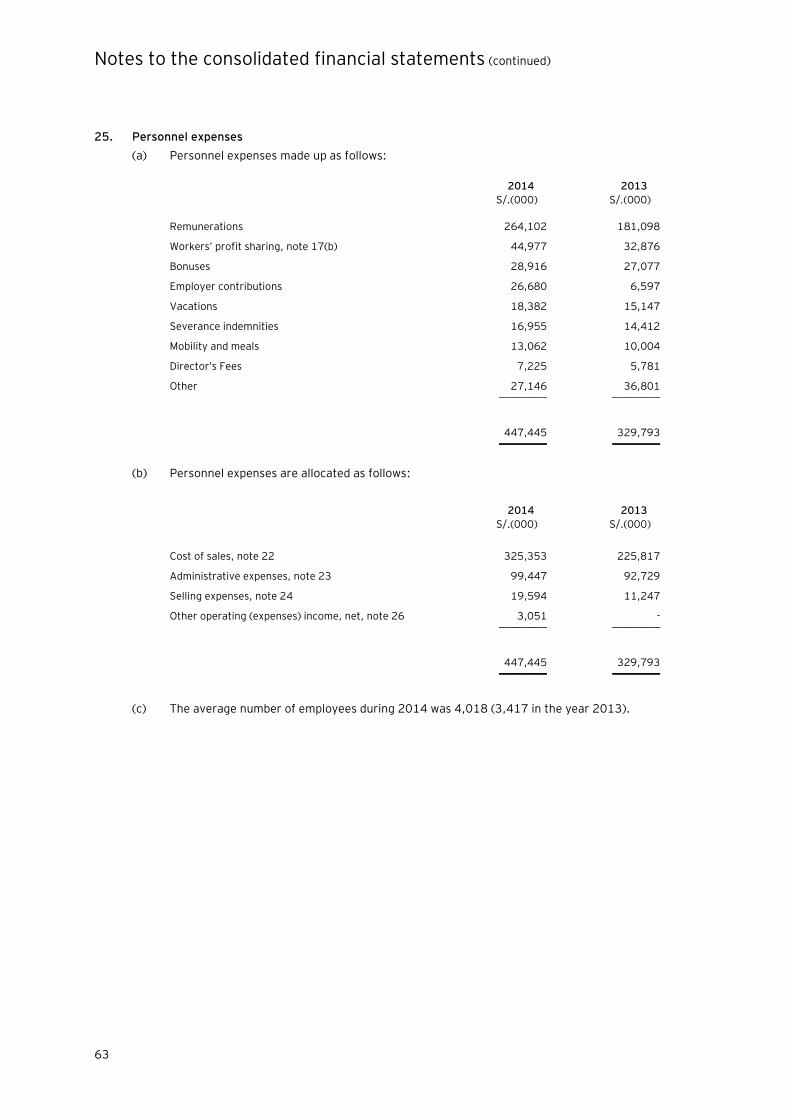
Notes to the consolidated financial statements (continued)
63
25. Personnel expenses
(a) Personnel expenses made up as follows:
2014 2013
S/.(000) S/.(000)
Remunerations 264,102 181,098
Workers’ profit sharing, note 17(b) 44,977 32,876
Bonuses 28,916 27,077
Employer contributions 26,680 6,597
Vacations 18,382 15,147
Severance indemnities 16,955 14,412
Mobility and meals 13,062 10,004
Director’s Fees 7,225 5,781
Other 27,146 36,801 _________ _________
447,445 329,793 _________ _________
(b) Personnel expenses are allocated as follows:
2014 2013
S/.(000) S/.(000)
Cost of sales, note 22 325,353 225,817
Administrative expenses, note 23 99,447 92,729
Selling expenses, note 24 19,594 11,247
Other operating (expenses) income, net, note 26 3,051 - _________ _________
447,445 329,793 _________ _________
(c) The average number of employees during 2014 was 4,018 (3,417 in the year 2013).
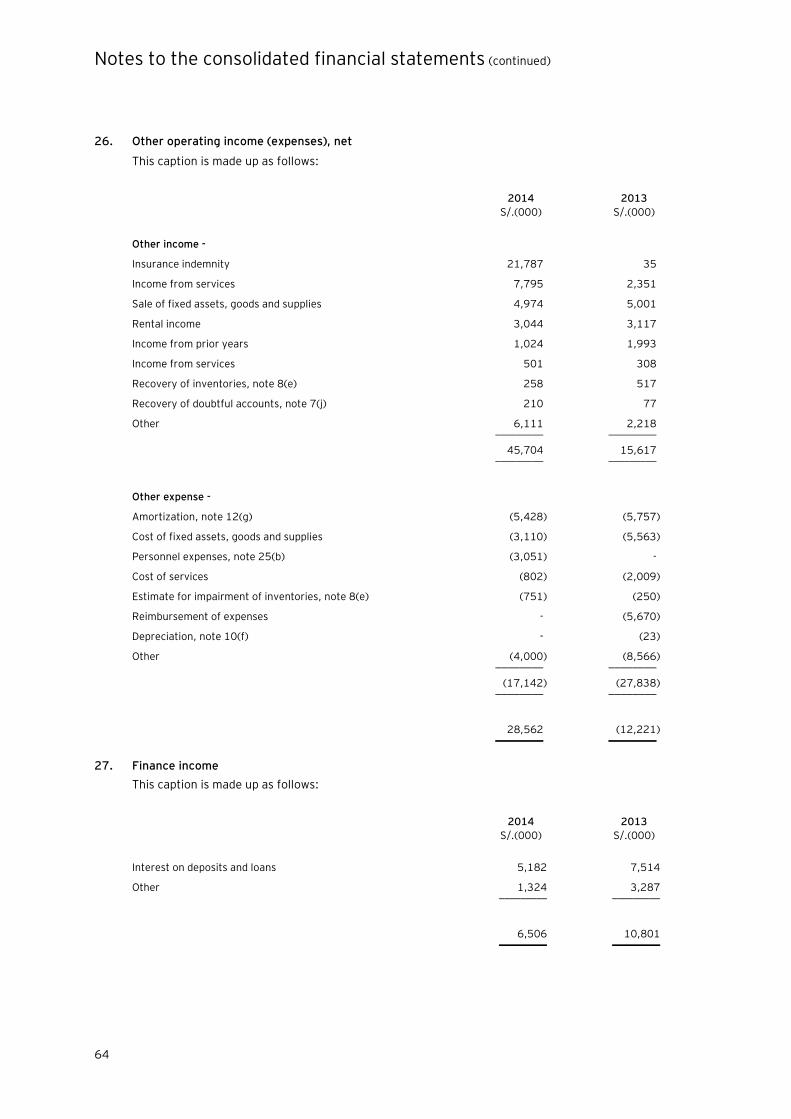
Notes to the consolidated financial statements (continued)
64
26. Other operating income (expenses), net
This caption is made up as follows:
2014 2013
S/.(000) S/.(000)
Other income -
Insurance indemnity 21,787 35
Income from services 7,795 2,351
Sale of fixed assets, goods and supplies 4,974 5,001
Rental income 3,044 3,117
Income from prior years 1,024 1,993
Income from services 501 308
Recovery of inventories, note 8(e) 258 517
Recovery of doubtful accounts, note 7(j) 210 77
Other 6,111 2,218 _________ _________
45,704 15,617 _________ _________
Other expense -
Amortization, note 12(g) (5,428) (5,757)
Cost of fixed assets, goods and supplies (3,110) (5,563)
Personnel expenses, note 25(b) (3,051) -
Cost of services (802) (2,009)
Estimate for impairment of inventories, note 8(e) (751) (250)
Reimbursement of expenses - (5,670)
Depreciation, note 10(f) - (23)
Other (4,000) (8,566) ________ ________
(17,142) (27,838) ________ ________
28,562 (12,221) _________ _________
27. Finance income
This caption is made up as follows:
2014 2013
S/.(000) S/.(000)
Interest on deposits and loans 5,182 7,514
Other 1,324 3,287 _________ _________
6,506 10,801 _________ _________
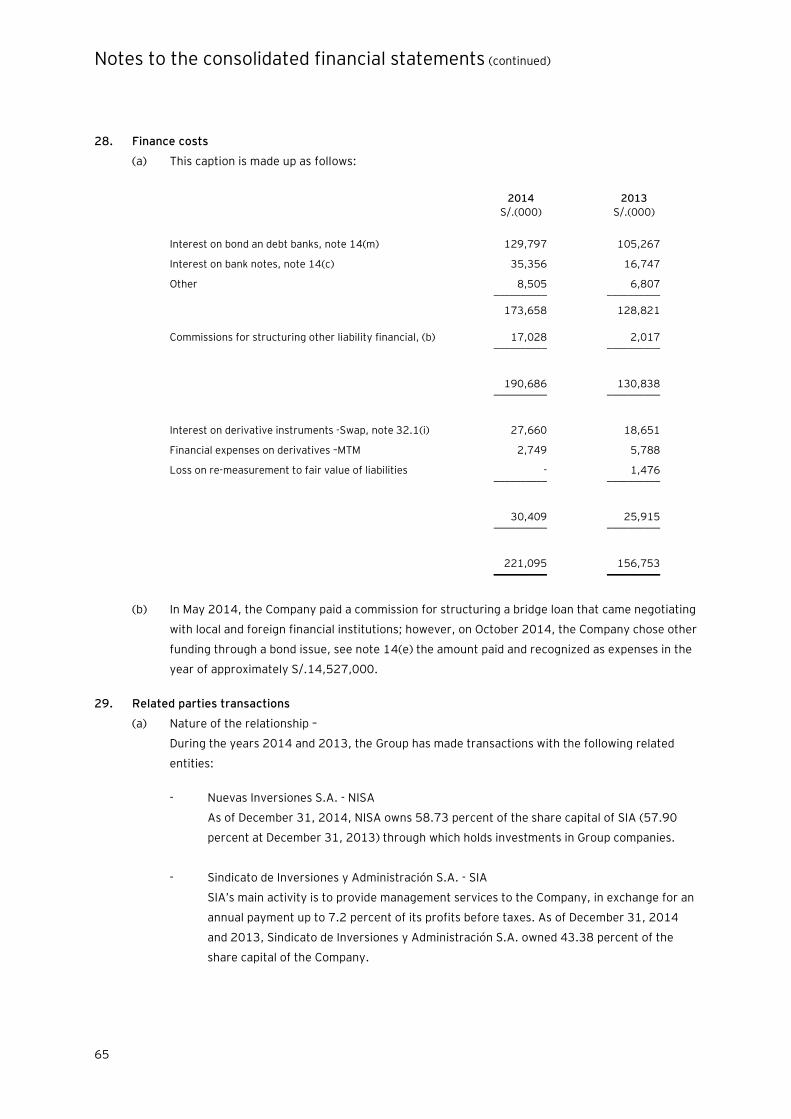
Notes to the consolidated financial statements (continued)
65
28. Finance costs
(a) This caption is made up as follows:
2014 2013
S/.(000) S/.(000)
Interest on bond an debt banks, note 14(m) 129,797 105,267
Interest on bank notes, note 14(c) 35,356 16,747
Other 8,505 6,807 __________ __________
173,658 128,821
Commissions for structuring other liability financial, (b) 17,028 2,017 __________ __________
190,686 130,838 __________ __________
Interest on derivative instruments -Swap, note 32.1(i) 27,660 18,651
Financial expenses on derivatives –MTM 2,749 5,788
Loss on re-measurement to fair value of liabilities - 1,476 __________ __________
30,409 25,915 __________ __________
221,095 156,753 __________ __________
(b) In May 2014, the Company paid a commission for structuring a bridge loan that came negotiating
with local and foreign financial institutions; however, on October 2014, the Company chose other
funding through a bond issue, see note 14(e) the amount paid and recognized as expenses in the
year of approximately S/.14,527,000.
29. Related parties transactions
(a) Nature of the relationship –
During the years 2014 and 2013, the Group has made transactions with the following related
entities:
- Nuevas Inversiones S.A. - NISA
As of December 31, 2014, NISA owns 58.73 percent of the share capital of SIA (57.90
percent at December 31, 2013) through which holds investments in Group companies.
- Sindicato de Inversiones y Administración S.A. - SIA
SIA’s main activity is to provide management services to the Company, in exchange for an
annual payment up to 7.2 percent of its profits before taxes. As of December 31, 2014
and 2013, Sindicato de Inversiones y Administración S.A. owned 43.38 percent of the
share capital of the Company.
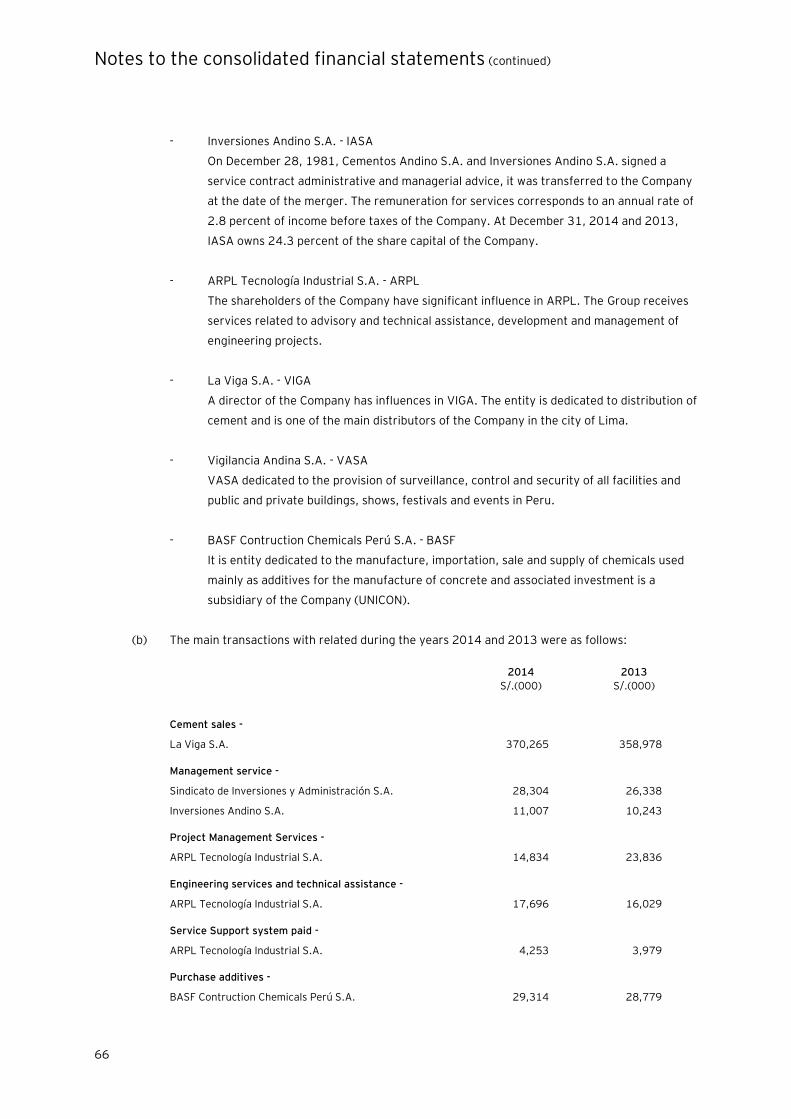
Notes to the consolidated financial statements (continued)
66
- Inversiones Andino S.A. - IASA
On December 28, 1981, Cementos Andino S.A. and Inversiones Andino S.A. signed a
service contract administrative and managerial advice, it was transferred to the Company
at the date of the merger. The remuneration for services corresponds to an annual rate of
2.8 percent of income before taxes of the Company. At December 31, 2014 and 2013,
IASA owns 24.3 percent of the share capital of the Company.
- ARPL Tecnología Industrial S.A. - ARPL
The shareholders of the Company have significant influence in ARPL. The Group receives
services related to advisory and technical assistance, development and management of
engineering projects.
- La Viga S.A. - VIGA
A director of the Company has influences in VIGA. The entity is dedicated to distribution of
cement and is one of the main distributors of the Company in the city of Lima.
- Vigilancia Andina S.A. - VASA
VASA dedicated to the provision of surveillance, control and security of all facilities and
public and private buildings, shows, festivals and events in Peru.
- BASF Contruction Chemicals Perú S.A. - BASF
It is entity dedicated to the manufacture, importation, sale and supply of chemicals used
mainly as additives for the manufacture of concrete and associated investment is a
subsidiary of the Company (UNICON).
(b) The main transactions with related during the years 2014 and 2013 were as follows:
2014 2013
S/.(000) S/.(000)
Cement sales -
La Viga S.A. 370,265 358,978
Management service -
Sindicato de Inversiones y Administración S.A. 28,304 26,338
Inversiones Andino S.A. 11,007 10,243
Project Management Services -
ARPL Tecnología Industrial S.A. 14,834 23,836
Engineering services and technical assistance -
ARPL Tecnología Industrial S.A. 17,696 16,029
Service Support system paid -
ARPL Tecnología Industrial S.A. 4,253 3,979
Purchase additives -
BASF Contruction Chemicals Perú S.A. 29,314 28,779
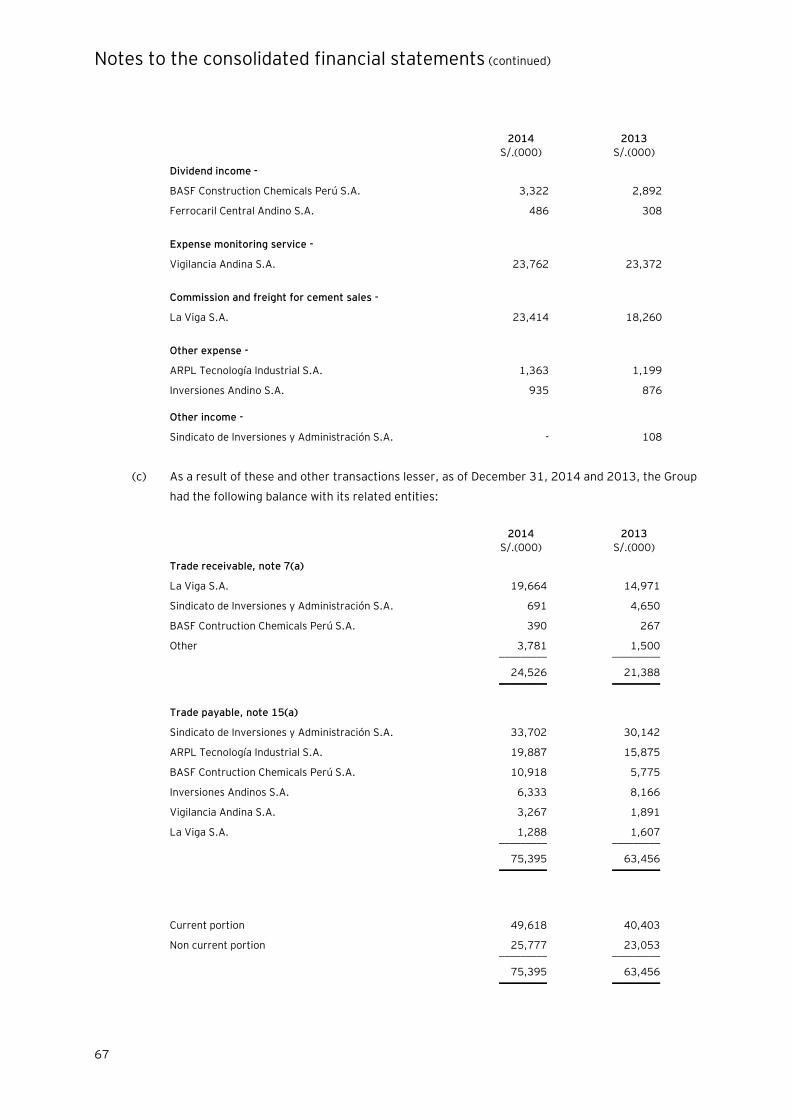
Notes to the consolidated financial statements (continued)
67
2014 2013
S/.(000) S/.(000)
Dividend income -
BASF Construction Chemicals Perú S.A. 3,322 2,892
Ferrocaril Central Andino S.A. 486 308
Expense monitoring service -
Vigilancia Andina S.A. 23,762 23,372
Commission and freight for cement sales -
La Viga S.A. 23,414 18,260
Other expense -
ARPL Tecnología Industrial S.A. 1,363 1,199
Inversiones Andino S.A. 935 876
Other income -
Sindicato de Inversiones y Administración S.A. - 108
(c) As a result of these and other transactions lesser, as of December 31, 2014 and 2013, the Group
had the following balance with its related entities:
2014 2013
S/.(000) S/.(000)
Trade receivable, note 7(a)
La Viga S.A. 19,664 14,971
Sindicato de Inversiones y Administración S.A. 691 4,650
BASF Contruction Chemicals Perú S.A. 390 267
Other 3,781 1,500 _________ _________
24,526 21,388 _________ _________
Trade payable, note 15(a)
Sindicato de Inversiones y Administración S.A. 33,702 30,142
ARPL Tecnología Industrial S.A. 19,887 15,875
BASF Contruction Chemicals Perú S.A. 10,918 5,775
Inversiones Andinos S.A. 6,333 8,166
Vigilancia Andina S.A. 3,267 1,891
La Viga S.A. 1,288 1,607 _________ _________
75,395 63,456 _________ _________
Current portion 49,618 40,403
Non current portion 25,777 23,053 _________ _________
75,395 63,456 _________ _________
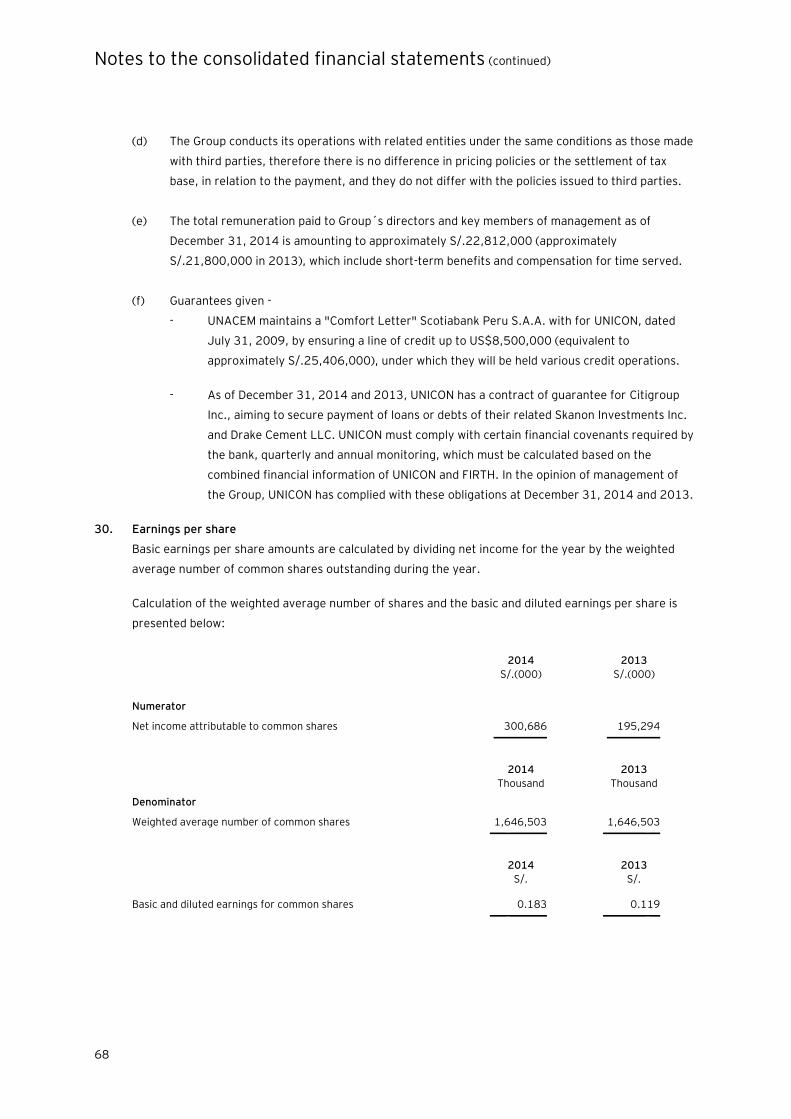
Notes to the consolidated financial statements (continued)
68
(d) The Group conducts its operations with related entities under the same conditions as those made
with third parties, therefore there is no difference in pricing policies or the settlement of tax
base, in relation to the payment, and they do not differ with the policies issued to third parties.
(e) The total remuneration paid to Group´s directors and key members of management as of
December 31, 2014 is amounting to approximately S/.22,812,000 (approximately
S/.21,800,000 in 2013), which include short-term benefits and compensation for time served.
(f) Guarantees given -
- UNACEM maintains a "Comfort Letter" Scotiabank Peru S.A.A. with for UNICON, dated
July 31, 2009, by ensuring a line of credit up to US$8,500,000 (equivalent to
approximately S/.25,406,000), under which they will be held various credit operations.
- As of December 31, 2014 and 2013, UNICON has a contract of guarantee for Citigroup
Inc., aiming to secure payment of loans or debts of their related Skanon Investments Inc.
and Drake Cement LLC. UNICON must comply with certain financial covenants required by
the bank, quarterly and annual monitoring, which must be calculated based on the
combined financial information of UNICON and FIRTH. In the opinion of management of
the Group, UNICON has complied with these obligations at December 31, 2014 and 2013.
30. Earnings per share
Basic earnings per share amounts are calculated by dividing net income for the year by the weighted
average number of common shares outstanding during the year.
Calculation of the weighted average number of shares and the basic and diluted earnings per share is
presented below:
2014 2013
S/.(000) S/.(000)
Numerator
Net income attributable to common shares 300,686 195,294 __________ __________
2014 2013
Thousand Thousand
Denominator
Weighted average number of common shares 1,646,503 1,646,503 ___-_______ ________-__
2014 2013
S/. S/.
Basic and diluted earnings for common shares 0.183 0.119 ___-_______ ________-__
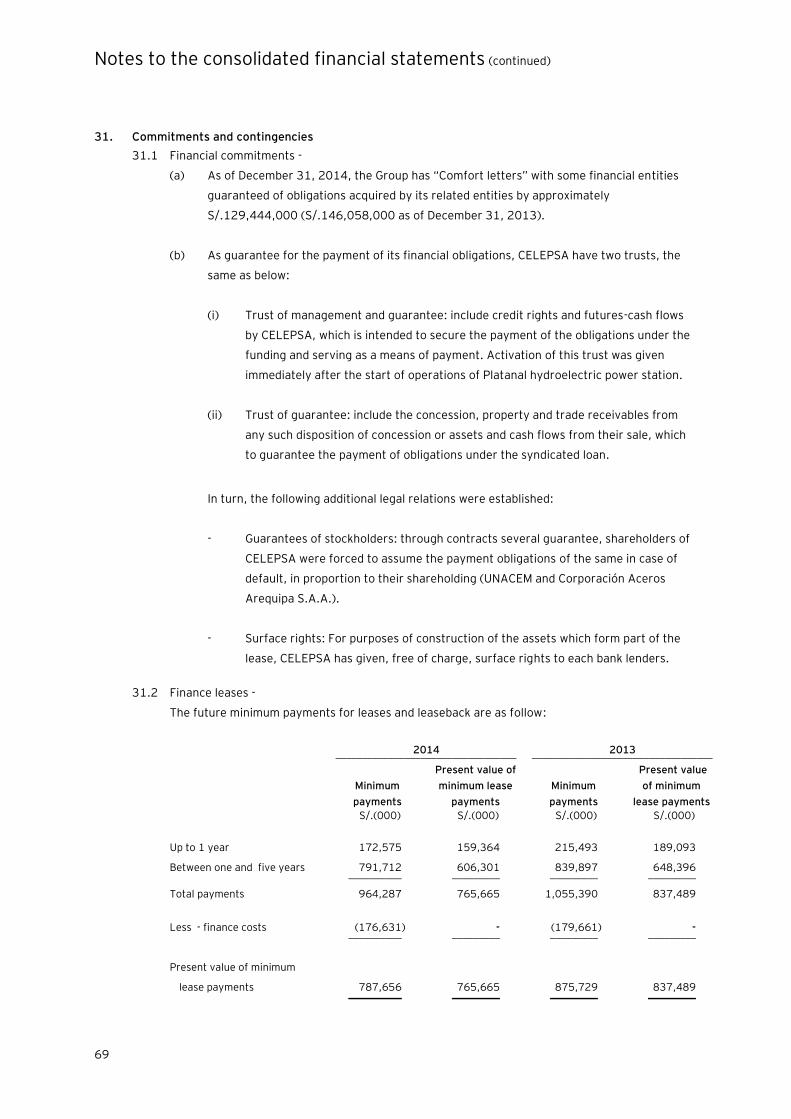
Notes to the consolidated financial statements (continued)
69
31. Commitments and contingencies
31.1 Financial commitments -
(a) As of December 31, 2014, the Group has “Comfort letters” with some financial entities
guaranteed of obligations acquired by its related entities by approximately
S/.129,444,000 (S/.146,058,000 as of December 31, 2013).
(b) As guarantee for the payment of its financial obligations, CELEPSA have two trusts, the
same as below:
(i) Trust of management and guarantee: include credit rights and futures-cash flows
by CELEPSA, which is intended to secure the payment of the obligations under the
funding and serving as a means of payment. Activation of this trust was given
immediately after the start of operations of Platanal hydroelectric power station.
(ii) Trust of guarantee: include the concession, property and trade receivables from
any such disposition of concession or assets and cash flows from their sale, which
to guarantee the payment of obligations under the syndicated loan.
In turn, the following additional legal relations were established:
- Guarantees of stockholders: through contracts several guarantee, shareholders of
CELEPSA were forced to assume the payment obligations of the same in case of
default, in proportion to their shareholding (UNACEM and Corporación Aceros
Arequipa S.A.A.).
- Surface rights: For purposes of construction of the assets which form part of the
lease, CELEPSA has given, free of charge, surface rights to each bank lenders.
31.2 Finance leases -
The future minimum payments for leases and leaseback are as follow:
2014 2013 __________________________________ __________________________________
Minimum
payments
Present value of
minimum lease
payments
Minimum
payments
Present value
of minimum
lease payments
S/.(000) S/.(000) S/.(000) S/.(000)
Up to 1 year 172,575 159,364 215,493 189,093
Between one and five years 791,712 606,301 839,897 648,396 __________ _________ _________ _________
Total payments 964,287 765,665 1,055,390 837,489
Less - finance costs (176,631) - (179,661) - __________ _________ _________ _________
Present value of minimum
lease payments 787,656 765,665 875,729 837,489 __________ _________ _________ _________
Notes to the consolidated financial statements (continued)
70
31.3 Tax situation -
(a) The entities comprising the Group are subject to taxation in the country in which they
operate and taxed separately on the basis of its non-consolidated results.
(a.1) As of December 31, 2013 and 2014, the rate of income tax in Peru is 30 percent
on taxable income after deducting the participation of workers.
From the fiscal year 2015, according to law No.30296, "Law that promotes
Economic Reactivation", the income tax rate applicable to taxable income, after
deducting the workers participation will be as follows:
- Fiscal year 2015 and 2016: 28 per cent.
- Fiscal year 2017 and 2018: 27 per cent.
- As of Fiscal year 2019: 26 per cent.
Legal persons not domiciled in Peru and individuals are subject to retention of an
additional tax on dividends received.
In this regard, considering Law No.30296, the additional tax on dividend generated
by profits is as follows:
- 4.1 per cent by profits generated until December 31, 2014.
- By the profits generated from 2015, whose distribution is made from that
date and will be the following:
- 2015 and 2016: 6.8 per cent.
- 2017 and 2018: 8 per cent.
- As of 2019 : 9.3 per cent.
(a.2) The entities domiciled in the United States America have not determined income
tax due to tax loss carryforwards, see next paragraph(c), the applicable tax rate of
41.7 percent.
(a.3) For the entities domiciled in Ecuador, the rate for income tax is calculated 22
percent on profits subject to distribution. However, the rate could be increased to
25 percent on taxable income corresponding to the direct or indirect participate of
partners, shareholders, beneficiaries or similar, who are resident in tax havens or
with lower tax regimes.
(a.4) For entities domiciled in Chile, the rate of income tax applicable to 2014 is 21
percent.
Notes to the consolidated financial statements (continued)
71
In September 2014, the Tax Reform Law N° 20.780, which introduces several
changes to the current tax system in Chile, considered a progressive increase in the
rate of income tax first class for commercial years 2014, 2015, 2016 , 2017 and
2018 onwards, changing the tax rate of 20 percent to 21 percent, 22.5 percent,
24 percent, 25.5 percent and 27 percent, respectively, in the event that is applied
the System Partially Integrated or, for commercial years 2014, 2015, 2016 and
2017 onwards, increasing the tax rate to a 21 percent, 22.5 percent, 24 percent
and 25 percent, respectively, in case you opt for System Application Income
Attributed.
(b) The Tax Authority in each country has the right to review and if necessary, adjust the
corresponding income tax calculated by the Company and its subsidiaries in the four years
after the filing of the tax return. The affidavits of income tax are open to inspection by the
Tax Authority as follows:
Periods open to review
Peru -
Unión Andina de Cementos S.A.A. 2010-2014
Compañía Eléctrica el Platanal S.A.
2006-2009 and 2011-
2014
Generación Eléctrica Atocongo S.A. 2010 and 2012-2014
Unión de Concreteras S.A. 2010 and 2012-2014
Firth Industries Perú S.A. 2012-2014
Inversiones en Concreto y Afines S.A. 2010-2014
Prefabricados Andinos Perú S.A.C. 2010 and 2012-2014
Transportes Lurin S.A. 2010-2014
Depósito Aduanero Conchán S.A. 2010 and 2012-2014
Ecuador -
UNACEM Ecuador S.A. 2010 -2014
United States of America 2010-2014
Due to the interpretations likely to be given by the Tax Authority on current legal
regulations, it is not possible to determine, as of this date, whether the reviews to be
conducted will result in liabilities for the Company and subsidiaries; therefore, any
increased tax or surcharge that could arise from possible tax reviews will be applied to the
results of the year in which it is determined. In the Management’s and its legal advisors’
opinion, any additional tax settlement would not be significant for the consolidated
financial statements as of December 31, 2014 and 2013.
As of December 31, 2014, the Group recorded a provision for income taxes of
S/.124,124,000 and credits related to payments in advance of S/.152,750,000
(S/.94,192,000 and S/.163,421,000, respectively as of December 31, 2013). This

Notes to the consolidated financial statements (continued)
72
balance amounting to S/.28,626,000 and other tax credits S/.4,243,000, are presented
in "Trade receivable and others" of the consolidated statement of financial position, note
7(h).
(c) As of December 31, 2014 and 2013, the tax loss carryforwards determined by the
subsidiaries in Peru amounted approximately to S/.221,785,000 and S/.191,409,000,
respectively. The managers of each subsidiary with tax loss carryforwards have therefore
chosen the option to offset the tax loss up to 50 percent of the taxable income generated
each year, indefinitely, as well as the option to offset the tax loss in the four years starting
from the date of his generation. The amount of the tax loss carryforwards is subject to the
outcome of the reviews referred to in the preceding paragraph.
Also, the tax loss carryforwards of subsidiaries in the United States of America were
approximately S/.813,119,000 and S/.568,652,000, respectively, and will be offset
against future profits of the subsidiaries in accordance with state and federal tax
requirements related.
The tax loss carryforwards of the subsidiary in Chile as of December 31, 2014 amounted
to approximately S/.8,883,000, and will be offset against future profits of the subsidiary
in accordance with the tax requirements of the country.
31.4 Contingencies –
In the normal course of business, the Company and subsidiaries have received some complaints
of such tax, legal (labor and management) and regulatory matters, which are recorded and
disclosed in accordance with International Financial Reporting Standards as set out in note
3.3(q).
The Group´s legal advisers consider that it is only possible, not probable tax, legal and regulatory
matters. In accordance with the foregoing and in Group’s Management opinion no provision was
recorded in the consolidated financial statements as of December 31, 2014 and 2013.
Peru -
As a result of audits for the years 2002 to 2006, the Company has been notified by the Tax
Authority (SUNAT) with different resolutions for alleged omissions in income tax. In some cases,
the Company has filed appeals for not finding the appropriate resolutions in accordance with the
laws in force in Peru and in other cases it has proceeded to pay the assessments received. As of
December 31, 2014 and 2013, the Company has recorded the necessary provisions, leaving as
possible contingency amounting to approximately S/.60,277,000 plus interest and costs on both
dates.
Likewise, as of December 31, 2014, the Company holds claims to Tax Authority (SUNAT),
corresponding to demands and requirements of refund of income tax paid in excess for the years
2004, 2005, 2006 and 2009, in such demands it is requested the decisions of annulment of the
Tax Court set aside and will devolution of the money paid for the amount of approximately
S/.32,089,000 (approximately S/.17,900,000 as of December 31, 2013).
Notes to the consolidated financial statements (continued)
73
The Group´s management and its legal advisors estimate that there are legal arguments to
obtain a favorable outcome in these processes, in which case they will not have a significant
impact on the consolidated financial statements of the Group.
Furthermore, through Resolution N° 004-2010/ST-CLC-INDECOPI of March 25, 2010, the
Technical Secretary of the Committee for the Defense of Free Competition declared admissible
the complaint by the Ferretería Malva S.A., against to the Company and others related to
commission of anticompetitive behavior, and initiate an infringement procedure against the
complained companies. In 2013, through Resolution N° 010-2013/CLC, the Committee for the
Defense of Free Competition sanctions to the Company at the end of the unjustified refusal sales,
imposing a penalty of 1,488.20 UIT and absolves the offense relating to boycott. Given the
resolution of the Commission, the Company filed an appeal to the Court of Competition, at the
end of the penalty for the alleged refusal of unjustified sales, which confirmed the decision
appealed, whereupon the Company has decided to bring contentious administrative proceedings
before the Judiciary, for the annulment of the decision of INDECOPI is declared. The Company
expects to obtain a favorable ruling in court.
Ecuador –
(a) Acts of determination income tax and advances of income tax -
As of December 31, 2014, there are judgments presented by UNACEM Ecuador S.A.
(formerly Lafarge Cement S.A.) against the SRI by the objection of the Acts of tax
determination of income tax for the tax years 2005 to 2009 by approximately
US$5,208,000. In the opinion of Group´s Management and its legal advisors are possible
contingencies and provision is not necessary.
(b) Report of the General Controller State -
At the end of September 2013, the General Controller State issued and adopted a report
on the situation of compliance with environmental regulations by UNACEM Ecuador SA
(formerly Lafarge Cement SA) and Canteras y Voladuras S.A. - CANTYVOL, and the role of
certain authorities of the Ministry of Environment of Ecuador, Ministry of Health, Agency
of Mining Regulation and Control Ministry of Nonrenewable Resources, among others. This
report was submitted by the State Comptroller General to the Prosecution, which began a
research process. On February 13, 2015, the Judge of Otavalo solved the final closing of
the investigation requested by the Prosecutor's Office to Otavalo.
(c) Interpretative Law Act Employees Retirement Cement Industry -
This Law searches an interpretation of Art. 4 of the Law on Retirement of workers in the
cement industry, to establish the currency should be performed the calculation of
pensions in the Law is indicated. In the opinion of its legal counsel a possible contingency
between US$500,000 and US$1,500,000 is estimated.

Notes to the consolidated financial statements (continued)
74
(d) Compensation -
In the year 2012, a claim was presented against Canteras y Voladuras S.A. - CANTYVOL
for alleged moral damage, which the claimants required the payment of compensation by
US$2,000,000. In the year 2013, this claim was known primarily by the Judge of the Civil
and Commercial Unit Imbabura, which in its judgment rejected the claim for considering
that the petition lacked support. The claimants presented an appeal to the National Court
of Justice, which so far has not been admitted. In the opinion the Group´s Management
and its legal advisors are possible contingencies and provision is not necessary.
31.5 Mining royalties –
Peru -
On November 20, 2013, Peru’s Constitutional Court, in a final and unappeasable decision stated
that the new regulation of the Royalty Mining Law in the year 2011, violates the constitutional
right of property, as well as, the principles of legal reservation and proportionality, consequently,
this modification is rendered inapplicable to the Company. Accordingly, the Company will
continue using as basis for the calculation of the mining royalty the value of the concentrate or
mining component and not the value of the product obtained by the industrial and manufacturing
process.
Mining royalty expense paid to the Peruvian Government for the years 2014 and 2013 amounted
to S/.3,451,000 and S/.2,853,000, respectively, and were recorded in the consolidated
statement of income, note 3.3(k).
Ecuador -
Mining royalty expense paid by UNACEM Ecuador to the Ecuadorian Government for the years
2014 US$621,000 (equivalent to S/.1,856,000), and were recorded in the consolidated
statement of income, note 3.3(k).
31.6 Environmental commitments -
The Group’s activities are subject to environmental protection standards and have to meet the
following regulations:
(a) Industrial activities -
Peru -
Law N° 28271 regulates environmental liabilities generated by mining activities, and
seeking to regulate the identification of environmental liabilities of mining and funding for
remediation of affected areas. Under said law, an environmental liability corresponding to
the impact caused to the environment by mining operations abandoned or inactive.
In accordance with the above mentioned law, the Company filed the Environmental Impact
Assessments (EIA by its acronym in Spanish), the Environmental Impact Statement (EIS)
and the Environmental Adaptation Programs (PAMA by its acronym in Spanish) for its
operating units.
Notes to the consolidated financial statements (continued)
75
Currently, the Company has an EIA for the modernization of its industrial plant facility
approved by the Ministry of Production in May 2011, and has been executing
environmental protection activities with an accumulated investment as of December 31,
2014 of US$54,433,578 (US$53,725,000 as of December 31, 2013) for implementation
of the environmental management plan in the cement manufacturing process.
Furthermore, UNICON has invested in the implementation of environmental protection
programs approximately S/.450,000 and S/.500,000 in the years 2014 and 2013,
respectively.
(b) Mining and port activities –
Peru -
In relation to its mining and port activities, the Company in the environmental impact
studies (EIA by its acronym in Spanish), which are in compliance with the terms and
amounts determined in such studies, and the accumulated investment in mining and port
activities as of December 31, 2014 amounts to approximately US$19,301,000
(approximately US$17,603,000 as of December 31, 2013).
On October 14, 2003, the Congress of the Republic of Peru issued Law N° 28090,
regulating mine closures. This law standardizes the obligations and procedures that
companies must comply with respect to statements of the mining activity to preparing,
submit ting implementing a Mine Closure Plan, as well as the environmental guarantees
that ensure the compliance of the investments subject to the principles of environment
protection, preservation and restoration of the environment. The Company has submitted
the closure plans of its mining units to the Ministry of Production and the Ministry of
Energy and Mines within the statutory terms. The Closure Plans Studies have established
the guaranties and investments to be made in the future, when the incremental and final
closures of the mining activities in each unit of production are made. The provision for
mine closure corresponds to the activities that must be performed for restoring the areas
affected by the exploitation activities. The main works are related to earth movements
and reforesting.
Ecuador -
In Ecuador, the subsidiaries are required to the implementation of the Environmental
Management Law and the Environmental Regulations for Mining Activities.
As of December 31, 2014 and 2013, the Group’s provision for mine closure amounts to
approximately S/.16,386,000 and S/.14,000,000, respectively and it is included in the
caption “Provisions” in the consolidated statement of financial position, see note 17(a).
The Group believes that this liability is sufficient to meet environmental protection laws in
force approved.

Notes to the consolidated financial statements (continued)
76
(c) Use of hydrocarbons –
Peru -
Supreme Decree N° 046-93-EM for the Regulation of Hydrocarbon Activities enacted on
November 12, 1993. It regulates the activities performed by the Company related to the
use of hydrocarbons as final user. In compliance with this regulation, the Company has a
PAMA that was approved by the Ministry of Energy and Mines in 1996. As of December
31, 2014, the Group has made an accumulated investment of approximately US$104,273
(US$98,000 as of December 31, 2013) in said PAMA.
(d) Special projects –
As of December 31, 2014, the main projects is implementing the Group relate to
construction of the hydroelectric Carpapata III, Mill VIII and packaging V in Condorcocha
Plant and the second phase of the expansion of the productive capacity of the kiln 1
Atocongo Plant of the Company.
During the year 2014, the main projects completed the Group correspond to Multisilo of
20 thousand tonnes of cement Atocongo Pant and cooler Electrostatic of kiln 1 Atocongo
Plant of the Company.
(e) Carbon credits –
As of December 31, 2014, the Group has the project “Fuel Switching at Atocongo Cement
Plant and Natural Gas Pipeline Extension, Cementos Lima, Peru”, registered with the
Executive Board of the United Nations Framework Convention on Climate Change
(UNFCCC) on November 10, 2008. As of to date the Company has made 3 emissions of
CERs by 316,306 CERs this project.
Also, the hydroelectric El Platanal not only produce clean, renewable energy, it is the main
project of emission reductions in Peru, and one of the largest in the world in Development
Framework (CDM) of the Nations together. This project has issued a total of 2,141,261
CERs from February 1, 2010 to April 30, 2013.
32. Financial risk objectives and management policies
The Group’s financial liabilities comprise –along with derivative instruments, include other financial
liabilities and trade payables and others. The main purpose of these financial liabilities is to finance the
Group’s operations. The Group has cash and trade receivables and others that arise directly from its
operations. The Group also holds derivative financial instruments.
The Group is exposed to market risk, credit risk and liquidity risk.
Notes to the consolidated financial statements (continued)
77
The Group’s Senior Management oversees the management of these risks. The Company’s Senior
Management is supported by the Financial Management that advises on financial risks and the
appropriate financial risk governance framework for the Company. The Financial Management provides
assurance to the Company’s Senior Management that the Company’s financial risk-taking activities are
governed by appropriate policies and procedures and that financial risks are identified, measured and
managed in accordance with the Company policies and company risk appetite. All activities comprising
risk management – related derivative instruments are handled by a team of experts with suitable
capabilities, experience and oversight.
The Board of Directors reviews and agrees policies for managing each of these risks which are
summarized below:
32.1 Market risk –
Market risk is the risk that the fair value of future cash flows of a financial instrument will
fluctuate because of changes in market prices. In turn, market prices comprise four types of risk:
interest rate risk, currency risk, commodity price risk and other price risk. Financial instruments
affected by market risk include loans and borrowings, deposits and derivative financial
instruments.
The sensitivity analyses shown in the following sections relate to the financial position as of
December 31, 2014 and 2013.
The sensitivity analyses have been prepared on the basis that the amount of net debts, the ratio
of fixed to floating interest rate of the debt and the proportion of financial instruments in foreign
currencies are all constant as of December 31, 2014 and 2013.
(i) Interest rate risk –
Interest rate risk is the risk that the fair value or future cash flows of a financial
instrument will fluctuate because of changes in market interest rates. Company exposure
of the Group to the interest rate risk is related mainly to the long-term debt with variable
interest rates.
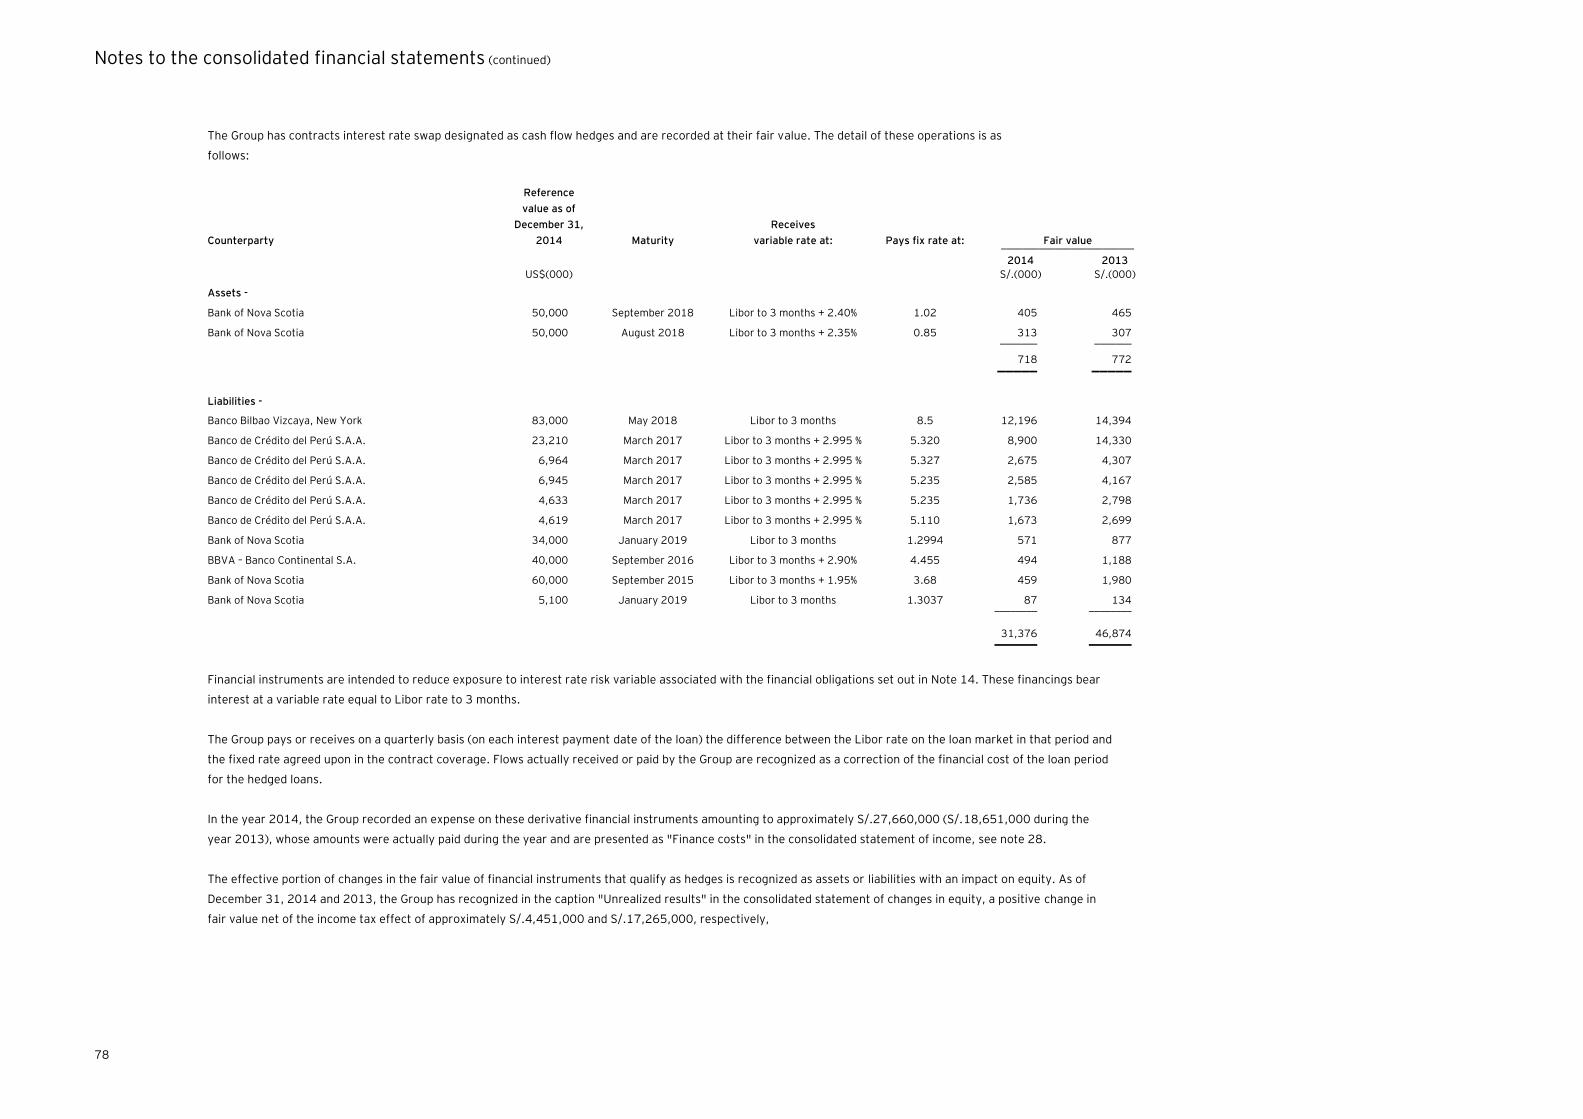
Notes to the consolidated financial statements (continued)
78
The Group has contracts interest rate swap designated as cash flow hedges and are recorded at their fair value. The detail of these operations is as
follows:
Counterparty
Reference
value as of
December 31,
2014 Maturity
Receives
variable rate at: Pays fix rate at: Fair value _________________________
2014 2013
US$(000) S/.(000) S/.(000)
Assets -
Bank of Nova Scotia 50,000 September 2018 Libor to 3 months + 2.40% 1.02 405 465
Bank of Nova Scotia 50,000 August 2018 Libor to 3 months + 2.35% 0.85 313 307 _______ _______
718 772 _____ _____
Liabilities -
Banco Bilbao Vizcaya, New York 83,000 May 2018 Libor to 3 months 8.5 12,196 14,394
Banco de Crédito del Perú S.A.A. 23,210 March 2017 Libor to 3 months + 2.995 % 5.320 8,900 14,330
Banco de Crédito del Perú S.A.A. 6,964 March 2017 Libor to 3 months + 2.995 % 5.327 2,675 4,307
Banco de Crédito del Perú S.A.A. 6,945 March 2017 Libor to 3 months + 2.995 % 5.235 2,585 4,167
Banco de Crédito del Perú S.A.A. 4,633 March 2017 Libor to 3 months + 2.995 % 5.235 1,736 2,798
Banco de Crédito del Perú S.A.A. 4,619 March 2017 Libor to 3 months + 2.995 % 5.110 1,673 2,699
Bank of Nova Scotia 34,000 January 2019 Libor to 3 months 1.2994 571 877
BBVA – Banco Continental S.A. 40,000 September 2016 Libor to 3 months + 2.90% 4.455 494 1,188
Bank of Nova Scotia 60,000 September 2015 Libor to 3 months + 1.95% 3.68 459 1,980
Bank of Nova Scotia 5,100 January 2019 Libor to 3 months 1.3037 87 134 ________ ________
31,376 46,874 ________ ________
Financial instruments are intended to reduce exposure to interest rate risk variable associated with the financial obligations set out in Note 14. These financings bear
interest at a variable rate equal to Libor rate to 3 months.
The Group pays or receives on a quarterly basis (on each interest payment date of the loan) the difference between the Libor rate on the loan market in that period and
the fixed rate agreed upon in the contract coverage. Flows actually received or paid by the Group are recognized as a correction of the financial cost of the loan period
for the hedged loans.
In the year 2014, the Group recorded an expense on these derivative financial instruments amounting to approximately S/.27,660,000 (S/.18,651,000 during the
year 2013), whose amounts were actually paid during the year and are presented as "Finance costs" in the consolidated statement of income, see note 28.
The effective portion of changes in the fair value of financial instruments that qualify as hedges is recognized as assets or liabilities with an impact on equity. As of
December 31, 2014 and 2013, the Group has recognized in the caption "Unrealized results" in the consolidated statement of changes in equity, a positive change in
fair value net of the income tax effect of approximately S/.4,451,000 and S/.17,265,000, respectively,
Notes to the consolidated financial statements (continued)
79
Sensitivity to interest rate -
The following table shows the sensitivity to a reasonably possible change in interest rates on the
portion of the loans, after the impact of hedge accounting. With all other variables remaining
constant, the profit before income tax of Group would be affected by the impact on variable rate
loans, as follows:
Increase / decrease in basis points Impact on income before income taxes __________________________________
2014 2013 % S/.(000) S/.(000)
+10 295 185
-10 (295) (185)
The movement course in the basics related to the analysis of sensitivity to interest rate is based
on the current market environment.
(ii) Foreign currency risk -
Foreign currency risk is the risk that the fair value or future cash flows of a financial instrument
will fluctuate because of changes in foreign exchange rates. The Group’s exposure to the risk of
changes in foreign exchange relates primarily to the Group’s operating activities (when revenue
or expense is denominated in a different currency from the Group’s functional currency).
Management monitors this risk through the analysis of the country’s macroeconomic variables.
The result of holding balances in foreign currency for the Group in the years 2014 and 2013 was
a loss in exchange difference amounting approximately S/.145,376,000 and S/.187,482,000,
respectively, which are presented in the caption “Exchange difference, net” in the consolidated
statement of income.
As of December 31, 2014 and 2013, the Group has “Cross currency interest rate swap”
amounting to S/.10,063,000 and S/.5,432,000 in favor of bank, respectively, and hedging of
risks associated with exchange rate fluctuations.
Foreign currency sensitivity -
Foreign currency transactions are made at free market exchange rates published by the
Superintendence of Banks, Insurance and Private Pension Funds. As of December 31, 2014 , the
weighted average market exchange rate for transactions in Nuevos Soles published by the
Superintendence of Banks, Insurance and Private Pension Funds was S/.2.981 for buying and
S/.2.989 for selling (S/.2.794 for buying and S/.2.796 for selling as of December 31, 2013),
respectively.
The weighted average exchange rates for transactions in Euros as of December 31, 2014 were
S/.3.545 for buying and S/.3.766 for selling (S/.3.715 for buying and S/.3.944 for selling as of
December 31, 2013), respectively.

Notes to the consolidated financial statements (continued)
80
As of December 31, 2014 and 2013, the Group had the following assets and liabilities in foreign
currency:
(a) U.S. Dollars
2014 2013 _____________________________ _____________________________
US$(000) Equivalent in
S/.(000) US$(000) Equivalent in
S/.(000)
Asset
Cash and cash equivalents 10,687 31,888 68,940 192,618
Trade and other receivables, net 54,373 162,202 22,366 62,941 ____________ ___________ ___________ ___________
65,060 194,090 91,306 255,559 ____________ ___________ ___________ ___________
Liabilities
Other financial payables (1,176,497) (3,516,080) (1,026,408) (2,869,837)
Trade and other payables (61,237) (183,040) (31,922) (89,254)
Derivative financial instruments (10,497) (31,376) (16,389) (45,824) ____________ ___________ ___________ ___________
(1,248,231) (3,730,496) (1,074,719) (3,004,915) ____________ ___________ ___________ ___________
Financial derivatives foreign
currency (3,367) (10,063) (1,943) (5,432) ____________ ___________ ___________ ___________
Net liability position (1,186,538) (3,546,469) (985,356) (2,754,788) ____________ ___________ ___________ ___________
(b) Euros
2014 2013 _____________________________ _____________________________
€(000) Equivalent in
S/.(000) €(000) Equivalent in
S/.(000)
Asset
Trade and other receivables 3 9 3 12 _________ __________ _________ __________
Asset position 3 9 3 12 _________ __________ _________ __________
The following table demonstrates the sensitivity to a reasonably possible change in the US
dollar exchange rate, with all other variables held constant, of the Group’s profit before
income tax (due to changes in the fair value of monetary assets and liabilities, including
derivative financial instruments in foreign currency not classified as hedge).
Change in
US Dollars exchange rate
Impact on income before income taxes _________________________________ 2014 2013
% S/.(000) S/.(000)
+5 (177,354) (137,490)
+10 (354,708) (274,981)
-5 177,354 137,490
-10 354,708 274,981

Notes to the consolidated financial statements (continued)
81
32.2 Credit risk -
Credit risk is the risk that counterparty will not meet its obligations under a financial
instrument or customer contract, leading to a financial loss. The Group is exposed to a
credit risk from its operating activities (primarily for trade receivables) and from its
financing activities, including deposits with banks and financial institutions, and trade and
other receivables. The maximum credit risk of the components of the consolidated
financial statements as of December 31, 2014 and 2013 is represented by the amount of
the captions cash and cash equivalents, trade and other accounts receivable.
Financial instruments and cash deposits -
Credit risk from balances with banks and financial institutions is managed by the Finance
Manager in accordance with the Company’s policy. Counterparty credit limits are reviewed
by Group´s Management and Board of Directors to minimize the concentration of risks
and therefore mitigate financial loss through potential counterparty’s failure.
Trade accounts receivable –
Customer credit risk is managed by management, subject to the Group’s established
policies, procedures and controls. Outstanding customer receivables are regularly
monitored to assure the collection. The Group’s sales are made in Peru, Chile, Ecuador
and United States America. Likewise, the Group evaluates the accounts receivable whose
collection is estimated as remote to determine the required allowance for un-collectability.
Other accounts receivable –
Accounts receivable correspond to balances pending of collection due to concepts not
related to the main operation activities of the Group. As of December 31, 2014 and 2013,
other accounts receivable correspond mainly to: advances to suppliers, claims to Tax
Authority and claims to third parties. The Group’s Management made a continuously
monitors of the credit risk to such items and periodically, it assesses the balances that
evidence an impairment to determine the required allowance for un-collectability.
32.3 Liquidity risk -
The Group monitors its risk of shortage of funds using a recurring liquidity planning tool.
The Group’s objective is to maintain a balance between continuity of funding and flexibility
through the use of bank deposits and other financial liabilities.
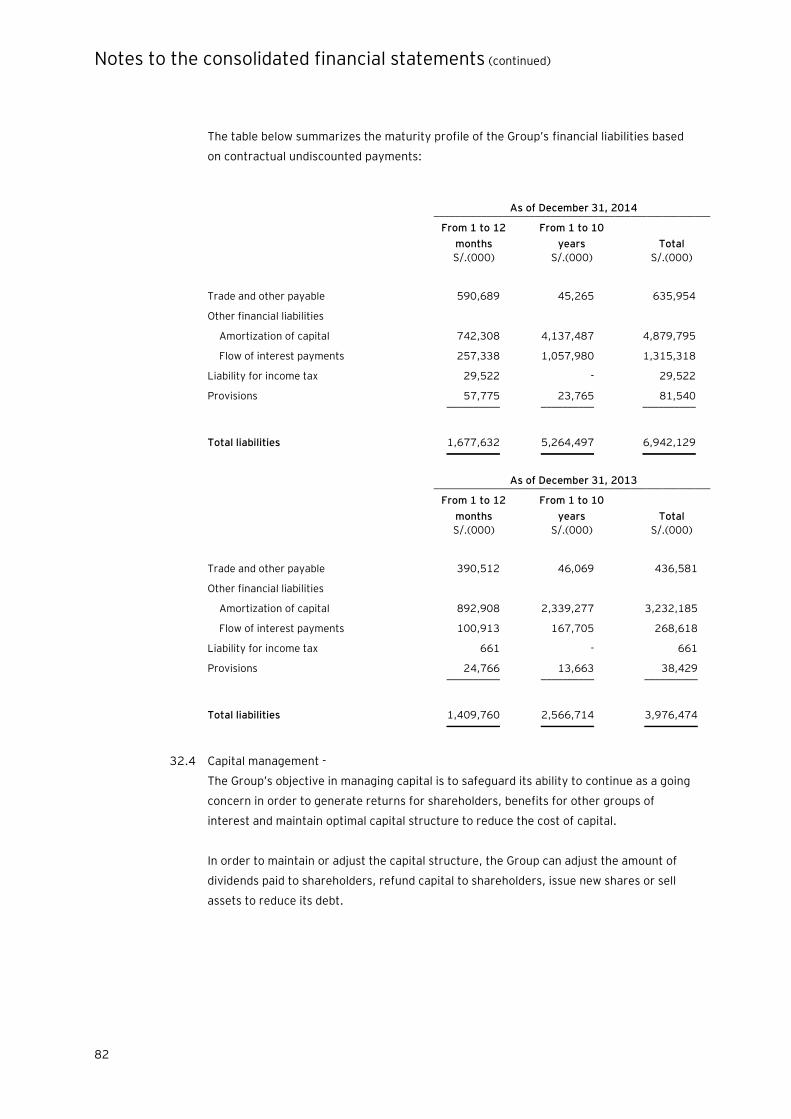
Notes to the consolidated financial statements (continued)
82
The table below summarizes the maturity profile of the Group’s financial liabilities based
on contractual undiscounted payments:
As of December 31, 2014 ____________________________________________________
From 1 to 12
months
From 1 to 10
years Total
S/.(000) S/.(000) S/.(000)
Trade and other payable 590,689 45,265 635,954
Other financial liabilities
Amortization of capital 742,308 4,137,487 4,879,795
Flow of interest payments 257,338 1,057,980 1,315,318
Liability for income tax 29,522 - 29,522
Provisions 57,775 23,765 81,540 __________ __________ __________
Total liabilities 1,677,632 5,264,497 6,942,129 __________ __________ __________
As of December 31, 2013 ____________________________________________________
From 1 to 12
months
From 1 to 10
years Total
S/.(000) S/.(000) S/.(000)
Trade and other payable 390,512 46,069 436,581
Other financial liabilities
Amortization of capital 892,908 2,339,277 3,232,185
Flow of interest payments 100,913 167,705 268,618
Liability for income tax 661 - 661
Provisions 24,766 13,663 38,429 __________ __________ __________
Total liabilities 1,409,760 2,566,714 3,976,474 __________ __________ __________
32.4 Capital management -
The Group’s objective in managing capital is to safeguard its ability to continue as a going
concern in order to generate returns for shareholders, benefits for other groups of
interest and maintain optimal capital structure to reduce the cost of capital.
In order to maintain or adjust the capital structure, the Group can adjust the amount of
dividends paid to shareholders, refund capital to shareholders, issue new shares or sell
assets to reduce its debt.
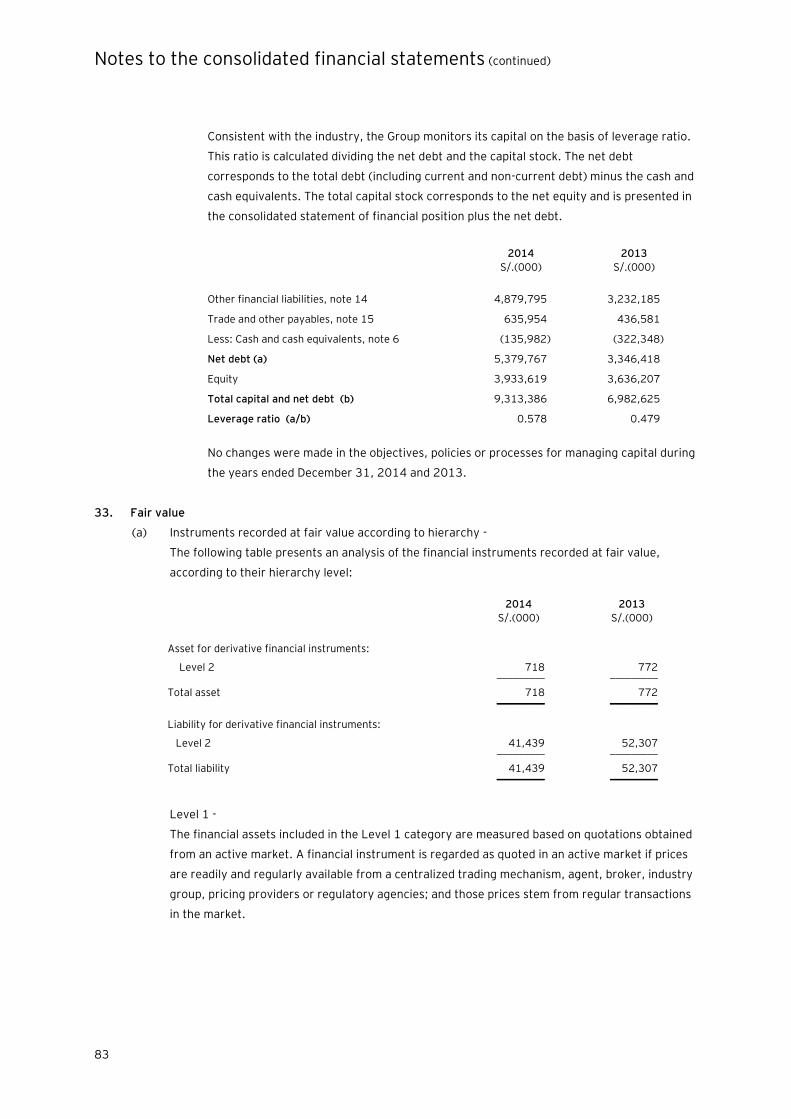
Notes to the consolidated financial statements (continued)
83
Consistent with the industry, the Group monitors its capital on the basis of leverage ratio.
This ratio is calculated dividing the net debt and the capital stock. The net debt
corresponds to the total debt (including current and non-current debt) minus the cash and
cash equivalents. The total capital stock corresponds to the net equity and is presented in
the consolidated statement of financial position plus the net debt.
2014 2013
S/.(000) S/.(000)
Other financial liabilities, note 14 4,879,795 3,232,185
Trade and other payables, note 15 635,954 436,581
Less: Cash and cash equivalents, note 6 (135,982) (322,348)
Net debt (a) 5,379,767 3,346,418
Equity 3,933,619 3,636,207
Total capital and net debt (b) 9,313,386 6,982,625
Leverage ratio (a/b) 0.578 0.479
No changes were made in the objectives, policies or processes for managing capital during
the years ended December 31, 2014 and 2013.
33. Fair value
(a) Instruments recorded at fair value according to hierarchy -
The following table presents an analysis of the financial instruments recorded at fair value,
according to their hierarchy level:
2014 2013
S/.(000) S/.(000)
Asset for derivative financial instruments:
Level 2 718 772 _________ _________
Total asset 718 772 _________ _________
Liability for derivative financial instruments:
Level 2 41,439 52,307 _________ _________
Total liability 41,439 52,307 _________ _________
Level 1 -
The financial assets included in the Level 1 category are measured based on quotations obtained
from an active market. A financial instrument is regarded as quoted in an active market if prices
are readily and regularly available from a centralized trading mechanism, agent, broker, industry
group, pricing providers or regulatory agencies; and those prices stem from regular transactions
in the market.
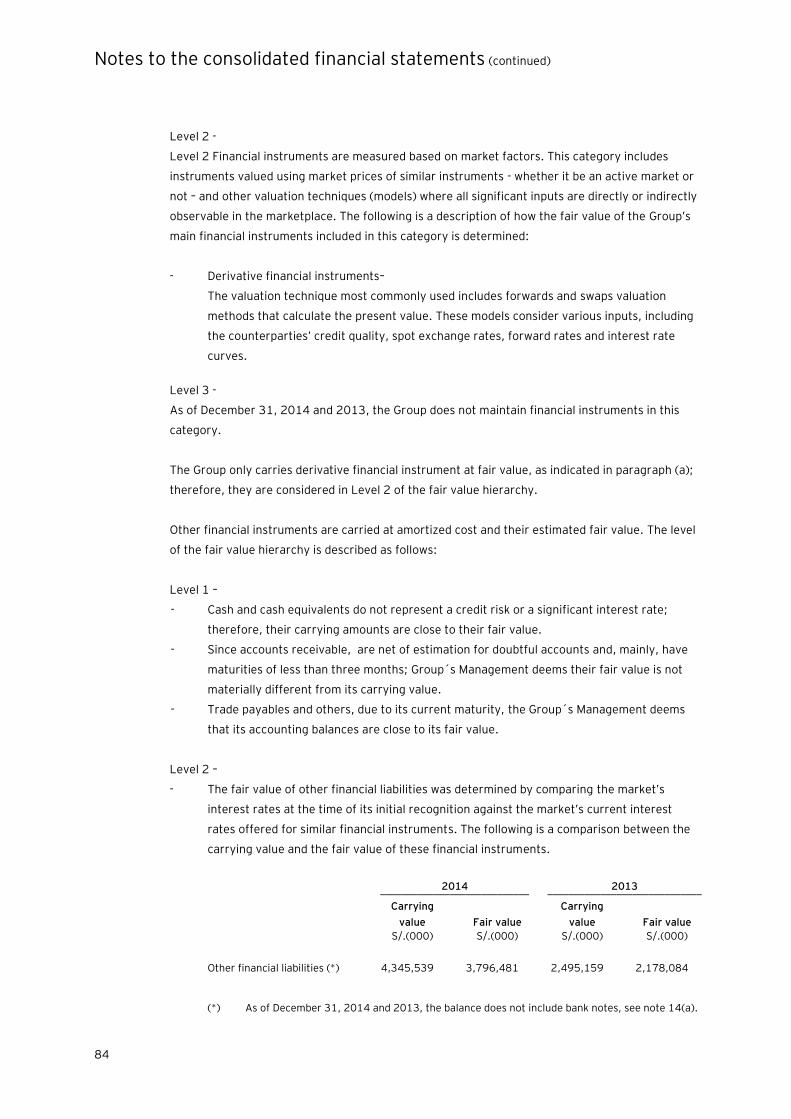
Notes to the consolidated financial statements (continued)
84
Level 2 -
Level 2 Financial instruments are measured based on market factors. This category includes
instruments valued using market prices of similar instruments - whether it be an active market or
not – and other valuation techniques (models) where all significant inputs are directly or indirectly
observable in the marketplace. The following is a description of how the fair value of the Group’s
main financial instruments included in this category is determined:
- Derivative financial instruments–
The valuation technique most commonly used includes forwards and swaps valuation
methods that calculate the present value. These models consider various inputs, including
the counterparties’ credit quality, spot exchange rates, forward rates and interest rate
curves.
Level 3 -
As of December 31, 2014 and 2013, the Group does not maintain financial instruments in this
category.
The Group only carries derivative financial instrument at fair value, as indicated in paragraph (a);
therefore, they are considered in Level 2 of the fair value hierarchy.
Other financial instruments are carried at amortized cost and their estimated fair value. The level
of the fair value hierarchy is described as follows:
Level 1 –
- Cash and cash equivalents do not represent a credit risk or a significant interest rate;
therefore, their carrying amounts are close to their fair value.
- Since accounts receivable, are net of estimation for doubtful accounts and, mainly, have
maturities of less than three months; Group´s Management deems their fair value is not
materially different from its carrying value.
- Trade payables and others, due to its current maturity, the Group´s Management deems
that its accounting balances are close to its fair value.
Level 2 –
- The fair value of other financial liabilities was determined by comparing the market’s
interest rates at the time of its initial recognition against the market’s current interest
rates offered for similar financial instruments. The following is a comparison between the
carrying value and the fair value of these financial instruments.
2014 2013 ____________________________ _____________________________
Carrying
value
Fair value
Carrying
value
Fair value
S/.(000) S/.(000) S/.(000) S/.(000)
Other financial liabilities (*) 4,345,539 3,796,481 2,495,159 2,178,084
(*) As of December 31, 2014 and 2013, the balance does not include bank notes, see note 14(a).
Notes to the consolidated financial statements (continued)
85
34. Segment information
For management purposes, the Group is organized into business units based on their products and
activities and have three main reportable segments as follows:
- Manufacture and sale of cement.
- Manufacture and sale of concrete.
- Generation and sale of electrical energy generated using hydraulic resources.
No operating segments have been aggregated to form the above reportable operating segments.
Management of each entity monitors the operating profit of each business unit separately for
purposes of making decisions about resources allocation and performance assessment.
Segment performance is evaluated based on gain or less operating and is measured
consistently with gain or less operating in the consolidated financial statements.
Transfer prices between operating segments are on an arm’s length basis in a manner similar to
transactions with third parties.

Notes to the consolidated financial statements (continued)
86
2014 2013 _______________________________________________________________________________________________________ ________________________________________________________________________________________________________
Cement Concrete
Electrical
energy Other
Total
segments
Adjustments
and
eliminations Consolidated Cement Concrete
Electrical
energy Other
Total
segments
Adjustments
and
eliminations Consolidated
S/.(000) S/.(000) S/.(000) S/.(000) S/.(000) S/.(000) S/.(000) S/.(000) S/.(000) S/.(000) S/.(000) S/.(000) S/.(000) S/.(000)
Income
Third-party customers 1,688,586 1,240,872 166,649 - 3,096,107 - 3,096,107 1,526,661 1,161,442 196,602 - 2,884,705 - 2,884,705
Inter segments 265,449 86,978 108,296 7,942 468,665 (468,665) - 247,938 44,341 81,260 7,215 380,754 (380,754) -
__________ __________ __________ __________ ___________ __________ __________ __________ __________ __________ __________ __________ __________ __________
Total revenues 1,954,035 1,327,850 274,945 7,942 3,564,772 (468,665) 3,096,107 1,774,599 1,205,783 277,862 7,215 3,265,459 (380,754) 2,884,705
__________ __________ __________ __________ ___________ __________ __________ __________ __________ __________ __________ __________ __________ __________
Gross profit 793,999 156,374 82,506 1,854 1,034,733 (13,488) 1,021,245 651,904 204,649 86,316 1,819 944,688 5,430 950,118
__________ __________ __________ __________ ___________ __________ __________ __________ __________ __________ __________ __________ __________ __________
Operating income (expenses)
Administrative expenses (188,708) (58,523) (14,735) (3,045) (265,011) 3,310 (261,701) (168,343) (52,124) (13,059) (2,565) (236,091) - (236,091)
Selling expenses (104,325) (19,940) (1,148) - (125,413) 3,183 (122,230) (88,189) (11,756) (1,260) (9) (101,214) 2,653 (98,561)
Other operating income (expenses),
net 41,535 (2,099) 2,625 (1,659) 40,402 (11,840) 28,562 10,486 (17,545) 2,685 236 (4,138) (8,083) (12,221)
__________ __________ __________ __________ ___________ __________ __________ __________ __________ __________ __________ __________ __________ __________
Operating profit 542,501 75,812 69,248 (2,850) 684,711 (18,835) 665,876 405,858 123,224 74,682 (519) 603,245 - 603,245
__________ __________ __________ __________ ___________ __________ __________ __________ __________ __________ __________ __________ __________ __________
Other income (expenses)
Gain on sharing in associate, net - 3,165 - - 3,165 - 3,165 - 3,321 - - 3,321 - 3,321
Finance income 3,647 2,257 454 148 6,506 - 6,506 7,440 2,876 389 96 10,801 - 10,801
Finance costs (162,243) (23,290) (31,422) (4,140) (221,095) - (221,095) (100,829) (16,582) (35,685) (3,657) (156,753) - (156,753)
Exchange difference, net (119,638) (4,940) (20,795) (3) (145,376) - (145,376) (135,649) (19,815) (32,000) (18) (187,482) - (187,482)
__________ __________ __________ __________ ___________ __________ __________ __________ __________ __________ __________ __________ __________ __________
Income before tax 264,267 53,004 17,485 (6,845) 327,911 (18,835) 309,076 176,820 93,024 7,386 (4,098) 273,132 - 273,132
Income tax expense (7,725) (1,893) 129 (315) (9,804) - (9,804) (62,526) (12,172) (4,775) (368) (79,841) - (79,841)
__________ __________ __________ __________ ___________ __________ __________ __________ __________ __________ __________ __________ __________ __________
Net income for segment 256,542 51,111 17,614 (7,160) 318,107 (18,835) 299,272 114,294 80,852 2,611 (4,466) 193,291 - 193,291 __________ __________ __________ __________ ___________ __________ __________ __________ __________ __________ __________ __________ __________ __________
Income before tax for segment 422,863 70,872 48,453 (2,853) 539,335 (230,259) 309,076 270,209 103,409 42,682 (537) 415,763 (142,631) 273,132 __________ __________ __________ __________ ___________ __________ __________ __________ __________ __________ __________ __________ __________ __________
Operating assets 7,837,495 998,253 1,149,592 38,059 10,023,399 231,303 10,254,702 5,903,886 731,566 1,124,007 149,959 7,909,418 129,742 8,039,160 __________ __________ __________ __________ ___________ __________ __________ __________ __________ __________ __________ __________ __________ __________
Operating liabilities 405,625 292,153 105,806 1,144 804,728 5,516,355 6,321,083 247,307 217,995 44,217 6,873 516,392 3,886,561 4,402,953
__________ __________ __________ __________ ___________ __________ __________ __________ __________ __________ __________ __________ __________ __________
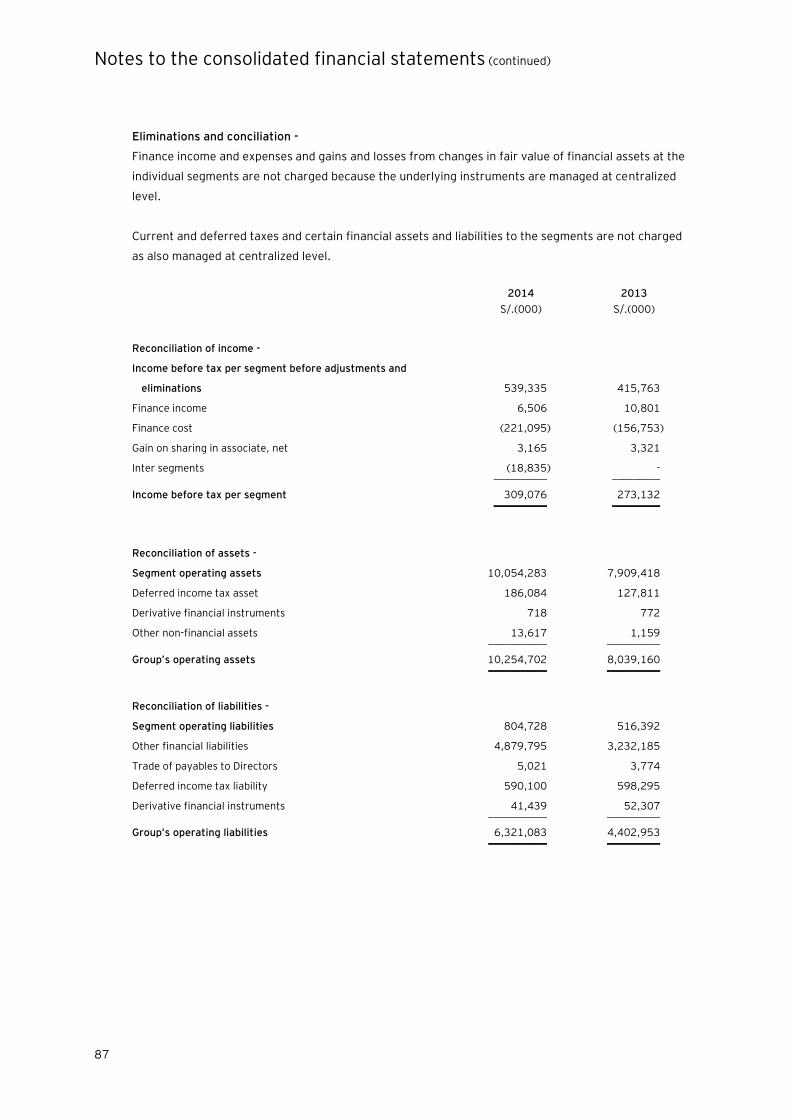
Notes to the consolidated financial statements (continued)
87
Eliminations and conciliation -
Finance income and expenses and gains and losses from changes in fair value of financial assets at the
individual segments are not charged because the underlying instruments are managed at centralized
level.
Current and deferred taxes and certain financial assets and liabilities to the segments are not charged
as also managed at centralized level.
2014 2013
S/.(000) S/.(000)
Reconciliation of income -
Income before tax per segment before adjustments and
eliminations 539,335 415,763
Finance income 6,506 10,801
Finance cost (221,095) (156,753)
Gain on sharing in associate, net 3,165 3,321
Inter segments (18,835) - __________ _________
Income before tax per segment 309,076 273,132 __________ _________
Reconciliation of assets -
Segment operating assets 10,054,283 7,909,418
Deferred income tax asset 186,084 127,811
Derivative financial instruments 718 772
Other non-financial assets 13,617 1,159 ___________ __________
Group’s operating assets 10,254,702 8,039,160 ___________ __________
Reconciliation of liabilities -
Segment operating liabilities 804,728 516,392
Other financial liabilities 4,879,795 3,232,185
Trade of payables to Directors 5,021 3,774
Deferred income tax liability 590,100 598,295
Derivative financial instruments 41,439 52,307 ___________ __________
Group’s operating liabilities 6,321,083 4,402,953 ___________ __________
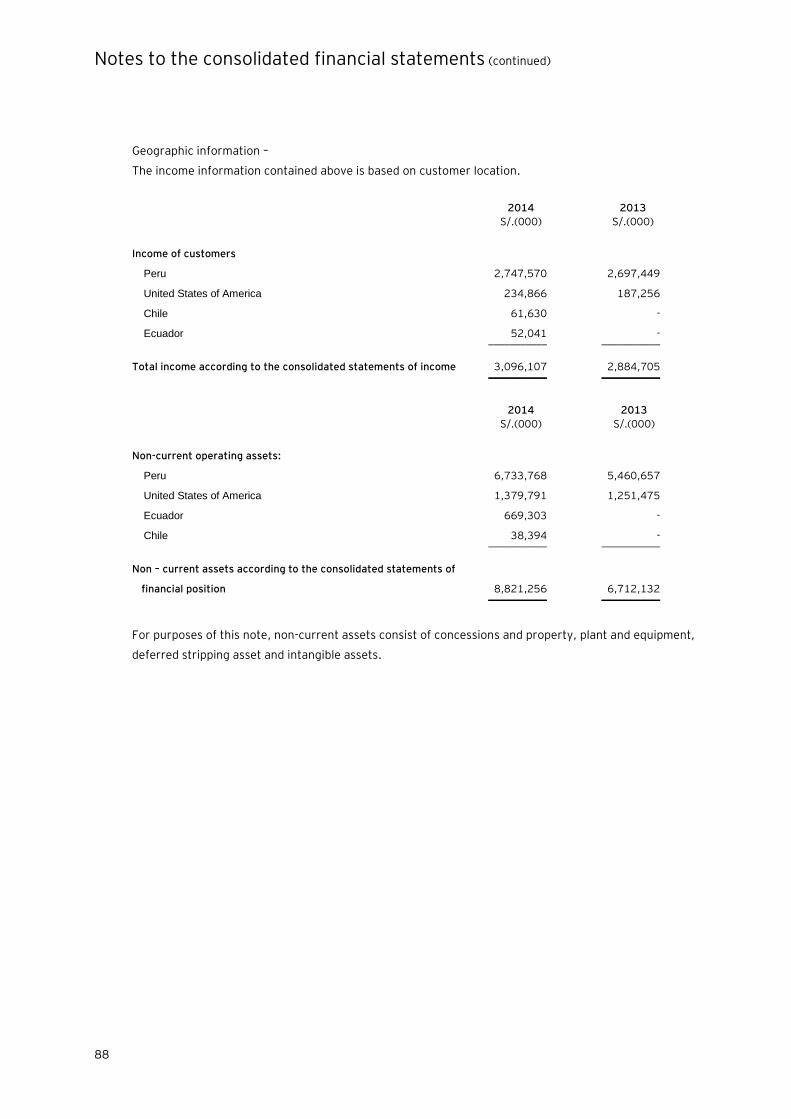
Notes to the consolidated financial statements (continued)
88
Geographic information –
The income information contained above is based on customer location.
2014 2013
S/.(000) S/.(000)
Income of customers
Peru 2,747,570 2,697,449
United States of America 234,866 187,256
Chile 61,630 -
Ecuador 52,041 - ___________ ___________
Total income according to the consolidated statements of income 3,096,107 2,884,705 ___________ ___________
2014 2013
S/.(000) S/.(000)
Non-current operating assets:
Peru 6,733,768 5,460,657
United States of America 1,379,791 1,251,475
Ecuador 669,303 -
Chile 38,394 - ___________ ___________
Non – current assets according to the consolidated statements of
financial position 8,821,256 6,712,132 ___________ ___________
For purposes of this note, non-current assets consist of concessions and property, plant and equipment,
deferred stripping asset and intangible assets.
EY I Assurance I Tax I Transactions I Advisory
Acerca de EY
EY es un líder global en servicios de auditoría, impuestos,
transacciones y consultoría. La calidad de servicio y
conocimientos que aportamos ayudan a brindar confianza
en los mercados de capitales y en las economías del mundo.
Desarrollamos líderes excepcionales que trabajan en equipo
para cumplir nuestro compromiso con nuestros
stakeholders. Así, jugamos un rol fundamental en la
construcción de un mundo mejor para nuestra gente,
nuestros clientes y nuestras comunidades.
Para más información visite ey.com
© 2015 EY
All Rights Reserved.