Embed Size (px)
Citation preview

Registered Number 4661188
UNION BANK UK PLC
ANNUAL REPORT
AND
FINANCIAL STATEMENTS
31ST
DECEMBER 2016
- 2 -
A member of the
Union Bank of Nigeria Plc Financial Group
FINANCIAL HIGHLIGHTS Thousands of US dollar
(Unless otherwise states)
Union Bank serves you better
2016 2015 2014 2013 2012
Thousands of US
dollars (unless
otherwise stated)
Reporting period ended 31st December 31
st December 31
st December 31
st December 31
st December
Total Income 11,024 10, 593 10,605 11,413 13,310
Profit/(Loss) before tax 685 958 1,483 (571) 2,924
Profit/(Loss) after tax 499 856 1,161 (455) 2,160
Dividends declared † - - - - 945
Shareholders’ Funds # 75,382 73,599 74,061 72,647 73,856
Total Assets 447,820 300,691 431,568 489,215 505,115
Capital / Risk Weighted
Assets 38% 49% 74% 39% 43%
Return on Equity 0.91% 1.30% 2.0% (0.8%) 4.0%
Cost Income Ratio 87% 90% 87% 85% 73%
Dollar / sterling exchange rate
Year end 1.2306 $1.48 $1.56 $1.65 $1.62
Average 1.3189 $1.53 $1.66 $1.57 $1.59
† Dividends are accounted for in the year in which they were declared by the board and subsequently approved at the
AGM.
# Including subordinated debt of $15.0m which was converted to Tier 1 Capital in 2010.
Financial statements are prepared under International Financial Reporting Standards as adopted by the European Union
(IFRS).
3
CHAIRMAN’S STATEMENT On behalf of the Board of Directors, it gives me great pleasure to present the audited annual reports and financial
statements of Union Bank UK (“UBUK”) for the year ended 31st December 2016.
The UK Economy
The UK was one of the fastest-growing advanced economies in 2016 with a GDP of 2%, better than both the US and the
EU which grew by 1.9% and 1.7%. UK 2016 growth was however slower than 2.2% recorded in 2015 and 3.1% in
2014. In spite of an earlier prediction by the IMF that a vote to leave the EU could plunge the country into recession and
trigger a stock market crash, stock market’s post-vote resilience and increased consumer spending in the second half of
the year resulted in significantly stronger growth than expected.
Since the vote the Bank of England has taken a number of steps to boost the UK economy, cutting interest rates from
0.5% to 0.25% in August - the first reduction in the cost of borrowing since 2009 and taking UK rates to a new record
low.
As the process to exit the EU commences, the British pound has fallen to its lowest levels against the dollar in over 31
years as traders worry about the future of the economy; today the pound is worth about ~$1.21 - compared with $1.47
pre-referendum. Consequently, inflation has jumped to a two-year low, hitting 1.6% in December 2016. Although the
fall in the pound helps exporters, it makes foreign holidays more expensive for British tourists and it has also increased
import costs for manufacturers.
Looking ahead, growth in 2017 is expected to be muted at 1.5%, declining to 1.4% in 2018 reflecting widespread
uncertainty over Britain’s future outside the EU. Household incomes will be squeezed by higher inflation and businesses
will hold back on investment decisions which are also likely to increase unemployment.
The Nigerian Economy
In 2016, the Nigerian economy slowed significantly due to the adverse effects of disruptions to oil production, foreign
currency shortages, lower power generation, delayed signing and implementation of the 2016 budget and overall weak
investor confidence. Consequently, the economy stumbled into a recession by June, with full year 2016 GDP estimated
at -1.6%, comparison to 2.7% growth in 2015. The mixed nature of UBUK business means that the performance of the
Nigerian economy influences our overall performance.
In the second quarter of 2016, the Central Bank of Nigeria (“CBN”) introduced a flexible exchange rate and a futures
and forwards market to ease the pressure of foreign currency shortages on the economy. This resulted in the official rate
of the naira depreciating from N197/$ to N282/$, eventually closing the year at N305. The higher cost of the dollar took
a toll on inflation, considering the import dependent nature of the economy. As a result, inflation accelerated from 9.6%
in January, peaking at 18.6% in December 2016.
We expect that 2017 will be a challenging year for Nigeria. Despite the projected increase in oil prices and the
anticipated increase in oil production, emerging from a recession is no small feat. We believe that the government will
play a key role in executing economic plans and improving infrastructure to aid businesses and improve the operating
environment in the country.
2016 Financial Performance
Despite the challenges of 2016, I am pleased to report that we improved our total income in 2016 over the previous year.
We also reduced cost-to-income ratio, reflective of the cost conscious approach taken by Board and Management.
In 2016, we continued to execute our strategy in line with the overall Group’s ambition. We have been cautious in our
approach to new business and this is reflected in our low non-performing loans. Our conservative approach will
continue into 2017 as we closely monitor the economic situation in Nigeria.
Board Changes
After 6 years of service to UBUK, Mr Marco Biglia resigned his position as non-Executive Director. He has been
succeeded by Mr. Nigel Richards who took up the role of non-Executive Director In August. On behalf of the Board I
would like to thank Marco for his contribution to UBUK and welcome Nigel to the Board.
4
Outlook
2017 will be another year of transition and change as the Bank continues the transformation set out in our strategic plan.
The global business environment remains uncertain, economies are still fragile and geopolitical tensions are strong. In
our industry, regulatory pressure is mounting, consumer needs are increasingly diverse and competition is intensifying
driven by innovation. In spite of these challenges, we will reinforce our ability to adapt to the changing environment and
continue to cautiously forge new client relationships, while strengthening existing connections in our core markets.
We are committed to delivering strong performance in the years ahead, increasing UBUK’s value to the group and all
stakeholders through sustainable profit growth.
I would like to express my heartfelt appreciation to our customers and partners for the loyalty and confidence they
continue to offer our Bank. On behalf of the board I would also like to say thank you to all our staff who have served the
bank so diligently.
5
CONTENTS
Directors, Advisers and Principal Officers
6
Strategic Report 7-8
Directors’ Report
9-12
Directors’ Responsibilities and Corporate
Governance
13-14
Independent Auditor’s Report
15-16
Statement of Comprehensive Income
17
Statement of Financial Position
18 - 19
Statements of Changes in Equity 20
Statement of Cash Flows 21
Notes to the Financial Statements
22-53
6
DIRECTORS AND ADVISERS
Directors: Gavin C Laws
Emeka Emuwa
Chairman / Independent Non-executive & Chairman of audit
committee
Non-executive and Group Managing Director/Chief
Executive of Union Bank of Nigeria Plc
Maurice Phido Managing Director/Chief Executive
Nigel J Richards Independent non-executive and Chairman of the Risk &
General Purposes Committee
David J Forster Executive Director/Chief Operating Officer
Kandolo S Kasongo Non-executive and Executive Director of Union Bank of
Nigeria Plc
Suzanne O Iroche
Independent non-executive and Chairman of the
Establishment & Remuneration Committee
Secretary: P.R Hartley F.C.A PO Box 27075, London, N2 0FZ
Registered Office: 1 King’s Arms Yard, London, EC2R 7AF
Solicitors: Hogan Lovells Atlantic House, London, EC1A 2FG
Auditors: BDO LLP 55 Baker Street, London, W1U 7EU
PRINCIPAL OFFICERS
Management Committee:
Maurice Phido Managing Director/Chief Executive
David J Forster
Executive Director/Chief Operating Officer (Acting CEO From 01/02/16 to
23/05/2016)
Dominiek Vangaever Director, Risk & Compliance
Martin Uzus Associate Director, Business Development
Farhood Hieydary Associate Director, Treasury
Janet A Ntuk Associate Director, Corporate Resources
Christopher C Nwabuoku Associate Director, Internal Audit
7
STRATEGIC REPORT
Overview
The Bank’s strategic aim is to primarily serve as an extension of Union Bank of Nigeria in the UK serving and
partnering with our clients on their specialised financial needs revolving around regional and international trade. Our
focus is to build our core business segments of Retail, Treasury/Corporate and Commercial both vertically, by offering a
competitive range of products, and horizontally so that our customers recognise UBUK for all of their banking needs.
Our ambition is to be a leading provider of specialised financial services to clients with interests in the UK, Europe,
Middle East and Africa. We will do this with the highest standards of conduct and by always putting the customer first.
Performance
The Bank’s performance in 2016 continues to reflect the challenging economic situation in its target market, producing
a pre-tax profit of US$0.685m against the previous year of US$0.958m.
Interest income at US$9.6m was marginally up on the 2015 figure of US$9.4m. Dealing and exchange profits at
US$0.661m were up on the previous year figure of US$0.489m primarily due to increased volumes. Fee and
commission income at US$2.14m was up on the previous year of US$2.020m, the increase is attributable to larger LC
transactions during the year. Other comprehensive income returned a positive result against the previous year’s figure.
This resulted from the economic conditions in the bond market during 2016 producing an unrealised mark-to-market
gain, net of tax US$1.099m.
Costs were again maintained within budget for the year and showed a small increase from the previous year. Impairment
charges, amounted to a debit of US$0.702m, which are inclusive of specific provisions of US$384,689 (actual). There
were no write-offs during the year.
Key Performance Indicators
The key indicators of the Bank’s performance monitored by the Board are those relating to profitability as measured by
the pre-tax return on equity (ROE) and Capital over risk weighted assets.
In the 12 months to 31st December 2016, the Bank’s returns on equity and capital over risk weighted assets were 0.91%
(2015: 1.30%) and 38% (2015: 49%) respectively. The key indicator of efficiency monitored by the Board is the
cost/income ratio which improved to 87% from 90% in 2015.
The Bank recognises that the movement in sterling/US$ rates could impact on its costs and would take appropriate steps
if there was a significant negative movement. The Bank’s results are shown in the statement of comprehensive income
on page 17, with the impact on shareholders’ funds shown in the statement of changes in equity on page 19.
Future Prospects
The Bank continues to diversify its business geographically in both the lending and fixed income revenue streams which
is in alignment with a strategy designed to enable UBUK to thrive without undue reliance on business secured from the
parent company. Business is increasingly being sought and undertaken in other sub-Saharan African markets either in
asset-backed transactions or co-financing with established international banks and multilateral development agencies.
Overall, performance remains closely linked to developments in Nigeria, including the financial strength and
performance of the parent bank. The Transformation Programme, that the parent bank is undergoing, is to ensure the
Bank consistently delivers the best service possible to its customers and consistently provides value for all its
stakeholders

8
STRATEGIC REPORT
CONTINUED
Principal Risks and Uncertainties
The principal risks associated with the business of the Bank are dealt with in the Directors’ report. The Bank is firmly
committed to risk management and to this end has continued to invest in this area in the form of experienced staff and
systems.
The Board of Directors is ultimately responsible for risk management policies, limits and risk appetite. It is supported
by two of its standing Committees, Risk and General Purpose Committee and Audit Committee, who assist in
formulating policy and provide strategic direction for all aspects of risk management. These Committees, in turn, charge
management to develop, update and implement these policies, controls and limits with risk management ensuring that
there is no event or combination of events that will materially affect the stability of the Bank.
Management operates through a number of committees, namely The Asset and Liability Committee, Credit Committee
and Management Committee, each having their own terms of reference.
All credit decisions and new products require the approval of one or more committees depending on the amount
required and are initially approved by Risk Department before any approval is taken. Risk will monitor the credit until
drawdown to ensure all conditions precedents are met. All portfolios and limits are continuously monitored by senior
management.
The economy in Nigeria has suffered from a period of low oil prices which have led to a drop in government revenues,
forex scarcity and fall in the value of the Naira. Management has closely followed these events and evaluated the
possible impact on our portfolios. Management has also carried out a full review of loans and sources of funding which
may be affected by oil prices and the Naira and believes that the Bank is well placed to manage any subsequent events.
In addition, the Bank makes an assessment with regard to the economic climate in the major markets in which the Bank
participates, the financial position of the Union Bank of Nigeria, current and prospective regulatory developments and
their likely impact on the Bank’s capital and liquidity requirements, and the Bank’s approach to the management of key
risks, as well as current budgets and financial forecasts for profitability, capital and liquidity requirements. The bank is
satisfied that, as a result of these assessments and its prudent approach to risk management, there would be no
unexpected negative impact from these factors.
Approved by the board of directors and signed on behalf of the board

9
DIRECTORS’ REPORT
The directors have pleasure in presenting their report together with the audited financial statements for the year ended
31st December 2016.
Principal Activities Union Bank UK plc (UBUK or the Bank) was incorporated in England and Wales on 10
th February 2003 as a wholly
owned subsidiary of the Union Bank of Nigeria Plc (UBN).
The Bank is authorised under the Financial Services and Markets Act 2000 (FSMA 2000), to carry on regulated
financial services activities, including deposit-taking and dealing in investments as principal. The business of the
Bank includes the provision of retail and commercial banking, treasury and trade finance services.
The Bank has established and maintains the management structure, policies, systems and procedures necessary to
enable full compliance with the rules and regulations of the Financial Conduct Authority (FCA) and the Prudential
Regulation Authority (PRA).
Directors The directors of the Bank at the date of this report and those who served during the year ended 31
st December 2016, are
as follows:
During the year, the Bank provided qualifying third party indemnity provision on behalf of the directors.
Going Concern Basis of Preparation The financial statements are prepared on a going concern basis.
In keeping with the guidance issued by the Financial Reporting Council in October 2009, the Board has considered
formally whether it is appropriate to prepare the financial statements on a going concern basis and has concluded that
the Bank has sufficient resources to continue in business for the foreseeable future. In making this assessment, the
Board has considered a wide range of information relating to present and future conditions, including that set out under
the headings ‘Business Review’, ‘Financial Risk Management’ and ‘Developments in Financial Regulation’ below.
The assessment has regard to the economic climate in the major markets in which the Bank participates, the financial
position of UBN, current and prospective regulatory developments and their likely impact on the Bank’s capital and
liquidity requirements, and the Bank’s approach to the management of key risks, as well as current budgets and
financial forecasts for profitability, capital and liquidity requirements.
Mr GC Laws - Non-executive Chairman appointed 1st January 2016
Mr AC Emuwa - Non-executive
Dr KA Ali
Mr M Phido
-
-
Managing Director/Chief Executive resigned 29th
February 2016
Managing Director/Chief Executive appointed 9th
February 2016
Mr MXMG Biglia - Non-executive resigned 3rd
June 2016
Mr DJ Forster - Executive Director/Chief Operating Officer
Mrs S Iroche - Non-executive
Mr KS Kasongo - Non-executive
Mr NJ Richards - Non-executive appointed 1st August 2016
10
DIRECTORS’ REPORT
CONTINUED
Financial Results The Bank’s financial statements are prepared under International Financial Reporting Standards (IFRSs) as endorsed by
the European Union (EU). The functional currency of the Bank for financial reporting purposes is the US dollar (US$),
being the currency in which the majority of its assets, liabilities, capital and revenues are denominated.
The financial statements for the year ended 31st December 2016 are shown on pages 17 to 53. The profit for the year
after taxation amounted to US$498,747 (2015 –US$856,411).
No dividend was paid in respect of the year ended 31st December 2016 (2015 - US$nil).
The directors do not propose the payment of a final dividend for the year (2015 – US$nil).
Financial Risk Management The principal risks associated with the business of the Bank are credit risk, liquidity risk, market rate risk and
operational risk.
The Bank has established a comprehensive enterprise risk management framework to manage these risks, guided by the
Basel Committee’s principles for sound risk management and compliance with Basel III and FCA and PRA prudential
regulations, including those in respect of liquidity risk. The Board establishes the risk governance structure and sets the
overall risk appetite for both risks to the capital and the liquidity position of the Bank, together with key risk
management policies, including limits relating to credit, market and liquidity risks. The framework provides for
independent oversight of business units, risk identification, assessment and measurement, as well as stress testing of key
risks and various other risk mitigations and monitoring techniques.
Financial and other risks are assessed and documented as part of the Bank's Internal Capital Adequacy Assessment
Process (ICAAP) whereby 'treated risk' after mitigation is considered and internal capital allocated accordingly. The
assessment of risks and allocation of capital recognises the Bank's commitment to the Nigerian and African markets.
These include political, infrastructure and concentration risks, including dependence on industry sectors such as oil and
gas. These risks are significantly mitigated by virtue of the specialised knowledge and experience of the Bank and
UBN, which permits the taking of informed decisions as to risk assumption and mitigation. The Bank produced a new
ICAAP as at 31st March 2016.
The Bank has a clearly defined risk appetite including policies for the identification of key risks and also has in place
Credit Grading and Key Risk Indicator tools.
As required by the UK regulatory authorities, the Bank prepares an Individual Liquidity Adequacy Assessment
(ILAAP) with the latest document as at 30th
June 2016. The framework is designed to assess whether the Bank is able
to survive liquidity stresses of varying magnitude and duration, including the provision to build up a liquidity asset
buffer (LAB) of UK Government or similar quality securities to be used in liquidity stress event.
The results of this ILAAP, which has been reviewed and approved by the Board and the Bank’s Internal Auditor,
indicated that as at 30th
June 2016, there was a positive overall net cumulative gap within the three-month stress period
and that the LAB requirement was US$20.5m. Further information concerning the Bank’s policies for managing risks
associated with financial assets and liabilities is set out in note 31 to the financial statements.
The Bank has completed a Recovery and Resolution plan as at 30th
September 2016 The process includes identifying
events and triggers thereto which would force the Bank to need to recover from an actual or imminent failure of all or
part of its business and agreeing, in consultation with the twin regulatory authorities, the critical economic functions
undertaken by the Bank for which a Resolution Pack will be put in place to be used by those authorities or their
appointed agents.
11
DIRECTORS’ REPORT
CONTINUED
Developments in Financial Regulation The Bank continues to monitor developments in relation to Basel III. In addition to traditional capital requirements,
banks will also be required to build up Capital Requirements Directive IV (CRDIV) buffers, Capital Conservation and
Counter Cyclical Buffer, 2.5% of RWA between 1st January 2016 and 1
st January 2019. However during Bank of
England has decided to postpone the effective date for the Counter Cyclical Buffer. The Bank continues to maintain
HQLA 10% above the regulatory minimum in order to maintain the Pillar 1 Liquidity Coverage Ratio at required levels.
From 1st Jan 2018 Net Stable Funding Ratio will be added to liquidity Pillar 1 standard. The European Banking
Authority (EBA), introduced Common Reporting Standards in 2014 and the Bank continues to report the data items set
to its reporting portfolio to Prudential Regulation Authority UK (PRA).
In the UK, the PRA has specifically focused on firm resolution as well as progressing the implementation in the UK of
changes to the regulation of financial institutions through amendments to the Capital Requirements Directive (CRD).
There is some evidence that reporting is being synchronised, for example with the Contingency Funding Plan prepared
by regulated firms now incorporated within Recovery and Resolution planning.
The results of the Bank’s ILAAP and Recovery and Resolution planning have been discussed in the Financial Risk
Management section above.
Corporate Culture & Values The UBN Group has, at its heart, the corporate values of Initiative, Customer Focus, Accountability, Respect and
Efficiency. These values are the foundation of our dealings with customers, and each other, and are regularly reviewed
by the Board and staff to ensure that we have a working culture that sustains our position as a highly respected provider
of quality banking services.
Information Management
The Bank seeks to ensure that expenditure on IT and Communications remains appropriate to meet all regulatory and
business needs.
The Bank recognises the importance of safeguarding client data and has developed policies and physical and logical
access controls which, coupled with staff awareness training, are designed to protect against data loss.
Employee Matters The Bank recognises that its performance is dependent on the quality of its work force and the investment it makes in
training and development. It is the Bank's policy that its staff should have the opportunity to develop to their full
potential, promote its business in a manner consistent with the highest standards and recognise its environmental and
other responsibilities as a corporate citizen. Staff competencies, training and development are planned consistently with
corporate objectives, including the management of risks, and staff are appraised and rewarded accordingly.
Property and Equipment, Intangible Assets and Capital Commitments Changes in property and equipment and intangible assets are set out in notes 22 and 23 to the financial statements.
The directors have authorised capital expenditure relating to relocation of the Bank’s premises and enhancements to
information technology systems of up to US$1.9m as set out in note 33 At 31st December 2016, amounts so authorised
but not yet expended amounted to US$1.2m.
12
DIRECTORS’ REPORT
CONTINUED
Directors’ Representation The directors who held office at the date of approval of this Directors’ Report confirm that, so far as they are each
aware, there is no relevant audit information of which the Bank’s auditor is unaware; and each of the directors has taken
all the steps that they ought to have taken as a director to make themselves aware of any relevant audit information and
to establish that the Bank’s auditor is aware of that information.
Auditors
The Board approved BDO LLP as their auditors.
By order of the Board on 12 May 2016
Union Bank UK plc
Annual Report & Financial Statements
31st December 2016
- 13 -
DIRECTORS’ RESPONSIBILITIES AND CORPORATE GOVERNANCE
Statement of Directors' Responsibilities in respect of the Strategic Report and Directors' Report and the Financial Statements
The directors are responsible for preparing the Strategic Report and the Directors’ Report and the financial statements in
accordance with applicable law and regulations.
Company law requires the directors to prepare financial statements for each financial year. Under that law they have
elected to prepare the financial statements in accordance with IFRSs as adopted by the EU and applicable law.
Under company law the directors must not approve the financial statements unless they are satisfied that they give a true
and fair view of the state of affairs of the company and of the profit or loss of the company for that period. In preparing
these financial statements, the directors are required to:
• select suitable accounting policies and then apply them consistently;
• make judgements and estimates that are reasonable and prudent;
• state whether they have been prepared in accordance with IFRSs as adopted by the EU; and
• prepare the financial statements on the going concern basis unless it is inappropriate to presume that the
company will continue in business.
The directors are responsible for keeping adequate accounting records that are sufficient to show and explain the
company’s transactions and disclose with reasonable accuracy at any time the financial position of the company and
enable them to ensure that the financial statements comply with the Companies Act 2006. They have general
responsibility for taking such steps as are reasonably open to them to safeguard the assets of the company and to
prevent and detect fraud and other irregularities.
Website Publication
The Directors are responsible for ensuring the Directors’ Report and financial statements are made available on a website. Financial statements are published on the Company’s website in accordance with legislation in the United Kingdom governing the preparation and dissemination of financial statements, which may vary from legislation in other jurisdictions. The maintenance and integrity of the Company’s website is the responsibility of the Directors. The Directors’ responsibility also extends to the ongoing integrity of the financial statements contained therein.
Corporate Governance The Board of Directors of the Bank comprises two executive directors, two non-executive directors appointed by UBN, and three independent non-executive directors one, of whom is the chairman of the board.
Currently there are three independent non-executive directors in-situ. The Board meets at least quarterly and has defined responsibilities for the overall direction, supervision and control of the Bank, including assessment of the Bank’s competitive position, approval of strategic and financial plans and review of performance and financial status. It reviews and approves significant changes in the Bank’s structure and organisation and establishes the risk framework, overall risk appetite and key policies in relation to credit, large exposures, impairment, liquidity and operational risk. The Board also approves and monitors the Bank’s policies, procedures and processes in connection with the fight against financial crime.
Union Bank UK plc
Annual Report & Financial Statements
31st December 2016
- 14 -
DIRECTORS’ RESPONSIBILITIES AND CORPORATE GOVERNANCE
CONTINUED
The Board has three standing committees: the Risk & General Purposes Committee, the Establishment & Remuneration Committee (E&RC) and the Audit Committee. Each of these standing committees is chaired by an independent non-executive director, has written terms of reference and, with the exception of the Audit Committee, defined limits of authority. The R&GPC meets as often as required but at least quarterly, the Audit Committee and the E&RC meets quarterly.
The primary functions of the R&GPC is to consider credit proposals in excess of the limits of authority of the executive Assets & Liabilities and Credit Committees of the Bank, to review financial plans and actual performance against plan, to consider, and check the progress of major IT initiatives and to monitor compliance with the Bank’s credit, large exposure, impairment, liquidity and market risk policies and financial regulations generally.
The Audit Committee comprises solely non- executive directors and is chaired by a financially experienced individual. Meetings are attended by the Bank’s Associate Directors from Internal Audit and Compliance, by executive directors when requested and by the independent external auditors. The primary functions of the Audit Committee are to assist the Board in fulfilling its oversight responsibilities by monitoring and assessing the integrity of financial statements, the qualifications, independence and performance of external auditors, compliance with legal and regulatory requirements and the adequacy of systems of internal accounting and financial controls. Its assessment of the internal control environment is made by reviewing and approving the plans of Internal Audit and considering and questioning management on operational audit reports.
The Audit Committee also approves the appointment of, and fees paid to, the external auditors for all audit and non-
audit work. It is also responsible for the recruitment or removal of the heads of Internal Audit and Compliance and for
appraisal of the performance of those functions.
The E&RC has responsibility for considering matters related to human resource policy, including compensation arrangements. In particular, it reviews and recommends to the Board both overall compensation pools and the remuneration of executive directors and certain other members of senior management. It has responsibility also for certain matters relating to the infrastructure of the Bank, including premises, the working environment of staff and insurance arrangements.
Union Bank UK plc
Annual Report & Financial Statements
31st December 2016
- 15 -
INDEPENDENT AUDITOR’S REPORT TO THE MEMBERS OF THE UNION BANK UK PLC Independent Auditor’s Report to the Members of the Union Bank UK plc
We have audited the financial statements of Union Bank (UK) Plc for the year ended 31 December 2016 which
comprise the statement of financial position, the statement of comprehensive income, the statement of cash flows, the
statement of changes in equity and the related notes. The financial reporting framework that has been applied in their
preparation is applicable law International Financial Reporting Standards (IFRSs) as adopted by the European Union.
This report is made solely to the company’s members, as a body, in accordance with Chapter 3 of Part 16 of the
Companies Act 2006. Our audit work has been undertaken so that we might state to the company’s members those
matters we are required to state to them in an auditor’s report and for no other purpose. To the fullest extent permitted
by law, we do not accept or assume responsibility to anyone other than the company and the company’s members as a
body, for our audit work, for this report, or for the opinions we have formed.
Respective responsibilities of directors and auditors
As explained more fully in the statement of directors’ responsibilities, the directors are responsible for the preparation of
the financial statements and for being satisfied that they give a true and fair view. Our responsibility is to audit and
express an opinion on the financial statements in accordance with applicable law and International Standards on
Auditing (UK and Ireland). Those standards require us to comply with the Financial Reporting Council’s (FRC’s)
Ethical Standards for Auditors.
Scope of the audit of the financial statement
A description of the scope of an audit of financial statements is provided on the FRC’s website at
www.frc.org.uk/auditscopeukprivate.
Opinion on financial statements
In our opinion:
the financial statements give a true and fair view of the state of the company’s affairs as at 31 December 2016 and
of its profit for the year then ended;
the financial statements have been properly prepared in accordance with IFRSs as adopted by the European Union;
and
the financial statements have been prepared in accordance with the requirements of the Companies Act 2006.
Opinion on other matters prescribed by the Companies Act 2006
In our opinion, based on the work undertaken in the course of the audit:
the information given in the strategic report and directors’ report for the financial year 31 December 2016, for
which the financial statements are prepared is consistent with the financial statements; and
the strategic report and directors’ report have been prepared in accordance with applicable legal requirements.
Union Bank UK plc
Annual Report & Financial Statements
31st December 2016
- 16 -
Matters on which we are required to report by exception
In the light of the knowledge and understanding of the company and its environment obtained in the course of the audit,
we have not identified material misstatements in the strategic report or the directors’ report.
We have nothing to report in respect of the following matters where the Companies Act 2006 requires us to report to
you if, in our opinion:
adequate accounting records have not been kept, or returns adequate for our audit have not been received from
branches not visited by us; or
the financial statements are not in agreement with the accounting records and returns; or
certain disclosures of directors’ remuneration specified by law are not made; or
we have not received all the information and explanations we require for our audit.
BDO LLP is a limited liability partnership registered in England and Wales (with registered number OC305127)
Union Bank UK plc
Annual Report & Financial Statements
31st December 2016
- 17 -
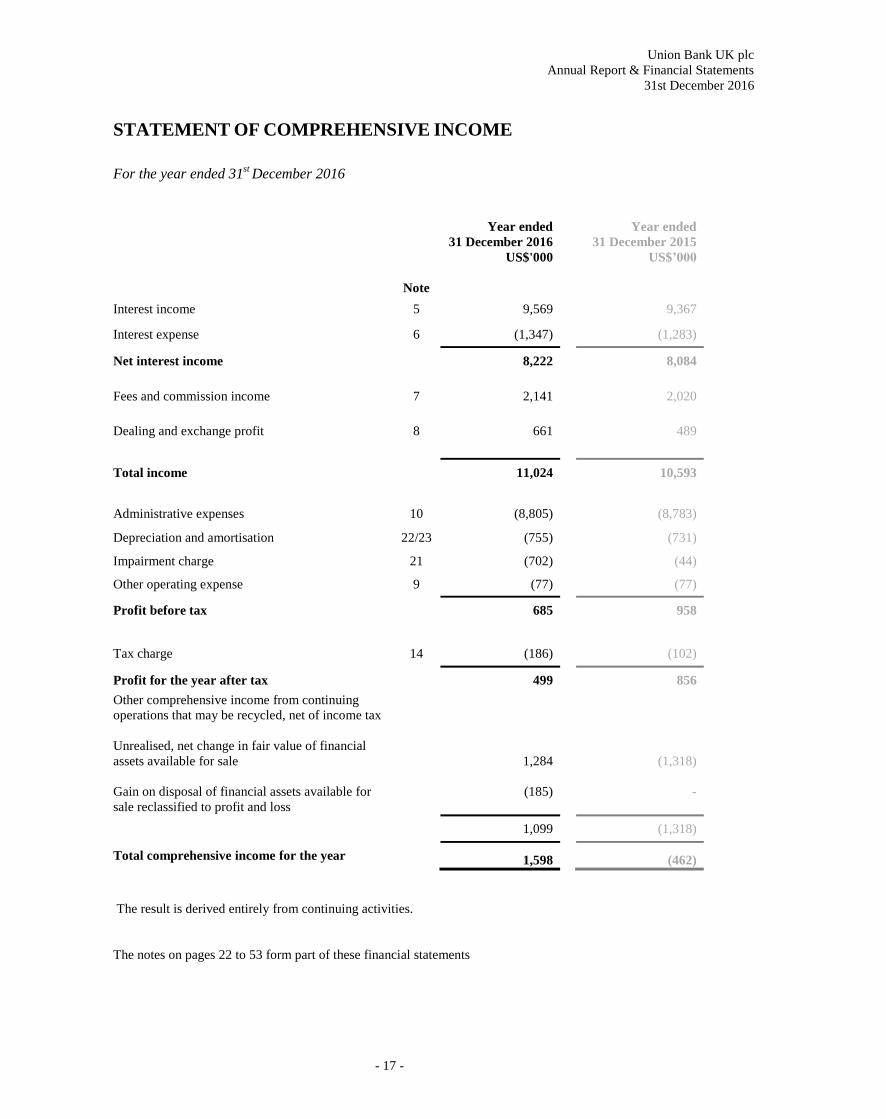
STATEMENT OF COMPREHENSIVE INCOME
For the year ended 31
st December 2016
Year ended Year ended
31 December 2016 31 December 2015
US$'000 US$’000
Note
Interest income 5 9,569 9,367
Interest expense 6 (1,347) (1,283)
Net interest income 8,222 8,084
Fees and commission income 7
2,141
2,020
Dealing and exchange profit 8 661 489
Total income 11,024 10,593
Administrative expenses 10 (8,805) (8,783)
Depreciation and amortisation 22/23 (755) (731)
Impairment charge 21 (702) (44)
Other operating expense 9 (77) (77)
Profit before tax 685 958
Tax charge 14 (186) (102)
Profit for the year after tax 499 856
Other comprehensive income from continuing
operations that may be recycled, net of income tax
Unrealised, net change in fair value of financial
assets available for sale
Gain on disposal of financial assets available for
sale reclassified to profit and loss
1,284
(185)
(1,318)
-
1,099 (1,318)
Total comprehensive income for the year 1,598 (462)
The result is derived entirely from continuing activities.
The notes on pages 22 to 53 form part of these financial statements
Union Bank UK plc
Annual Report & Financial Statements
31st December 2016
- 18 -
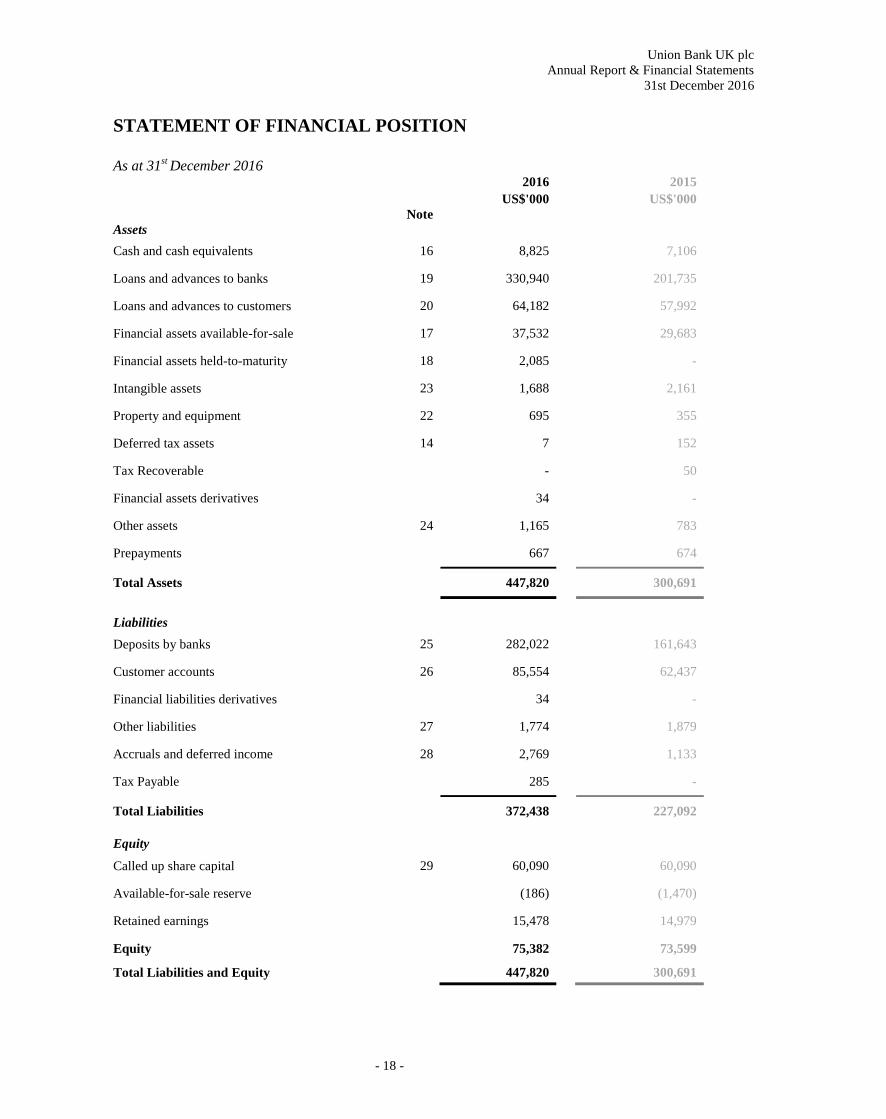
STATEMENT OF FINANCIAL POSITION
As at 31
st December 2016
2016 2015
US$'000 US$'000
Note
Assets
Cash and cash equivalents 16 8,825 7,106
Loans and advances to banks 19 330,940 201,735
Loans and advances to customers 20 64,182 57,992
Financial assets available-for-sale 17 37,532 29,683
Financial assets held-to-maturity 18 2,085 -
Intangible assets 23 1,688 2,161
Property and equipment 22 695 355
Deferred tax assets 14 7 152
Tax Recoverable - 50
Financial assets derivatives 34 -
Other assets 24 1,165 783
Prepayments 667 674
Total Assets 447,820 300,691
Liabilities
Deposits by banks 25 282,022 161,643
Customer accounts 26 85,554 62,437
Financial liabilities derivatives 34 -
Other liabilities 27 1,774 1,879
Accruals and deferred income 28 2,769 1,133
Tax Payable 285 -
Total Liabilities 372,438 227,092
Equity
Called up share capital 29 60,090 60,090
Available-for-sale reserve (186) (1,470)
Retained earnings 15,478 14,979
Equity 75,382 73,599
Total Liabilities and Equity 447,820 300,691

Union Bank UK plc
Annual Report & Financial Statements
31st December 2016
- 19 -
The financial statements were approved by the board of Directors and authorised for issue on 12
th May 2017.
Signed on behalf of the board of directors:
The notes on pages 22 to 53 form part of these financial statements
Union Bank UK plc
Annual Report & Financial Statements
31st December 2016
- 20 -
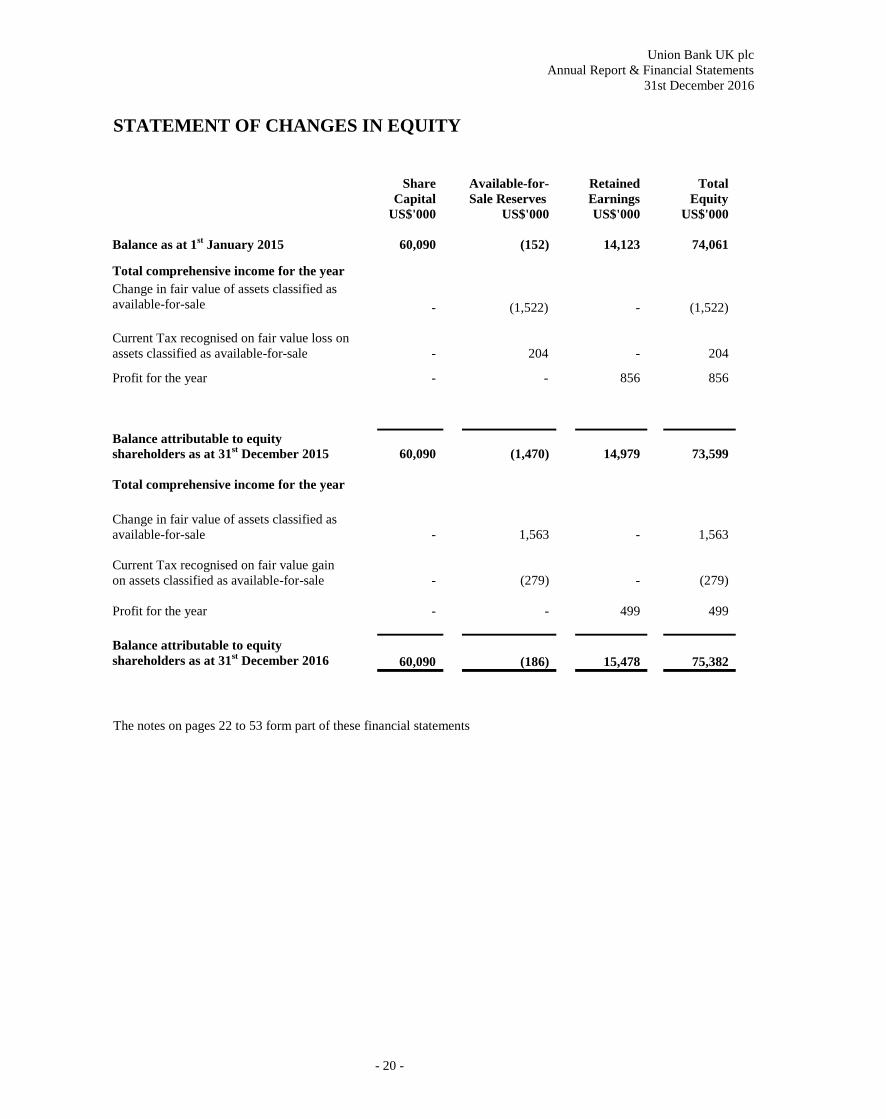
STATEMENT OF CHANGES IN EQUITY
Share
Capital
Available-for-
Sale Reserves
Retained
Earnings
Total
Equity
US$'000 US$'000 US$'000 US$'000
Balance as at 1st January 2015 60,090 (152) 14,123 74,061
Total comprehensive income for the year
Change in fair value of assets classified as
available-for-sale
-
(1,522)
-
(1,522)
Current Tax recognised on fair value loss on
assets classified as available-for-sale
-
204
-
204
Profit for the year - - 856 856
Balance attributable to equity
shareholders as at 31st December 2015
60,090 (1,470) 14,979
73,599
Total comprehensive income for the year
Change in fair value of assets classified as
available-for-sale
- 1,563 - 1,563
Current Tax recognised on fair value gain
on assets classified as available-for-sale
- (279) - (279)
Profit for the year
- -
499
499
Balance attributable to equity
shareholders as at 31st December 2016
60,090 (186) 15,478
75,382
The notes on pages 22 to 53 form part of these financial statements
Union Bank UK plc
Annual Report & Financial Statements
31st December 2016
- 21 -
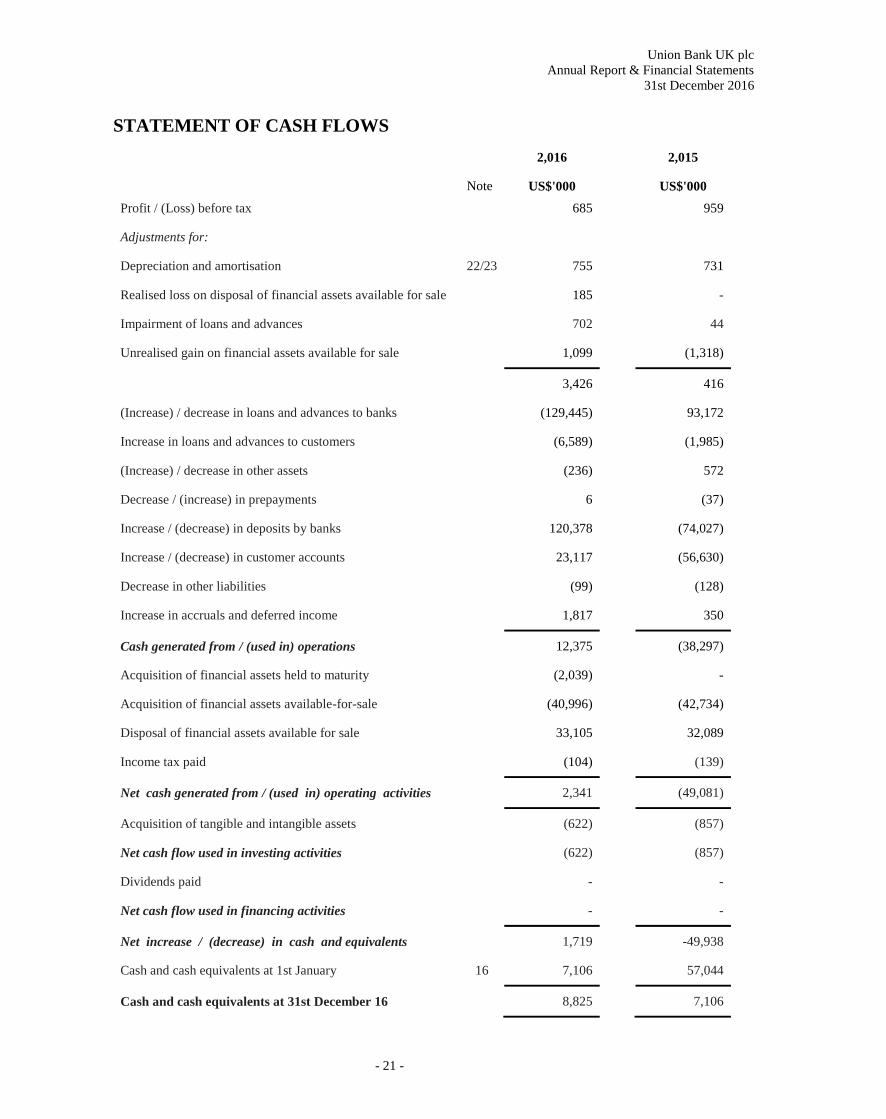
STATEMENT OF CASH FLOWS
2,016
2,015
Note US$'000
US$'000
Profit / (Loss) before tax
685
959
Adjustments for:
Depreciation and amortisation 22/23 755
731
Realised loss on disposal of financial assets available for sale
185
-
Impairment of loans and advances
702
44
Unrealised gain on financial assets available for sale
1,099
(1,318)
3,426
416
(Increase) / decrease in loans and advances to banks
(129,445)
93,172
Increase in loans and advances to customers
(6,589)
(1,985)
(Increase) / decrease in other assets
(236)
572
Decrease / (increase) in prepayments
6
(37)
Increase / (decrease) in deposits by banks
120,378
(74,027)
Increase / (decrease) in customer accounts
23,117
(56,630)
Decrease in other liabilities
(99)
(128)
Increase in accruals and deferred income
1,817
350
Cash generated from / (used in) operations
12,375
(38,297)
Acquisition of financial assets held to maturity (2,039) -
Acquisition of financial assets available-for-sale (40,996) (42,734)
Disposal of financial assets available for sale 33,105 32,089
Income tax paid
(104)
(139)
Net cash generated from / (used in) operating activities
2,341
(49,081)
Acquisition of tangible and intangible assets
(622)
(857)
Net cash flow used in investing activities
(622)
(857)
Dividends paid
-
-
Net cash flow used in financing activities
-
-
Net increase / (decrease) in cash and equivalents
1,719
-49,938
Cash and cash equivalents at 1st January 16 7,106
57,044
Cash and cash equivalents at 31st December 16
8,825
7,106
Union Bank UK plc
Annual Report & Financial Statements
31st December 2016
- 22 -
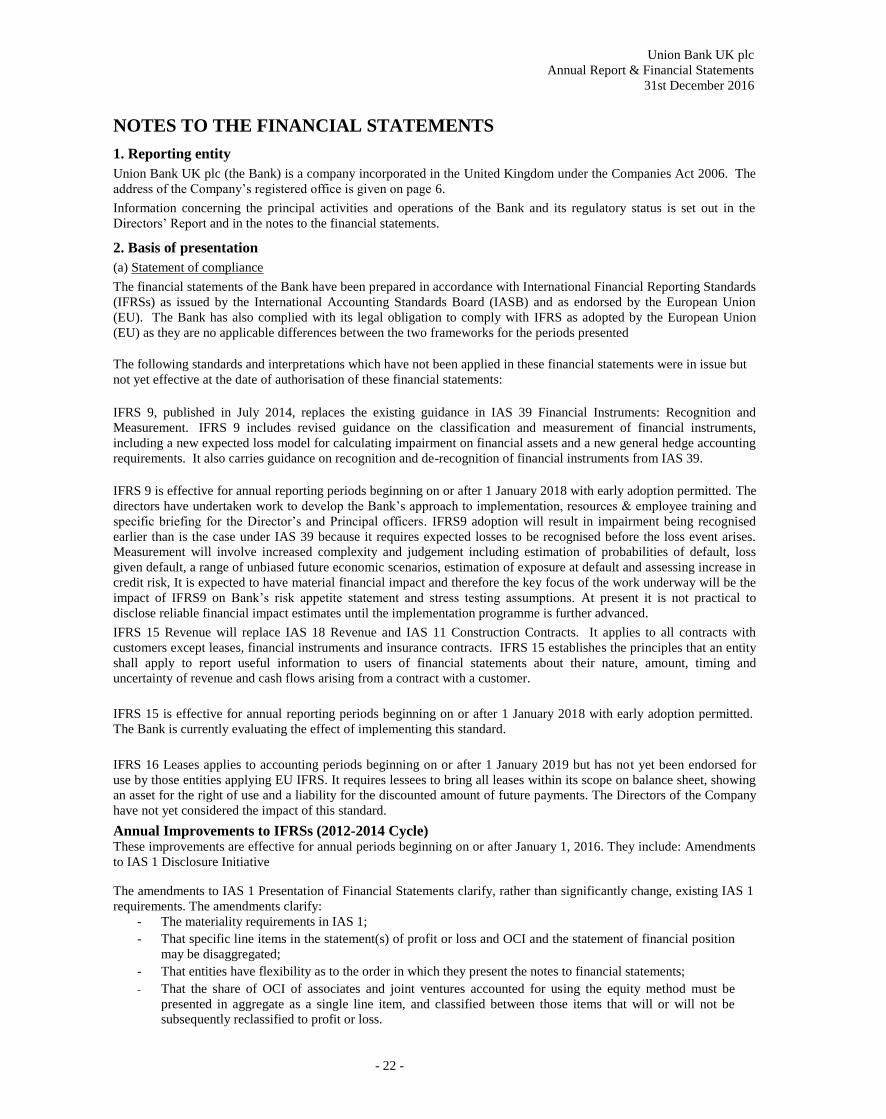
NOTES TO THE FINANCIAL STATEMENTS
1. Reporting entity
Union Bank UK plc (the Bank) is a company incorporated in the United Kingdom under the Companies Act 2006. The
address of the Company’s registered office is given on page 6.
Information concerning the principal activities and operations of the Bank and its regulatory status is set out in the
Directors’ Report and in the notes to the financial statements.
2. Basis of presentation
(a) Statement of compliance
The financial statements of the Bank have been prepared in accordance with International Financial Reporting Standards
(IFRSs) as issued by the International Accounting Standards Board (IASB) and as endorsed by the European Union
(EU). The Bank has also complied with its legal obligation to comply with IFRS as adopted by the European Union
(EU) as they are no applicable differences between the two frameworks for the periods presented
The following standards and interpretations which have not been applied in these financial statements were in issue but
not yet effective at the date of authorisation of these financial statements:
IFRS 9, published in July 2014, replaces the existing guidance in IAS 39 Financial Instruments: Recognition and
Measurement. IFRS 9 includes revised guidance on the classification and measurement of financial instruments,
including a new expected loss model for calculating impairment on financial assets and a new general hedge accounting
requirements. It also carries guidance on recognition and de-recognition of financial instruments from IAS 39.
IFRS 9 is effective for annual reporting periods beginning on or after 1 January 2018 with early adoption permitted. The
directors have undertaken work to develop the Bank’s approach to implementation, resources & employee training and
specific briefing for the Director’s and Principal officers. IFRS9 adoption will result in impairment being recognised
earlier than is the case under IAS 39 because it requires expected losses to be recognised before the loss event arises.
Measurement will involve increased complexity and judgement including estimation of probabilities of default, loss
given default, a range of unbiased future economic scenarios, estimation of exposure at default and assessing increase in
credit risk, It is expected to have material financial impact and therefore the key focus of the work underway will be the
impact of IFRS9 on Bank’s risk appetite statement and stress testing assumptions. At present it is not practical to
disclose reliable financial impact estimates until the implementation programme is further advanced.
IFRS 15 Revenue will replace IAS 18 Revenue and IAS 11 Construction Contracts. It applies to all contracts with
customers except leases, financial instruments and insurance contracts. IFRS 15 establishes the principles that an entity
shall apply to report useful information to users of financial statements about their nature, amount, timing and
uncertainty of revenue and cash flows arising from a contract with a customer.
IFRS 15 is effective for annual reporting periods beginning on or after 1 January 2018 with early adoption permitted.
The Bank is currently evaluating the effect of implementing this standard.
IFRS 16 Leases applies to accounting periods beginning on or after 1 January 2019 but has not yet been endorsed for
use by those entities applying EU IFRS. It requires lessees to bring all leases within its scope on balance sheet, showing
an asset for the right of use and a liability for the discounted amount of future payments. The Directors of the Company
have not yet considered the impact of this standard.
Annual Improvements to IFRSs (2012-2014 Cycle) These improvements are effective for annual periods beginning on or after January 1, 2016. They include: Amendments
to IAS 1 Disclosure Initiative
The amendments to IAS 1 Presentation of Financial Statements clarify, rather than significantly change, existing IAS 1
requirements. The amendments clarify:
- The materiality requirements in IAS 1;
- That specific line items in the statement(s) of profit or loss and OCI and the statement of financial position
may be disaggregated;
- That entities have flexibility as to the order in which they present the notes to financial statements;
- That the share of OCI of associates and joint ventures accounted for using the equity method must be
presented in aggregate as a single line item, and classified between those items that will or will not be
subsequently reclassified to profit or loss.
Union Bank UK plc
Annual Report & Financial Statements
31st December 2016
- 23 -
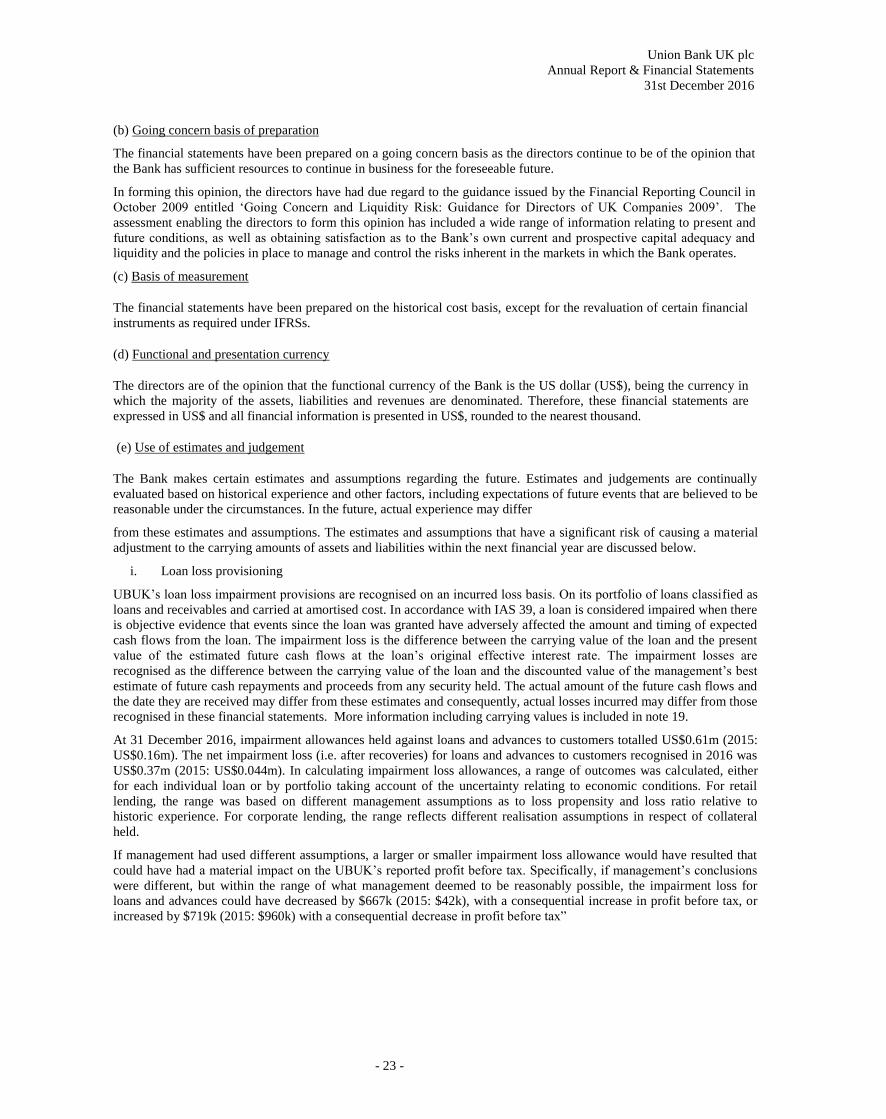
(b) Going concern basis of preparation
The financial statements have been prepared on a going concern basis as the directors continue to be of the opinion that
the Bank has sufficient resources to continue in business for the foreseeable future.
In forming this opinion, the directors have had due regard to the guidance issued by the Financial Reporting Council in
October 2009 entitled ‘Going Concern and Liquidity Risk: Guidance for Directors of UK Companies 2009’. The
assessment enabling the directors to form this opinion has included a wide range of information relating to present and
future conditions, as well as obtaining satisfaction as to the Bank’s own current and prospective capital adequacy and
liquidity and the policies in place to manage and control the risks inherent in the markets in which the Bank operates.
(c) Basis of measurement
The financial statements have been prepared on the historical cost basis, except for the revaluation of certain financial
instruments as required under IFRSs.
(d) Functional and presentation currency
The directors are of the opinion that the functional currency of the Bank is the US dollar (US$), being the currency in
which the majority of the assets, liabilities and revenues are denominated. Therefore, these financial statements are
expressed in US$ and all financial information is presented in US$, rounded to the nearest thousand.
(e) Use of estimates and judgement
The Bank makes certain estimates and assumptions regarding the future. Estimates and judgements are continually
evaluated based on historical experience and other factors, including expectations of future events that are believed to be
reasonable under the circumstances. In the future, actual experience may differ
from these estimates and assumptions. The estimates and assumptions that have a significant risk of causing a material
adjustment to the carrying amounts of assets and liabilities within the next financial year are discussed below.
i. Loan loss provisioning
UBUK’s loan loss impairment provisions are recognised on an incurred loss basis. On its portfolio of loans classified as
loans and receivables and carried at amortised cost. In accordance with IAS 39, a loan is considered impaired when there
is objective evidence that events since the loan was granted have adversely affected the amount and timing of expected
cash flows from the loan. The impairment loss is the difference between the carrying value of the loan and the present
value of the estimated future cash flows at the loan’s original effective interest rate. The impairment losses are
recognised as the difference between the carrying value of the loan and the discounted value of the management’s best
estimate of future cash repayments and proceeds from any security held. The actual amount of the future cash flows and
the date they are received may differ from these estimates and consequently, actual losses incurred may differ from those
recognised in these financial statements. More information including carrying values is included in note 19.
At 31 December 2016, impairment allowances held against loans and advances to customers totalled US$0.61m (2015:
US$0.16m). The net impairment loss (i.e. after recoveries) for loans and advances to customers recognised in 2016 was
US$0.37m (2015: US$0.044m). In calculating impairment loss allowances, a range of outcomes was calculated, either
for each individual loan or by portfolio taking account of the uncertainty relating to economic conditions. For retail
lending, the range was based on different management assumptions as to loss propensity and loss ratio relative to
historic experience. For corporate lending, the range reflects different realisation assumptions in respect of collateral
held.
If management had used different assumptions, a larger or smaller impairment loss allowance would have resulted that
could have had a material impact on the UBUK’s reported profit before tax. Specifically, if management’s conclusions
were different, but within the range of what management deemed to be reasonably possible, the impairment loss for
loans and advances could have decreased by $667k (2015: $42k), with a consequential increase in profit before tax, or
increased by $719k (2015: $960k) with a consequential decrease in profit before tax”
Union Bank UK plc
Annual Report & Financial Statements
31st December 2016
- 24 -
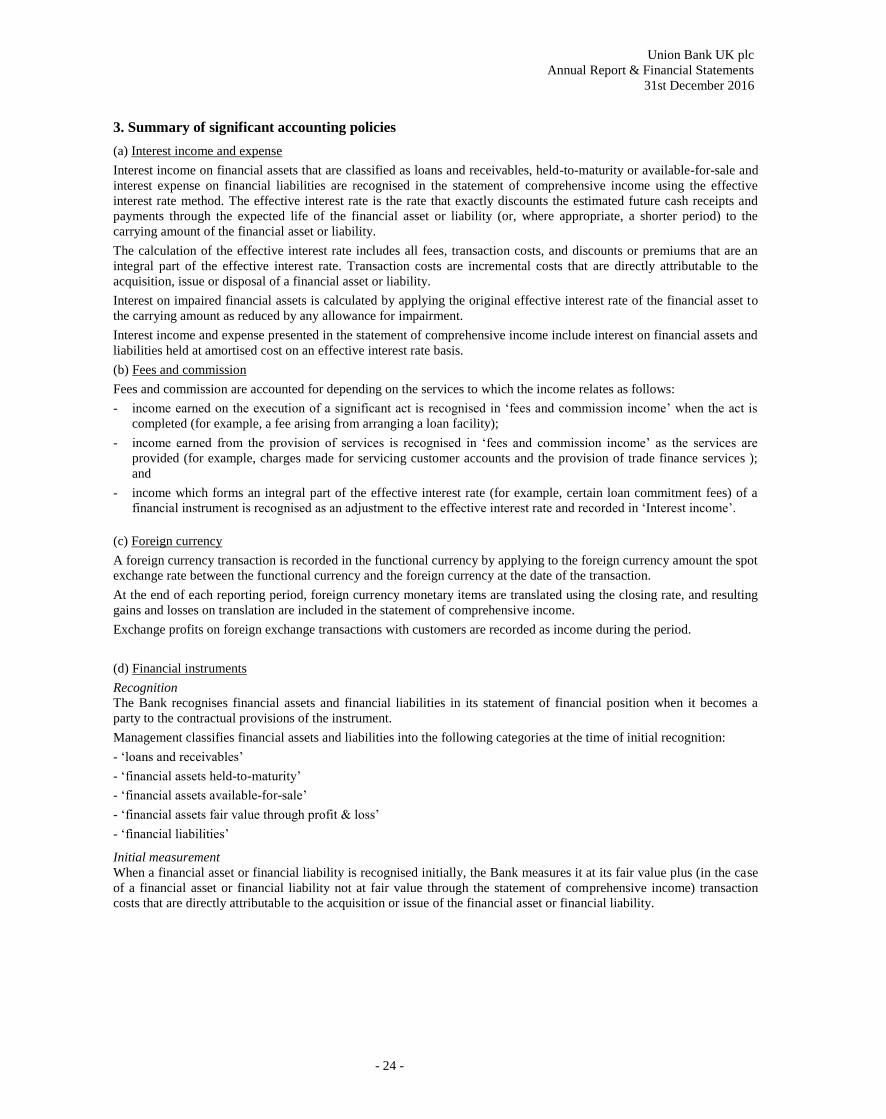
3. Summary of significant accounting policies
(a) Interest income and expense
Interest income on financial assets that are classified as loans and receivables, held-to-maturity or available-for-sale and
interest expense on financial liabilities are recognised in the statement of comprehensive income using the effective
interest rate method. The effective interest rate is the rate that exactly discounts the estimated future cash receipts and
payments through the expected life of the financial asset or liability (or, where appropriate, a shorter period) to the
carrying amount of the financial asset or liability.
The calculation of the effective interest rate includes all fees, transaction costs, and discounts or premiums that are an
integral part of the effective interest rate. Transaction costs are incremental costs that are directly attributable to the
acquisition, issue or disposal of a financial asset or liability.
Interest on impaired financial assets is calculated by applying the original effective interest rate of the financial asset to
the carrying amount as reduced by any allowance for impairment.
Interest income and expense presented in the statement of comprehensive income include interest on financial assets and
liabilities held at amortised cost on an effective interest rate basis.
(b) Fees and commission
Fees and commission are accounted for depending on the services to which the income relates as follows:
- income earned on the execution of a significant act is recognised in ‘fees and commission income’ when the act is
completed (for example, a fee arising from arranging a loan facility);
- income earned from the provision of services is recognised in ‘fees and commission income’ as the services are
provided (for example, charges made for servicing customer accounts and the provision of trade finance services );
and
- income which forms an integral part of the effective interest rate (for example, certain loan commitment fees) of a
financial instrument is recognised as an adjustment to the effective interest rate and recorded in ‘Interest income’.
(c) Foreign currency
A foreign currency transaction is recorded in the functional currency by applying to the foreign currency amount the spot
exchange rate between the functional currency and the foreign currency at the date of the transaction.
At the end of each reporting period, foreign currency monetary items are translated using the closing rate, and resulting
gains and losses on translation are included in the statement of comprehensive income.
Exchange profits on foreign exchange transactions with customers are recorded as income during the period.
(d) Financial instruments
Recognition
The Bank recognises financial assets and financial liabilities in its statement of financial position when it becomes a
party to the contractual provisions of the instrument.
Management classifies financial assets and liabilities into the following categories at the time of initial recognition:
- ‘loans and receivables’
- ‘financial assets held-to-maturity’
- ‘financial assets available-for-sale’
- ‘financial assets fair value through profit & loss’
- ‘financial liabilities’
Initial measurement
When a financial asset or financial liability is recognised initially, the Bank measures it at its fair value plus (in the case
of a financial asset or financial liability not at fair value through the statement of comprehensive income) transaction
costs that are directly attributable to the acquisition or issue of the financial asset or financial liability.
Union Bank UK plc
Annual Report & Financial Statements
31st December 2016
- 25 -
3. Summary of significant accounting policies (continued)
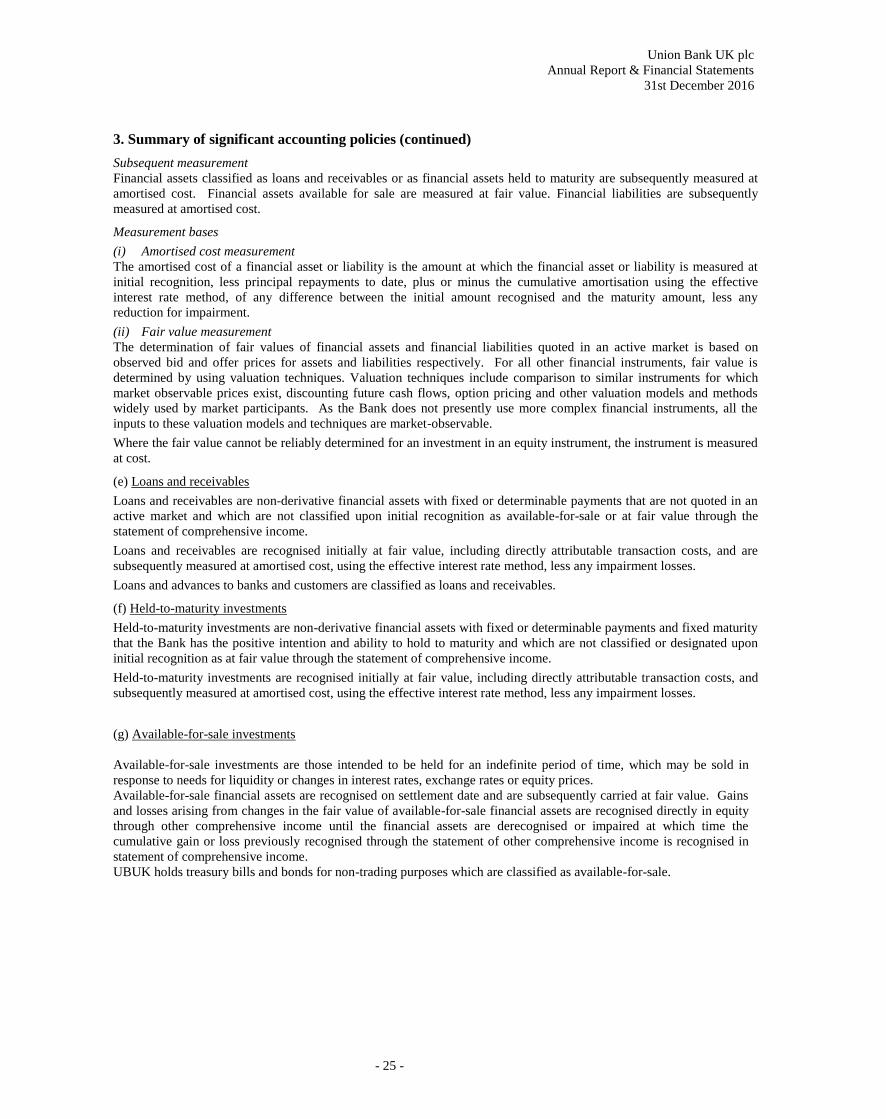
Subsequent measurement
Financial assets classified as loans and receivables or as financial assets held to maturity are subsequently measured at
amortised cost. Financial assets available for sale are measured at fair value. Financial liabilities are subsequently
measured at amortised cost.
Measurement bases
(i) Amortised cost measurement
The amortised cost of a financial asset or liability is the amount at which the financial asset or liability is measured at
initial recognition, less principal repayments to date, plus or minus the cumulative amortisation using the effective
interest rate method, of any difference between the initial amount recognised and the maturity amount, less any
reduction for impairment.
(ii) Fair value measurement
The determination of fair values of financial assets and financial liabilities quoted in an active market is based on
observed bid and offer prices for assets and liabilities respectively. For all other financial instruments, fair value is
determined by using valuation techniques. Valuation techniques include comparison to similar instruments for which
market observable prices exist, discounting future cash flows, option pricing and other valuation models and methods
widely used by market participants. As the Bank does not presently use more complex financial instruments, all the
inputs to these valuation models and techniques are market-observable.
Where the fair value cannot be reliably determined for an investment in an equity instrument, the instrument is measured
at cost.
(e) Loans and receivables
Loans and receivables are non-derivative financial assets with fixed or determinable payments that are not quoted in an
active market and which are not classified upon initial recognition as available-for-sale or at fair value through the
statement of comprehensive income.
Loans and receivables are recognised initially at fair value, including directly attributable transaction costs, and are
subsequently measured at amortised cost, using the effective interest rate method, less any impairment losses.
Loans and advances to banks and customers are classified as loans and receivables.
(f) Held-to-maturity investments
Held-to-maturity investments are non-derivative financial assets with fixed or determinable payments and fixed maturity
that the Bank has the positive intention and ability to hold to maturity and which are not classified or designated upon
initial recognition as at fair value through the statement of comprehensive income.
Held-to-maturity investments are recognised initially at fair value, including directly attributable transaction costs, and
subsequently measured at amortised cost, using the effective interest rate method, less any impairment losses.
(g) Available-for-sale investments
Available-for-sale investments are those intended to be held for an indefinite period of time, which may be sold in
response to needs for liquidity or changes in interest rates, exchange rates or equity prices.
Available-for-sale financial assets are recognised on settlement date and are subsequently carried at fair value. Gains
and losses arising from changes in the fair value of available-for-sale financial assets are recognised directly in equity
through other comprehensive income until the financial assets are derecognised or impaired at which time the
cumulative gain or loss previously recognised through the statement of other comprehensive income is recognised in
statement of comprehensive income.
UBUK holds treasury bills and bonds for non-trading purposes which are classified as available-for-sale.
Union Bank UK plc
Annual Report & Financial Statements
31st December 2016
- 26 -
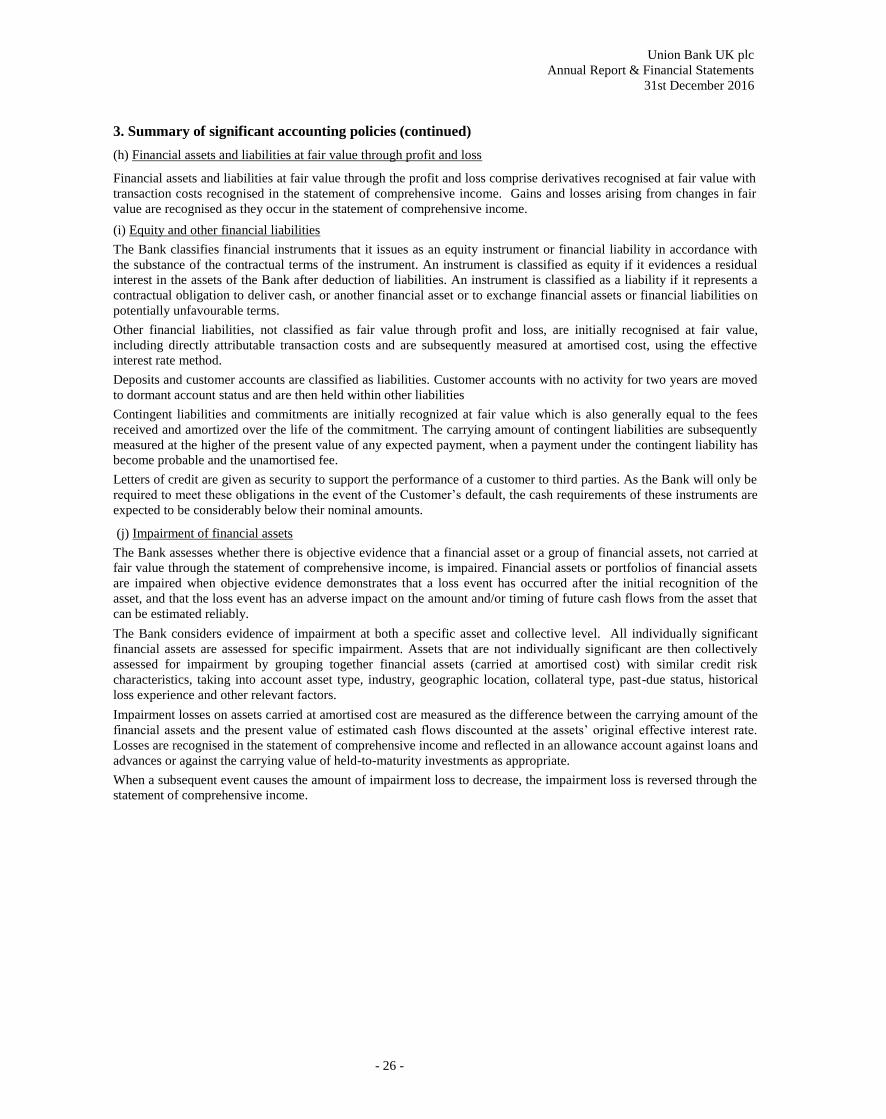
3. Summary of significant accounting policies (continued)
(h) Financial assets and liabilities at fair value through profit and loss
Financial assets and liabilities at fair value through the profit and loss comprise derivatives recognised at fair value with
transaction costs recognised in the statement of comprehensive income. Gains and losses arising from changes in fair
value are recognised as they occur in the statement of comprehensive income.
(i) Equity and other financial liabilities
The Bank classifies financial instruments that it issues as an equity instrument or financial liability in accordance with
the substance of the contractual terms of the instrument. An instrument is classified as equity if it evidences a residual
interest in the assets of the Bank after deduction of liabilities. An instrument is classified as a liability if it represents a
contractual obligation to deliver cash, or another financial asset or to exchange financial assets or financial liabilities on
potentially unfavourable terms.
Other financial liabilities, not classified as fair value through profit and loss, are initially recognised at fair value,
including directly attributable transaction costs and are subsequently measured at amortised cost, using the effective
interest rate method.
Deposits and customer accounts are classified as liabilities. Customer accounts with no activity for two years are moved
to dormant account status and are then held within other liabilities
Contingent liabilities and commitments are initially recognized at fair value which is also generally equal to the fees
received and amortized over the life of the commitment. The carrying amount of contingent liabilities are subsequently
measured at the higher of the present value of any expected payment, when a payment under the contingent liability has
become probable and the unamortised fee.
Letters of credit are given as security to support the performance of a customer to third parties. As the Bank will only be
required to meet these obligations in the event of the Customer’s default, the cash requirements of these instruments are
expected to be considerably below their nominal amounts.
(j) Impairment of financial assets
The Bank assesses whether there is objective evidence that a financial asset or a group of financial assets, not carried at
fair value through the statement of comprehensive income, is impaired. Financial assets or portfolios of financial assets
are impaired when objective evidence demonstrates that a loss event has occurred after the initial recognition of the
asset, and that the loss event has an adverse impact on the amount and/or timing of future cash flows from the asset that
can be estimated reliably.
The Bank considers evidence of impairment at both a specific asset and collective level. All individually significant
financial assets are assessed for specific impairment. Assets that are not individually significant are then collectively
assessed for impairment by grouping together financial assets (carried at amortised cost) with similar credit risk
characteristics, taking into account asset type, industry, geographic location, collateral type, past-due status, historical
loss experience and other relevant factors.
Impairment losses on assets carried at amortised cost are measured as the difference between the carrying amount of the
financial assets and the present value of estimated cash flows discounted at the assets’ original effective interest rate.
Losses are recognised in the statement of comprehensive income and reflected in an allowance account against loans and
advances or against the carrying value of held-to-maturity investments as appropriate.
When a subsequent event causes the amount of impairment loss to decrease, the impairment loss is reversed through the
statement of comprehensive income.
Union Bank UK plc
Annual Report & Financial Statements
31st December 2016
- 27 -
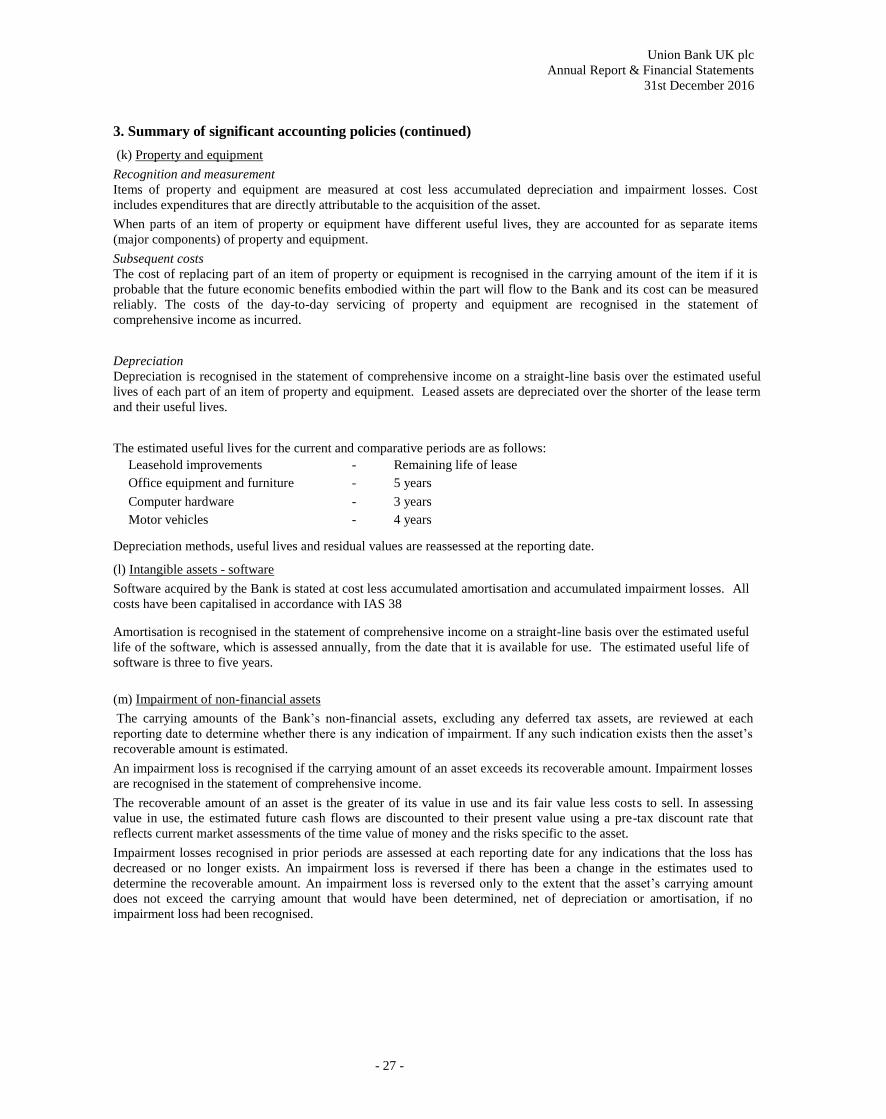
3. Summary of significant accounting policies (continued)
(k) Property and equipment
Recognition and measurement
Items of property and equipment are measured at cost less accumulated depreciation and impairment losses. Cost
includes expenditures that are directly attributable to the acquisition of the asset.
When parts of an item of property or equipment have different useful lives, they are accounted for as separate items
(major components) of property and equipment.
Subsequent costs
The cost of replacing part of an item of property or equipment is recognised in the carrying amount of the item if it is
probable that the future economic benefits embodied within the part will flow to the Bank and its cost can be measured
reliably. The costs of the day-to-day servicing of property and equipment are recognised in the statement of
comprehensive income as incurred.
Depreciation
Depreciation is recognised in the statement of comprehensive income on a straight-line basis over the estimated useful
lives of each part of an item of property and equipment. Leased assets are depreciated over the shorter of the lease term
and their useful lives.
The estimated useful lives for the current and comparative periods are as follows:
Leasehold improvements - Remaining life of lease
Office equipment and furniture - 5 years
Computer hardware - 3 years
Motor vehicles - 4 years
Depreciation methods, useful lives and residual values are reassessed at the reporting date.
(l) Intangible assets - software
Software acquired by the Bank is stated at cost less accumulated amortisation and accumulated impairment losses. All
costs have been capitalised in accordance with IAS 38
Amortisation is recognised in the statement of comprehensive income on a straight-line basis over the estimated useful
life of the software, which is assessed annually, from the date that it is available for use. The estimated useful life of
software is three to five years.
(m) Impairment of non-financial assets
The carrying amounts of the Bank’s non-financial assets, excluding any deferred tax assets, are reviewed at each
reporting date to determine whether there is any indication of impairment. If any such indication exists then the asset’s
recoverable amount is estimated.
An impairment loss is recognised if the carrying amount of an asset exceeds its recoverable amount. Impairment losses
are recognised in the statement of comprehensive income.
The recoverable amount of an asset is the greater of its value in use and its fair value less costs to sell. In assessing
value in use, the estimated future cash flows are discounted to their present value using a pre-tax discount rate that
reflects current market assessments of the time value of money and the risks specific to the asset.
Impairment losses recognised in prior periods are assessed at each reporting date for any indications that the loss has
decreased or no longer exists. An impairment loss is reversed if there has been a change in the estimates used to
determine the recoverable amount. An impairment loss is reversed only to the extent that the asset’s carrying amount
does not exceed the carrying amount that would have been determined, net of depreciation or amortisation, if no
impairment loss had been recognised.
Union Bank UK plc
Annual Report & Financial Statements
31st December 2016
- 28 -
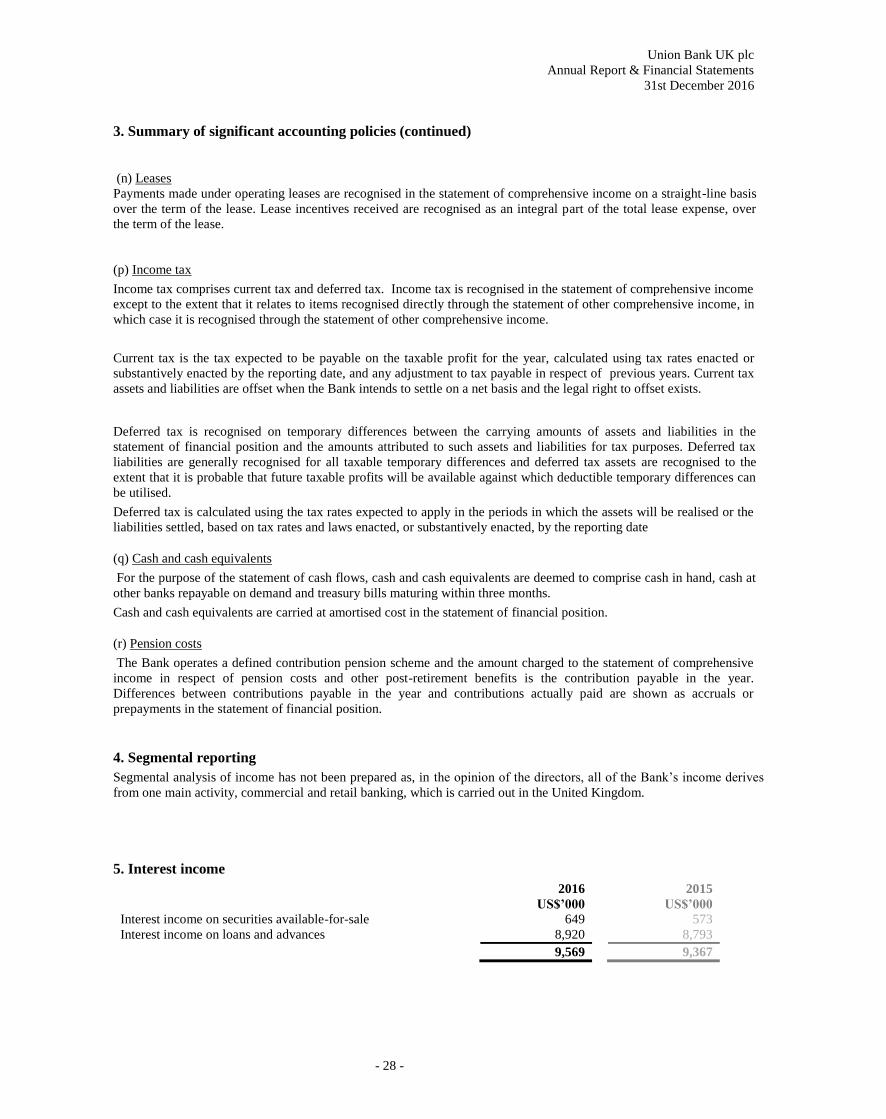
3. Summary of significant accounting policies (continued)
(n) Leases
Payments made under operating leases are recognised in the statement of comprehensive income on a straight-line basis
over the term of the lease. Lease incentives received are recognised as an integral part of the total lease expense, over
the term of the lease.
(p) Income tax
Income tax comprises current tax and deferred tax. Income tax is recognised in the statement of comprehensive income
except to the extent that it relates to items recognised directly through the statement of other comprehensive income, in
which case it is recognised through the statement of other comprehensive income.
Current tax is the tax expected to be payable on the taxable profit for the year, calculated using tax rates enacted or
substantively enacted by the reporting date, and any adjustment to tax payable in respect of previous years. Current tax
assets and liabilities are offset when the Bank intends to settle on a net basis and the legal right to offset exists.
Deferred tax is recognised on temporary differences between the carrying amounts of assets and liabilities in the
statement of financial position and the amounts attributed to such assets and liabilities for tax purposes. Deferred tax
liabilities are generally recognised for all taxable temporary differences and deferred tax assets are recognised to the
extent that it is probable that future taxable profits will be available against which deductible temporary differences can
be utilised.
Deferred tax is calculated using the tax rates expected to apply in the periods in which the assets will be realised or the
liabilities settled, based on tax rates and laws enacted, or substantively enacted, by the reporting date
(q) Cash and cash equivalents
For the purpose of the statement of cash flows, cash and cash equivalents are deemed to comprise cash in hand, cash at
other banks repayable on demand and treasury bills maturing within three months.
Cash and cash equivalents are carried at amortised cost in the statement of financial position.
(r) Pension costs
The Bank operates a defined contribution pension scheme and the amount charged to the statement of comprehensive
income in respect of pension costs and other post-retirement benefits is the contribution payable in the year.
Differences between contributions payable in the year and contributions actually paid are shown as accruals or
prepayments in the statement of financial position.
4. Segmental reporting
Segmental analysis of income has not been prepared as, in the opinion of the directors, all of the Bank’s income derives
from one main activity, commercial and retail banking, which is carried out in the United Kingdom.
5. Interest income
2016 2015
US$’000 US$’000 Interest income on securities available-for-sale 649 573
Interest income on loans and advances 8,920 8,793
9,569 9,367
Union Bank UK plc
Annual Report & Financial Statements
31st December 2016
- 29 -
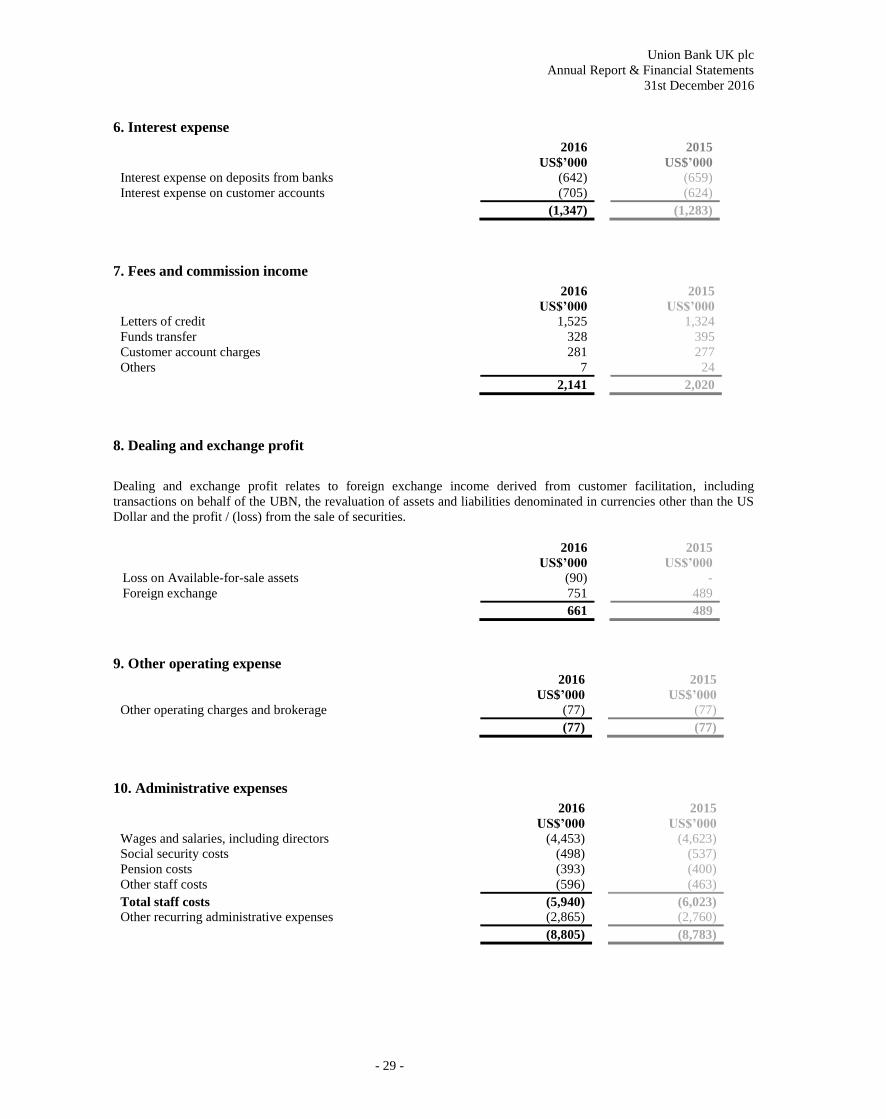
6. Interest expense
2016 2015
US$’000 US$’000 Interest expense on deposits from banks (642) (659)
Interest expense on customer accounts (705) (624)
(1,347) (1,283)
7. Fees and commission income
2016 2015
US$’000 US$’000
Letters of credit 1,525 1,324
Funds transfer 328 395
Customer account charges 281 277
Others 7 24
2,141 2,020
8. Dealing and exchange profit
Dealing and exchange profit relates to foreign exchange income derived from customer facilitation, including
transactions on behalf of the UBN, the revaluation of assets and liabilities denominated in currencies other than the US
Dollar and the profit / (loss) from the sale of securities.
2016 2015
US$’000 US$’000
Loss on Available-for-sale assets (90) -
Foreign exchange 751 489
661 489
9. Other operating expense 2016 2015
US$’000 US$’000 Other operating charges and brokerage (77) (77)
(77) (77)
10. Administrative expenses
2016 2015
US$’000 US$’000
Wages and salaries, including directors (4,453) (4,623)
Social security costs (498) (537)
Pension costs (393) (400)
Other staff costs (596) (463)
Total staff costs (5,940) (6,023)
Other recurring administrative expenses (2,865) (2,760)
(8,805) (8,783)
Union Bank UK plc
Annual Report & Financial Statements
31st December 2016
- 30 -
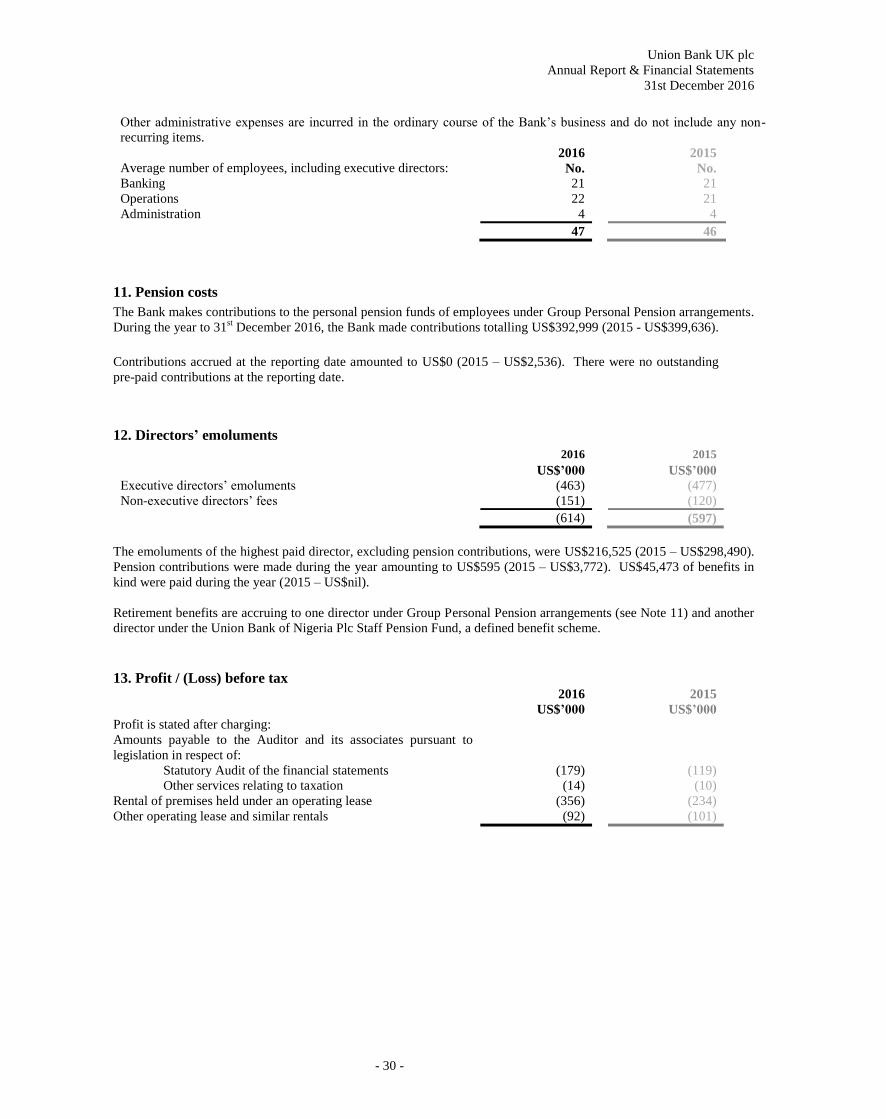
Other administrative expenses are incurred in the ordinary course of the Bank’s business and do not include any non-
recurring items.
2016 2015
Average number of employees, including executive directors: No. No.
Banking 21 21
Operations 22 21
Administration 4 4
47 46
11. Pension costs
The Bank makes contributions to the personal pension funds of employees under Group Personal Pension arrangements.
During the year to 31st December 2016, the Bank made contributions totalling US$392,999 (2015 - US$399,636).
Contributions accrued at the reporting date amounted to US$0 (2015 – US$2,536). There were no outstanding
pre-paid contributions at the reporting date.
12. Directors’ emoluments
2016 2015
US$’000 US$’000 Executive directors’ emoluments (463) (477)
Non-executive directors’ fees (151) (120)
(614) (597)
The emoluments of the highest paid director, excluding pension contributions, were US$216,525 (2015 – US$298,490).
Pension contributions were made during the year amounting to US$595 (2015 – US$3,772). US$45,473 of benefits in
kind were paid during the year (2015 – US$nil).
Retirement benefits are accruing to one director under Group Personal Pension arrangements (see Note 11) and another
director under the Union Bank of Nigeria Plc Staff Pension Fund, a defined benefit scheme.
13. Profit / (Loss) before tax 2016 2015
US$’000 US$’000 Profit is stated after charging:
Amounts payable to the Auditor and its associates pursuant to
legislation in respect of:
Statutory Audit of the financial statements (179) (119)
Other services relating to taxation (14) (10)
Rental of premises held under an operating lease (356) (234)
Other operating lease and similar rentals (92) (101)
Union Bank UK plc
Annual Report & Financial Statements
31st December 2016
- 31 -
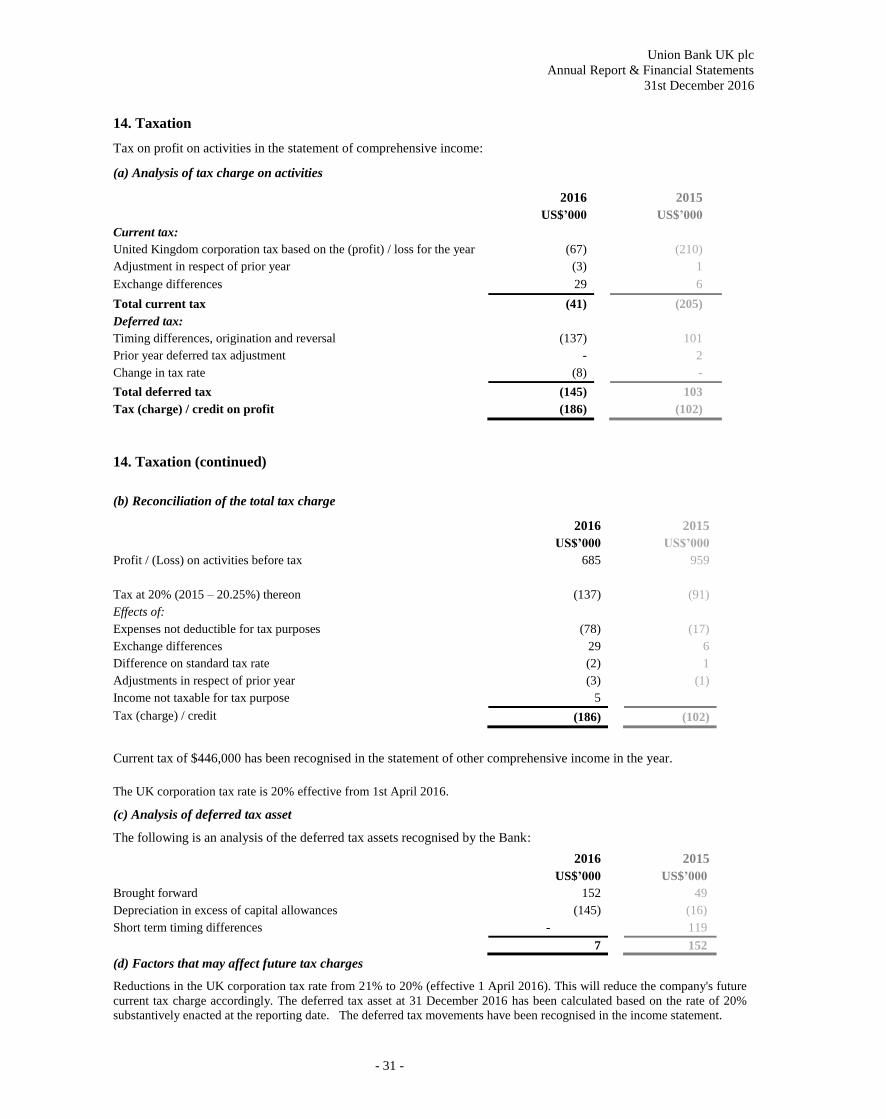
14. Taxation
Tax on profit on activities in the statement of comprehensive income:
(a) Analysis of tax charge on activities
2016 2015
US$’000 US$’000
Current tax:
United Kingdom corporation tax based on the (profit) / loss for the year (67) (210)
Adjustment in respect of prior year (3) 1
Exchange differences 29 6
Total current tax (41) (205)
Deferred tax:
Timing differences, origination and reversal (137) 101
Prior year deferred tax adjustment - 2
Change in tax rate (8) -
Total deferred tax (145) 103
Tax (charge) / credit on profit (186) (102)
14. Taxation (continued)
(b) Reconciliation of the total tax charge
2016 2015
US$’000 US$’000
Profit / (Loss) on activities before tax 685 959
Tax at 20% (2015 – 20.25%) thereon (137) (91)
Effects of:
Expenses not deductible for tax purposes (78) (17)
Exchange differences 29 6
Difference on standard tax rate (2) 1
Adjustments in respect of prior year (3) (1)
Income not taxable for tax purpose 5
Tax (charge) / credit (186) (102)
Current tax of $446,000 has been recognised in the statement of other comprehensive income in the year.
The UK corporation tax rate is 20% effective from 1st April 2016.
(c) Analysis of deferred tax asset
The following is an analysis of the deferred tax assets recognised by the Bank:
2016 2015
US$’000 US$’000
Brought forward 152 49
Depreciation in excess of capital allowances (145) (16)
Short term timing differences - 119
7 152
(d) Factors that may affect future tax charges
Reductions in the UK corporation tax rate from 21% to 20% (effective 1 April 2016). This will reduce the company's future
current tax charge accordingly. The deferred tax asset at 31 December 2016 has been calculated based on the rate of 20%
substantively enacted at the reporting date. The deferred tax movements have been recognised in the income statement.
Union Bank UK plc
Annual Report & Financial Statements
31st December 2016
- 32 -
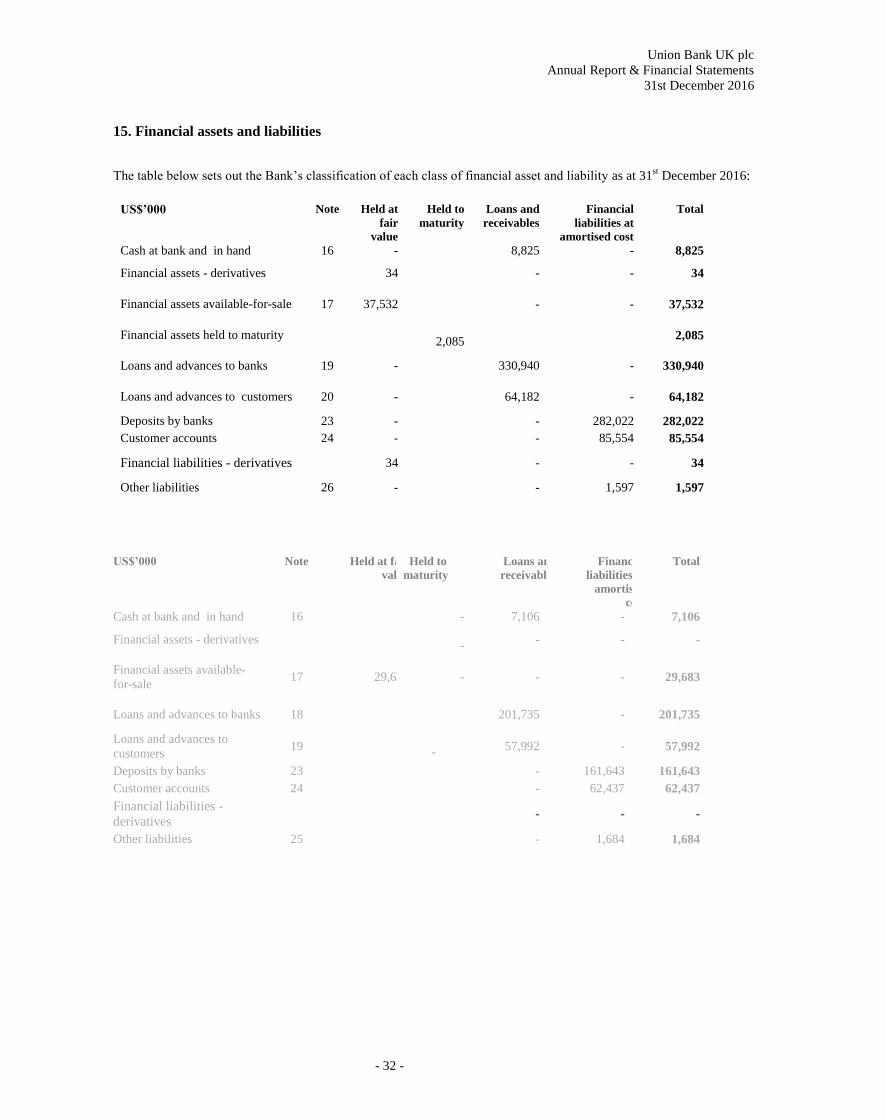
15. Financial assets and liabilities
The table below sets out the Bank’s classification of each class of financial asset and liability as at 31st December 2016:
US$’000 Note Held at
fair
value
Held to
maturity
Loans and
receivables
Financial
liabilities at
amortised cost
Total
Cash at bank and in hand 16 - 8,825 - 8,825
Financial assets - derivatives 34
- - 34
Financial assets available-for-sale 17 37,532
- - 37,532
Financial assets held to maturity
2,085 2,085
Loans and advances to banks 19 -
330,940 - 330,940
Loans and advances to customers 20 -
64,182 - 64,182
Deposits by banks 23 - - 282,022 282,022
Customer accounts 24 - - 85,554 85,554
Financial liabilities - derivatives 34
- - 34
Other liabilities 26 - - 1,597 1,597
US$’000 Note Held at fair
value
Held to
maturity
Loans and
receivables
Financial
liabilities at
amortised
cost
Total
Cash at bank and in hand 16 - - 7,106 - 7,106
Financial assets - derivatives -
- - - -
Financial assets available-
for-sale 17 29,683
-
- - 29,683
Loans and advances to banks 18 -
201,735 - 201,735
Loans and advances to
customers 19 -
- 57,992 - 57,992
Deposits by banks 23 - - 161,643 161,643
Customer accounts 24 - - 62,437 62,437
Financial liabilities -
derivatives -
- - -
Other liabilities 25 - - 1,684 1,684

Union Bank UK plc
Annual Report & Financial Statements
31st December 2016
- 33 -
16. Cash at bank and in hand
2016 2015
US$’000 US$’000
Cash 85 154
Short term placements with other banks 8,740 6,952
8,825 7,106
Cash is classified as a level 1 instrument.
17. Financial assets available-for-sale 2016 2015
US$’000 US$’000
Financial assets available-for-sale at fair value
Treasury bills 30,631 22,153
Government bonds 6,901 5,522
Bank bonds - 2,008
37,532 29,683
Interest included in above
Government bonds 113 113
Maturity
- 3 months or less
14,984
3,684
- 1 year or less but over 3 months 15,647 18,469
- 5 years or less but over 1 year - 2,008
- Over 5 years 6,901 5,522
37,532 29,683
All amounts included above relate to interest on treasury bills and bonds.
The Bank measures fair values using the fair value hierarchy that reflects the significance of inputs used in making the
measurements. The financial assets of the Bank fall within the category of Level 1 where valuation is based upon quoted
prices in an active market for the same or identical instrument. Unrealised Profit of US$1,099,102 (2015 – Unrealised loss of
US$(1,318,100) have been recognised in the Statement of Comprehensive Income. Financial assets available-for-sale
purchased and sold amounted to US$40,996,000 (2015 - US$42,734,000) and US$33,105,000 (2015 – US$32,089,000)
respectively
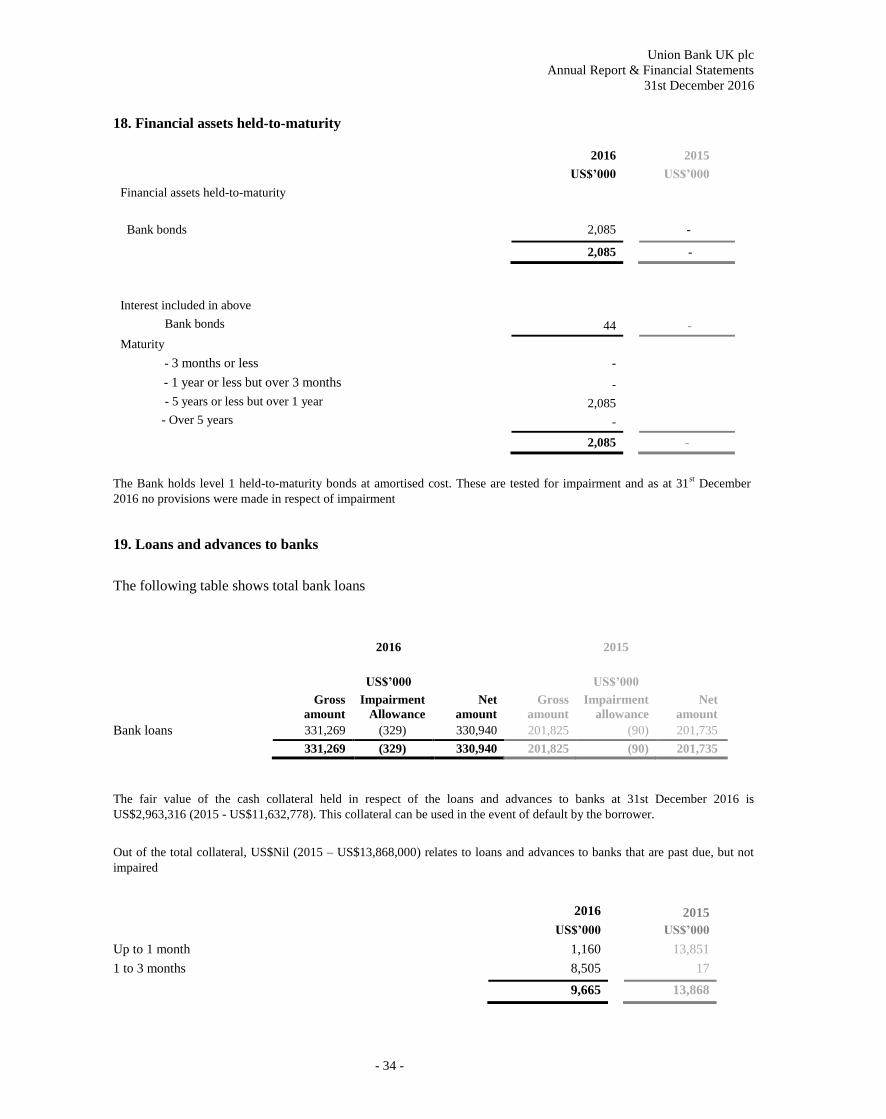
Union Bank UK plc
Annual Report & Financial Statements
31st December 2016
- 34 -
18. Financial assets held-to-maturity
2016 2015
US$’000 US$’000
Financial assets held-to-maturity
Bank bonds
2,085
-
2,085 -
Interest included in above
Bank bonds 44 -
Maturity
- 3 months or less
-
- 1 year or less but over 3 months -
- 5 years or less but over 1 year 2,085
- Over 5 years -
2,085 -
The Bank holds level 1 held-to-maturity bonds at amortised cost. These are tested for impairment and as at 31st December
2016 no provisions were made in respect of impairment
19. Loans and advances to banks
The following table shows total bank loans
2016 2015
US$’000 US$’000
Gross
amount
Impairment
Allowance
Net
amount
Gross
amount
Impairment
allowance
Net
amount
Bank loans 331,269 (329) 330,940 201,825 (90) 201,735
331,269 (329) 330,940 201,825 (90) 201,735
The fair value of the cash collateral held in respect of the loans and advances to banks at 31st December 2016 is
US$2,963,316 (2015 - US$11,632,778). This collateral can be used in the event of default by the borrower.
Out of the total collateral, US$Nil (2015 – US$13,868,000) relates to loans and advances to banks that are past due, but not
impaired
2016 2015
US$’000 US$’000
Up to 1 month 1,160 13,851
1 to 3 months 8,505 17
9,665 13,868
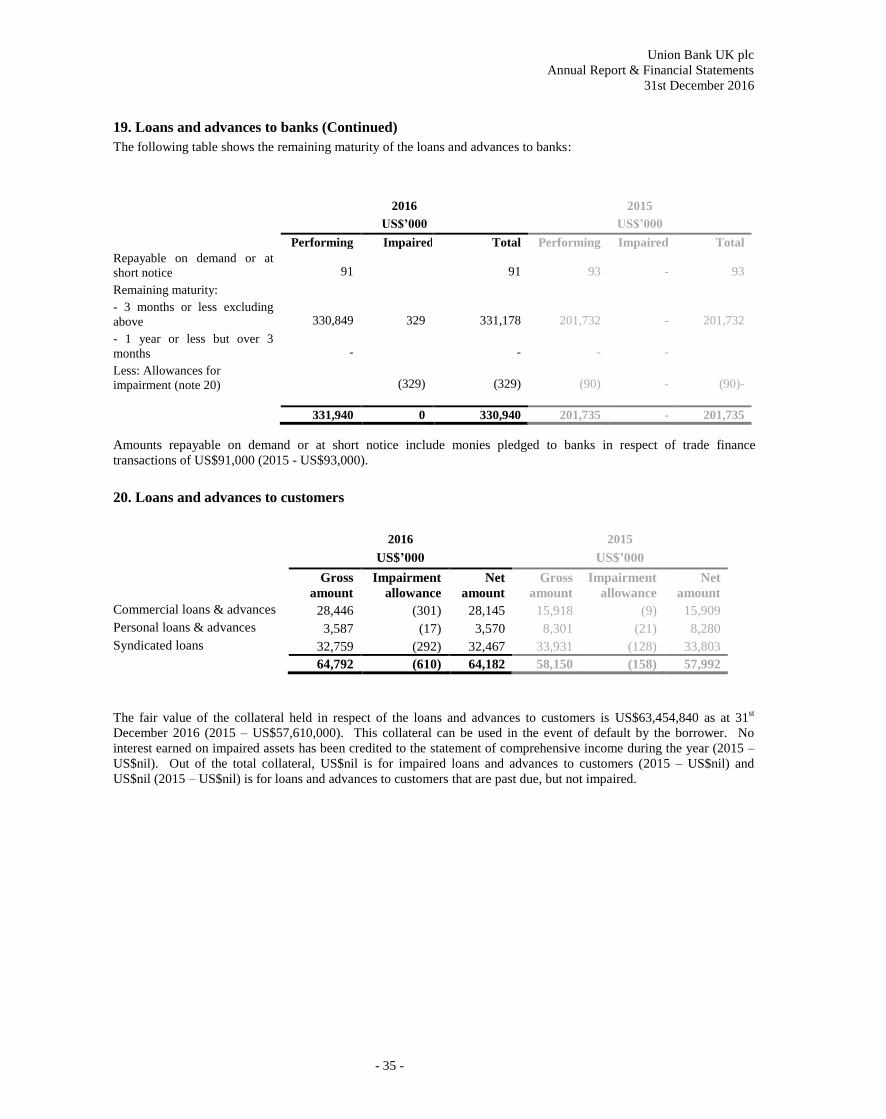
Union Bank UK plc
Annual Report & Financial Statements
31st December 2016
- 35 -
19. Loans and advances to banks (Continued)
The following table shows the remaining maturity of the loans and advances to banks:
2016 2015
US$’000 US$’000
Performing Impaired Total Performing Impaired Total
Repayable on demand or at
short notice
91
91
93
-
93
Remaining maturity:
- 3 months or less excluding
above
330,849
329
331,178
201,732
-
201,732
- 1 year or less but over 3
months
-
-
-
-
Less: Allowances for
impairment (note 20)
(329)
(329)
(90)
-
(90)-
331,940 0 330,940 201,735 - 201,735
Amounts repayable on demand or at short notice include monies pledged to banks in respect of trade finance
transactions of US$91,000 (2015 - US$93,000).
20. Loans and advances to customers
2016 2015
US$’000 US$’000
Gross
amount
Impairment
allowance
Net
amount
Gross
amount
Impairment
allowance
Net
amount
Commercial loans & advances 28,446 (301) 28,145 15,918 (9) 15,909
Personal loans & advances 3,587 (17) 3,570 8,301 (21) 8,280
Syndicated loans 32,759 (292) 32,467 33,931 (128) 33,803
64,792 (610) 64,182 58,150 (158) 57,992
The fair value of the collateral held in respect of the loans and advances to customers is US$63,454,840 as at 31st
December 2016 (2015 – US$57,610,000). This collateral can be used in the event of default by the borrower. No
interest earned on impaired assets has been credited to the statement of comprehensive income during the year (2015 –
US$nil). Out of the total collateral, US$nil is for impaired loans and advances to customers (2015 – US$nil) and
US$nil (2015 – US$nil) is for loans and advances to customers that are past due, but not impaired.
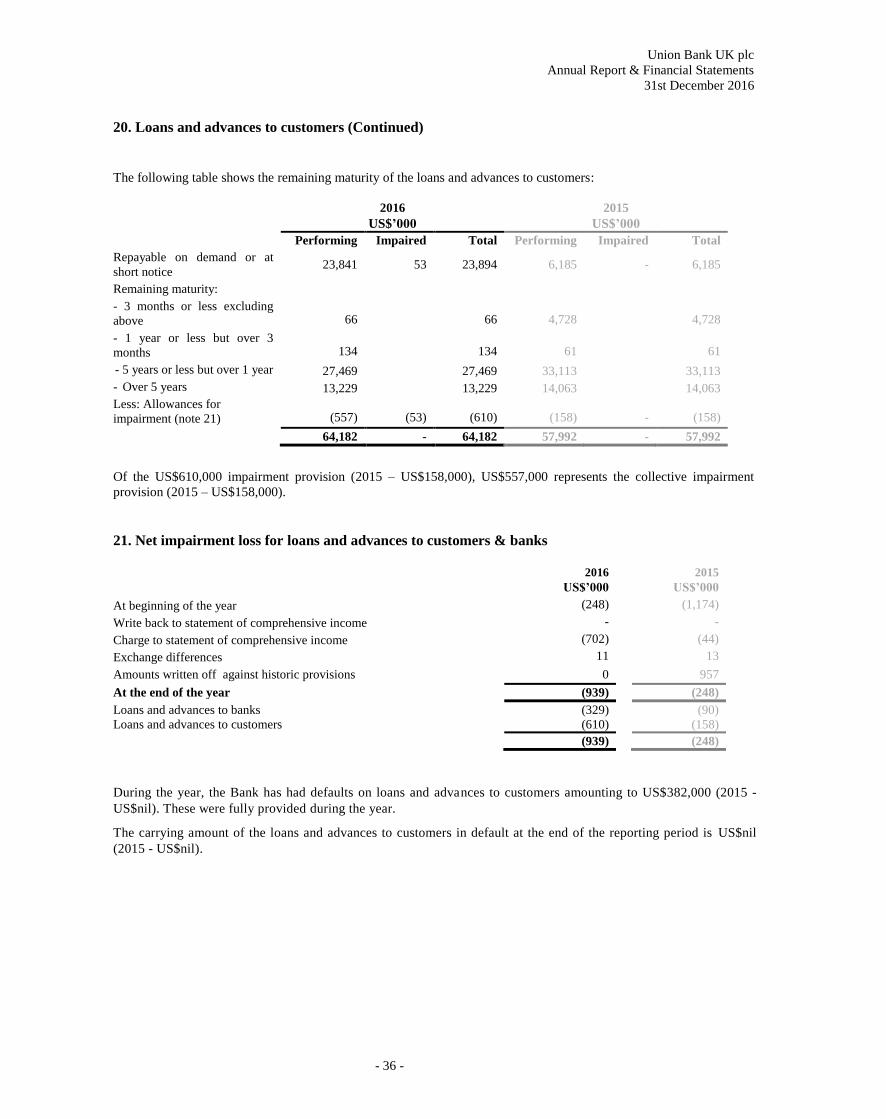
Union Bank UK plc
Annual Report & Financial Statements
31st December 2016
- 36 -
20. Loans and advances to customers (Continued)
The following table shows the remaining maturity of the loans and advances to customers:
2016 2015
US$’000 US$’000
Performing Impaired Total Performing Impaired Total
Repayable on demand or at
short notice 23,841 53 23,894 6,185 - 6,185
Remaining maturity:
- 3 months or less excluding
above
66
66
4,728
4,728
- 1 year or less but over 3
months
134
134
61
61
- 5 years or less but over 1 year 27,469 27,469 33,113 33,113
- Over 5 years 13,229 13,229 14,063 14,063
Less: Allowances for
impairment (note 21)
(557)
(53)
(610)
(158)
-
(158)
64,182 - 64,182 57,992 - 57,992
Of the US$610,000 impairment provision (2015 – US$158,000), US$557,000 represents the collective impairment
provision (2015 – US$158,000).
21. Net impairment loss for loans and advances to customers & banks
2016 2015
US$’000 US$’000
At beginning of the year (248) (1,174)
Write back to statement of comprehensive income - -
Charge to statement of comprehensive income (702) (44)
Exchange differences 11 13
Amounts written off against historic provisions 0 957
At the end of the year (939) (248)
Loans and advances to banks (329) (90)
Loans and advances to customers (610) (158)
(939) (248)
During the year, the Bank has had defaults on loans and advances to customers amounting to US$382,000 (2015 -
US$nil). These were fully provided during the year.
The carrying amount of the loans and advances to customers in default at the end of the reporting period is US$nil
(2015 - US$nil).
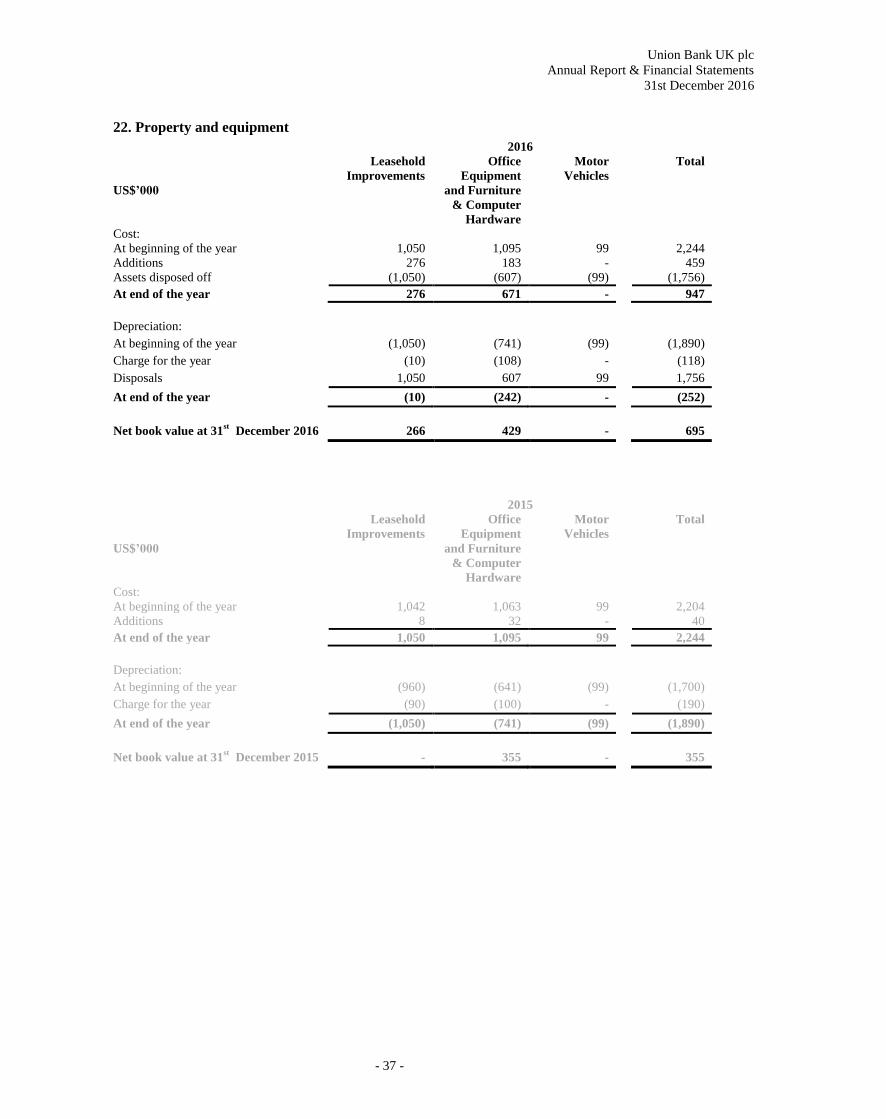
Union Bank UK plc
Annual Report & Financial Statements
31st December 2016
- 37 -
22. Property and equipment
2016
US$’000
Leasehold
Improvements
Office
Equipment
and Furniture
& Computer
Hardware
Motor
Vehicles
Total
Cost:
At beginning of the year 1,050 1,095 99 2,244
Additions 276 183 - 459
Assets disposed off (1,050) (607) (99) (1,756)
At end of the year 276 671 - 947
Depreciation:
At beginning of the year (1,050) (741) (99) (1,890)
Charge for the year (10) (108) - (118)
Disposals 1,050 607 99 1,756
At end of the year (10) (242) - (252)
Net book value at 31st December 2016 266 429 - 695
2015
US$’000
Leasehold
Improvements
Office
Equipment
and Furniture
& Computer
Hardware
Motor
Vehicles
Total
Cost:
At beginning of the year 1,042 1,063 99 2,204
Additions 8 32 - 40
At end of the year 1,050 1,095 99 2,244
Depreciation:
At beginning of the year (960) (641) (99) (1,700)
Charge for the year (90) (100) - (190)
At end of the year (1,050) (741) (99) (1,890)
Net book value at 31st December 2015 - 355 - 355
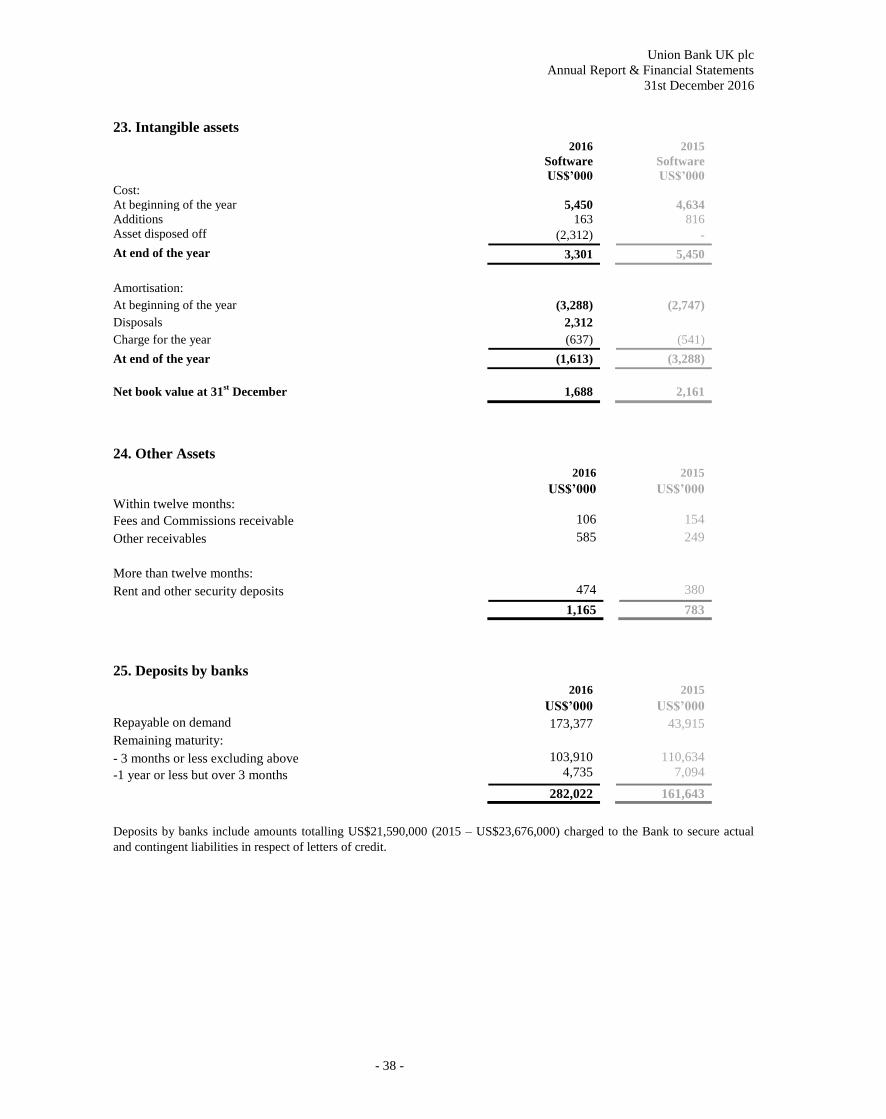
Union Bank UK plc
Annual Report & Financial Statements
31st December 2016
- 38 -
23. Intangible assets
2016 2015
Software Software
US$’000 US$’000
Cost:
At beginning of the year 5,450 4,634
Additions 163 816
Asset disposed off (2,312) -
At end of the year 3,301 5,450
Amortisation:
At beginning of the year (3,288) (2,747)
Disposals 2,312
Charge for the year (637) (541)
At end of the year (1,613) (3,288)
Net book value at 31st December 1,688 2,161
24. Other Assets
2016 2015
Within twelve months: US$’000 US$’000
Fees and Commissions receivable 106 154
Other receivables 585 249
More than twelve months:
Rent and other security deposits 474 380
1,165 783
25. Deposits by banks
2016 2015
US$’000 US$’000
Repayable on demand 173,377 43,915
Remaining maturity:
- 3 months or less excluding above
-1 year or less but over 3 months
103,910
4,735
110,634
7,094
282,022 161,643
Deposits by banks include amounts totalling US$21,590,000 (2015 – US$23,676,000) charged to the Bank to secure actual
and contingent liabilities in respect of letters of credit.

Union Bank UK plc
Annual Report & Financial Statements
31st December 2016
- 39 -
26. Customer accounts
2016 2015
US$’000 US$’000
Repayable on demand 70,878 37,080
Remaining maturity:
- 3 months or less excluding above 4,242 11,807
- 1 year or less but over 3 months 9,993 13,215
- 5 years or less but over 1 year 440 336
85,554 62,437
Customer accounts include amounts totalling US$1,055,715 (2015 – US$2,392,000) charged to the Bank to secure actual and
contingent liabilities in respect of letters of credit.
27. Other liabilities
2016 2015
Within twelve months: US$’000 US$’000
Taxation and social security 177 195
Accounts payable
More than twelve months:
881 769
Customers’ unclaimed balances 716 915
1,774 1,879
28. Accruals and deferred income
2016 2015
US$’000 US$’000
Accruals 2,230 463
Deferred income 539 670
2,769 1,133
29. Called up share capital
2016 2015
Authorised, Allotted, called up and fully paid US$’000 US$’000
50,000 deferred shares of £1 each 90 90
60,000,000 ordinary shares of US$1 each 60,000 60,000
60,090 60,090
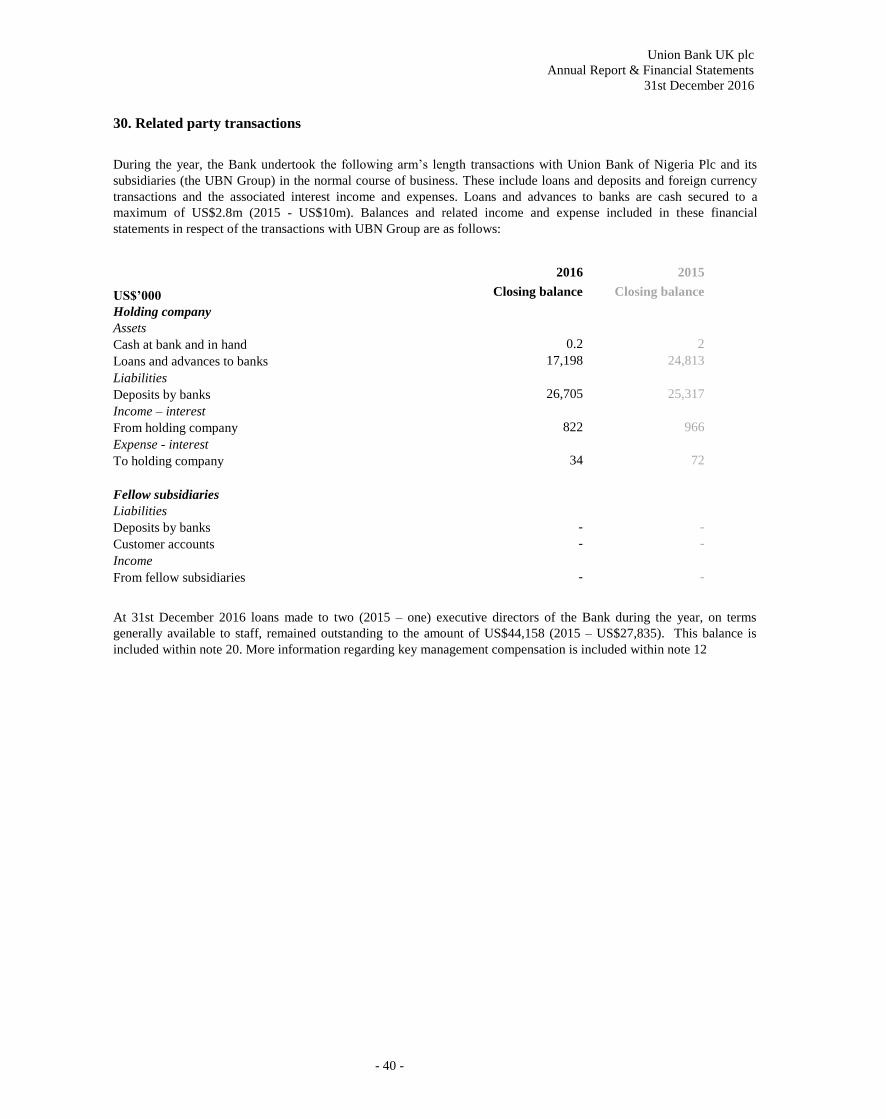
Union Bank UK plc
Annual Report & Financial Statements
31st December 2016
- 40 -
30. Related party transactions
During the year, the Bank undertook the following arm’s length transactions with Union Bank of Nigeria Plc and its
subsidiaries (the UBN Group) in the normal course of business. These include loans and deposits and foreign currency
transactions and the associated interest income and expenses. Loans and advances to banks are cash secured to a
maximum of US$2.8m (2015 - US$10m). Balances and related income and expense included in these financial
statements in respect of the transactions with UBN Group are as follows:
2016 2015
US$’000 Closing balance Closing balance
Holding company
Assets
Cash at bank and in hand 0.2 2
Loans and advances to banks 17,198 24,813
Liabilities
Deposits by banks 26,705 25,317
Income – interest
From holding company 822 966
Expense - interest
To holding company 34 72
Fellow subsidiaries
Liabilities
Deposits by banks - -
Customer accounts - -
Income
From fellow subsidiaries - -
At 31st December 2016 loans made to two (2015 – one) executive directors of the Bank during the year, on terms
generally available to staff, remained outstanding to the amount of US$44,158 (2015 – US$27,835). This balance is
included within note 20. More information regarding key management compensation is included within note 12

Union Bank UK plc
Annual Report & Financial Statements
31st December 2016
- 41 -
31. Financial risk management
(a) Risk management
The Bank holds and issues financial instruments for the purposes of:
- earning interest margins, fees and commission;
- financing its operations; and
- managing the interest rate and currency risks inherent in its operations.
The Bank does not actively trade in financial instruments and, therefore, does not have a trading book. Its operations are
financed from a mixture of equity and deposits. Deposits are raised primarily in US dollars and to a lesser extent sterling
and euros at both fixed and variable rates and lending is similarly distributed. Longer term lending is partly financed by
capital but is otherwise generally matched to deposits both in terms of maturity and re-pricing.
The Bank’s functional currency is the US dollar. It does not actively speculate in foreign currencies and the majority of
its foreign exchange transactions are carried out in the spot market for customer facilitation purposes. Forward foreign
exchange transactions are undertaken for the purposes of hedging the US$ value of the Bank's estimated GBP sterling
expenses.
The main risks arising from the Bank’s financial instruments are credit risk, liquidity risk, interest rate risk and foreign
currency risk. Management has developed policies for managing each of these risks, which are reviewed and approved
by the Board on an annual basis. Significant features of these policies are summarised below.
(b) Credit risk
Credit risk is the risk that a customer or counterparty is unable or unwilling to meet a commitment that it has entered into
with the Bank and arises mainly from lending and trade finance activities. To mitigate this risk, the Bank has adopted
policies that minimise significant unsecured credit exposures other than to financial institutions and to avoid
concentrations of unsecured credit risk to counterparty groups, industry sectors and countries, which do not carry
investment grade credit ratings. All credit exposures are subject to continuous assessment by the Assets & Liabilities
Committee and the Risk & General Purposes Committee of the Board. It is the policy of the Bank to make adequate
impairment allowances where real or probable problems in asset recovery are identified and to make adequate collective
impairment allowances for those as yet unidentified credit problems that are inherent in any portfolio of banking assets.
Details of impairment allowances are summarised in Notes 19 to 21.
(i) Age analysis of past due but not impaired assets
Impairment assessment takes into account known recoveries after the reporting date in respect of assets past due at that
date as well as collateral held in the form of cash and property and chattel mortgages. The table below shows the age
analysis of past due but not impaired assets together with collateral held.
2016 2015
US$’000 US$’000
Gross
amount
Collateral Net Gross
amount
Collateral Net
Within 3 months
Over 3 months
-
-
-
-
- 13,851
17
13,851
17
-
- - - 13,868 13,868 -
(ii) Credit exposure by sector
2016 2015
US$’000 US$’000
Banks 341,766 210,699
Government 37,532 27,675
Corporate 58,048 49,709
Individuals 6,135 8,280
443,481 296,363

Union Bank UK plc
Annual Report & Financial Statements
31st December 2016
- 42 -
31. Financial risk management (continued)
(iii) Credit exposure by location
2016 2015
US$’000 US$’000
Europe 246,960 143,257
Africa 86,118 91,560
Others (mainly Canada, India, Japan and Australia) 110,403 61,546
443,481 296,363
The above sector and geographical analyses only include cash at bank and in hand, loans and advances to banks and to
customers, financial assets available-for-sale, financial assets held to maturity and financial assets - derivatives.
The Bank has established procedures to manage country risk. During the year there continued to be periods of
significant volatility in the emerging bond markets which are closely monitored and valued daily. The Bank also carries
out country credit reviews of emerging markets and thereby assesses any potential creditworthiness issues.
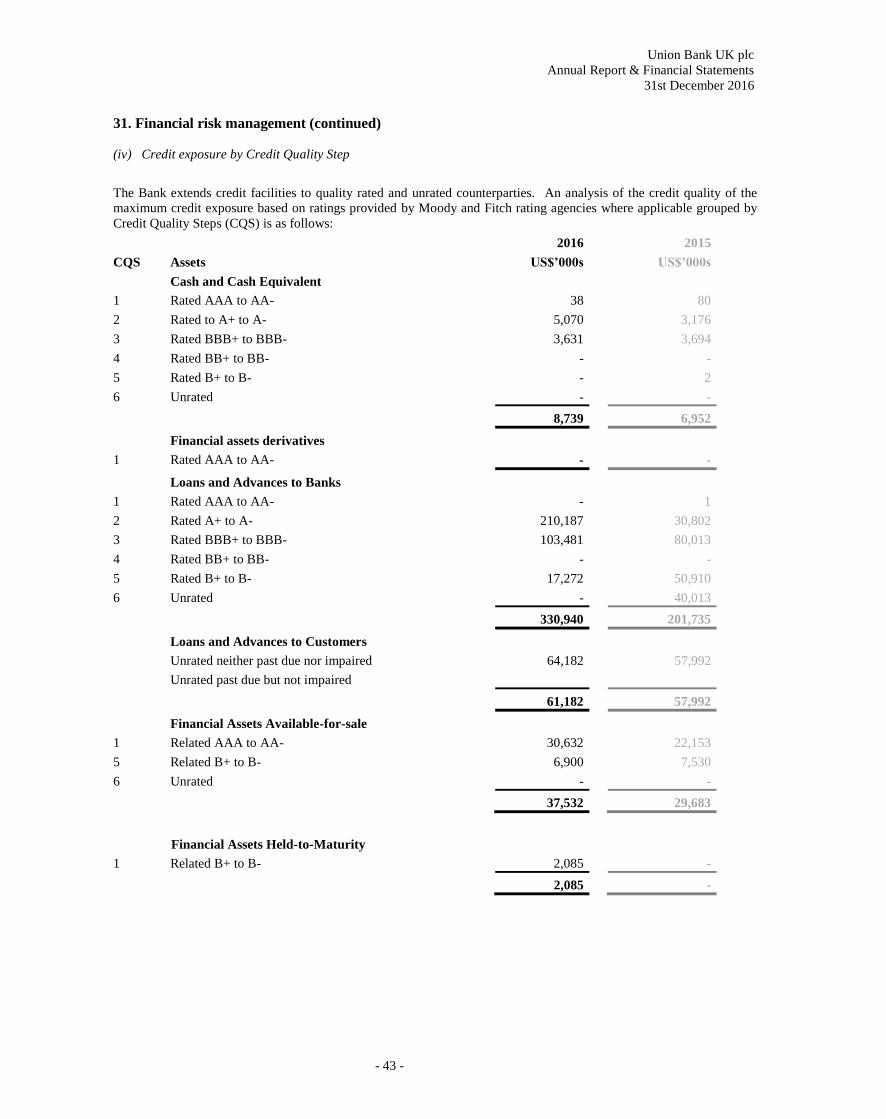
Union Bank UK plc
Annual Report & Financial Statements
31st December 2016
- 43 -
31. Financial risk management (continued)
(iv) Credit exposure by Credit Quality Step
The Bank extends credit facilities to quality rated and unrated counterparties. An analysis of the credit quality of the
maximum credit exposure based on ratings provided by Moody and Fitch rating agencies where applicable grouped by
Credit Quality Steps (CQS) is as follows:
2016 2015
CQS Assets US$’000s US$’000s
Cash and Cash Equivalent
1 Rated AAA to AA- 38 80
2 Rated to A+ to A- 5,070 3,176
3 Rated BBB+ to BBB- 3,631 3,694
4 Rated BB+ to BB- - -
5 Rated B+ to B- - 2
6 Unrated - -
8,739 6,952
Financial assets derivatives
1 Rated AAA to AA- - -
Loans and Advances to Banks
1 Rated AAA to AA- - 1
2 Rated A+ to A- 210,187 30,802
3 Rated BBB+ to BBB- 103,481 80,013
4 Rated BB+ to BB- - -
5 Rated B+ to B- 17,272 50,910
6 Unrated - 40,013
330,940 201,735
Loans and Advances to Customers
Unrated neither past due nor impaired 64,182 57,992
Unrated past due but not impaired
61,182 57,992
Financial Assets Available-for-sale
1 Related AAA to AA- 30,632 22,153
5 Related B+ to B- 6,900 7,530
6 Unrated - -
37,532 29,683
Financial Assets Held-to-Maturity
1 Related B+ to B- 2,085 -
2,085 -
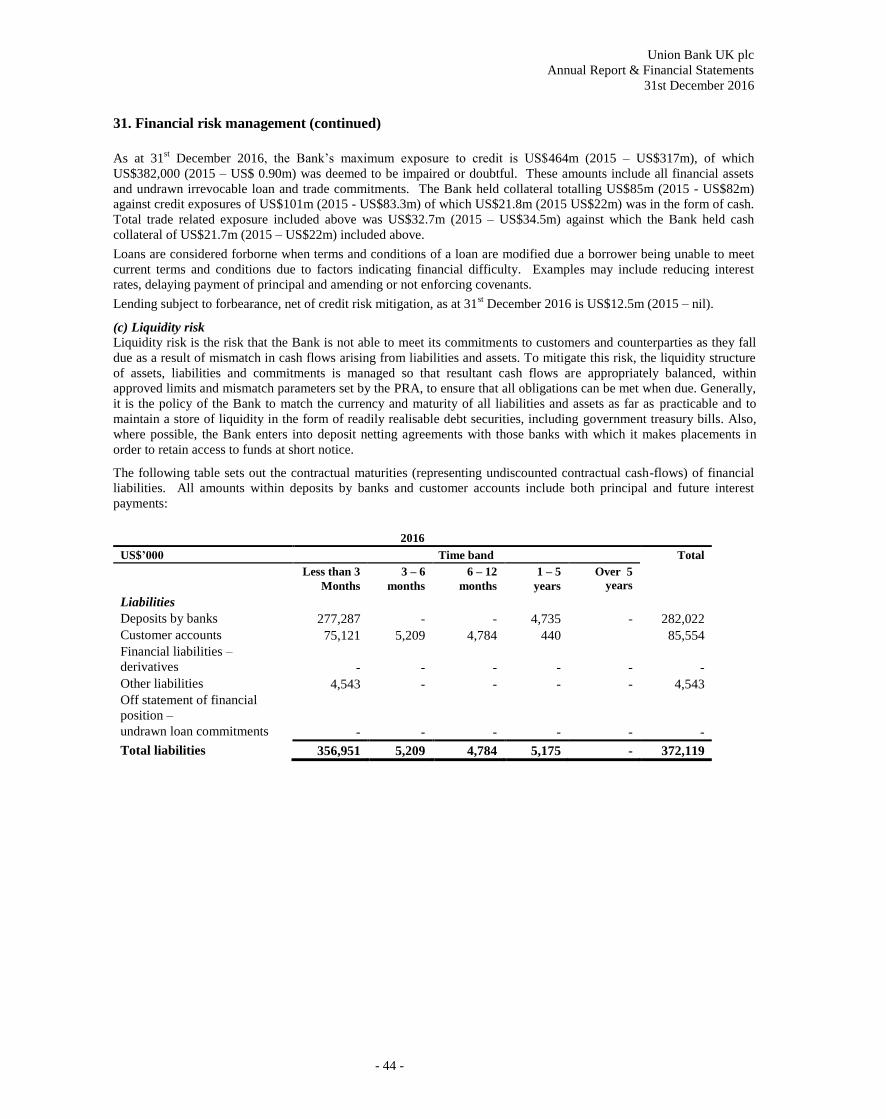
Union Bank UK plc
Annual Report & Financial Statements
31st December 2016
- 44 -
31. Financial risk management (continued)
As at 31st December 2016, the Bank’s maximum exposure to credit is US$464m (2015 – US$317m), of which
US$382,000 (2015 – US$ 0.90m) was deemed to be impaired or doubtful. These amounts include all financial assets
and undrawn irrevocable loan and trade commitments. The Bank held collateral totalling US$85m (2015 - US$82m)
against credit exposures of US$101m (2015 - US$83.3m) of which US$21.8m (2015 US$22m) was in the form of cash.
Total trade related exposure included above was US$32.7m (2015 – US$34.5m) against which the Bank held cash
collateral of US$21.7m (2015 – US$22m) included above.
Loans are considered forborne when terms and conditions of a loan are modified due a borrower being unable to meet
current terms and conditions due to factors indicating financial difficulty. Examples may include reducing interest
rates, delaying payment of principal and amending or not enforcing covenants.
Lending subject to forbearance, net of credit risk mitigation, as at 31st December 2016 is US$12.5m (2015 – nil).
(c) Liquidity risk
Liquidity risk is the risk that the Bank is not able to meet its commitments to customers and counterparties as they fall
due as a result of mismatch in cash flows arising from liabilities and assets. To mitigate this risk, the liquidity structure
of assets, liabilities and commitments is managed so that resultant cash flows are appropriately balanced, within
approved limits and mismatch parameters set by the PRA, to ensure that all obligations can be met when due. Generally,
it is the policy of the Bank to match the currency and maturity of all liabilities and assets as far as practicable and to
maintain a store of liquidity in the form of readily realisable debt securities, including government treasury bills. Also,
where possible, the Bank enters into deposit netting agreements with those banks with which it makes placements in
order to retain access to funds at short notice.
The following table sets out the contractual maturities (representing undiscounted contractual cash-flows) of financial
liabilities. All amounts within deposits by banks and customer accounts include both principal and future interest
payments:
2016
US$’000 Time band Total
Less than 3
Months
3 – 6
months
6 – 12
months
1 – 5
years
Over 5
years
Liabilities
Deposits by banks 277,287 - - 4,735 - 282,022
Customer accounts 75,121 5,209 4,784 440 85,554
Financial liabilities –
derivatives - - - - - -
Other liabilities 4,543 - - - - 4,543
Off statement of financial
position –
undrawn loan commitments - - - - - -
Total liabilities 356,951 5,209 4,784 5,175 - 372,119
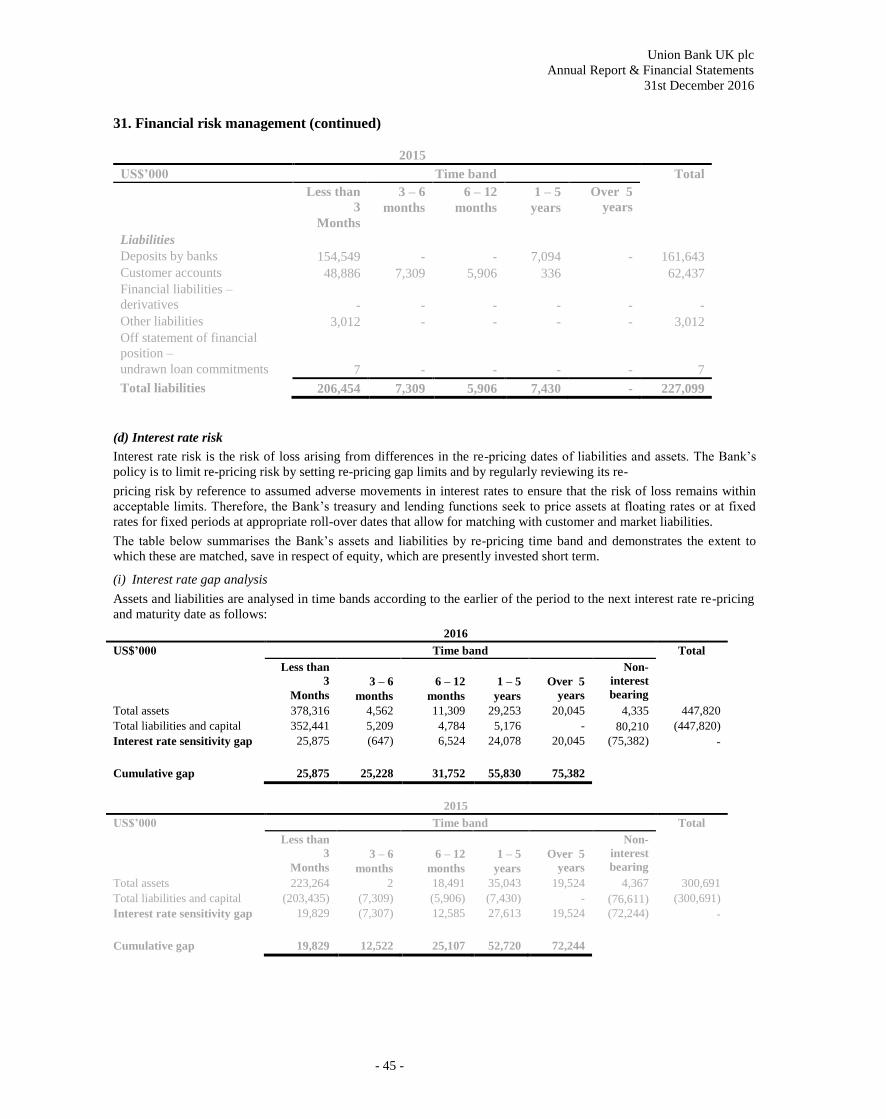
Union Bank UK plc
Annual Report & Financial Statements
31st December 2016
- 45 -
31. Financial risk management (continued)
2015
US$’000 Time band Total
Less than
3
Months
3 – 6
months
6 – 12
months
1 – 5
years
Over 5
years
Liabilities
Deposits by banks 154,549 - - 7,094 - 161,643
Customer accounts 48,886 7,309 5,906 336 62,437
Financial liabilities –
derivatives - - - - - -
Other liabilities 3,012 - - - - 3,012
Off statement of financial
position –
undrawn loan commitments 7 - - - - 7
Total liabilities 206,454 7,309 5,906 7,430 - 227,099
(d) Interest rate risk
Interest rate risk is the risk of loss arising from differences in the re-pricing dates of liabilities and assets. The Bank’s
policy is to limit re-pricing risk by setting re-pricing gap limits and by regularly reviewing its re-
pricing risk by reference to assumed adverse movements in interest rates to ensure that the risk of loss remains within
acceptable limits. Therefore, the Bank’s treasury and lending functions seek to price assets at floating rates or at fixed
rates for fixed periods at appropriate roll-over dates that allow for matching with customer and market liabilities.
The table below summarises the Bank’s assets and liabilities by re-pricing time band and demonstrates the extent to
which these are matched, save in respect of equity, which are presently invested short term.
(i) Interest rate gap analysis
Assets and liabilities are analysed in time bands according to the earlier of the period to the next interest rate re-pricing
and maturity date as follows:
2016
US$’000 Time band Total
Less than
3
Months
3 – 6
months
6 – 12
months
1 – 5
years
Over 5
years
Non-
interest
bearing
Total assets 378,316 4,562 11,309 29,253 20,045 4,335 447,820
Total liabilities and capital 352,441 5,209 4,784 5,176 - 80,210 (447,820)
Interest rate sensitivity gap 25,875 (647) 6,524 24,078 20,045 (75,382) -
Cumulative gap 25,875 25,228 31,752 55,830 75,382
2015
US$’000 Time band Total
Less than
3
Months
3 – 6
months
6 – 12
months
1 – 5
years
Over 5
years
Non-
interest
bearing
Total assets 223,264 2 18,491 35,043 19,524 4,367 300,691
Total liabilities and capital (203,435) (7,309) (5,906) (7,430) - (76,611) (300,691)
Interest rate sensitivity gap 19,829 (7,307) 12,585 27,613 19,524 (72,244) -
Cumulative gap 19,829 12,522 25,107 52,720 72,244

Union Bank UK plc
Annual Report & Financial Statements
31st December 2016
- 46 -
31. Financial risk management (continued)
(ii) Interest rate sensitivity analysis
Interest rate sensitivity analysis has been performed on the net cash flow interest rate risk exposures as at the reporting
dates. A range of possible upward/downward movements in Libor/Euribor of 100bps has been assumed for the
different currencies which the directors consider reasonable given the current market conditions and the nature of
matched funding within the exposures. If all other variables are held constant, the tables below present the likely
impact on the Bank’s statement of comprehensive income:
2016
US$’000 Currencies Total
US dollar £ Sterling Euro Other
Total Financial assets 415,030 24,514 3,494 442 443,479
Less: fixed rate assets (115,598) (1,461) - - (117,059)
Total Variable rate assets 299,434 23,053 3,494 442 326,420
Total Financial liabilities 338,617 24,575 3,961 422 367,031
Less: fixed rate liabilities (109,070) 6,696 - - (102,375)
Total Variable rate liabilities 229,547 31,270 3,961 422 265,200
Net cash flow interest Rate Risk exposure 69,887 (8,218) (467) 20 61,222
Possible movement in Libor/Euribor (bps) 100 100 100 100
Possible impact of increase in Libor/Euribor on
profit/loss before tax and equity 699 (82) (5) - 612
Tax charge-20% (140) 16 1 - (122)
Possible impact of increase in Libor/Euribor on
profit/loss after tax and equity 559 (66) -4 - 490
Possible impact of decrease in Libor/Euribor
on profit/loss before tax and equity (699) 82 5 - (612)
Tax charge-21.5% 140 (16) -1 - 123
Possible impact of decrease in Libor/Euribor
on profit/loss after tax and equity (559) 66 4 - (490)
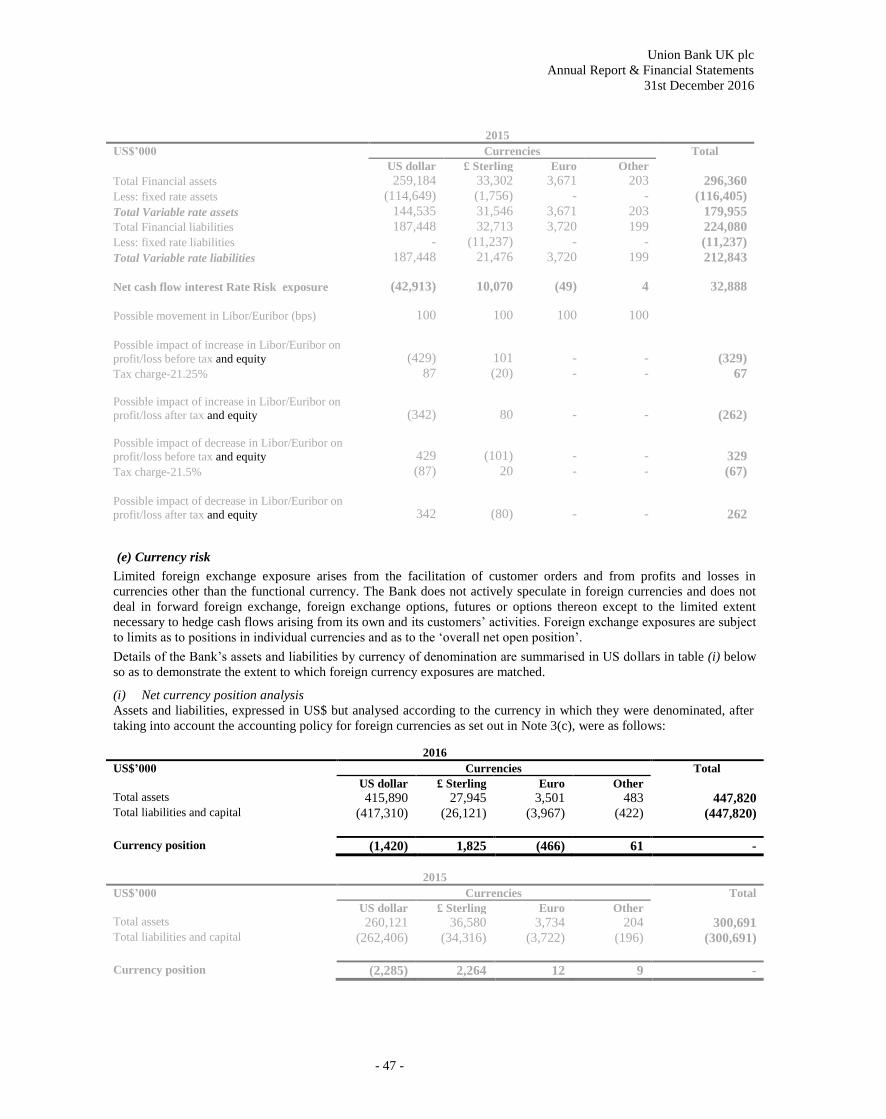
Union Bank UK plc
Annual Report & Financial Statements
31st December 2016
- 47 -
2015
US$’000 Currencies Total
US dollar £ Sterling Euro Other
Total Financial assets 259,184 33,302 3,671 203 296,360
Less: fixed rate assets (114,649) (1,756) - - (116,405)
Total Variable rate assets 144,535 31,546 3,671 203 179,955
Total Financial liabilities 187,448 32,713 3,720 199 224,080
Less: fixed rate liabilities - (11,237) - - (11,237)
Total Variable rate liabilities 187,448 21,476 3,720 199 212,843
Net cash flow interest Rate Risk exposure (42,913) 10,070 (49) 4 32,888
Possible movement in Libor/Euribor (bps) 100 100 100 100
Possible impact of increase in Libor/Euribor on
profit/loss before tax and equity (429) 101 - - (329)
Tax charge-21.25% 87 (20) - - 67
Possible impact of increase in Libor/Euribor on
profit/loss after tax and equity (342) 80 - - (262)
Possible impact of decrease in Libor/Euribor on
profit/loss before tax and equity 429 (101) - - 329
Tax charge-21.5% (87) 20 - - (67)
Possible impact of decrease in Libor/Euribor on
profit/loss after tax and equity 342 (80) - - 262
(e) Currency risk
Limited foreign exchange exposure arises from the facilitation of customer orders and from profits and losses in
currencies other than the functional currency. The Bank does not actively speculate in foreign currencies and does not
deal in forward foreign exchange, foreign exchange options, futures or options thereon except to the limited extent
necessary to hedge cash flows arising from its own and its customers’ activities. Foreign exchange exposures are subject
to limits as to positions in individual currencies and as to the ‘overall net open position’.
Details of the Bank’s assets and liabilities by currency of denomination are summarised in US dollars in table (i) below
so as to demonstrate the extent to which foreign currency exposures are matched.
(i) Net currency position analysis
Assets and liabilities, expressed in US$ but analysed according to the currency in which they were denominated, after
taking into account the accounting policy for foreign currencies as set out in Note 3(c), were as follows:
2016
US$’000 Currencies Total
US dollar £ Sterling Euro Other
Total assets 415,890 27,945 3,501 483 447,820 Total liabilities and capital (417,310) (26,121) (3,967) (422) (447,820)
Currency position (1,420) 1,825 (466) 61 -
2015
US$’000 Currencies Total
US dollar £ Sterling Euro Other
Total assets 260,121 36,580 3,734 204 300,691 Total liabilities and capital (262,406) (34,316) (3,722) (196) (300,691)
Currency position (2,285) 2,264 12 9 -
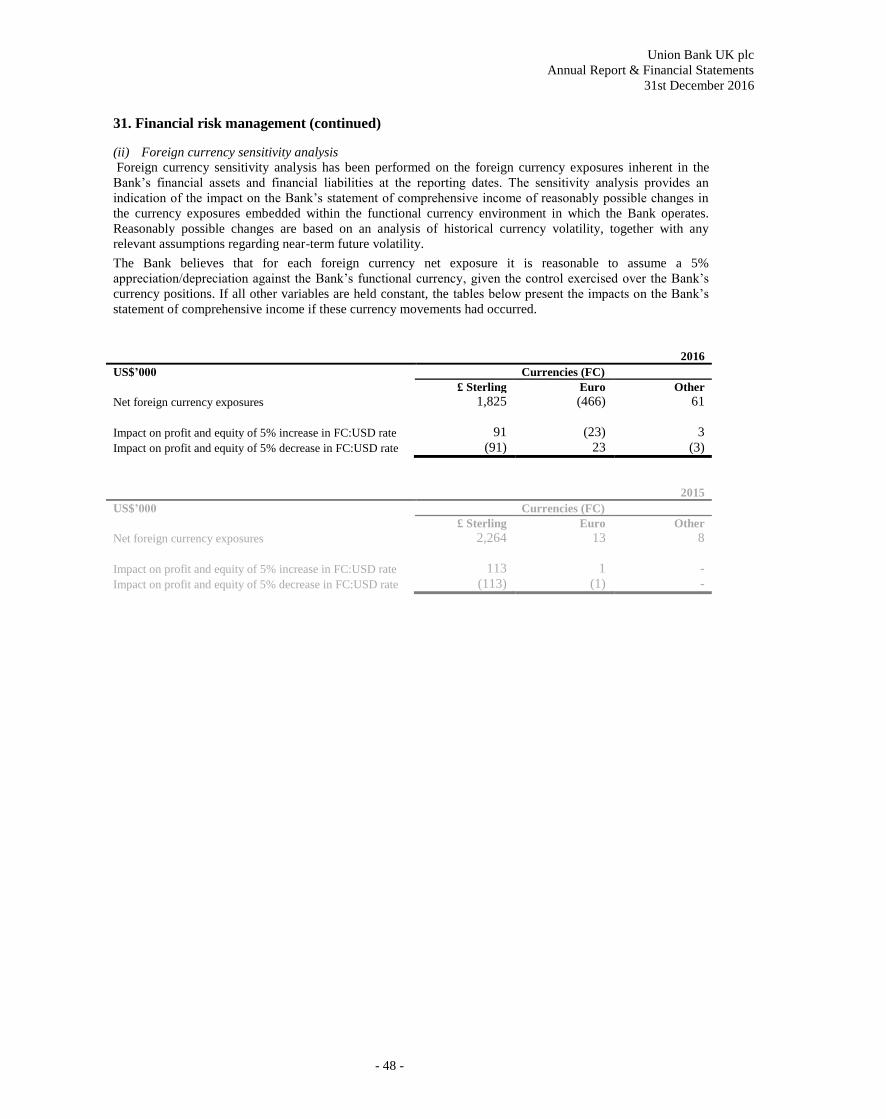
Union Bank UK plc
Annual Report & Financial Statements
31st December 2016
- 48 -
31. Financial risk management (continued)
(ii) Foreign currency sensitivity analysis
Foreign currency sensitivity analysis has been performed on the foreign currency exposures inherent in the
Bank’s financial assets and financial liabilities at the reporting dates. The sensitivity analysis provides an
indication of the impact on the Bank’s statement of comprehensive income of reasonably possible changes in
the currency exposures embedded within the functional currency environment in which the Bank operates.
Reasonably possible changes are based on an analysis of historical currency volatility, together with any
relevant assumptions regarding near-term future volatility.
The Bank believes that for each foreign currency net exposure it is reasonable to assume a 5%
appreciation/depreciation against the Bank’s functional currency, given the control exercised over the Bank’s
currency positions. If all other variables are held constant, the tables below present the impacts on the Bank’s
statement of comprehensive income if these currency movements had occurred.
2016
US$’000 Currencies (FC)
£ Sterling Euro Other
Net foreign currency exposures 1,825 (466) 61
Impact on profit and equity of 5% increase in FC:USD rate 91 (23) 3
Impact on profit and equity of 5% decrease in FC:USD rate (91) 23 (3)
2015
US$’000 Currencies (FC)
£ Sterling Euro Other
Net foreign currency exposures 2,264 13 8
Impact on profit and equity of 5% increase in FC:USD rate 113 1 -
Impact on profit and equity of 5% decrease in FC:USD rate (113) (1) -
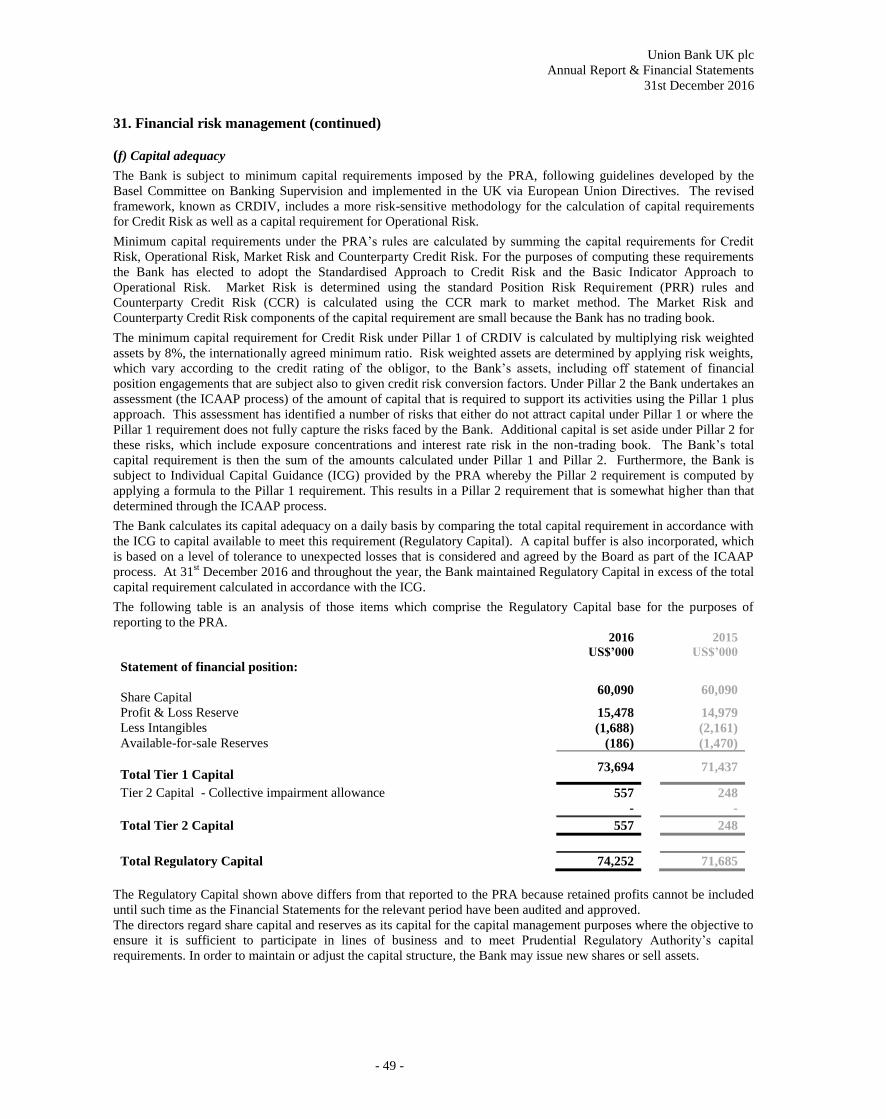
Union Bank UK plc
Annual Report & Financial Statements
31st December 2016
- 49 -
31. Financial risk management (continued)
(f) Capital adequacy
The Bank is subject to minimum capital requirements imposed by the PRA, following guidelines developed by the
Basel Committee on Banking Supervision and implemented in the UK via European Union Directives. The revised
framework, known as CRDIV, includes a more risk-sensitive methodology for the calculation of capital requirements
for Credit Risk as well as a capital requirement for Operational Risk.
Minimum capital requirements under the PRA’s rules are calculated by summing the capital requirements for Credit
Risk, Operational Risk, Market Risk and Counterparty Credit Risk. For the purposes of computing these requirements
the Bank has elected to adopt the Standardised Approach to Credit Risk and the Basic Indicator Approach to
Operational Risk. Market Risk is determined using the standard Position Risk Requirement (PRR) rules and
Counterparty Credit Risk (CCR) is calculated using the CCR mark to market method. The Market Risk and
Counterparty Credit Risk components of the capital requirement are small because the Bank has no trading book.
The minimum capital requirement for Credit Risk under Pillar 1 of CRDIV is calculated by multiplying risk weighted
assets by 8%, the internationally agreed minimum ratio. Risk weighted assets are determined by applying risk weights,
which vary according to the credit rating of the obligor, to the Bank’s assets, including off statement of financial
position engagements that are subject also to given credit risk conversion factors. Under Pillar 2 the Bank undertakes an
assessment (the ICAAP process) of the amount of capital that is required to support its activities using the Pillar 1 plus
approach. This assessment has identified a number of risks that either do not attract capital under Pillar 1 or where the
Pillar 1 requirement does not fully capture the risks faced by the Bank. Additional capital is set aside under Pillar 2 for
these risks, which include exposure concentrations and interest rate risk in the non-trading book. The Bank’s total
capital requirement is then the sum of the amounts calculated under Pillar 1 and Pillar 2. Furthermore, the Bank is
subject to Individual Capital Guidance (ICG) provided by the PRA whereby the Pillar 2 requirement is computed by
applying a formula to the Pillar 1 requirement. This results in a Pillar 2 requirement that is somewhat higher than that
determined through the ICAAP process.
The Bank calculates its capital adequacy on a daily basis by comparing the total capital requirement in accordance with
the ICG to capital available to meet this requirement (Regulatory Capital). A capital buffer is also incorporated, which
is based on a level of tolerance to unexpected losses that is considered and agreed by the Board as part of the ICAAP
process. At 31st December 2016 and throughout the year, the Bank maintained Regulatory Capital in excess of the total
capital requirement calculated in accordance with the ICG.
The following table is an analysis of those items which comprise the Regulatory Capital base for the purposes of
reporting to the PRA. 2016 2015
US$’000 US$’000
Statement of financial position:
Share Capital 60,090
60,090
Profit & Loss Reserve 15,478 14,979
Less Intangibles (1,688) (2,161)
Available-for-sale Reserves (186) (1,470)
Total Tier 1 Capital 73,694
71,437
Tier 2 Capital - Collective impairment allowance 557 248
- -
Total Tier 2 Capital 557 248
Total Regulatory Capital 74,252 71,685
The Regulatory Capital shown above differs from that reported to the PRA because retained profits cannot be included
until such time as the Financial Statements for the relevant period have been audited and approved.
The directors regard share capital and reserves as its capital for the capital management purposes where the objective to
ensure it is sufficient to participate in lines of business and to meet Prudential Regulatory Authority’s capital
requirements. In order to maintain or adjust the capital structure, the Bank may issue new shares or sell assets.
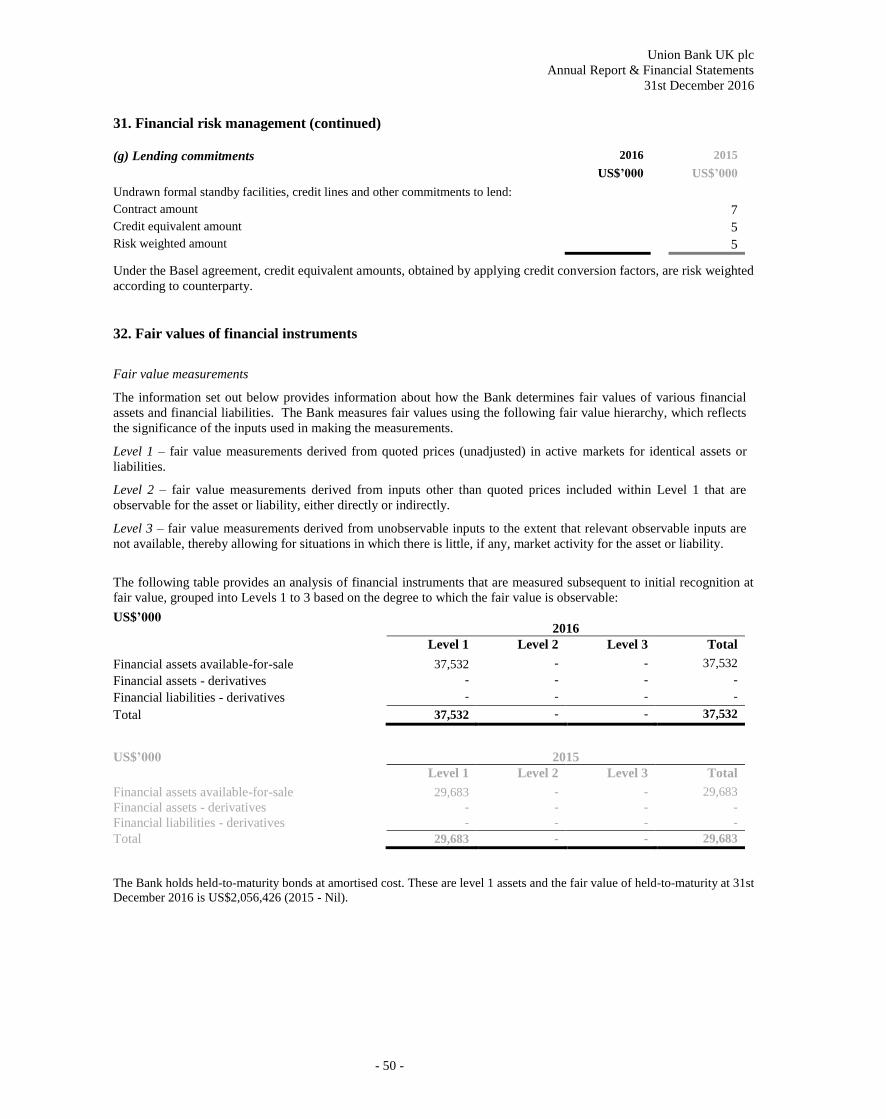
Union Bank UK plc
Annual Report & Financial Statements
31st December 2016
- 50 -
31. Financial risk management (continued)
(g) Lending commitments 2016 2015
US$’000 US$’000
Undrawn formal standby facilities, credit lines and other commitments to lend:
Contract amount 7
Credit equivalent amount 5
Risk weighted amount 5
Under the Basel agreement, credit equivalent amounts, obtained by applying credit conversion factors, are risk weighted
according to counterparty.
32. Fair values of financial instruments
Fair value measurements
The information set out below provides information about how the Bank determines fair values of various financial
assets and financial liabilities. The Bank measures fair values using the following fair value hierarchy, which reflects
the significance of the inputs used in making the measurements.
Level 1 – fair value measurements derived from quoted prices (unadjusted) in active markets for identical assets or
liabilities.
Level 2 – fair value measurements derived from inputs other than quoted prices included within Level 1 that are
observable for the asset or liability, either directly or indirectly.
Level 3 – fair value measurements derived from unobservable inputs to the extent that relevant observable inputs are
not available, thereby allowing for situations in which there is little, if any, market activity for the asset or liability.
The following table provides an analysis of financial instruments that are measured subsequent to initial recognition at
fair value, grouped into Levels 1 to 3 based on the degree to which the fair value is observable:
US$’000
2016
Level 1 Level 2 Level 3 Total
Financial assets available-for-sale 37,532 - - 37,532
Financial assets - derivatives - - - -
Financial liabilities - derivatives - - - -
Total 37,532 - - 37,532
US$’000 2015
Level 1 Level 2 Level 3 Total
Financial assets available-for-sale 29,683 - - 29,683
Financial assets - derivatives - - - -
Financial liabilities - derivatives - - - -
Total 29,683 - - 29,683
The Bank holds held-to-maturity bonds at amortised cost. These are level 1 assets and the fair value of held-to-maturity at 31st
December 2016 is US$2,056,426 (2015 - Nil).

Union Bank UK plc
Annual Report & Financial Statements
31st December 2016
- 51 -
32. Fair values of financial instruments (continued)
The following table sets out the fair values of financial instruments not measured at fair value and compares them to
carrying value.
2016 2015
Carrying
Value
Fair Value Carrying
Value
Fair Value
US$’000 US$’000 US$’000 US$’000
Assets
Cash at bank and in hand 8,740 8,740 7,106 7,106
Loans and advances to banks 330,939 330,939 201,735 201,735
Loans and advances to customers 64,182 64,347 57,992 57,992
Liabilities
Deposits by banks 282,022 284,497 161,643 161,643
Customer accounts 85,554 85,900 62,437 62,437
Other liabilities 4,543 4,543 3,012 3,012
The fair value of financial instruments is the estimated price at which an orderly transaction to sell the asset or to
transfer the liability would take place between market participants at the measurement date under current market
conditions. If a quoted market price is available for an instrument, the fair value is calculated based on the market price.
Where quoted market prices are not available, fair value is determined using pricing models which use a mathematical
methodology based on accepted financial theories, depending on the product type and its components.
Cash at bank and in hand consist of demand deposits with the Central Bank of Nigeria together with cash in tills.
Accordingly, the carrying amount of these balances is deemed an appropriate approximation of the fair value.
Both loans and advances to banks and customers noted above are level 3 financial assets. Loans and advances to banks
comprise secured loans, short-term placements with banks including collateral and unsettled financial transactions. The
secured loans have been valued as above and using the valuation technique described below. The carrying amount of
the other items is deemed a reasonable approximation of their fair value, as the transactions are very short-term in
duration. This includes intercompany balances.
The fair valuation of loans and advances to customers is an area of considerable estimation and uncertainty as there is
no observable market and values are significantly affected by customer behaviour. These comprise secured loans,
unsecured loans and corporate loans.
The fair values of mortgage portfolios have been estimated by comparing existing contractual interest rates over the
weighted average lives with an estimation of new business interest rates based on competitor market information.
Adjustments have also been made to reduce:
- the weighted average lives to reflect the uncertainty inherent in the value that could be achieved, given that the
borrower could re-finance at any time;
- discount the value of performing loans with a higher loan-to-value ratio to reflect the higher risk of this part of
the portfolio and the fact that this is outside the Company’s normal underwriting standards; and
- discount the collateral value of non-performing loans with a higher loan-to-value ratio to reflect the
significantly higher possibility of re-possession and the lower value that is achieved on repossession and to
take cognisance of rates available in the market for loans in arrears but with a lower loan-to-value ratio.
Unsecured loans are overdrafts and personal loans. The weighted average lives of these portfolios are short, and the
business was written relatively recently. As a result, contractual interest rates approximate new business interest rates,
and therefore no mark-to-market surplus or deficit has been recorded with respect to the performing book and discounts
applied to the non-performing book.
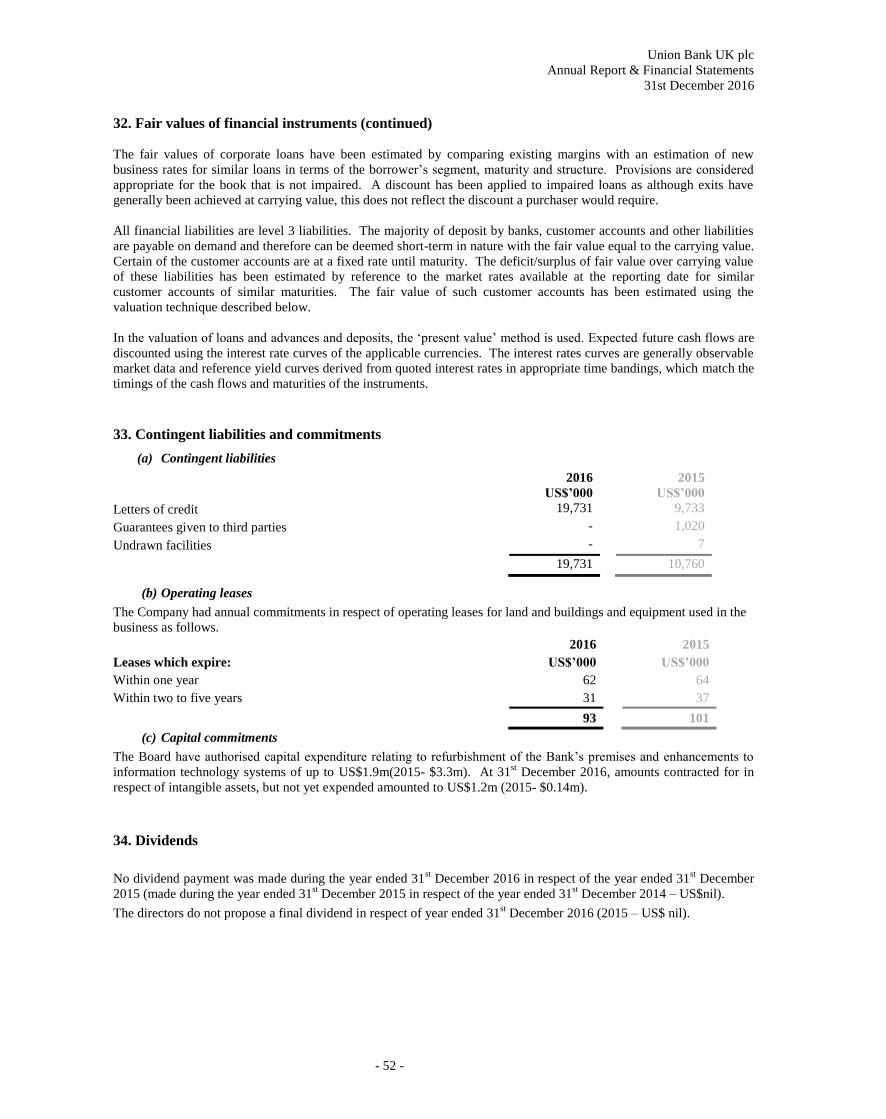
Union Bank UK plc
Annual Report & Financial Statements
31st December 2016
- 52 -
32. Fair values of financial instruments (continued)
The fair values of corporate loans have been estimated by comparing existing margins with an estimation of new
business rates for similar loans in terms of the borrower’s segment, maturity and structure. Provisions are considered
appropriate for the book that is not impaired. A discount has been applied to impaired loans as although exits have
generally been achieved at carrying value, this does not reflect the discount a purchaser would require.
All financial liabilities are level 3 liabilities. The majority of deposit by banks, customer accounts and other liabilities
are payable on demand and therefore can be deemed short-term in nature with the fair value equal to the carrying value.
Certain of the customer accounts are at a fixed rate until maturity. The deficit/surplus of fair value over carrying value
of these liabilities has been estimated by reference to the market rates available at the reporting date for similar
customer accounts of similar maturities. The fair value of such customer accounts has been estimated using the
valuation technique described below.
In the valuation of loans and advances and deposits, the ‘present value’ method is used. Expected future cash flows are
discounted using the interest rate curves of the applicable currencies. The interest rates curves are generally observable
market data and reference yield curves derived from quoted interest rates in appropriate time bandings, which match the
timings of the cash flows and maturities of the instruments.
33. Contingent liabilities and commitments
(a) Contingent liabilities
2016 2015
US$’000 US$’000
Letters of credit 19,731 9,733
Guarantees given to third parties - 1,020
Undrawn facilities - 7
19,731 10,760
(b) Operating leases
The Company had annual commitments in respect of operating leases for land and buildings and equipment used in the
business as follows.
2016 2015
Leases which expire: US$’000 US$’000
Within one year 62 64
Within two to five years 31 37
93 101
(c) Capital commitments
The Board have authorised capital expenditure relating to refurbishment of the Bank’s premises and enhancements to
information technology systems of up to US$1.9m(2015- $3.3m). At 31st December 2016, amounts contracted for in
respect of intangible assets, but not yet expended amounted to US$1.2m (2015- $0.14m).
34. Dividends
No dividend payment was made during the year ended 31st December 2016 in respect of the year ended 31
st December
2015 (made during the year ended 31st December 2015 in respect of the year ended 31
st December 2014 – US$nil).
The directors do not propose a final dividend in respect of year ended 31st December 2016 (2015 – US$ nil).
Union Bank UK plc
Annual Report & Financial Statements
31st December 2016
- 53 -
35. Ultimate parent company and controlling party
The Bank is a directly wholly-owned subsidiary of its parent and ultimate holding undertaking, Union Bank of Nigeria
Plc, a company incorporated in Nigeria and listed on the Nigerian Stock Exchange. The smallest and largest group in
which the Bank is consolidated is Union Bank of Nigeria Plc. The directors do not consider there to be an ultimate
controlling party.
Copies of the Group financial statements of Union Bank of Nigeria Plc can be obtained from:
Corporate Affairs Department
Union Bank of Nigeria Plc
Stallion Plaza
36, Marina, Lagos
Nigeria
36. Subsequent events
There are no material adjusting or non-adjusting events after the reporting date.