Embed Size (px)
Citation preview

March 2015Peter Altabef | President & CEOJanet Haugen | SVP & CFO
Unisys Investor Presentationwww.unisys.com/investor
© 2015 Unisys Corporation. All rights reserved. 2
Disclaimer
• Statements made by Unisys during today's presentation that are not historical facts, including those regarding future performance, are forward-looking statements under the Private Securities Litigation Reform Act of 1995. These statements are based on current expectations and assumptions and involve risks and uncertainties that could cause actual results to differ from expectations. These risks and uncertainties are discussed in the company's reports filed with the SEC and in today's earnings release.
• This presentation also includes non-GAAP financial measures including non-GAAP Operating Profit, non-GAAP Earnings per Diluted Share, Free Cash Flow, EBITDA, Adjusted EBITDA, and Net Cash. Definitions of these non-GAAP financial measures and reconciliations to GAAP measures are included in this presentation.
• These presentation materials can be accessed on the Unisys Investor Web site at www.unisys.com/investor. Information in this presentation is as of January 29, 2015 and Unisys undertakes no duty to update this information.
© 2015 Unisys Corporation. All rights reserved. 3
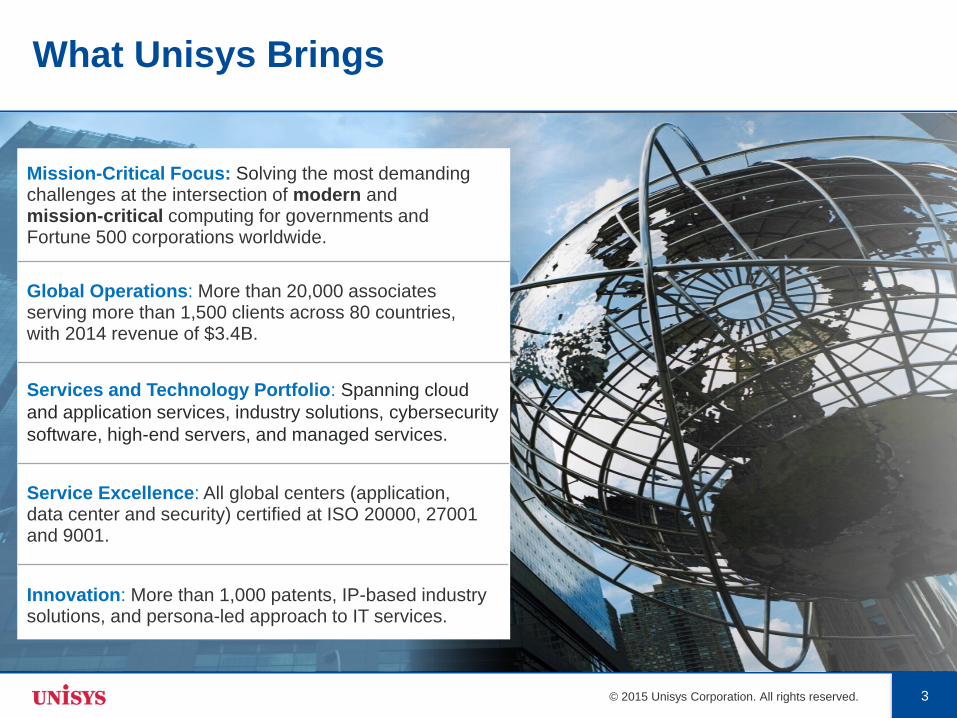
What Unisys Brings
Mission-Critical Focus: Solving the most demanding challenges at the intersection of modern and mission-critical computing for governments and Fortune 500 corporations worldwide.
Global Operations: More than 20,000 associates serving more than 1,500 clients across 80 countries, with 2014 revenue of $3.4B.
Innovation: More than 1,000 patents, IP-based industry solutions, and persona-led approach to IT services.
Service Excellence: All global centers (application, data center and security) certified at ISO 20000, 27001 and 9001.
Services and Technology Portfolio: Spanning cloud
and application services, industry solutions, cybersecurity
software, high-end servers, and managed services.
© 2015 Unisys Corporation. All rights reserved. 4
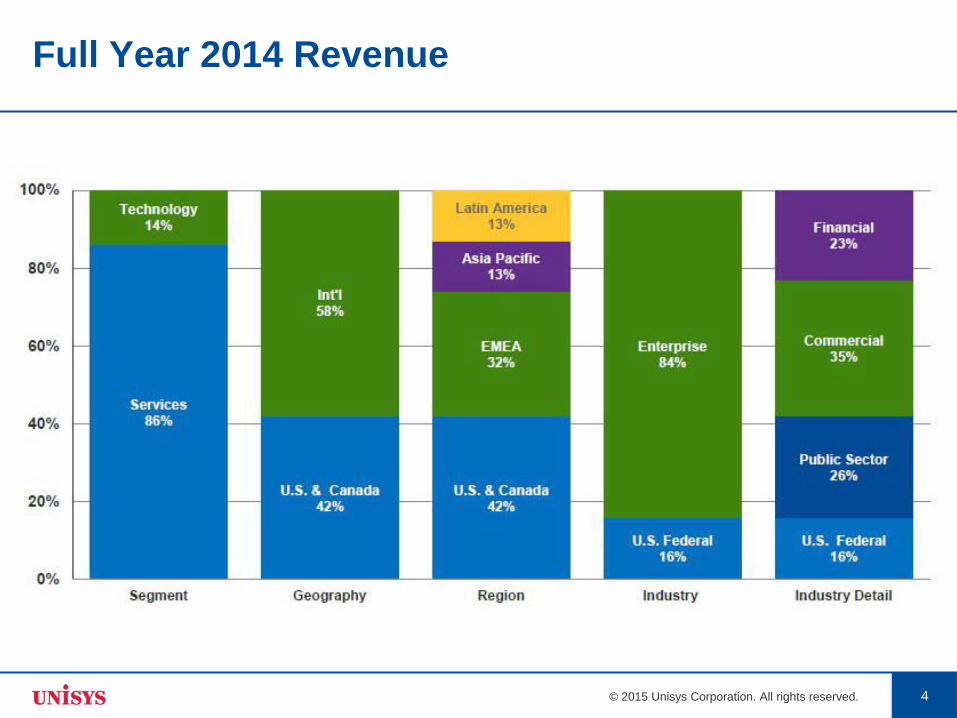
Full Year 2014 Revenue

© 2015 Unisys Corporation. All rights reserved.
Thank you
www.unisys.com/investor
© 2015 Unisys Corporation. All rights reserved. 6
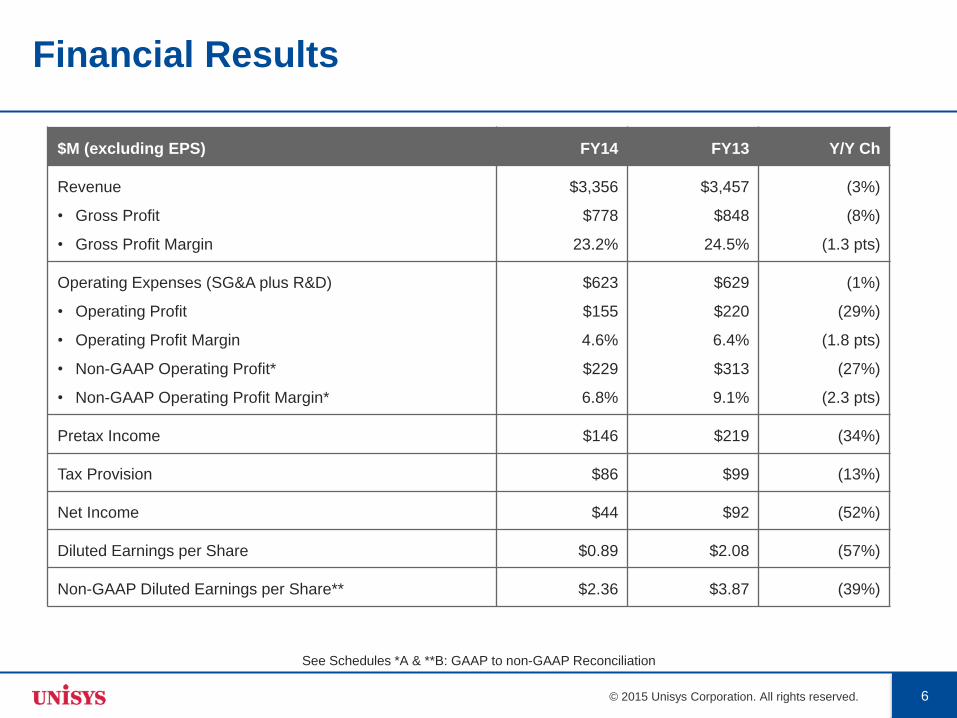
$M (excluding EPS) FY14 FY13 Y/Y Ch
Revenue
• Gross Profit
• Gross Profit Margin
$3,356
$778
23.2%
$3,457
$848
24.5%
(3%)
(8%)
(1.3 pts)
Operating Expenses (SG&A plus R&D)
• Operating Profit
• Operating Profit Margin
• Non-GAAP Operating Profit*
• Non-GAAP Operating Profit Margin*
$623
$155
4.6%
$229
6.8%
$629
$220
6.4%
$313
9.1%
(1%)
(29%)
(1.8 pts)
(27%)
(2.3 pts)
Pretax Income $146 $219 (34%)
Tax Provision $86 $99 (13%)
Net Income $44 $92 (52%)
Diluted Earnings per Share $0.89 $2.08 (57%)
Non-GAAP Diluted Earnings per Share** $2.36 $3.87 (39%)
Financial Results
See Schedules *A & **B: GAAP to non-GAAP Reconciliation
© 2015 Unisys Corporation. All rights reserved. 7
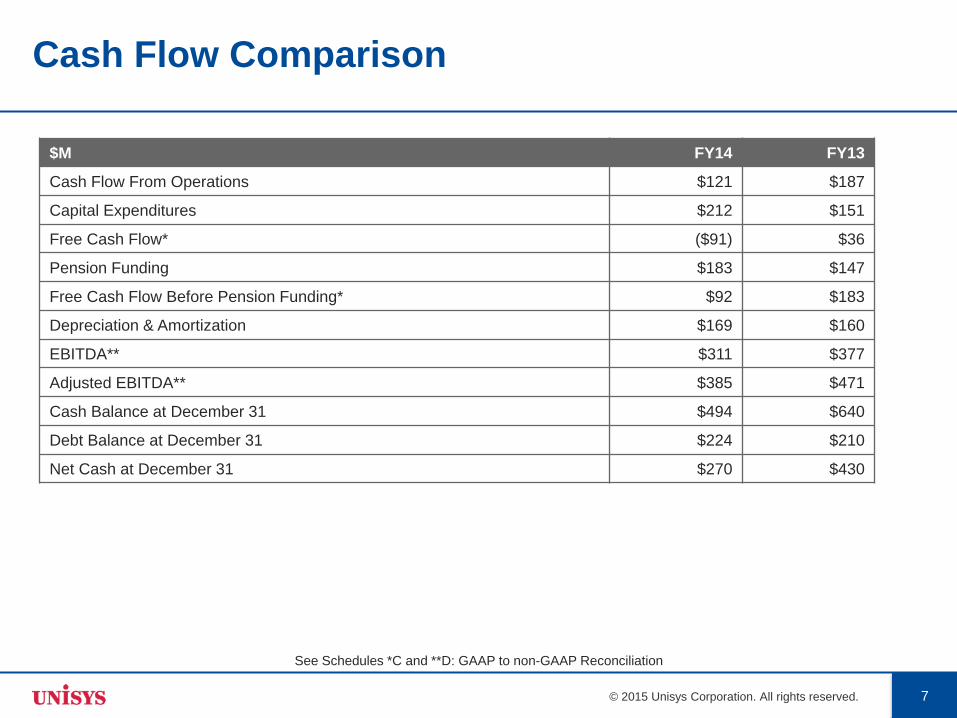
Cash Flow Comparison
$M FY14 FY13
Cash Flow From Operations $121 $187
Capital Expenditures $212 $151
Free Cash Flow* ($91) $36
Pension Funding $183 $147
Free Cash Flow Before Pension Funding* $92 $183
Depreciation & Amortization $169 $160
EBITDA** $311 $377
Adjusted EBITDA** $385 $471
Cash Balance at December 31 $494 $640
Debt Balance at December 31 $224 $210
Net Cash at December 31 $270 $430
See Schedules *C and **D: GAAP to non-GAAP Reconciliation
© 2015 Unisys Corporation. All rights reserved. 8
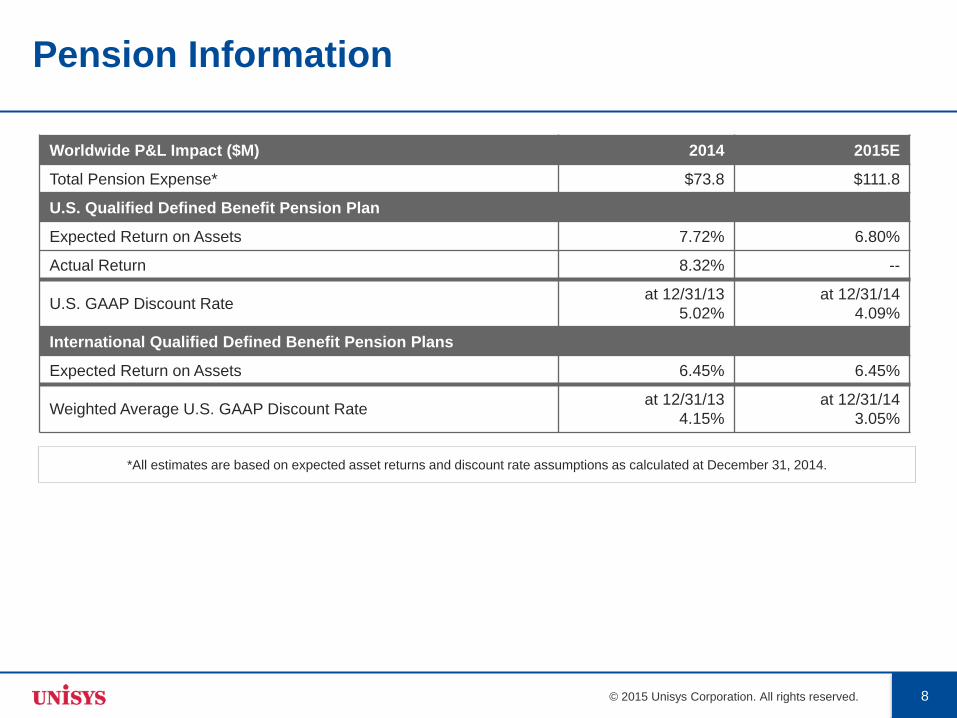
Pension Information
Worldwide P&L Impact ($M) 2014 2015E
Total Pension Expense* $73.8 $111.8
U.S. Qualified Defined Benefit Pension Plan
Expected Return on Assets 7.72% 6.80%
Actual Return 8.32% --
U.S. GAAP Discount Rateat 12/31/13
5.02%
at 12/31/14
4.09%
International Qualified Defined Benefit Pension Plans
Expected Return on Assets 6.45% 6.45%
Weighted Average U.S. GAAP Discount Rateat 12/31/13
4.15%
at 12/31/14
3.05%
*All estimates are based on expected asset returns and discount rate assumptions as calculated at December 31, 2014.
© 2015 Unisys Corporation. All rights reserved. 9
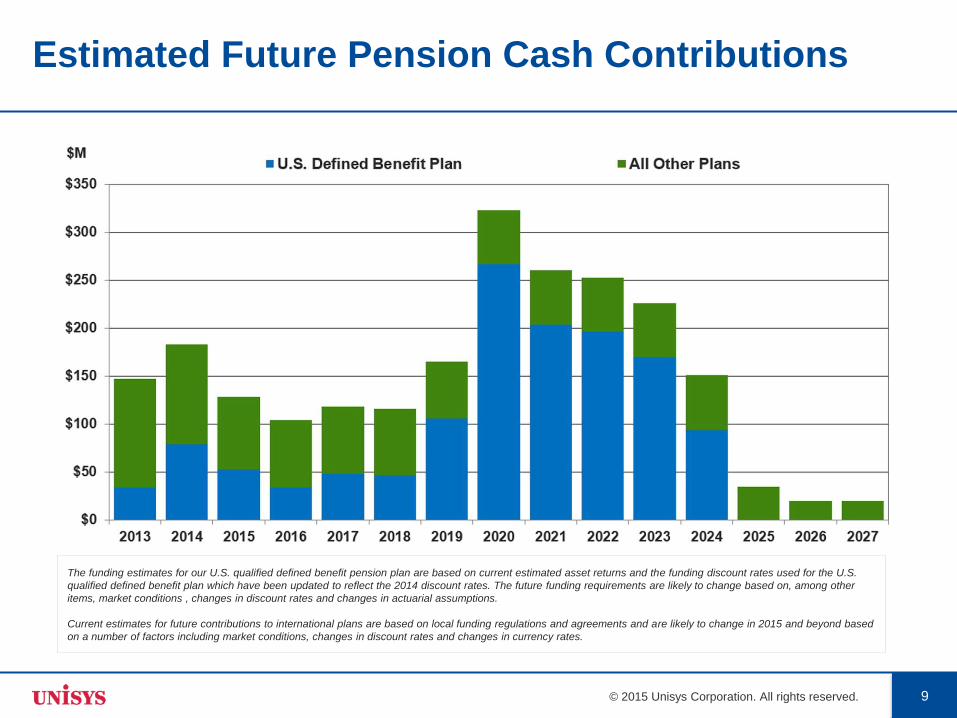
Estimated Future Pension Cash Contributions
The funding estimates for our U.S. qualified defined benefit pension plan are based on current estimated asset returns and the funding discount rates used for the U.S.
qualified defined benefit plan which have been updated to reflect the 2014 discount rates. The future funding requirements are likely to change based on, among other
items, market conditions , changes in discount rates and changes in actuarial assumptions.
Current estimates for future contributions to international plans are based on local funding regulations and agreements and are likely to change in 2015 and beyond based
on a number of factors including market conditions, changes in discount rates and changes in currency rates.
© 2015 Unisys Corporation. All rights reserved. 10
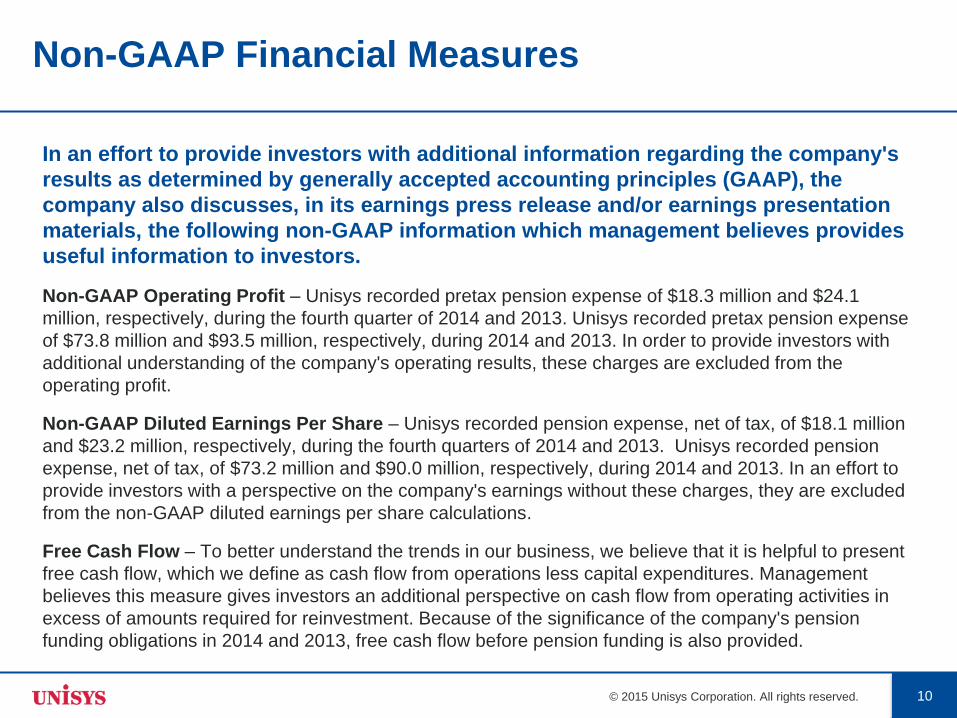
Non-GAAP Financial Measures
In an effort to provide investors with additional information regarding the company's
results as determined by generally accepted accounting principles (GAAP), the
company also discusses, in its earnings press release and/or earnings presentation
materials, the following non-GAAP information which management believes provides
useful information to investors.
Non-GAAP Operating Profit – Unisys recorded pretax pension expense of $18.3 million and $24.1
million, respectively, during the fourth quarter of 2014 and 2013. Unisys recorded pretax pension expense
of $73.8 million and $93.5 million, respectively, during 2014 and 2013. In order to provide investors with
additional understanding of the company's operating results, these charges are excluded from the
operating profit.
Non-GAAP Diluted Earnings Per Share – Unisys recorded pension expense, net of tax, of $18.1 million
and $23.2 million, respectively, during the fourth quarters of 2014 and 2013. Unisys recorded pension
expense, net of tax, of $73.2 million and $90.0 million, respectively, during 2014 and 2013. In an effort to
provide investors with a perspective on the company's earnings without these charges, they are excluded
from the non-GAAP diluted earnings per share calculations.
Free Cash Flow – To better understand the trends in our business, we believe that it is helpful to present
free cash flow, which we define as cash flow from operations less capital expenditures. Management
believes this measure gives investors an additional perspective on cash flow from operating activities in
excess of amounts required for reinvestment. Because of the significance of the company's pension
funding obligations in 2014 and 2013, free cash flow before pension funding is also provided.
© 2015 Unisys Corporation. All rights reserved. 11
Non-GAAP Financial Measures
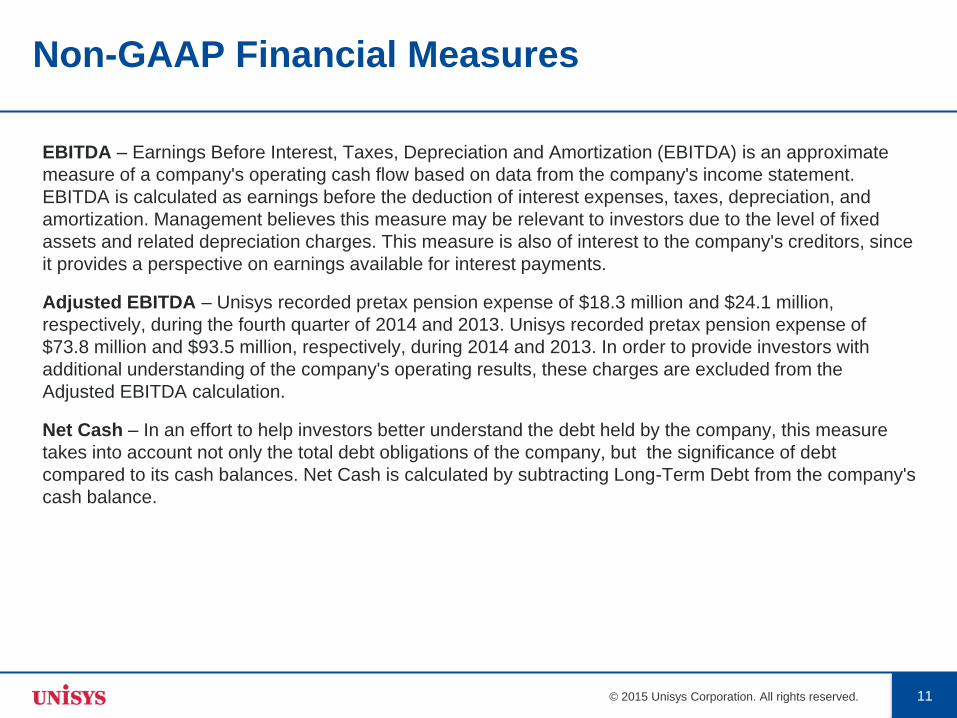
EBITDA – Earnings Before Interest, Taxes, Depreciation and Amortization (EBITDA) is an approximate
measure of a company's operating cash flow based on data from the company's income statement.
EBITDA is calculated as earnings before the deduction of interest expenses, taxes, depreciation, and
amortization. Management believes this measure may be relevant to investors due to the level of fixed
assets and related depreciation charges. This measure is also of interest to the company's creditors, since
it provides a perspective on earnings available for interest payments.
Adjusted EBITDA – Unisys recorded pretax pension expense of $18.3 million and $24.1 million,
respectively, during the fourth quarter of 2014 and 2013. Unisys recorded pretax pension expense of
$73.8 million and $93.5 million, respectively, during 2014 and 2013. In order to provide investors with
additional understanding of the company's operating results, these charges are excluded from the
Adjusted EBITDA calculation.
Net Cash – In an effort to help investors better understand the debt held by the company, this measure
takes into account not only the total debt obligations of the company, but the significance of debt
compared to its cash balances. Net Cash is calculated by subtracting Long-Term Debt from the company's
cash balance.
© 2015 Unisys Corporation. All rights reserved. 12
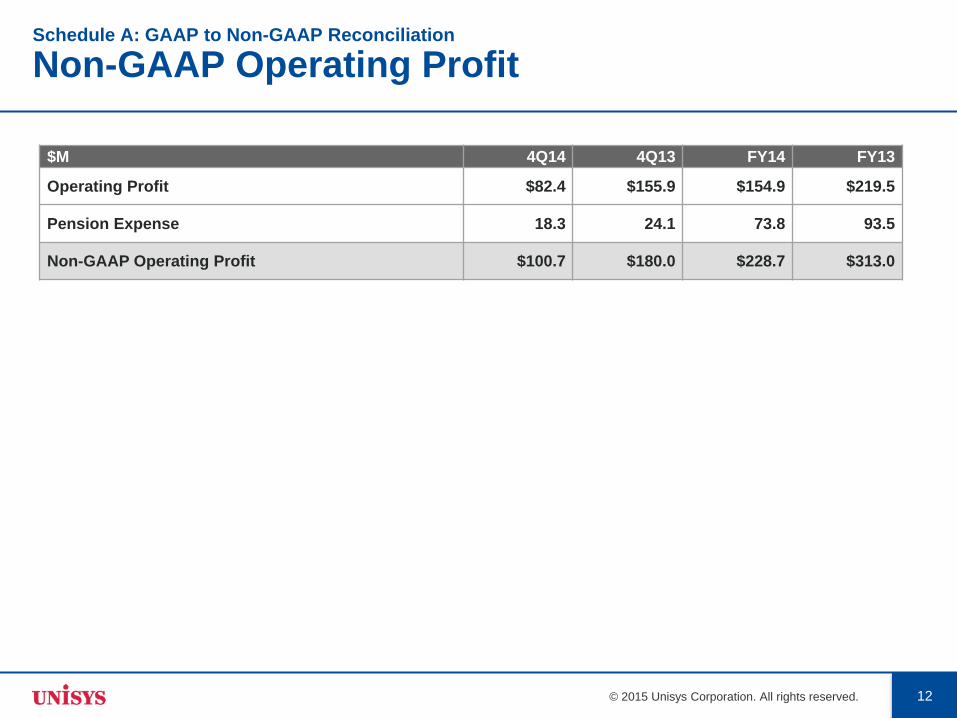
Schedule A: GAAP to Non-GAAP Reconciliation
Non-GAAP Operating Profit
$M 4Q14 4Q13 FY14 FY13
Operating Profit $82.4 $155.9 $154.9 $219.5
Pension Expense 18.3 24.1 73.8 93.5
Non-GAAP Operating Profit $100.7 $180.0 $228.7 $313.0
© 2015 Unisys Corporation. All rights reserved. 13
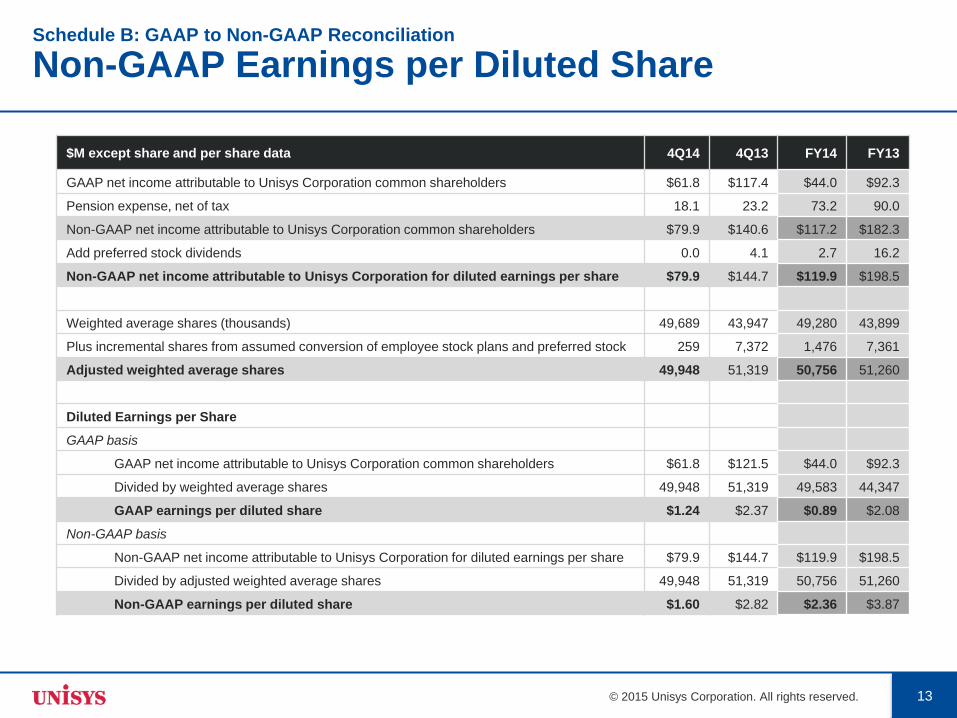
Schedule B: GAAP to Non-GAAP Reconciliation
Non-GAAP Earnings per Diluted Share
$M except share and per share data 4Q14 4Q13 FY14 FY13
GAAP net income attributable to Unisys Corporation common shareholders $61.8 $117.4 $44.0 $92.3
Pension expense, net of tax 18.1 23.2 73.2 90.0
Non-GAAP net income attributable to Unisys Corporation common shareholders $79.9 $140.6 $117.2 $182.3
Add preferred stock dividends 0.0 4.1 2.7 16.2
Non-GAAP net income attributable to Unisys Corporation for diluted earnings per share $79.9 $144.7 $119.9 $198.5
Weighted average shares (thousands) 49,689 43,947 49,280 43,899
Plus incremental shares from assumed conversion of employee stock plans and preferred stock 259 7,372 1,476 7,361
Adjusted weighted average shares 49,948 51,319 50,756 51,260
Diluted Earnings per Share
GAAP basis
GAAP net income attributable to Unisys Corporation common shareholders $61.8 $121.5 $44.0 $92.3
Divided by weighted average shares 49,948 51,319 49,583 44,347
GAAP earnings per diluted share $1.24 $2.37 $0.89 $2.08
Non-GAAP basis
Non-GAAP net income attributable to Unisys Corporation for diluted earnings per share $79.9 $144.7 $119.9 $198.5
Divided by adjusted weighted average shares 49,948 51,319 50,756 51,260
Non-GAAP earnings per diluted share $1.60 $2.82 $2.36 $3.87
© 2015 Unisys Corporation. All rights reserved. 14
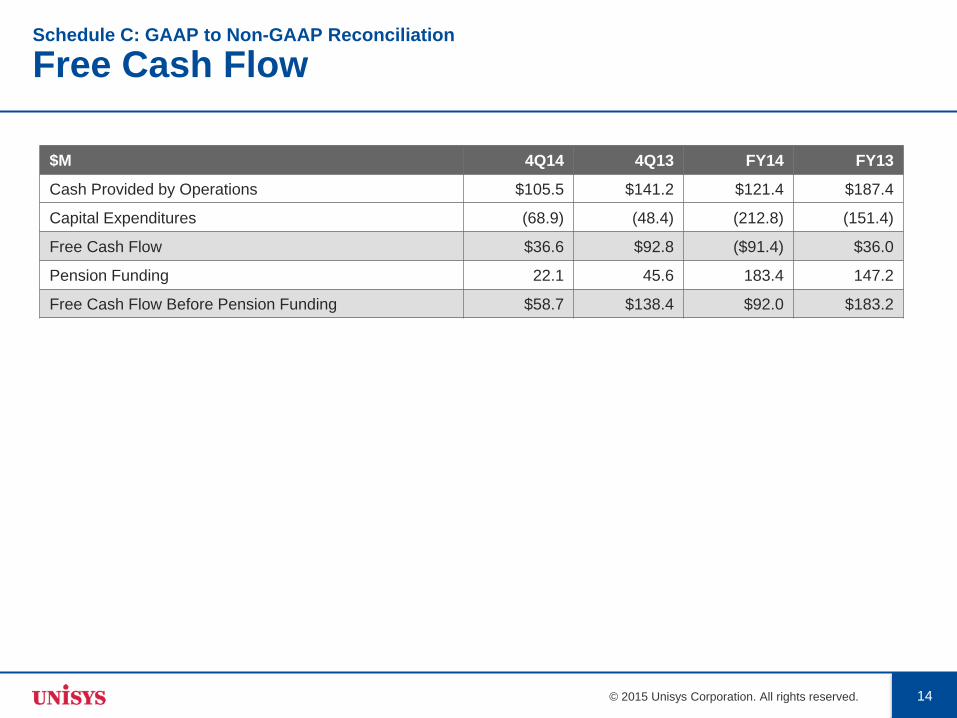
Schedule C: GAAP to Non-GAAP Reconciliation
Free Cash Flow
$M 4Q14 4Q13 FY14 FY13
Cash Provided by Operations $105.5 $141.2 $121.4 $187.4
Capital Expenditures (68.9) (48.4) (212.8) (151.4)
Free Cash Flow $36.6 $92.8 ($91.4) $36.0
Pension Funding 22.1 45.6 183.4 147.2
Free Cash Flow Before Pension Funding $58.7 $138.4 $92.0 $183.2
© 2015 Unisys Corporation. All rights reserved. 15
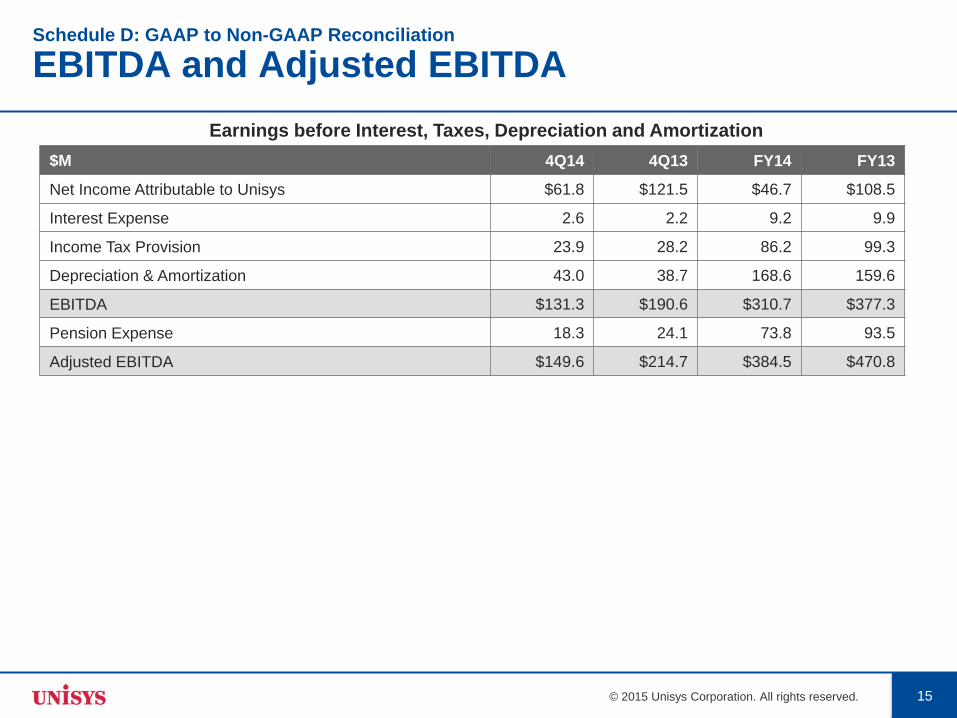
Schedule D: GAAP to Non-GAAP Reconciliation
EBITDA and Adjusted EBITDA
$M 4Q14 4Q13 FY14 FY13
Net Income Attributable to Unisys $61.8 $121.5 $46.7 $108.5
Interest Expense 2.6 2.2 9.2 9.9
Income Tax Provision 23.9 28.2 86.2 99.3
Depreciation & Amortization 43.0 38.7 168.6 159.6
EBITDA $131.3 $190.6 $310.7 $377.3
Pension Expense 18.3 24.1 73.8 93.5
Adjusted EBITDA $149.6 $214.7 $384.5 $470.8
Earnings before Interest, Taxes, Depreciation and Amortization