Embed Size (px)
Citation preview
1
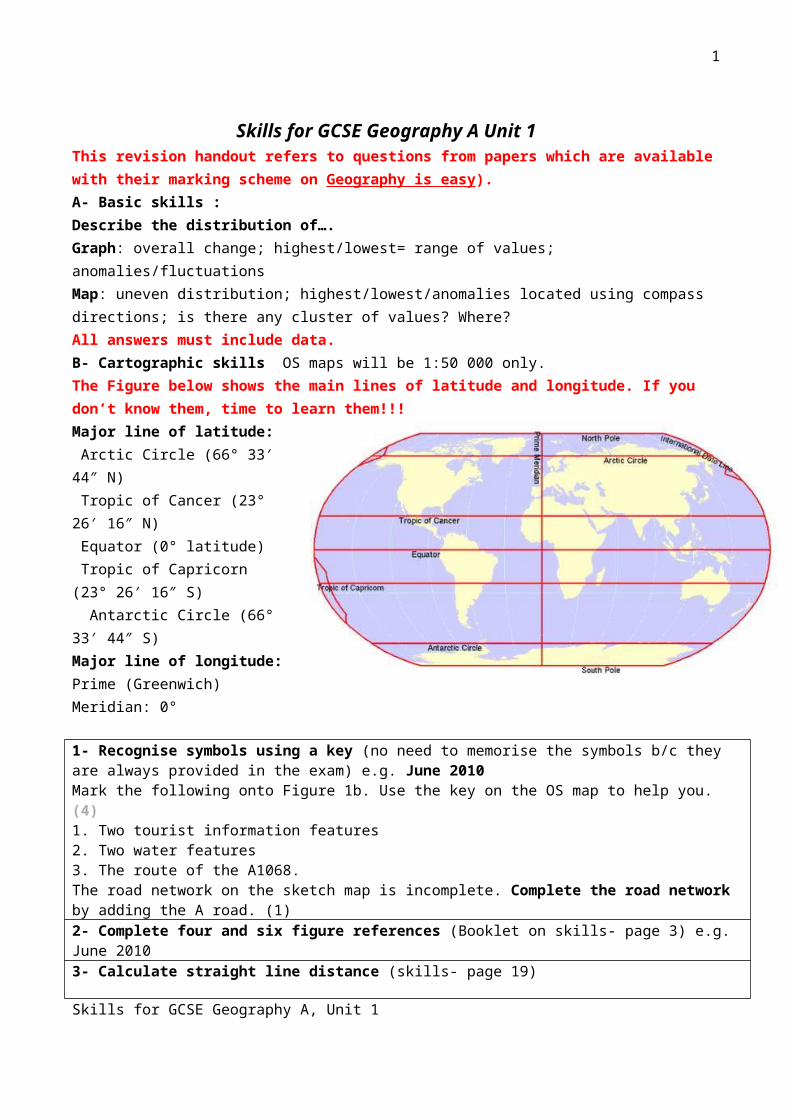
Skills for GCSE Geography A Unit 1This revision handout refers to questions from papers which are available with their marking scheme on Geography is easy). A- Basic skills : Describe the distribution of…. Graph: overall change; highest/lowest= range of values; anomalies/fluctuationsMap: uneven distribution; highest/lowest/anomalies located using compass directions; is there any cluster of values? Where? All answers must include data. B- Cartographic skills OS maps will be 1:50 000 only.The Figure below shows the main lines of latitude and longitude. If you don’t know them, time to learn them!!! Major line of latitude: Arctic Circle (66° 33 44″ N)′ Tropic of Cancer (23° 26 16″ N)′ Equator (0° latitude) Tropic of Capricorn (23° 26 16″ S)′ Antarctic Circle (66° 33 44″ S)′Major line of longitude: Prime (Greenwich) Meridian: 0°
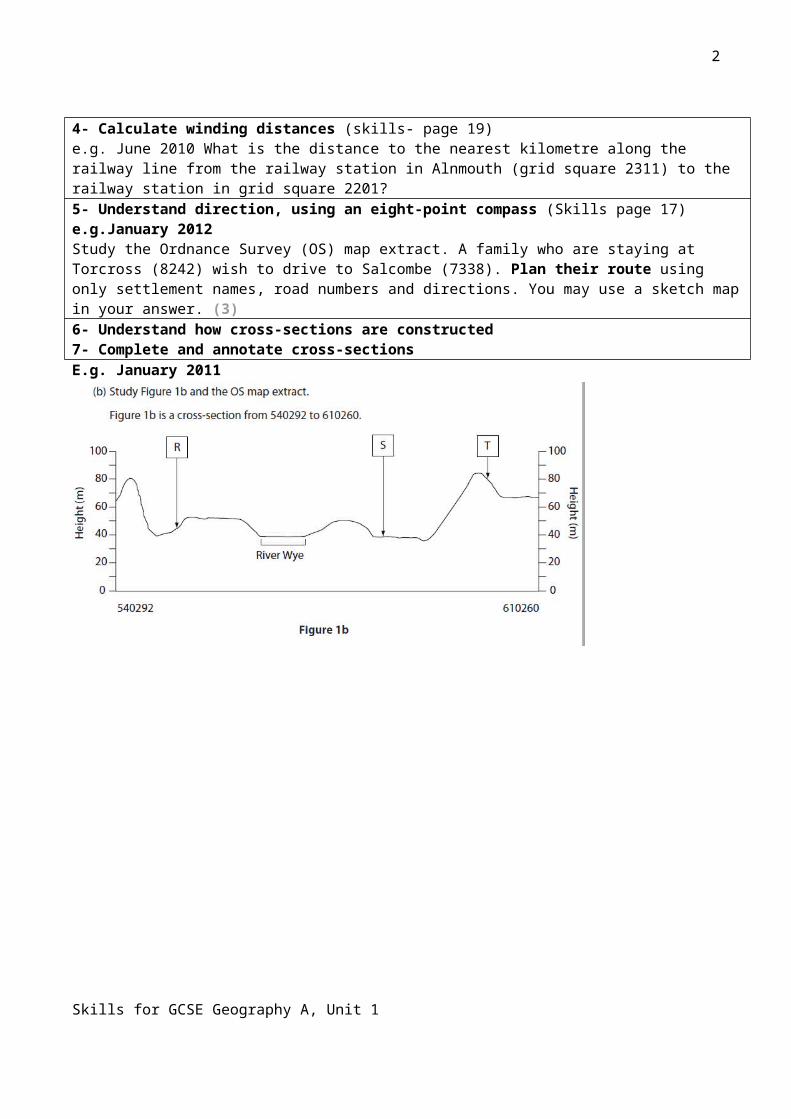
1- Recognise symbols using a key (no need to memorise the symbols b/c they are always provided in the exam) e.g. June 2010Mark the following onto Figure 1b. Use the key on the OS map to help you. (4)1. Two tourist information features2. Two water features3. The route of the A1068.The road network on the sketch map is incomplete. Complete the road network by adding the A road. (1)2- Complete four and six figure references (Booklet on skills- page 3) e.g. June 2010 3- Calculate straight line distance (skills- page 19)4- Calculate winding distances (skills- page 19)e.g. June 2010 What is the distance to the nearest kilometre along the railway line from the railway station in Alnmouth (grid square 2311) to the railway station in grid square 2201?5- Understand direction, using an eight-point compass (Skills page 17)e.g.January 2012Study the Ordnance Survey (OS) map extract. A family who are staying at Torcross (8242) wish to drive to Salcombe (7338). Plan their route using only settlement names, road numbers and directions. You may use a sketch map in your answer. (3)6- Understand how cross-sections are constructed 7- Complete and annotate cross-sections
Skills for GCSE Geography A, Unit 1
2
E.g. January 2011
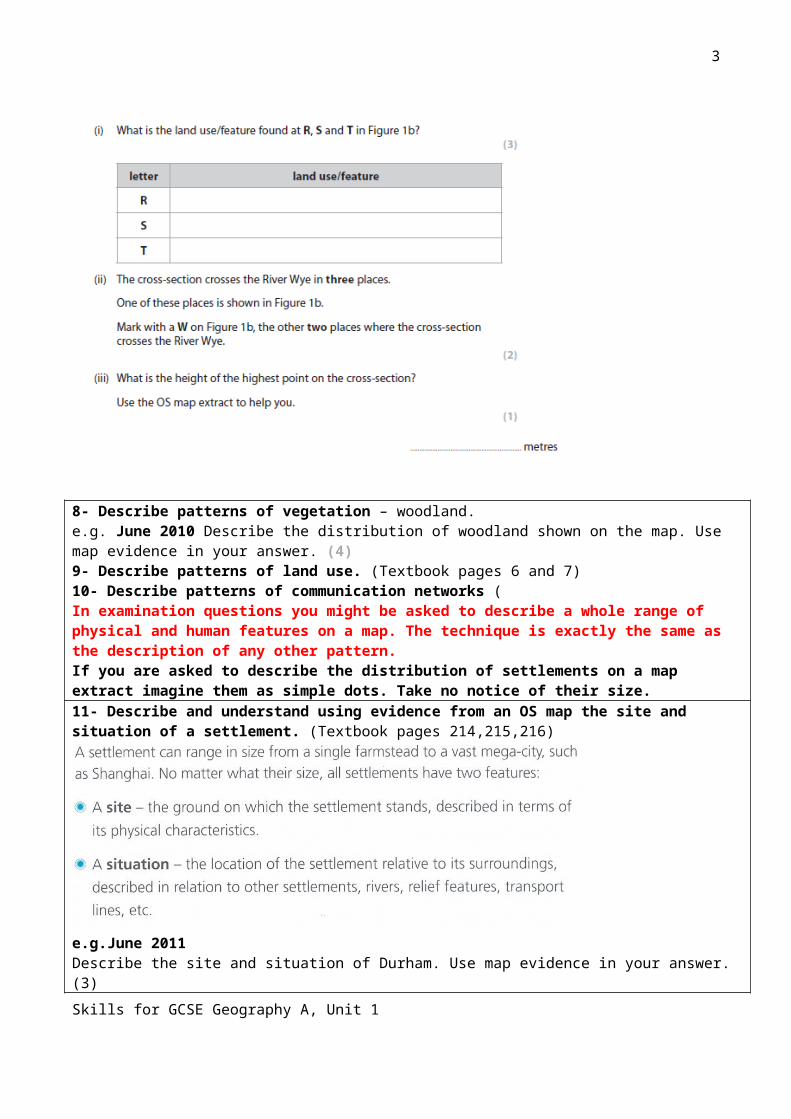
8- Describe patterns of vegetation – woodland. e.g. June 2010 Describe the distribution of woodland shown on the map. Use map evidence in your answer. (4)9- Describe patterns of land use. (Textbook pages 6 and 7)10- Describe patterns of communication networks (In examination questions you might be asked to describe a whole range of physical and human features on a map. The technique is exactly the same as the description of any other pattern.If you are asked to describe the distribution of settlements on a map extract imagine them as simple dots. Take no notice of their size. 11- Describe and understand using evidence from an OS map the site and situation of a settlement. (Textbook pages 214,215,216)
Skills for GCSE Geography A, Unit 1
3
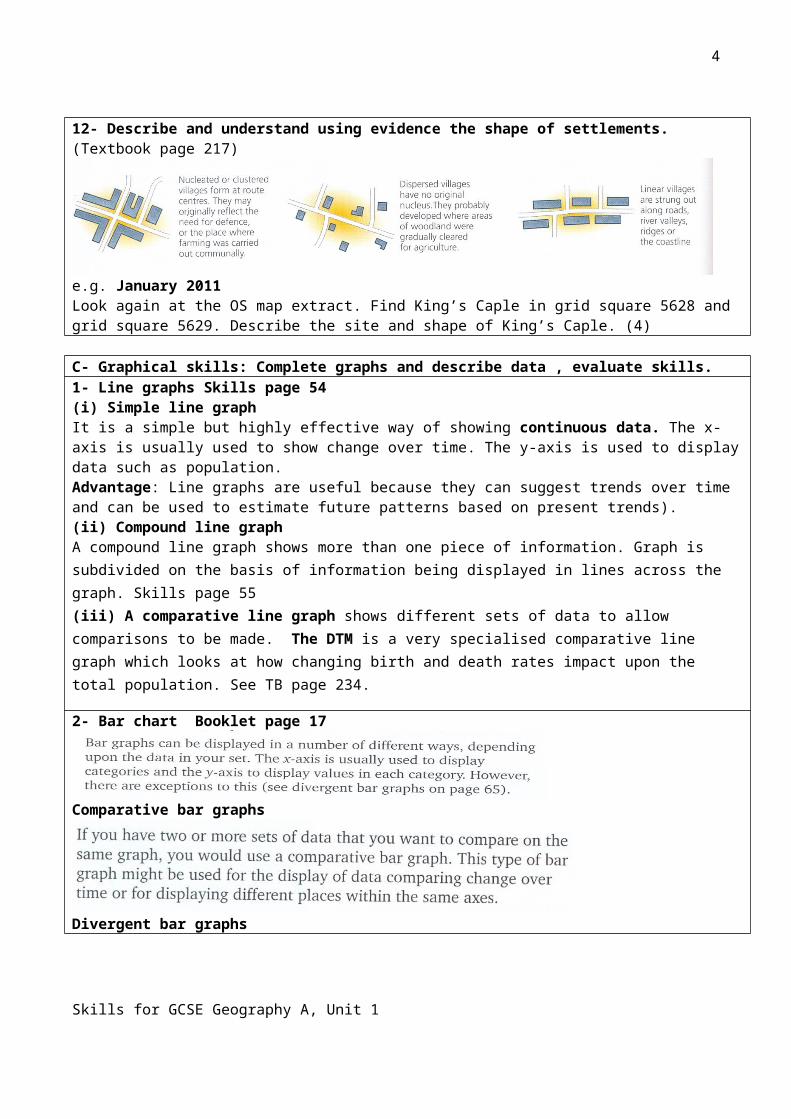
e.g.June 2011Describe the site and situation of Durham. Use map evidence in your answer. (3)12- Describe and understand using evidence the shape of settlements. (Textbook page 217)
e.g. January 2011Look again at the OS map extract. Find King’s Caple in grid square 5628 and grid square 5629. Describe the site and shape of King’s Caple. (4)
C- Graphical skills: Complete graphs and describe data , evaluate skills. 1- Line graphs Skills page 54(i) Simple line graphIt is a simple but highly effective way of showing continuous data. The x-axis is usually used to show change over time. The y-axis is used to display data such as population.Advantage: Line graphs are useful because they can suggest trends over time and can be used to estimate future patterns based on present trends). (ii) Compound line graphA compound line graph shows more than one piece of information. Graph is subdivided on the basis of information being displayed in lines across the graph. Skills page 55(iii) A comparative line graph shows different sets of data to allow comparisons to be made. The DTM is a very specialised comparative line graph which looks at how changing birth and death rates impact upon the total population. See TB page 234.
2- Bar chart Booklet page 17
Comparative bar graphs
Skills for GCSE Geography A, Unit 1
4
Divergent bar graphs
Compound bar graphs Booklet page 21
Advantage: Bar graphs can show positive and negative valuesDisadvantage: If there is a wide range of data to be displayed, the bar graph loses its impact as it becomes difficult to read accurately.
3- Histograms Booklet page 23
Disadvantage of histograms: too many or too few classes can hide important patterns in the data.
4- Flow lines (used to show movement as either arrows or lines)
Disadvantage of flow lines: Choosing either the wrong scale of map or the wrong scale for your arrows/lines will make your map look very unclear.6- Rose / ray diagrams Skills page 64Consists of straight lines which show movement or a connection between two places.
Skills for GCSE Geography A, Unit 1
5
Advantage: show the direction as well as the data Disadvantage: Only used with a limited type of data
7- Pictograms Booklet page 25
Disadvantage: only a limited range of data can be displayed
8- Pie diagrams Skill page 60
Advantage: Give a good visual representation of the data.Disadvantage: Too many categories (more than six) make a pie chart difficult to interpret
9- Scattergraphs Skills page 76 (To be learned from booklet)June 2011Complete the scattergraph (Figure 2) for sites 7 and 8. Use the data in the table below.Give one reason why a scattergraph is a good way of displaying this type of data. (2)10- Pyramid graphs (Divergent bar graph) Textbook page 248
e.g. June 2010 Complete the population graph for Warkworth and England (Figure 2a).Use the data in the table below.Comment on the age structure of Warkworth compared to England.Use population data in your answer.
11- Triangular graphs Skills page 66
Skills for GCSE Geography A, Unit 1
6
Advantage( 1st bullet point)/ Disadvantage
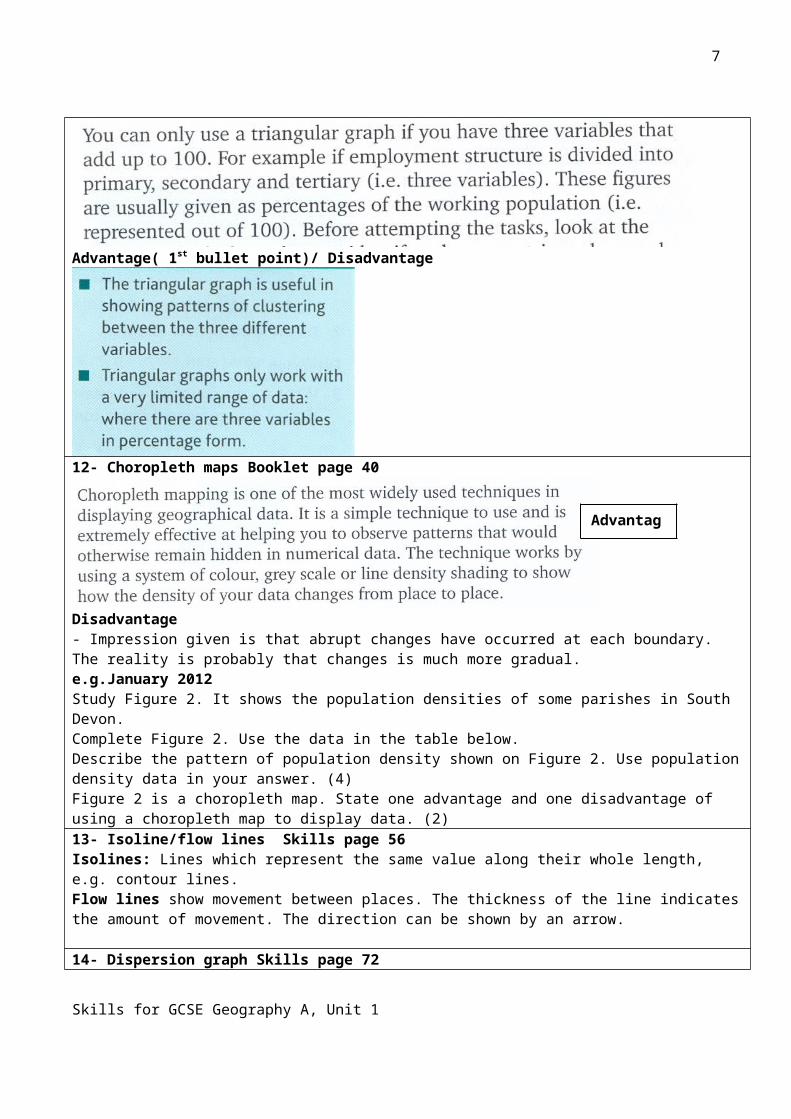
12- Choropleth maps Booklet page 40
Disadvantage - Impression given is that abrupt changes have occurred at each boundary. The reality is probably that changes is much more gradual.e.g.January 2012Study Figure 2. It shows the population densities of some parishes in South Devon.Complete Figure 2. Use the data in the table below.Describe the pattern of population density shown on Figure 2. Use population density data in your answer. (4)Figure 2 is a choropleth map. State one advantage and one disadvantage of using a choropleth map to display data. (2)13- Isoline/flow lines Skills page 56Isolines: Lines which represent the same value along their whole length, e.g. contour lines. Flow lines show movement between places. The thickness of the line indicates the amount of movement. The direction can be shown by an arrow.
14- Dispersion graph Skills page 72
Advantage:This technique is a useful visual representation of the dispersion in a data set.Disadvantage: - Dispersion diagrams usually display only one set at a time. Skills for GCSE Geography A, Unit 1
Advantage
7
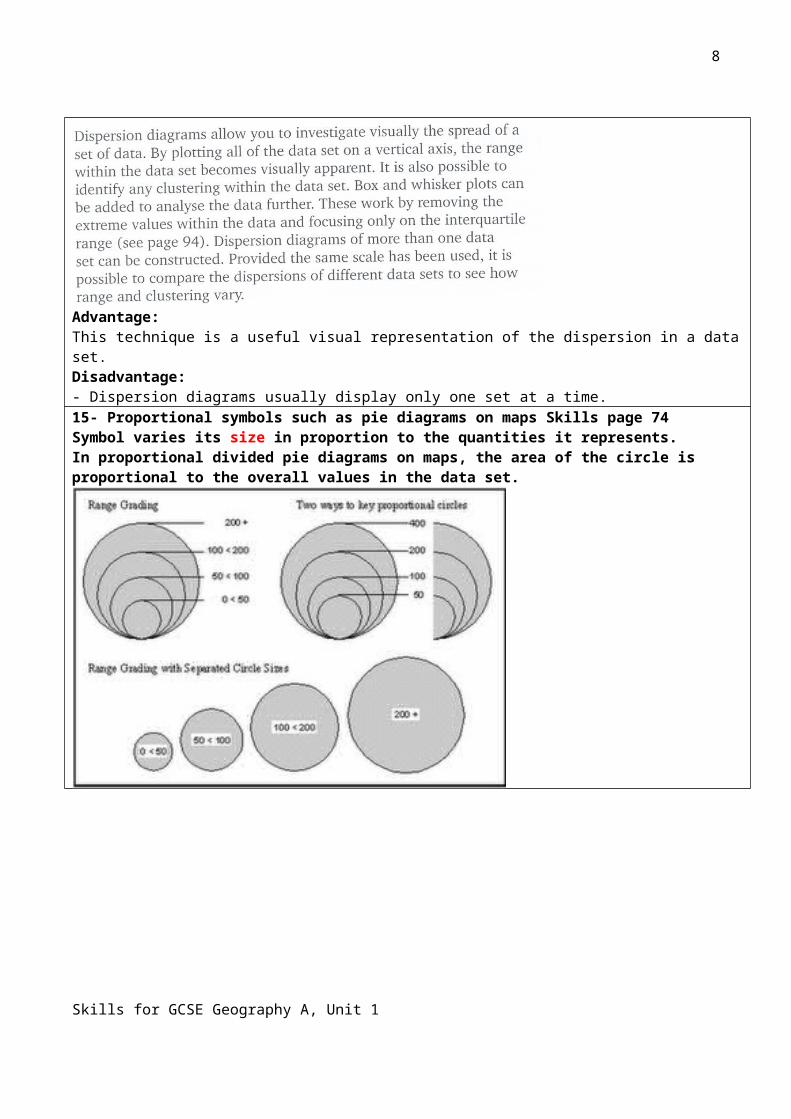
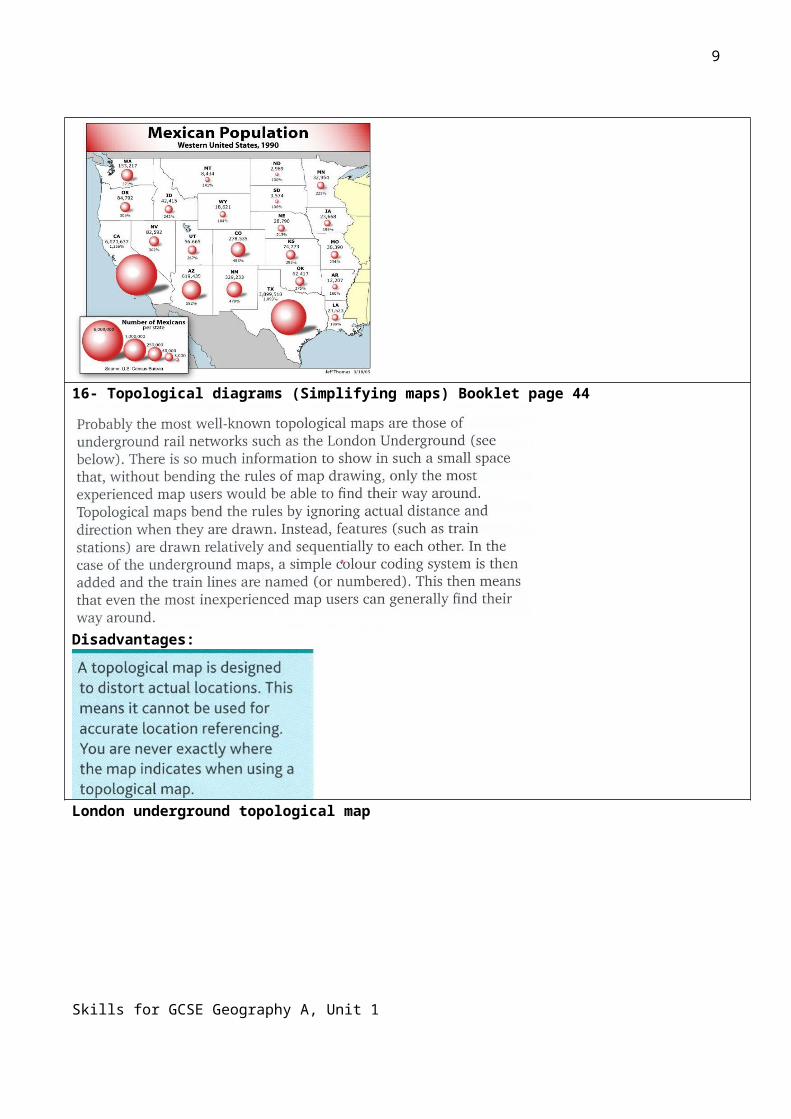
15- Proportional symbols such as pie diagrams on maps Skills page 74Symbol varies its size in proportion to the quantities it represents.In proportional divided pie diagrams on maps, the area of the circle is proportional to the overall values in the data set.
16- Topological diagrams (Simplifying maps) Booklet page 44
Skills for GCSE Geography A, Unit 1
8
Disadvantages:
London underground topological map
D- GIS skillsWhat is GIS?A geographical information system (GIS) integrates hardware, software, and data for capturing, managing, analyzing and displaying all forms of geographical information. e.g. Using the census data to generate a choropleth map of the population density of different counties within the UK. More example page 47 in the Key points box.GIS layering: Data layers are the individual layers of spatial data that can be used in a GIS. Typically, each data layer shows one type of feature (such as roads, rivers, states, or altitude) You have used GIS layering to show the location of the three sites on a satellite image for your coursework.
e.g. June 2010Skills for GCSE Geography A, Unit 1
9
Study Figure 2b. It shows one use of Geographical Information Systems (GIS). Describe what is meant by layering information. You may use Figure 2b to help you.Suggest one group of people who might use the information shown in Figure 2b.January 2011 The maps in Figure 2a and Figure 2b could have been created using GIS.State two advantages of using GIS compared to looking at the maps separately. (2)June 2011Describe one way that ICT can be used to prepare for fieldwork or to collect fieldwork data. (3)January 2012Geographical Information Systems (GIS) could be used to display the populationdata in Figure 2.(i) What is meant by the term Geographical Information Systems (GIS)? (2)The population densities for some South Devon parishes is shown on Figure 2. State one other piece of information that could be added using GIS to make the map more useful. (1)
Skills for GCSE Geography A, Unit 1
![3D mesh description using Subdivided Shape-Curvature-Graphs · Curvature-Graph after enrichment. (Image from [Pea17]) 2. Construction of the Subdivided Shape-Curvature-Graph The proposed](https://img.pdfslide.net/doc/110x75/612652ed33d28d08441bf156/3d-mesh-description-using-subdivided-shape-curvature-graphs-curvature-graph-after.jpg)