Embed Size (px)
Citation preview
1
Unit 1
Population Pattern, Data
1
News?
2
iRAT This is a closed-book, no notes test! You have 10 minutes to complete the test. Circle the correct answers to each question on
the answer sheet provided. Also record your answers on the question
sheet. When you are done, turn over your paper to
signal that you have finished. Turn in the answer sheet
3
tRAT—as a team (Closed Book!)
• You have 15 minutes• Designate one person to be
the official team “scratcher.”• Don’t select an answer until
your team agrees.• Use a coin or a key to
scratch.• You’ll know you have the
correct answer when you find the star!
“Missed” questions?
Does any team want to appeal?
5
A.D.2000
A.D.1000
A.D.1
1000B.C.
2000B.C.
3000B.C.
4000B.C.
5000B.C.
6000B.C.
7000B.C.
1+ million years
8
7
6
5
2
1
4
3
OldStoneAge New Stone Age
BronzeAge
IronAge
MiddleAges
ModernAge
9
10
11
12
A.D.3000
A.D.4000
A.D.5000
18001900
1950
1975
2000
2100
FutureBillions
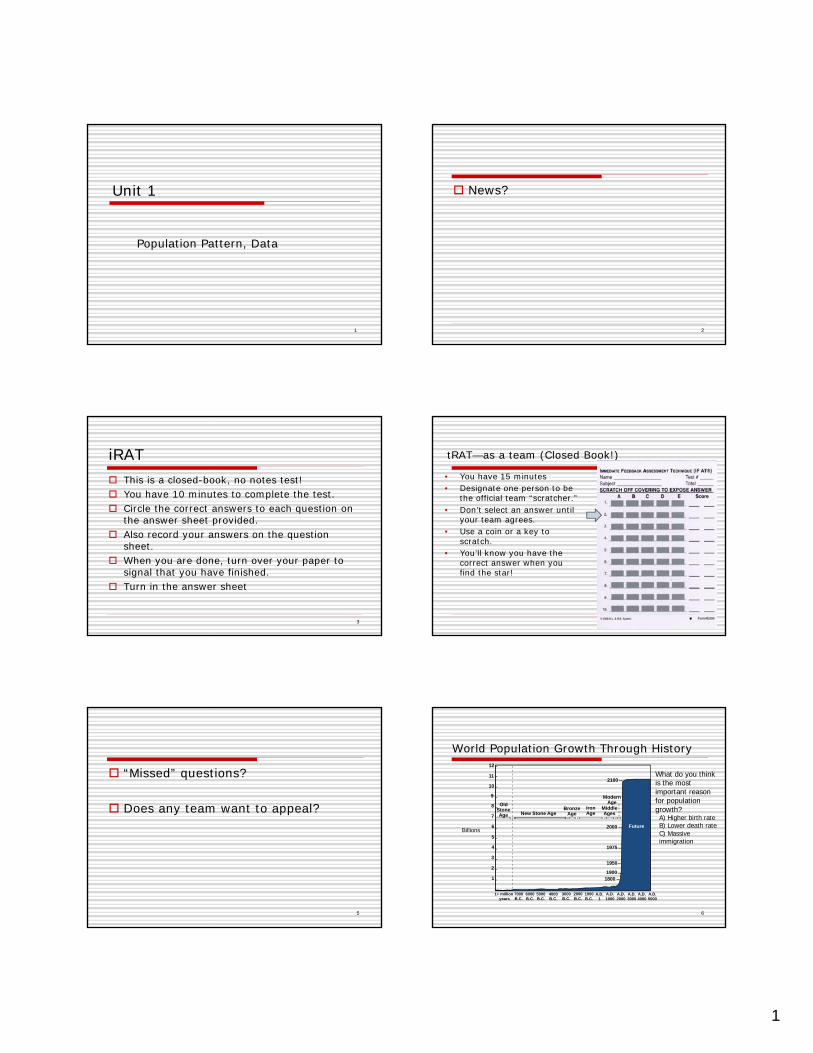
World Population Growth Through History
6
What do you think is the most important reason for population growth?A) Higher birth rateB) Lower death rateC) Massive immigration
2
A.D.2000
A.D.1000
A.D.1
1000B.C.
2000B.C.
3000B.C.
4000B.C.
5000B.C.
6000B.C.
7000B.C.
1+ million years
8
7
6
5
2
1
4
3
OldStoneAge New Stone Age
BronzeAge
IronAge
MiddleAges
ModernAge
Black Death —The Plague
9
10
11
12
A.D.3000
A.D.4000
A.D.5000
18001900
1950
1975
2000
2100
FutureBillions
World Population Growth Through History
7Agricultural RevolutionIndustrial Revolution
Population growth over time Most of the history: hunting-gathering
society, high fertility and mortality, small population
Agricultural revolution: 4 Million Time of the Christ (1 A.D.): 250 million Industrial revolution (1750): 800 million 1750-1950: rapid increase, 2.5 billion 1950 -: even more rapid increase, now
7+ billion
Why Was Early Growth Slow? During the hunting-gathering phase, life
expectancy was very low (~ 20 years). High mortality More than half of children born died before
age 5. The average woman who survived to the
reproductive years would have to bear nearly 7 children to assure 2 survived to adulthood.
Why Are More Recent Increases So Rapid? Acceleration in population after 1750 was due to
declines in the death rate during the Industrial Revolution. Higher standard of living Better food, cleaner water, sanitation system,
public health system … Post-WWII rapid population growth in LDCs
Import of medical technology from MDCs Continuing population increases are due to dramatic
declines in mortality without a commensurate decline in fertility (even though fertility IS declining).
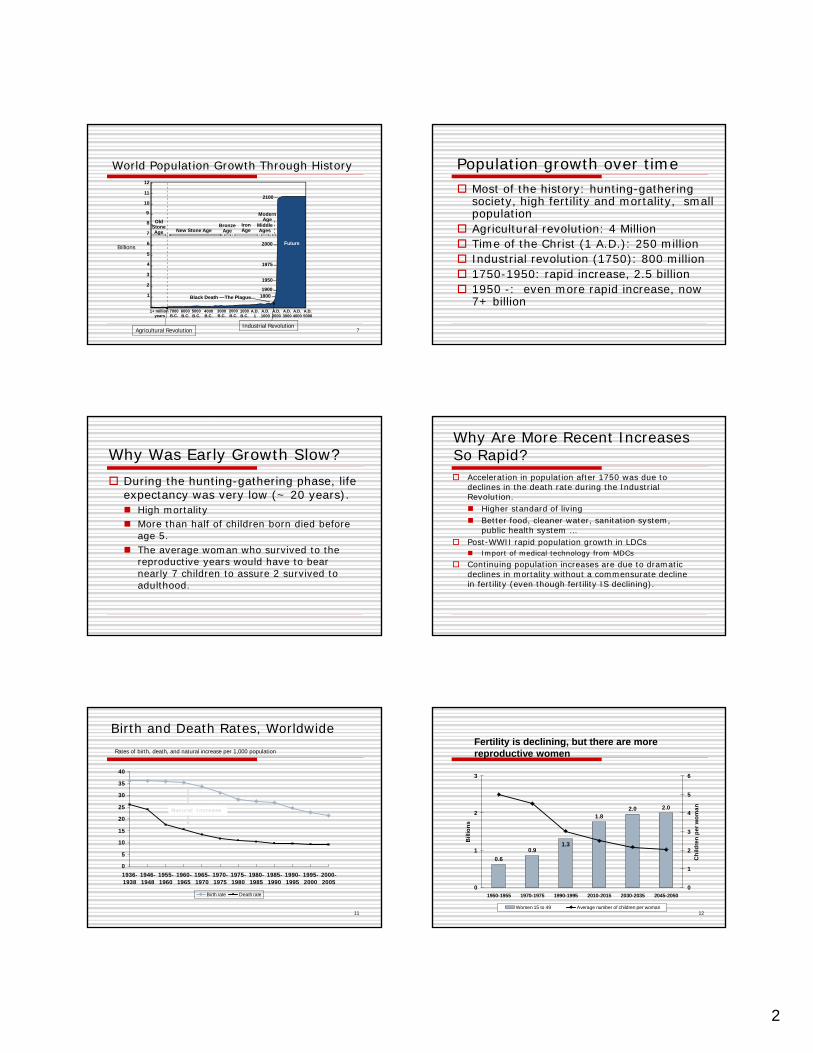
Rates of birth, death, and natural increase per 1,000 population
0
5
10
15
20
25
30
35
40
1936-1938
1946-1948
1955-1960
1960-1965
1965-1970
1970-1975
1975-1980
1980-1985
1985-1990
1990-1995
1995-2000
2000-2005
Birth rate Death rate
Natural Increase
Birth and Death Rates, Worldwide
11
Fertility is declining, but there are more reproductive women
0.6
0.9
1.82.0 2.0
1.3
0
1
2
3
1950-1955 1970-1975 1990-1995 2010-2015 2030-2035 2045-2050
Bill
ion
s
0
1
2
3
4
5
6
Ch
ildre
n p
er
wo
ma
n
Women 15 to 49 Average number of children per woman12
3
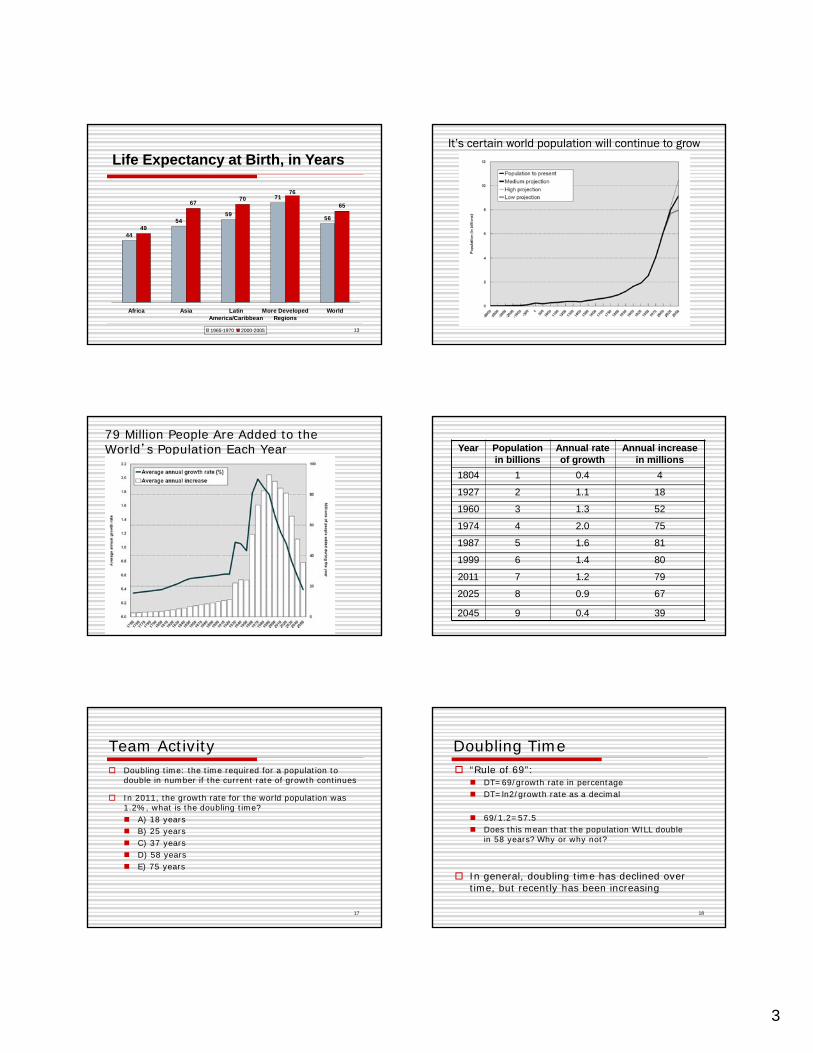
Life Expectancy at Birth, in Years
44
5459
71
56
49
6770
76
65
Africa Asia LatinAmerica/Caribbean
More DevelopedRegions
World
1965-1970 2000-2005 13
It’s certain world population will continue to grow
79 Million People Are Added to the World’s Population Each Year Year Population
in billionsAnnual rate of growth
Annual increase in millions
1804 1 0.4 4
1927 2 1.1 18
1960 3 1.3 52
1974 4 2.0 75
1987 5 1.6 81
1999 6 1.4 80
2011 7 1.2 79
2025 8 0.9 67
2045 9 0.4 39
Team Activity Doubling time: the time required for a population to
double in number if the current rate of growth continues
In 2011, the growth rate for the world population was 1.2%, what is the doubling time? A) 18 years B) 25 years C) 37 years D) 58 years E) 75 years
17
Doubling Time “Rule of 69”:
DT=69/growth rate in percentage DT=ln2/growth rate as a decimal
69/1.2=57.5 Does this mean that the population WILL double
in 58 years? Why or why not?
In general, doubling time has declined over time, but recently has been increasing
18

4
19
Carrying Capacity Refers to the number of people that can
theoretically be supported in an area given the available physical resources and the way that people use those resources.
Change over time, space and culture Extensive vs. intensive use of resources Short-term vs. long-term
20
Team Activity Is carrying capacity larger in the U.S.
than China? A) Yes B) No
Why?
21
Team Activity With 7.5 Billion population, have we
overshot the carrying capacity of the earth? A) Yes B) No
22
Geographic Perspective Population geographers: Where (location)? How (spatial process)? What is the pattern of population
distribution? What are the causes (why) and
consequences of such population distribution?
23
Team Activity
24
What are the most important characteristics of world population?
List top 3 Write on board
5
25
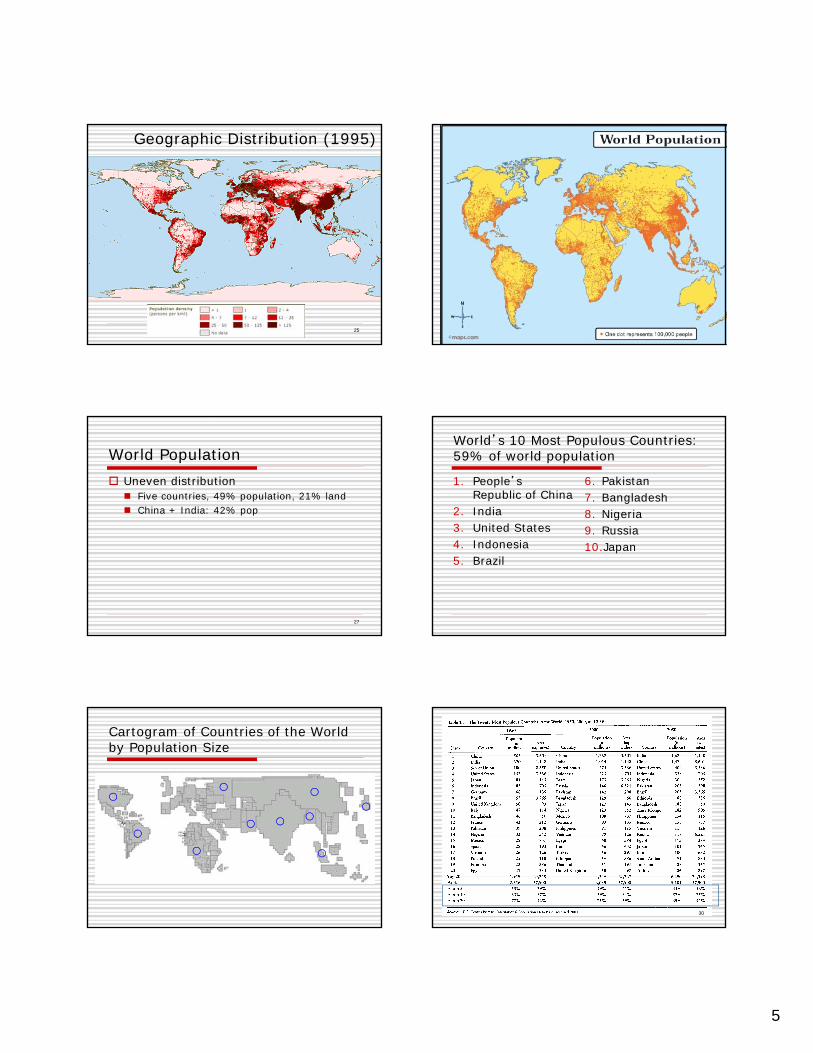
Geographic Distribution (1995)
26
World Population Uneven distribution Five countries, 49% population, 21% land China + India: 42% pop
27
World’s 10 Most Populous Countries: 59% of world population
1. People’s Republic of China
2. India3. United States4. Indonesia5. Brazil
6. Pakistan7. Bangladesh8. Nigeria9. Russia10.Japan
Cartogram of Countries of the World by Population Size
30
6
31
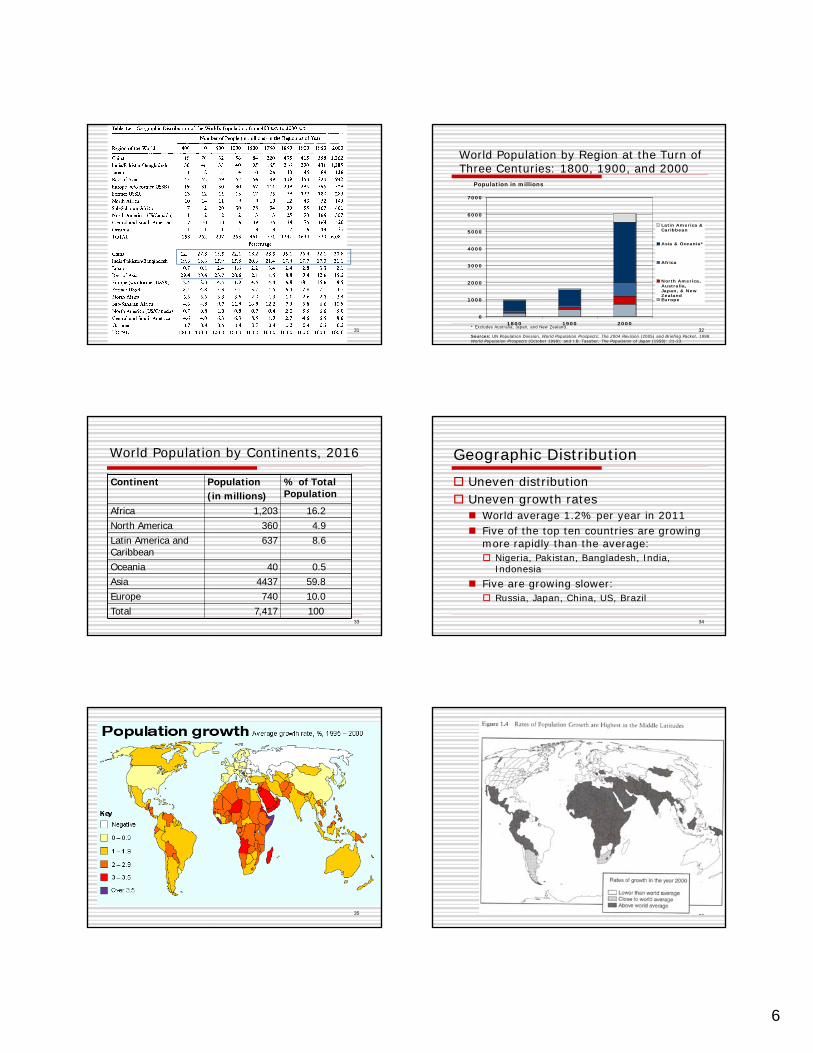
World Population by Region at the Turn of Three Centuries: 1800, 1900, and 2000
0
1000
2000
3000
4000
5000
6000
7000
1800 1900 2000
Latin America &Caribbean
Asia & Oceania*
Africa
North America,Australia,Japan, & NewZealandEurope
32
Population in millions
* Excludes Australia, Japan, and New Zealand.
Sources: UN Population Division, World Population Prospects: The 2004 Revision (2005) and Briefing Packet, 1998 World Population Prospects (October 1998); and I.B. Taeuber, The Population of Japan (1958): 21-23.
World Population by Continents, 2016
Continent Population (in millions)
% of Total Population
Africa 1,203 16.2North America 360 4.9Latin America and Caribbean
637 8.6
Oceania 40 0.5 Asia 4437 59.8Europe 740 10.0Total 7,417 100
33
Geographic Distribution Uneven distribution Uneven growth rates World average 1.2% per year in 2011 Five of the top ten countries are growing
more rapidly than the average: Nigeria, Pakistan, Bangladesh, India,
Indonesia Five are growing slower: Russia, Japan, China, US, Brazil
34
35 36

7
Source: Population Reference Bureau, 2005 World Population Data Sheet.
Projected Population ChangePercent Population Change, 2005-2050
Geographic Distribution Uneven distribution Uneven growth rates Developing vs. developed regions Four out of five most populous countries
are LDCs: China, India, Brazil, Indonesia Growth rate is generally higher in LDCs
38
Global population growth:A developing country phenomenon
0
1
2
3
4
5
6
7
8
9
1950 1975 2000 2025 2050
39Source: United Nations Populations Division, World Population Prospects, The 2004 Revision, medium variant.
Developing countries
Billions
Developed countries
The “Future” is in Developing Regions!
40
North-South Divide
8
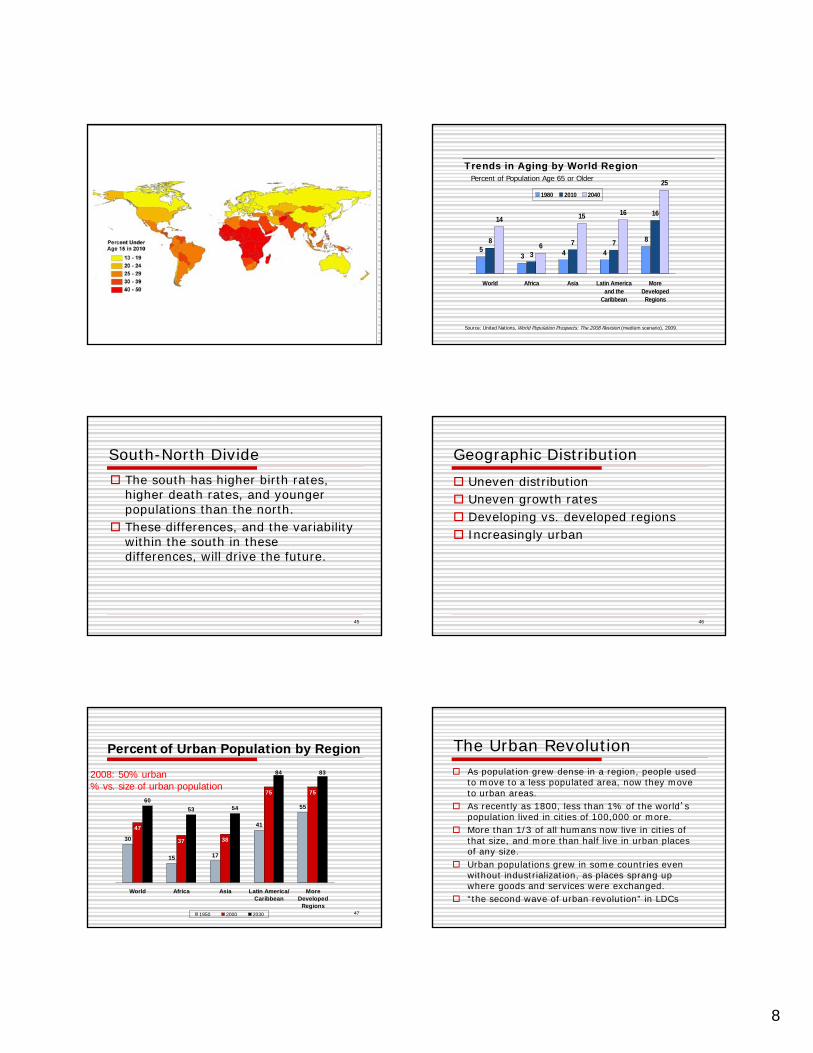
Trends in Aging by World RegionPercent of Population Age 65 or Older
53 4 4
88
3
7 7
1614
6
15 16
25
World Africa Asia Latin Americaand the
Caribbean
MoreDeveloped
Regions
1980 2010 2040
Source: United Nations, World Population Prospects: The 2008 Revision (medium scenario), 2009.
South-North Divide The south has higher birth rates,
higher death rates, and younger populations than the north.
These differences, and the variability within the south in these differences, will drive the future.
45
Geographic Distribution Uneven distribution Uneven growth rates Developing vs. developed regions Increasingly urban
46
30
15 17
55
47
37 38
7560
53 54
84 83
41
75
World Africa Asia Latin America/Caribbean
MoreDeveloped
Regions
1950 2000 2030
Percent of Urban Population by Region
2008: 50% urban% vs. size of urban population
47
The Urban Revolution As population grew dense in a region, people used
to move to a less populated area, now they move to urban areas.
As recently as 1800, less than 1% of the world’s population lived in cities of 100,000 or more.
More than 1/3 of all humans now live in cities of that size, and more than half live in urban places of any size.
Urban populations grew in some countries even without industrialization, as places sprang up where goods and services were exchanged.
“the second wave of urban revolution” in LDCs
9
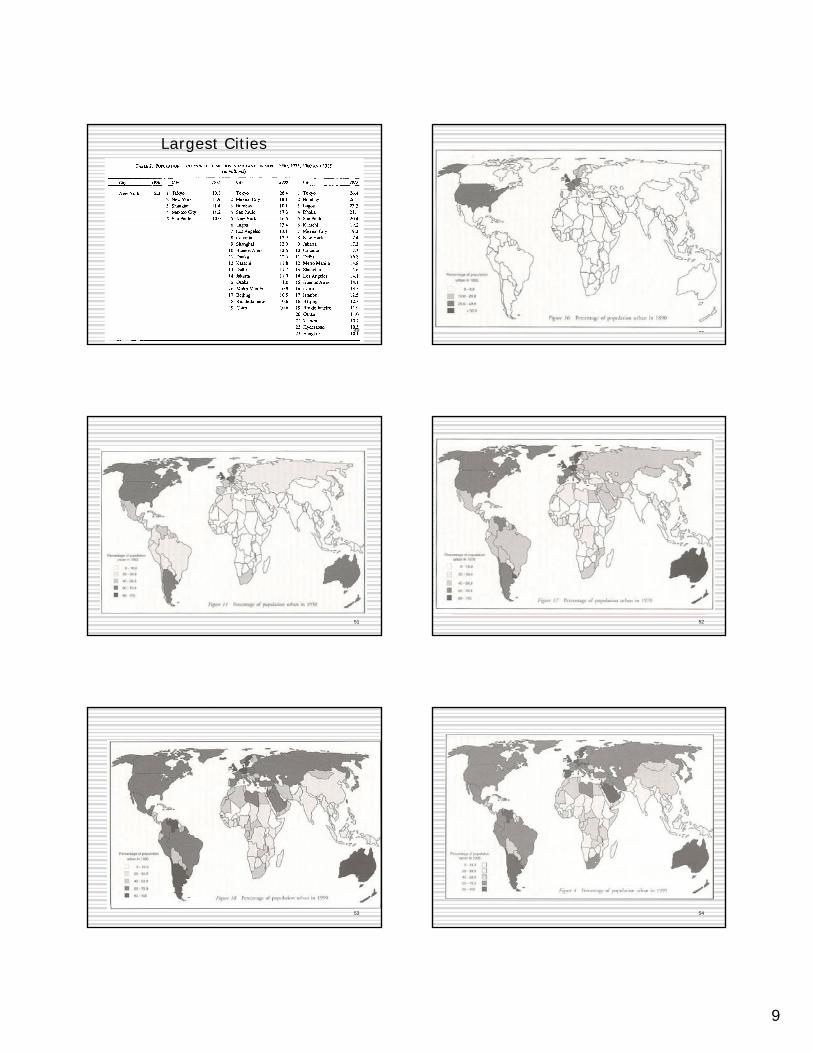
Largest Cities
49 50
51 52
53 54
10
55
% urban population over time
56
57
Team Activity: Due to unevenness in population
distribution, migration has been the most important dynamics to adjust the spatial distribution of population. Please draw major migration streams in history on the world map.
58
59
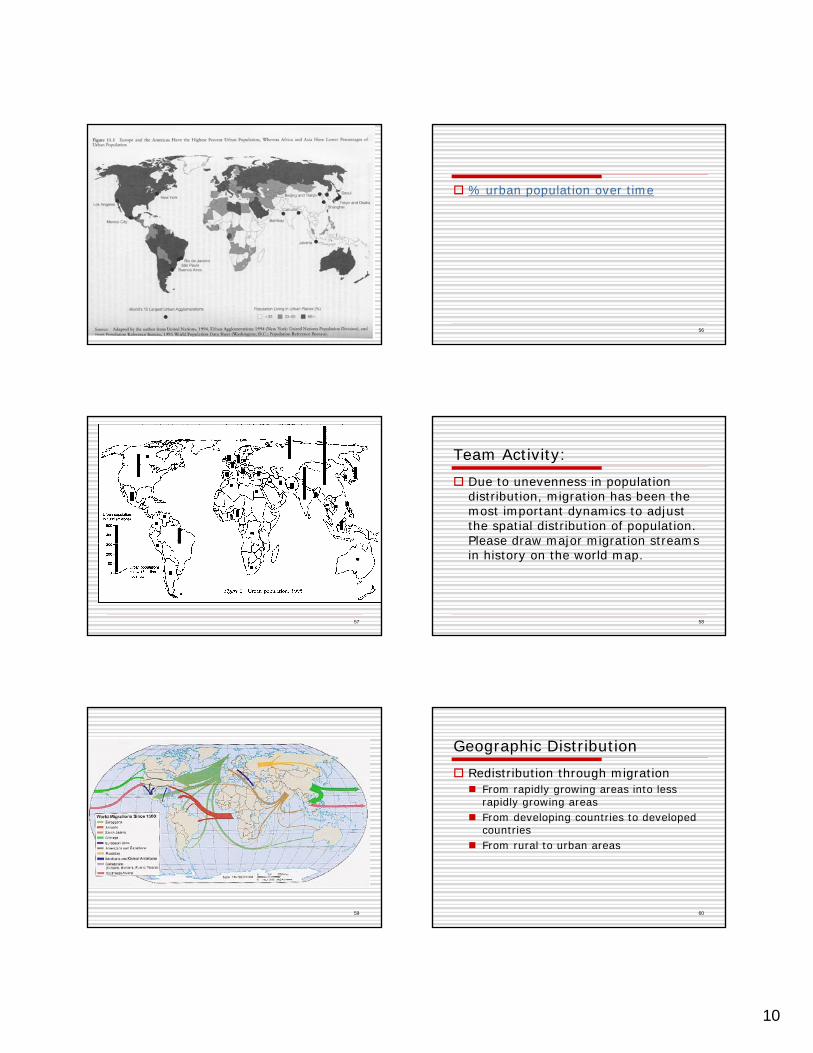
Geographic Distribution Redistribution through migration From rapidly growing areas into less
rapidly growing areas From developing countries to developed
countries From rural to urban areas
60
11
Redistribution of the World’s Population through Migration European expansion (14th to 20th centuries)
Europe to North and South America Africa to Latin America, Caribbean and North America
South to North migration (20th & 21st centuries) Latin America and Asia to the United States Asia to Canada Africa and Asia to Europe
Judith Blake “population growth used to be a reward for doing well; now it’s a scourge for doing badly”.
Redistribution of the World’s Population through Migration But the latest projection by PRB: more migration between developing
countries in the future (south-south migration)
63
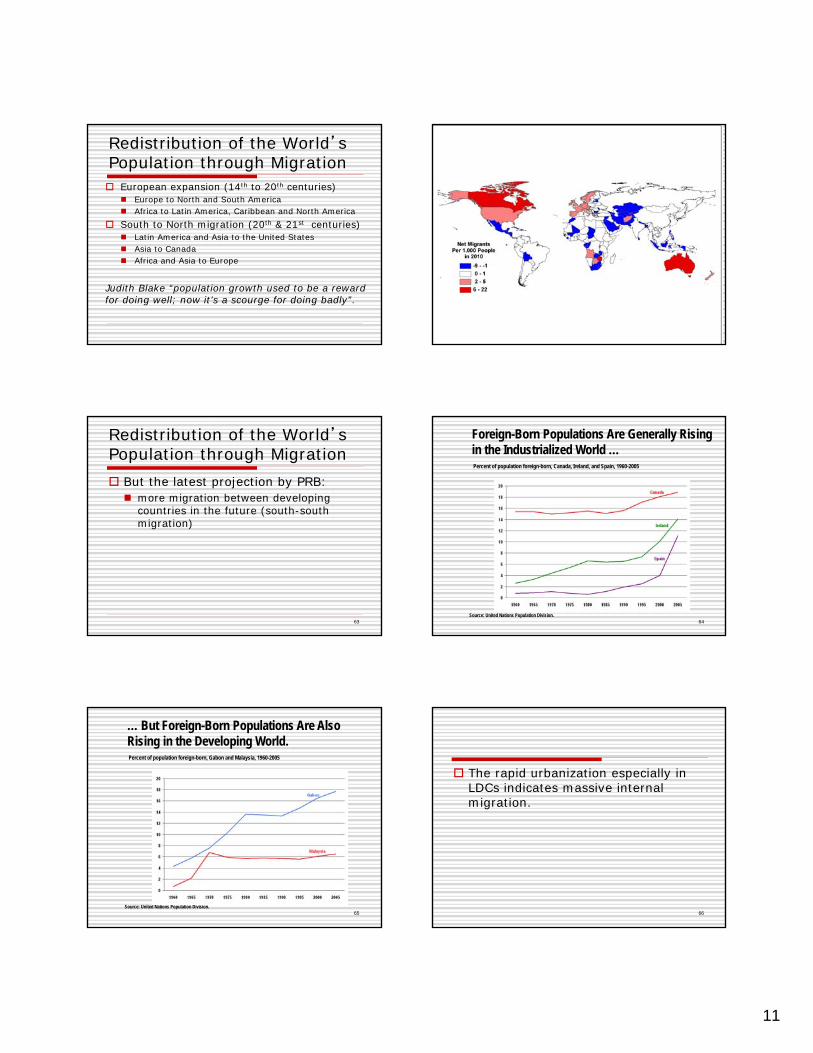
Percent of population foreign-born, Canada, Ireland, and Spain, 1960-2005
Source: United Nations Population Division.
Foreign-Born Populations Are Generally Rising in the Industrialized World …
64
Percent of population foreign-born, Gabon and Malaysia, 1960-2005
Source: United Nations Population Division.
… But Foreign-Born Populations Are Also Rising in the Developing World.
65
The rapid urbanization especially in LDCs indicates massive internal migration.
66
12
Population Distribution Uneven distribution Uneven growth rates Developing vs. developed regions North vs. south contrast
Increasingly urban, more mega cities Massive migration/immigration
67
Team Activity In 2050, most of you will be around
55-60 years old. What kind of world would you be living in 2050? List top 3 main characteristics
Write on the board
GOG 344Y Youqin Huang 68
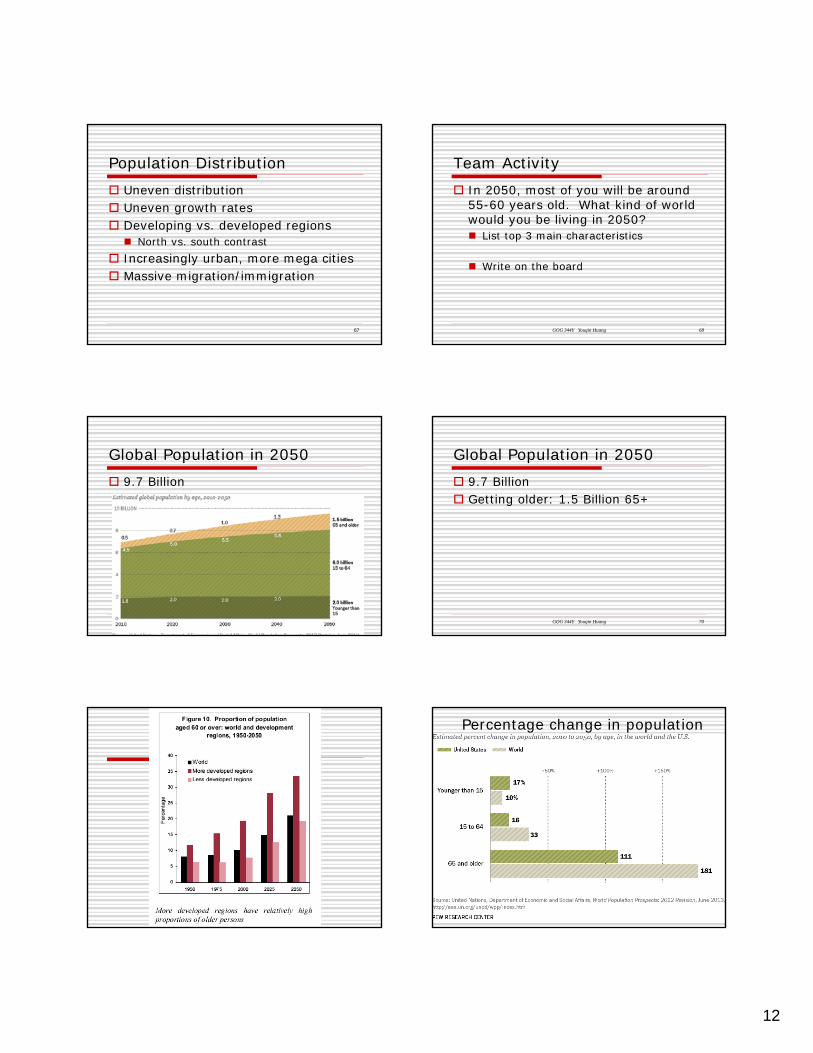
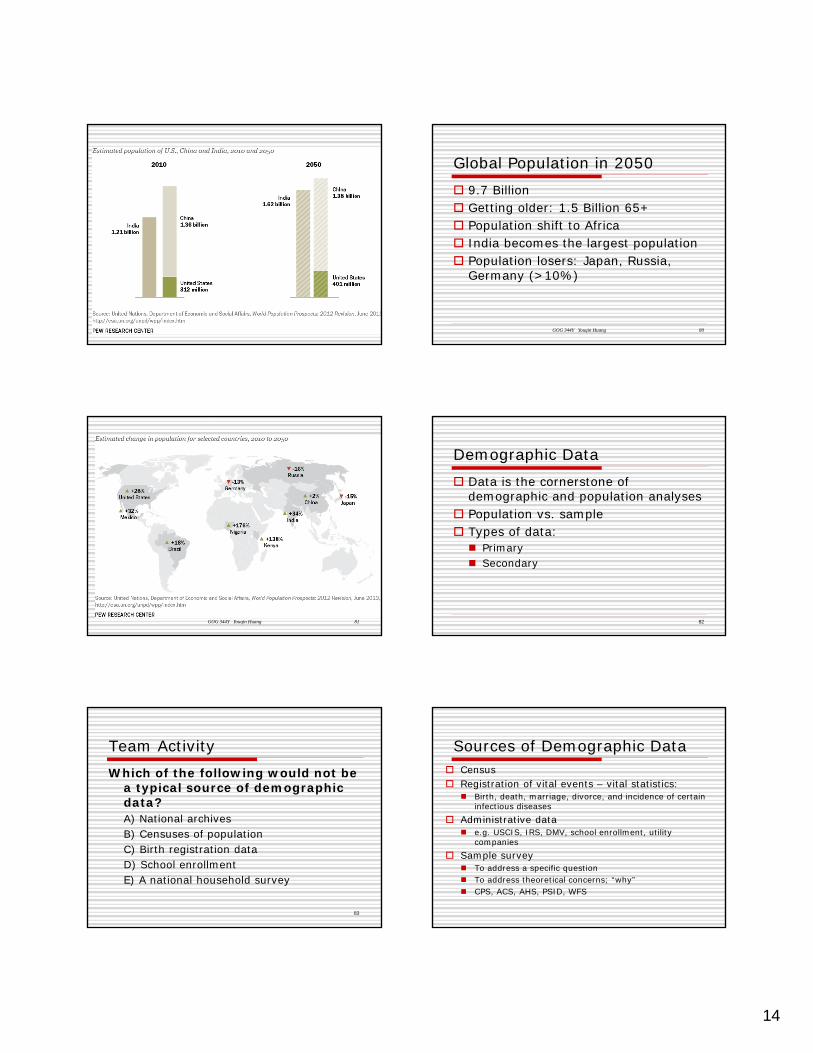
Global Population in 2050 9.7 Billion
GOG 344Y Youqin Huang 69
Global Population in 2050 9.7 Billion Getting older: 1.5 Billion 65+
GOG 344Y Youqin Huang 70
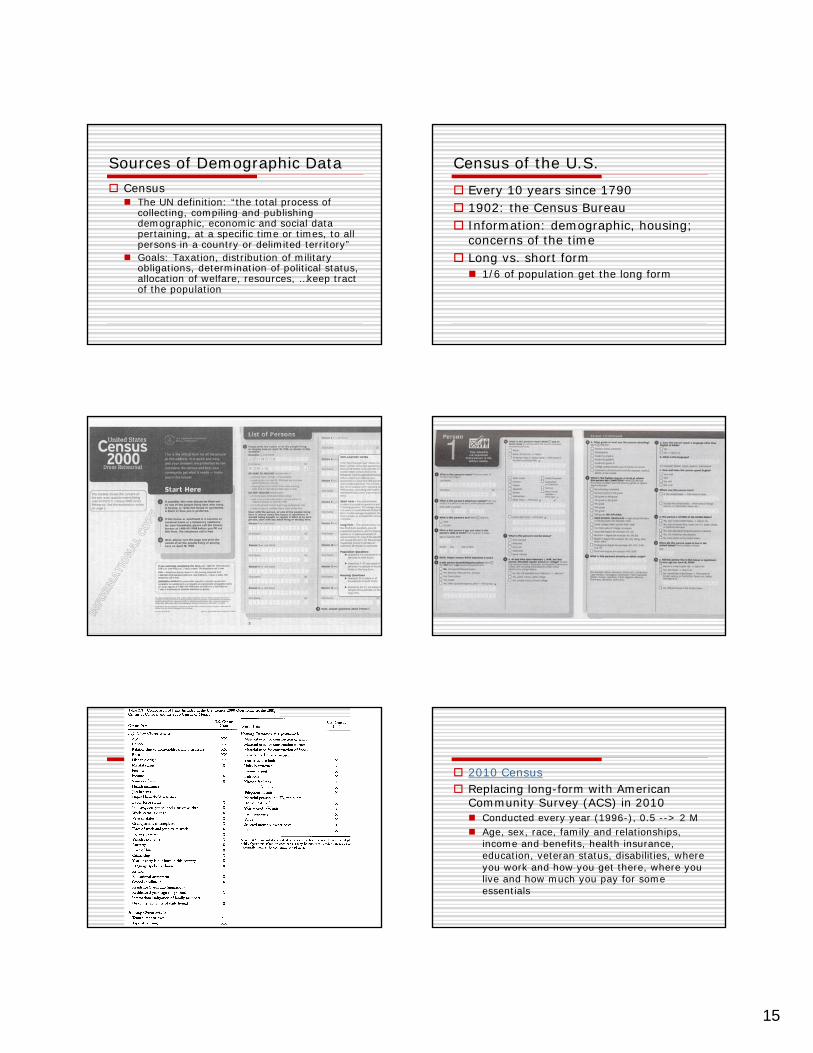
Percentage change in population
13
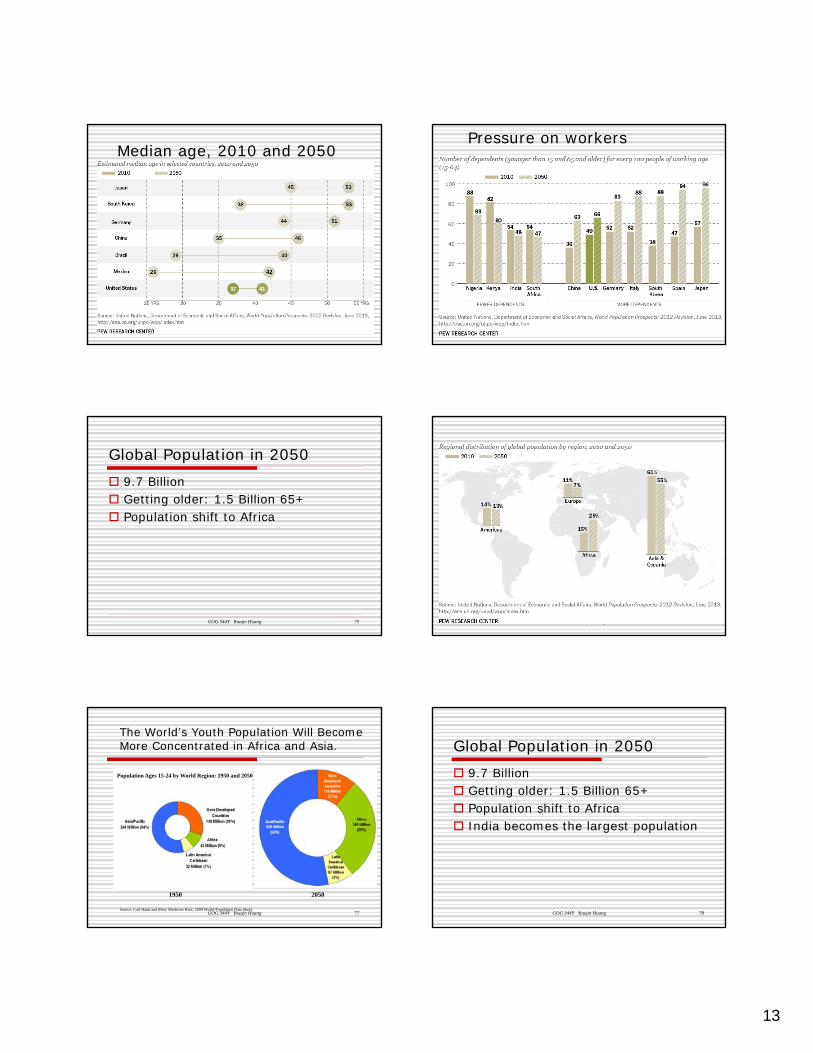
Median age, 2010 and 2050Pressure on workers
Global Population in 2050 9.7 Billion Getting older: 1.5 Billion 65+ Population shift to Africa
GOG 344Y Youqin Huang 75 GOG 344Y Youqin Huang 76
Source: Carl Haub and Mary Mederios Kent, 2009 World Population Data Sheet.
The World’s Youth Population Will Become More Concentrated in Africa and Asia.
Population Ages 15-24 by World Region: 1950 and 2050
1950 2050
77GOG 344Y Youqin Huang
Global Population in 2050 9.7 Billion Getting older: 1.5 Billion 65+ Population shift to Africa India becomes the largest population
GOG 344Y Youqin Huang 78
14
GOG 344Y Youqin Huang 79
Global Population in 2050 9.7 Billion Getting older: 1.5 Billion 65+ Population shift to Africa India becomes the largest population Population losers: Japan, Russia,
Germany (>10%)
GOG 344Y Youqin Huang 80
GOG 344Y Youqin Huang 81
Demographic Data Data is the cornerstone of
demographic and population analyses Population vs. sample Types of data: Primary Secondary
82
Team ActivityWhich of the following would not be
a typical source of demographic data?A) National archivesB) Censuses of populationC) Birth registration dataD) School enrollmentE) A national household survey
83
Sources of Demographic Data Census Registration of vital events – vital statistics:
Birth, death, marriage, divorce, and incidence of certain infectious diseases
Administrative data e.g. USCIS, IRS, DMV, school enrollment, utility
companies Sample survey
To address a specific question To address theoretical concerns; “why” CPS, ACS, AHS, PSID, WFS
15
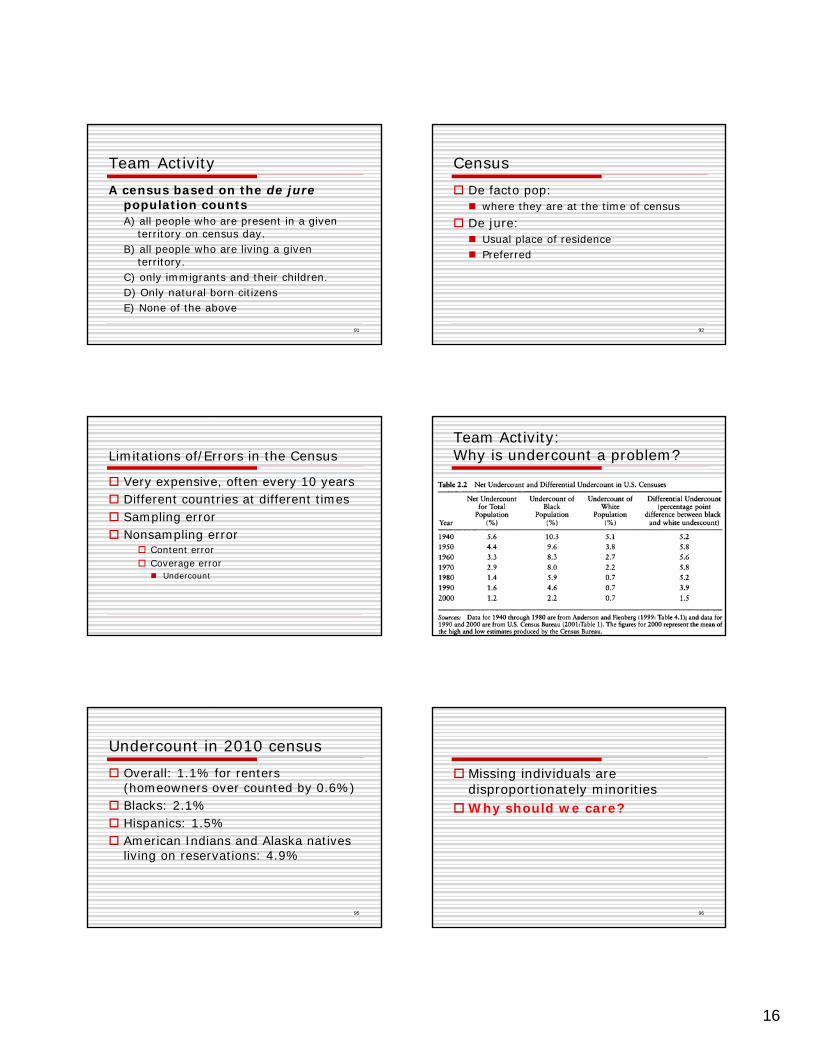
Sources of Demographic Data Census The UN definition: “the total process of
collecting, compiling and publishing demographic, economic and social data pertaining, at a specific time or times, to all persons in a country or delimited territory”
Goals: Taxation, distribution of military obligations, determination of political status, allocation of welfare, resources, …keep tract of the population
Census of the U.S. Every 10 years since 1790 1902: the Census Bureau Information: demographic, housing;
concerns of the time Long vs. short form 1/6 of population get the long form
2010 Census Replacing long-form with American
Community Survey (ACS) in 2010 Conducted every year (1996-), 0.5 --> 2 M Age, sex, race, family and relationships,
income and benefits, health insurance, education, veteran status, disabilities, where you work and how you get there, where you live and how much you pay for some essentials
16
Team ActivityA census based on the de jure
population countsA) all people who are present in a given
territory on census day.B) all people who are living a given
territory.C) only immigrants and their children.D) Only natural born citizensE) None of the above
91
Census De facto pop: where they are at the time of census
De jure: Usual place of residence Preferred
92
Limitations of/Errors in the Census
Very expensive, often every 10 years Different countries at different times Sampling error Nonsampling error
Content error Coverage error Undercount
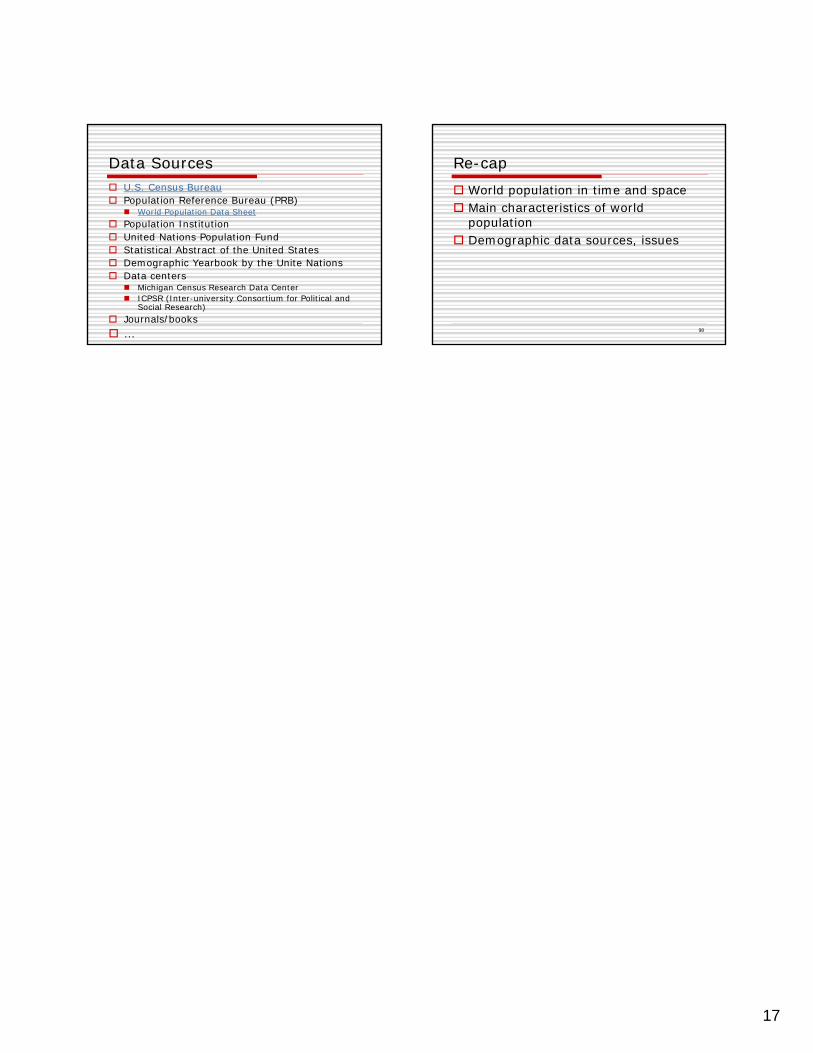
Team Activity: Why is undercount a problem?
Undercount in 2010 census Overall: 1.1% for renters
(homeowners over counted by 0.6%) Blacks: 2.1% Hispanics: 1.5% American Indians and Alaska natives
living on reservations: 4.9%
95
Missing individuals are disproportionately minorities
Why should we care?
96
17
Data Sources U.S. Census Bureau Population Reference Bureau (PRB)
World Population Data Sheet Population Institution United Nations Population Fund Statistical Abstract of the United States Demographic Yearbook by the Unite Nations Data centers
Michigan Census Research Data Center ICPSR (Inter-university Consortium for Political and
Social Research) Journals/books …
Re-cap World population in time and space Main characteristics of world
population Demographic data sources, issues
98