Embed Size (px)
Citation preview
Unit 3: Foundations for inferenceLecture 3: Decision errors, significance levels,
sample size, power, and bootstrapping
Statistics 101
Thomas Leininger
June 3, 2013
Decision errors Type 1 and Type 2 errors
Decision errors
Hypothesis tests are not flawless.
In the court system innocent people are sometimes wronglyconvicted and the guilty sometimes walk free.
Similarly, we can make a wrong decision in statistical hypothesistests as well.
The difference is that we have the tools necessary to quantifyhow often we make errors in statistics.
Statistics 101 (Thomas Leininger) U3 - L4: Decision errors, significance levels, sample size, and power June 3, 2013 2 / 23
Decision errors Type 1 and Type 2 errors
Decision errors (cont.)
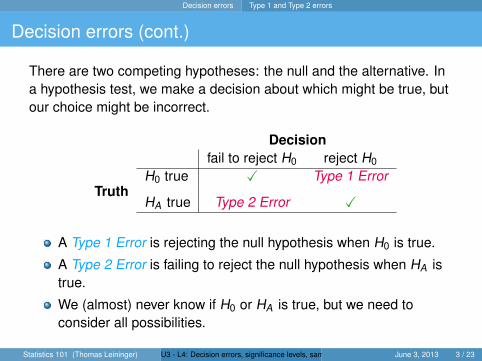
There are two competing hypotheses: the null and the alternative. Ina hypothesis test, we make a decision about which might be true, butour choice might be incorrect.
Decisionfail to reject H0 reject H0
H0 true X Type 1 ErrorTruth
HA true Type 2 Error X
A Type 1 Error is rejecting the null hypothesis when H0 is true.
A Type 2 Error is failing to reject the null hypothesis when HA istrue.
We (almost) never know if H0 or HA is true, but we need toconsider all possibilities.
Statistics 101 (Thomas Leininger) U3 - L4: Decision errors, significance levels, sample size, and power June 3, 2013 3 / 23
Decision errors Type 1 and Type 2 errors
Hypothesis Test as a trial
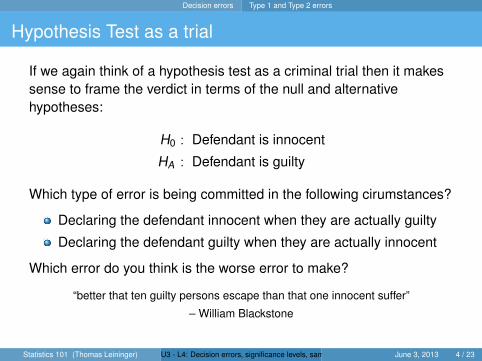
If we again think of a hypothesis test as a criminal trial then it makessense to frame the verdict in terms of the null and alternativehypotheses:
H0 : Defendant is innocent
HA : Defendant is guilty
Which type of error is being committed in the following cirumstances?
Declaring the defendant innocent when they are actually guilty
Declaring the defendant guilty when they are actually innocent
Which error do you think is the worse error to make?
“better that ten guilty persons escape than that one innocent suffer”
– William Blackstone
Statistics 101 (Thomas Leininger) U3 - L4: Decision errors, significance levels, sample size, and power June 3, 2013 4 / 23
Decision errors Error rates & power
Type 1 error rate
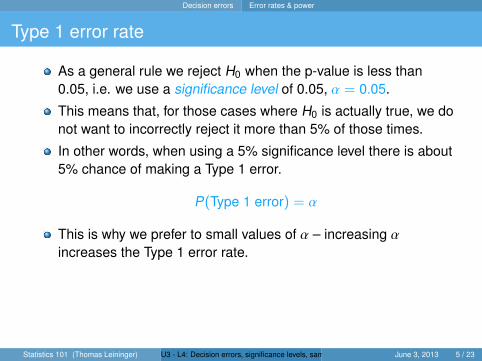
As a general rule we reject H0 when the p-value is less than0.05, i.e. we use a significance level of 0.05, α = 0.05.
This means that, for those cases where H0 is actually true, we donot want to incorrectly reject it more than 5% of those times.
In other words, when using a 5% significance level there is about5% chance of making a Type 1 error.
P(Type 1 error) = α
This is why we prefer to small values of α – increasing αincreases the Type 1 error rate.
Statistics 101 (Thomas Leininger) U3 - L4: Decision errors, significance levels, sample size, and power June 3, 2013 5 / 23
Decision errors Error rates & power
Filling in the table...
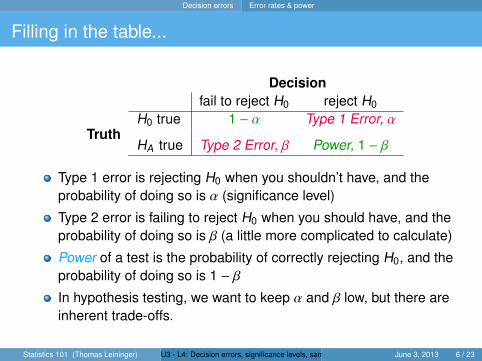
Decisionfail to reject H0 reject H0
H0 true 1 − α Type 1 Error, αTruth
HA true Type 2 Error, β Power, 1 − β
Type 1 error is rejecting H0 when you shouldn’t have, and theprobability of doing so is α (significance level)
Type 2 error is failing to reject H0 when you should have, and theprobability of doing so is β (a little more complicated to calculate)
Power of a test is the probability of correctly rejecting H0, and theprobability of doing so is 1 − β
In hypothesis testing, we want to keep α and β low, but there areinherent trade-offs.
Statistics 101 (Thomas Leininger) U3 - L4: Decision errors, significance levels, sample size, and power June 3, 2013 6 / 23
Decision errors Error rates & power
A quick example
In a cancer screening, what happens if we conclude a patienthas cancer and they do in fact have cancer?
What if they didn’t have cancer (but we concluded that they did)?
What if we conclude the patient has cancer but we conclude thatthey do not have cancer?
Statistics 101 (Thomas Leininger) U3 - L4: Decision errors, significance levels, sample size, and power June 3, 2013 7 / 23

Decision errors Error rates & power
Type 2 error rate
If the alternative hypothesis is actually true, what is the chance thatwe make a Type 2 Error, i.e. we fail to reject the null hypothesis evenwhen we should reject it?
The answer is not obvious.
If the true population average is very close to the null hypothesisvalue, it will be difficult to detect a difference (and reject H0).
If the true population average is very different from the nullhypothesis value, it will be easier to detect a difference.
Clearly, β depends on the effect size (δ)
Statistics 101 (Thomas Leininger) U3 - L4: Decision errors, significance levels, sample size, and power June 3, 2013 8 / 23
Decision errors Power
Example - Blood Pressure
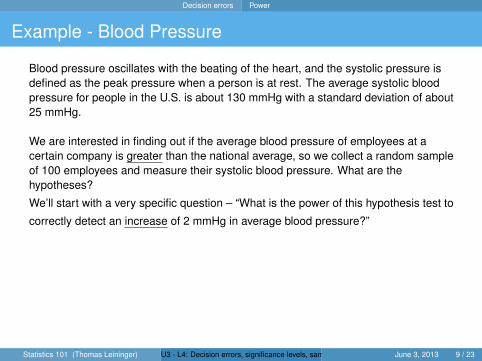
Blood pressure oscillates with the beating of the heart, and the systolic pressure isdefined as the peak pressure when a person is at rest. The average systolic bloodpressure for people in the U.S. is about 130 mmHg with a standard deviation of about25 mmHg.
We are interested in finding out if the average blood pressure of employees at acertain company is greater than the national average, so we collect a random sampleof 100 employees and measure their systolic blood pressure. What are thehypotheses?
We’ll start with a very specific question – “What is the power of this hypothesis test to
correctly detect an increase of 2 mmHg in average blood pressure?”
Statistics 101 (Thomas Leininger) U3 - L4: Decision errors, significance levels, sample size, and power June 3, 2013 9 / 23
Decision errors Power
Problem 1
Which values of x̄ represent sufficient evidence to reject H0?(Remember H0 : µ = 130, HA : µ > 130)
Statistics 101 (Thomas Leininger) U3 - L4: Decision errors, significance levels, sample size, and power June 3, 2013 10 / 23
Decision errors Power
Problem 2
What is the probability that we would reject H0 if x̄ did come fromN(mean = 132,SE = 2.5).
Statistics 101 (Thomas Leininger) U3 - L4: Decision errors, significance levels, sample size, and power June 3, 2013 11 / 23
Decision errors Power
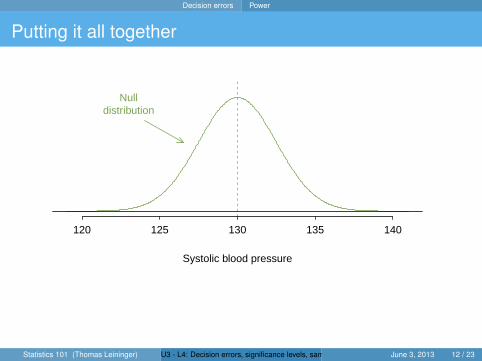
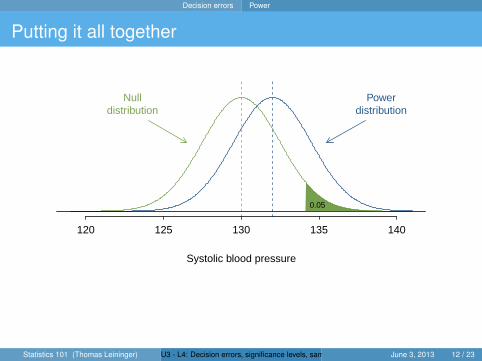
Putting it all together
Systolic blood pressure
120 125 130 135 140
Nulldistribution
Statistics 101 (Thomas Leininger) U3 - L4: Decision errors, significance levels, sample size, and power June 3, 2013 12 / 23
Decision errors Power
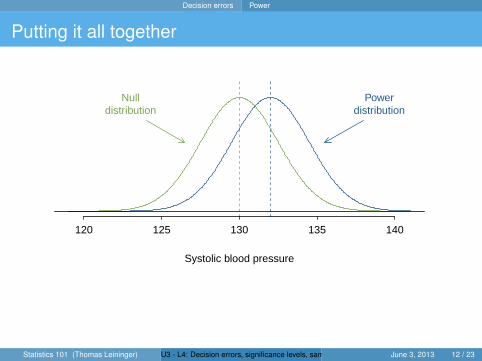
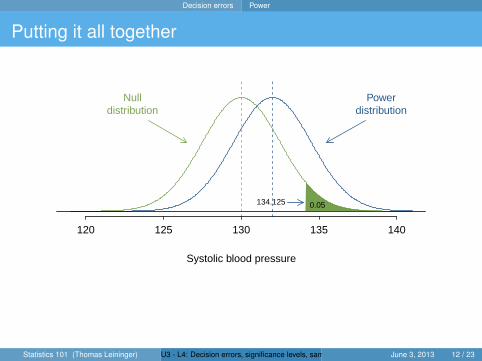
Putting it all together
Systolic blood pressure
120 125 130 135 140
Nulldistribution
Powerdistribution
Statistics 101 (Thomas Leininger) U3 - L4: Decision errors, significance levels, sample size, and power June 3, 2013 12 / 23
Decision errors Power
Putting it all together
Systolic blood pressure
120 125 130 135 140
Nulldistribution
Powerdistribution
0.05
Statistics 101 (Thomas Leininger) U3 - L4: Decision errors, significance levels, sample size, and power June 3, 2013 12 / 23
Decision errors Power
Putting it all together
Systolic blood pressure
120 125 130 135 140
Nulldistribution
Powerdistribution
0.05134.125
Statistics 101 (Thomas Leininger) U3 - L4: Decision errors, significance levels, sample size, and power June 3, 2013 12 / 23
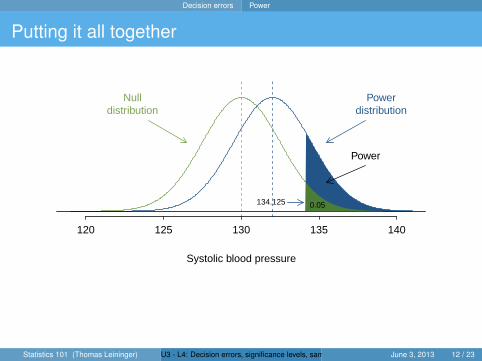
Decision errors Power
Putting it all together
Systolic blood pressure
120 125 130 135 140
Nulldistribution
Powerdistribution
0.05134.125
Power
Statistics 101 (Thomas Leininger) U3 - L4: Decision errors, significance levels, sample size, and power June 3, 2013 12 / 23
Decision errors Power
Achieving desired power
There are several ways to increase power (and hence decrease type2 error rate):
1 Increase the sample size.2 Decrease the standard deviation of the sample, which essentially
has the same effect as increasing the sample size (it willdecrease the standard error).
3 Increase α, which will make it more likely to reject H0 (but notethat this has the side effect of increasing the Type 1 error rate).
4 Consider a larger effect size δ.
Statistics 101 (Thomas Leininger) U3 - L4: Decision errors, significance levels, sample size, and power June 3, 2013 13 / 23
Decision errors Power
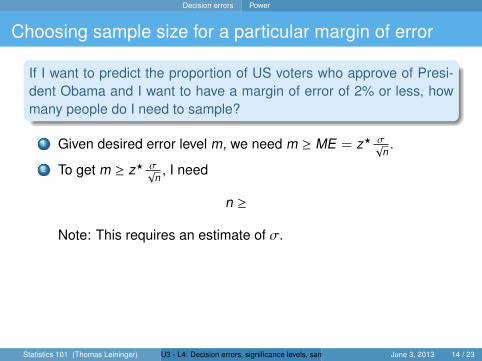
Choosing sample size for a particular margin of error
If I want to predict the proportion of US voters who approve of Presi-dent Obama and I want to have a margin of error of 2% or less, howmany people do I need to sample?
1 Given desired error level m, we need m ≥ ME = z? σ√n.
2 To get m ≥ z? σ√n, I need
n ≥
Note: This requires an estimate of σ.
Statistics 101 (Thomas Leininger) U3 - L4: Decision errors, significance levels, sample size, and power June 3, 2013 14 / 23
Bootstrapping
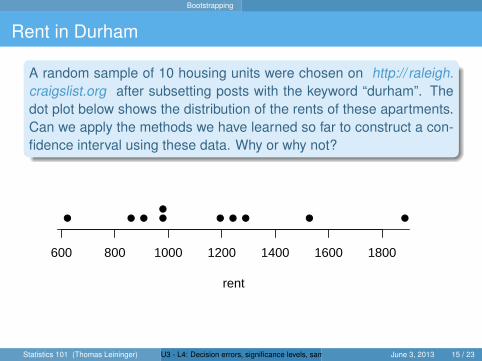
Rent in Durham
A random sample of 10 housing units were chosen on http:// raleigh.craigslist.org after subsetting posts with the keyword “durham”. Thedot plot below shows the distribution of the rents of these apartments.Can we apply the methods we have learned so far to construct a con-fidence interval using these data. Why or why not?
rent
600 800 1000 1200 1400 1600 1800
● ●● ●●●
●● ●●
Statistics 101 (Thomas Leininger) U3 - L4: Decision errors, significance levels, sample size, and power June 3, 2013 15 / 23
Bootstrapping
Bootstrapping
An alternative approach to constructing confidence intervals isbootstrapping.
This term comes from the phrase “pulling oneself up by one’sbootstraps”, which is a metaphor for accomplishing animpossible task without any outside help.
In this case the impossible task is estimating a populationparameter, and we’ll accomplish it using data from only the givensample.
Statistics 101 (Thomas Leininger) U3 - L4: Decision errors, significance levels, sample size, and power June 3, 2013 16 / 23
Bootstrapping
Bootstrapping
Bootstrapping works as follows:(1) take a bootstrap sample - a random sample taken with
replacement from the original sample, of the same size as theoriginal sample
(2) calculate the bootstrap statistic - a statistic such as mean,median, proportion, etc. computed on the bootstrap samples
(3) repeat steps (1) and (2) many times to create a bootstrapdistribution - a distribution of bootstrap statistics
The 95% bootstrap confidence interval is estimated by the cutoffvalues for the middle 95% of the bootstrap distribution.
Statistics 101 (Thomas Leininger) U3 - L4: Decision errors, significance levels, sample size, and power June 3, 2013 17 / 23
Bootstrapping
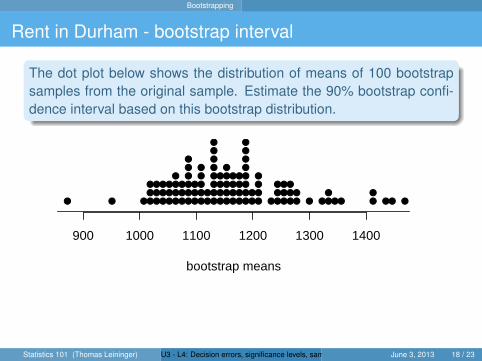
Rent in Durham - bootstrap interval
The dot plot below shows the distribution of means of 100 bootstrapsamples from the original sample. Estimate the 90% bootstrap confi-dence interval based on this bootstrap distribution.
bootstrap means
900 1000 1100 1200 1300 1400
●● ● ●●●●●
● ●● ●●●●
● ●●
●●
●●
● ●●
●● ●
●
●
●●
●●
●●
●●
●● ●●
●
●●● ●
●
●●●
●●
●●●
● ●● ●
●●
●
●
●
●●
●●
●
●
●●
●
●● ●
●●
●●
●
●
●●
●●
●
●
●
●●●
●
●
●
●
●● ●
Statistics 101 (Thomas Leininger) U3 - L4: Decision errors, significance levels, sample size, and power June 3, 2013 18 / 23
Randomization testing
Randomization testing for a mean
We can also use a simulation method to conduct the same test.
This is very similar to bootstrapping, i.e. we randomly samplewith replacement from the sample, but this time we shift thebootstrap distribution to be centered at the null value.
The p-value is then defined as the proportion of simulations thatyield a sample mean at least as favorable to the alternativehypothesis as the observed sample mean.
Statistics 101 (Thomas Leininger) U3 - L4: Decision errors, significance levels, sample size, and power June 3, 2013 19 / 23
Randomization testing
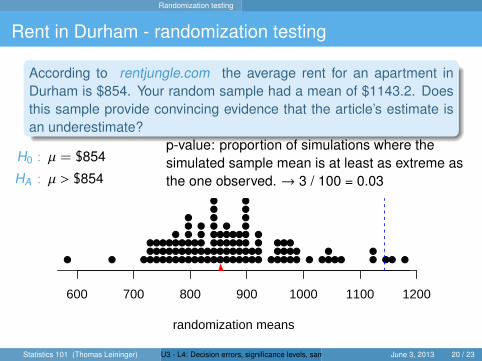
Rent in Durham - randomization testing
According to rentjungle.com the average rent for an apartment inDurham is $854. Your random sample had a mean of $1143.2. Doesthis sample provide convincing evidence that the article’s estimate isan underestimate?
H0 : µ = $854
HA : µ > $854
p-value: proportion of simulations where thesimulated sample mean is at least as extreme asthe one observed. → 3 / 100 = 0.03
randomization means
600 700 800 900 1000 1100 1200
●● ● ●●●●●
● ●● ●●●●
● ●●
●●
●●
● ●●
●● ●
●
●
●●
●●
●●
●●
●● ●●
●
●●● ●
●
●●●
●●
●●●
● ●● ●
●●
●
●
●
●●
●●
●
●
●●
●
●● ●
●●
●●
●
●
●●
●●
●
●
●
●●●
●
●
●
●
●● ●
Statistics 101 (Thomas Leininger) U3 - L4: Decision errors, significance levels, sample size, and power June 3, 2013 20 / 23
Randomization testing
Extra Notes - Calculating Power
Begin by picking a meaningful effect size δ and a significancelevel α
Calculate the range of values for the point estimate beyondwhich you would reject H0 at the chosen α level.
Calculate the probability of observing a value from precedingstep if the sample was derived from a population wherex̄ ∼ N(µH0 + δ,SE)
Statistics 101 (Thomas Leininger) U3 - L4: Decision errors, significance levels, sample size, and power June 3, 2013 21 / 23
Randomization testing
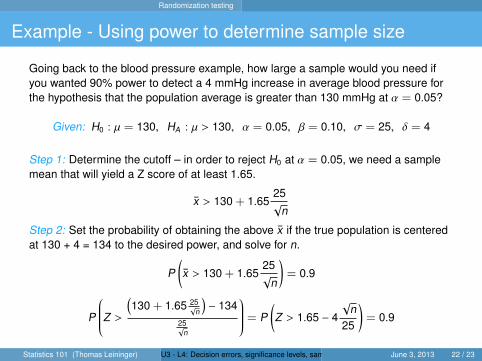
Example - Using power to determine sample size
Going back to the blood pressure example, how large a sample would you need ifyou wanted 90% power to detect a 4 mmHg increase in average blood pressure forthe hypothesis that the population average is greater than 130 mmHg at α = 0.05?
Given: H0 : µ = 130, HA : µ > 130, α = 0.05, β = 0.10, σ = 25, δ = 4
Step 1: Determine the cutoff – in order to reject H0 at α = 0.05, we need a samplemean that will yield a Z score of at least 1.65.
x̄ > 130 + 1.6525√
n
Step 2: Set the probability of obtaining the above x̄ if the true population is centeredat 130 + 4 = 134 to the desired power, and solve for n.
P(x̄ > 130 + 1.65
25√
n
)= 0.9
P
Z >
(130 + 1.65 25
√n
)− 134
25√
n
= P(Z > 1.65 − 4
√n
25
)= 0.9
Statistics 101 (Thomas Leininger) U3 - L4: Decision errors, significance levels, sample size, and power June 3, 2013 22 / 23
Randomization testing
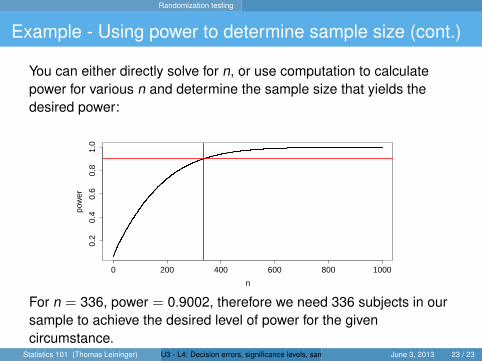
Example - Using power to determine sample size (cont.)
You can either directly solve for n, or use computation to calculatepower for various n and determine the sample size that yields thedesired power:
0 200 400 600 800 1000
0.2
0.4
0.6
0.8
1.0
n
pow
er
For n = 336, power = 0.9002, therefore we need 336 subjects in oursample to achieve the desired level of power for the givencircumstance.
Statistics 101 (Thomas Leininger) U3 - L4: Decision errors, significance levels, sample size, and power June 3, 2013 23 / 23