Embed Size (px)
Citation preview
Unit 5 NotesNational Economic Performance
Economic Indicators
Economic Indicators are statistics that economists use to determine the health of a nation’s economy. We are going to focus on three statistics in this unit.● Inflation● Unemployment● Gross Domestic Product
Inflation
Inflation is defined as the increase in the general price level for goods and services over a period of time.
When prices rise faster than income, buyers lose purchasing power.
Types of Inflation
Demand-pull inflation - Occurs when consumers want to buy more goods than producers can supply.
The Fed will try to create this to reduce unemployment.
Cost-push inflation - Occurs when producers raise prices because input costs increase.
Example: The price of a latte at Starbucks increases because the price of coffee beans increase.
Calculating the Inflation Rate
● The inflation rate is calculated by determining the change in the Consumer Price Index (CPI).
● The CPI is a statistical measure of the price of everything in a market basket of about 80,000 goods and services.
Rate of Inflation = [CPI(new)-CPI(old)]/CPI(old)*100
Calculating the Inflation Rate
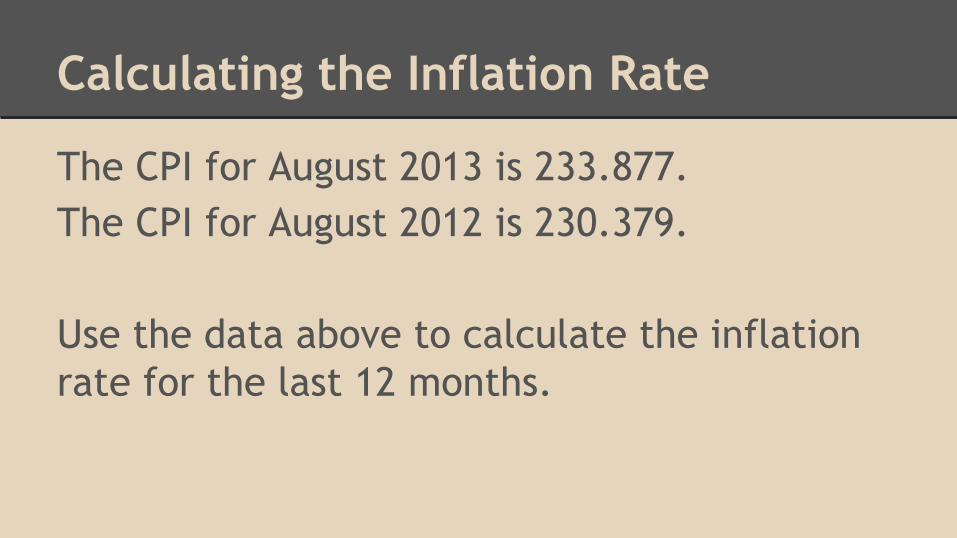
The CPI for August 2013 is 233.877.The CPI for August 2012 is 230.379.
Use the data above to calculate the inflation rate for the last 12 months.
Calculating the Inflation Rate
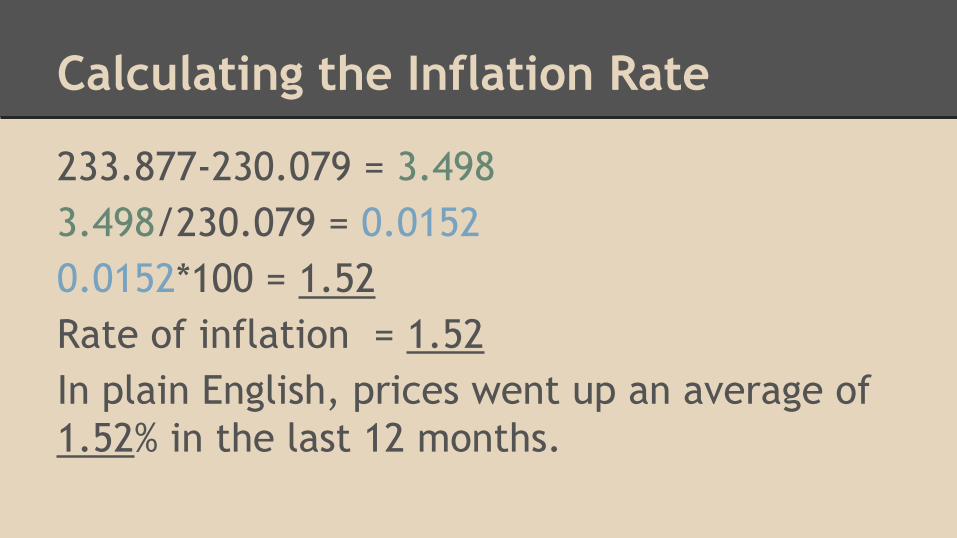
233.877-230.079 = 3.4983.498/230.079 = 0.01520.0152*100 = 1.52Rate of inflation = 1.52In plain English, prices went up an average of 1.52% in the last 12 months.
Patterns of Inflation
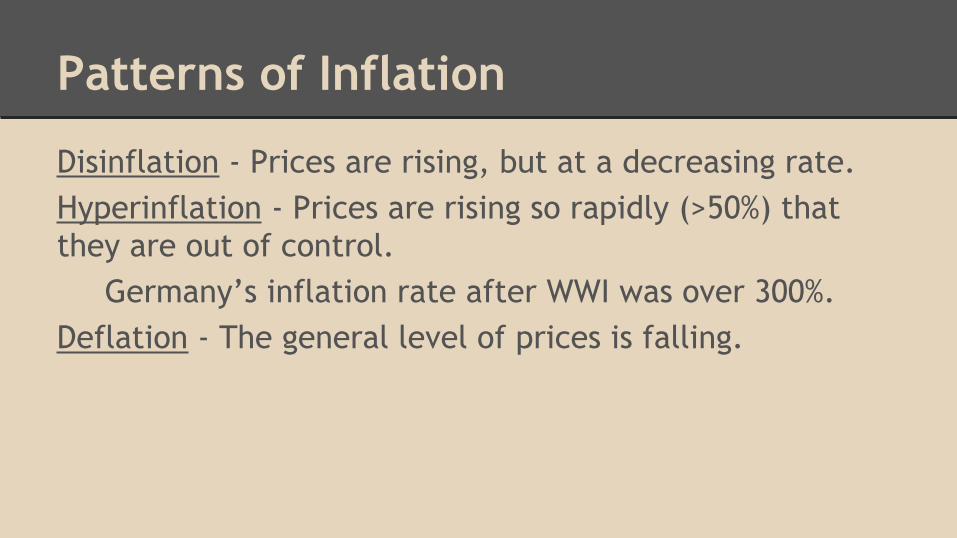
Disinflation - Prices are rising, but at a decreasing rate.Hyperinflation - Prices are rising so rapidly (>50%) that they are out of control.
Germany’s inflation rate after WWI was over 300%.Deflation - The general level of prices is falling.
Calculating the Inflation Rate
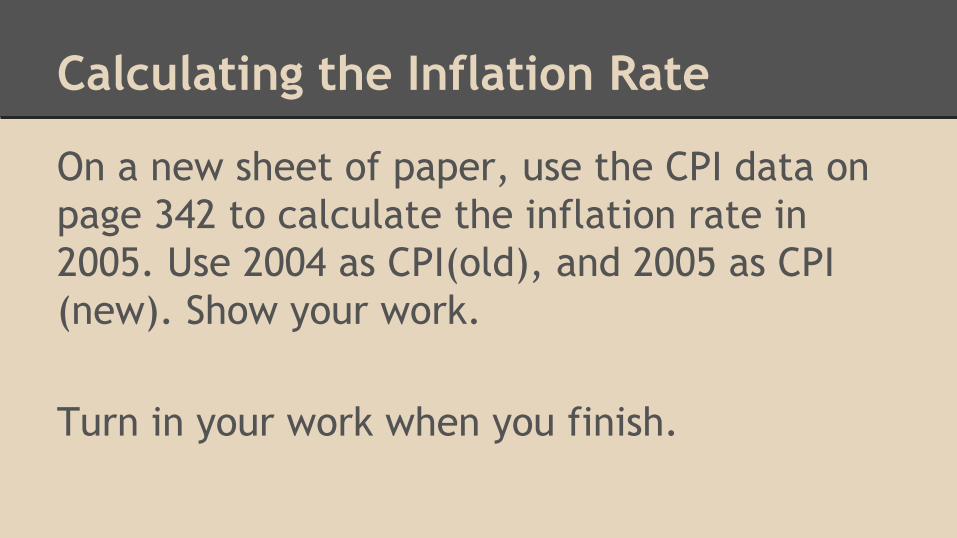
On a new sheet of paper, use the CPI data on page 342 to calculate the inflation rate in 2005. Use 2004 as CPI(old), and 2005 as CPI(new). Show your work.
Turn in your work when you finish.
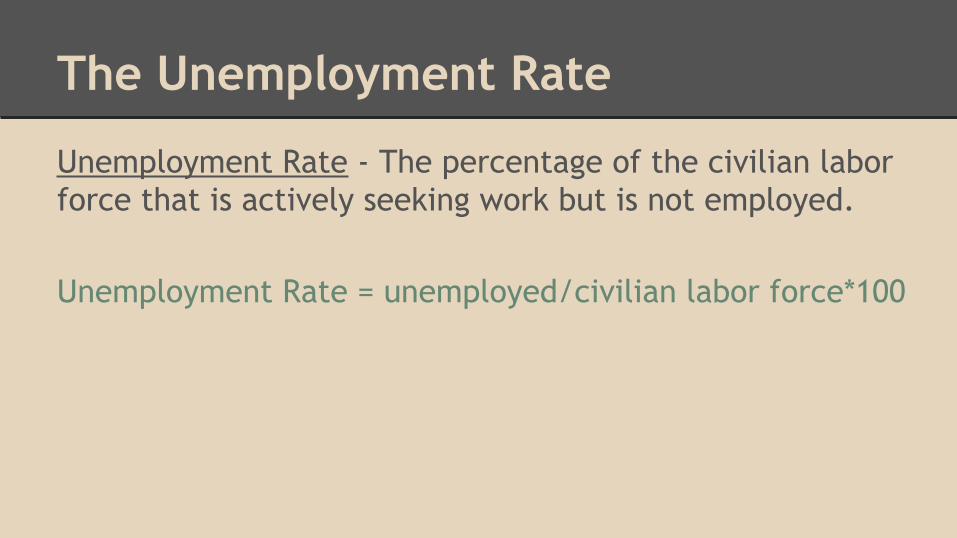
The Unemployment Rate
Unemployment Rate - The percentage of the civilian labor force that is actively seeking work but is not employed.
Unemployment Rate = unemployed/civilian labor force*100
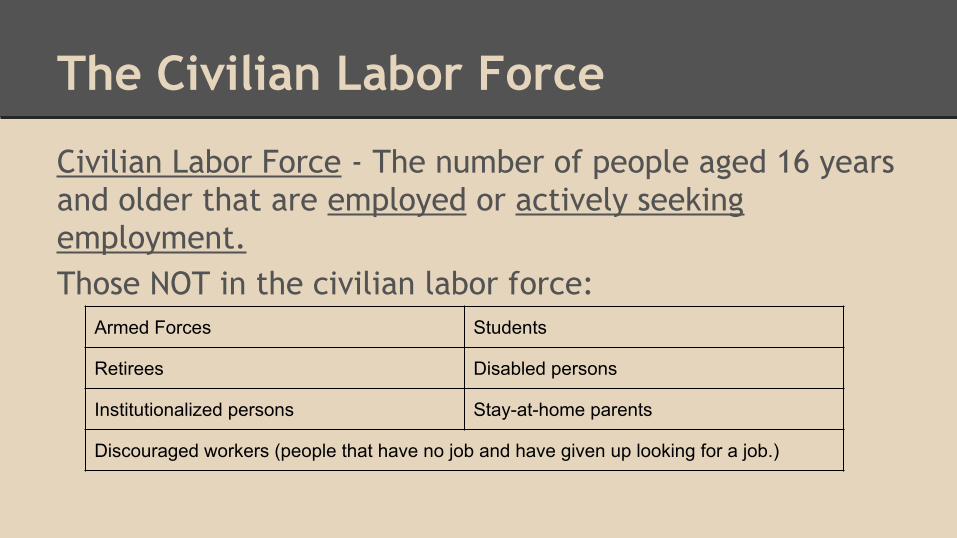
The Civilian Labor Force
Civilian Labor Force - The number of people aged 16 years and older that are employed or actively seeking employment.Those NOT in the civilian labor force:
Armed Forces Students
Retirees Disabled persons
Institutionalized persons Stay-at-home parents
Discouraged workers (people that have no job and have given up looking for a job.)
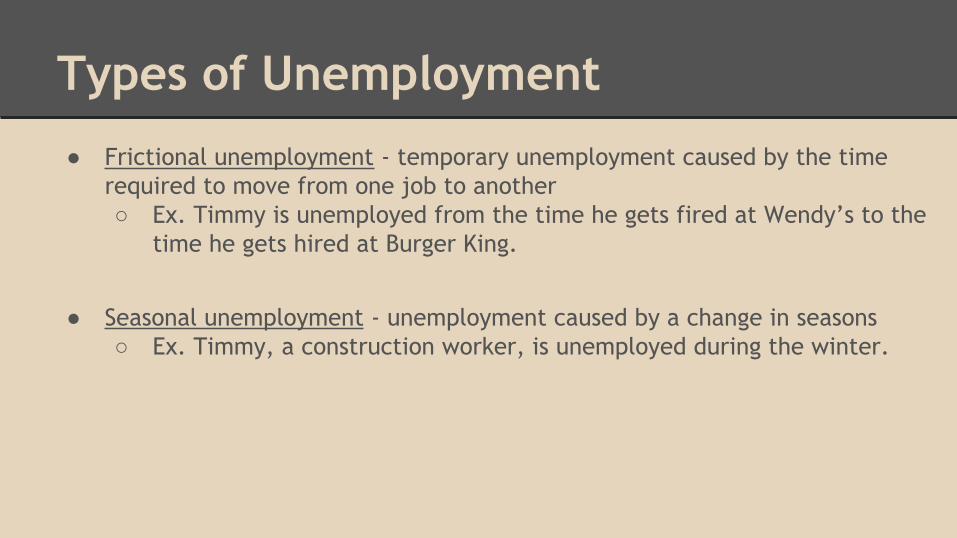
Types of Unemployment
● Frictional unemployment - temporary unemployment caused by the time required to move from one job to another○ Ex. Timmy is unemployed from the time he gets fired at Wendy’s to the
time he gets hired at Burger King.
● Seasonal unemployment - unemployment caused by a change in seasons○ Ex. Timmy, a construction worker, is unemployed during the winter.
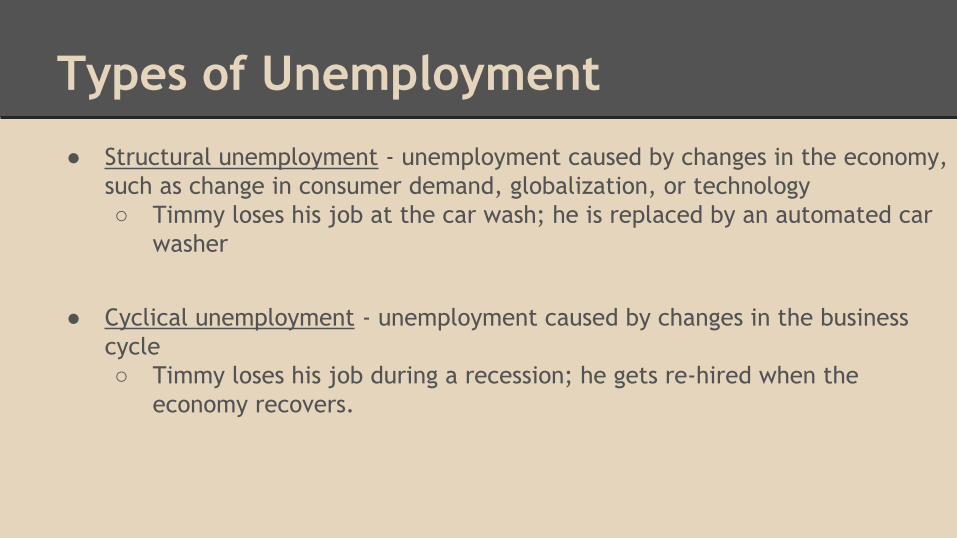
Types of Unemployment
● Structural unemployment - unemployment caused by changes in the economy, such as change in consumer demand, globalization, or technology○ Timmy loses his job at the car wash; he is replaced by an automated car
washer
● Cyclical unemployment - unemployment caused by changes in the business cycle○ Timmy loses his job during a recession; he gets re-hired when the
economy recovers.
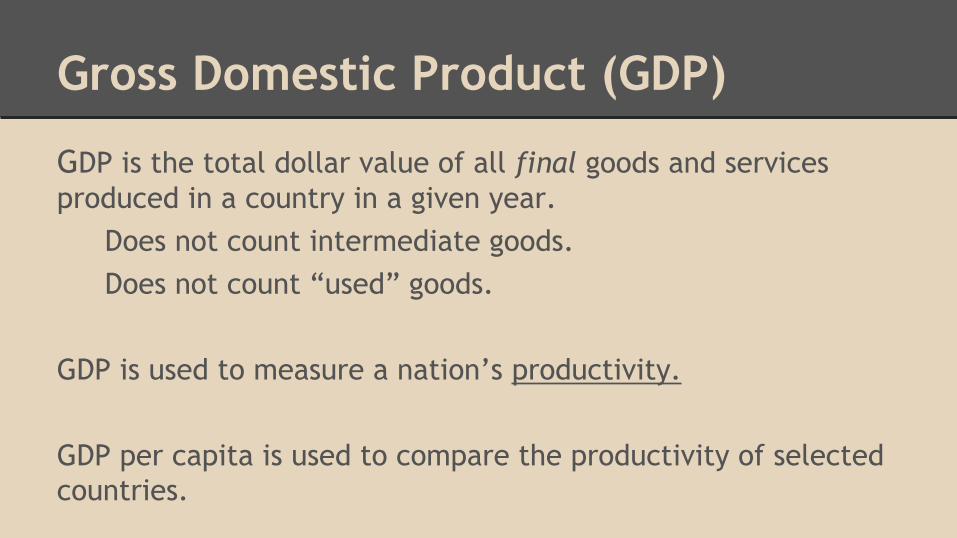
Gross Domestic Product (GDP)
GDP is the total dollar value of all final goods and services produced in a country in a given year.
Does not count intermediate goods.Does not count “used” goods.
GDP is used to measure a nation’s productivity.
GDP per capita is used to compare the productivity of selected countries.
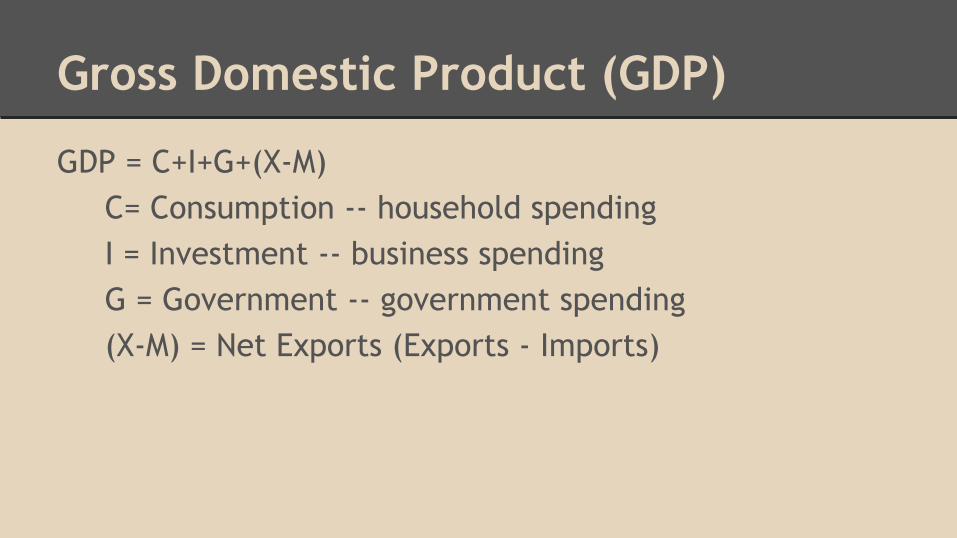
Gross Domestic Product (GDP)
GDP = C+I+G+(X-M)C= Consumption -- household spendingI = Investment -- business spending G = Government -- government spending(X-M) = Net Exports (Exports - Imports)
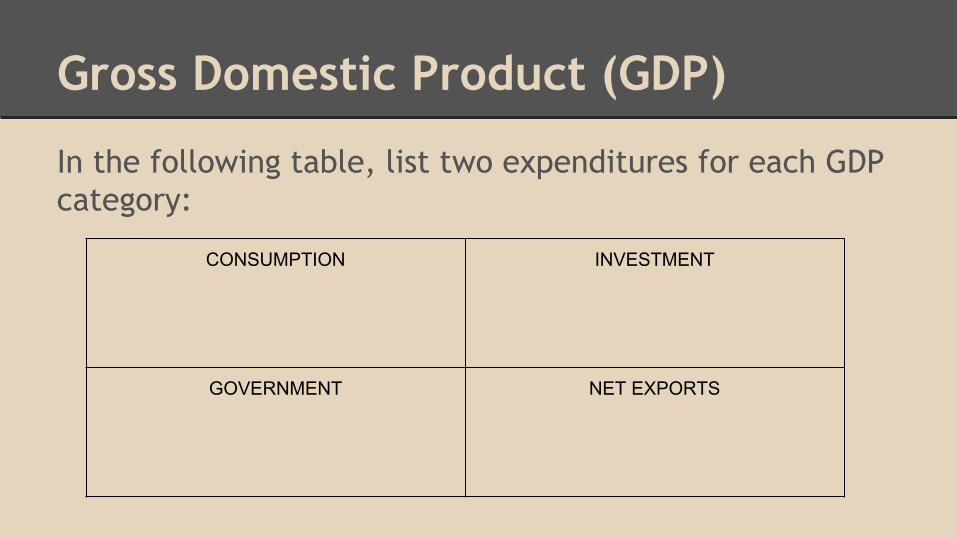
Gross Domestic Product (GDP)
In the following table, list two expenditures for each GDP category:
CONSUMPTION INVESTMENT
GOVERNMENT NET EXPORTS
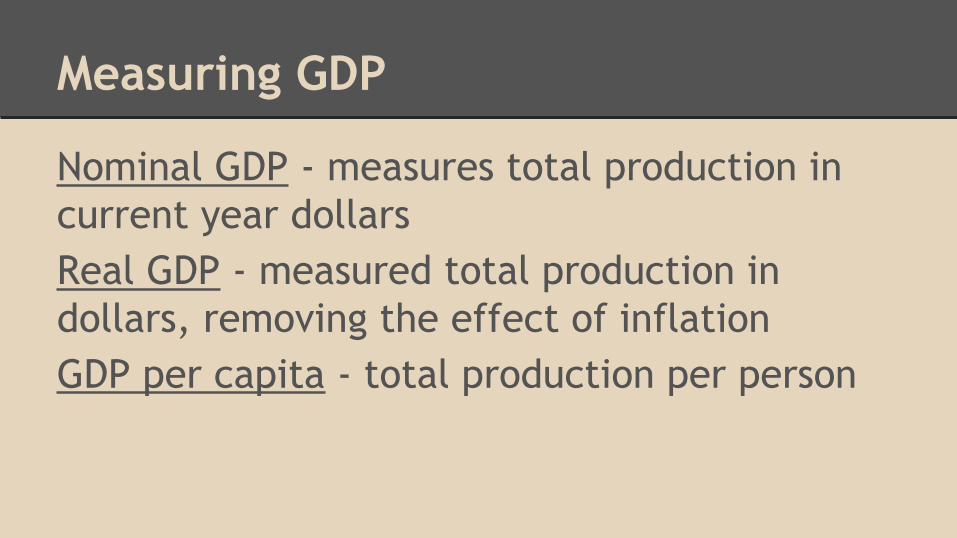
Measuring GDP
Nominal GDP - measures total production in current year dollarsReal GDP - measured total production in dollars, removing the effect of inflationGDP per capita - total production per person
October 30, 2013
Answer the following questions in complete sentences. Turn in this work by the end of the period.● Page 345, #3● Page 362, #10, 12● Page 363, #23 (a,b,c)● Page 445, #2
Work on Unit 5 Learning Guide if you finish early.
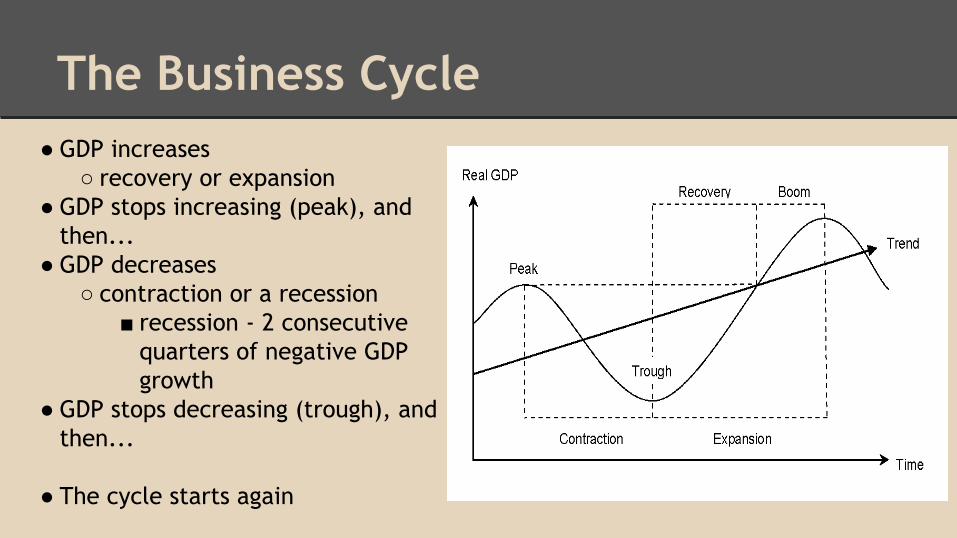
The Business Cycle● GDP increases
○ recovery or expansion● GDP stops increasing (peak), and
then... ● GDP decreases
○ contraction or a recession■ recession - 2 consecutive
quarters of negative GDP growth
● GDP stops decreasing (trough), and then...
● The cycle starts again
The Business Cycle
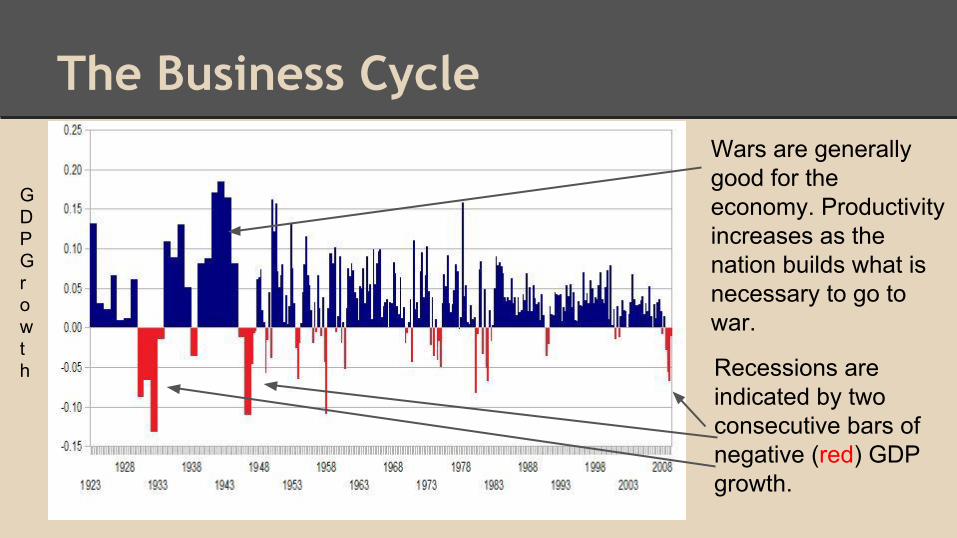
Recessions are indicated by two consecutive bars of negative (red) GDP growth.
GDP Growth
Wars are generally good for the economy. Productivity increases as the nation builds what is necessary to go to war.
Aggregate Supply
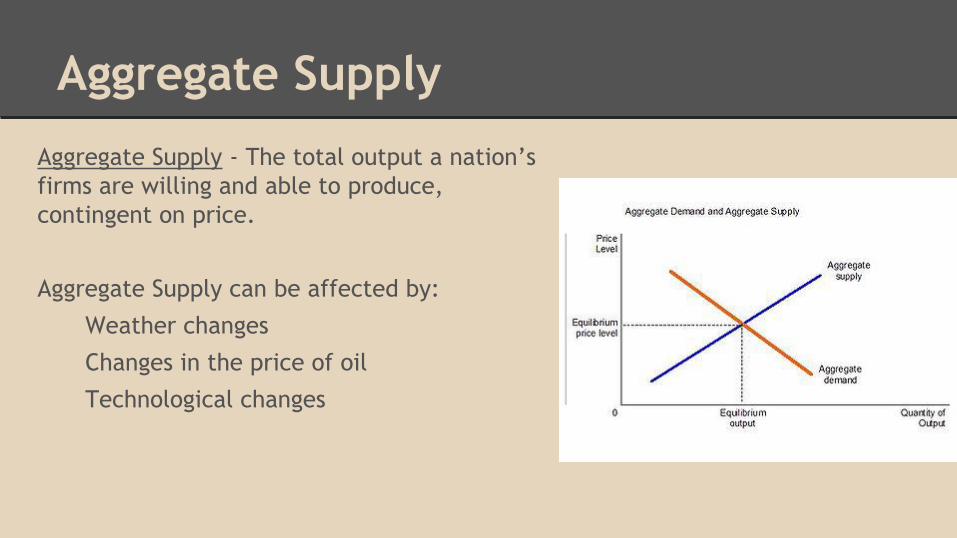
Aggregate Supply - The total output a nation’s firms are willing and able to produce, contingent on price.
Aggregate Supply can be affected by:
Weather changes
Changes in the price of oil
Technological changes
Aggregate Demand
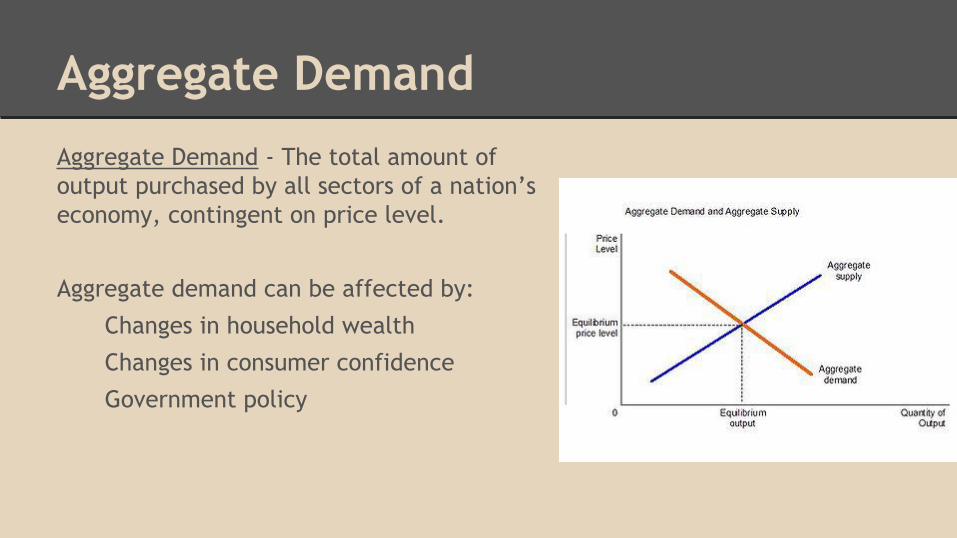
Aggregate Demand - The total amount of output purchased by all sectors of a nation’s economy, contingent on price level.
Aggregate demand can be affected by:
Changes in household wealth
Changes in consumer confidence
Government policy
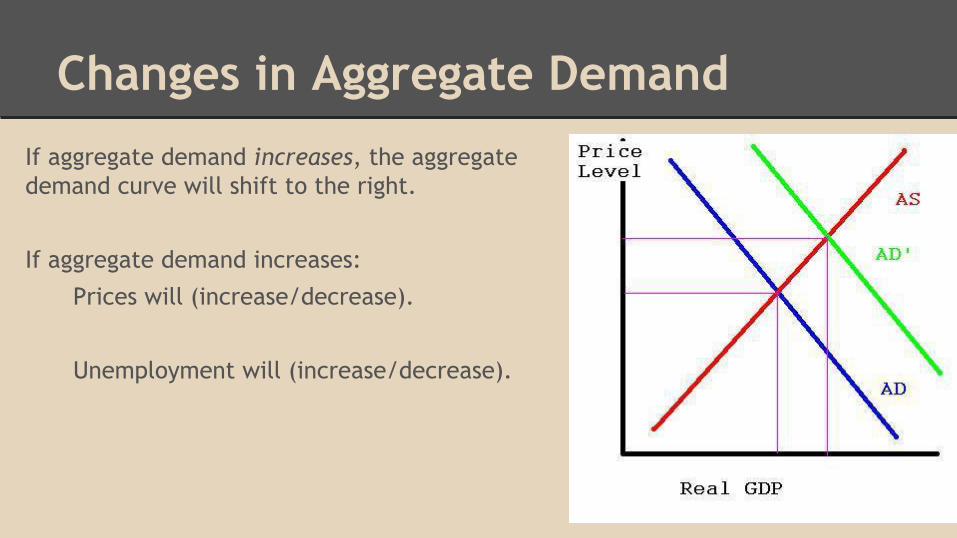
Changes in Aggregate Demand
If aggregate demand increases, the aggregate demand curve will shift to the right.
If aggregate demand increases:
Prices will (increase/decrease).
Unemployment will (increase/decrease).
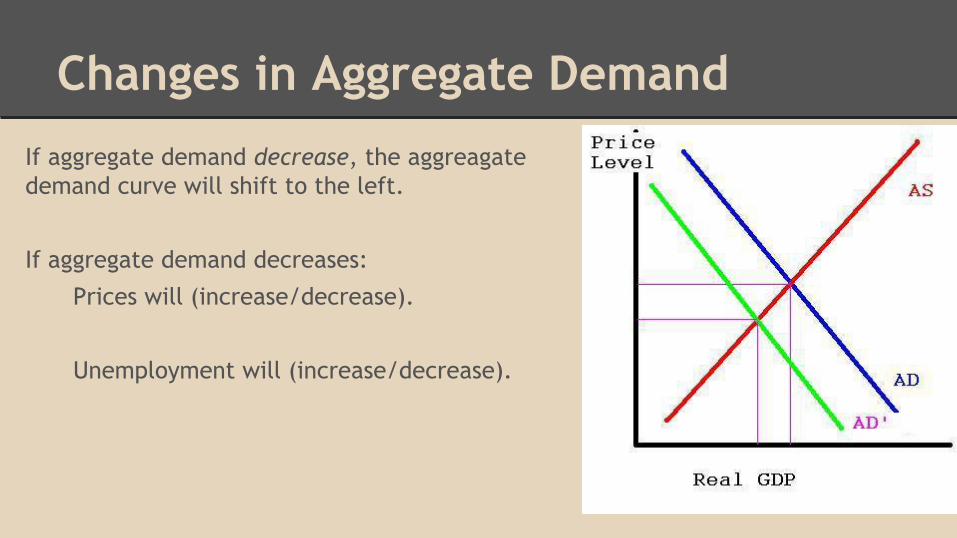
Changes in Aggregate Demand
If aggregate demand decrease, the aggreagate demand curve will shift to the left.
If aggregate demand decreases:
Prices will (increase/decrease).
Unemployment will (increase/decrease).
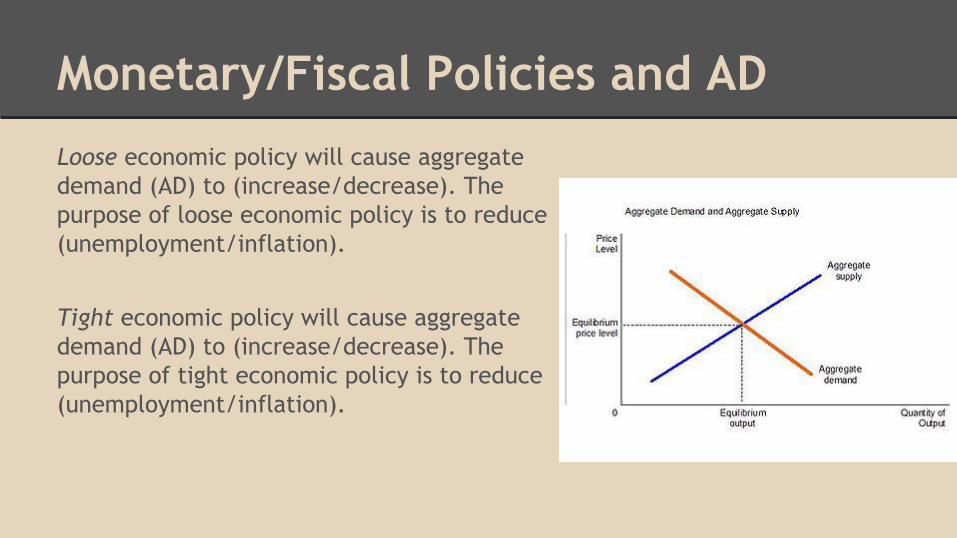
Monetary/Fiscal Policies and AD
Loose economic policy will cause aggregate demand (AD) to (increase/decrease). The purpose of loose economic policy is to reduce (unemployment/inflation).
Tight economic policy will cause aggregate demand (AD) to (increase/decrease). The purpose of tight economic policy is to reduce (unemployment/inflation).
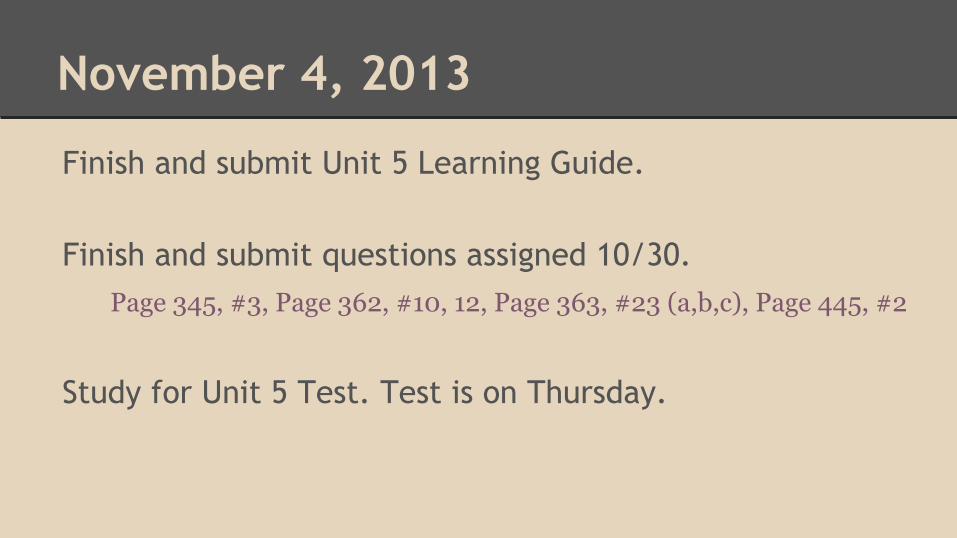
November 4, 2013
Finish and submit Unit 5 Learning Guide.
Finish and submit questions assigned 10/30.Page 345, #3, Page 362, #10, 12, Page 363, #23 (a,b,c), Page 445, #2
Study for Unit 5 Test. Test is on Thursday.