Embed Size (px)
Citation preview

9/12/2004 Stat 567: Unit 6 - Ramón V. León 1
Unit 6: Probability Plotting
Notes largely based on “Statistical Methods for Reliability Data”
by W.Q. Meeker and L. A. Escobar, Wiley, 1998 and on their class notes.
Ramón V. León

9/12/2004 Stat 567: Unit 6 - Ramón V. León 2
Unit 6 Objectives• Describe applications for probability plots• Explain the basic concepts of probability plotting• Show how to linearize a cdf on special plotting scales• Explain how to plot a nonparametric estimate of the cdf
to judge the adequacy of a particular parametric distribution
• Explain methods of separating useful information from noise when interpreting a probability plot
• Use a probability plot to obtain graphical estimates of reliability characteristics like failure probabilities and quantiles
9/12/2004 Stat 567: Unit 6 - Ramón V. León 3
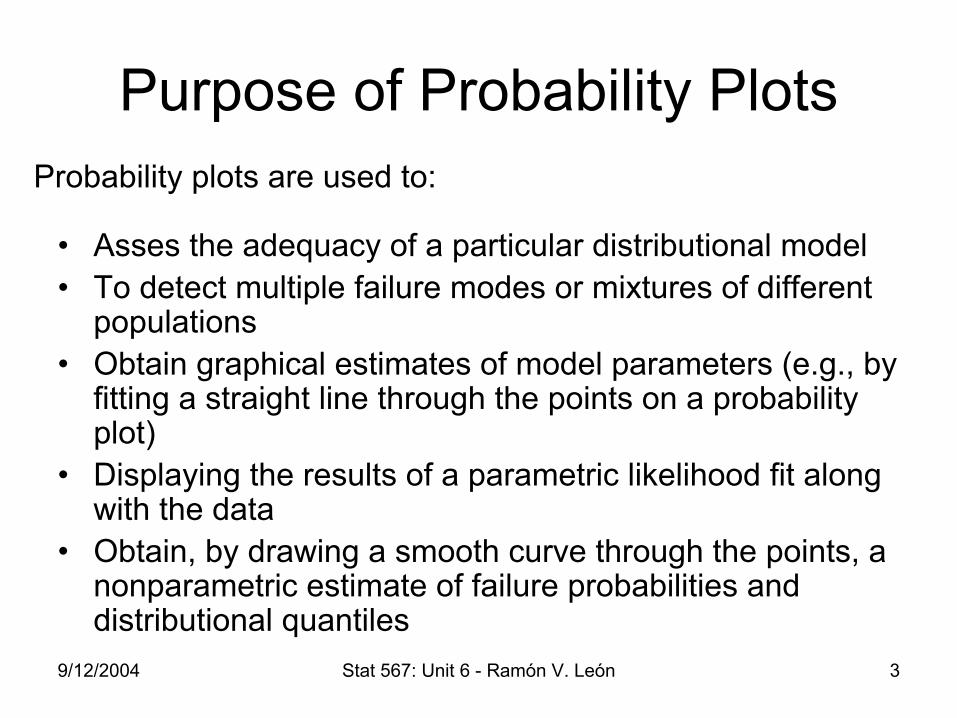
Purpose of Probability Plots
• Asses the adequacy of a particular distributional model• To detect multiple failure modes or mixtures of different
populations• Obtain graphical estimates of model parameters (e.g., by
fitting a straight line through the points on a probability plot)
• Displaying the results of a parametric likelihood fit along with the data
• Obtain, by drawing a smooth curve through the points, a nonparametric estimate of failure probabilities and distributional quantiles
Probability plots are used to:

9/12/2004 Stat 567: Unit 6 - Ramón V. León 4
Probability Plotting Scales: Linearizing a CDF

9/12/2004 Stat 567: Unit 6 - Ramón V. León 5
Linearizing the Exponential CDF
log(1 ) ptpγ
θ−
− − =
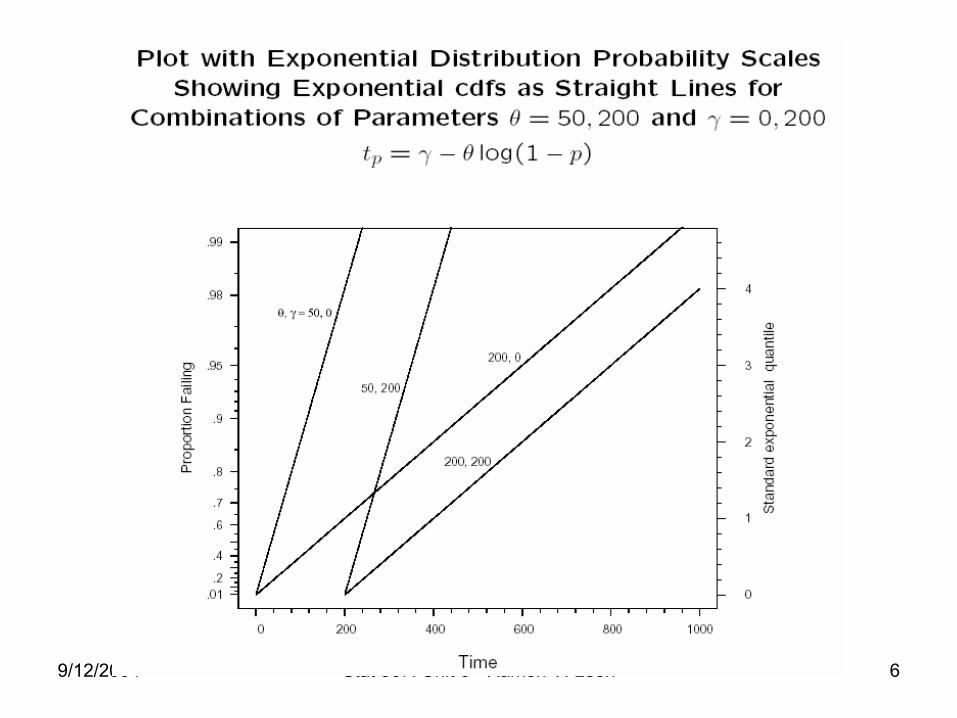
9/12/2004 Stat 567: Unit 6 - Ramón V. León 6

9/12/2004 Stat 567: Unit 6 - Ramón V. León 7
Linearizing the Normal CDF
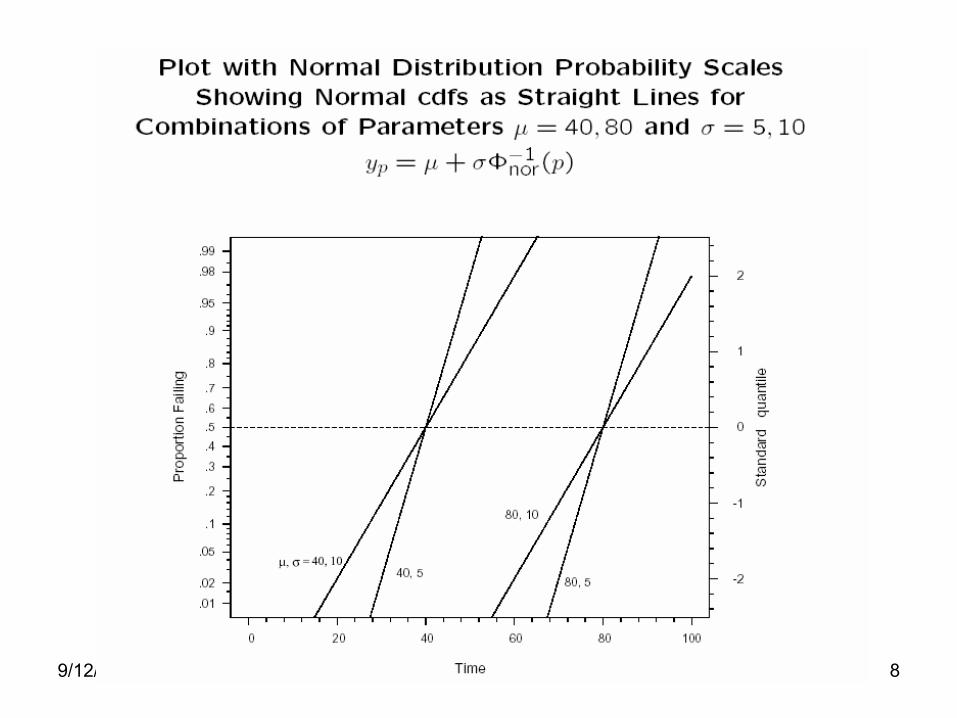
9/12/2004 Stat 567: Unit 6 - Ramón V. León 8

9/12/2004 Stat 567: Unit 6 - Ramón V. León 9
Linearizing the Lognormal CDF

9/12/2004 Stat 567: Unit 6 - Ramón V. León 10

9/12/2004 Stat 567: Unit 6 - Ramón V. León 11
Linearizing the Weibull CDF

9/12/2004 Stat 567: Unit 6 - Ramón V. León 12
Linearizing the Weibull CDF - Continued

9/12/2004 Stat 567: Unit 6 - Ramón V. León 13
9/12/2004 Stat 567: Unit 6 - Ramón V. León 14
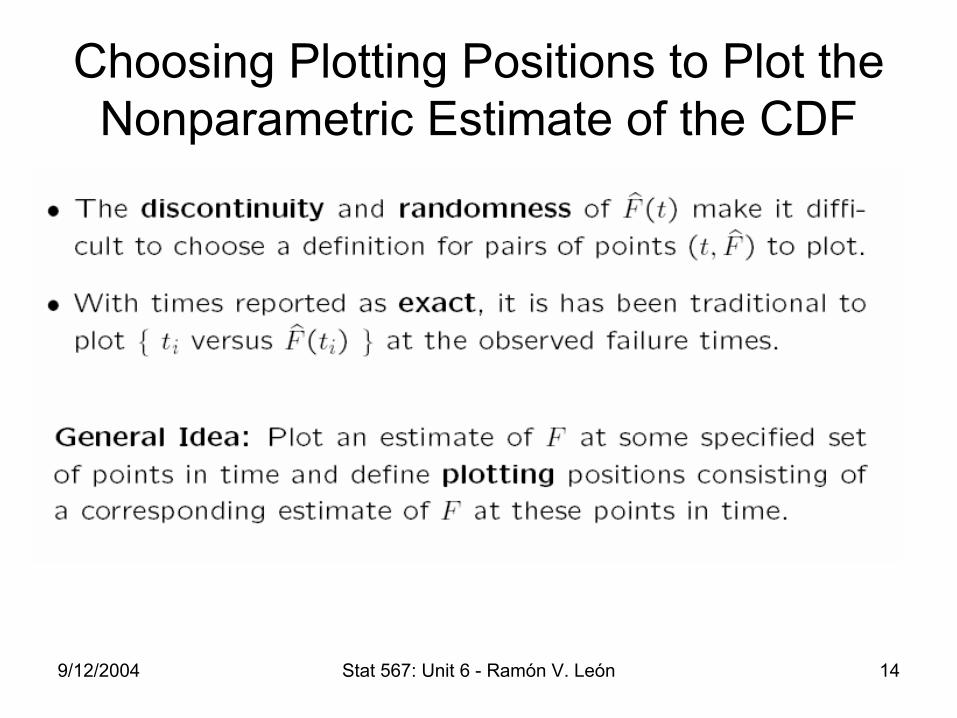
Choosing Plotting Positions to Plot the Nonparametric Estimate of the CDF

9/12/2004 Stat 567: Unit 6 - Ramón V. León 15
Criteria for Choosing Plotting Positions
• Checking distributional assumptions• Estimation of parameters• Display of maximum likelihood results
with data.
Criteria for choosing plotting positions should depend on the application or purpose for constructing the probability plot
Some applications that suggest criteria:

9/12/2004 Stat 567: Unit 6 - Ramón V. León 16
Plotting Positions: Continuous Inspection Data and Single Censoring

9/12/2004 Stat 567: Unit 6 - Ramón V. León 17
Plotting Positions: Continuous Inspection Data and Multiple Censoring

9/12/2004 Stat 567: Unit 6 - Ramón V. León 18

9/12/2004 Stat 567: Unit 6 - Ramón V. León 19

9/12/2004 Stat 567: Unit 6 - Ramón V. León 20

9/12/2004 Stat 567: Unit 6 - Ramón V. León 21
Six Distribution Probability Plots of the
Shock Absorber Data

9/12/2004 Stat 567: Unit 6 - Ramón V. León 22

9/12/2004 Stat 567: Unit 6 - Ramón V. León 23
Six Distribution Probability
PlotsAlloy
T7987 Fatigue Life
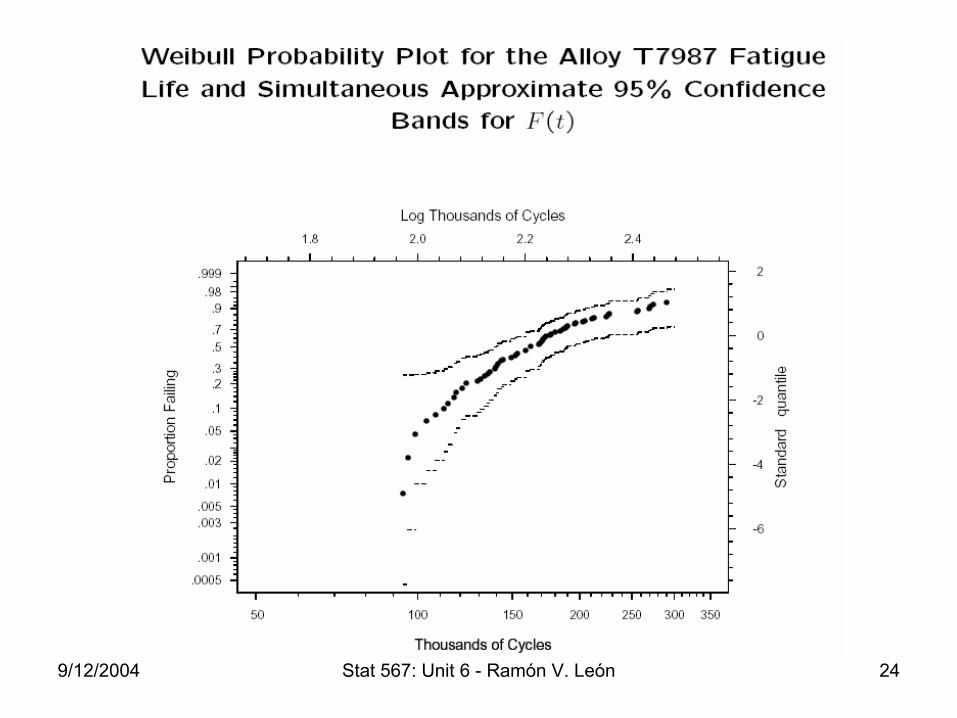
9/12/2004 Stat 567: Unit 6 - Ramón V. León 24
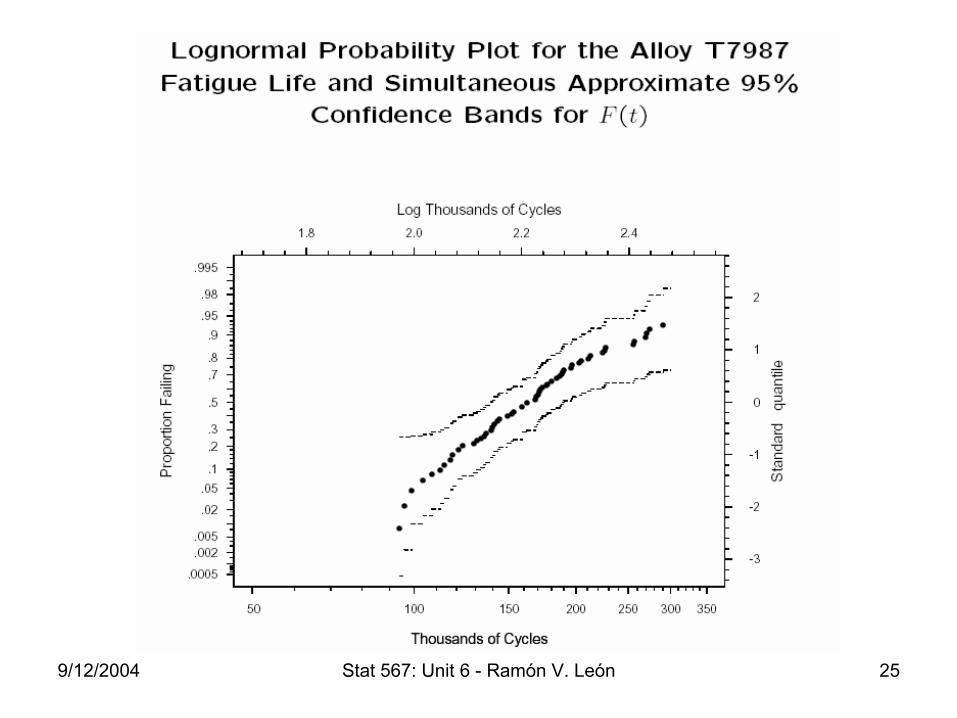
9/12/2004 Stat 567: Unit 6 - Ramón V. León 25

9/12/2004 Stat 567: Unit 6 - Ramón V. León 26
9/12/2004 Stat 567: Unit 6 - Ramón V. León 27
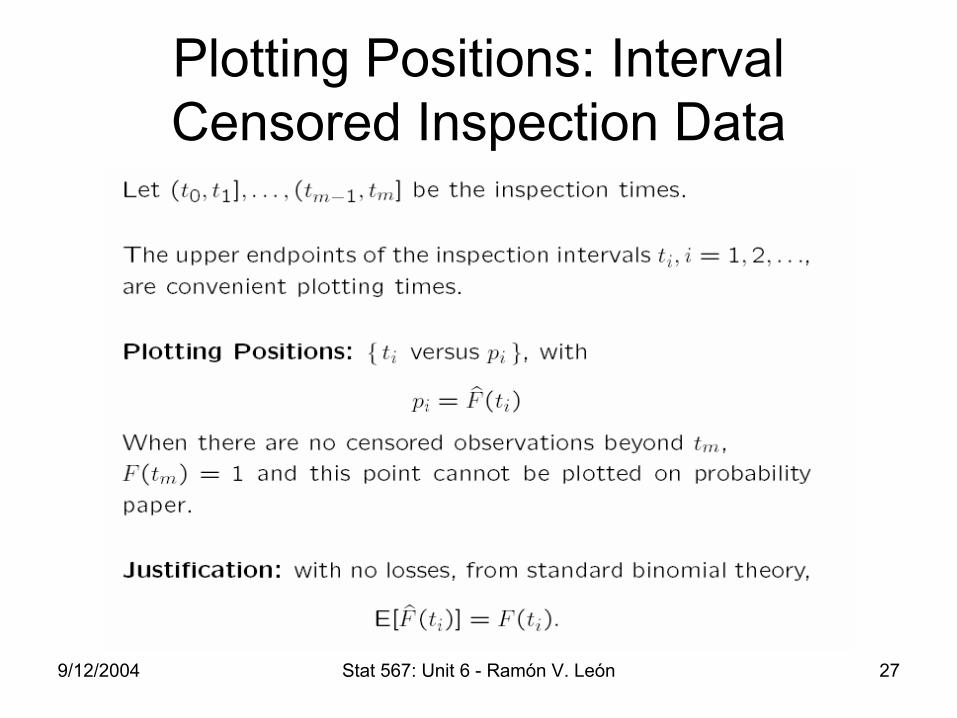
Plotting Positions: Interval Censored Inspection Data

9/12/2004 Stat 567: Unit 6 - Ramón V. León 28

9/12/2004 Stat 567: Unit 6 - Ramón V. León 29

9/12/2004 Stat 567: Unit 6 - Ramón V. León 30
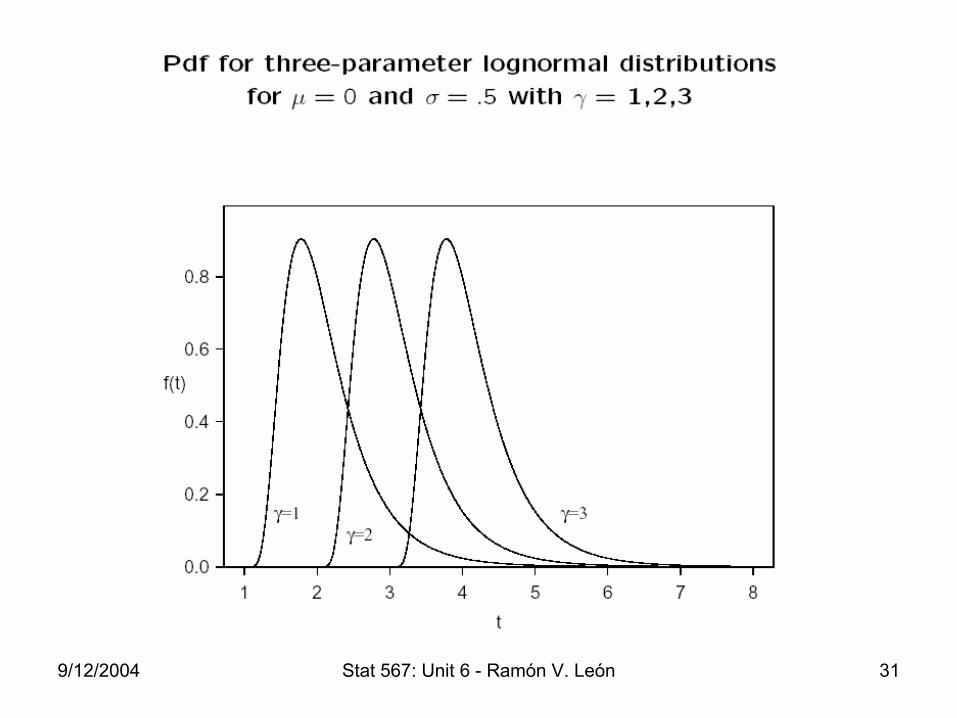
Probability Plots with Specified Shape Parameters
• Distributions that are not members of the location-scale family
• To help identify, graphically, the need for non-zero threshold parameters
• Estimate graphically a shape parameter
The probability plotting techniques can be extended to construct probability plots for:
9/12/2004 Stat 567: Unit 6 - Ramón V. León 31

9/12/2004 Stat 567: Unit 6 - Ramón V. León 32
Distributions with a Threshold Parameter
9/12/2004 Stat 567: Unit 6 - Ramón V. León 33
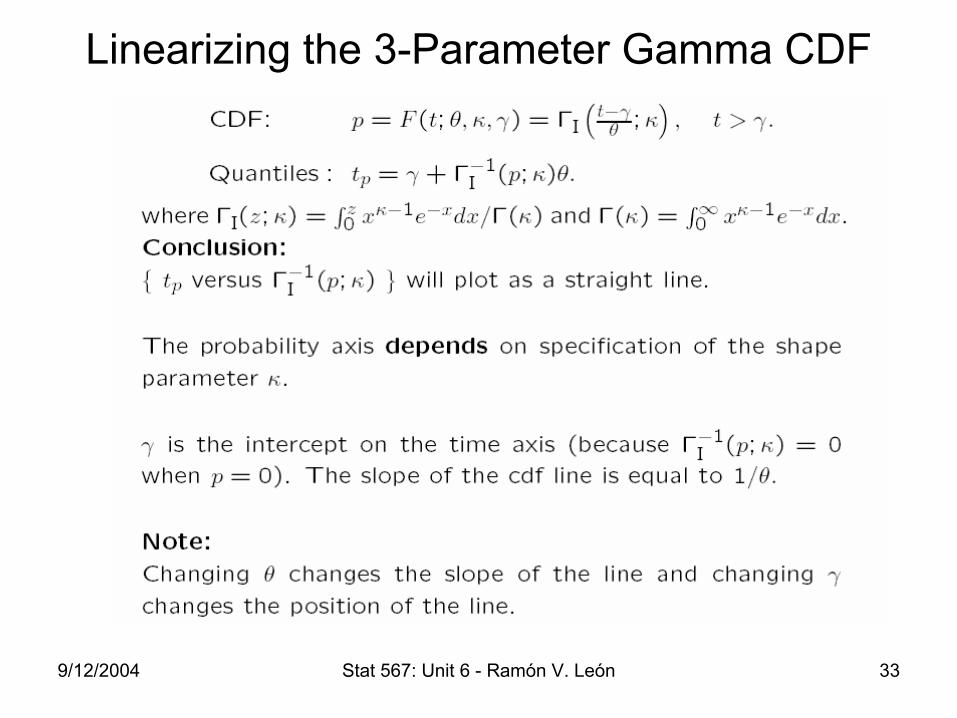
Linearizing the 3-Parameter Gamma CDF

9/12/2004 Stat 567: Unit 6 - Ramón V. León 34

9/12/2004 Stat 567: Unit 6 - Ramón V. León 35
Linearizing the 3-Parameter Weibull CDF Using Linear Time Axis and Specified Shape Parameter

9/12/2004 Stat 567: Unit 6 - Ramón V. León 36
9/12/2004 Stat 567: Unit 6 - Ramón V. León 37
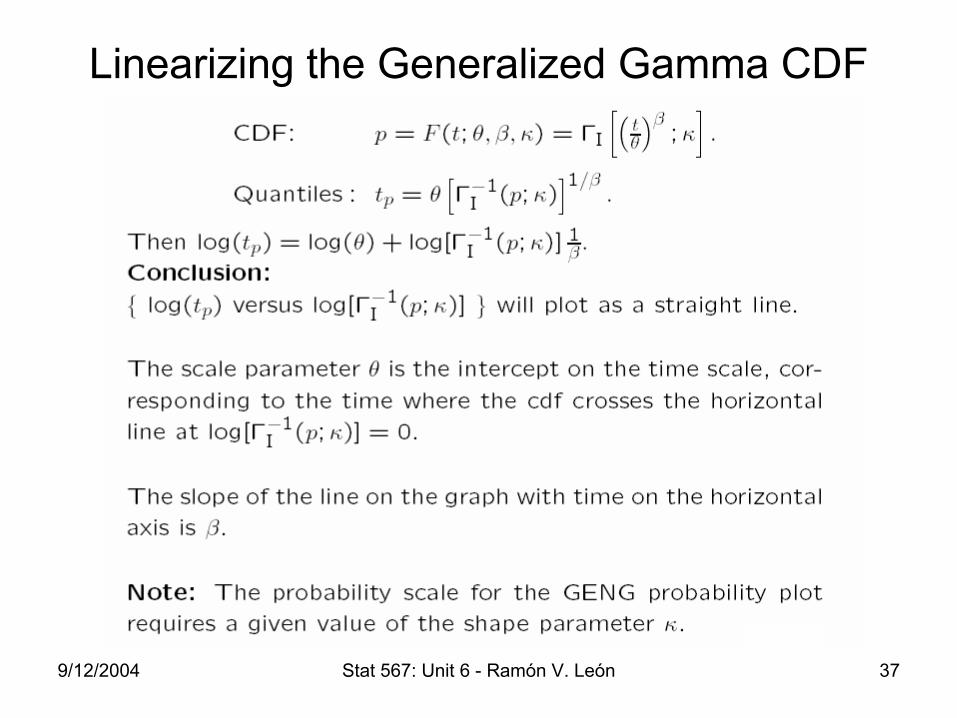
Linearizing the Generalized Gamma CDF

9/12/2004 Stat 567: Unit 6 - Ramón V. León 38

9/12/2004 Stat 567: Unit 6 - Ramón V. León 39

9/12/2004 Stat 567: Unit 6 - Ramón V. León 40
9/12/2004 Stat 567: Unit 6 - Ramón V. León 41
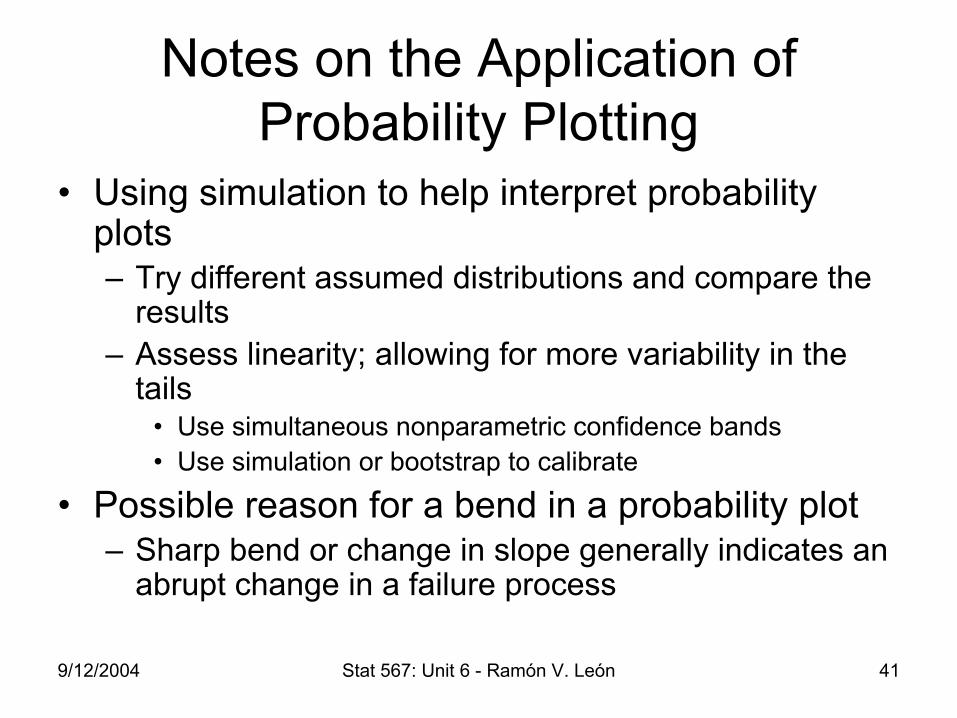
Notes on the Application of Probability Plotting
• Using simulation to help interpret probability plots– Try different assumed distributions and compare the
results– Assess linearity; allowing for more variability in the
tails• Use simultaneous nonparametric confidence bands• Use simulation or bootstrap to calibrate
• Possible reason for a bend in a probability plot– Sharp bend or change in slope generally indicates an
abrupt change in a failure process

9/12/2004 Stat 567: Unit 6 - Ramón V. León 42

9/12/2004 Stat 567: Unit 6 - Ramón V. León 43

9/12/2004 Stat 567: Unit 6 - Ramón V. León 44
9/12/2004 Stat 567: Unit 6 - Ramón V. León 45