Embed Size (px)
Citation preview
Name: ______________________________________ Class: ______________ Date: ____________
Unit 6: Say it with Symbols Investigation 4: Looking Back At Functions
Practice Ace Problems
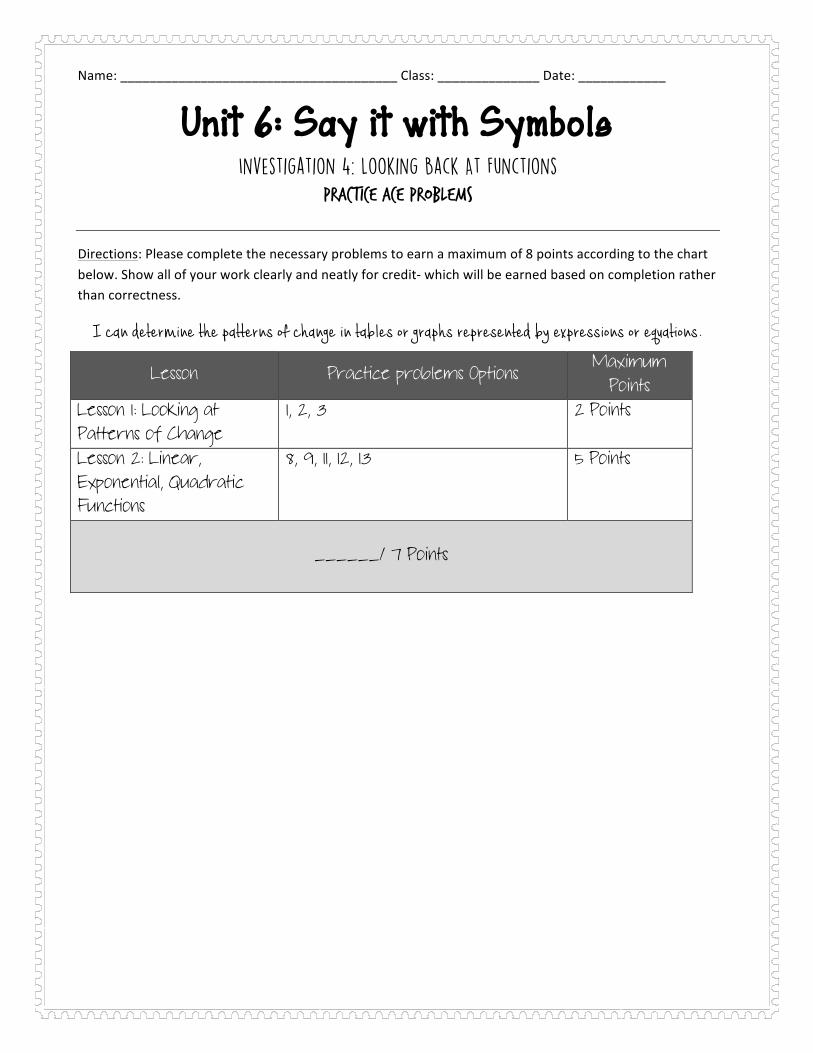
Directions: Please complete the necessary problems to earn a maximum of 8 points according to the chart below. Show all of your work clearly and neatly for credit-‐ which will be earned based on completion rather than correctness.
I can determine the patterns of change in tables or graphs represented by expressions or equations.
Lesson Practice problems Options Maximum Points
Lesson 1: Looking at Patterns of Change
1, 2, 3
2 Points
Lesson 2: Linear, Exponential, Quadratic Functions
8, 9, 11, 12, 13 5 Points
______/ 7 Points
Name: ______________________________________ Class: ______________ Date: ____________
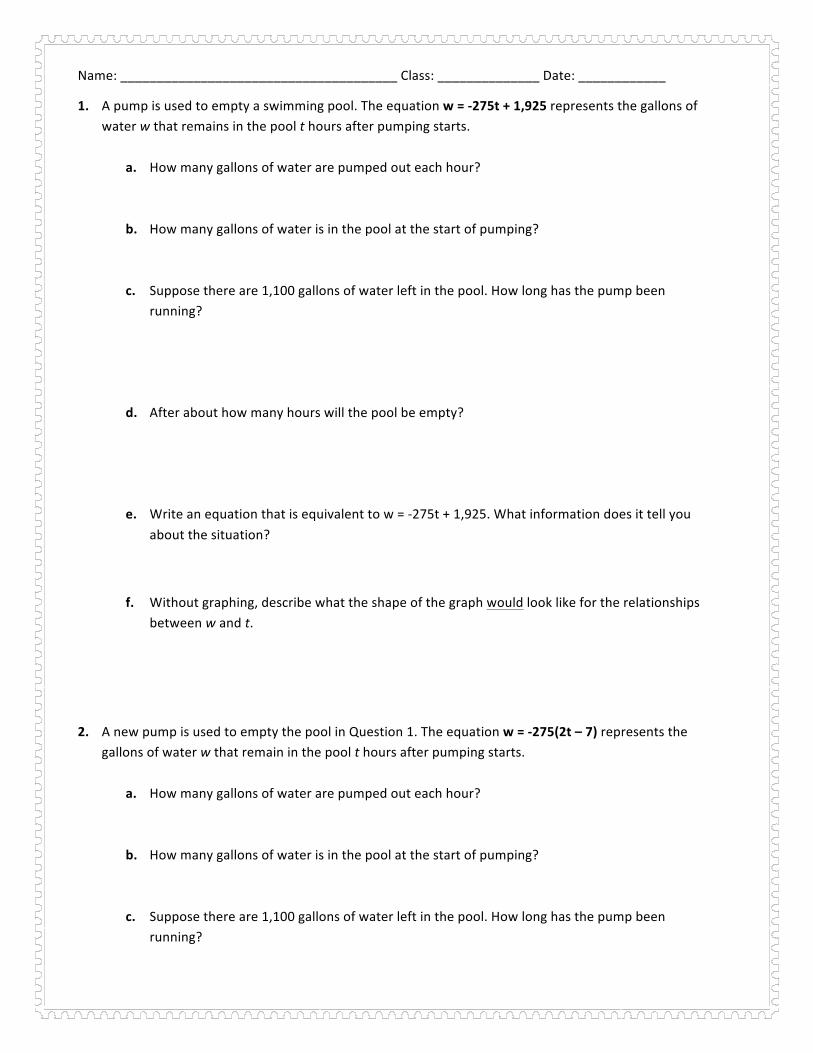
1. A pump is used to empty a swimming pool. The equation w = -‐275t + 1,925 represents the gallons of water w that remains in the pool t hours after pumping starts.
a. How many gallons of water are pumped out each hour?
b. How many gallons of water is in the pool at the start of pumping?
c. Suppose there are 1,100 gallons of water left in the pool. How long has the pump been running?
d. After about how many hours will the pool be empty?
e. Write an equation that is equivalent to w = -‐275t + 1,925. What information does it tell you about the situation?
f. Without graphing, describe what the shape of the graph would look like for the relationships between w and t.
2. A new pump is used to empty the pool in Question 1. The equation w = -‐275(2t – 7) represents the gallons of water w that remain in the pool t hours after pumping starts.
a. How many gallons of water are pumped out each hour?
b. How many gallons of water is in the pool at the start of pumping?
c. Suppose there are 1,100 gallons of water left in the pool. How long has the pump been running?
Name: ______________________________________ Class: ______________ Date: ____________
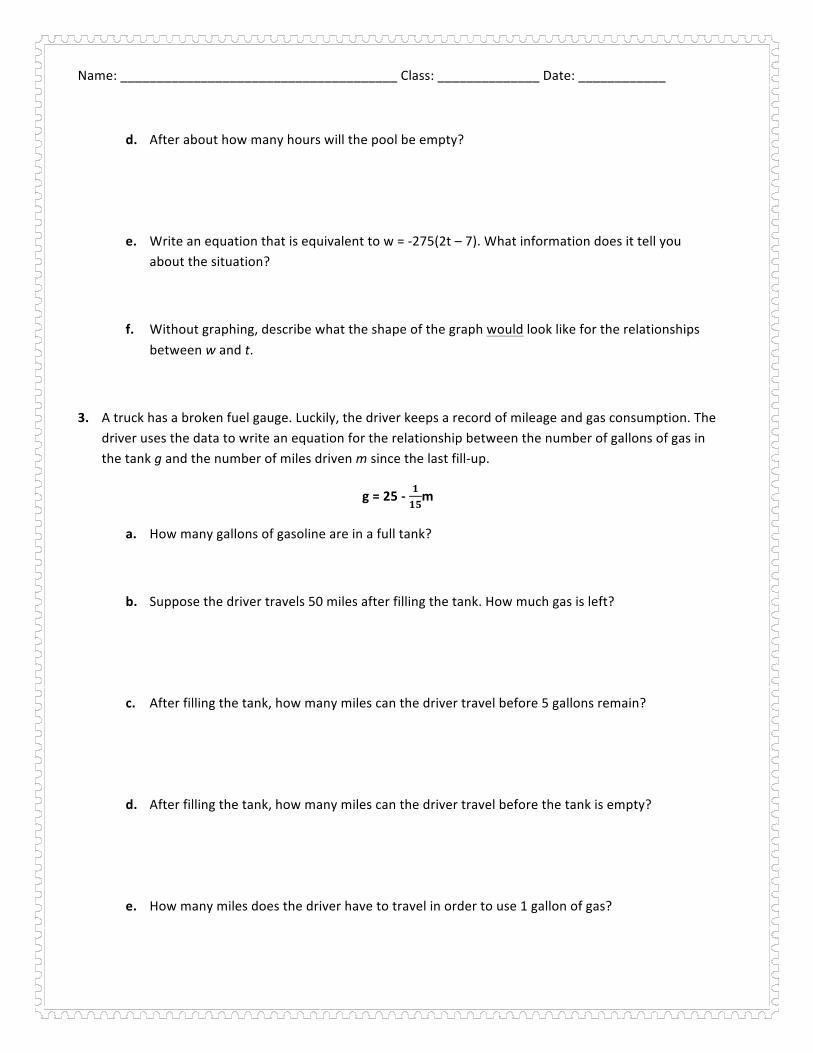
d. After about how many hours will the pool be empty?
e. Write an equation that is equivalent to w = -‐275(2t – 7). What information does it tell you about the situation?
f. Without graphing, describe what the shape of the graph would look like for the relationships between w and t.
3. A truck has a broken fuel gauge. Luckily, the driver keeps a record of mileage and gas consumption. The driver uses the data to write an equation for the relationship between the number of gallons of gas in the tank g and the number of miles driven m since the last fill-‐up.
g = 25 -‐ 𝟏𝟏𝟓m
a. How many gallons of gasoline are in a full tank?
b. Suppose the driver travels 50 miles after filling the tank. How much gas is left?
c. After filling the tank, how many miles can the driver travel before 5 gallons remain?
d. After filling the tank, how many miles can the driver travel before the tank is empty?
e. How many miles does the driver have to travel in order to use 1 gallon of gas?
Name: ______________________________________ Class: ______________ Date: ____________
f. In the equation, what do the numbers 25 and !!" tell you about the situation?
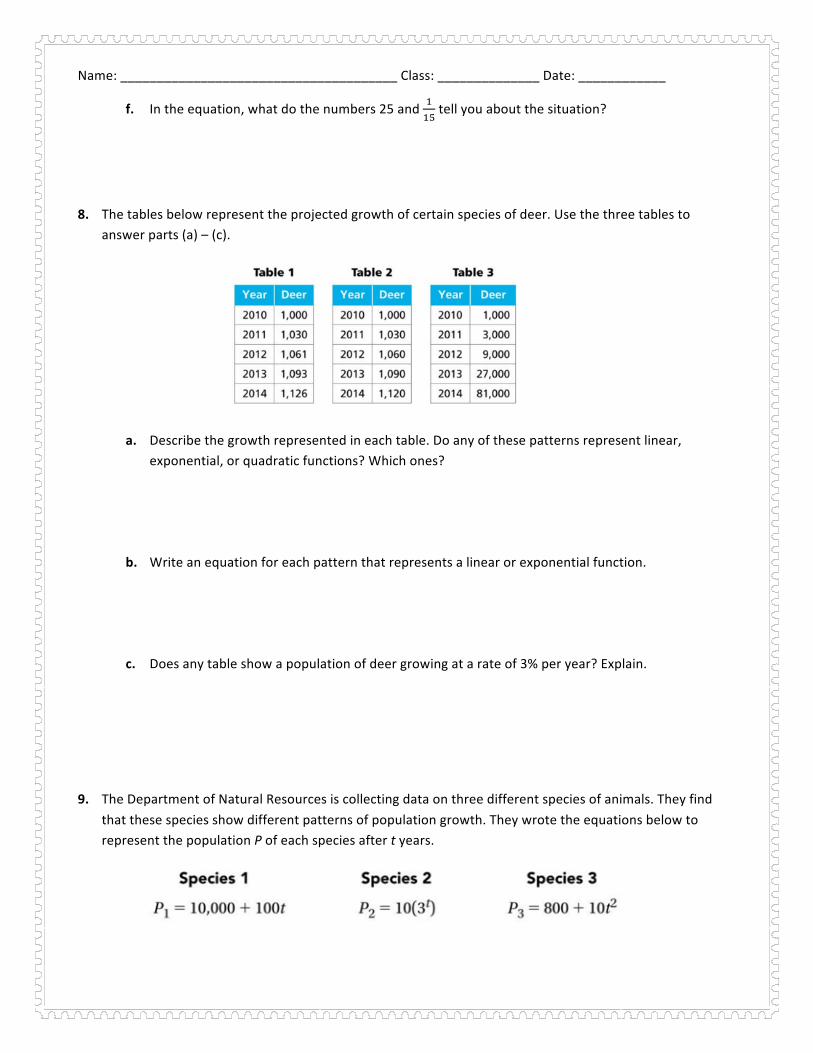
8. The tables below represent the projected growth of certain species of deer. Use the three tables to answer parts (a) – (c).
a. Describe the growth represented in each table. Do any of these patterns represent linear, exponential, or quadratic functions? Which ones?
b. Write an equation for each pattern that represents a linear or exponential function.
c. Does any table show a population of deer growing at a rate of 3% per year? Explain.
9. The Department of Natural Resources is collecting data on three different species of animals. They find that these species show different patterns of population growth. They wrote the equations below to represent the population P of each species after t years.
Name: ______________________________________ Class: ______________ Date: ____________
a. Describe what information the numbers and variables represent in each situation.
Species 1:
Species 2:
Species 3:
b. Describe the pattern of growth for each species. Explain how patterns differ.
Species 1:
Species 2:
Species 3:
c. Pick any two species. After how many years will the population of the two species be equal? Explain how you got your answer.
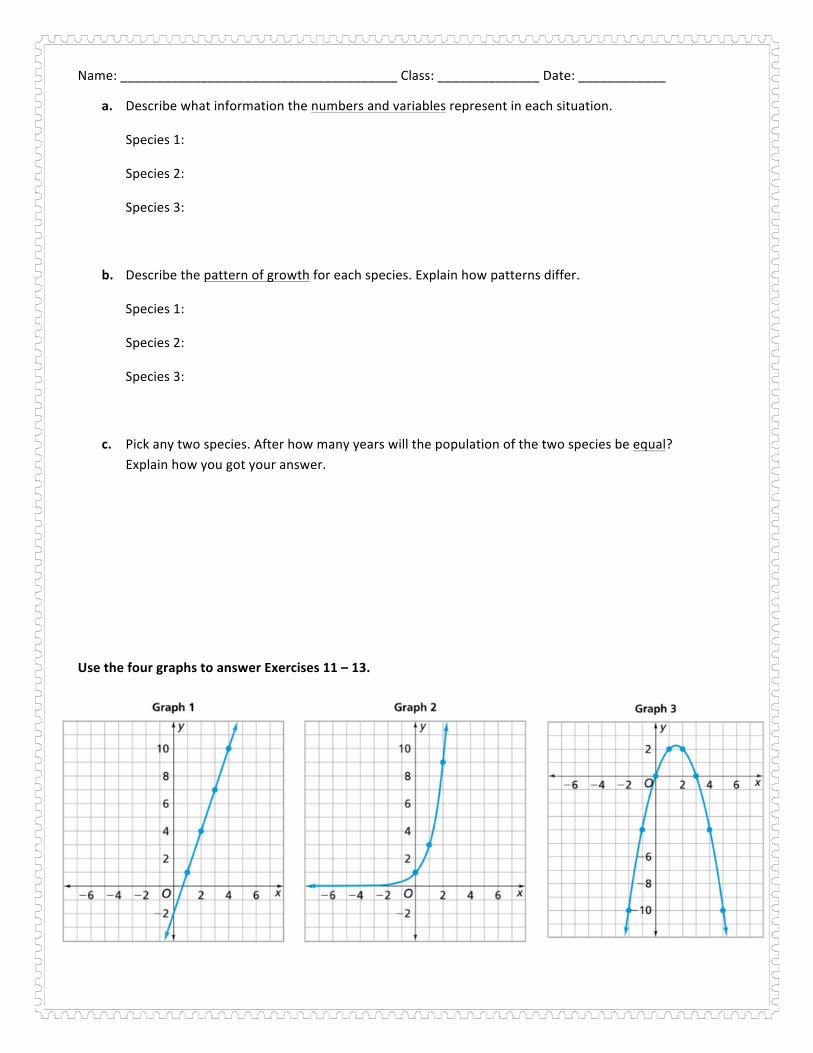
Use the four graphs to answer Exercises 11 – 13.
Name: ______________________________________ Class: ______________ Date: ____________
11. What graph represents a linear function? A quadratic function? An exponential function?
Linear: Quadratic: Exponential:
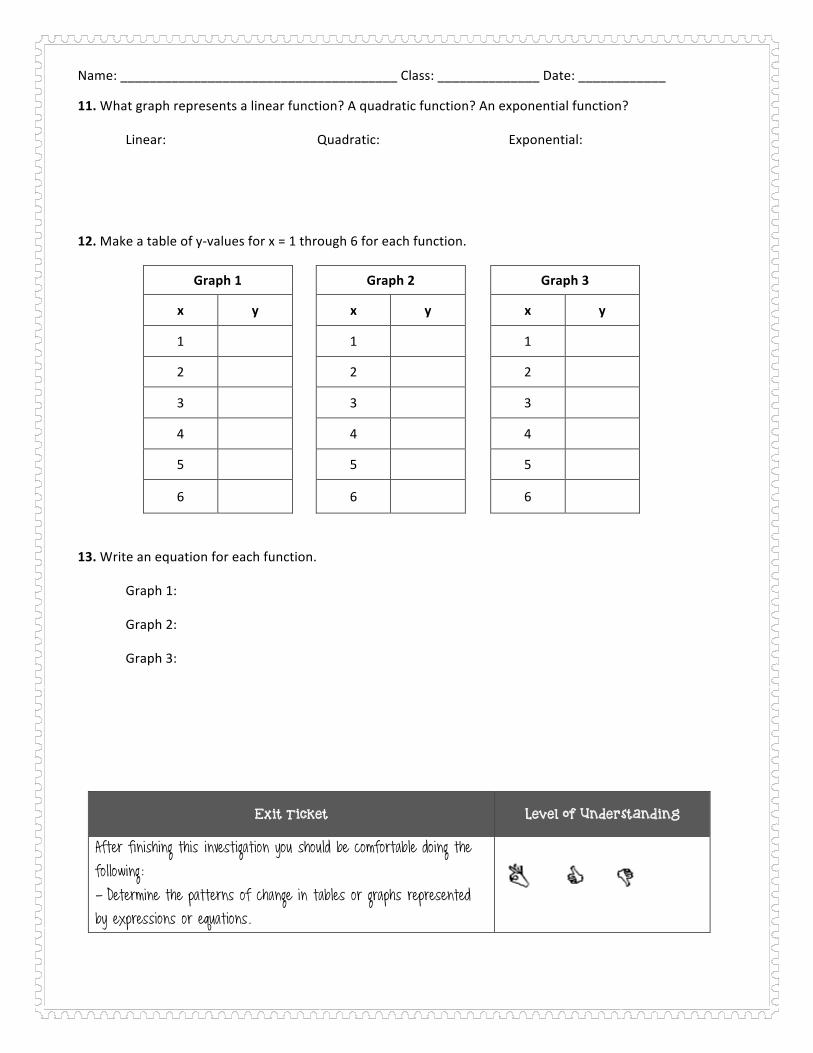
12. Make a table of y-‐values for x = 1 through 6 for each function.
Graph 1 Graph 2 Graph 3
x y x y x y
1 1 1
2 2 2
3 3 3
4 4 4
5 5 5
6 6 6
13. Write an equation for each function.
Graph 1:
Graph 2:
Graph 3:
Exit Ticket Level of Understanding
After finishing this investigation you should be comfortable doing the following: - Determine the patterns of change in tables or graphs represented by expressions or equations.

Name: ______________________________________ Class: ______________ Date: ____________


![Intrebari Test Grila Anul IV Cspa[1]Test](https://img.pdfslide.net/doc/110x75/55cf92e3550346f57b9a4a2d/intrebari-test-grila-anul-iv-cspa1test.jpg)