Embed Size (px)
Citation preview

UNITED ARAB EMIRATES: 40 Years of ProgressRetrospective Analysis of Key Indicators


“History is a continuous chain of events.The present is only an extension of the past.”
Sheikh Zayed bin Sultan Al Nahyan

UAE: 40 Years of Progress 3
Introduction
As the United Arab Emirates celebrates its 40th anniversary, it is timely to reflect upon how the country has developed and what it has achieved. Thanks to the country’s visionary leadership, what the nation has accomplished in the last four decades is truly extraordinary.
This analysis, United Arab Emirates: 40 Years of Progress hopes to contribute to a greater appreciation of the nation’s achievements by depicting its historical progression based on statistical information. The study draws upon recently released datasets from the UAE’s National Bureau of Statistics and from international organizations such as the United Nations and the World Bank.
To provide a multi-faceted reflection of the country’s profound transformation, charts are used to illustrate selected accomplishments in key dimensions such as health and education, economy and infrastructure, travel and tourism, environment and foreign aid. For each dimension, historical milestones are presented to offer a greater sense of the social and economic progress achieved. Moreover, the country’s development experience is occasionally juxtaposed with other economies to provide further contextual backdrop.
At best, the charts offer but a glimpse of the depth of the United Arab Emirates’ development experiences, hinting of the numerous challenges and obstacles that have been overcome. A fuller picture can be obtained through the rich trove of historical archives, spoken recollections and cultural artifacts. But in sketching the country’s successful transformation using charts based on statistical data, this study seeks to contribute in its unique way to a deeper appreciation of the past, and a greater expectation of the potential that the country’s future holds.
Introduction

UAE: 40 Years of Progress 5UAE: 40 Years of Progress4
OverviewHighlights
OverviewThe Human Development Index, which embodies the view that “People are the real wealth of a nation” shows the progress the UAE has made in health, education and income over the last four decades. From a rank of 62nd in 1971, the UAE is now 30th among 187 countries in the Human Development Index, with a score that has surpassed that of Europe as a whole.
HealthSince 1970, average life expectancy in the UAE has surged to now exceed 76 years. The country’s various mortality indicators have all improved significantly, especially the infant mortality rate, which is now even better than that of the United States.
EducationFour decades ago, only 48% of UAE adults were literate; today, over 93% are literate, with nearly equal rates for men and women. Educational attainment is also much higher, with mean years of schooling rising from 3 years in 1970 to 9 years in 2010.
EconomyUAE’s GDP has now exceeded 1 trillion dirhams, from 11 billion dirhams in 1973, depicting a rate of economic expansion that has exceeded even that of Singapore. The UAE has the world’s third highest GDP per capita (in purchasing power parity terms).
InfrastructureThe UAE’s rapid modernization is reflected in its world-class infrastructure, especially in communications . Today, the UAE enjoys one of the highest mobile phone penetration rates in the world, and is among the heaviest users of social media in the region.
Travel & TourismThe success of the country’s airline industry has enabled the country to exceed Singapore in the number of departures of registered carriers and number of passengers. The tourism industry has also flourished, making the UAE one of the leading tourist destinations worldwide.
EnvironmentAs the country strives to improve its environmental performance, carbon dioxide emissions per capita have been declining, from 80 metric tons per capita in 1971 to 31 metric tons per capita in 2007.
Foreign AidUAE’s foreign aid during the last four decades is estimated to exceed 163 billion dirhams. When other forms of development assistance are included, the total increases to an estimated 255 billion dirhams, making the country one of the most generous donors in the world.
Overview of Progress in Human DevelopmentHighlights
Human Development Index Scores: UAE and Europe, 1970-2010
Data Sources: United Nations’ Human Development Index database and Wolfram Alpha
Over the last 40 years, the UAE has made tremendous gains, enabling the country’s score in the Human Development Index to surpass that of Europe
In 2011, UAE ranks 30th among 187 countries in the Human Development Index0.75
0.85
0.80
0
Europe with Russiaand Turkey
United Arab Emirates
0.70
0.65
0.60
1970 1972 1980 1990 2000 2010197819761974 1982 198819861984 1992 199819961994 2002 200820062004

Health

HealthHealth
UAE: 40 Years of Progress 9UAE: 40 Years of Progress8
1971 19911972 1973 20001985 20051986 20071983 1990 2009
National blood transfusion program
Noor Hospital in Abu Dhabi
Dubai’s Department of Health and Medical
Services
UAE has seven federal hospitals
Rashid Hospital in Dubai Dubai Hospital Al Wasl Hospital in Dubai
Selected Historical Milestones
Dubai Health Authority
Federal Health Authority
Abu Dhabi Health Services Company (SEHA) & Health
Authority of Abu Dhabi (HAAD)
Al Qassimi Hospital in Sharjah
Commissioning of the Sheikh Khalifa Medical
City
Issuance of Law that made health insurance mandatory in Abu Dhabi
and the formation of DAMAN

Health
UAE: 40 Years of Progress 11
Data Sources: World Bank’s World Development Indicators Database and United Nations’ Human Development Index 2011 Database
UAE Male and Female Life Expectancy at Birth(in years)
UAE and High Income Countries: Life Expectancy, 1970 and 2010(in years)
Among its greatest accomplishments, the UAE’s average life expectancy now exceeds 76 years, approaching the level of the most highly developed economies
020102000199019801970
75
65
55
45
35
25
15
5
80
1995
10
40
70
30
60
1975 2005
20
1985
50
Female
Male
77%79%
2010 1970
High Income CountriesUnited Arab Emirates
63
8077
71

HealthHealth
UAE: 40 Years of Progress 13UAE: 40 Years of Progress12
Data Source: World Bank’s Health Nutrition and Population DatabaseData Source: World Bank’s World Development Indicators Database
UAE and High Income Countries: Child Mortality Rate, 1970 and 2010
(per 1,000)
Child Mortality Rate, 1970-2010(per 1,000)
Survival of children under 5 years of age also dramatically improved to reach similar levels as most high income countries
UAE and High Income Countries: Infant Mortality Rate, 1970 and 2010
(per 1,000 live births)
UAE Infant Mortality Rate, 1970-2010(per 1,000 live births)
The UAE has significantly reduced infant mortality to a rate that is now better than that of the United States
15
10
30
25
20
5
0
40
35
70
6567
60
55
50
45
USAUnited Arab Emirates
1970
19
72
1974
19
76
1978
19
80
1982
19
84
1986
19
88
1990
19
92
1994
19
96
1998
20
00
2002
20
04
2006
20
08
2010
6
1970 2010
United Arab Emirates High Income Countries
24
65
67
1975 19851970 1980 20101990 1995 20052000
91
43
30
2216
129
63
7
20101970
United Arab Emirates High Income Countries
30
76
91

HealthHealth
UAE: 40 Years of Progress 15UAE: 40 Years of Progress14
Data Source: World Bank’s World Development Indicators DatabaseData Source: World Bank’s World Development Indicators Database
Health Expenditure Per Capita, 1995-2009 (in dirhams)
The UAE’s remarkable improvements in health and longevity have been made possible by significant increases in resource commitments
Comparison of Maternal Mortality Ratios, 1990 and 2008 (modeled estimate, per 100,000 live births)
UAE Maternal Mortality Ratio, 1990-2008 (modeled estimate, per 100,000 live births)
Maternal mortality has been reduced in the UAE to a rate that is lower than that of New Zealand and Republic of Korea
28
20082005200019951990
15
10
20
12
2007199819971996 20011995 2006 2009200820052004200320021999 2000
2,616 2,578 2,6352,511 2,487 2,565
2,7592,602
27612,897
3,289
3,947
4,693
5,237
5,579
28
20081990
Korea, Rep.New ZealandUnited Arab Emirates
1818 18
14
10

Education

EducationEducation
UAE: 40 Years of Progress 19UAE: 40 Years of Progress18
1977 2001 20031978 20051983 1991 1997 20072006 20091988 1998 2010
Selected Historical Milestones
Petroleum Institute Abu Dhabi Education Council
Abu Dhabi campus of Sorbonne University INSEAD – Abu Dhabi
Abu Dhabi UniversityKhalifa University of Science, Technology
and Research
Dubai’s Knowledge and Human Development
Authority
Start of teaching at Masdar Institute of
Technology
Entry of Initial class of students of the New York
University campus in Abu Dhabi
UAE University Zayed UniversityEmirates Aviation CollegeEmirates Institute for
Banking and Financial Studies
ADNOC Technical Institute
Higher Colleges of Technology University of Sharjah

Education
UAE: 40 Years of Progress 21
Data Sources: World Bank’s World Development Indicators Database, UAE National Bureau of Statistics
UAE Female and Male Literacy Rate, 1975 and 2005(% of population ages 15 and above )
UAE Adult Literacy Rate, 1970-2010(% of population ages 15 and above )
In 1970, only 48% of UAE adults were literate; today over 93% are literate, with nearly equal rates for women and men
38.1
2005 1975
Female
Male
89.591.5
58.4
70
65
60
10
50
45
40
2005
30 25
20
1985
5
0
35
1980
75
1990 1995 2000
80
15
85
90
2010
55
95
1970 1975
4852
61
69
76
8184
8993

EducationEducation
UAE: 40 Years of Progress 23UAE: 40 Years of Progress22
Data Source: World Bank’s World Development Indicators Database Data Source: United Nations’ Human Development Index 2011 Database, UNESCO, Barro-Lee (2010)
UAE Primary Education Enrollment Rate: Male and Female, 1978 and 2009
(% Net)
Primary education enrollment in the UAE rose from 74.5% in 1980 to nearly 90%, maintaining near gender parity
UAE Primary Education Enrollment Rate(% Net)
UAE Mean Years of Schooling of Adults, 1980-2010(years of schooling of adults aged 25 years and above)
Increasing enrolment rates across all levels boosted educational attainment of the UAE’s adult population to an average of 9.2 years of schooling today
201020092008200720062005200420032002200120001995199019851980
3.1
3.6
4.3
5.6
6.97.2
9.29.18.98.7
8.58.48.1
7.87.5
77.3
2009
90.5 88.8
77.1
1978
FemaleMale
5 0
2010 1980
100 95
90
85
80
75
70
65 60 55 50 45
40
10
30
25 20 15
2000 1990
35
90

EducationEducation
UAE: 40 Years of Progress 25UAE: 40 Years of Progress24
Data Source: World Bank’s World Development Indicators Database
UAE Female Tertiary Education Enrollment Rate, 1980-2009(% Gross)
UAE Tertiary Education Enrollment Rate, 1979 -2009(% Gross)
Tertiary education enrollment in the UAE rose from 1.3% in 1979 to 30% in 2009, with female tertiary enrollment rates rising even higher to 41.3%
Data Source: World Bank’s World Development Indicators Database
Comparative Female Secondary Education Enrollment Rate, 2009
(% Gross)
UAE Secondary Education Enrollment Rate(% Gross)
Secondary education enrollment in the UAE rose from 22% in 1973 to 95% in 2009, with the female secondary enrollment rate among the highest in the region
Middle East &North Africa
71.6
Arab World
72.5
United ArabEmirates
95.6
2009
30.4
1999
17.6
1989
6.5
1979
1.3
2009
41.3
2000
29.6
1990
12.3
1980
2.7
70
20
60
10
1990
15
19801970 2005
95
1995
85
1985
75
1975
65
55
100
50
90
40
80
30
5 0
45
2010
35
2000
25
95
22
44
6164
7875
82

Economy

EconomyEconomy
UAE: 40 Years of Progress 29UAE: 40 Years of Progress28
1971 1988 19921973 19961975 1977 1979 2006 200820041976 1984 19871985 2010
Selected Historical Milestones
Abu Dhabi National Oil Company (ADNOC)
Fujairah Free Zone
Ajman & Um Al Quwain Free
Zones
International Petroleum Investment Company
Abu Dhabi Investment Company
Start of UAE’s first cement factory in Ras al Khaimah
Ras Al Khaimah & Sharjah Free
Zones
Abu Dhabi Investment
Council
UAE Offsets Group
Abu Dhabi’s Higher
Corporation for Specialized
Economic Zones
Dubai Financial Market
Unveiling of Abu Dhabi’s 2030
Economic Vision
UAE’s GDP exceeds Dh 1
trillion
Circulation of the UAE Dirham
Dubai Aluminum Company
Abu Dhabi Investment Authority
Jebel Ali Free Zone
Abu Dhabi Securities Exchange
2000
Dubai International
Financial Center
UAE Currency Board (Currently Central Bank of
the UAE)
Economy
UAE: 40 Years of Progress 31
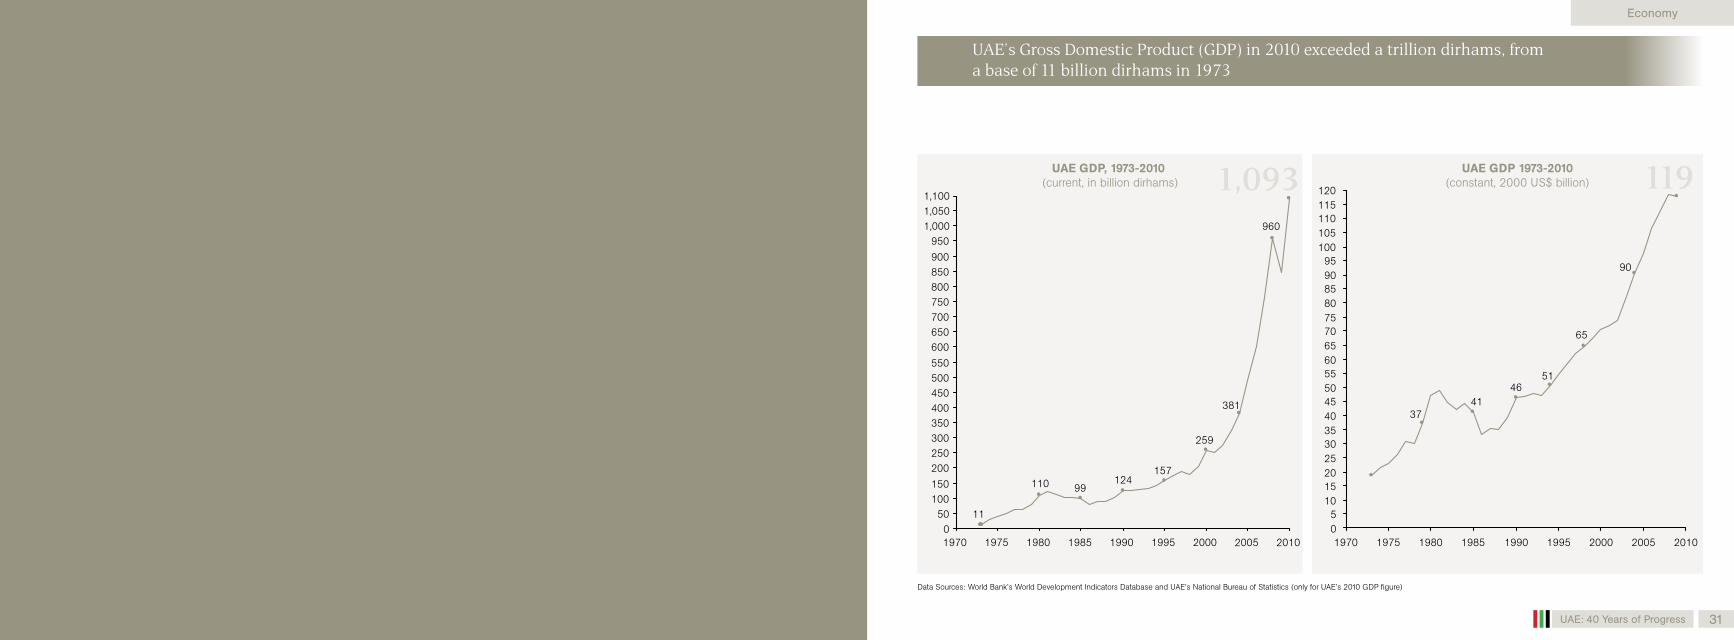
Data Sources: World Bank’s World Development Indicators Database and UAE’s National Bureau of Statistics (only for UAE’s 2010 GDP figure)
UAE GDP 1973-2010(constant, 2000 US$ billion)
UAE GDP, 1973-2010 (current, in billion dirhams)
UAE’s Gross Domestic Product (GDP) in 2010 exceeded a trillion dirhams, from a base of 11 billion dirhams in 1973
381
960
1,093
259
157124
99110
11
20102005
300250
700
200
600
550
01985
850
650
900
1970
950
50
150100
450400
1,000
500
800750
1,1001,050
350
200019801975 19951990
120
1980
90
20
1985
70
1970
80
10
1975
75
25
020102005200019951990
11511010510095
65
15
5045403530
55
5
85
60
90
119
65
5146
4137

EconomyEconomy
UAE: 40 Years of Progress 33UAE: 40 Years of Progress32
Data Source: United Nations’ Human Development Index 2011 Database website http://hdrstats.undp.org/en/indicators/20206.html
GDP per capita in PPP terms, 2011 (constant 2005 international US$)
Latest figures indicate that the UAE has the world’s third highest GDP per capita in purchasing power parity terms
Data Sources: World Bank’s World Development Indicators Database and UAE’s National Bureau of Statistics (only for UAE’s 2010 GDP figure)
GDP of UAE and Singapore, 1973-2010 (current, in US$ billion)
The pace of UAE’s economic expansion over nearly four decades has exceeded even that of Singapore
200
1990 1995
300
250
20051980 19851975 20000
Singapore
United Arab Emirates
150
100
50
1973
223
298
2010
Netherlands
Hong Kong
Ireland
Switzerland
Luxembourg
Qatar
United Arab Emirates
Norway
Singapore
United States
36,358
39,255
36,278
36,954
68,853
82,978
52,435 (192,436 dirhams)
47,676
45,978
41,761

Economy
UAE: 40 Years of Progress 35UAE: 40 Years of Progress34
Data Source: UAE National Bureau of Statistics
Population
The UAE’s economic growth also benefited from the emergence of a more youthful population in the national labor force
Data Source: World Bank’s World Development Indicators Database
Population Pyramid for Nationals, 1975 - 2005Female Labor Force Participation Rate(% of female population ages 15-64)
UAE Total Labor Force, 1980-2009
The expansion of the labor force contributed to the UAE’s economic growth, marked by rising participation of women in the economy
60,0000 40,000
0 - 4
20,00010,000 30,000 50,00050,000 10,00030,000 20,00040,00060,000
85+
80 - 84
75 - 79
70 - 74
65 - 69
60 - 64
55 - 59
50 - 54
45 - 49
40 - 44
35 - 39
30 - 34
25 - 29
20 - 24
15 - 19
10 - 14
5 - 9
0 - 4
2005 200519751975MalesFemales85+
80 - 84
75 - 79
70 - 74
65 - 69
60 - 64
55 - 59
50 - 54
45 - 49
40 - 44
35 - 39
30 - 34
25 - 29
20 - 24
15 - 19
10 - 14
5 - 9
0 - 4
1980 19951990 20091985 20052000
2,884,8892,524,583
1,865,289
1,309,671
953,079
717,741
548,024
2009200519951985 200019901980
United Arab EmiratesMiddle East & North AfricaArab World
28
4340
35
32
26
21
16
28
EconomyEconomy
UAE: 40 Years of Progress 37UAE: 40 Years of Progress36
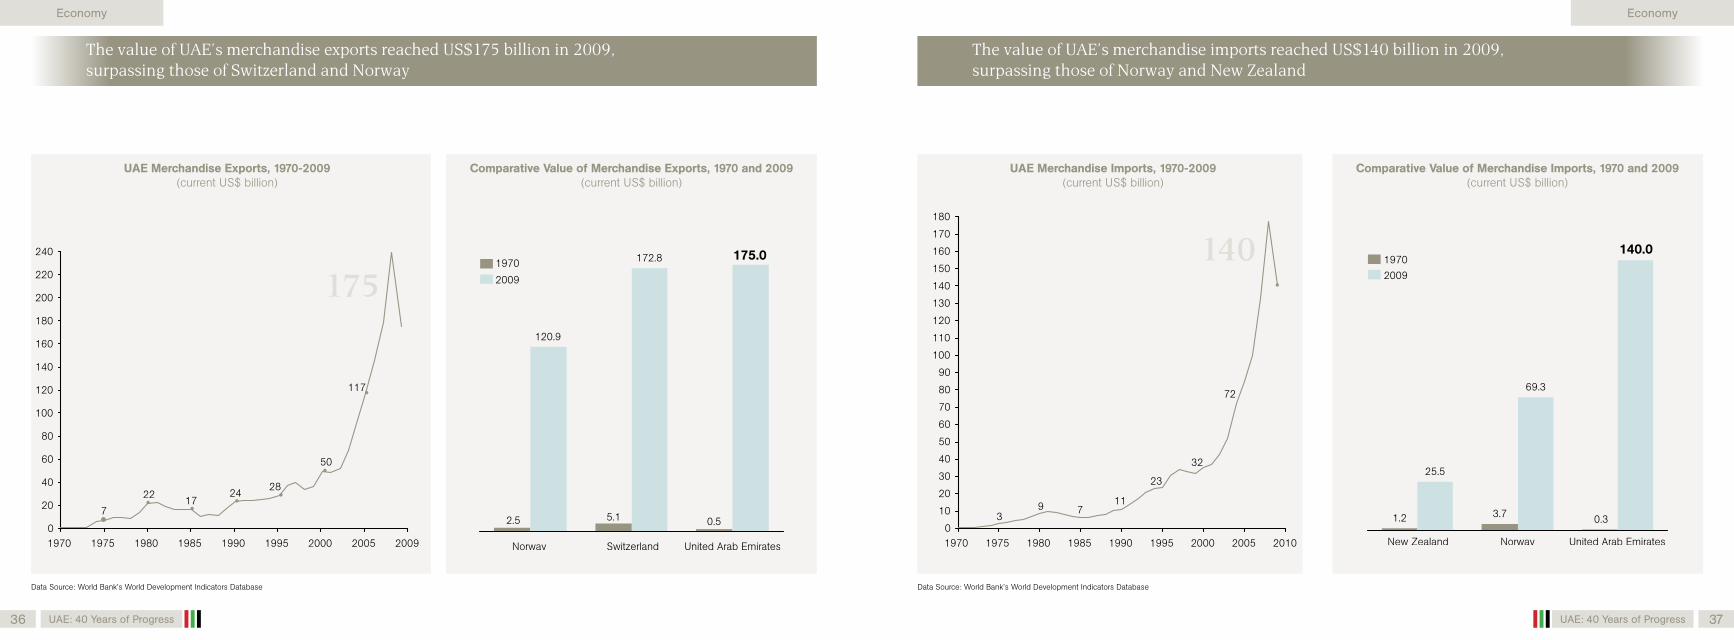
Data Source: World Bank’s World Development Indicators Database
Comparative Value of Merchandise Imports, 1970 and 2009 (current US$ billion)
UAE Merchandise Imports, 1970-2009 (current US$ billion)
The value of UAE’s merchandise imports reached US$140 billion in 2009, surpassing those of Norway and New Zealand
Data Source: World Bank’s World Development Indicators Database
Comparative Value of Merchandise Exports, 1970 and 2009 (current US$ billion)
UAE Merchandise Exports, 1970-2009(current US$ billion)
The value of UAE’s merchandise exports reached US$175 billion in 2009, surpassing those of Switzerland and Norway
180
160
1975
240
140
120
100
80
1970 19851980 1990
60
2000
220
200
1995
20
40
20090
2005
117
50
2824
1722
7
175
Norway Switzerland United Arab Emirates
0.5
175.0172.8
5.12.5
120.9
2009
1970
NorwayNew Zealand United Arab Emirates
20091970
140.0
0.33.71.2
25.5
69.390
80
100
70
30
20
10
0
180
170
160
40
150
60
50
110
140
130
120
140
2010200519801970 200019901985 19951975
72
32
23
1179
3
EconomyEconomy
UAE: 40 Years of Progress 39UAE: 40 Years of Progress38
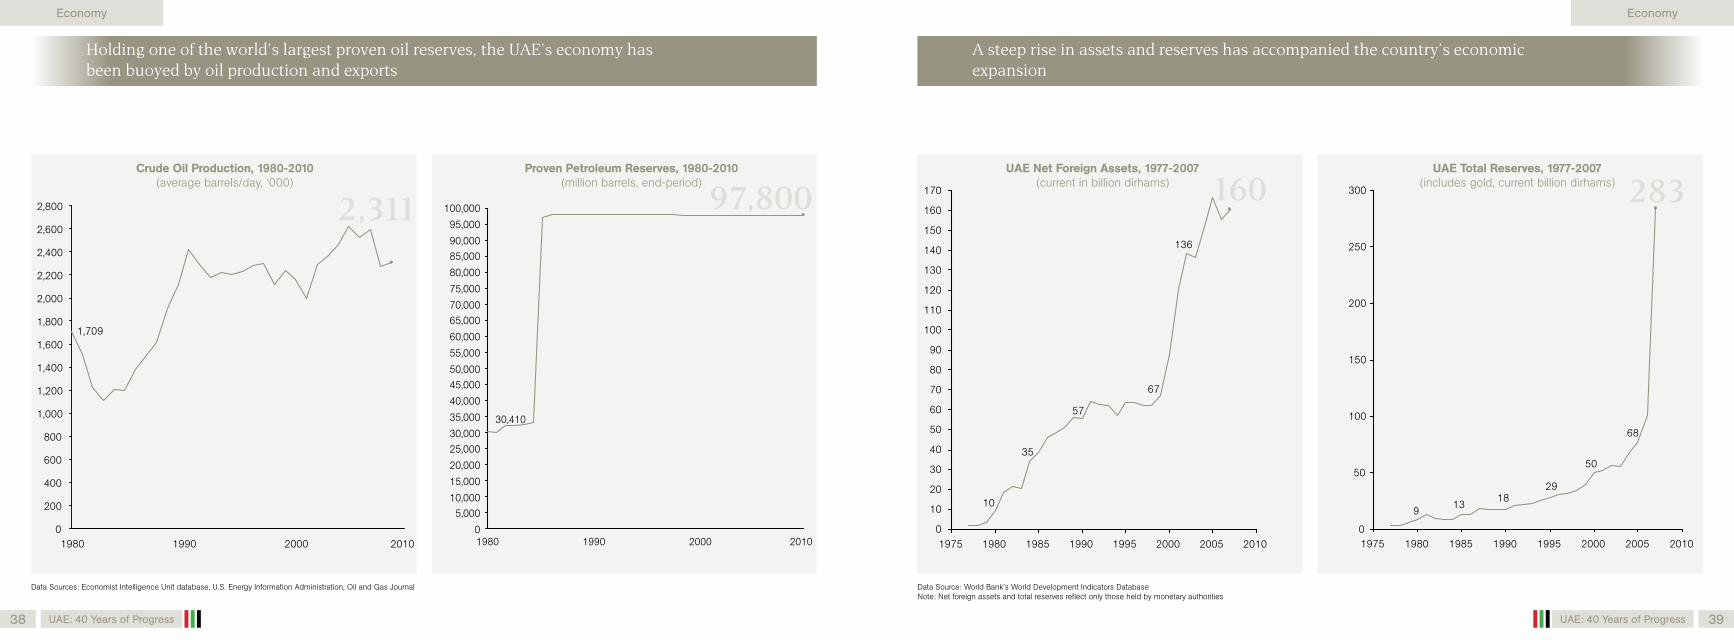
Data Source: World Bank’s World Development Indicators DatabaseNote: Net foreign assets and total reserves reflect only those held by monetary authorities
UAE Total Reserves, 1977-2007(includes gold, current billion dirhams)
UAE Net Foreign Assets, 1977-2007(current in billion dirhams)
A steep rise in assets and reserves has accompanied the country’s economic expansion
Data Sources: Economist Intelligence Unit database, U.S. Energy Information Administration, Oil and Gas Journal
Proven Petroleum Reserves, 1980-2010(million barrels, end-period)
Crude Oil Production, 1980-2010(average barrels/day, ‘000)
Holding one of the world’s largest proven oil reserves, the UAE’s economy has been buoyed by oil production and exports
95,000
80,000
75,000
70,000
85,00090,000
65,000
60,000
55,000
50,000
40,000
35,000
30,00025,000
20,000
15,000
10,0005,000
100,000
45,000
01990 20001980
30,410
97,800
2010
100
90
80
70
60
50
40
30
20
10
0
170
160
150
140
130
120
110
160
10
35
57
67
136
20102005200019951990198519801975
150
100
50
0
250
300
200
283
201020051975 1995199019851980 2000
913
18
68
50
29
1990 20100
20001980
1,800
1,600
200
2,800
2,600
2,400
2,200
2,000
400
600
800
1,000
1,200
1,400
1,709
2,311

EconomyEconomy
UAE: 40 Years of Progress 41UAE: 40 Years of Progress40
Data Source: World Bank’s World Development Indicators Database
Number of Listed Domestic Companies in the UAE Stock Markets
The number of listed domestic companies in the UAE stock markets rose from 12 in 2001 to 101 in 2010
Data Sources: World Bank’s World Development Indicators Database for the official exchange rate and the International Monetary Fund’s data base for the inflation rate
Inflation Rate, 1980-2010(average % change in consumer prices)
Official Exchange Rate, 1970-2010(dirham per US$, period average)
The UAE’s economy has benefited from exchange rate stability and, more recently, from a reduction in the rate of inflation
4.64.44.24.03.83.63.43.23.02.82.62.42.22.01.81.6
4.8
1.21.00.80.60.40.20.0
201020052000199519901985198019751970
1.4
3.7
2010200920082007200620052001 2002 2003 2004
12
24
30
50
79 81
90
96 95
101
0.9200019901980
1
5
02010
6
11
12
13
2
4
3
8
10
7
9
1.3
5.4
0.6
5.5 5.7
3.0
1.3
3.1
12.3

Economy
UAE: 40 Years of Progress42
Data Source: World Bank’s World Development Indicators Database
Comparative Growth of Value of Stocks Traded, 2000 and 2010 (US$ billion)
Comparative Growth of Market Capitalization of Listed Companies, 2000 and 2010
(US$ billion)
Over the last decade, the UAE’s market capitalization and value turnover surpassed those of Ireland and New Zealand
81
New Zealand United Arab Emirates Ireland
2010
2000
33
18
36
57
104
New Zealand United Arab Emirates Ireland
2010
2000
10.710.7
14.4
16.8
0.1
27.4
Infrastructure

InfrastructureInfrastructure
UAE: 40 Years of Progress 45UAE: 40 Years of Progress44
1976 2003 20051992 1999 200920072006 20101998 2001 2011
Selected Historical Milestones
Emirates Telecommunications Corporation (Etisalat)
Successful deployment of Thuraya 1
Federal Electricity and Water Authority
Dubai Electricity and Water Authority
Sharjah Ports Authority Commencement of operations of Ajman Port
Abu Dhabi Water and Electricity Authority
Emirates Postal Corporation
Abu Dhabi National Energy Company (TAQA)
Abu Dhabi Urban Planning Council
Completion of Sheikh Khalifa Bridge and Yas
Marina Circuit
Telecommunications Regulatory Authority
Start of operations of Dubai’s first metro line
Emirates Integrated Telecommunication
Company (du)Khalifa Port
Successful completion of in-orbit testing of Yahsat’s
satellite Y1A
Infrastructure
UAE: 40 Years of Progress 47
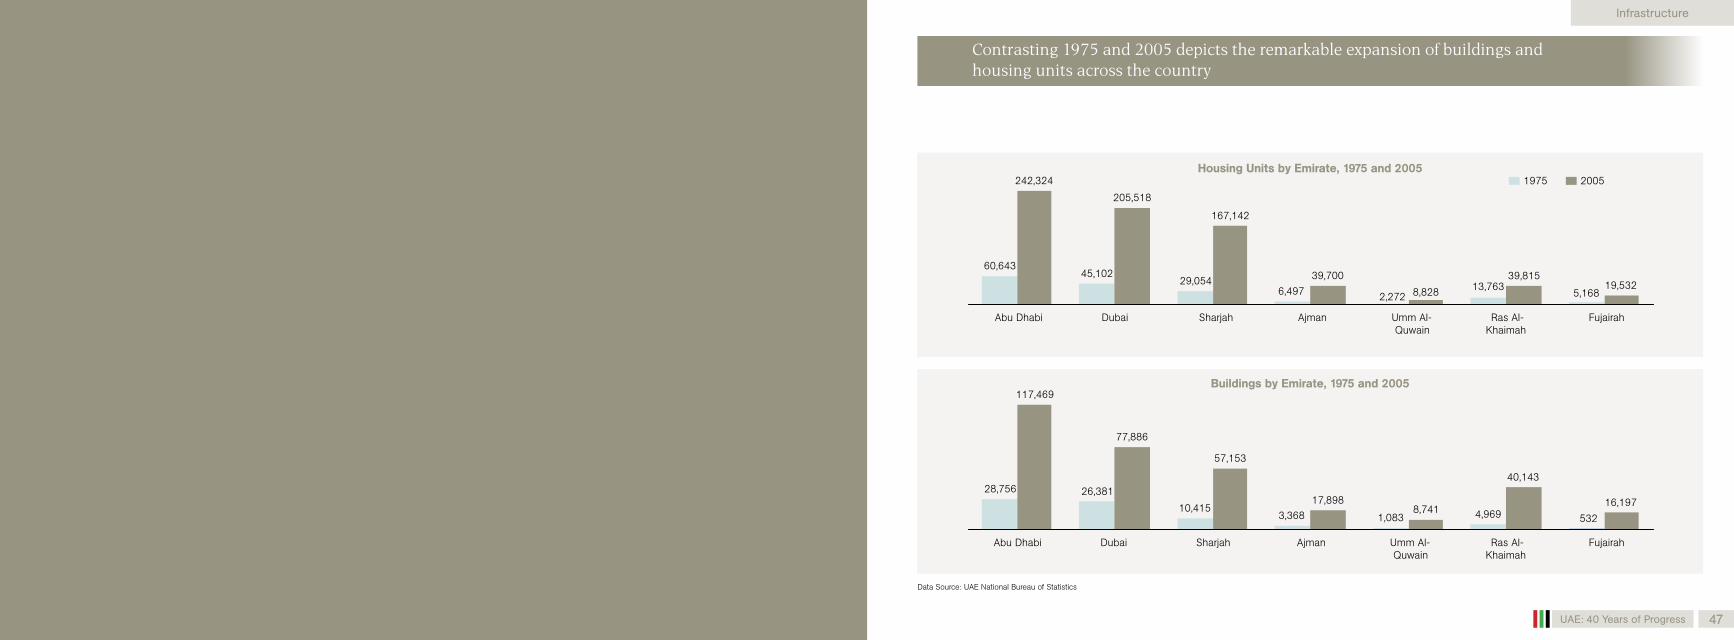
2,272 8,828 13,763 19,5325,1686,497
Fujairah Ras Al-Khaimah
Umm Al-Quwain
Ajman Sharjah Dubai Abu Dhabi
60,64345,102
242,324
205,518
167,142
39,700 39,81529,054
20051975
28,756 26,381
77,886
57,153
40,143
Fujairah Ras Al-Khaimah
Umm Al-Quwain
Ajman Sharjah Dubai Abu Dhabi
17,8988,741 4,969
16,197
5321,0833,36810,415
117,469
Data Source: UAE National Bureau of Statistics
Buildings by Emirate, 1975 and 2005
Housing Units by Emirate, 1975 and 2005
Contrasting 1975 and 2005 depicts the remarkable expansion of buildings and housing units across the country

InfrastructureInfrastructure
UAE: 40 Years of Progress 49UAE: 40 Years of Progress48
Data Sources: World Bank’s World Development Indicators Database and International Telecommunication Union Database
UAE Total Number of Mobile Cellular Subscriptions, 1982-2010UAE Total Number of Telephone Lines, 1975-2010
As UAE’s population and economy expanded, its communications infrastructure grew accordingly
Data Source: World Bank’s World Development Indicators Database
Comparative Electric Power Consumption, 1975-2008 (kWh per capita)
UAE Electric Power Consumption, 1971-2008 (kWh)
UAE’s rapid modernization is reflected in the rise of electric power consumption
13,000
16,00015,00014,000
2005
7,000
1975
6,000
1990
9,0008,000
5,000
2000
12,000
2,000
4,0003,000
11,00010,000
1980 1985 1995
1,0000
20101970
16,89117,000
8,030
9,339
11,919
7,511
5,040
2,402
13,759 11,000
1995 200520001990
10,000
9,000
8,000
13,000
2,000
1,000
019851980 2008
12,000
4,000
3,000
14,000
1975
5,000
6,000
7,000
12,2069,492
8,3078,184
6,301
SingaporeIreland
New ZealandSwitzerland
United Arab Emirates
200019951990198519801975 20102005
1,479,485
1,135,758
207,052
915,223
615,124
352,730
120,59125,808
2010200520001995199019851980
1,428,115
128,968
10,926,019
3,683,117
2,330

InfrastructureInfrastructure
UAE: 40 Years of Progress 51UAE: 40 Years of Progress50
Data Sources: World Bank’s World Development Indicators Database and International Telecommunication Union Database
UAE Fixed Broadband Internet Subscribers, 1999-2010(per 100 people)
UAE Internet Penetration Rate, 1995-2010(users per 100 people)
The number of internet users and broadband subscribers have also risen steeply
Data Sources: World Bank’s World Development Indicators Database and International Telecommunication Union Database
Comparative Mobile Cellular Subscription Rate, 2009(per 100 people)
UAE Mobile Cellular Penetration Rate, 1982-2009(per 100 people)
UAE’s mobile cellular phone penetration rate has become one of the highest in the world
160
150
140
130
120
110
100
90
80
70
40
30
2000 2010
10
0
1982
50
20
60
1990
111
143
154
87
61
47
172
27
98109 109 111
120
133
154
United Arab
Emirates
Singapore Switzerland Norway Ireland New Zealand
Korea, Rep.
200520001995
78
05
2010
10
6560555045
40
807570
3530252015
2001 2006200520001999 2002 20042003 20082007 2009
9
16151413121110
876543210
15

Infrastructure
UAE: 40 Years of Progress52
Data Source: Arab Social Media Report, May 2011
IIIIIIII Secondary Education Enrollment Rate(% gross)
New Facebook Users In the Arab Region, January–April 2011 (% of population)
Number of Active Twitter Users in the Arab Region, January–March 2011
The rapid diffusion of technologies has boosted the UAE to a regional leadership position in the use of online social media networks
6,679
29,422
61,896
63,919
79,163
113,428
115,084
131,204
133,209
201,060
Libya
Egypt
Saudi Arabia
Kuwait
Bahrain
Yemen
Oman
Qatar
UAE
Lebanon
Jordan
Saudi Arabia
Egypt
UAE
Morroco
Tunisia
Palestine
Bahrain
Oman
Kuwait
2.19
2.21
2.27
2.75
3.10
3.16
4.75
5.11
5.31
6.06
Travel & Tourism

Travel & TourismTravel & Tourism
UAE: 40 Years of Progress 55UAE: 40 Years of Progress54
1971 19941975 19961976 20031985 1987 201020061982 1989 2005
Selected Historical Milestones
The new Dubai International Airport
Ras Al Khaimah International Airport Emirates airline Start of the Dubai
AirshowAl Maktroum International
AirportRAK Airways
Sharjah International Airport
Abu Dhabi International Airport
Fujairah International Airport
General Civil Aviation Authority
Abu Dhabi Tourism Development and
Investment Company
Abu Dhabi Airports Company
Etihad AirwaysAl Ain International Airport

Travel & Tourism
UAE: 40 Years of Progress 57
Data Source: World Bank’s World Development Indicators DatabaseNote: Registered carrier departures worldwide are domestic takeoffs and takeoffs abroad of air carriers registered in the country.
Registered Carriers Departures Worldwide, 1975 and 2009
Passengers Carried by Registered Carriers, 1975 and 2009
The success of the country’s airline industry has exceeded Singapore’s in terms of the number of departures of, and passengers carried by, registered carriers
23,800
1975
Singapore
United Arab Emirates 5,400
1975
Singapore 1,814,700
United Arab Emirates 173,000
83,772
2009
170,588
31,761,631
18,427,473
2009

Travel & Tourism
UAE: 40 Years of Progress58
Data Source: World Bank’s World Development Indicators Database
Tourist Receipts 1995-2010(current US$ millions)
UAE Tourist Arrivals, 1995-2010(in US$ millions)
The country’s tourism industry has also flourished, making UAE one of the world’s leading tourist destinations
2010200520001995
8.6
7.1
3.9
2.3
2009200520001995
7,351
3,218
1,063632
Environment

EnvironmentEnvironment
UAE: 40 Years of Progress 61UAE: 40 Years of Progress60
19981996
1975
19831975 1991 2000 2001 2009200820072005
Selected Historical Milestones
Emirates Wildlife Society
UAE as the headquarters of the International Renewable Energy
Agency
Masdar
Federal Law for Protection and
Development of the Environment
Environment Agency-Abu Dhabi
Higher Environmental Council
Emirates Environmental Group
Sharjah’s Department of Environment and
Protected Areas (DEPA)UAE Hunting Law First World Future
Energy SummitMinistry of Environment
and Water

Environment
UAE: 40 Years of Progress 63
Data Source: World Bank’s World Development Indicators Database
UAE CO2 Emissions Per Capita,1970-2007(in metric tons)
As the country strives to improve its environmental performance, carbon dioxide emissions per capita is declining
68
19811979 1980 1982 1983 1984 1985 1986 1987 1988 1989 1990 1991 1992 1993 1994 1995 1996 1997 1998 1999 2000 2001 2002 2003 2004 2005 2006 20071971 19721970 1973 1974 1975 1976 1977 1978
80
74
81
70
59
64
54 55
4036
3331
28
35 3532 30 29
31 29 30 29 3133
30
17 16
34
29
39
33
2328 29 28 29
31

Foreign Aid

Foreign AidForeign Aid
UAE: 40 Years of Progress 67UAE: 40 Years of Progress66
2000199719921971 1983 1989 2003 200920082007
Selected Historical Milestones
The Mohammed bin Rashid Al Maktoum
Charity and Humanitarian Foundation ( MBRCF)
Abu Dhabi Fund for Development (ADFD)
Sharjah Charity Association
Humanitarian Foundation
Sheikha Fatima bint Mubarak Fund for Refugee Women
Zayed Foundation for Charitable and Humanitarian Aid
Red Crescent Authority
Khalifa bin Zayed Charity Foundation
Office for the Coordination of Foreign
Aid
Mohammed bin Rashid Al Maktoum Foundation
Dubai Aid City Noor DubaiDubai Cares

Foreign Aid
UAE: 40 Years of Progress 69
Data Source: : Federal Co-ordination Office for AidNote:*cited by UAE Interact; **cited by the Ministry of Foreign Affairs
UAE Foreign Aid, 1973-2009(in billion dirhams)
1718
10
19
1211
1314
16
8
2008
7
9
2006
6
2004 2010
3210
54
19841976 1978 198819741972
15
1992 1994 1996 19981990 20021980 1982 1986 2000
The value of foreign aid extended by the UAE during the last four decades is estimated to exceed Dh 163 billion*, making the country one of the most generous donors in the world
When other forms of development assistance are included, the total amounts to an estimated Dh 255 billion**