Embed Size (px)
Citation preview
DISCLOSURE APPENDIX AT THE BACK OF THIS REPORT CONTAINS IMPORTANT DISCLOSURES, ANALYST CERTIFICATIONS, AND THE STATUS OF NON-US ANALYSTS. US Disclosure: Credit Suisse does and seeks to do business with companies covered in its research reports. As a result, investors should be aware that the Firm may have a conflict of interest that could affect the objectivity of this report. Investors should consider this report as only a single factor in making their investment decision.
CREDIT SUISSE SECURITIES RESEARCH & ANALYTICS BEYOND INFORMATION®
Client-Driven Solutions, Insights, and Access
08 September 2014
Americas/United States
Equity Research
Airlines
United Continental Holdings, Inc. (UAL)
INITIATION
Top Pick - What's Right with United
■ Initiating Coverage of UAL with an Outperform Rating, $68 Target Price.
■ The Sector's Turnaround Story: While UAL shares still embed substantial execution risk, we see a string of catalysts and tailwinds in 2015 that should drive earnings & valuation upside. We believe 2015 earnings improvement is underappreciated for the following reasons: (1) maturing revenue initiatives should lead to 2015 PRASM outperformance by as much as 100 bps; (2) accelerating cost reductions and easing wage inflation will likely permit flat to down ex-fuel unit cost growth, despite only modest capacity additions; (3) we expect UAL to exceed buyback expectations. Our more optimistic assumptions yield a 2015 EBIT forecast 23% ahead of the consensus and 230 bps of margin improvement Y/Y. The earlier-than-expected buyback underpins management's confidence in the earnings trajectory, and we expect a strong Q3 will build on Q2's reassuring performance that United's extended period of postmerger underperformance is coming to a close.
■ Mind the Gap, We Think It's Closing: We look at UAL's margin progress in the four years following the merger versus Delta's and highlight that it isn’t all that different. The consensus has Delta's year-six postmerger EBIT margins +570 bps above year four, whereas the consensus only embeds 200 bps of improvement over the same period for United. We think that this is overly conservative and see no structural impediments to UAL achieving a low-double-digit EBIT margin by year six (2016 +500 bps versus 2014E).
■ Catalysts: (1) investor update 10/7, (2) Q3 2014 earnings 10/23, (3) fall conferences, (4) investor day in 2015 (tbd); (5) buyback pace, (6) the potential for a dividend or a margin target, (7) >10% ROIC target.
■ Valuation: We blend a 12.5x midcycle P/E multiple and a 6.5x EV/EBITDAR
multiple on our 2015 (fully taxed) estimates to yield our $68 target price. Note, while 2015 is untaxed, we fully tax our 2016 earnings estimate.
Share price performance
29
34
39
44
49
Sep-13 Dec-13 Mar-14 Jun-14
Daily Sep 09, 2013 - Sep 03, 2014, 9/09/13 = US$31.03
Price Indexed S&P 500 INDEX
On 09/03/14 the S&P 500 INDEX closed at 2007.71
Quarterly EPS Q1 Q2 Q3 Q4 2013A -1.08 1.35 1.49 0.76 2014E -1.33 2.34 2.54 1.12 2015E -0.13 2.83 3.20 1.65
Financial and valuation metrics
Year 12/13A 12/14E 12/15E 12/16E EPS (CS adj.) (US$) 3.01 4.68 7.55 7.45 Prev. EPS (US$) — — — — P/E (x) 16.8 10.9 6.7 6.8 P/E rel. (%) 94.0 65.7 45.4 51.2 Revenue (US$ m) 38,279.0 38,866.4 40,436.1 42,020.6 EBITDA (US$ m) 3,458.0 4,166.1 5,243.9 6,579.1 OCFPS (US$) 3.82 8.18 10.96 11.08 P/OCF (x) 9.9 6.2 4.6 4.6 EV/EBITDA (current) 8.1 6.7 5.3 4.2 Net debt (US$ m) 9,189 10,077 6,280 2,997
Number of shares (m) 373.57 IC (current, US$ m) 12,173.00 BV/share (Next Qtr., US$) 10.6 EV/IC (x) 2.2 Net debt (Next Qtr., US$ m) 8,091.5 Dividend (current, US$) — Net debt/tot eq (Next Qtr., %) 196.3 Dividend yield (%) —
Source: Company data, Credit Suisse estimates.
Rating OUTPERFORM* Price (05 Sep 14, US$) 50.73 Target price (US$) 68.00¹ 52-week price range 50.73 - 29.65 Market cap. (US$ m) 18,951.44 Enterprise value (US$ m) 29,027.95
*Stock ratings are relative to the coverage universe in each
analyst's or each team's respective sector.
¹Target price is for 12 months.
Research Analysts
Julie Yates
212 325 3706
Krishna Vege
212 325 6949
08 September 2014
United Continental Holdings, Inc. (UAL) 2
Investment Overview We initiate coverage of United Continental Holdings (UAL) as our top pick with an
Outperform rating and a $68 target price. We launch coverage of the U.S. Airline sector at
Overweight, with a favorable bias to the network carriers structural industry changes, a
strong demand environment, and ongoing margin enhancing initiatives. See our
accompanying report, titled, "U.S. Airline Industry Coverage Initiation: Network
Carriers Flying on Course for Continued Outperformance" for our industry views.
What's Right with United? The question, "What's wrong with United?", has been a
dominant theme for airline investors over the last 12 months. We think that United's
operational and financial underperformance has come to a close as the carrier recalibrates
and optimizes its network and cost structure following an extended period of integration
challenges. Management's tone has improved over the last six months as it aggressively
implements cost and revenue initiatives. Confidence in improving earnings was supported
by the earlier-than-expected buyback announcement in July 2014, and we see a string of
catalysts and tailwinds in 2015 that should drive earnings and valuation upside. Our
estimates are ahead of the Street on a combination of higher unit revenues and lower unit
costs.
Exhibit 1: United Airlines—Credit Suisse Estimates versus the Consensus
2014 2015
EPS EBITDAR EPS* EBITDAR
CS Consensus ∆ CS Consensus ∆ CS Consensus ∆ CS Consensus ∆$4.68 $4.56 2.5% $5,063 $4,991 1.4% $7.55 $5.79 30.3% $6,150 $5,733 7.3%
10.8x 11.1x 5.0x 5.1x 6.7x 8.8x 4.1x 4.4x
* 2015 consensus is a mix of taxed and untaxed estimates; CS is untaxed Source: Company data, Credit Suisse estimates.
The Margin Gap Should Narrow: Since 2011, United's operating margin gap has
averaged 500 basis points versus peers and lagged by 430 basis points in Q2 2014. The
consensus view is that UAL's margin gap will widen as Delta and American continue to
expand margins at a faster pace, with few analysts projecting that UAL will reach 10% by
2016. The consensus has DAL and AAL's EBIT margins projected in the midteens. Our
EBIT margin forecast for UAL is 161 bps ahead of the Street in 2015 and 284 bps ahead
in 2016, as we are more optimistic that the company can transition to a PRASM
outperformer and recognize significant benefits from structural cost reductions.
Exhibit 2: United Airlines Bull versus Bear and Credit Suisse View
Summary Our ViewUnited(UAL)
UAL has lagged peers as it has suffered from lingering integration issues post its 2010 merger with CAL. However, better than expected Q2 performance on unit revenues and unit costs, as well as the earlier than expected buyback announcement encouraged investors the carrier is turning around.
• Turnaround underway• Margin potential
underappreciated• Q2 progress on revenue & cost initiatives will continue and accelerate, allowing UAL to close the RASM & margin gap• Share buyback program indicative of mgmt confidence of L-T targets; just a first step• CapEx spend will be lower than plan with used a/c plan• Valuation attractive
• Substantial execution risk• Relative RASM / marginunderperformance will continue into 2015 • Margin gap vs. peers (400 bps on pre-tax margin) won’t close due to structural issues with network / hub structure • Lingering integration challenges will continue to slow down progress• Aggressive CapEx plan pressures FCF
• Outperform, $68 Target Price• String of catalysts and tailwinds in 2015 should drive earnings & valuation upside• 2015 earnings improvement underappreciated due to (i) likely PRASM outperformance, (ii) better cost control/lower unit costs, (iii) more aggressive buyback pace• We see no structural impediments to UAL achieving a low double-digit EBIT margin in 2 years
Source: Company data, Credit Suisse estimates.
United is our top pick, as we
see a string of catalysts and
tailwinds for 2015 that
should drive upward
estimate revisions and
support a higher multiple
08 September 2014
United Continental Holdings, Inc. (UAL) 3
Key Investment Points ■ Performance Has Lagged Peers, and Investor Expectations Are Mixed: United
has lagged network peers in operational and financial performance as it has continued
to struggle with postmerger integration challenges and execution. However,
management has identified self-help opportunities to improve PRASM performance
and reduce its industry-high cost structure, which should drive margin expansion. (We
detail these initiatives in Exhibit 28 and Exhibit 35.) Expectations continued to
deteriorate up until Q2 2014 as investors have become accustomed to United's
relative underperformance and a 400-500 basis point margin gap. Q2 drove renewed
optimism, as PRASM (3.7% versus 1.0-3.0% guidance) and CASM (-0.2% versus
+1.25-2.25% guidance) displayed surprising strength, and the Q3 PRASM guidance of
2-4% improvement Y/Y was in-line with peers.
■ Q2 Performance Is Starting to Restore Confidence; Strong Q3 Performance Is
Crucial to the Bull Case: Management's tone improved markedly with the Q2
earnings report versus Q1, and the $1B buyback announcement came earlier than
expected, underpinning management's confidence in ongoing earnings improvement.
In our view, if Q3 continues to show progress on cost control and if PRASM comes in
at midend to high end or ahead of the 2-4% guidance, confidence should continue to
rebuild. We see a string of catalysts and tailwinds in 2015 that should drive earnings
and valuation upside in 2015, and we believe that 2015 earnings improvement is
underappreciated for the following reasons:
o Maturing Revenue Initiatives Should Drive as Much as 100 Bps of
PRASM Outperformance in 2015: After Q3 2013 unit revenue growth
came in lower than management's expectations and those of peers
(2.7% versus guidance for 3-5% Y/Y versus the network peer average of
4.2%), management has taken action to drive better revenue growth.
Since Q3's disappointment, every quarter since then management has
outlined new initiatives to improve revenue performance. These initiatives
are ramping and should reach a full run rate in 2015 to drive what we
think will be peer-leading PRASM performance as UAL receives assists
from initiatives and easier comps in H2 2014 and 2015 relative to DAL
and AAL. In addition, ancillary initiatives are continuing to drive high-
margin revenue, and high-yielding corporate revenue is growing.
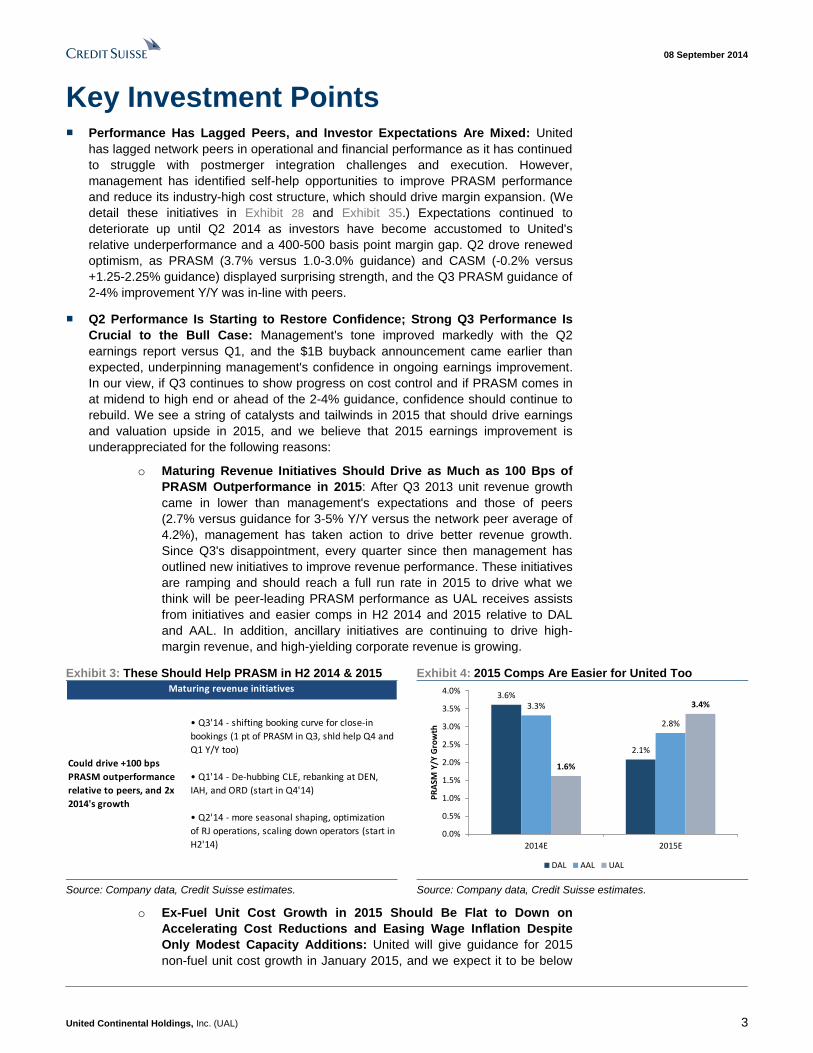
Exhibit 3: These Should Help PRASM in H2 2014 & 2015 Exhibit 4: 2015 Comps Are Easier for United Too
Maturing revenue initiatives
Could drive +100 bps
PRASM outperformance
relative to peers, and 2x
2014's growth
• Q3'14 - shifting booking curve for close-in
bookings (1 pt of PRASM in Q3, shld help Q4 and
Q1 Y/Y too)
• Q1'14 - De-hubbing CLE, rebanking at DEN,
IAH, and ORD (start in Q4'14)
• Q2'14 - more seasonal shaping, optimization
of RJ operations, scaling down operators (start in
H2'14)
3.6%
2.1%
3.3%
2.8%
1.6%
3.4%
0.0%
0.5%
1.0%
1.5%
2.0%
2.5%
3.0%
3.5%
4.0%
2014E 2015E
PR
ASM
Y/Y
Gro
wth
DAL AAL UAL
Source: Company data, Credit Suisse estimates. Source: Company data, Credit Suisse estimates.
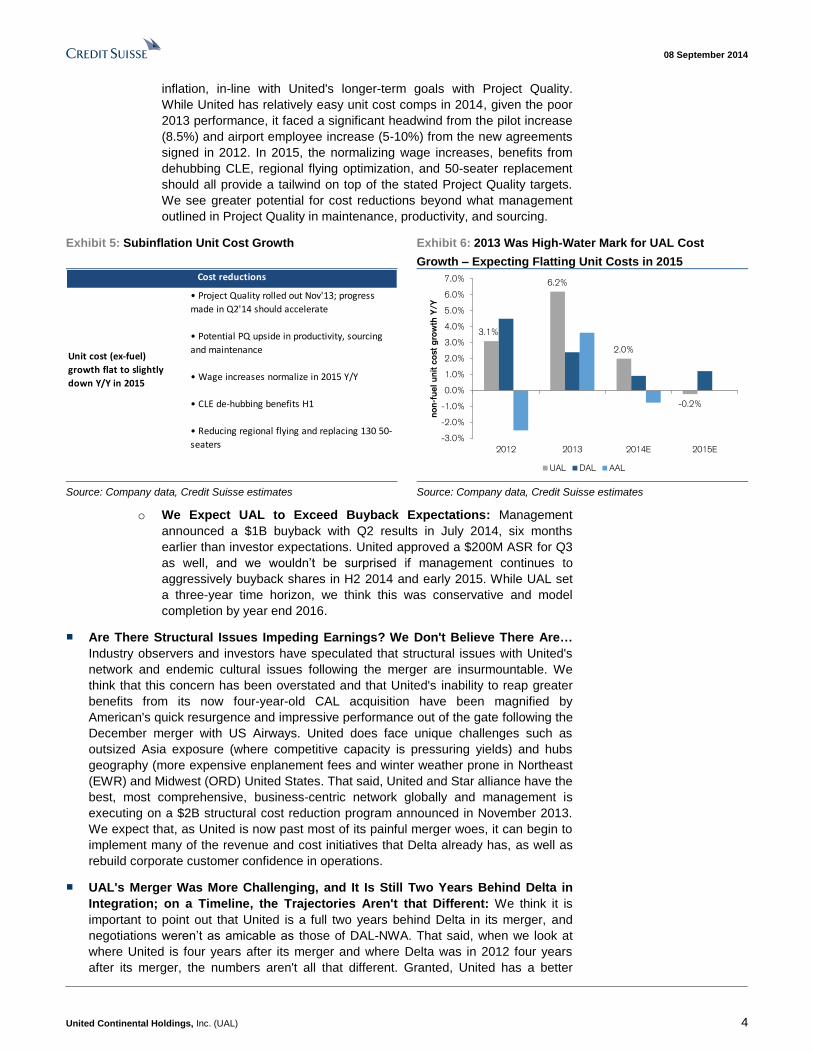
o Ex-Fuel Unit Cost Growth in 2015 Should Be Flat to Down on
Accelerating Cost Reductions and Easing Wage Inflation Despite
Only Modest Capacity Additions: United will give guidance for 2015
non-fuel unit cost growth in January 2015, and we expect it to be below
08 September 2014
United Continental Holdings, Inc. (UAL) 4
inflation, in-line with United's longer-term goals with Project Quality.
While United has relatively easy unit cost comps in 2014, given the poor
2013 performance, it faced a significant headwind from the pilot increase
(8.5%) and airport employee increase (5-10%) from the new agreements
signed in 2012. In 2015, the normalizing wage increases, benefits from
dehubbing CLE, regional flying optimization, and 50-seater replacement
should all provide a tailwind on top of the stated Project Quality targets.
We see greater potential for cost reductions beyond what management
outlined in Project Quality in maintenance, productivity, and sourcing.
Exhibit 5: Subinflation Unit Cost Growth Exhibit 6: 2013 Was High-Water Mark for UAL Cost
Growth – Expecting Flatting Unit Costs in 2015
Cost reductions
Unit cost (ex-fuel)
growth flat to slightly
down Y/Y in 2015
• Project Quality rolled out Nov'13; progress
made in Q2'14 should accelerate
• Potential PQ upside in productivity, sourcing
and maintenance
• Wage increases normalize in 2015 Y/Y
• CLE de-hubbing benefits H1
• Reducing regional flying and replacing 130 50-
seaters
3.1%
6.2%
2.0%
-0.2%
-3.0%
-2.0%
-1.0%
0.0%
1.0%
2.0%
3.0%
4.0%
5.0%
6.0%
7.0%
2012 2013 2014E 2015E
no
n-f
ue
l u
nit c
ost
gro
wth
Y/Y
UAL DAL AAL
Source: Company data, Credit Suisse estimates Source: Company data, Credit Suisse estimates
o We Expect UAL to Exceed Buyback Expectations: Management
announced a $1B buyback with Q2 results in July 2014, six months
earlier than investor expectations. United approved a $200M ASR for Q3
as well, and we wouldn’t be surprised if management continues to
aggressively buyback shares in H2 2014 and early 2015. While UAL set
a three-year time horizon, we think this was conservative and model
completion by year end 2016.
■ Are There Structural Issues Impeding Earnings? We Don't Believe There Are…
Industry observers and investors have speculated that structural issues with United's
network and endemic cultural issues following the merger are insurmountable. We
think that this concern has been overstated and that United's inability to reap greater
benefits from its now four-year-old CAL acquisition have been magnified by
American's quick resurgence and impressive performance out of the gate following the
December merger with US Airways. United does face unique challenges such as
outsized Asia exposure (where competitive capacity is pressuring yields) and hubs
geography (more expensive enplanement fees and winter weather prone in Northeast
(EWR) and Midwest (ORD) United States. That said, United and Star alliance have the
best, most comprehensive, business-centric network globally and management is
executing on a $2B structural cost reduction program announced in November 2013.
We expect that, as United is now past most of its painful merger woes, it can begin to
implement many of the revenue and cost initiatives that Delta already has, as well as
rebuild corporate customer confidence in operations.
■ UAL's Merger Was More Challenging, and It Is Still Two Years Behind Delta in
Integration; on a Timeline, the Trajectories Aren't that Different: We think it is
important to point out that United is a full two years behind Delta in its merger, and
negotiations weren’t as amicable as those of DAL-NWA. That said, when we look at
where United is four years after its merger and where Delta was in 2012 four years
after its merger, the numbers aren't all that different. Granted, United has a better
08 September 2014
United Continental Holdings, Inc. (UAL) 5
macro environment and should be earning more in today's demand/pricing picture
than DAL was able to in 2012, we think that UAL can narrow the gap to Delta over the
next two to three years.
United did announce its share repurchase program one year earlier than Delta did (in
year four, versus Delta in year five), and United's was 6% of market cap, whereas
Delta's was 3%, although complemented by a dividend (1% yield at the time). Delta
subsequently completed its buyback two years early and announced a $2B
authorization in year six (May 2014) and a 50% increase to its dividend just one year
after the initial program.
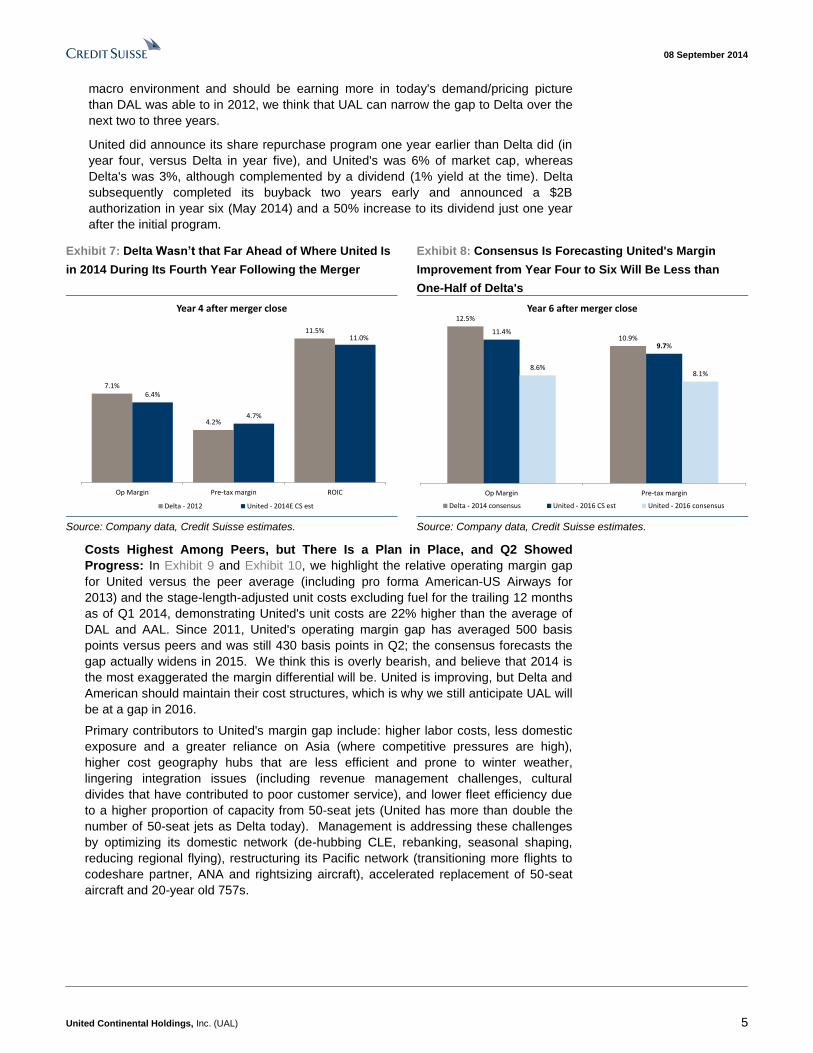
Exhibit 7: Delta Wasn’t that Far Ahead of Where United Is
in 2014 During Its Fourth Year Following the Merger
Exhibit 8: Consensus Is Forecasting United's Margin
Improvement from Year Four to Six Will Be Less than
One-Half of Delta's
7.1%
4.2%
11.5%
6.4%
4.7%
11.0%
Op Margin Pre-tax margin ROIC
Year 4 after merger close
Delta - 2012 United - 2014E CS est
12.5%
10.9%11.4%
9.7%
8.6%8.1%
Op Margin Pre-tax margin
Year 6 after merger close
Delta - 2014 consensus United - 2016 CS est United - 2016 consensus
Source: Company data, Credit Suisse estimates. Source: Company data, Credit Suisse estimates.
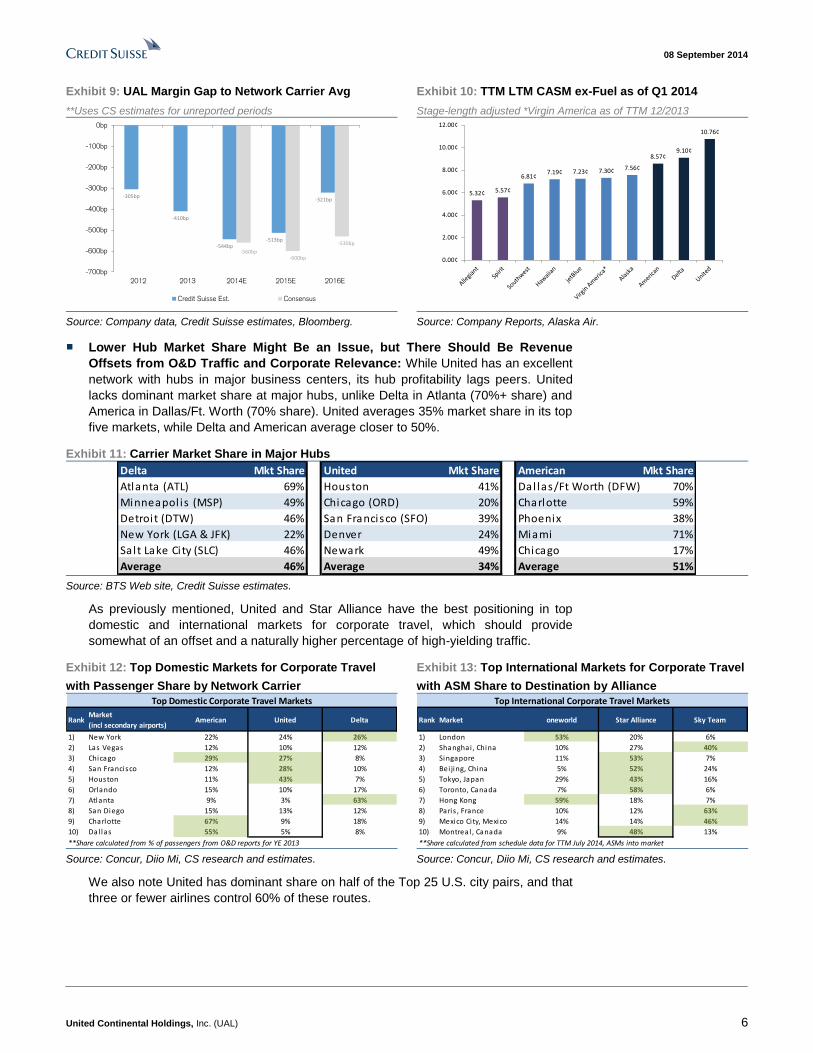
Costs Highest Among Peers, but There Is a Plan in Place, and Q2 Showed
Progress: In Exhibit 9 and Exhibit 10, we highlight the relative operating margin gap
for United versus the peer average (including pro forma American-US Airways for
2013) and the stage-length-adjusted unit costs excluding fuel for the trailing 12 months
as of Q1 2014, demonstrating United's unit costs are 22% higher than the average of
DAL and AAL. Since 2011, United's operating margin gap has averaged 500 basis
points versus peers and was still 430 basis points in Q2; the consensus forecasts the
gap actually widens in 2015. We think this is overly bearish, and believe that 2014 is
the most exaggerated the margin differential will be. United is improving, but Delta and
American should maintain their cost structures, which is why we still anticipate UAL will
be at a gap in 2016.
Primary contributors to United's margin gap include: higher labor costs, less domestic
exposure and a greater reliance on Asia (where competitive pressures are high),
higher cost geography hubs that are less efficient and prone to winter weather,
lingering integration issues (including revenue management challenges, cultural
divides that have contributed to poor customer service), and lower fleet efficiency due
to a higher proportion of capacity from 50-seat jets (United has more than double the
number of 50-seat jets as Delta today). Management is addressing these challenges
by optimizing its domestic network (de-hubbing CLE, rebanking, seasonal shaping,
reducing regional flying), restructuring its Pacific network (transitioning more flights to
codeshare partner, ANA and rightsizing aircraft), accelerated replacement of 50-seat
aircraft and 20-year old 757s.
08 September 2014
United Continental Holdings, Inc. (UAL) 6
Exhibit 9: UAL Margin Gap to Network Carrier Avg
**Uses CS estimates for unreported periods
Exhibit 10: TTM LTM CASM ex-Fuel as of Q1 2014
Stage-length adjusted *Virgin America as of TTM 12/2013
-305bp
-410bp
-544bp-513bp
-321bp
-560bp-600bp
-530bp
-700bp
-600bp
-500bp
-400bp
-300bp
-200bp
-100bp
0bp
2012 2013 2014E 2015E 2016E
Credit Suisse Est. Consensus
5.32¢ 5.57¢
6.81¢7.19¢ 7.23¢ 7.30¢ 7.56¢
8.57¢9.10¢
10.76¢
0.00¢
2.00¢
4.00¢
6.00¢
8.00¢
10.00¢
12.00¢
Source: Company data, Credit Suisse estimates, Bloomberg. Source: Company Reports, Alaska Air.
■ Lower Hub Market Share Might Be an Issue, but There Should Be Revenue
Offsets from O&D Traffic and Corporate Relevance: While United has an excellent
network with hubs in major business centers, its hub profitability lags peers. United
lacks dominant market share at major hubs, unlike Delta in Atlanta (70%+ share) and
America in Dallas/Ft. Worth (70% share). United averages 35% market share in its top
five markets, while Delta and American average closer to 50%.
Exhibit 11: Carrier Market Share in Major Hubs
Delta Mkt Share United Mkt Share American Mkt Share
Atlanta (ATL) 69% Houston 41% Dal las/Ft Worth (DFW) 70%
Minneapol is (MSP) 49% Chicago (ORD) 20% Charlotte 59%
Detroit (DTW) 46% San Francisco (SFO) 39% Phoenix 38%
New York (LGA & JFK) 22% Denver 24% Miami 71%
Salt Lake City (SLC) 46% Newark 49% Chicago 17%
Average 46% Average 34% Average 51% Source: BTS Web site, Credit Suisse estimates.
As previously mentioned, United and Star Alliance have the best positioning in top
domestic and international markets for corporate travel, which should provide
somewhat of an offset and a naturally higher percentage of high-yielding traffic.
Exhibit 12: Top Domestic Markets for Corporate Travel
with Passenger Share by Network Carrier
Exhibit 13: Top International Markets for Corporate Travel
with ASM Share to Destination by Alliance
RankMarket
(incl secondary airports)American United Delta
1) New York 22% 24% 26%
2) Las Vegas 12% 10% 12%
3) Chicago 29% 27% 8%
4) San Francisco 12% 28% 10%
5) Houston 11% 43% 7%
6) Orlando 15% 10% 17%
7) Atlanta 9% 3% 63%
8) San Diego 15% 13% 12%
9) Charlotte 67% 9% 18%
10) Dal las 55% 5% 8%
**Share calculated from % of passengers from O&D reports for YE 2013
Top Domestic Corporate Travel Markets
Rank Market oneworld Star Alliance Sky Team
1) London 53% 20% 6%
2) Shanghai , China 10% 27% 40%
3) Singapore 11% 53% 7%
4) Bei jing, China 5% 52% 24%
5) Tokyo, Japan 29% 43% 16%
6) Toronto, Canada 7% 58% 6%
7) Hong Kong 59% 18% 7%
8) Paris , France 10% 12% 63%
9) Mexico City, Mexico 14% 14% 46%
10) Montreal , Canada 9% 48% 13%
**Share calculated from schedule data for TTM July 2014, ASMs into market
Top International Corporate Travel Markets
Source: Concur, Diio Mi, CS research and estimates. Source: Concur, Diio Mi, CS research and estimates.
We also note United has dominant share on half of the Top 25 U.S. city pairs, and that
three or fewer airlines control 60% of these routes.

08 September 2014
United Continental Holdings, Inc. (UAL) 7
Exhibit 14: Percentage of Top 25 U.S. Routes where
Carrier is Dominant (>45% market share)
Exhibit 15: Number of Competitors on Top 25 Domestic
Routes Shows Oligopolistic Market Structure
United53%
American35%
Delta12%
Duopoly
24%
3
competitors
36%
4
competitors
24%
5
competitors
16%
Source: Diio Mi. Source: Diio Mi.
■ Consistent Capacity Discipline Central to Strategy: United has demonstrated that
capacity discipline is central to its strategy by keeping capacity growth below GDP
since 2008. Since 2008, United's system-wide capacity has fallen ~2% annually, more
than double the industry average. For 2014, United expects to keep system-wide
capacity growth to 0-1% Y/Y (a full point below initial plans), and over the next three
years it is targeting annual capacity growth below GDP, or 1-2%. United expects the
consolidated fleet count to remain flat, between 1,250 and 1,300 aircraft and has
recently announced that it will pursue opportunities in the used aircraft market, making
more return-driven decisions that would result in capital expenditures below its
previous plan of $2.8-3.0B from 2014 to 2017, 65% of which is for aircraft
replacement.
Exhibit 16: UAL Consolidated Capacity versus GDP
-2.3%
-6.4%
1.1%
-0.2%
-1.5% -1.4%
0.5%
1.8%
-0.3%
-2.8%
2.5%1.8%
2.8%1.9%
1.5%
3%
-8.0%
-6.0%
-4.0%
-2.0%
0.0%
2.0%
4.0%
6.0%
2008 2009 2010 2011 2012 2013 2014E 2015E
United consolidated capacity GDP
Source: Company data, Credit Suisse estimates.
Capacity additions from UAL are efficient, mostly consisting of upgauging and
installation of slimline seats. The carrier is installing slimline seats that are 10-15%
lighter and provide one to two more rows of seats per plane on the regional (CRJ 700)
and mainline fleets (A320 and 737s). New routes in the Pacific and upgauging the
regional fleet are the other capacity contributors this year. United began reducing
flying from its Cleveland hub in April 2014, targeting a 60% reduction in average daily
departures, primarily through regional departures. Reductions were fully implemented
in June 2014.
United has that
demonstrated capacity
discipline is central to its
strategy by keeping capacity
growth below GDP since
2008
08 September 2014
United Continental Holdings, Inc. (UAL) 8
■ Returning Cash to Shareholders Through Buyback, Dividend May Be Next: We
expect United will follow the path that DAL, AAL, and LUV have all pursued with a
balanced capital return program that incorporates a dividend at some point in 2015.
However we expect that management will want to see additional progress on its
revenue optimization and cost-savings initiatives before committing additional capital,
and the choice between additional buyback commitment versus a dividend will depend
on stock price.
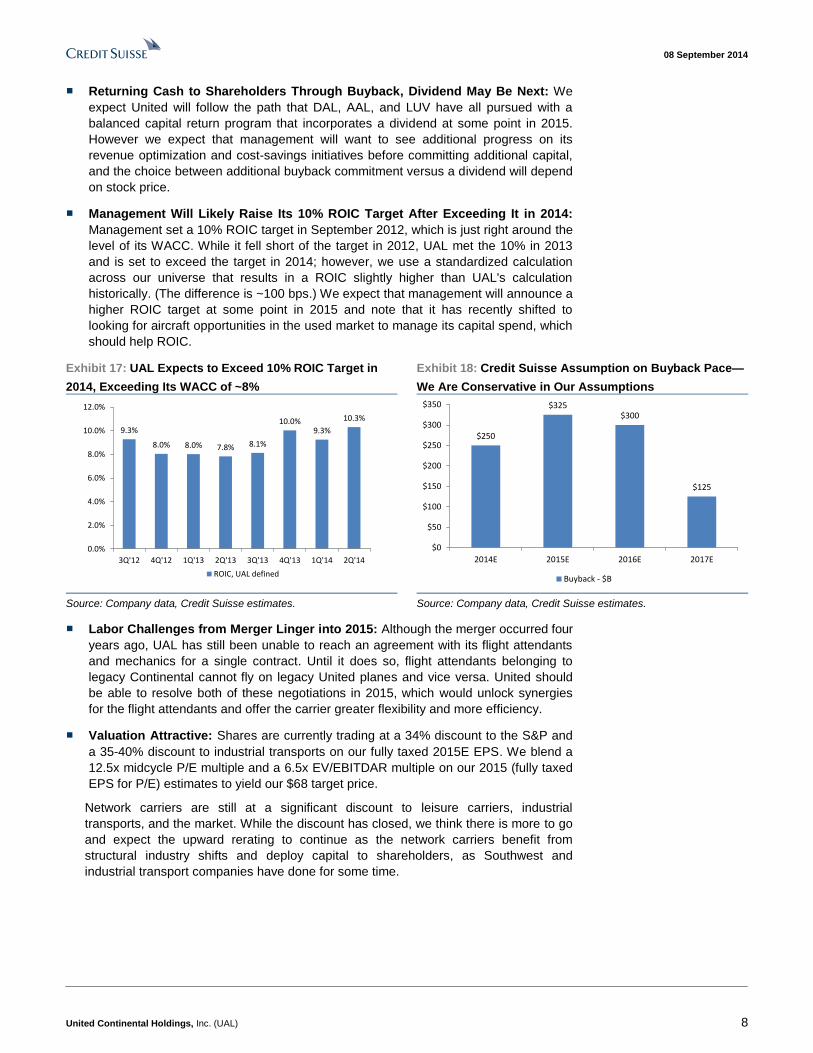
■ Management Will Likely Raise Its 10% ROIC Target After Exceeding It in 2014:
Management set a 10% ROIC target in September 2012, which is just right around the
level of its WACC. While it fell short of the target in 2012, UAL met the 10% in 2013
and is set to exceed the target in 2014; however, we use a standardized calculation
across our universe that results in a ROIC slightly higher than UAL's calculation
historically. (The difference is ~100 bps.) We expect that management will announce a
higher ROIC target at some point in 2015 and note that it has recently shifted to
looking for aircraft opportunities in the used market to manage its capital spend, which
should help ROIC.
Exhibit 17: UAL Expects to Exceed 10% ROIC Target in
2014, Exceeding Its WACC of ~8%
Exhibit 18: Credit Suisse Assumption on Buyback Pace—
We Are Conservative in Our Assumptions
9.3%
8.0% 8.0% 7.8% 8.1%
10.0%9.3%
10.3%
0.0%
2.0%
4.0%
6.0%
8.0%
10.0%
12.0%
3Q'12 4Q'12 1Q'13 2Q'13 3Q'13 4Q'13 1Q'14 2Q'14
ROIC, UAL defined
$250
$325$300
$125
$0
$50
$100
$150
$200
$250
$300
$350
2014E 2015E 2016E 2017E
Buyback - $B
Source: Company data, Credit Suisse estimates. Source: Company data, Credit Suisse estimates.
■ Labor Challenges from Merger Linger into 2015: Although the merger occurred four
years ago, UAL has still been unable to reach an agreement with its flight attendants
and mechanics for a single contract. Until it does so, flight attendants belonging to
legacy Continental cannot fly on legacy United planes and vice versa. United should
be able to resolve both of these negotiations in 2015, which would unlock synergies
for the flight attendants and offer the carrier greater flexibility and more efficiency.
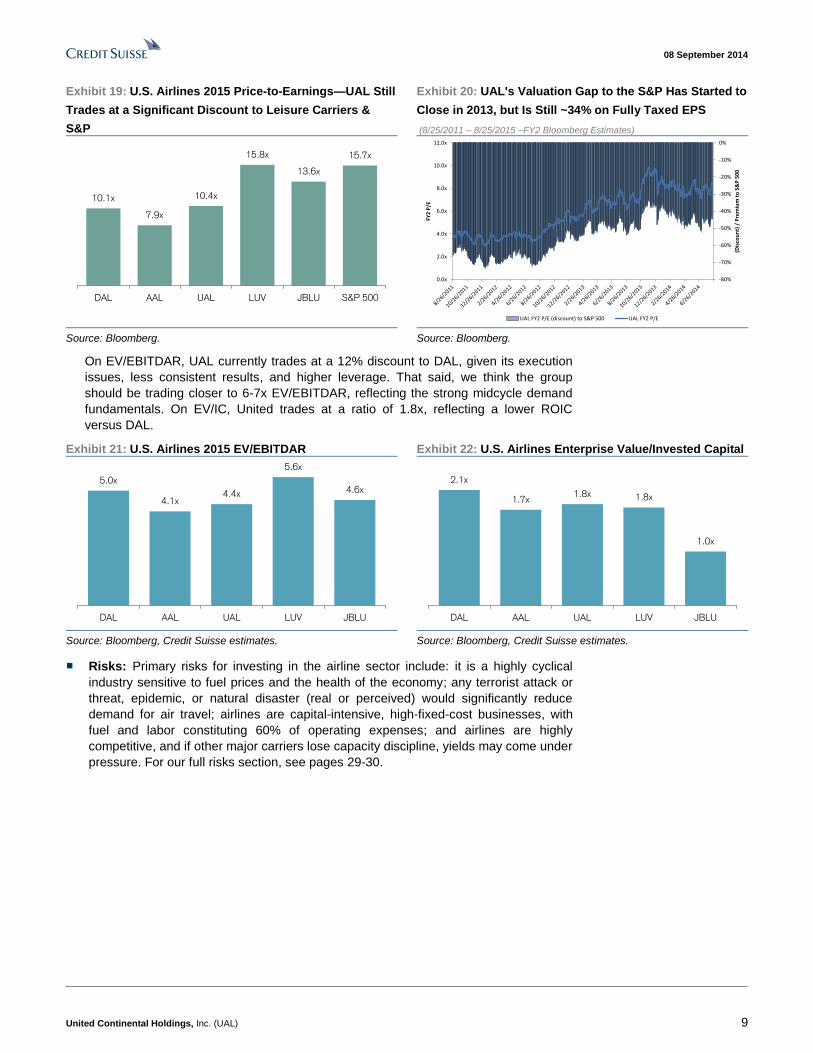
■ Valuation Attractive: Shares are currently trading at a 34% discount to the S&P and
a 35-40% discount to industrial transports on our fully taxed 2015E EPS. We blend a
12.5x midcycle P/E multiple and a 6.5x EV/EBITDAR multiple on our 2015 (fully taxed
EPS for P/E) estimates to yield our $68 target price.
Network carriers are still at a significant discount to leisure carriers, industrial
transports, and the market. While the discount has closed, we think there is more to go
and expect the upward rerating to continue as the network carriers benefit from
structural industry shifts and deploy capital to shareholders, as Southwest and
industrial transport companies have done for some time.
08 September 2014
United Continental Holdings, Inc. (UAL) 9
Exhibit 19: U.S. Airlines 2015 Price-to-Earnings—UAL Still
Trades at a Significant Discount to Leisure Carriers &
S&P
Exhibit 20: UAL's Valuation Gap to the S&P Has Started to
Close in 2013, but Is Still ~34% on Fully Taxed EPS
(8/25/2011 – 8/25/2015 –FY2 Bloomberg Estimates)
10.1x
7.9x
10.4x
15.8x
13.6x
15.7x
DAL AAL UAL LUV JBLU S&P 500
-80%
-70%
-60%
-50%
-40%
-30%
-20%
-10%
0%
0.0x
2.0x
4.0x
6.0x
8.0x
10.0x
12.0x
(Dis
cou
nt)
/ P
rem
ium
to
S&
P 5
00
FY2
P/E
UAL FY2 P/E (discount) to S&P 500 UAL FY2 P/E
Source: Bloomberg. Source: Bloomberg.
On EV/EBITDAR, UAL currently trades at a 12% discount to DAL, given its execution
issues, less consistent results, and higher leverage. That said, we think the group
should be trading closer to 6-7x EV/EBITDAR, reflecting the strong midcycle demand
fundamentals. On EV/IC, United trades at a ratio of 1.8x, reflecting a lower ROIC
versus DAL.
Exhibit 21: U.S. Airlines 2015 EV/EBITDAR Exhibit 22: U.S. Airlines Enterprise Value/Invested Capital
5.0x
4.1x4.4x
5.6x
4.6x
DAL AAL UAL LUV JBLU
2.1x
1.7x1.8x 1.8x
1.0x
DAL AAL UAL LUV JBLU
Source: Bloomberg, Credit Suisse estimates. Source: Bloomberg, Credit Suisse estimates.
■ Risks: Primary risks for investing in the airline sector include: it is a highly cyclical
industry sensitive to fuel prices and the health of the economy; any terrorist attack or
threat, epidemic, or natural disaster (real or perceived) would significantly reduce
demand for air travel; airlines are capital-intensive, high-fixed-cost businesses, with
fuel and labor constituting 60% of operating expenses; and airlines are highly
competitive, and if other major carriers lose capacity discipline, yields may come under
pressure. For our full risks section, see pages 29-30.
08 September 2014
United Continental Holdings, Inc. (UAL) 10
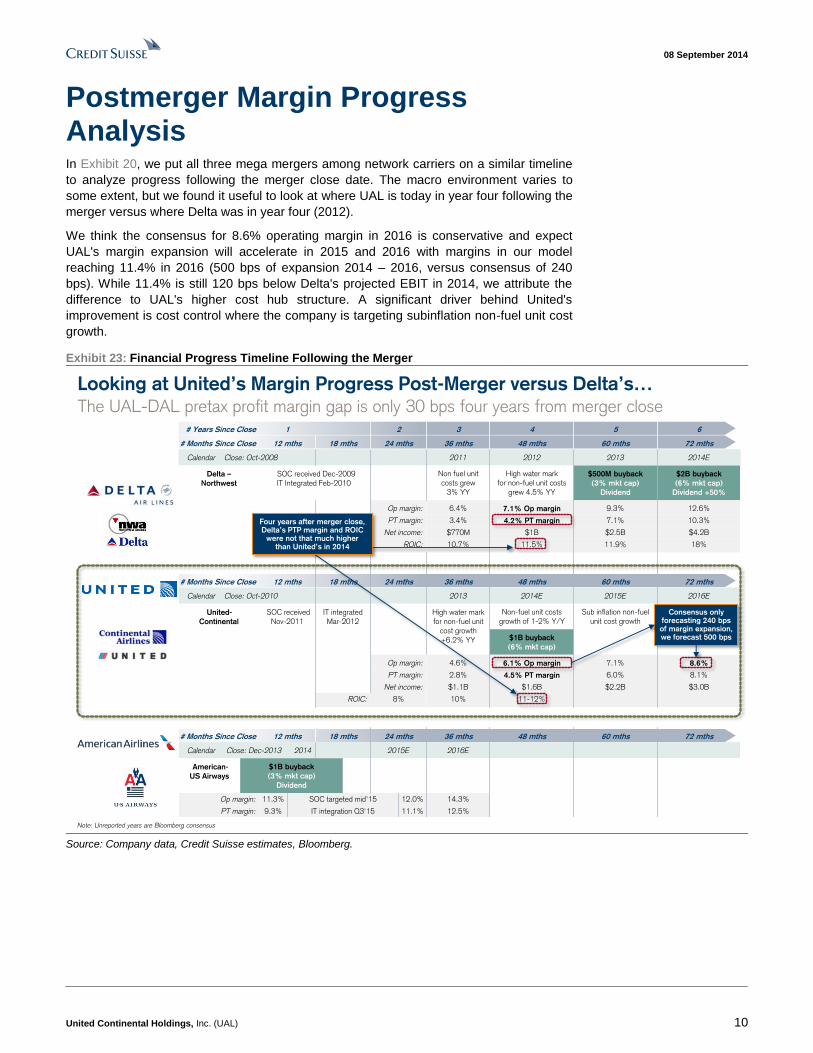
Postmerger Margin Progress Analysis In Exhibit 20, we put all three mega mergers among network carriers on a similar timeline
to analyze progress following the merger close date. The macro environment varies to
some extent, but we found it useful to look at where UAL is today in year four following the
merger versus where Delta was in year four (2012).
We think the consensus for 8.6% operating margin in 2016 is conservative and expect
UAL's margin expansion will accelerate in 2015 and 2016 with margins in our model
reaching 11.4% in 2016 (500 bps of expansion 2014 – 2016, versus consensus of 240
bps). While 11.4% is still 120 bps below Delta's projected EBIT in 2014, we attribute the
difference to UAL's higher cost hub structure. A significant driver behind United's
improvement is cost control where the company is targeting subinflation non-fuel unit cost
growth.
Exhibit 23: Financial Progress Timeline Following the Merger
# Years Since Close 1 2 3 4 5 6
# Months Since Close 12 mths 18 mths 24 mths 36 mths 48 mths 60 mths 72 mths
Calendar Close: Oct-2008 2011 2012 2013 2014E
Delta –
Northwest
SOC received Dec-2009IT Integrated Feb-2010
Non fuel unit costs grew
3% YY
High water mark for non-fuel unit costs
grew 4.5% YY
$500M buyback
(3% mkt cap)
Dividend
$2B buyback
(6% mkt cap)
Dividend +50%
Op margin: 6.4% 7.1% Op margin 9.3% 12.6%
PT margin: 3.4% 4.2% PT margin 7.1% 10.3%
Net income: $770M $1B $2.5B $4.2B
ROIC: 10.7% 11.5% 11.9% 18%
# Months Since Close 12 mths 18 mths 24 mths 36 mths 48 mths 60 mths 72 mths
Calendar Close: Oct-2010 2013 2014E 2015E 2016E
United-
Continental
SOC received Nov-2011
IT integratedMar-2012
High water mark for non-fuel unit
cost growth +6.2% YY
Non-fuel unit costs growth of 1-2% Y/Y
Sub inflation non-fuel unit cost growth
$1B buyback
(6% mkt cap)
Op margin: 4.6% 6.1% Op margin 7.1% 8.6%
PT margin: 2.8% 4.5% PT margin 6.0% 8.1%
Net income: $1.1B $1.6B $2.2B $3.0B
ROIC: 8% 10% 11-12%
# Months Since Close 12 mths 18 mths 24 mths 36 mths 48 mths 60 mths 72 mths
Calendar Close: Dec-2013 2014 2015E 2016E
American-
US Airways
$1B buyback
(3% mkt cap)
Dividend
Op margin: 11.3% SOC targeted mid'15 12.0% 14.3%
PT margin: 9.3% IT integration Q3'15 11.1% 12.5%
The UAL-DAL pretax profit margin gap is only 30 bps four years from merger close
Looking at United’s Margin Progress Post-Merger versus Delta’s…
Consensus onlyforecasting 240 bpsof margin expansion, we forecast 500 bps
Note: Unreported years are Bloomberg consensus
Four years after merger close,Delta’s PTP margin and ROIC
were not that much higher than United’s in 2014
Source: Company data, Credit Suisse estimates, Bloomberg.
08 September 2014
United Continental Holdings, Inc. (UAL) 11
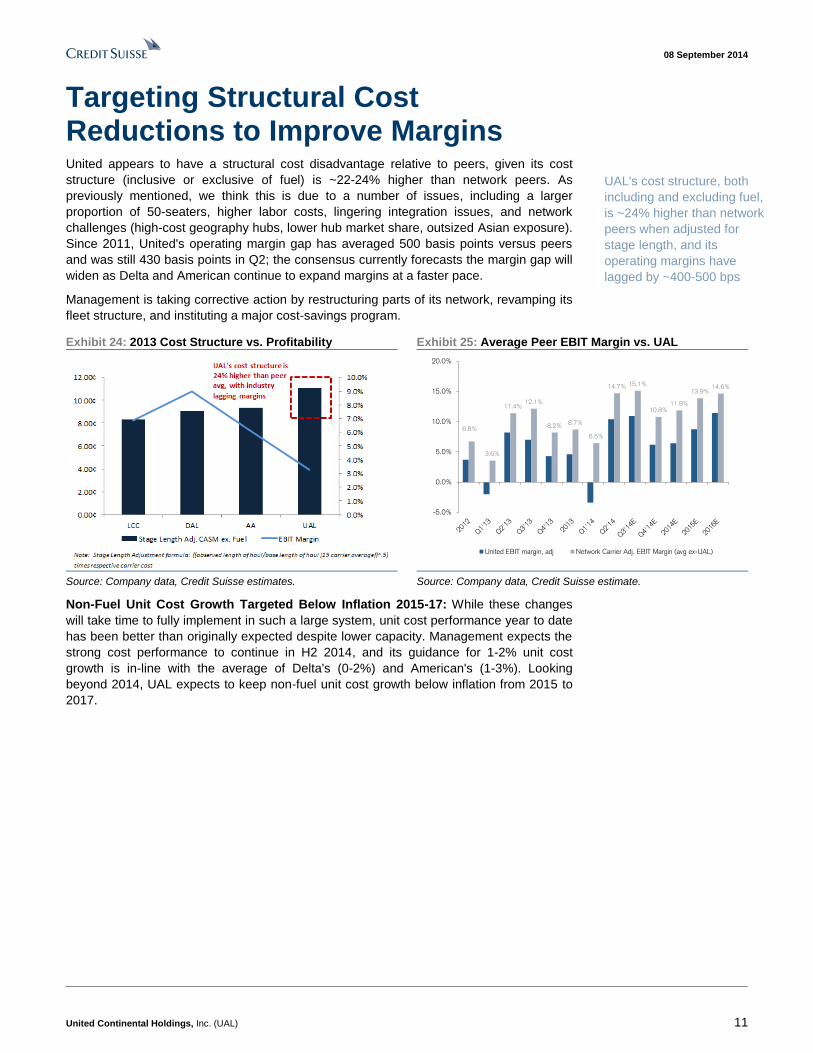
Targeting Structural Cost Reductions to Improve Margins United appears to have a structural cost disadvantage relative to peers, given its cost
structure (inclusive or exclusive of fuel) is ~22-24% higher than network peers. As
previously mentioned, we think this is due to a number of issues, including a larger
proportion of 50-seaters, higher labor costs, lingering integration issues, and network
challenges (high-cost geography hubs, lower hub market share, outsized Asian exposure).
Since 2011, United's operating margin gap has averaged 500 basis points versus peers
and was still 430 basis points in Q2; the consensus currently forecasts the margin gap will
widen as Delta and American continue to expand margins at a faster pace.
Management is taking corrective action by restructuring parts of its network, revamping its
fleet structure, and instituting a major cost-savings program.
Exhibit 24: 2013 Cost Structure vs. Profitability Exhibit 25: Average Peer EBIT Margin vs. UAL
6.8%
3.6%
11.4%12.1%
8.2% 8.7%
6.5%
14.7% 15.1%
10.8%11.9%
13.9%14.6%
-5.0%
0.0%
5.0%
10.0%
15.0%
20.0%
United EBIT margin, adj Network Carrier Adj. EBIT Margin (avg ex-UAL)
Source: Company data, Credit Suisse estimates. Source: Company data, Credit Suisse estimate.
Non-Fuel Unit Cost Growth Targeted Below Inflation 2015-17: While these changes
will take time to fully implement in such a large system, unit cost performance year to date
has been better than originally expected despite lower capacity. Management expects the
strong cost performance to continue in H2 2014, and its guidance for 1-2% unit cost
growth is in-line with the average of Delta's (0-2%) and American's (1-3%). Looking
beyond 2014, UAL expects to keep non-fuel unit cost growth below inflation from 2015 to
2017.
UAL's cost structure, both
including and excluding fuel,
is ~24% higher than network
peers when adjusted for
stage length, and its
operating margins have
lagged by ~400-500 bps
08 September 2014
United Continental Holdings, Inc. (UAL) 12
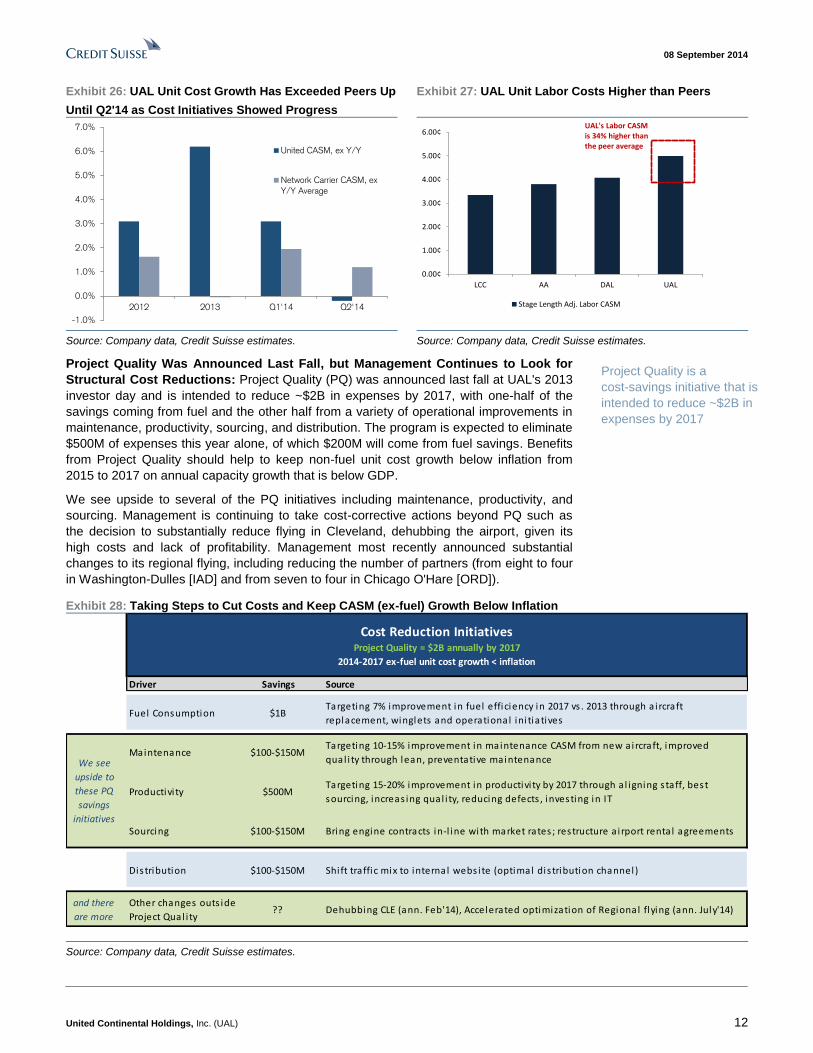
Exhibit 26: UAL Unit Cost Growth Has Exceeded Peers Up
Until Q2'14 as Cost Initiatives Showed Progress
Exhibit 27: UAL Unit Labor Costs Higher than Peers
-1.0%
0.0%
1.0%
2.0%
3.0%
4.0%
5.0%
6.0%
7.0%
2012 2013 Q1'14 Q2'14
United CASM, ex Y/Y
Network Carrier CASM, ex
Y/Y Average
0.00¢
1.00¢
2.00¢
3.00¢
4.00¢
5.00¢
6.00¢
LCC AA DAL UAL
Stage Length Adj. Labor CASM
UAL's Labor CASM is 34% higher than the peer average
Source: Company data, Credit Suisse estimates. Source: Company data, Credit Suisse estimates.
Project Quality Was Announced Last Fall, but Management Continues to Look for
Structural Cost Reductions: Project Quality (PQ) was announced last fall at UAL's 2013
investor day and is intended to reduce ~$2B in expenses by 2017, with one-half of the
savings coming from fuel and the other half from a variety of operational improvements in
maintenance, productivity, sourcing, and distribution. The program is expected to eliminate
$500M of expenses this year alone, of which $200M will come from fuel savings. Benefits
from Project Quality should help to keep non-fuel unit cost growth below inflation from
2015 to 2017 on annual capacity growth that is below GDP.
We see upside to several of the PQ initiatives including maintenance, productivity, and
sourcing. Management is continuing to take cost-corrective actions beyond PQ such as
the decision to substantially reduce flying in Cleveland, dehubbing the airport, given its
high costs and lack of profitability. Management most recently announced substantial
changes to its regional flying, including reducing the number of partners (from eight to four
in Washington-Dulles [IAD] and from seven to four in Chicago O'Hare [ORD]).
Exhibit 28: Taking Steps to Cut Costs and Keep CASM (ex-fuel) Growth Below Inflation
Driver Savings Source
Fuel Consumption $1BTargeting 7% improvement in fuel efficiency in 2017 vs . 2013 through a ircraft
replacement, winglets and operational ini tiatives
Maintenance $100-$150MTargeting 10-15% improvement in maintenance CASM from new a ircraft, improved
qual i ty through lean, preventative maintenance
Productivi ty $500MTargeting 15-20% improvement in productivi ty by 2017 through a l igning s taff, best
sourcing, increas ing qual i ty, reducing defects , investing in IT
Sourcing $100-$150M Bring engine contracts in-l ine with market rates ; restructure a i rport rental agreements
Distribution $100-$150M Shift traffic mix to internal webs ite (optimal dis tribution channel )
and there
are more
Other changes outs ide
Project Qual i ty?? Dehubbing CLE (ann. Feb'14), Accelerated optimization of Regional flying (ann. July'14)
Cost Reduction InitiativesProject Quality = $2B annually by 2017
2014-2017 ex-fuel unit cost growth < inflation
We see
upside to
these PQ
savings
initiatives
Source: Company data, Credit Suisse estimates.
Project Quality is a
cost-savings initiative that is
intended to reduce ~$2B in
expenses by 2017
08 September 2014
United Continental Holdings, Inc. (UAL) 13
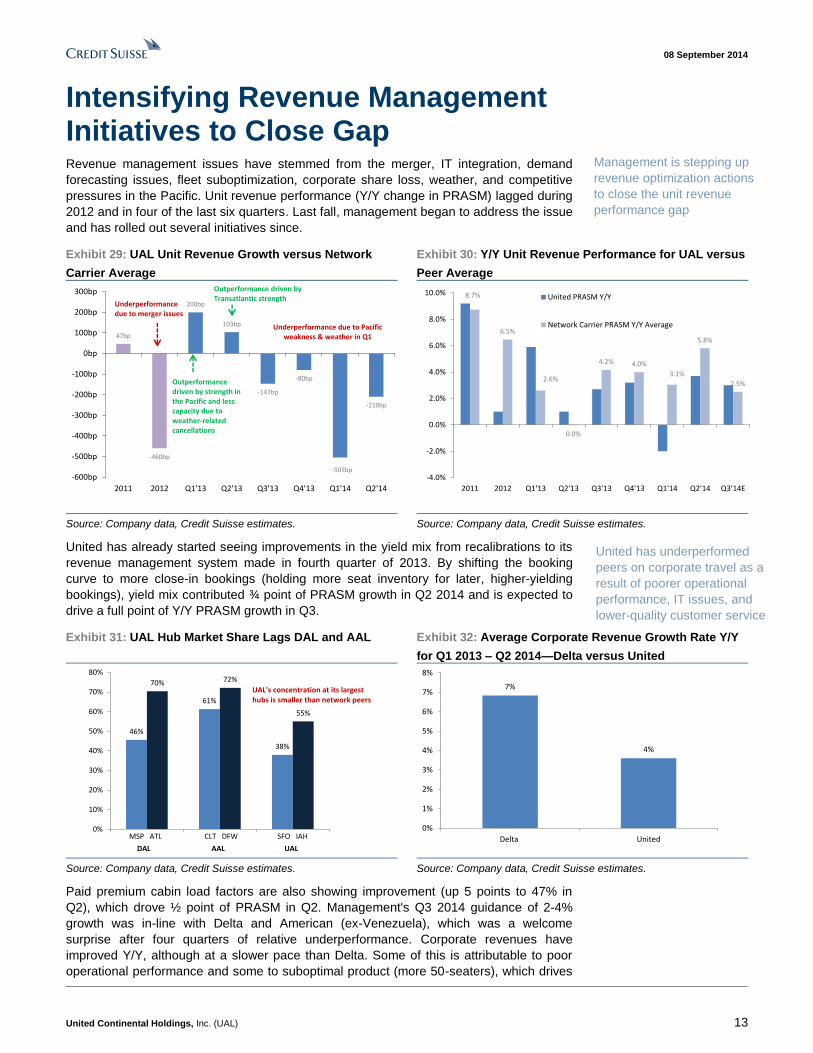
Intensifying Revenue Management Initiatives to Close Gap Revenue management issues have stemmed from the merger, IT integration, demand
forecasting issues, fleet suboptimization, corporate share loss, weather, and competitive
pressures in the Pacific. Unit revenue performance (Y/Y change in PRASM) lagged during
2012 and in four of the last six quarters. Last fall, management began to address the issue
and has rolled out several initiatives since.
Exhibit 29: UAL Unit Revenue Growth versus Network
Carrier Average
Exhibit 30: Y/Y Unit Revenue Performance for UAL versus
Peer Average
47bp
-460bp
200bp
103bp
-147bp
-80bp
-505bp
-210bp
-600bp
-500bp
-400bp
-300bp
-200bp
-100bp
0bp
100bp
200bp
300bp
2011 2012 Q1'13 Q2'13 Q3'13 Q4'13 Q1'14 Q2'14
Outperformancedriven by strength in the Pacific and less capacity due to weather-related cancellations
Outperformance driven by Transatlantic strength
Underperformancedue to merger issues
Underperformance due to Pacific weakness & weather in Q1
8.7%
6.5%
2.6%
0.0%
4.2% 4.0%
3.1%
5.8%
2.5%
-4.0%
-2.0%
0.0%
2.0%
4.0%
6.0%
8.0%
10.0%
2011 2012 Q1'13 Q2'13 Q3'13 Q4'13 Q1'14 Q2'14 Q3'14E
United PRASM Y/Y
Network Carrier PRASM Y/Y Average
Source: Company data, Credit Suisse estimates. Source: Company data, Credit Suisse estimates.
United has already started seeing improvements in the yield mix from recalibrations to its
revenue management system made in fourth quarter of 2013. By shifting the booking
curve to more close-in bookings (holding more seat inventory for later, higher-yielding
bookings), yield mix contributed ¾ point of PRASM growth in Q2 2014 and is expected to
drive a full point of Y/Y PRASM growth in Q3.
Exhibit 31: UAL Hub Market Share Lags DAL and AAL Exhibit 32: Average Corporate Revenue Growth Rate Y/Y
for Q1 2013 – Q2 2014—Delta versus United
46%
61%
38%
70% 72%
55%
0%
10%
20%
30%
40%
50%
60%
70%
80%
UAL's concentration at its largest hubs is smaller than network peers
DAL AAL UAL
MSP ATL CLT DFW SFO IAH
7%
4%
0%
1%
2%
3%
4%
5%
6%
7%
8%
Delta United
Source: Company data, Credit Suisse estimates. Source: Company data, Credit Suisse estimates.
Paid premium cabin load factors are also showing improvement (up 5 points to 47% in
Q2), which drove ½ point of PRASM in Q2. Management's Q3 2014 guidance of 2-4%
growth was in-line with Delta and American (ex-Venezuela), which was a welcome
surprise after four quarters of relative underperformance. Corporate revenues have
improved Y/Y, although at a slower pace than Delta. Some of this is attributable to poor
operational performance and some to suboptimal product (more 50-seaters), which drives
Management is stepping up
revenue optimization actions
to close the unit revenue
performance gap
United has underperformed
peers on corporate travel as a
result of poorer operational
performance, IT issues, and
lower-quality customer service
08 September 2014
United Continental Holdings, Inc. (UAL) 14
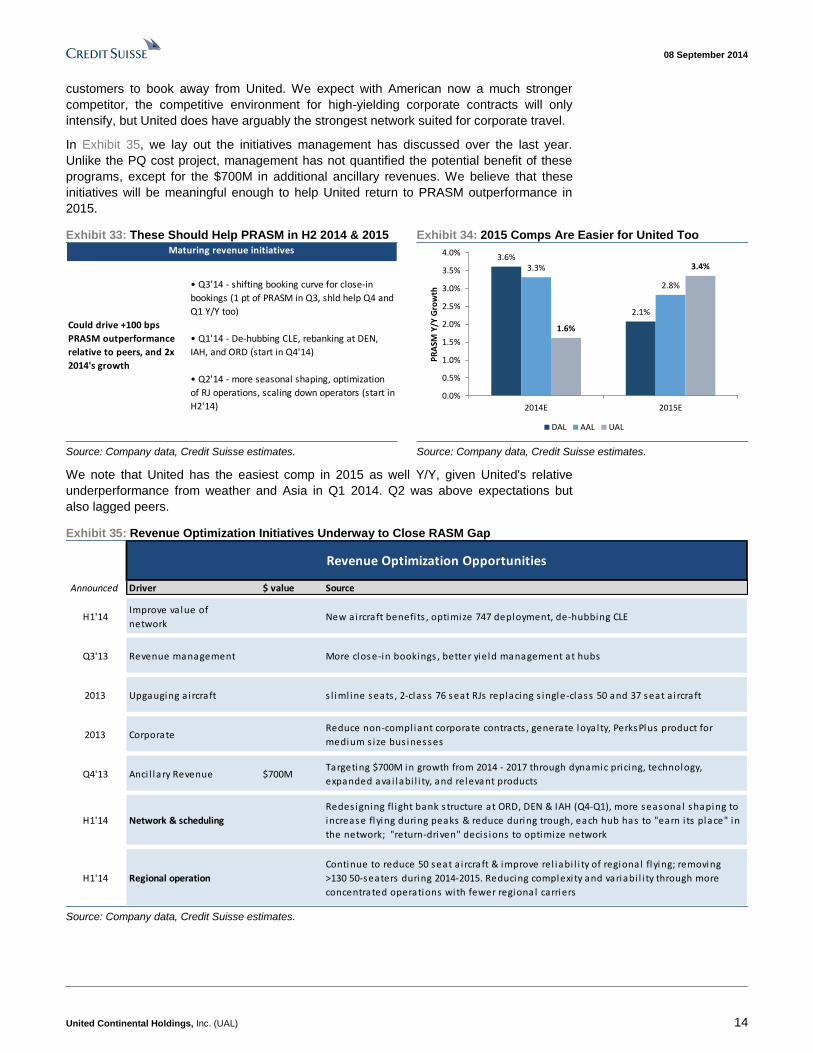
customers to book away from United. We expect with American now a much stronger
competitor, the competitive environment for high-yielding corporate contracts will only
intensify, but United does have arguably the strongest network suited for corporate travel.
In Exhibit 35, we lay out the initiatives management has discussed over the last year.
Unlike the PQ cost project, management has not quantified the potential benefit of these
programs, except for the $700M in additional ancillary revenues. We believe that these
initiatives will be meaningful enough to help United return to PRASM outperformance in
2015.
Exhibit 33: These Should Help PRASM in H2 2014 & 2015 Exhibit 34: 2015 Comps Are Easier for United Too
Maturing revenue initiatives
Could drive +100 bps
PRASM outperformance
relative to peers, and 2x
2014's growth
• Q3'14 - shifting booking curve for close-in
bookings (1 pt of PRASM in Q3, shld help Q4 and
Q1 Y/Y too)
• Q1'14 - De-hubbing CLE, rebanking at DEN,
IAH, and ORD (start in Q4'14)
• Q2'14 - more seasonal shaping, optimization
of RJ operations, scaling down operators (start in
H2'14)
3.6%
2.1%
3.3%
2.8%
1.6%
3.4%
0.0%
0.5%
1.0%
1.5%
2.0%
2.5%
3.0%
3.5%
4.0%
2014E 2015E
PR
ASM
Y/Y
Gro
wth
DAL AAL UAL
Source: Company data, Credit Suisse estimates. Source: Company data, Credit Suisse estimates.
We note that United has the easiest comp in 2015 as well Y/Y, given United's relative
underperformance from weather and Asia in Q1 2014. Q2 was above expectations but
also lagged peers.
Exhibit 35: Revenue Optimization Initiatives Underway to Close RASM Gap
Announced Driver $ value Source
H1'14Improve va lue of
networkNew aircraft benefi ts , optimize 747 deployment, de-hubbing CLE
Q3'13 Revenue management More close-in bookings , better yield management at hubs
2013 Upgauging a i rcraft s l iml ine seats , 2-class 76 seat RJs replacing s ingle-class 50 and 37 seat a i rcraft
2013 CorporateReduce non-compl iant corporate contracts , generate loyalty, PerksPlus product for
medium s ize bus inesses
Q4'13 Anci l lary Revenue $700MTargeting $700M in growth from 2014 - 2017 through dynamic pricing, technology,
expanded avai labi l i ty, and relevant products
H1'14 Network & scheduling
Redes igning fl ight bank s tructure at ORD, DEN & IAH (Q4-Q1), more seasonal shaping to
increase flying during peaks & reduce during trough, each hub has to "earn i ts place" in
the network; "return-driven" decis ions to optimize network
H1'14 Regional operation
Continue to reduce 50 seat a i rcraft & improve rel iabi l i ty of regional flying; removing
>130 50-seaters during 2014-2015. Reducing complexi ty and variabi l i ty through more
concentrated operations with fewer regional carriers
Revenue Optimization Opportunities
Source: Company data, Credit Suisse estimates.
08 September 2014
United Continental Holdings, Inc. (UAL) 15
Scaling Down Unprofitable Hubs
The company reduced its average daily departures from Cleveland (CLE) by ~60%,
starting in phases in April of this year. The reductions were completed in June 2014, and
UAL took its CLE capacity down by ~36% from 200 daily departures to 72 departures with
destinations served falling to 72 from 200. The reduction will largely come from regional
departures, with mainline operations remaining largely unchanged. The decision was
driven in part by the hub's lack of profitability, as well as by new industry regulations on
pilot hours that have caused mainline carriers to increase hiring of regional pilots,
drastically reducing the supply of regional pilots. Poor profitability resulted from the lack of
higher-yielding connecting traffic, as many passengers opted instead to travel through
Detroit or Chicago.
Given the decisions by other carriers to scale down Cincinnati, Milwaukee, Memphis,
Pittsburgh, and St. Louis since consolidation, this wasn’t so surprising. CLE was a
Continental hub and served a vital purpose in the network for connecting passengers in
the Midwest. However, its O&D traffic was small and it's close enough to Chicago that
United didn’t need both.
There could be more scaledowns to come as management continues to evaluate its
network.
Restructuring Pacific Network & Routes
United has shifted its Asia strategy by (1) restructuring Narita flying by working with JV
partner ANA (eliminating unprofitable flying beyond Tokyo), (2) optimizing 747 deployment
(improving reliability and down gauging where appropriate to 777s), (3) transitioning flights
to Tier 2 cities with less competition (offering flights from San Francisco to Chengdu and
Taipei), and (4) rightsizing with 787 flying (to better match capacity with demand and
increase fuel efficiency). The Pacific performed better than expected in Q2 2014,
exhibiting progress on the initiatives and a benefit from the seasonal peak. However,
competitive capacity will pressure yields after the seasonal peak.
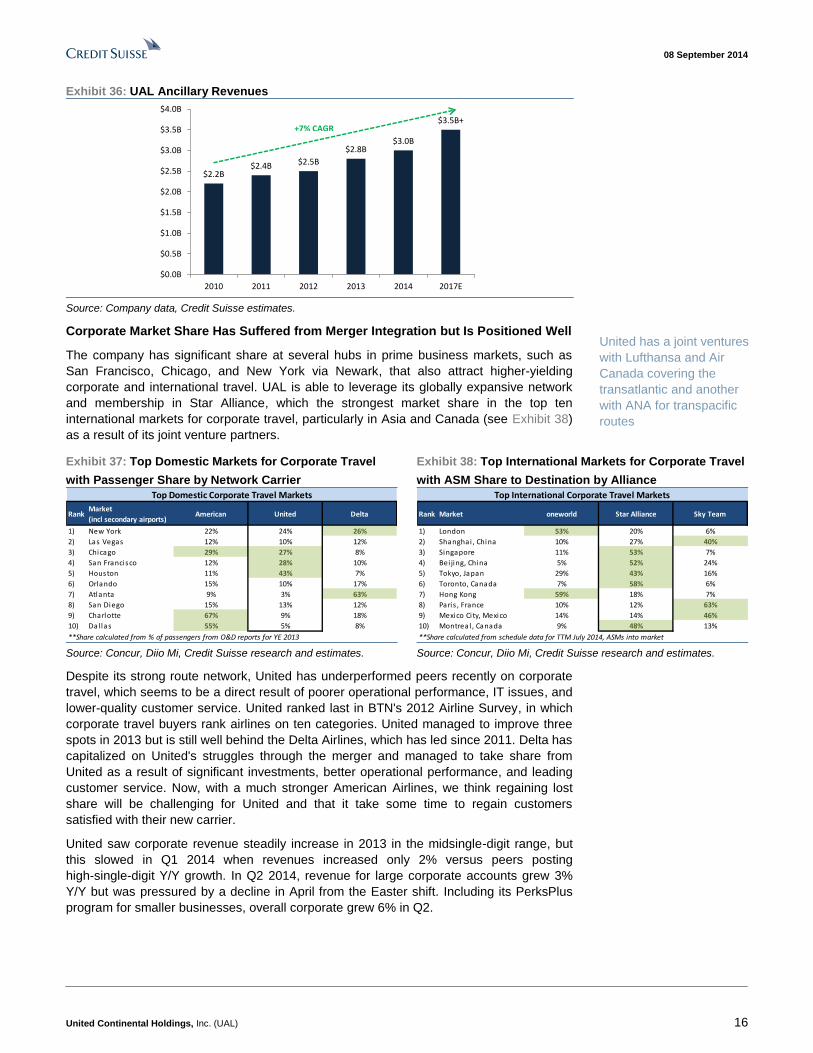
Ancillary Products and Services Offer High Margin Growth
United has grown ancillary revenues to $3B (~8% of sales) in 2014 and is planning to
grow that to $3.5B dollars by 2017, a 7% CAGR from 2010's $2.2B level. Ancillary
products are extremely high margin, as they extract additional revenue from an existing
customer with little to no incremental expense with no associated working capital. United
trails Delta, for which non-ticket revenues are closer to 20% of sales at >$5B.
United is targeting growth through unbundling (charging for bags, meals), new in-flight
products (streaming entertainment, onboard Wi-Fi), and optimization of the customer
experience (premier access, United Club, flexibility through FareLock, and premium cabin
upsell). United is also improving dynamic pricing and expanding availability through digital
channels, as well as stimulating growth via smart bundling of products. Wi-Fi is currently
offered on 170 aircraft, and the airline plans to expand that offering to its entire mainline
fleet.
The company has also launched a dynamic pricing system that offers multiple price points
for Economy Plus seats on a plane based on the demand for the seat (i.e., people will pay
more for an aisle versus the middle), as well as for demand for the flight. The enhanced
pricing of these seats will also be available to a wider consumer base. UAL is expanding
the distribution of this product by offering Economy Plus on TravelPort as well as two other
distribution systems.
Management commented in
July that each hub has to
"earn its place in the
network" and it is making
"return-driven" decisions to
optimize the network,
suggesting that there could
be more hub scaledowns to
come
United is targeting $3B
dollars in ancillary revenues
this year and is planning to
grow that to $3.5B dollars by
2017
08 September 2014
United Continental Holdings, Inc. (UAL) 16
Exhibit 36: UAL Ancillary Revenues
$2.2B$2.4B $2.5B
$2.8B$3.0B
$3.5B+
$0.0B
$0.5B
$1.0B
$1.5B
$2.0B
$2.5B
$3.0B
$3.5B
$4.0B
2010 2011 2012 2013 2014 2017E
+7% CAGR
Source: Company data, Credit Suisse estimates.
Corporate Market Share Has Suffered from Merger Integration but Is Positioned Well
The company has significant share at several hubs in prime business markets, such as
San Francisco, Chicago, and New York via Newark, that also attract higher-yielding
corporate and international travel. UAL is able to leverage its globally expansive network
and membership in Star Alliance, which the strongest market share in the top ten
international markets for corporate travel, particularly in Asia and Canada (see Exhibit 38)
as a result of its joint venture partners.
Exhibit 37: Top Domestic Markets for Corporate Travel
with Passenger Share by Network Carrier
Exhibit 38: Top International Markets for Corporate Travel
with ASM Share to Destination by Alliance
RankMarket
(incl secondary airports)American United Delta
1) New York 22% 24% 26%
2) Las Vegas 12% 10% 12%
3) Chicago 29% 27% 8%
4) San Francisco 12% 28% 10%
5) Houston 11% 43% 7%
6) Orlando 15% 10% 17%
7) Atlanta 9% 3% 63%
8) San Diego 15% 13% 12%
9) Charlotte 67% 9% 18%
10) Dal las 55% 5% 8%
**Share calculated from % of passengers from O&D reports for YE 2013
Top Domestic Corporate Travel Markets
Rank Market oneworld Star Alliance Sky Team
1) London 53% 20% 6%
2) Shanghai , China 10% 27% 40%
3) Singapore 11% 53% 7%
4) Bei jing, China 5% 52% 24%
5) Tokyo, Japan 29% 43% 16%
6) Toronto, Canada 7% 58% 6%
7) Hong Kong 59% 18% 7%
8) Paris , France 10% 12% 63%
9) Mexico City, Mexico 14% 14% 46%
10) Montreal , Canada 9% 48% 13%
**Share calculated from schedule data for TTM July 2014, ASMs into market
Top International Corporate Travel Markets
Source: Concur, Diio Mi, Credit Suisse research and estimates. Source: Concur, Diio Mi, Credit Suisse research and estimates.
Despite its strong route network, United has underperformed peers recently on corporate
travel, which seems to be a direct result of poorer operational performance, IT issues, and
lower-quality customer service. United ranked last in BTN's 2012 Airline Survey, in which
corporate travel buyers rank airlines on ten categories. United managed to improve three
spots in 2013 but is still well behind the Delta Airlines, which has led since 2011. Delta has
capitalized on United's struggles through the merger and managed to take share from
United as a result of significant investments, better operational performance, and leading
customer service. Now, with a much stronger American Airlines, we think regaining lost
share will be challenging for United and that it take some time to regain customers
satisfied with their new carrier.
United saw corporate revenue steadily increase in 2013 in the midsingle-digit range, but
this slowed in Q1 2014 when revenues increased only 2% versus peers posting
high-single-digit Y/Y growth. In Q2 2014, revenue for large corporate accounts grew 3%
Y/Y but was pressured by a decline in April from the Easter shift. Including its PerksPlus
program for smaller businesses, overall corporate grew 6% in Q2.
United has a joint ventures
with Lufthansa and Air
Canada covering the
transatlantic and another
with ANA for transpacific
routes
08 September 2014
United Continental Holdings, Inc. (UAL) 17
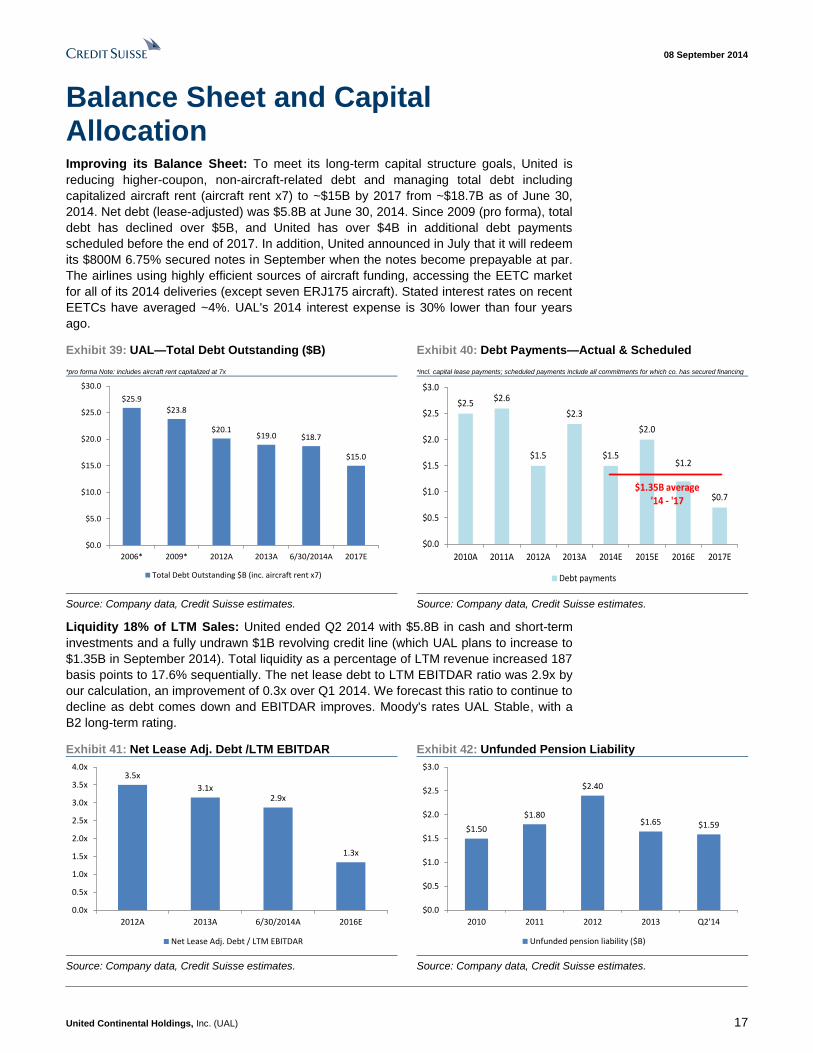
Balance Sheet and Capital Allocation Improving its Balance Sheet: To meet its long-term capital structure goals, United is
reducing higher-coupon, non-aircraft-related debt and managing total debt including
capitalized aircraft rent (aircraft rent x7) to ~$15B by 2017 from ~$18.7B as of June 30,
2014. Net debt (lease-adjusted) was $5.8B at June 30, 2014. Since 2009 (pro forma), total
debt has declined over $5B, and United has over $4B in additional debt payments
scheduled before the end of 2017. In addition, United announced in July that it will redeem
its $800M 6.75% secured notes in September when the notes become prepayable at par.
The airlines using highly efficient sources of aircraft funding, accessing the EETC market
for all of its 2014 deliveries (except seven ERJ175 aircraft). Stated interest rates on recent
EETCs have averaged ~4%. UAL's 2014 interest expense is 30% lower than four years
ago.
Exhibit 39: UAL—Total Debt Outstanding ($B)
*pro forma Note: includes aircraft rent capitalized at 7x
Exhibit 40: Debt Payments—Actual & Scheduled
*incl. capital lease payments; scheduled payments include all commitments for which co. has secured financing
$25.9
$23.8
$20.1$19.0 $18.7
$15.0
$0.0
$5.0
$10.0
$15.0
$20.0
$25.0
$30.0
2006* 2009* 2012A 2013A 6/30/2014A 2017E
Total Debt Outstanding $B (inc. aircraft rent x7)
$2.5$2.6
$1.5
$2.3
$1.5
$2.0
$1.2
$0.7
$0.0
$0.5
$1.0
$1.5
$2.0
$2.5
$3.0
2010A 2011A 2012A 2013A 2014E 2015E 2016E 2017E
Debt payments
$1.35B average'14 - '17
Source: Company data, Credit Suisse estimates. Source: Company data, Credit Suisse estimates.
Liquidity 18% of LTM Sales: United ended Q2 2014 with $5.8B in cash and short-term
investments and a fully undrawn $1B revolving credit line (which UAL plans to increase to
$1.35B in September 2014). Total liquidity as a percentage of LTM revenue increased 187
basis points to 17.6% sequentially. The net lease debt to LTM EBITDAR ratio was 2.9x by
our calculation, an improvement of 0.3x over Q1 2014. We forecast this ratio to continue to
decline as debt comes down and EBITDAR improves. Moody's rates UAL Stable, with a
B2 long-term rating.
Exhibit 41: Net Lease Adj. Debt /LTM EBITDAR Exhibit 42: Unfunded Pension Liability
3.5x
3.1x2.9x
1.3x
0.0x
0.5x
1.0x
1.5x
2.0x
2.5x
3.0x
3.5x
4.0x
2012A 2013A 6/30/2014A 2016E
Net Lease Adj. Debt / LTM EBITDAR
$1.50
$1.80
$2.40
$1.65 $1.59
$0.0
$0.5
$1.0
$1.5
$2.0
$2.5
$3.0
2010 2011 2012 2013 Q2'14
Unfunded pension liability ($B)
Source: Company data, Credit Suisse estimates. Source: Company data, Credit Suisse estimates.
08 September 2014
United Continental Holdings, Inc. (UAL) 18
Managing Down Pension Risk: United is contributing $290M to its pension in 2014,
double its minimum funding requirements. It expects it will continue fund the pension
above the minimum to reduce risk over the long term. UAL has stated it will fund
~$125-150M above required contributions going forward. The unfunded pension obligation
has declined to <$1.6B as of June 30, 2014, a greater than 30% decline since 2012.
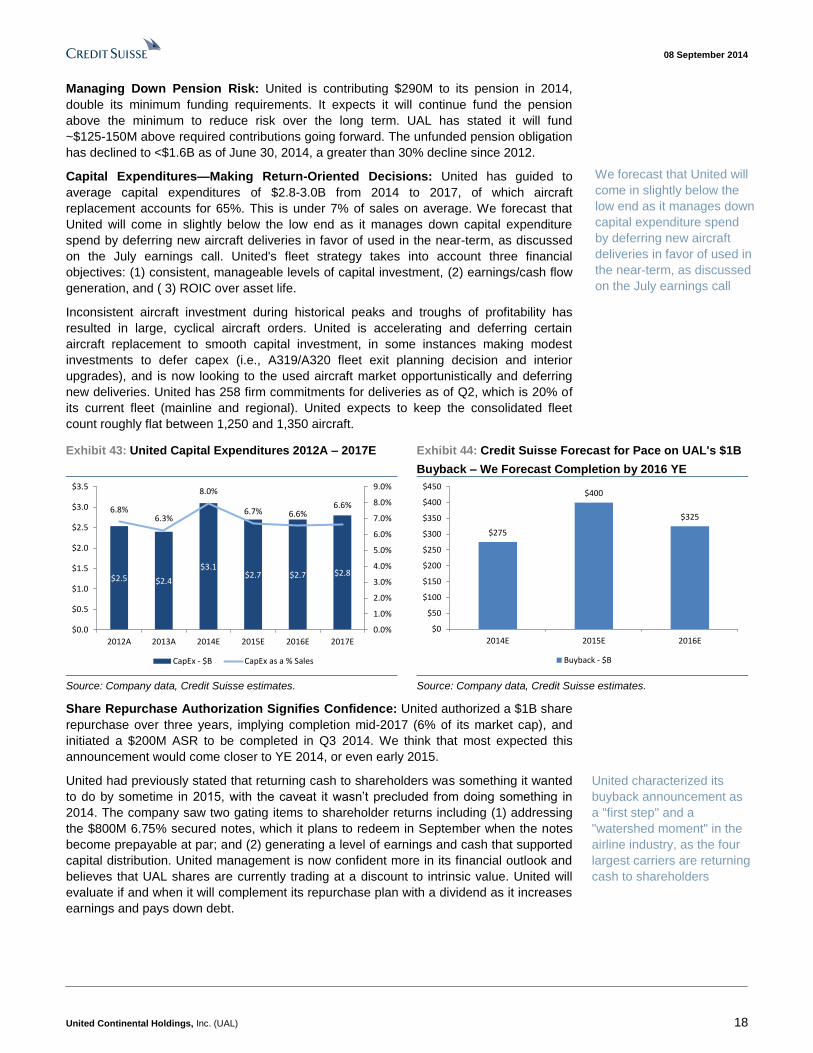
Capital Expenditures—Making Return-Oriented Decisions: United has guided to
average capital expenditures of $2.8-3.0B from 2014 to 2017, of which aircraft
replacement accounts for 65%. This is under 7% of sales on average. We forecast that
United will come in slightly below the low end as it manages down capital expenditure
spend by deferring new aircraft deliveries in favor of used in the near-term, as discussed
on the July earnings call. United's fleet strategy takes into account three financial
objectives: (1) consistent, manageable levels of capital investment, (2) earnings/cash flow
generation, and ( 3) ROIC over asset life.
Inconsistent aircraft investment during historical peaks and troughs of profitability has
resulted in large, cyclical aircraft orders. United is accelerating and deferring certain
aircraft replacement to smooth capital investment, in some instances making modest
investments to defer capex (i.e., A319/A320 fleet exit planning decision and interior
upgrades), and is now looking to the used aircraft market opportunistically and deferring
new deliveries. United has 258 firm commitments for deliveries as of Q2, which is 20% of
its current fleet (mainline and regional). United expects to keep the consolidated fleet
count roughly flat between 1,250 and 1,350 aircraft.
Exhibit 43: United Capital Expenditures 2012A – 2017E Exhibit 44: Credit Suisse Forecast for Pace on UAL's $1B
Buyback – We Forecast Completion by 2016 YE
$2.5 $2.4
$3.1$2.7 $2.7 $2.8
6.8%6.3%
8.0%
6.7% 6.6%6.6%
0.0%
1.0%
2.0%
3.0%
4.0%
5.0%
6.0%
7.0%
8.0%
9.0%
$0.0
$0.5
$1.0
$1.5
$2.0
$2.5
$3.0
$3.5
2012A 2013A 2014E 2015E 2016E 2017E
CapEx - $B CapEx as a % Sales
$275
$400
$325
$0
$50
$100
$150
$200
$250
$300
$350
$400
$450
2014E 2015E 2016E
Buyback - $B
Source: Company data, Credit Suisse estimates. Source: Company data, Credit Suisse estimates.
Share Repurchase Authorization Signifies Confidence: United authorized a $1B share
repurchase over three years, implying completion mid-2017 (6% of its market cap), and
initiated a $200M ASR to be completed in Q3 2014. We think that most expected this
announcement would come closer to YE 2014, or even early 2015.
United had previously stated that returning cash to shareholders was something it wanted
to do by sometime in 2015, with the caveat it wasn’t precluded from doing something in
2014. The company saw two gating items to shareholder returns including (1) addressing
the $800M 6.75% secured notes, which it plans to redeem in September when the notes
become prepayable at par; and (2) generating a level of earnings and cash that supported
capital distribution. United management is now confident more in its financial outlook and
believes that UAL shares are currently trading at a discount to intrinsic value. United will
evaluate if and when it will complement its repurchase plan with a dividend as it increases
earnings and pays down debt.
We forecast that United will
come in slightly below the
low end as it manages down
capital expenditure spend
by deferring new aircraft
deliveries in favor of used in
the near-term, as discussed
on the July earnings call
United characterized its
buyback announcement as
a "first step" and a
"watershed moment" in the
airline industry, as the four
largest carriers are returning
cash to shareholders
08 September 2014
United Continental Holdings, Inc. (UAL) 19
Strategic Positioning Chicago-based United Continental Holdings owns United Airlines, which is the second
largest U.S. network airline by ASMs and claims the world's most comprehensive global
route network. United's mainline and regional operations fly >5,300 flights daily to more
than 360 airports across six continents. United has nine hub locations, including four of the
largest cities in the U.S., and two internationally in Guam and Japan. United is a cofounder
and member of the Star Alliance, the world's largest airline network, and is the largest U.S.
carrier to China.
United merged with Continental Airlines (which at the time was the fourth largest airline in
the U.S.) in October 2010, forming United Continental Holdings. Continental ceased in
March 2012 upon integration of the Web sites, reservation systems, and frequent flyer
programs of the two carriers. Today, the combined entity operates under United Airlines
using the Continental logo and livery and is run by Continental's former CEO, Jeffrey
Smisek.
Postmerger integration challenges have severely affected operational and financial
performance of the combined carrier, negatively affecting the brand and the stock
performance. In November 2013, management announced it was implementing a $2B
annual cost savings program (by 2017) and taking actions to improve revenue to enhance
long-term shareholder value. These goals include generating ROIC >10%, increasing
earnings by 2-4x (from $1.1B in 2013), improving the capital structure, and balancing cash
flow allocation.
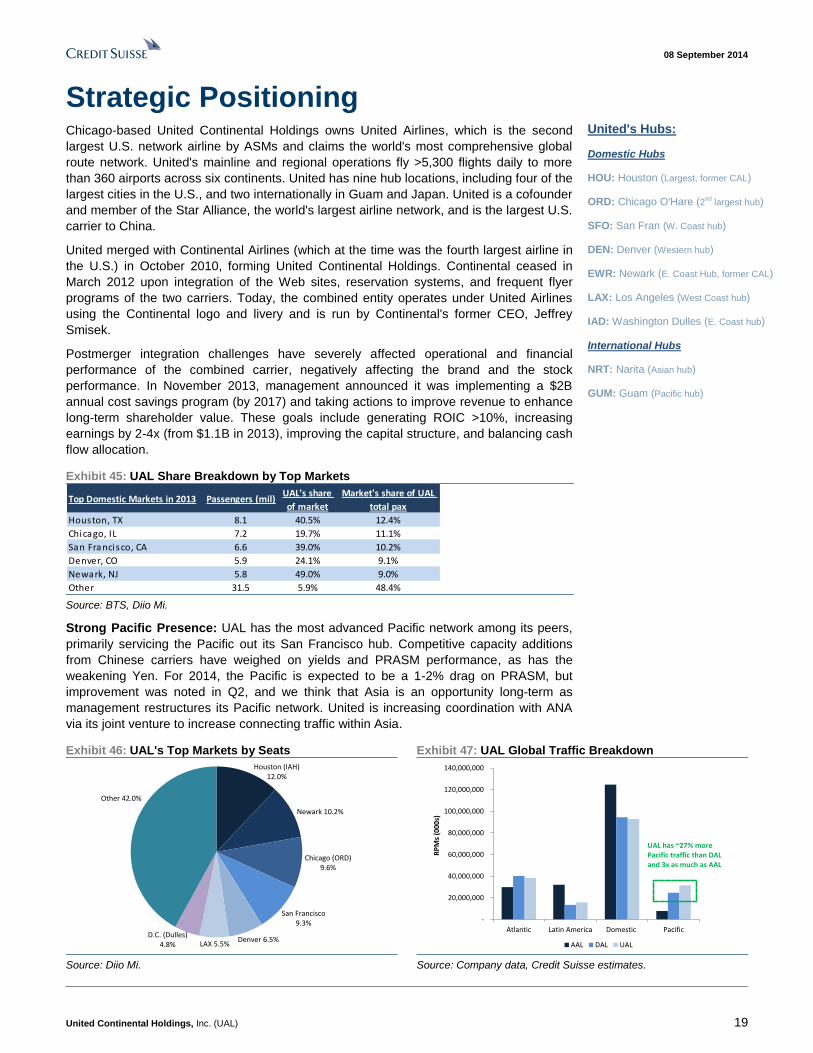
Exhibit 45: UAL Share Breakdown by Top Markets
Top Domestic Markets in 2013 Passengers (mil)UAL's share
of market
Market's share of UAL
total pax
Houston, TX 8.1 40.5% 12.4%
Chicago, IL 7.2 19.7% 11.1%
San Francisco, CA 6.6 39.0% 10.2%
Denver, CO 5.9 24.1% 9.1%
Newark, NJ 5.8 49.0% 9.0%
Other 31.5 5.9% 48.4% Source: BTS, Diio Mi.
Strong Pacific Presence: UAL has the most advanced Pacific network among its peers,
primarily servicing the Pacific out its San Francisco hub. Competitive capacity additions
from Chinese carriers have weighed on yields and PRASM performance, as has the
weakening Yen. For 2014, the Pacific is expected to be a 1-2% drag on PRASM, but
improvement was noted in Q2, and we think that Asia is an opportunity long-term as
management restructures its Pacific network. United is increasing coordination with ANA
via its joint venture to increase connecting traffic within Asia.
Exhibit 46: UAL's Top Markets by Seats Exhibit 47: UAL Global Traffic Breakdown
Houston (IAH) 12.0%
Newark 10.2%
Chicago (ORD) 9.6%
San Francisco 9.3%
Denver 6.5%LAX 5.5%
D.C. (Dulles) 4.8%
Other 42.0%
-
20,000,000
40,000,000
60,000,000
80,000,000
100,000,000
120,000,000
140,000,000
Atlantic Latin America Domestic Pacific
RP
Ms
(00
0s)
AAL DAL UAL
UAL has ~27% more Pacific traffic than DAL and 3x as much as AAL
Source: Diio Mi. Source: Company data, Credit Suisse estimates.
United's Hubs:
Domestic Hubs
HOU: Houston (Largest, former CAL)
ORD: Chicago O'Hare (2nd largest hub)
SFO: San Fran (W. Coast hub)
DEN: Denver (Western hub)
EWR: Newark (E. Coast Hub, former CAL)
LAX: Los Angeles (West Coast hub)
IAD: Washington Dulles (E. Coast hub)
International Hubs
NRT: Narita (Asian hub)
GUM: Guam (Pacific hub)
08 September 2014
United Continental Holdings, Inc. (UAL) 20
Fuel—19% Hedged for 2015: In 2013, fuel represented UAL's single-largest operating
cost at 33% of total operating expenses. For the full-year 2014, fuel price per gallon
(including hedging impacts) is expected to be $3.06-3.11 based on the July 17, 2014,
forward fuel curve (Brent crude spot $107.89), down ~1.2% from $3.13 in 2013. UAL
typically hedges a portion of its forecast fuel consumption. As of Q2, the company had
hedged 21% of 2014 projected fuel requirements and 19% of its projected 2015
consumption.
Regional Partner Flying
United relies on regional contract carriers as an efficient means to feed its route network
and operate commuter flights. Network carriers outsource to regional airlines as many of
the smaller airports served by regional contract carriers would be unprofitable to service
with a mainline aircraft. United partners with a number of regional carriers including
Republic Airlines, CommutAir Airline, ExpressJet Airlines, GoJet Airlines, Mesa Airlines,
Shuttle America, SkyWest Airlines, and Trans States Airlines to provide regional service
under the United Express brand as an extension of the mainline network.
Of United's regional flights, 95% are operated under capacity purchase agreements
(CPAs), which include a fixed fee plus variable reimbursement (incentive payment based
on operational performance). Fuel, landing fees, and facilities rent are passed through by
the regional carrier at cost. United determines the schedules, pricing, and revenue
management. In 2013, regional capacity purchase represented 6.5% of total operating
expenses for the carrier.
Restructuring Regional Flying to Improve Profitability and Reliability: Today, 68%
(391/572 aircraft) of United's regional fleet comprises regional jets with 50 or fewer seats.
United is currently restructuring its regional fleet to enhance service and improve efficiency
and profitability by replacing the equivalent of more than 130 50-seat regional jets with 70
larger ERJ-175 76 seat aircraft with dual classes and 10% better fuel efficiency. By the
end of 2015, United expects it will have ~230 50-seaters. For context, at the beginning of
2014, United flew 8% of its capacity with 50-seat and smaller aircraft and expects this will
decline to 5% by the end of 2015.
United also announced in July that it is taking action to improve the reliability of its regional
operations, including reducing complexity and variability through more concentrated
operations and fewer regional carriers. This means a reduction in the number of partners
out of a given hub (i.e., going from eight to four out of Washington-Dulles and seven to
four in Chicago O'Hare), which should improve profitability by providing both revenue and
cost benefits. (See Exhibit 52 and Exhibit 53 in the Fleet Strategy section for more detail.)
UAL has 24% of its 2014
fuel consumption hedged

08 September 2014
United Continental Holdings, Inc. (UAL) 21
Merger Integration Since the 2010 merger, United has underperformed peers operationally and financially,
and while UAL shares have risen 108% (since the merger close date in October 2010),
DAL shares are up 300% over the same period. Labor and IT issues have been the
primary culprits, and the flight attendants and mechanic unions are still negotiating for a
single contract four years after the merger was announced, creating inefficiencies and
cultural challenges. United flight attendants and cabin crews are still unable to fly on
Continental flights and vice versa, and the airline has had the highest rate of complaints
filed with the DoT among major airlines in the past three years.
The merger was expected to generate net annual synergies of approximately $1.0-1.2B
dollars a year, and the combined entity has faced many difficulties in the integration
process. The transition to a single-passenger services system in 2012 created numerous
challenges both internally with revenue management and efficiency, as well as from a
customer perspective, with ticketing glitches and poorly perceived customer service
responses.
More problems arose earlier this year when United suffered an outsized impact from the
severe winter weather. On its Q1 call, UAL acknowledged it is still operating a number of
parallel systems and processes that resulted from the merger and are driving inefficiencies
and costs. United has also admitted that its customer service has been subpar following
the merger, and it is spending time and money and leveraging third parties to train its
employees. The lack of operational reliability, combined with IT issues and poor customer
service, has weighed on United's brand image and ratings and resulted in corporate
market share loss as previously outlined.
Exhibit 48: UAL-CAL Integration Timeline
Stock swapmerger announced
ShareholdersApprove MergerNew ticker ann. UAL
CAL leadership is appointed to run combined entity
Government Approves Merger
Merger closesOctober 1, 2010
May-2010 Aug-2010 Sep-2010 Oct-2010
CAL CEO Jeff Smisek takes CEO role at combined carrier
Single Operating Certificate Issued
Nov-2011
Reservation Systems & Frequent Flier Programscombined
Union Negotiations for single contracts
Flight attendants and mechanics still negotiating -Legacy United flight attendants cannot fly on Continental Planes and vice versa
Single Livery & Uniform
Mar-2012 Apr-2012 Aug-2012 - Present
Decision to migrate to smaller, legacy Continental system results in numerous operation challenges
UAL Pilots ratify new 4-yr laboragreement
Dec-2012
Under terms of agreement pilots receive an 8.5% raise in Jan 14 and 3 annual raises of 3%
Decision enables Continental pilots to fly >50 seat aircraft
Source: ACI, WSJ, Credit Suisse Research, Company data.
History of Merger: Continental left the Sky Team Alliance following the DAL-NWA merger
and subsequently joined Star Alliance. United and Continental contemplated merging in
late 2006 and again in 2008; however, in April 2008, negotiations ceased. United then
began talks (again) with US Airways (with which it also considered merging in 2000), but
eventually United and Continental signed an alliance that ultimately paved the way for the
merger, which was approved in May of 2010. This came not even a month after United
formally announced it would not merge with US Airways.
The transition to a
single-passenger services
system in 2012 created
numerous challenges both
internally with revenue
management and efficiency,
as well as from a customer
perspective, with ticketing
glitches and poorly perceived
customer service responses
On its Q1 call, UAL
acknowledged it is still
operating a number of parallel
systems and processes;
these are lingering from the
merger and are driving
inefficiencies and costs
08 September 2014
United Continental Holdings, Inc. (UAL) 22
Fleet Strategy United's new aircraft order book is replacing older, less fuel-efficient aircraft and is a
significant contributor to its cost-savings targets. United expects to save $200M from
improved fuel efficiency in 2014 alone as it replaces 37 of its 20-year old 757-200 aircraft
with 29 737-900ER aircraft, and 43 ERJ-135/145 small regional jets with 27 larger
ERJ-175 aircraft. United is also taking delivery of six 787s in 2014 and another 20 in 2015.
In July 2014, United announced it will also look to the used aircraft market for fleet
replacement opportunities, potentially replacing some new aircraft orders to lower capital
spend, although it has not updated its long-term capex target of $2.8-3.0B.
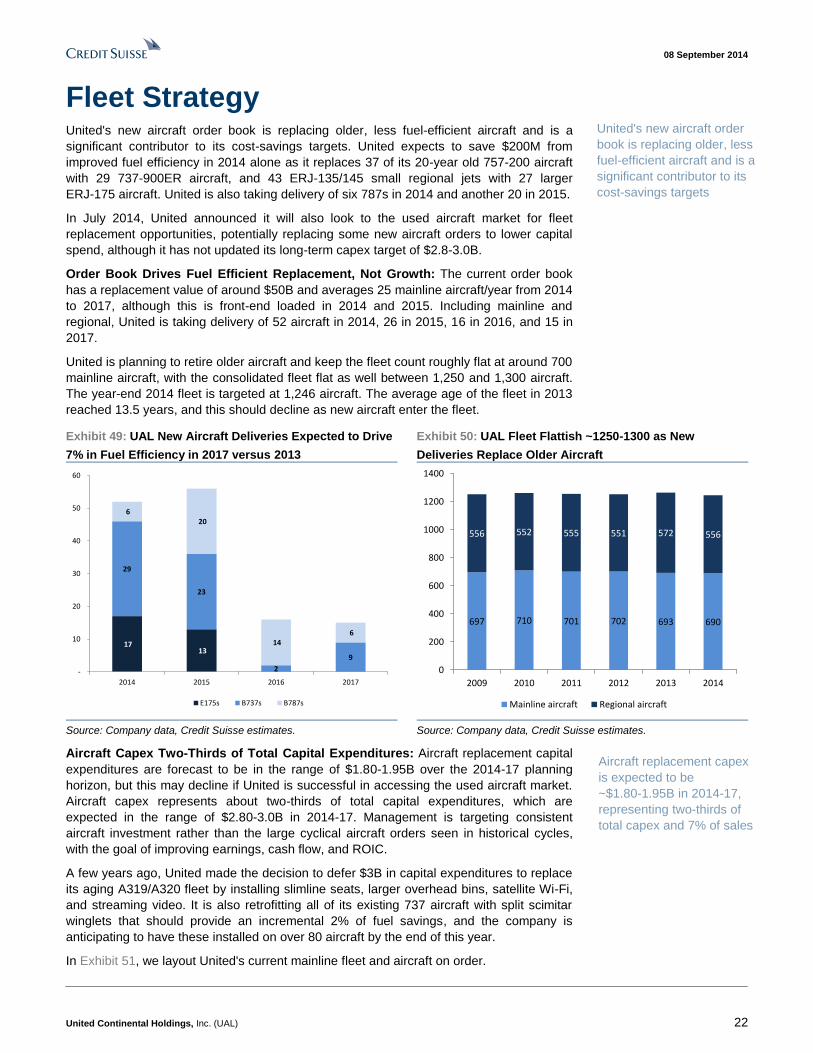
Order Book Drives Fuel Efficient Replacement, Not Growth: The current order book
has a replacement value of around $50B and averages 25 mainline aircraft/year from 2014
to 2017, although this is front-end loaded in 2014 and 2015. Including mainline and
regional, United is taking delivery of 52 aircraft in 2014, 26 in 2015, 16 in 2016, and 15 in
2017.
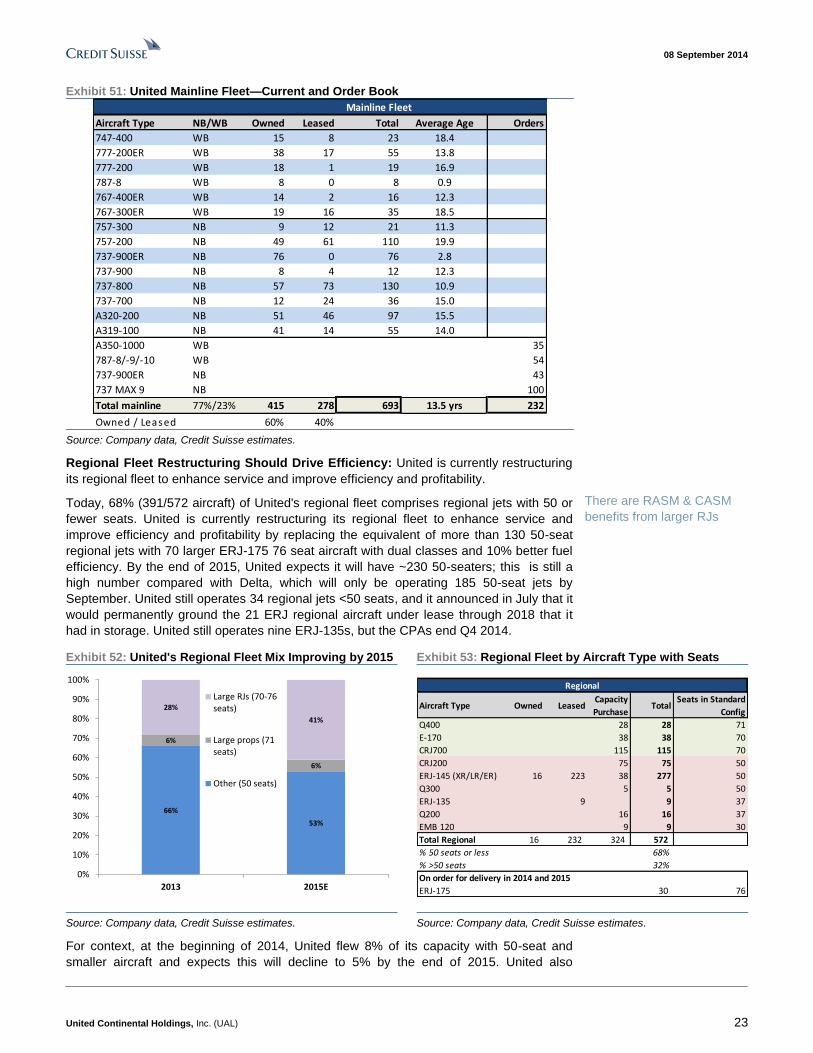
United is planning to retire older aircraft and keep the fleet count roughly flat at around 700
mainline aircraft, with the consolidated fleet flat as well between 1,250 and 1,300 aircraft.
The year-end 2014 fleet is targeted at 1,246 aircraft. The average age of the fleet in 2013
reached 13.5 years, and this should decline as new aircraft enter the fleet.
Exhibit 49: UAL New Aircraft Deliveries Expected to Drive
7% in Fuel Efficiency in 2017 versus 2013
Exhibit 50: UAL Fleet Flattish ~1250-1300 as New
Deliveries Replace Older Aircraft
17 13
29
23
2
9
6 20
14 6
-
10
20
30
40
50
60
2014 2015 2016 2017
E175s B737s B787s
697 710 701 702 693 690
556 552 555 551 572 556
0
200
400
600
800
1000
1200
1400
2009 2010 2011 2012 2013 2014
Mainline aircraft Regional aircraft
Source: Company data, Credit Suisse estimates. Source: Company data, Credit Suisse estimates.
Aircraft Capex Two-Thirds of Total Capital Expenditures: Aircraft replacement capital
expenditures are forecast to be in the range of $1.80-1.95B over the 2014-17 planning
horizon, but this may decline if United is successful in accessing the used aircraft market.
Aircraft capex represents about two-thirds of total capital expenditures, which are
expected in the range of $2.80-3.0B in 2014-17. Management is targeting consistent
aircraft investment rather than the large cyclical aircraft orders seen in historical cycles,
with the goal of improving earnings, cash flow, and ROIC.
A few years ago, United made the decision to defer $3B in capital expenditures to replace
its aging A319/A320 fleet by installing slimline seats, larger overhead bins, satellite Wi-Fi,
and streaming video. It is also retrofitting all of its existing 737 aircraft with split scimitar
winglets that should provide an incremental 2% of fuel savings, and the company is
anticipating to have these installed on over 80 aircraft by the end of this year.
In Exhibit 51, we layout United's current mainline fleet and aircraft on order.
United's new aircraft order
book is replacing older, less
fuel-efficient aircraft and is a
significant contributor to its
cost-savings targets
Aircraft replacement capex
is expected to be
~$1.80-1.95B in 2014-17,
representing two-thirds of
total capex and 7% of sales
08 September 2014
United Continental Holdings, Inc. (UAL) 23
Exhibit 51: United Mainline Fleet—Current and Order Book
Mainline Fleet
Aircraft Type NB/WB Owned Leased Total Average Age Orders
747-400 WB 15 8 23 18.4
777-200ER WB 38 17 55 13.8
777-200 WB 18 1 19 16.9
787-8 WB 8 0 8 0.9
767-400ER WB 14 2 16 12.3
767-300ER WB 19 16 35 18.5
757-300 NB 9 12 21 11.3
757-200 NB 49 61 110 19.9
737-900ER NB 76 0 76 2.8
737-900 NB 8 4 12 12.3
737-800 NB 57 73 130 10.9
737-700 NB 12 24 36 15.0
A320-200 NB 51 46 97 15.5
A319-100 NB 41 14 55 14.0
A350-1000 WB 35
787-8/-9/-10 WB 54
737-900ER NB 43
737 MAX 9 NB 100
Total mainline 77%/23% 415 278 693 13.5 yrs 232
Owned / Leased 60% 40% Source: Company data, Credit Suisse estimates.
Regional Fleet Restructuring Should Drive Efficiency: United is currently restructuring
its regional fleet to enhance service and improve efficiency and profitability.
Today, 68% (391/572 aircraft) of United's regional fleet comprises regional jets with 50 or
fewer seats. United is currently restructuring its regional fleet to enhance service and
improve efficiency and profitability by replacing the equivalent of more than 130 50-seat
regional jets with 70 larger ERJ-175 76 seat aircraft with dual classes and 10% better fuel
efficiency. By the end of 2015, United expects it will have ~230 50-seaters; this is still a
high number compared with Delta, which will only be operating 185 50-seat jets by
September. United still operates 34 regional jets <50 seats, and it announced in July that it
would permanently ground the 21 ERJ regional aircraft under lease through 2018 that it
had in storage. United still operates nine ERJ-135s, but the CPAs end Q4 2014.
Exhibit 52: United's Regional Fleet Mix Improving by 2015 Exhibit 53: Regional Fleet by Aircraft Type with Seats
66%
53%
6%
6%
28%
41%
0%
10%
20%
30%
40%
50%
60%
70%
80%
90%
100%
2013 2015E
Large RJs (70-76seats)
Large props (71seats)
Other (50 seats)
Regional
Aircraft Type Owned LeasedCapacity
PurchaseTotal
Seats in Standard
Config
Q400 28 28 71
E-170 38 38 70
CRJ700 115 115 70
CRJ200 75 75 50
ERJ-145 (XR/LR/ER) 16 223 38 277 50
Q300 5 5 50
ERJ-135 9 9 37
Q200 16 16 37
EMB 120 9 9 30
Total Regional 16 232 324 572
% 50 seats or less 68%
% >50 seats 32%
On order for delivery in 2014 and 2015
ERJ-175 30 76
Source: Company data, Credit Suisse estimates. Source: Company data, Credit Suisse estimates.
For context, at the beginning of 2014, United flew 8% of its capacity with 50-seat and
smaller aircraft and expects this will decline to 5% by the end of 2015. United also
There are RASM & CASM
benefits from larger RJs
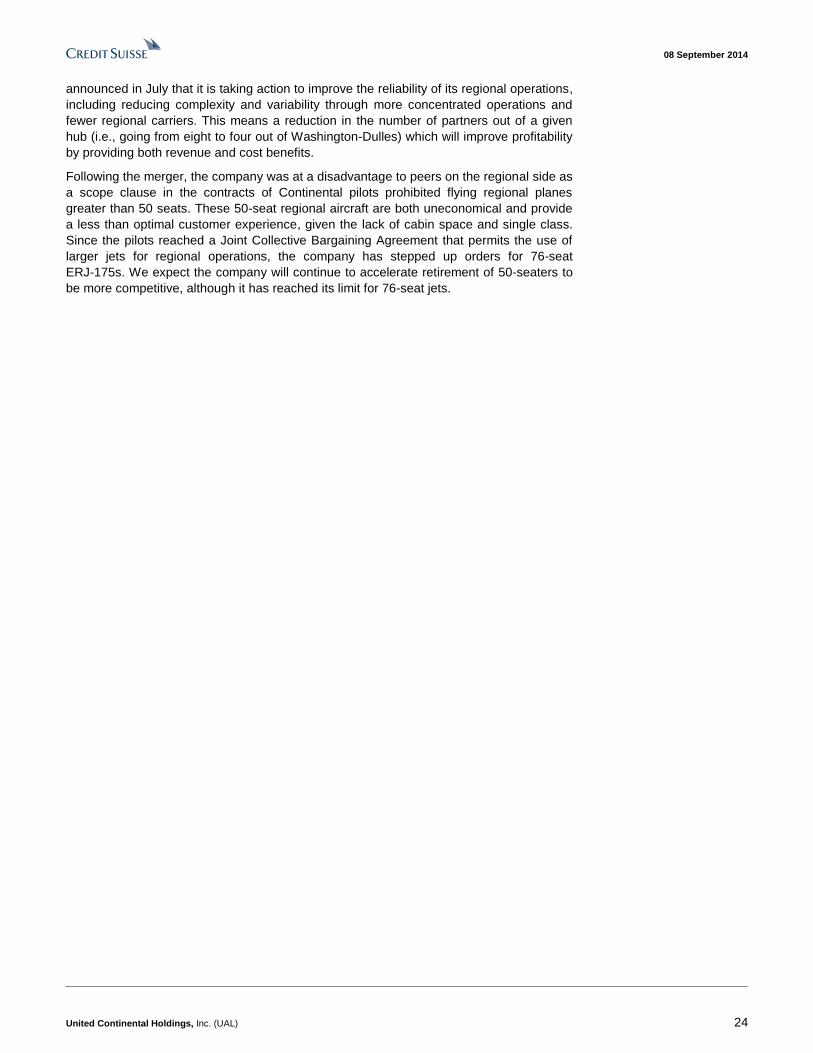
08 September 2014
United Continental Holdings, Inc. (UAL) 24
announced in July that it is taking action to improve the reliability of its regional operations,
including reducing complexity and variability through more concentrated operations and
fewer regional carriers. This means a reduction in the number of partners out of a given
hub (i.e., going from eight to four out of Washington-Dulles) which will improve profitability
by providing both revenue and cost benefits.
Following the merger, the company was at a disadvantage to peers on the regional side as
a scope clause in the contracts of Continental pilots prohibited flying regional planes
greater than 50 seats. These 50-seat regional aircraft are both uneconomical and provide
a less than optimal customer experience, given the lack of cabin space and single class.
Since the pilots reached a Joint Collective Bargaining Agreement that permits the use of
larger jets for regional operations, the company has stepped up orders for 76-seat
ERJ-175s. We expect the company will continue to accelerate retirement of 50-seaters to
be more competitive, although it has reached its limit for 76-seat jets.
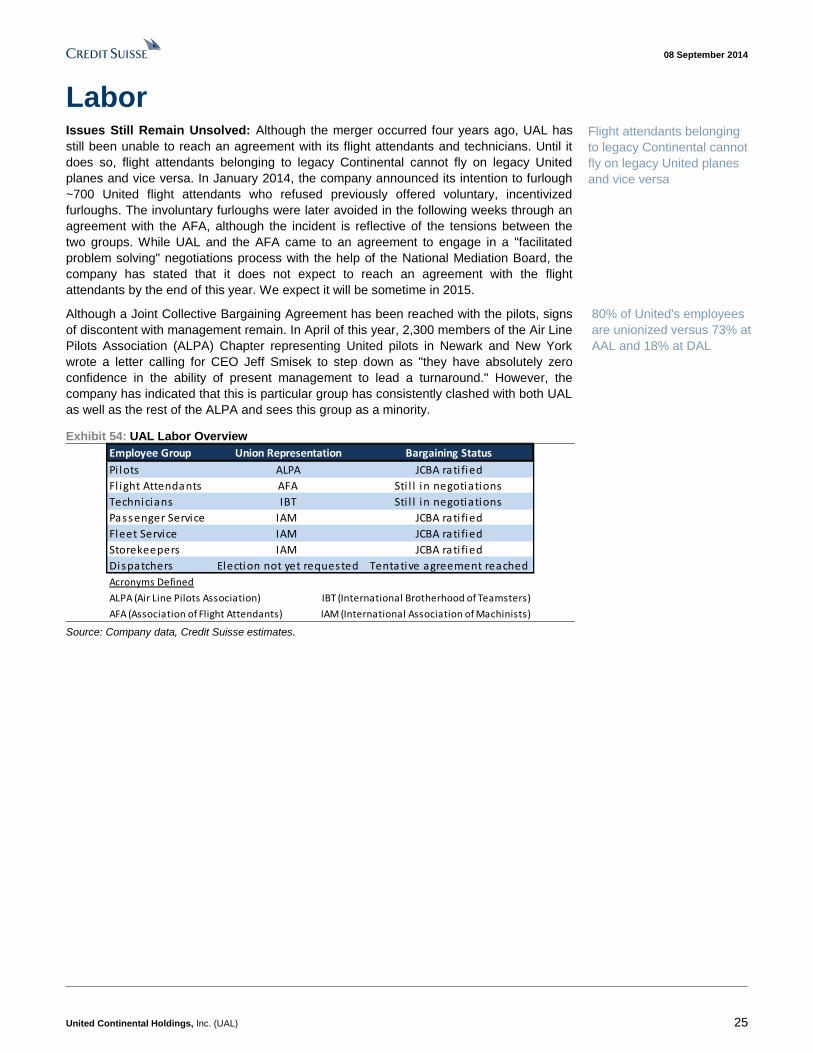
08 September 2014
United Continental Holdings, Inc. (UAL) 25
Labor Issues Still Remain Unsolved: Although the merger occurred four years ago, UAL has
still been unable to reach an agreement with its flight attendants and technicians. Until it
does so, flight attendants belonging to legacy Continental cannot fly on legacy United
planes and vice versa. In January 2014, the company announced its intention to furlough
~700 United flight attendants who refused previously offered voluntary, incentivized
furloughs. The involuntary furloughs were later avoided in the following weeks through an
agreement with the AFA, although the incident is reflective of the tensions between the
two groups. While UAL and the AFA came to an agreement to engage in a "facilitated
problem solving" negotiations process with the help of the National Mediation Board, the
company has stated that it does not expect to reach an agreement with the flight
attendants by the end of this year. We expect it will be sometime in 2015.
Although a Joint Collective Bargaining Agreement has been reached with the pilots, signs
of discontent with management remain. In April of this year, 2,300 members of the Air Line
Pilots Association (ALPA) Chapter representing United pilots in Newark and New York
wrote a letter calling for CEO Jeff Smisek to step down as "they have absolutely zero
confidence in the ability of present management to lead a turnaround." However, the
company has indicated that this is particular group has consistently clashed with both UAL
as well as the rest of the ALPA and sees this group as a minority.
Exhibit 54: UAL Labor Overview
Employee Group Union Representation Bargaining Status
Pi lots ALPA JCBA rati fied
Fl ight Attendants AFA Sti l l in negotiations
Technicians IBT Sti l l in negotiations
Passenger Service IAM JCBA rati fied
Fleet Service IAM JCBA rati fied
Storekeepers IAM JCBA rati fied
Dispatchers Election not yet requested Tentative agreement reached
Acronyms Defined
ALPA (Air Line Pilots Association) IBT (International Brotherhood of Teamsters)
AFA (Association of Flight Attendants) IAM (International Association of Machinists) Source: Company data, Credit Suisse estimates.
Flight attendants belonging
to legacy Continental cannot
fly on legacy United planes
and vice versa
80% of United's employees
are unionized versus 73% at
AAL and 18% at DAL
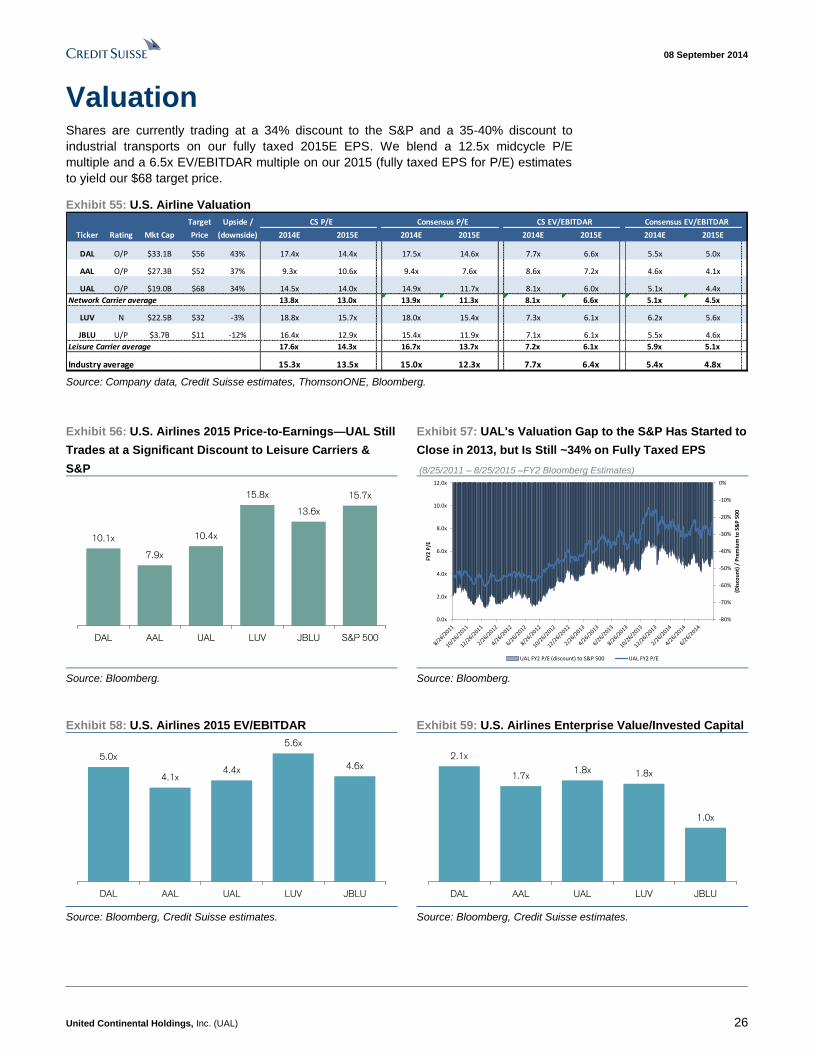
08 September 2014
United Continental Holdings, Inc. (UAL) 26
Valuation Shares are currently trading at a 34% discount to the S&P and a 35-40% discount to
industrial transports on our fully taxed 2015E EPS. We blend a 12.5x midcycle P/E
multiple and a 6.5x EV/EBITDAR multiple on our 2015 (fully taxed EPS for P/E) estimates
to yield our $68 target price.
Exhibit 55: U.S. Airline Valuation
Target Upside / CS P/E Consensus P/E CS EV/EBITDAR Consensus EV/EBITDAR
Ticker Rating Mkt Cap Price (downside) 2014E 2015E 2014E 2015E 2014E 2015E 2014E 2015E
DAL O/P $33.1B $56 43% 17.4x 14.4x 17.5x 14.6x 7.7x 6.6x 5.5x 5.0x
AAL O/P $27.3B $52 37% 9.3x 10.6x 9.4x 7.6x 8.6x 7.2x 4.6x 4.1x
UAL O/P $19.0B $68 34% 14.5x 14.0x 14.9x 11.7x 8.1x 6.0x 5.1x 4.4x
Network Carrier average 13.8x 13.0x 13.9x 11.3x 8.1x 6.6x 5.1x 4.5x
LUV N $22.5B $32 -3% 18.8x 15.7x 18.0x 15.4x 7.3x 6.1x 6.2x 5.6x
JBLU U/P $3.7B $11 -12% 16.4x 12.9x 15.4x 11.9x 7.1x 6.1x 5.5x 4.6x
Leisure Carrier average 17.6x 14.3x 16.7x 13.7x 7.2x 6.1x 5.9x 5.1x
Industry average 15.3x 13.5x 15.0x 12.3x 7.7x 6.4x 5.4x 4.8x Source: Company data, Credit Suisse estimates, ThomsonONE, Bloomberg.
Exhibit 56: U.S. Airlines 2015 Price-to-Earnings—UAL Still
Trades at a Significant Discount to Leisure Carriers &
S&P
Exhibit 57: UAL's Valuation Gap to the S&P Has Started to
Close in 2013, but Is Still ~34% on Fully Taxed EPS
(8/25/2011 – 8/25/2015 –FY2 Bloomberg Estimates)
10.1x
7.9x
10.4x
15.8x
13.6x
15.7x
DAL AAL UAL LUV JBLU S&P 500
-80%
-70%
-60%
-50%
-40%
-30%
-20%
-10%
0%
0.0x
2.0x
4.0x
6.0x
8.0x
10.0x
12.0x
(Dis
cou
nt)
/ P
rem
ium
to
S&
P 5
00
FY2
P/E
UAL FY2 P/E (discount) to S&P 500 UAL FY2 P/E
Source: Bloomberg. Source: Bloomberg.
Exhibit 58: U.S. Airlines 2015 EV/EBITDAR Exhibit 59: U.S. Airlines Enterprise Value/Invested Capital
5.0x
4.1x4.4x
5.6x
4.6x
DAL AAL UAL LUV JBLU
2.1x
1.7x1.8x 1.8x
1.0x
DAL AAL UAL LUV JBLU
Source: Bloomberg, Credit Suisse estimates. Source: Bloomberg, Credit Suisse estimates.
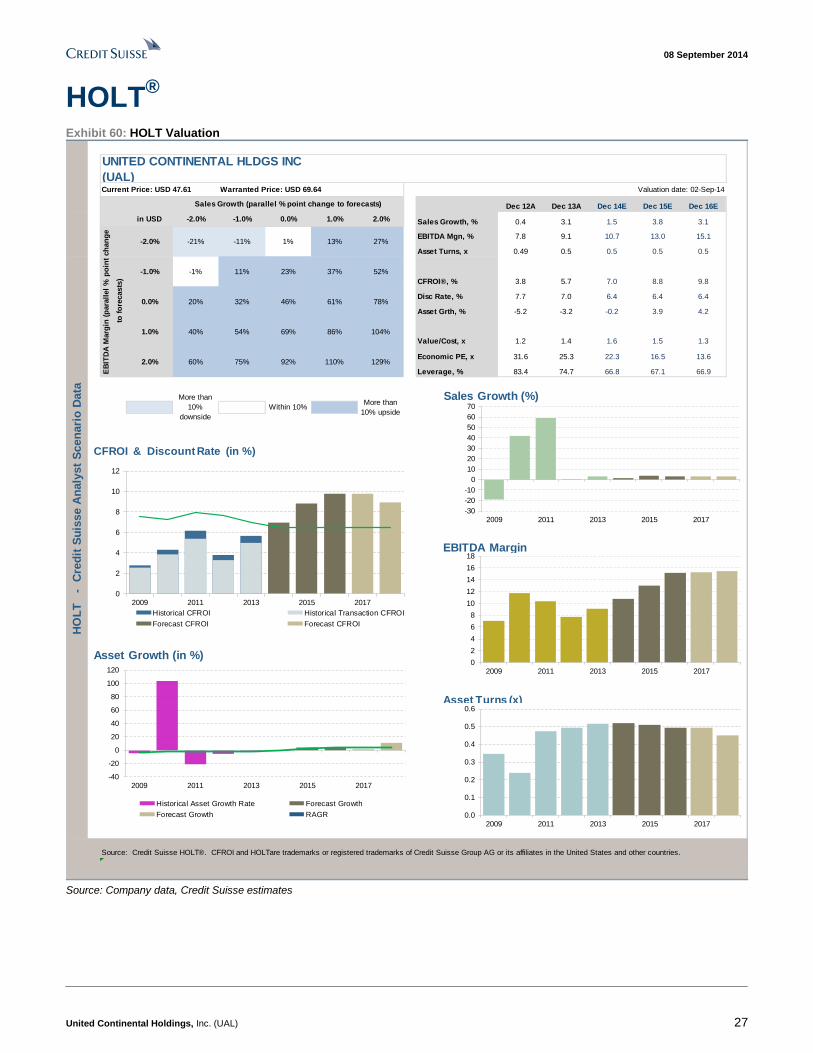
08 September 2014
United Continental Holdings, Inc. (UAL) 27
HOLT®
Exhibit 60: HOLT Valuation
Current Price: USD 47.61 Warranted Price: USD 69.64 Valuation date: 02-Sep-14
Sales Growth (parallel % point change to forecasts) Dec 12A Dec 13A Dec 14E Dec 15E Dec 16E
in USD -2.0% -1.0% 0.0% 1.0% 2.0% Sales Growth, % 0.4 3.1 1.5 3.8 3.1
EBITDA Mgn, % 7.8 9.1 10.7 13.0 15.1
Asset Turns, x 0.49 0.5 0.5 0.5 0.5
CFROI®, % 3.8 5.7 7.0 8.8 9.8
Disc Rate, % 7.7 7.0 6.4 6.4 6.4
Asset Grth, % -5.2 -3.2 -0.2 3.9 4.2
Value/Cost, x 1.2 1.4 1.6 1.5 1.3
Economic PE, x 31.6 25.3 22.3 16.5 13.6
Leverage, % 83.4 74.7 66.8 67.1 66.9
More than
10%
downside
Within 10%More than
10% upside
Source: Credit Suisse HOLT®. CFROI and HOLTare trademarks or registered trademarks of Credit Suisse Group AG or its affiliates in the United States and other countries.
129%
1.0% 40% 54% 69% 86% 104%
2.0% 60% 75% 92% 110%
37% 52%
0.0% 20% 32% 46% 61%
HO
LT
-
C
red
it S
uis
se A
naly
st
Scen
ari
o D
ata
UNITED CONTINENTAL HLDGS INC
(UAL)
EB
ITD
A M
arg
in (
para
llel
% p
oin
t ch
an
ge
to f
ore
casts
)
-2.0% -21% -11% 1% 13%
78%
27%
-1.0% -1% 11% 23%
-30
-20
-10
0
10
20
30
40
50
60
70
2009 2011 2013 2015 2017
Sales Growth (%)
0
2
4
6
8
10
12
14
16
18
2009 2011 2013 2015 2017
EBITDA Margin
0.0
0.1
0.2
0.3
0.4
0.5
0.6
2009 2011 2013 2015 2017
Asset Turns (x)
0
2
4
6
8
10
12
2009 2011 2013 2015 2017
Historical CFROI Historical Transaction CFROI
Forecast CFROI Forecast CFROI
CFROI & Discount Rate (in %)
-40
-20
0
20
40
60
80
100
120
2009 2011 2013 2015 2017
Historical Asset Growth Rate Forecast Growth
Forecast Growth RAGR
Asset Growth (in %)
Source: Company data, Credit Suisse estimates

08 September 2014
United Continental Holdings, Inc. (UAL) 28
Credit Suisse forecasts through the HOLT® framework: HOLT runs a CFROI®
valuation methodology that adjusts for accounting, inflation and asset life distortions to
forecast economic cash flows. We input our forecasts into HOLT to review fundamental
drivers (i.e. returns, growth, life cycle). Incorporating our assumptions, CFROI is
forecasted to improve above cost of capital to earn a positive economic spread
(CFROI>Discount Rate) in 2014, reaching 10% by 2016, as shown by the brown bars in
the CFROI and Discount Rate chart in Exhibit 60. The current price implies a longer term
CFROI of 7.7%, meaning our estimates warrant healthy upside, with a valuation of $69.64.
We have used the HOLT default company specific (real) discount rate of 6.4% in this
analysis. In Exhibit 61 we use the HOLT framework to gage market expectations of
EBITDA margins. We assume consensus Sales Growth to 2016 then hold flat. We use
consensus EBITDA margins to 2015, then solve for the level of EBITDA margins longer
term that results in the current share price. While the market is pricing in a level of margin
expansion in 2016, there is no improvement beyond this priced in, which is very
conservative, in our view.
Exhibit 61: HOLT – Market Implied EBITDA margins
Source: Company data, Credit Suisse estimates
08 September 2014
United Continental Holdings, Inc. (UAL) 29
Investment Risks ■ Fuel Price Volatility: Fuel is UAL's largest operating expense at 33% of 2013
operating expenses. Aircraft fuel prices fluctuate on a number of factors including
supply/demand balance, inventory levels, geopolitical events, economic outlooks, and
fiscal/monetary policies. Given the competitive nature of the industry, United Airlines
may not be able to pass future fuel price costs to customers. Furthermore, passengers
frequently book flights in advance, thus fuel price increases occurring after the ticket
purchase date must be incurred by the airline. Volatility in fuel costs could adversely
affect UAL's operations, and UAL is only partially hedged (21% for the remainder of
2014 and 19% for 2015).
■ Economic Fluctuations: Given that consumer demand for travel is fairly elastic, any
economic uncertainty or downturn in the macro environment could jeopardize leisure
traffic. Corporate spending on business travelers would also decline in a recession,
which would further compress margins as business travelers pay higher fares. The
carrier is running at record load factors relative to history, and any economic weakness
would likely negatively affect loads and pricing.
■ Risk of Unexpected, Public Event: Any terrorist attack or threat, epidemic, or natural
disaster (real or perceived) would significantly reduce demand for air travel and would
significantly affect United's operations. Similarly, an accident or crash on any flight,
irrespective of its operator, would create the perception that aircraft travel is dangerous
and would also negatively affect passenger traffic.
■ Significant Leverage: As of 2Q 2014, UAL had $18B of total debt, including
capitalized leases and capitalized aircraft rent. While this has declined from >$22B in
2010, any failure to meet its interest obligations or covenants would adversely affect its
operations and liquidity. Net lease-adjusted debt/total net capitalization was 79% as of
Q2, and the net lease-adjusted debt/LTM EBITDA ratio was 2.9x.
■ Integration Risk: Although United Airlines and Continental merged in 2010, the
company still has to reach an agreement with flight attendants and mechanics, as well
as resolve tensions between management and its existing labor force. Also, following
severe weather issues in Q1 2014, UAL acknowledged it that is still operating a
number of parallel systems and processes; these are lingering from the merger and are
driving inefficiencies and costs.
■ Excess Capacity Growth: Historically, airlines have competed for market share by
competing on price and increasing capacity, which ultimately resulted in major
bankruptcies and subsequent consolidation. Much of the recent positive stock
performance and financial stability in the sector has been attributed to capacity
discipline by all of the top carriers. If management teams were to once again flood the
market with capacity, industry profitability would likely suffer. United has a stated goal
of keeping capacity growth below GDP over the next three years, and it reduced initial
capacity plans for 2014 in response to demand signals, demonstrating its commitment
to capacity discipline.
■ Unionized Labor Force: Of UAL's 87,000 employees, 80% are unionized. Employee
strikes or slowdowns could negatively impact UAL operations. UAL still needs to
negotiate joint collective bargaining agreements with two groups (flight attendants and
mechanics) to complete merger integration and fully reap synergies. A failure to reach
an agreement would increase costs.
■ Airlines are a Highly Competitive Industry: With consolidation in the U.S. among
network carriers, the differentiation between routes/networks has lessened. Network
carriers are aggressively pursuing corporate travel share and control of certain markets,
which could lead to price competition. Also, as ultra-low-cost and low-cost carriers
pursue aggressive growth plans, established carriers could be at risk of market share

08 September 2014
United Continental Holdings, Inc. (UAL) 30
erosion to low-cost carriers, particularly in leisure markets. Furthermore, well-funded
Middle Eastern airlines are competing with network carriers internationally and are
attempting to enter the U.S. market. Excess capacity from Chinese carriers is
pressuring yields in Asia, where United has more exposure than peers.
■ Pension: As of 2Q 2014, UAL has a unfunded pension status of $1.59B. UAL must
make minimum funding requirements annually, and estimates of pension funding are
often inaccurate, which could potentially affect UAL's funding obligations.
■ Government Regulation and Fees: The airline industry is heavily regulated, and new
or unexpected regulations may increase the company's operating costs. Future
legislation mandating fuel- and noise-efficient planes would also cause United to incur
additional operating expenses. Additionally, taxes and fees are high and elevate the
total ticket price that customers pay. Most recently, the Transportation Security
Administration hiked fees, which could negatively affect leisure travel demand.

08 September 2014
United Continental Holdings, Inc. (UAL) 31
Management Senior Management Profiles and Board
■ Jeffery Smisek—President & Chief Executive Officer: Mr. Smisek assumed this
role upon the completion of the merger in 2010, previously holding the CEO position at
Continental Airlines. Mr. Smisek joined Continental in 1995 as senior VP and general
counsel, becoming a director and president of the company in 2004 and COO of the
airline in 2008. He attended Princeton University and Harvard Law School.
■ John Rainey—Chief Financial Officer: Mr. Rainey has held this position since the
merger in 2010. He was the VP of financial planning and analysis for Continental
Airlines from 2005 to 2010 and has held various finance and analysis positions at the
company. Prior to Continental, Mr. Rainey spent two years with Ernst & Young. He
received his bachelor's degree as well as MBA from Baylor University.
■ James Compton—Vice Chairman and Chief Revenue Officer: Mr. Compton is
responsible for the company's corporate development, pricing and revenue
management, and network planning. He was previously Continental's chief marketing
officer. Since joining Continental in 1995, he also served as senior director of pricing
and senior VP of marketing, launching EliteAccess. Prior to Continental, Mr. Compton
worked in systems development and business planning at United Parcel Service of
America and was the manager of forecasting and revenue analysis for United Airlines
from 1984 to 1993. He attended the University of Illinois, Chicago.
■ Gregory Hart—Chief Operating Officer: Mr. Hart has been the company's chief
operating officer since December 2013, succeeding Pete McDonald who retired. Prior
to that, he served as senior VP of technical operations from 2010 to 2013. Prior to
that, he was the VP of network strategy for Continental from 2008 to 2010. He joined
Continental in 1997 and has been the VP of domestic scheduling as well as managing
director of corporate development. Mr. Hart attended the University of Wisconsin and
received an MBA from Cornell University.
■ Robert Edwards—Chief Information Officer: Mr. Edwards has over 30 years of
experience in the transportation industry, joining Continental Airlines in 1979. He has
held various management roles in cargo, airport services, flight operations, and
technology, developing technology solutions for the airline in 1989. He attended the
University of Missouri, Kansas City and El Camino College.
Exhibit 62: Key Compensation Components for Executive Compensation
Compensation Component Performance Measure
Base salary
Annual incentive awardsPre-tax income (80%)
Customer satisfaction (20%)
Long-term incentive awards:
Long-term Relative
Performance awardsPre-tax margin relative to industry peer group
Performance-based RSUsROIC of 10% (stretch goal is 100 bps higher)
Stock price performance over time
Restricted Share Awards Stock price performance over time
Source: 2013 Proxy.
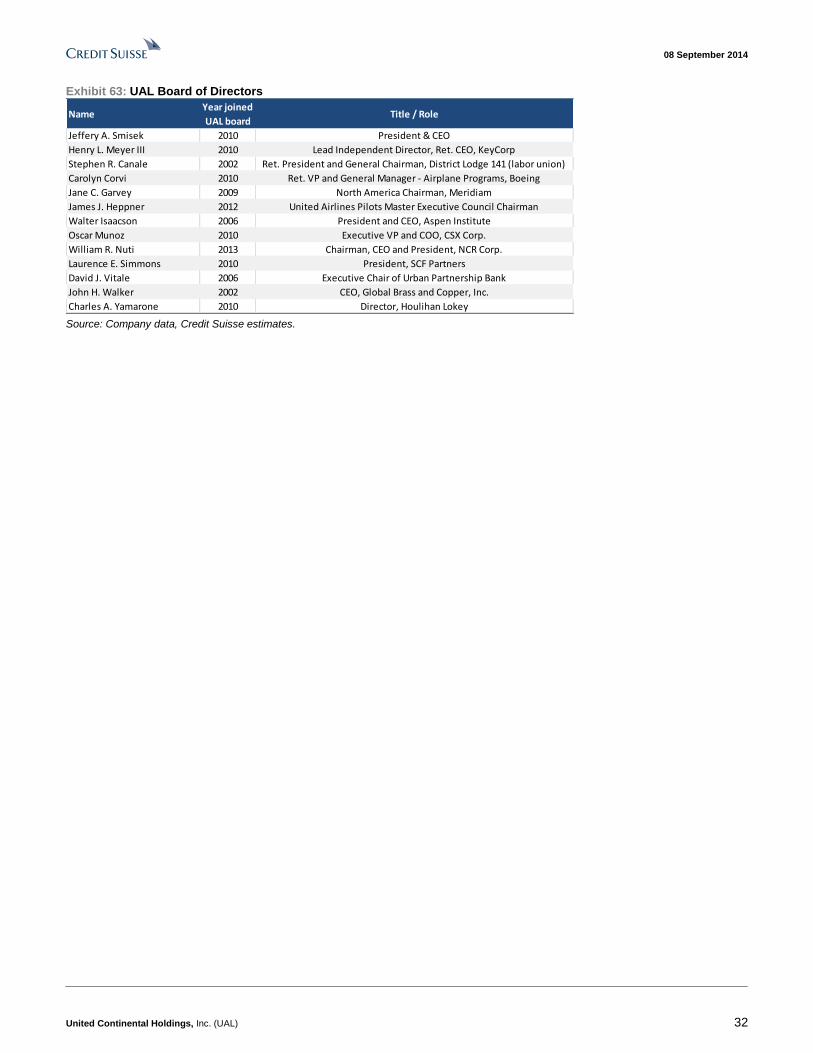
08 September 2014
United Continental Holdings, Inc. (UAL) 32
Exhibit 63: UAL Board of Directors
NameYear joined
UAL boardTitle / Role
Jeffery A. Smisek 2010 President & CEO
Henry L. Meyer III 2010 Lead Independent Director, Ret. CEO, KeyCorp
Stephen R. Canale 2002 Ret. President and General Chairman, District Lodge 141 (labor union)
Carolyn Corvi 2010 Ret. VP and General Manager - Airplane Programs, Boeing
Jane C. Garvey 2009 North America Chairman, Meridiam
James J. Heppner 2012 United Airlines Pilots Master Executive Council Chairman
Walter Isaacson 2006 President and CEO, Aspen Institute
Oscar Munoz 2010 Executive VP and COO, CSX Corp.
William R. Nuti 2013 Chairman, CEO and President, NCR Corp.
Laurence E. Simmons 2010 President, SCF Partners
David J. Vitale 2006 Executive Chair of Urban Partnership Bank
John H. Walker 2002 CEO, Global Brass and Copper, Inc.
Charles A. Yamarone 2010 Director, Houlihan Lokey Source: Company data, Credit Suisse estimates.
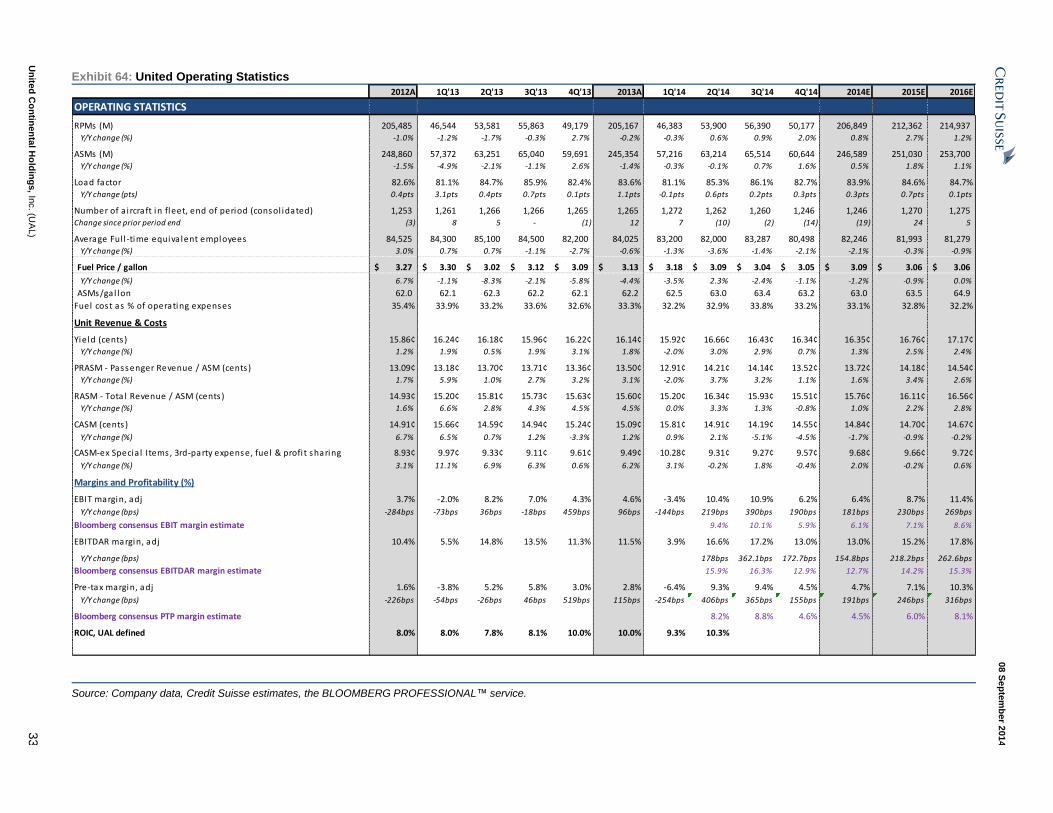
08 S
ep
tem
ber 2
01
4
Un
ited
Co
ntin
en
tal H
old
ing
s, In
c. (U
AL)
33
Exhibit 64: United Operating Statistics
2012A 1Q'13 2Q'13 3Q'13 4Q'13 2013A 1Q'14 2Q'14 3Q'14 4Q'14 2014E 2015E 2016E
OPERATING STATISTICS
RPMs (M) 205,485 46,544 53,581 55,863 49,179 205,167 46,383 53,900 56,390 50,177 206,849 212,362 214,937
Y/Y change (%) -1.0% -1.2% -1.7% -0.3% 2.7% -0.2% -0.3% 0.6% 0.9% 2.0% 0.8% 2.7% 1.2%
ASMs (M) 248,860 57,372 63,251 65,040 59,691 245,354 57,216 63,214 65,514 60,644 246,589 251,030 253,700 Y/Y change (%) -1.5% -4.9% -2.1% -1.1% 2.6% -1.4% -0.3% -0.1% 0.7% 1.6% 0.5% 1.8% 1.1%
Load factor 82.6% 81.1% 84.7% 85.9% 82.4% 83.6% 81.1% 85.3% 86.1% 82.7% 83.9% 84.6% 84.7%
Y/Y change (pts) 0.4pts 3.1pts 0.4pts 0.7pts 0.1pts 1.1pts -0.1pts 0.6pts 0.2pts 0.3pts 0.3pts 0.7pts 0.1pts
Number of a i rcraft in fleet, end of period (consol idated) 1,253 1,261 1,266 1,266 1,265 1,265 1,272 1,262 1,260 1,246 1,246 1,270 1,275 Change since prior period end (3) 8 5 - (1) 12 7 (10) (2) (14) (19) 24 5
Average Ful l -time equiva lent employees 84,525 84,300 85,100 84,500 82,200 84,025 83,200 82,000 83,287 80,498 82,246 81,993 81,279
Y/Y change (%) 3.0% 0.7% 0.7% -1.1% -2.7% -0.6% -1.3% -3.6% -1.4% -2.1% -2.1% -0.3% -0.9%
Fuel Price / gallon 3.27$ 3.30$ 3.02$ 3.12$ 3.09$ 3.13$ 3.18$ 3.09$ 3.04$ 3.05$ 3.09$ 3.06$ 3.06$
Y/Y change (%) 6.7% -1.1% -8.3% -2.1% -5.8% -4.4% -3.5% 2.3% -2.4% -1.1% -1.2% -0.9% 0.0%
ASMs/gal lon 62.0 62.1 62.3 62.2 62.1 62.2 62.5 63.0 63.4 63.2 63.0 63.5 64.9
Fuel cost as % of operating expenses 35.4% 33.9% 33.2% 33.6% 32.6% 33.3% 32.2% 32.9% 33.8% 33.2% 33.1% 32.8% 32.2%
Unit Revenue & Costs
Yield (cents ) 15.86¢ 16.24¢ 16.18¢ 15.96¢ 16.22¢ 16.14¢ 15.92¢ 16.66¢ 16.43¢ 16.34¢ 16.35¢ 16.76¢ 17.17¢
Y/Y change (%) 1.2% 1.9% 0.5% 1.9% 3.1% 1.8% -2.0% 3.0% 2.9% 0.7% 1.3% 2.5% 2.4%
PRASM - Passenger Revenue / ASM (cents ) 13.09¢ 13.18¢ 13.70¢ 13.71¢ 13.36¢ 13.50¢ 12.91¢ 14.21¢ 14.14¢ 13.52¢ 13.72¢ 14.18¢ 14.54¢
Y/Y change (%) 1.7% 5.9% 1.0% 2.7% 3.2% 3.1% -2.0% 3.7% 3.2% 1.1% 1.6% 3.4% 2.6%
RASM - Tota l Revenue / ASM (cents ) 14.93¢ 15.20¢ 15.81¢ 15.73¢ 15.63¢ 15.60¢ 15.20¢ 16.34¢ 15.93¢ 15.51¢ 15.76¢ 16.11¢ 16.56¢
Y/Y change (%) 1.6% 6.6% 2.8% 4.3% 4.5% 4.5% 0.0% 3.3% 1.3% -0.8% 1.0% 2.2% 2.8%
CASM (cents ) 14.91¢ 15.66¢ 14.59¢ 14.94¢ 15.24¢ 15.09¢ 15.81¢ 14.91¢ 14.19¢ 14.55¢ 14.84¢ 14.70¢ 14.67¢
Y/Y change (%) 6.7% 6.5% 0.7% 1.2% -3.3% 1.2% 0.9% 2.1% -5.1% -4.5% -1.7% -0.9% -0.2%
CASM-ex Specia l Items, 3rd-party expense, fuel & profi t sharing 8.93¢ 9.97¢ 9.33¢ 9.11¢ 9.61¢ 9.49¢ 10.28¢ 9.31¢ 9.27¢ 9.57¢ 9.68¢ 9.66¢ 9.72¢
Y/Y change (%) 3.1% 11.1% 6.9% 6.3% 0.6% 6.2% 3.1% -0.2% 1.8% -0.4% 2.0% -0.2% 0.6%
Margins and Profitability (%)
EBIT margin, adj 3.7% -2.0% 8.2% 7.0% 4.3% 4.6% -3.4% 10.4% 10.9% 6.2% 6.4% 8.7% 11.4%
Y/Y change (bps) -284bps -73bps 36bps -18bps 459bps 96bps -144bps 219bps 390bps 190bps 181bps 230bps 269bps
Bloomberg consensus EBIT margin estimate 9.4% 10.1% 5.9% 6.1% 7.1% 8.6%
EBITDAR margin, adj 10.4% 5.5% 14.8% 13.5% 11.3% 11.5% 3.9% 16.6% 17.2% 13.0% 13.0% 15.2% 17.8%
Y/Y change (bps) 178bps 362.1bps 172.7bps 154.8bps 218.2bps 262.6bps
Bloomberg consensus EBITDAR margin estimate 15.9% 16.3% 12.9% 12.7% 14.2% 15.3%
Pre-tax margin, adj 1.6% -3.8% 5.2% 5.8% 3.0% 2.8% -6.4% 9.3% 9.4% 4.5% 4.7% 7.1% 10.3%
Y/Y change (bps) -226bps -54bps -26bps 46bps 519bps 115bps -254bps 406bps 365bps 155bps 191bps 246bps 316bps
Bloomberg consensus PTP margin estimate 8.2% 8.8% 4.6% 4.5% 6.0% 8.1%
ROIC, UAL defined 8.0% 8.0% 7.8% 8.1% 10.0% 10.0% 9.3% 10.3%
Source: Company data, Credit Suisse estimates, the BLOOMBERG PROFESSIONAL™ service.
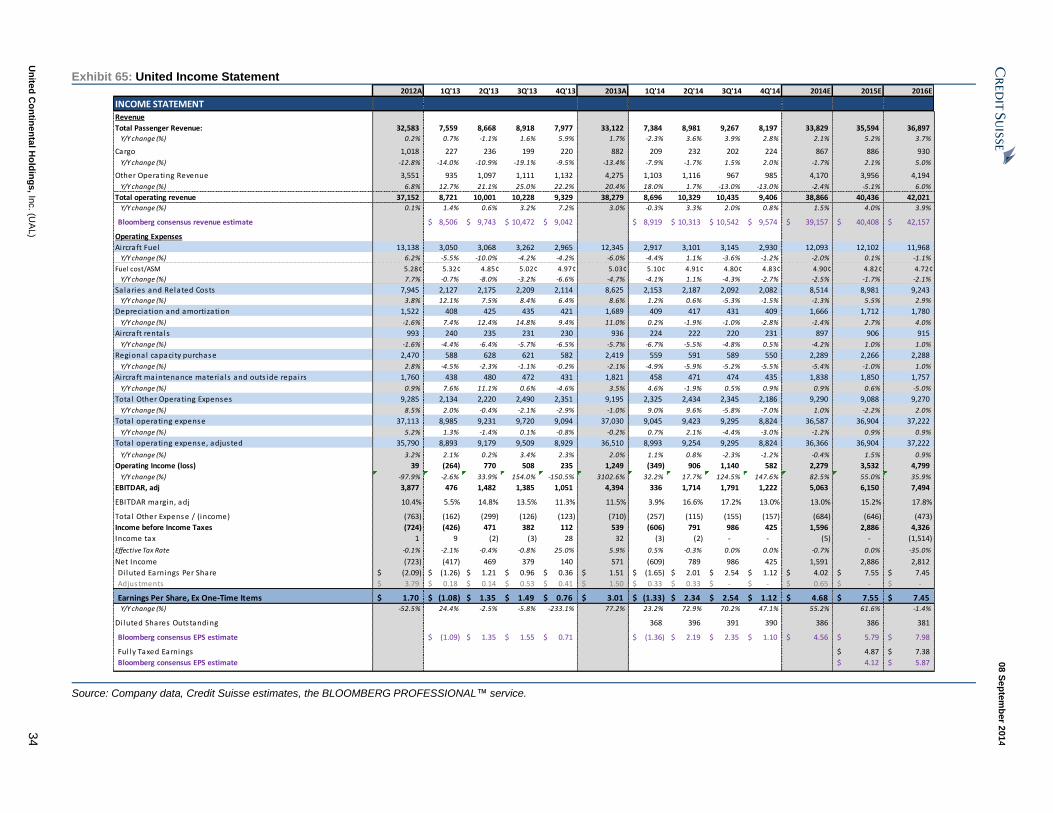
08 S
ep
tem
ber 2
01
4
Un
ited
Co
ntin
en
tal H
old
ing
s, In
c. (U
AL)
34
Exhibit 65: United Income Statement 2012A 1Q'13 2Q'13 3Q'13 4Q'13 2013A 1Q'14 2Q'14 3Q'14 4Q'14 2014E 2015E 2016E
INCOME STATEMENTRevenue
Total Passenger Revenue: 32,583 7,559 8,668 8,918 7,977 33,122 7,384 8,981 9,267 8,197 33,829 35,594 36,897
Y/Y change (%) 0.2% 0.7% -1.1% 1.6% 5.9% 1.7% -2.3% 3.6% 3.9% 2.8% 2.1% 5.2% 3.7%
Cargo 1,018 227 236 199 220 882 209 232 202 224 867 886 930
Y/Y change (%) -12.8% -14.0% -10.9% -19.1% -9.5% -13.4% -7.9% -1.7% 1.5% 2.0% -1.7% 2.1% 5.0%
Other Operating Revenue 3,551 935 1,097 1,111 1,132 4,275 1,103 1,116 967 985 4,170 3,956 4,194
Y/Y change (%) 6.8% 12.7% 21.1% 25.0% 22.2% 20.4% 18.0% 1.7% -13.0% -13.0% -2.4% -5.1% 6.0%
Total operating revenue 37,152 8,721 10,001 10,228 9,329 38,279 8,696 10,329 10,435 9,406 38,866 40,436 42,021
Y/Y change (%) 0.1% 1.4% 0.6% 3.2% 7.2% 3.0% -0.3% 3.3% 2.0% 0.8% 1.5% 4.0% 3.9%
Bloomberg consensus revenue estimate 8,506$ 9,743$ 10,472$ 9,042$ 8,919$ 10,313$ 10,542$ 9,574$ 39,157$ 40,408$ 42,157$
Operating Expenses
Aircraft Fuel 13,138 3,050 3,068 3,262 2,965 12,345 2,917 3,101 3,145 2,930 12,093 12,102 11,968
Y/Y change (%) 6.2% -5.5% -10.0% -4.2% -4.2% -6.0% -4.4% 1.1% -3.6% -1.2% -2.0% 0.1% -1.1%
Fuel cost/ASM 5.28¢ 5.32¢ 4.85¢ 5.02¢ 4.97¢ 5.03¢ 5.10¢ 4.91¢ 4.80¢ 4.83¢ 4.90¢ 4.82¢ 4.72¢
Y/Y change (%) 7.7% -0.7% -8.0% -3.2% -6.6% -4.7% -4.1% 1.1% -4.3% -2.7% -2.5% -1.7% -2.1%
Salaries and Related Costs 7,945 2,127 2,175 2,209 2,114 8,625 2,153 2,187 2,092 2,082 8,514 8,981 9,243
Y/Y change (%) 3.8% 12.1% 7.5% 8.4% 6.4% 8.6% 1.2% 0.6% -5.3% -1.5% -1.3% 5.5% 2.9%
Depreciation and amortization 1,522 408 425 435 421 1,689 409 417 431 409 1,666 1,712 1,780
Y/Y change (%) -1.6% 7.4% 12.4% 14.8% 9.4% 11.0% 0.2% -1.9% -1.0% -2.8% -1.4% 2.7% 4.0%
Aircraft renta ls 993 240 235 231 230 936 224 222 220 231 897 906 915
Y/Y change (%) -1.6% -4.4% -6.4% -5.7% -6.5% -5.7% -6.7% -5.5% -4.8% 0.5% -4.2% 1.0% 1.0%
Regional capaci ty purchase 2,470 588 628 621 582 2,419 559 591 589 550 2,289 2,266 2,288
Y/Y change (%) 2.8% -4.5% -2.3% -1.1% -0.2% -2.1% -4.9% -5.9% -5.2% -5.5% -5.4% -1.0% 1.0%
Aircraft maintenance materia ls and outs ide repairs 1,760 438 480 472 431 1,821 458 471 474 435 1,838 1,850 1,757
Y/Y change (%) 0.9% 7.6% 11.1% 0.6% -4.6% 3.5% 4.6% -1.9% 0.5% 0.9% 0.9% 0.6% -5.0%
Total Other Operating Expenses 9,285 2,134 2,220 2,490 2,351 9,195 2,325 2,434 2,345 2,186 9,290 9,088 9,270
Y/Y change (%) 8.5% 2.0% -0.4% -2.1% -2.9% -1.0% 9.0% 9.6% -5.8% -7.0% 1.0% -2.2% 2.0%
Total operating expense 37,113 8,985 9,231 9,720 9,094 37,030 9,045 9,423 9,295 8,824 36,587 36,904 37,222
Y/Y change (%) 5.2% 1.3% -1.4% 0.1% -0.8% -0.2% 0.7% 2.1% -4.4% -3.0% -1.2% 0.9% 0.9%
Total operating expense, adjusted 35,790 8,893 9,179 9,509 8,929 36,510 8,993 9,254 9,295 8,824 36,366 36,904 37,222
Y/Y change (%) 3.2% 2.1% 0.2% 3.4% 2.3% 2.0% 1.1% 0.8% -2.3% -1.2% -0.4% 1.5% 0.9%
Operating Income (loss) 39 (264) 770 508 235 1,249 (349) 906 1,140 582 2,279 3,532 4,799
Y/Y change (%) -97.9% -2.6% 33.9% 154.0% -150.5% 3102.6% 32.2% 17.7% 124.5% 147.6% 82.5% 55.0% 35.9%
EBITDAR, adj 3,877 476 1,482 1,385 1,051 4,394 336 1,714 1,791 1,222 5,063 6,150 7,494
EBITDAR margin, adj 10.4% 5.5% 14.8% 13.5% 11.3% 11.5% 3.9% 16.6% 17.2% 13.0% 13.0% 15.2% 17.8%
Total Other Expense / (income) (763) (162) (299) (126) (123) (710) (257) (115) (155) (157) (684) (646) (473)
Income before Income Taxes (724) (426) 471 382 112 539 (606) 791 986 425 1,596 2,886 4,326
Income tax 1 9 (2) (3) 28 32 (3) (2) - - (5) - (1,514)
Effective Tax Rate -0.1% -2.1% -0.4% -0.8% 25.0% 5.9% 0.5% -0.3% 0.0% 0.0% -0.7% 0.0% -35.0%
Net Income (723) (417) 469 379 140 571 (609) 789 986 425 1,591 2,886 2,812
Di luted Earnings Per Share (2.09)$ (1.26)$ 1.21$ 0.96$ 0.36$ 1.51$ (1.65)$ 2.01$ 2.54$ 1.12$ 4.02$ 7.55$ 7.45$
Adjustments 3.79$ 0.18$ 0.14$ 0.53$ 0.41$ 1.50$ 0.33$ 0.33$ -$ -$ 0.65$ -$ -$
Earnings Per Share, Ex One-Time Items 1.70$ (1.08)$ 1.35$ 1.49$ 0.76$ 3.01$ (1.33)$ 2.34$ 2.54$ 1.12$ 4.68$ 7.55$ 7.45$ Y/Y change (%) -52.5% 24.4% -2.5% -5.8% -233.1% 77.2% 23.2% 72.9% 70.2% 47.1% 55.2% 61.6% -1.4%
Di luted Shares Outstanding 368 396 391 390 386 386 381
Bloomberg consensus EPS estimate (1.09)$ 1.35$ 1.55$ 0.71$ (1.36)$ 2.19$ 2.35$ 1.10$ 4.56$ 5.79$ 7.98$
Ful ly Taxed Earnings 4.87$ 7.38$
Bloomberg consensus EPS estimate 4.12$ 5.87$
Source: Company data, Credit Suisse estimates, the BLOOMBERG PROFESSIONAL™ service.
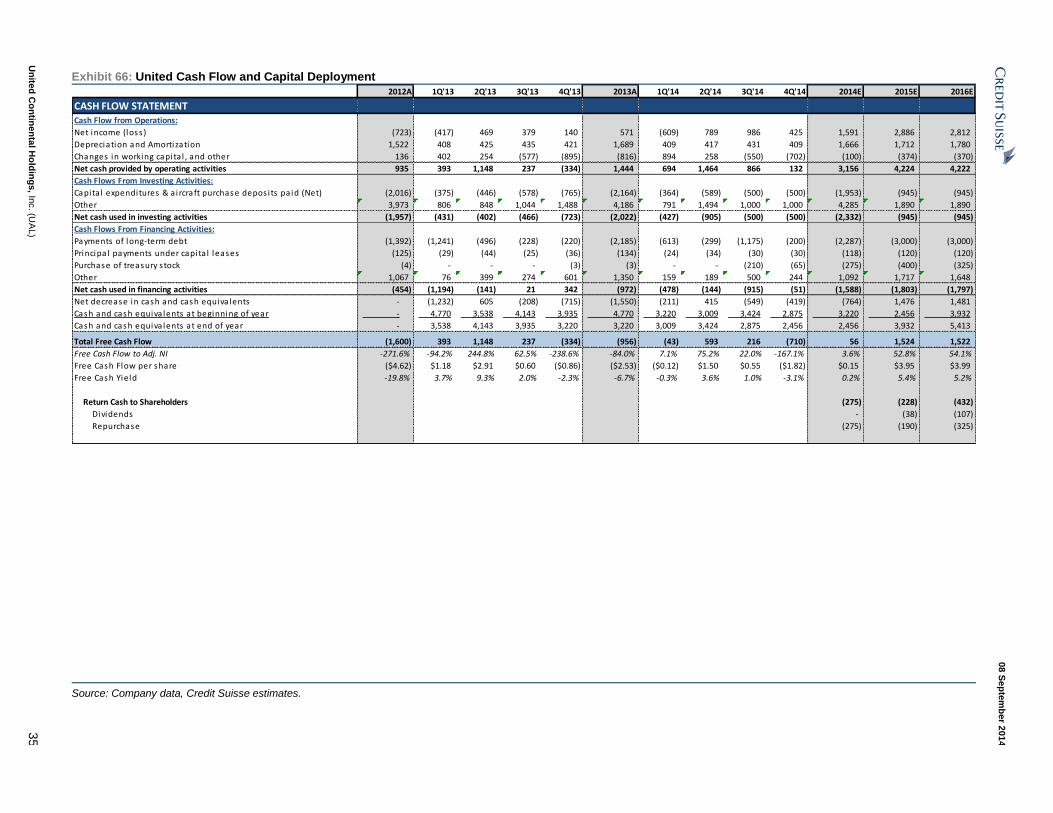
08 S
ep
tem
ber 2
01
4
Un
ited
Co
ntin
en
tal H
old
ing
s, In
c. (U
AL)
35
Exhibit 66: United Cash Flow and Capital Deployment 2012A 1Q'13 2Q'13 3Q'13 4Q'13 2013A 1Q'14 2Q'14 3Q'14 4Q'14 2014E 2015E 2016E
CASH FLOW STATEMENTCash Flow from Operations:
Net income (loss ) (723) (417) 469 379 140 571 (609) 789 986 425 1,591 2,886 2,812
Depreciation and Amortization 1,522 408 425 435 421 1,689 409 417 431 409 1,666 1,712 1,780
Changes in working capita l , and other 136 402 254 (577) (895) (816) 894 258 (550) (702) (100) (374) (370)
Net cash provided by operating activities 935 393 1,148 237 (334) 1,444 694 1,464 866 132 3,156 4,224 4,222
Cash Flows From Investing Activities:
Capita l expenditures & a ircraft purchase depos its pa id (Net) (2,016) (375) (446) (578) (765) (2,164) (364) (589) (500) (500) (1,953) (945) (945)
Other 3,973 806 848 1,044 1,488 4,186 791 1,494 1,000 1,000 4,285 1,890 1,890
Net cash used in investing activities (1,957) (431) (402) (466) (723) (2,022) (427) (905) (500) (500) (2,332) (945) (945)
Cash Flows From Financing Activities:
Payments of long-term debt (1,392) (1,241) (496) (228) (220) (2,185) (613) (299) (1,175) (200) (2,287) (3,000) (3,000)
Principal payments under capita l leases (125) (29) (44) (25) (36) (134) (24) (34) (30) (30) (118) (120) (120)
Purchase of treasury s tock (4) - - - (3) (3) - - (210) (65) (275) (400) (325)
Other 1,067 76 399 274 601 1,350 159 189 500 244 1,092 1,717 1,648
Net cash used in financing activities (454) (1,194) (141) 21 342 (972) (478) (144) (915) (51) (1,588) (1,803) (1,797)
Net decrease in cash and cash equiva lents - (1,232) 605 (208) (715) (1,550) (211) 415 (549) (419) (764) 1,476 1,481
Cash and cash equiva lents at beginning of year - 4,770 3,538 4,143 3,935 4,770 3,220 3,009 3,424 2,875 3,220 2,456 3,932
Cash and cash equiva lents at end of year - 3,538 4,143 3,935 3,220 3,220 3,009 3,424 2,875 2,456 2,456 3,932 5,413
Total Free Cash Flow (1,600) 393 1,148 237 (334) (956) (43) 593 216 (710) 56 1,524 1,522
Free Cash Flow to Adj. NI -271.6% -94.2% 244.8% 62.5% -238.6% -84.0% 7.1% 75.2% 22.0% -167.1% 3.6% 52.8% 54.1%
Free Cash Flow per share ($4.62) $1.18 $2.91 $0.60 ($0.86) ($2.53) ($0.12) $1.50 $0.55 ($1.82) $0.15 $3.95 $3.99
Free Cash Yield -19.8% 3.7% 9.3% 2.0% -2.3% -6.7% -0.3% 3.6% 1.0% -3.1% 0.2% 5.4% 5.2%
Return Cash to Shareholders (275) (228) (432)
Dividends - (38) (107)
Repurchase (275) (190) (325)
Source: Company data, Credit Suisse estimates.
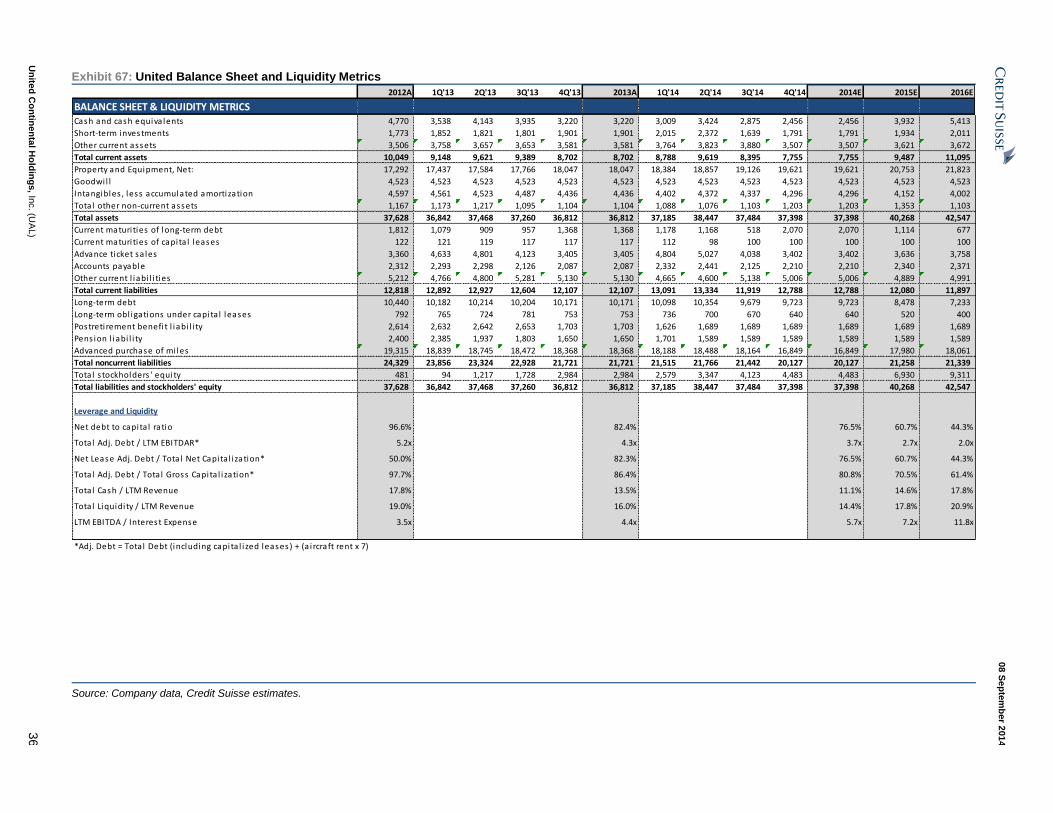
08 S
ep
tem
ber 2
01
4
Un
ited
Co
ntin
en
tal H
old
ing
s, In
c. (U
AL)
36
Exhibit 67: United Balance Sheet and Liquidity Metrics
2012A 1Q'13 2Q'13 3Q'13 4Q'13 2013A 1Q'14 2Q'14 3Q'14 4Q'14 2014E 2015E 2016E
BALANCE SHEET & LIQUIDITY METRICSCash and cash equiva lents 4,770 3,538 4,143 3,935 3,220 3,220 3,009 3,424 2,875 2,456 2,456 3,932 5,413
Short-term investments 1,773 1,852 1,821 1,801 1,901 1,901 2,015 2,372 1,639 1,791 1,791 1,934 2,011
Other current assets 3,506 3,758 3,657 3,653 3,581 3,581 3,764 3,823 3,880 3,507 3,507 3,621 3,672
Total current assets 10,049 9,148 9,621 9,389 8,702 8,702 8,788 9,619 8,395 7,755 7,755 9,487 11,095
Property and Equipment, Net: 17,292 17,437 17,584 17,766 18,047 18,047 18,384 18,857 19,126 19,621 19,621 20,753 21,823
Goodwi l l 4,523 4,523 4,523 4,523 4,523 4,523 4,523 4,523 4,523 4,523 4,523 4,523 4,523
Intangibles , less accumulated amortization 4,597 4,561 4,523 4,487 4,436 4,436 4,402 4,372 4,337 4,296 4,296 4,152 4,002
Total other non-current assets 1,167 1,173 1,217 1,095 1,104 1,104 1,088 1,076 1,103 1,203 1,203 1,353 1,103
Total assets 37,628 36,842 37,468 37,260 36,812 36,812 37,185 38,447 37,484 37,398 37,398 40,268 42,547
Current maturi ties of long-term debt 1,812 1,079 909 957 1,368 1,368 1,178 1,168 518 2,070 2,070 1,114 677
Current maturi ties of capita l leases 122 121 119 117 117 117 112 98 100 100 100 100 100
Advance ticket sa les 3,360 4,633 4,801 4,123 3,405 3,405 4,804 5,027 4,038 3,402 3,402 3,636 3,758
Accounts payable 2,312 2,293 2,298 2,126 2,087 2,087 2,332 2,441 2,125 2,210 2,210 2,340 2,371
Other current l iabi l i ties 5,212 4,766 4,800 5,281 5,130 5,130 4,665 4,600 5,138 5,006 5,006 4,889 4,991
Total current liabilities 12,818 12,892 12,927 12,604 12,107 12,107 13,091 13,334 11,919 12,788 12,788 12,080 11,897
Long-term debt 10,440 10,182 10,214 10,204 10,171 10,171 10,098 10,354 9,679 9,723 9,723 8,478 7,233
Long-term obl igations under capita l leases 792 765 724 781 753 753 736 700 670 640 640 520 400
Postreti rement benefi t l iabi l i ty 2,614 2,632 2,642 2,653 1,703 1,703 1,626 1,689 1,689 1,689 1,689 1,689 1,689
Pens ion l iabi l i ty 2,400 2,385 1,937 1,803 1,650 1,650 1,701 1,589 1,589 1,589 1,589 1,589 1,589
Advanced purchase of mi les 19,315 18,839 18,745 18,472 18,368 18,368 18,188 18,488 18,164 16,849 16,849 17,980 18,061
Total noncurrent liabilities 24,329 23,856 23,324 22,928 21,721 21,721 21,515 21,766 21,442 20,127 20,127 21,258 21,339
Total s tockholders ' equity 481 94 1,217 1,728 2,984 2,984 2,579 3,347 4,123 4,483 4,483 6,930 9,311
Total liabilities and stockholders' equity 37,628 36,842 37,468 37,260 36,812 36,812 37,185 38,447 37,484 37,398 37,398 40,268 42,547
Leverage and Liquidity
Net debt to capita l ratio 96.6% 82.4% 76.5% 60.7% 44.3%
Total Adj. Debt / LTM EBITDAR* 5.2x 4.3x 3.7x 2.7x 2.0x
Net Lease Adj. Debt / Total Net Capita l i zation* 50.0% 82.3% 76.5% 60.7% 44.3%
Total Adj. Debt / Total Gross Capita l i zation* 97.7% 86.4% 80.8% 70.5% 61.4%
Total Cash / LTM Revenue 17.8% 13.5% 11.1% 14.6% 17.8%
Total Liquidi ty / LTM Revenue 19.0% 16.0% 14.4% 17.8% 20.9%
LTM EBITDA / Interest Expense 3.5x 4.4x 5.7x 7.2x 11.8x
*Adj. Debt = Total Debt (including capita l i zed leases) + (a i rcraft rent x 7)
Source: Company data, Credit Suisse estimates.
08 September 2014
United Continental Holdings, Inc. (UAL) 37
Appendix – About HOLT®
The HOLT valuation model is a Credit Suisse proprietary corporate finance tool that uses
historical and forward financial information to compare corporate performances according
to normalized metrics, such as historical CFROI® (Cash Flow Return on Investment) and
CFROE (Cash Flow Return on Equity), and to assess equity valuations. The methodology
normalizes global accounting standards and adjusts for inflation to provide comparability
across time, industries, and countries to deliver comparable measures of growth and
returns.
HOLT’s flexible platform, which has been evolving for over 25 years, provides an objective
view of over 20,000 companies around the world, with customizable inputs that allow you
to test your assumptions against virtually any scenario. The rigorous, proprietary
methodology examines accounting information, converts it to cash and then values that
cash. This allows you to survey the entire corporate capital structure and identify key
drivers of value that others miss.
The HOLT methodology goes beyond traditional accounting information to emphasize a
company’s cash generating ability and overall potential for value creation. It provides not
only a thorough analysis of a company’s performance in the past; but also an objective
view of the company’s valuation in the future.
The cash flow-based return metric at the heart of HOLT, CFROI®, measures an industrial
firm’s return on investment, or CFROI level, and charts it clearly against the firm’s cost of
capital. The resulting spread is positive, negative or neutral.
■ Returns that exceed their cost of capital create value.
■ Returns below the cost of capital destroy value.
■ Returns equal to the cost of capital have no impact on shareholder value.
In contrast to the CFROI metric for industrial companies, the CFROE metric is used for
financial services firms. Such firms present a unique challenge and are viewed separately
from all other sectors. A lender’s decision to employ financial leverage is critical to the
wealth creation process and, therefore, cannot be removed from the calculation of
economic performance.
For more information about HOLT and the HOLT Methodology, please see
http://www.credit-suisse.com/investment_banking/holt/en
08 September 2014
United Continental Holdings, Inc. (UAL) 38
Companies Mentioned (Price as of 05-Sep-2014)
Airbus (AIR.PA, €49.19) Alaska Air Group (ALK.N, $47.14) Allegiant Tr (ALGT.OQ, $126.04) American Airlines Group Inc. (AAL.OQ, $37.85) Boeing (BA.N, $124.69) Bombardier Inc (SVS) (BBDb.TO, C$3.63) Delta Air Lines, Inc. (DAL.N, $39.22) Embraer (ERJ.N, $39.29) Hawaiian Hldgs (HA.OQ, $15.34) JetBlue Airways Corporation (JBLU.OQ, $12.54) Southwest Airlines Co. (LUV.N, $32.83) Spirit Airlines (SAVE.OQ, $73.2) United Continental Holdings, Inc. (UAL.N, $50.73, OUTPERFORM, TP $68.0)
Disclosure Appendix
Important Global Disclosures
I, Julie Yates, certify that (1) the views expressed in this report accurately reflect my personal views about all of the subject companies and securities and (2) no part of my compensation was, is or will be directly or indirectly related to the specific recommendations or views expressed in this report.
The analyst(s) responsible for preparing this research report received Compensation that is based upon various factors including Credit Suisse's total revenues, a portion of which are generated by Credit Suisse's investment banking activities
As of December 10, 2012 Analysts’ stock rating are defined as follows:
Outperform (O) : The stock’s total return is expected to outperform the relevant benchmark*over the next 12 months.
Neutral (N) : The stock’s total return is expected to be in line with the relevant benchmark* over the next 12 months.
Underperform (U) : The stock’s total return is expected to underperform the relevant benchmark* over the next 12 months.
*Relevant benchmark by region: As of 10th December 2012, Japanese ratings are based on a stock’s total return relative to the analyst's coverage universe wh ich consists of all companies covered by the analyst within the relevant sector, with Outperforms representing the most attractiv e, Neutrals the less attractive, and Underperforms the least attractive investment opportunities. As of 2nd October 2012, U.S. and Canadian as well as European ra tings are based on a stock’s total return relative to the analyst's coverage universe which consists of all companies covered by the analyst within the relevant sector, with Outperforms representing the most attractive, Neutrals the less attractive, and Underperforms the least attractive investment opportunities. For Latin Ame rican and non-Japan Asia stocks, ratings are based on a stock’s total return relative to the average total return of the relevant country or regional benchmark; prior to 2nd October 2012 U.S. and Canadian ratings were based on (1) a stock’s absolute total return potential to its current share price and (2) the relative attractiveness of a stock’s total return potential within an analyst’s coverage universe. For Australian and New Zealand stocks, 12 -month rolling yield is incorporated in the absolute total return calculation and a 15% and a 7.5% threshold replace the 10-15% level in the Outperform and Underperform stock rating definitions, respectively. The 15% and 7.5% thresholds replace the +10-15% and -10-15% levels in the Neutral stock rating definition, respectively. Prior to 10th December 2012, Japanese ratings were based on a stock’s total return relative to the average total return of the relevant country or regional benchmark.
Restricted (R) : In certain circumstances, Credit Suisse policy and/or applicable law and regulations preclude certain types of communications, including an investment recommendation, during the course of Credit Suisse's engagement in an investment banking transaction and in certain other circumstances.
Volatility Indicator [V] : A stock is defined as volatile if the stock price has moved up or down by 20% or more in a month in at least 8 of the past 24 months or the analyst expects significant volatility going forward.
Analysts’ sector weightings are distinct from analysts’ stock ratings and are based on the analyst’s expectations for the fundamentals and/or valuation of the sector* relative to the group’s historic fundamentals and/or valuation:
Overweight : The analyst’s expectation for the sector’s fundamentals and/or valuation is favorable over the next 12 months.
Market Weight : The analyst’s expectation for the sector’s fundamentals and/or valuation is neutral over the next 12 months.
Underweight : The analyst’s expectation for the sector’s fundamentals and/or valuation is cautious over the next 12 months.
*An analyst’s coverage sector consists of all companies covered by the analyst within the relevant sector. An analyst may cover multiple sectors.
08 September 2014
United Continental Holdings, Inc. (UAL) 39
Credit Suisse's distribution of stock ratings (and banking clients) is:
Global Ratings Distribution
Rating Versus universe (%) Of which banking clients (%)
Outperform/Buy* 44% (54% banking clients)
Neutral/Hold* 40% (51% banking clients)
Underperform/Sell* 13% (44% banking clients)
Restricted 3%
*For purposes of the NYSE and NASD ratings distribution disclosure requirements, our stock ratings of Outperform, Neutral, and Underperform most closely correspond to Buy, Hold, and Sell, respectively; however, the meanings are not the same, as our stock ratings are determined on a relative basis. (Please refer to definitions above.) An investor's decision to buy or sell a security should be based on investment objectives, current holdin gs, and other individual factors.
Credit Suisse’s policy is to update research reports as it deems appropriate, based on developments with the subject company, the sector or the market that may have a material impact on the research views or opinions stated herein.
Credit Suisse's policy is only to publish investment research that is impartial, independent, clear, fair and not misleading. For more detail please refer to Credit Suisse's Policies for Managing Conflicts of Interest in connection with Investment Research: http://www.csfb.com/research and analytics/disclaimer/managing_conflicts_disclaimer.html
Credit Suisse does not provide any tax advice. Any statement herein regarding any US federal tax is not intended or written to be used, and cannot be used, by any taxpayer for the purposes of avoiding any penalties.
Price Target: (12 months) for United Continental Holdings, Inc. (UAL.N)
Method: Our $68 target price for UAL is the equally weighted average of (1) a 12.5x mid-cycle P/E multiple on our 2015E EPS (fully taxed), and (2) a 6.5x mid-cycle EV/EBITDAR multiple on our 2015E EBITDAR.
Risk: Primary risks to our $68 target price for UAL include the health of the economy, fuel price volatility, event risk (terrorism, weather), execution and labor disruptions. UAL also has the most exposure amongst any of the domestic network carriers to Asia where overcapacity has resulted in weakening yields and loads. If these trends continue or if the Asian economy weakens, UAL could be adversely affected.
Please refer to the firm's disclosure website at https://rave.credit-suisse.com/disclosures for the definitions of abbreviations typically used in the target price method and risk sections.
See the Companies Mentioned section for full company names
The subject company (UAL.N) currently is, or was during the 12-month period preceding the date of distribution of this report, a client of Credit Suisse.
Credit Suisse provided investment banking services to the subject company (UAL.N) within the past 12 months.
Credit Suisse has managed or co-managed a public offering of securities for the subject company (UAL.N) within the past 12 months.
Credit Suisse has received investment banking related compensation from the subject company (UAL.N) within the past 12 months
Credit Suisse expects to receive or intends to seek investment banking related compensation from the subject company (UAL.N) within the next 3 months.
As of the date of this report, Credit Suisse makes a market in the following subject companies (UAL.N).
As of the end of the preceding month, Credit Suisse beneficially own 1% or more of a class of common equity securities of (UAL.N).
Important Regional Disclosures
Singapore recipients should contact Credit Suisse AG, Singapore Branch for any matters arising from this research report.
The analyst(s) involved in the preparation of this report have not visited the material operations of the subject company (UAL.N) within the past 12 months
Restrictions on certain Canadian securities are indicated by the following abbreviations: NVS--Non-Voting shares; RVS--Restricted Voting Shares; SVS--Subordinate Voting Shares.
Individuals receiving this report from a Canadian investment dealer that is not affiliated with Credit Suisse should be advised that this report may not contain regulatory disclosures the non-affiliated Canadian investment dealer would be required to make if this were its own report.
For Credit Suisse Securities (Canada), Inc.'s policies and procedures regarding the dissemination of equity research, please visit http://www.csfb.com/legal_terms/canada_research_policy.shtml.
Credit Suisse has acted as lead manager or syndicate member in a public offering of securities for the subject company (UAL.N) within the past 3 years.
08 September 2014
United Continental Holdings, Inc. (UAL) 40
As of the date of this report, Credit Suisse acts as a market maker or liquidity provider in the equities securities that are the subject of this report.
Principal is not guaranteed in the case of equities because equity prices are variable.
Commission is the commission rate or the amount agreed with a customer when setting up an account or at any time after that.
Important Credit Suisse HOLT Disclosures
With respect to the analysis in this report based on the Credit Suisse HOLT methodology, Credit Suisse certifies that (1) the views expressed in this report accurately reflect the Credit Suisse HOLT methodology and (2) no part of the Firm’s compensation was, is, or will be directly related to the specific views disclosed in this report.
The Credit Suisse HOLT methodology does not assign ratings to a security. It is an analytical tool that involves use of a set of proprietary quantitative algorithms and warranted value calculations, collectively called the Credit Suisse HOLT valuation model, that are consistently applied to all the companies included in its database. Third-party data (including consensus earnings estimates) are systematically translated into a number of default algorithms available in the Credit Suisse HOLT valuation model. The source financial statement, pricing, and earnings data provided by outside data vendors are subject to quality control and may also be adjusted to more closely measure the underlying economics of firm performance. The adjustments provide consistency when analyzing a single company across time, or analyzing multiple companies across industries or national borders. The default scenario that is produced by the Credit Suisse HOLT valuation model establishes the baseline valuation for a security, and a user then may adjust the default variables to produce alternative scenarios, any of which could occur.
Additional information about the Credit Suisse HOLT methodology is available on request.
The Credit Suisse HOLT methodology does not assign a price target to a security. The default scenario that is produced by the Credit Suisse HOLT valuation model establishes a warranted price for a security, and as the third-party data are updated, the warranted price may also change. The default variable may also be adjusted to produce alternative warranted prices, any of which could occur.
CFROI®, HOLT, HOLTfolio, ValueSearch, AggreGator, Signal Flag and “Powered by HOLT” are trademarks or service marks or registered trademarks or registered service marks of Credit Suisse or its affiliates in the United States and other countries. HOLT is a corporate performance and valuation advisory service of Credit Suisse.
For Credit Suisse disclosure information on other companies mentioned in this report, please visit the website at https://rave.credit-suisse.com/disclosures or call +1 (877) 291-2683.

08 September 2014
United Continental Holdings, Inc. (UAL) 41
References in this report to Credit Suisse include all of the subsidiaries and affiliates of Credit Suisse operating under its investment banking division. For more information on our structure, please use the following link: https://www.credit-suisse.com/who_we_are/en/This report may contain material that is not directed to, or intended for distribution to or use by, any person or entity who is a citizen or resident of or located in any locality, state, country or other jurisdiction where such distribution, publication, availability or use would be contrary to law or regulation or which would subject Credit Suisse AG or its affiliates ("CS") to any registration or licensing requirement within such jurisdiction. All material presented in this report, unless specifically indicated otherwise, is under copyright to CS. None of the material, nor its content, nor any copy of it, may be altered in any way, transmitted to, copied or distributed to any other party, without the prior express written permission of CS. All trademarks, service marks and logos used in this report are trademarks or service marks or registered trademarks or service marks of CS or its affiliates. The information, tools and material presented in this report are provided to you for information purposes only and are not to be used or considered as an offer or the solicitation of an offer to sell or to buy or subscribe for securities or other financial instruments. CS may not have taken any steps to ensure that the securities referred to in this report are suitable for any particular investor. CS will not treat recipients of this report as its customers by virtue of their receiving this report. The investments and services contained or referred to in this report may not be suitable for you and it is recommended that you consult an independent investment advisor if you are in doubt about such investments or investment services. Nothing in this report constitutes investment, legal, accounting or tax advice, or a representation that any investment or strategy is suitable or appropriate to your individual circumstances, or otherwise constitutes a personal recommendation to you. CS does not advise on the tax consequences of investments and you are advised to contact an independent tax adviser. Please note in particular that the bases and levels of taxation may change. Information and opinions presented in this report have been obtained or derived from sources believed by CS to be reliable, but CS makes no representation as to their accuracy or completeness. CS accepts no liability for loss arising from the use of the material presented in this report, except that this exclusion of liability does not apply to the extent that such liability arises under specific statutes or regulations applicable to CS. This report is not to be relied upon in substitution for the exercise of independent judgment. CS may have issued, and may in the future issue, other communications that are inconsistent with, and reach different conclusions from, the information presented in this report. Those communications reflect the different assumptions, views and analytical methods of the analysts who prepared them and CS is under no obligation to ensure that such other communications are brought to the attention of any recipient of this report. Some investments referred to in this report will be offered solely by a single entity and in the case of some investments solely by CS, or an associate of CS or CS may be the only market maker in such investments. Past performance should not be taken as an indication or guarantee of future performance, and no representation or warranty, express or implied, is made regarding future performance. Information, opinions and estimates contained in this report reflect a judgment at its original date of publication by CS and are subject to change without notice. The price, value of and income from any of the securities or financial instruments mentioned in this report can fall as well as rise. The value of securities and financial instruments is subject to exchange rate fluctuation that may have a positive or adverse effect on the price or income of such securities or financial instruments. Investors in securities such as ADR's, the values of which are influenced by currency volatility, effectively assume this risk. Structured securities are complex instruments, typically involve a high degree of risk and are intended for sale only to sophisticated investors who are capable of understanding and assuming the risks involved. The market value of any structured security may be affected by changes in economic, financial and political factors (including, but not limited to, spot and forward interest and exchange rates), time to maturity, market conditions and volatility, and the credit quality of any issuer or reference issuer. Any investor interested in purchasing a structured product should conduct their own investigation and analysis of the product and consult with their own professional advisers as to the risks involved in making such a purchase. Some investments discussed in this report may have a high level of volatility. High volatility investments may experience sudden and large falls in their value causing losses when that investment is realised. Those losses may equal your original investment. Indeed, in the case of some investments the potential losses may exceed the amount of initial investment and, in such circumstances, you may be required to pay more money to support those losses. Income yields from investments may fluctuate and, in consequence, initial capital paid to make the investment may be used as part of that income yield. Some investments may not be readily realisable and it may be difficult to sell or realise those investments, similarly it may prove difficult for you to obtain reliable information about the value, or risks, to which such an investment is exposed. This report may provide the addresses of, or contain hyperlinks to, websites. Except to the extent to which the report refers to website material of CS, CS has not reviewed any such site and takes no responsibility for the content contained therein. Such address or hyperlink (including addresses or hyperlinks to CS's own website material) is provided solely for your convenience and information and the content of any such website does not in any way form part of this document. Accessing such website or following such link through this report or CS's website shall be at your own risk. This report is issued and distributed in Europe (except Switzerland) by Credit Suisse Securities (Europe) Limited, One Cabot Square, London E14 4QJ, England, which is authorised by the Prudential Regulation Authority and regulated by the Financial Conduct Authority and the Prudential Regulation Authority. This report is being distributed in Germany by Credit Suisse Securities (Europe) Limited Niederlassung Frankfurt am Main regulated by the Bundesanstalt fuer Finanzdienstleistungsaufsicht ("BaFin"). This report is being distributed in the United States and Canada by Credit Suisse Securities (USA) LLC; in Switzerland by Credit Suisse AG; in Brazil by Banco de Investimentos Credit Suisse (Brasil) S.A or its affiliates; in Mexico by Banco Credit Suisse (México), S.A. (transactions related to the securities mentioned in this report will only be effected in compliance with applicable regulation); in Japan by Credit Suisse Securities (Japan) Limited, Financial Instruments Firm, Director-General of Kanto Local Finance Bureau (Kinsho) No. 66, a member of Japan Securities Dealers Association, The Financial Futures Association of Japan, Japan Investment Advisers Association, Type II Financial Instruments Firms Association; elsewhere in Asia/ Pacific by whichever of the following is the appropriately authorised entity in the relevant jurisdiction: Credit Suisse (Hong Kong) Limited, Credit Suisse Equities (Australia) Limited, Credit Suisse Securities (Thailand) Limited, regulated by the Office of the Securities and Exchange Commission, Thailand, having registered address at 990 Abdulrahim Place, 27th Floor, Unit 2701, Rama IV Road, Silom, Bangrak, Bangkok 10500, Thailand, Tel. +66 2614 6000, Credit Suisse Securities (Malaysia) Sdn Bhd, Credit Suisse AG, Singapore Branch, Credit Suisse Securities (India) Private Limited (CIN no. U67120MH1996PTC104392) regulated by the Securities and Exchange Board of India (registration Nos. INB230970637; INF230970637; INB010970631; INF010970631), having registered address at 9th Floor, Ceejay House, Dr.A.B. Road, Worli, Mumbai - 18, India, T- +91-22 6777 3777, Credit Suisse Securities (Europe) Limited, Seoul Branch, Credit Suisse AG, Taipei Securities Branch, PT Credit Suisse Securities Indonesia, Credit Suisse Securities (Philippines ) Inc., and elsewhere in the world by the relevant authorised affiliate of the above. Research on Taiwanese securities produced by Credit Suisse AG, Taipei Securities Branch has been prepared by a registered Senior Business Person. Research provided to residents of Malaysia is authorised by the Head of Research for Credit Suisse Securities (Malaysia) Sdn Bhd, to whom they should direct any queries on +603 2723 2020. This report has been prepared and issued for distribution in Singapore to institutional investors, accredited investors and expert investors (each as defined under the Financial Advisers Regulations) only, and is also distributed by Credit Suisse AG, Singapore branch to overseas investors (as defined under the Financial Advisers Regulations). By virtue of your status as an institutional investor, accredited investor, expert investor or overseas investor, Credit Suisse AG, Singapore branch is exempted from complying with certain compliance requirements under the Financial Advisers Act, Chapter 110 of Singapore (the "FAA"), the Financial Advisers Regulations and the relevant Notices and Guidelines issued thereunder, in respect of any financial advisory service which Credit Suisse AG, Singapore branch may provide to you. This research may not conform to Canadian disclosure requirements. In jurisdictions where CS is not already registered or licensed to trade in securities, transactions will only be effected in accordance with applicable securities legislation, which will vary from jurisdiction to jurisdiction and may require that the trade be made in accordance with applicable exemptions from registration or licensing requirements. Non-U.S. customers wishing to effect a transaction should contact a CS entity in their local jurisdiction unless governing law permits otherwise. U.S. customers wishing to effect a transaction should do so only by contacting a representative at Credit Suisse Securities (USA) LLC in the U.S. Please note that this research was originally prepared and issued by CS for distribution to their market professional and institutional investor customers. Recipients who are not market professional or institutional investor customers of CS should seek the advice of their independent financial advisor prior to taking any investment decision based on this report or for any necessary explanation of its contents. This research may relate to investments or services of a person outside of the UK or to other matters which are not authorised by the Prudential Regulation Authority and regulated by the Financial Conduct Authority and the Prudential Regulation Authority or in respect of which the protections of the Prudential Regulation Authority and Financial Conduct Authority for private customers and/or the UK compensation scheme may not be available, and further details as to where this may be the case are available upon request in respect of this report. CS may provide various services to US municipal entities or obligated persons ("municipalities"), including suggesting individual transactions or trades and entering into such transactions. Any services CS provides to municipalities are not viewed as "advice" within the meaning of Section 975 of the Dodd-Frank Wall Street Reform and Consumer Protection Act. CS is providing any such services and related information solely on an arm's length basis and not as an advisor or fiduciary to the municipality. In connection with the provision of the any such services, there is no agreement, direct or indirect, between any municipality (including the officials, management, employees or agents thereof) and CS for CS to provide advice to the municipality. Municipalities should consult with their financial, accounting and legal advisors regarding any such services provided by CS. In addition, CS is not acting for direct or indirect compensation to solicit the municipality on behalf of an unaffiliated broker, dealer, municipal securities dealer, municipal advisor, or investment adviser for the purpose of obtaining or retaining an engagement by the municipality for or in connection with Municipal Financial Products, the issuance of municipal securities, or of an investment adviser to provide investment advisory services to or on behalf of the municipality. If this report is being distributed by a financial institution other than Credit Suisse AG, or its affiliates, that financial institution is solely responsible for distribution. Clients of that institution should contact that institution to effect a transaction in the securities mentioned in this report or require further information. This report does not constitute investment advice by Credit Suisse to the clients of the distributing financial institution, and neither Credit Suisse AG, its affiliates, and their respective officers, directors and employees accept any liability whatsoever for any direct or consequential loss arising from their use of this report or its content. Principal is not guaranteed. Commission is the commission rate or the amount agreed with a customer when setting up an account or at any time after that.
Copyright © 2014 CREDIT SUISSE AG and/or its affiliates. All rights reserved.
Investment principal on bonds can be eroded depending on sale price or market price. In addition, there are bonds on which investment principal can be eroded due to changes in redemption amounts. Care is required when investing in such instruments. When you purchase non-listed Japanese fixed income securities (Japanese government bonds, Japanese municipal bonds, Japanese government guaranteed bonds, Japanese corporate bonds) from CS as a seller, you will be requested to pay the purchase price only.
2014-09-08 United (UAL)
Initiation_final.doc


![Re: United Continental Holdings, Inc. - sec.gov · In Apple Inc. (December 14, 2015), the Staff allowed a proposal that, in part, requested theBoard “issue a report identify[ing]](https://img.pdfslide.net/doc/110x75/5b7ac6037f8b9ae7368c698e/re-united-continental-holdings-inc-secgov-in-apple-inc-december-14.jpg)