Embed Size (px)
Citation preview
UNCTAD/RMT(2000)/1 UNITED NATIONS CONFERENCE ON TRADE AND DEVELOPMENT
REVIEW OF MARITIME TRANSPORT 2000 Report by the UNCTAD secretariat
NOTE
The Review of Maritime Transport is a recurrent publication prepared by the UNCTAD secretariat since 1968 with the aim of fostering the transparency of maritime markets and analysing relevant developments. Any factual or editorial corrections that may prove necessary based on comments made by Governments would be reflected in a corrigendum to be issued subsequently.
*** Symbols of United Nations documents are composed of capital letters combined with figures. Use of such a symbol indicates a reference to a United Nations document.
*** The designations employed and the presentation of the material in this publication do not imply an expression of opinion by the Secretariat of the United Nations concerning the legal status of any country, territory, city or area, or of its authorities, or concerning the delimitation of its frontiers or boundaries.
*** Material in this publication may be freely quoted or reprinted, but acknowledgement is requested, with reference to the document number (see below). A copy of the publication containing the quotation or reprint should be sent to the UNCTAD secretariat at: Palais des Nations, CH - 1211 Geneva 10, Switzerland.
UNCTAD/RMT(2000)/1UNITED NATIONS PUBLICATION
Sales No. E.00.II..D.34 ISBN 92-1-112501-4 ISSN 0566-7682
UNCTAD/RMT(2000)/1

iii
Contents
Abbreviations Explanatory notes Approximate vessel size groups referred to in the Review of Maritime Transport, according to generally used shipping terminology Introduction Summary of Main Developments
Page
viii ix
ix x x
Chapter
I. Development of international seaborne trade
A. World Economic Background B. World Seaborne Trade
1
1 3
II. Structure and ownership of the world fleet
A. Structure of the World Fleet B. Ownership of the World Fleet C. Registry of Vessels D. Shipbuilding and the Secondhand Market
15
15 23 26 33
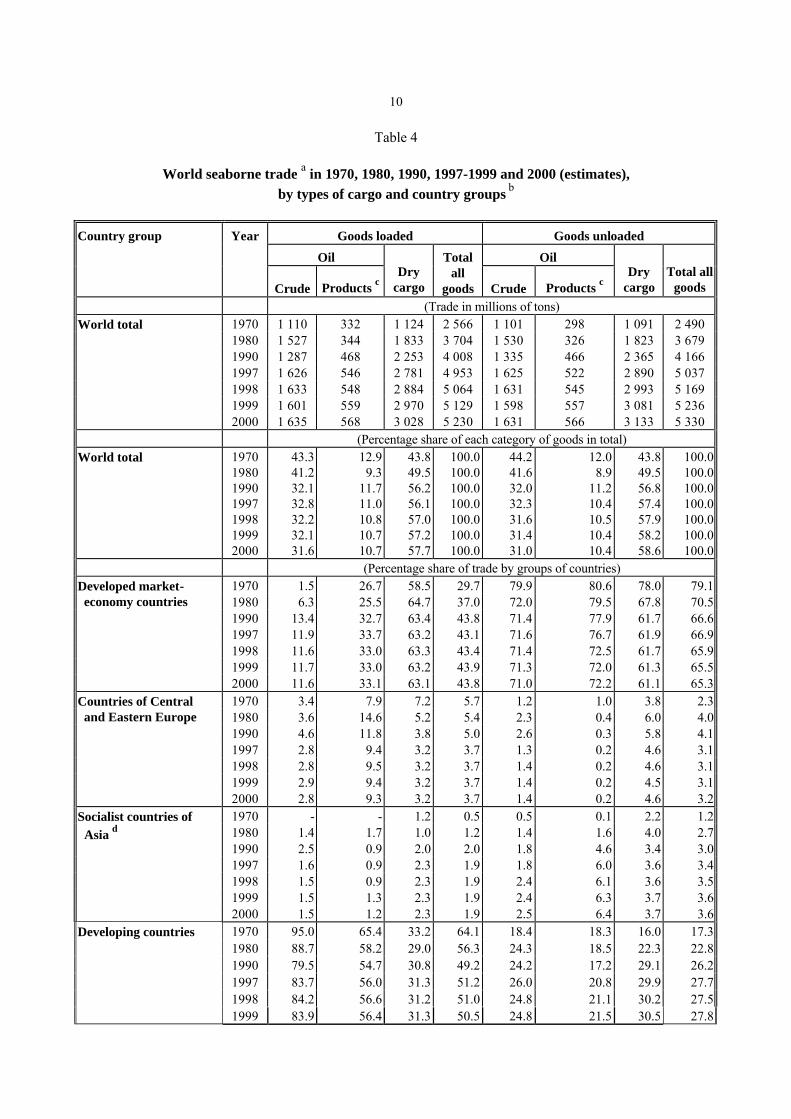
III. Productivity of the world fleet and supply and demand in world shipping
A. Operational Productivity B. Supply and Demand in World Shipping C. Comparison of Cargo Turnover and Fleet Ownership
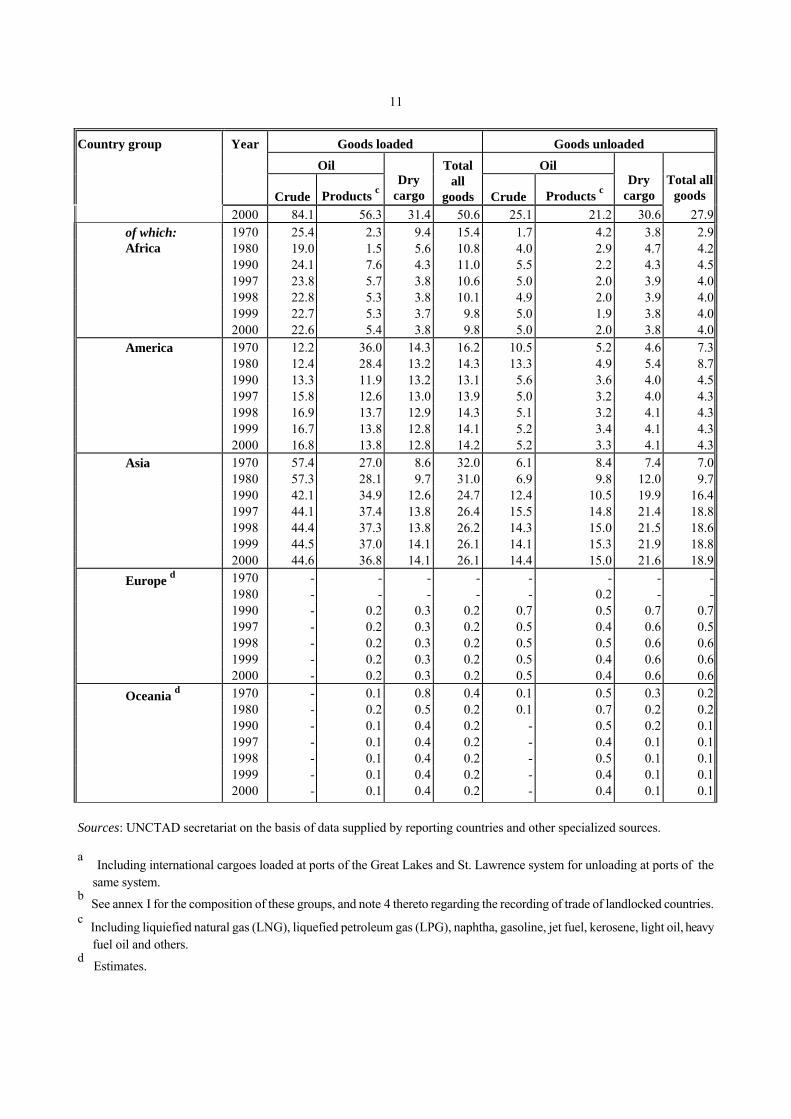
39
39 44 44
IV. Trade and freight markets
A. Liner Shipping Market B. Dry Bulk Shipping Market C. Crude Oil and Petroleum Products Seaborne Freight Market D. Estimates of Total Freight Costs in World Trade
49
49 59 61 65
iv
V. Port development
A. Container Port Traffic B. Improving Port Performance C. Institutional Change D. Special Needs of Small Ports
69
69 69 72 73
VI. Trade and transport efficiency
A. Developments In Multimodal Transport B. Electronic Commerce and its Impact on Transport C. Expert Meeting on Capacity Building in the Area of Electronic Commerce: Legand Regulatory Dimensions D. Other Developments
75
75 84
87 90
VII. Review of regional developments: Sub-Saharan Africa
A. Economic Background B. General Situation of Merchant Fleets of Africa C. Movements of non-Liner Dry D. Cargo and Major Dry Bulk Cargo E. Movements of Crude Oil and Petroleum Products F. Liner Cargo Movements G. Costs of Transport in African Developing Countries H. Improving Transport Operations and Services through Acis
93
93 97 99
104 104 108 111
Notes Annexes I. Classification of countries and territories II. World seaborne trade according to geographical area, 1970, 1980, 1990, 1998-1999 and 2000 (estimates) III(a) Merchant fleets of the world by flag of registration, groups of countries and types of ship as at 1 January 2000 III(b) Merchant fleets of the world by flag of registration, groups of countries
and types of ship as at 1 January 2000
115
117
121
125
129

v
LIST OF TABLES
Table
1. World output, 1990-1999
2. Exports and imports by major regions and economic groupings, 1996-1999
3. Development of international seaborne trade, selected years
4. World seaborne trade in 1970, 1980, 1990, 1997-1999 and 2000 (estimates), by types of cargo and country groups
5. World shipping performance by types of cargo, selected years
6. World fleet size by principal types of vessel, 1997-1999
7. Distribution of the world fleet and TEU capacity of fully cellular container ships by groups of countries, in 1997, 1998 and 1999
8. Age distribution of the world merchant fleet by types of vessel, as at 1 January 2000
9. Deliveries of newbuildings, 1980, 1985, 1990, 1995-1999
10. Broken-up tonnage trends, 1980 and 1993-1999
11. Tonnage reported sold for breaking by types of vessel, 1995-1999
12. Average age of broken-up ships by type from 1991 to 1999
13. Distribution of world tonnage (dwt) by groups of countries of registration, 1980, 1990, 1998 and 1999
14. Percentage shares of world tonnage by types of vessel and country groups, in 1980 (as at 1 July), 1998 and 1999 (as at 31 December)
15. Structure of the marchant fleets of the main country groups, as at 1 January 2000
16. The 35 most important maritime countries and territories, as at 1 January 2000
17. Tonnage distribution of major open-registry fleets, as at 1 January 2000
18. Tonnage owned by the nationals of, and registered in, the country or territory of registry in the total fleet of the most important open and international registers, as at 1 January 2000
19. True nationality of major open-registry fleets, as at 1 January 2000
20. Newbuilding contracts placed for the main types of ship a during 1995-1999 and 2000
21. World tonnage on order, as at 1 January 2000
22. Representative newbuilding prices in 1980, 1985, 1990, 1997-1999 and 2000
23. Second-hand prices for five-year-old vessels, 1993-1999
24. Cargo carried and ton-miles performed per deadweight ton (dwt) of the total world fleet, 1990-1999
25. Estimated productivity of tankers, bulk carriers, combined carriers a and the residual fleet, 1990-1999
26. Estimated productivity of tankers, bulk carriers, combined carriers and the residual fleet, 1990-1999
Page
2
4
6
10
14
16
18
19
21
22
22
22
23
25
27
28
30
31
32
34
35
36
37
39
41
42
vi
27. Analysis of tonnage oversupply by main type of vessel, 1992-1999
28. Tonnage oversupply in the world merchant fleet, 1992-1999
29. Comparison between total cargo turnover and fleet ownership by groups of countries in 1980, 1998 and 1999
30. Maritime engagement of 25 major trading nations
31. Leading 20 container service operators (January 2000) on the basis of number of ships and total shipboard capacity (TEUs)
32. Estimated carrying capacity of alliances, January 2001
33. Containership time charter rates
34. Freight rates (market average) on the three major liner trade routes, 1998-1999
35. Cargo movements on the three major liner trade routes for 1997-1999 and forecasts for 2000
36. Supply (ships' carrying capacity) and demand (cargo volume) in transpacific, Europe-Asia and transatlantic trades, 1998-2000
37. Liner freight indices, 1997-2000
38. Ratio of liner freight rates to prices of selected commodities
39. Dry cargo freight indices, 1997 – 2000
40. Tanker freight indices, 1997-2000
41. Estimates of total freight costs for imports in world trade by country groups
42. Container port traffic of 41 developing countries and territories in 1998 and 1997
43. Top 20 container terminals and their throughput, 1999 and 1998
44. Operating container fleets of major lessors and total industry for 1997-1999
45. New container purchases by major lessors in 1997-1999
46. Global fleet of containers on operating lease by type, 1997-1999
47. Global fleet of containers on operating lease by size, 1999 and 1998
48. Global container production by country/region for 1998 and 1999
49. Global container production by main type for 1998 and 1999
50. Real GDP of the developing countries of sub-Saharan Africa
51. Total trade in goods of sub-Saharan Africa and developing countries
52. Merchant fleets of the world and those registered in sub-Saharan African countries, selected years
53. Exports and imports of all dry cargo, iron ore, coal and grain of sub-Saharan African subregions, 1998-2000
54. Age distribution of the merchant fleet of developing countries of Africa by types of vessel, as at 1 January 2000
55. Exports and imports of all petroleum, crude oil and petroleum products of sub-Saharan African subregions, 1998-2000
56. Liner cargo movements (containerized) between the West, East and Southern coasts of sub-Saharan Africa and country groups of major trading partners, and all countries of the world, 1998-2000
43
45
46
47
50
51
52
54
55
56
57
58
60
64
66
70
71
78
79
81
81
82
83
94
96
97
100
101
105
106
vii
57. Estimates of total freight costs on imports of African countries (excluding South Africa), 1998
58. Comparison of transit and ocean freight costs of imports to selected African landlocked countries from north-western Europe, 1999
59. Estimates of total freight costs of total import value in world trade by selected African landlocked countries, 1998
108
109
110

viii
LIST OF GRAPHS
Graph
1. Annual change in OECD industrial production and world seaborne trade, 1996-1999
2. International seaborne trade for selected years
3. World seaborne trade by country groups
4. World fleet size by principal types of vessel: selected years
5. World tonnage by country groups, 1999
6. Index of ton-miles performed per deadweight ton of total world fleet, 1990-1999
7. Trends in surplus capacity by main vessel type in selected years
8. Estimates of total freight costs for imports in world trade by groups
9. World container output, 1990-1999
LIST OF BOXES
Box
1. Vessels and registry groupings used in the Review of Maritime Transport
2. Selected examples of Internet-based transportation service providers
3. Contracting States of selected conventions on maritime transport as at 10 July 2000
4. Transit transport services accessing to sea ports in selected landlocked countries in Africa
Page
5
5
12
17
24
40
44
67
83
Page
xiii
85 89
112
ABBREVIATIONS
ACIS Advance Cargo Information System c.i.f. cost, insurance and freight dwt deadweight tons FIO free in and out f.o.b. free on board GDP gross domestic product grt gross registered tons IICL Institute of International Container Lessors IMF International Monetary Fund IMO International Maritime Organization LNG liquefied natural gas LPG liquefied petroleum gas OECD Organisation for Economic Co-operation and Development OPEC Organization of the Petroleum Exporting Countries TEU twenty-foot equivalent unit ULCC ultra-large crude carrier UNCTAD United Nations Conference on Trade and Development VLCC very large crude carrier WS Worldscale WTO World Trade Organization

Explanatory notes
All references to dollars ($) are to United States dollars, unless otherwise stated.
"Tons" refers to metric tons, unless otherwise stated.
Details and percentages presented in tables do not necessarily add up to the totals because of rounding.
Two dots indicate that data are not available or are not separately reported.
A hyphen signifies that the amount is nil, or less than half the unit used.
In some tables, the data shown for earlier years have been revised and updated, and therefore differ from those shown in previous issues of the Review. This relates in particular to the distribution of world tonnage according to country groups, specifically the classification of major open-registry countries. Up to the 1994 edition of the Review, the majority of tables included five countries in this group, namely, Bahamas, Bermuda, Cyprus, Liberia and Panama, while some tables also included Malta and Vanuatu. In order to improve consistency and to reflect practices of ship registration, Malta and Vanuatu have been included in all tables referring to major open-registry countries. This reclassification primarily affects the share of developing countries in Europe in total world tonnage.
In the tables and the text, the use of the term "countries" refers to countries, territories or areas.
Approximate vessel size groups referred to in the Review ofMaritime Transport, according to generally used shipping terminology
Crude oil tankers:
ULCC 300,000 dwt plus VLCC 150,000 - 299,999 dwt Suezmax 100,000 - 149,999 dwt Affiamax 50,000 - 99,999 dwt
Dry bulk carriers:
Capesize 80,000 dwt plus Panamax 50,000 - 79,999 dwt Handymax 35,000 - 49,999 dwt Handy 20,000 -34,999 dwt

x
INTRODUCTION
The Review of Maritime Transport is an annual publication prepared by the United Nations Conference on Trade and Development . Its purpose is to identify the main developments in world maritime transport and to provide relevant statistical data. It focuses on the development of the maritime activities in developing countries as compared with other groups of countries, and to the correlation between the development of
global trade and maritime transport activities in general. In order to maintain a balance between the information requirements of data users and those of providers of maritime transport services, this year's Review has more information on e-commerce in a chapter on trade transport efficiency. Regional developments in African economic and maritime transport are the subject of this year's special chapter.
SUMMARY OF MAIN DEVELOPMENTS
Development of the world economy and seaborne trade v World output grew in 1999 by 2.7 per cent over
1998. The developed market-economy countries experienced growth of 2.5 per cent over the previous year, while developing countries (including China) recorded an average increase of 3.4 per cent. In 2000, the output growth of the world is expected to be 3.5-4.5 per cent while the output of developed market-economy countries and developing countries is expected to be 3.0-4.0 per cent and 5.0-5.5 per cent respectively.
v The growth of world merchandise exports
continued to slow in 1999, to 3.9 per cent, as compared to 4.7 per cent in 1998, while that of imports increased slightly to 5.3 per cent from 4.5 per cent in the previous year. The slowdown in exports is accounted for by a contraction of exports in the transition economies as well as slower export growth in developing countries. The import improvement in 1999 was due mainly to a recovery in developing countries and also to sustained growth in developed market economy countries.
v The total industrial production index of the
Organisation for Economic Cooperation and Development (OECD) rose moderately in 1999 by 3.0 per cent to 113.4 from 110.1 in 1998 (1995=100). This positive development was primarily due to the United States industrial production, which grew by 3.5 per cent in 1999.
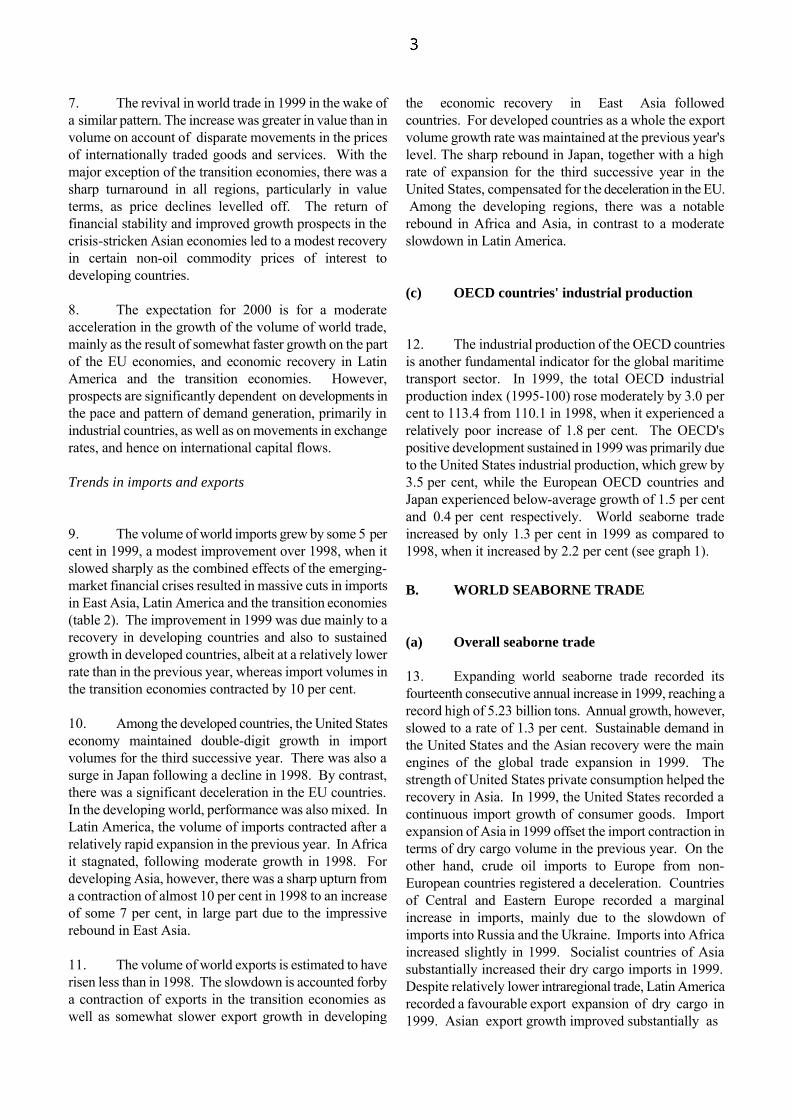
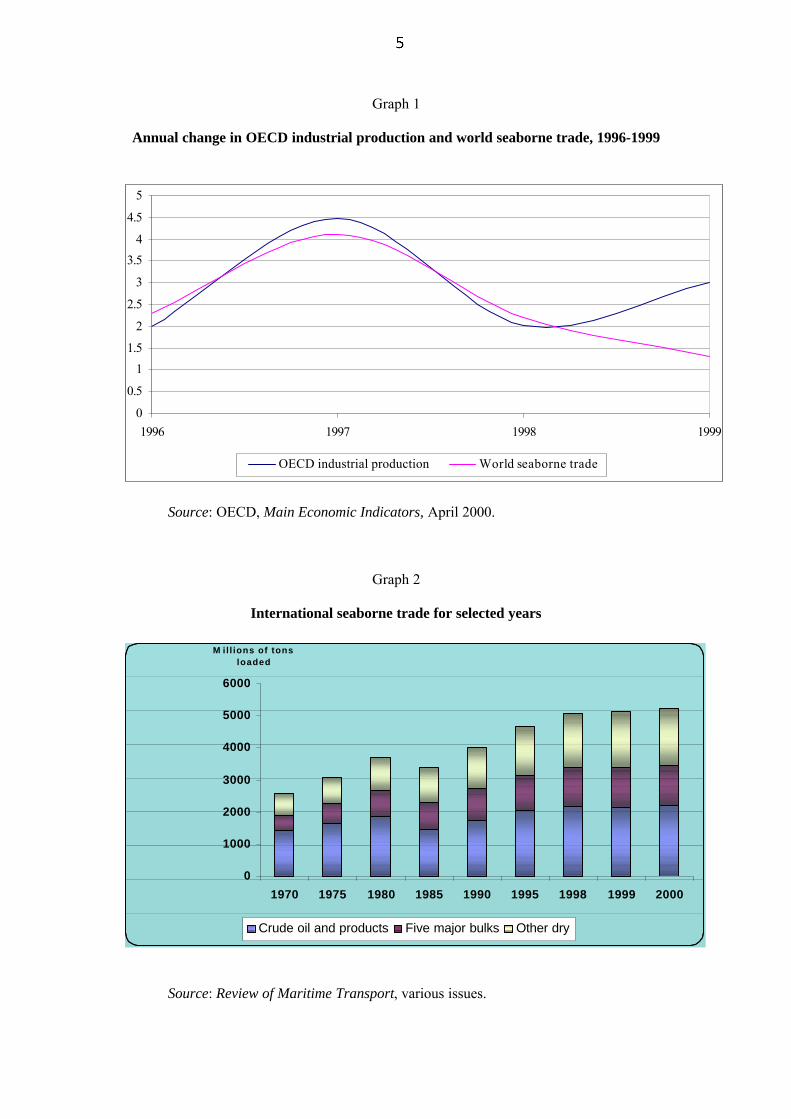
v World seaborne trade recorded its fourteenth consecutive annual increase in 1999, reaching a record high of 5.23 billion tons. Annual growth, however, declined at a rate of 1.3 per cent, the lowest since 1987. Preliminary data available indicate that global maritime trade growth in 2000 is expected to be 2.0 per cent.
v Total maritime activities measured in ton-miles in
global trade decreased to the minimal level of 21,480 billion ton-miles in 1999, in comparison with 21,492 billion ton-miles in the previous year.
Development of the world fleet v ?The world merchant fleet expanded to
799.0 million deadweight tons (dwt) at the end of 1999, representing a 1.3 per cent increase over 1998. The relatively low rate of fleet expansion reflects the balance between newbuilding deliveries of 40.5 million dwt and tonnage broken up and lost of 30.7 million dwt, leaving a net gain of 9.8 million dwt.
v In 1999, tonnage ownership fell marginally by
0.3 per cent in developed market-economy countries, while major open-registry countries and developing countries increased their fleet by 0.3 per cent and 0.1 per cent respectively. The developing countries' share of tonnage registered in major open-registry countries has slowly increased, reaching about one third in 1999. On the other hand, the developed market-economy countries' share has pursued a downward trend,
xi
representing about two thirds of the total tonnage registered in the major open-registry countries.
Productivity of the world fleet and supply and demand in world shipping v The main operational productivity indicators for
the world fleet developed favourably in 1999. Tons of cargo carried per dwt stood at 6.42, which was the same as in the previous year.
v World total surplus tonnage stood at 23.7 million
dwt in 1999 (the lowest in the 1990s), or 3.0 per cent of the 1999 world merchant fleet. The surplus capacity in the oil-tanker sector declined to 14.0 million dwt, or 5.0 per cent of the total world tanker fleet, in 1999, while overcapacity in the dry bulk sector decreased to 7.9 million dwt, accounting for 3.2 per cent of the world dry bulk fleet.
Freight markets v In the transpacific trades, the average annual
revenue per TEU on the eastbound leg in 1999 increased by 34 per cent as compared with that in the previous year. On the westbound routes, the average annual rates per TEU in 1999 declined by 18.1 per cent from those in 1998. In the Asia/Europe trades, the average annual rates per TEU on the Europe-Asia routes in 1999 declined by 17.9 per cent as compared with those in 1998, while those on the Asia-Europe routes rose by 19 per cent in 1999 from the average level in 1998. The transatlantic trade remained the most problematic liner market in 1999. The average annual rates in 1999 plummeted by 23 per cent in the United States to Europe trade and 11.7 per cent in the opposite direction as compared with those in 1998.
v In 1999, the dry bulk supply and demand balance
showed a clear improvement. The growth in demand was remarkably higher during the second half of 1999, specifically with strong demand from Asia for both coal and iron ore.
v ?In 1999, world crude oil production decreased by
1.5 per cent from the level of 1998. Accordingly the overall volume of the seaborne crude oil trade decreased by 2.0 per cent. Nevertheless, the overall shipments of petroleum products in 1999
increased by 2.0 per cent. The average rates paid for VLCC transportation from the Middle East Gulf to the West was WS 46.16, as compared with WS 58.2 recorded in 1998. On voyages to Japan, the average was WS 50.78, whereas it was WS 66.9 in 1998.
Total freight costs in world trade by groups v ?World total freight payments as a proportion of
total import value (the freight factor) have been following a downward trend, falling from as high as 6.64 per cent in 1980 to 5.22 per cent in 1990 and further down to 5.06 per cent in 1998. The freight factor for the developed market-economy countries decreased to 4.07 per cent in 1998 as compared with 4.17 per cent in 1997, while that of developing countries increased very marginally to 8.06 per cent in 1998 from 8.04 per cent in 1997. The freight factor for the African developing countries was higher at 11.36 per cent in 1998.
Port development v ?World container port traffic continued to expand
in 1998 at a rate of 6.7 per cent over 1997, reaching 165.0 million TEUs, of which 88.5 million TEUs (or 53.6 per cent, compared with 50.9 per cent in 1997) were handled at the ports of developing countries.
Trade and transport efficiency v ?Many transport companies, including maritime
carriers, are now providing a variety of information on their services on the Internet as well as enabling customers to process transactions online. In recent years there has been a considerable growth of infomediaries, which are creating market places and exchanges for transportation services. A brief description and selected examples of infomediaries or Internet transport portals are provided.
Review of regional developments: sub-Saharan African economic and maritime transport developments v Sub-Saharan Africa's overall economic activities
regained some momentum in 1995, sustaining the favourable development until 1998, when the
xii
growth rate fell below 3.0 per cent, continuing downwards in 1999.
v Over the period from 1995 through 1999, the
exports of sub-Saharan African countries expanded at an average annual rate of 4.0 per cent in value and 5.1 per cent in volume, with imports increasing at 6.3 per cent per year in value and 6.9 per cent in volume, as compared with 7.5 per cent in value and 8.0 per cent in volume for exports, and 6.5 per cent in value and the same growth in volume for imports of all developing countries.
v The total merchant fleet of all the sub-Saharan
African countries has been decreasing in terms of deadweight tons, from 0.29 per cent of the world total in 1980 to 0.23 per cent in 1990, reaching 0.15 per cent in 1999. Tankers and general cargo ships account for 46.4 per cent and 29.1 per cent respectively of the total sub-Saharan fleets.
v Subregional exports of all non-liner dry cargoes
have been expanding at the average annual growth rate of 3-4 per cent over the last several years. About 75 per cent of the total are exported from the southern coast. Imports have increased at the rate of 2-3 per cent annually. Nearly 60 per cent of total imports moved through the West coast of sub-Saharan Africa. Crude oil shipments
from the western coast represent more than two thirds of the total, nearly half of which are destined for the United States. Exports of petroleum products, the majority of which are fuels for the United States, are fully dominated by the western coast while imports of petroleum products are mainly supplied equally by northern and southern Europe.
v Total liner cargo of both imports (54 per cent)
and exports (46 per cent) are increasing at the average annual rate of 2.1 per cent from 2.0 million TEUs in 1998 to nearly 2.1 million TEUs in 2000, of which approximately half are loaded or discharged on the southern coast. Trades with Europe, the biggest trade partner, have been increasing at the average annual rate of 2.3 per cent, reaching a share of nearly 60 per cent of the total trade in TEU terms in 2000.
v Average freight costs of landlocked African
countries in 1998 constituted a higher proportion of total import value (18.08 per cent) than the ratio for all African developing countries (11.36 per cent). In West Africa, Mali and Burkina Faso represented a higher percentage (29.57 per cent and 21.67 per cent respectively) in 1998. Rwanda registered the highest ratio in East Africa (29.91 per cent) while Malawi in southern Africa represented as much as 39.41 per cent.

BOX 1
Vessel and registry used n the Review of Maritime Transport
As in previous year's Review, five vessel groupings have been used throughout most shipping tables in this year's edition. The cut-off point for all tables based on data from Lloyd's Maritime Information Services in 100 gross registered tons (grt), except those tables dealing with ownership, where the cut-off level is 1,000 grt. The groups aggregate 20 principal types of vessel category, as noted below.
Review group
Constituent ship types
Oil tankers Bulk carriers General cargo Container ships Other ships Total all ships
Oil tankers Ore and bulk carriers, ore bulk/oil carriers Refrigerated cargo, specialized cargo, ro-ro cargo, general cargo (single and multi-deck), general cargo/passenger Fully cellular Oil/chemical tankers, chemical tankers, other tankers, liquefied gas carriers, passengers ro-ro passenger, tank barges, general cargo barges, fishing, offshore supply, and all other types Summation of all above-mentioned vessel types
The following guidelines are offered by Lloyd's Maritime Information Service for the tables in this year's Review relating to fleet development. Former Yugoslavia Most ships have been allocated to either Croatia (CRT) or Slovenia (SLO), with very few left under Yugoslavia (YUG). Major open-registry countries This group of countries flies the flags of the Bahamas, Bermuda, Cyprus, Liberia, Malta, Panama and Vanuatu. Source: Lloyd's Maritime Information Services (London).
Chapter I
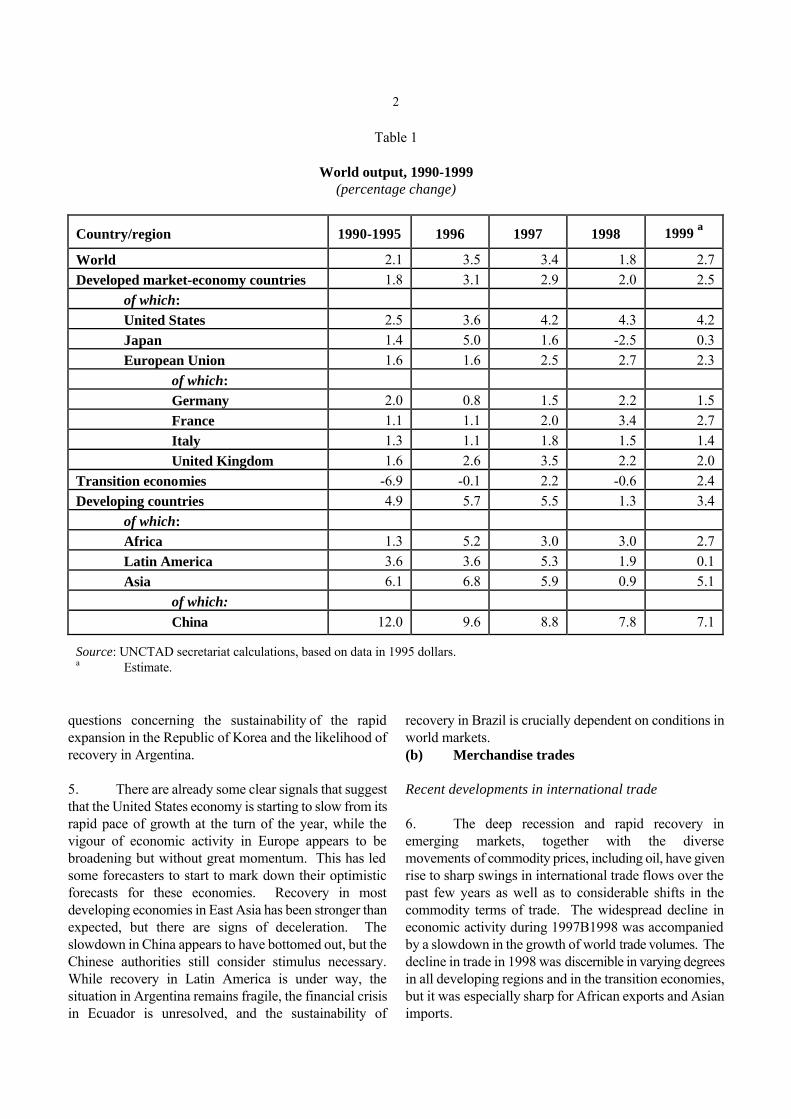
DEVELOPMENT OF INTERNATIONAL SEABORNE TRADE The first chapter of the Review provides an overview of the demand for global maritime transport services, together with background information on the world economic situation, and a review and forecast of developments in world seaborne trade. A. WORLD ECONOMIC BACKGROUND 1 (a) World output General 1. The year 1999 was characterized by a comparatively significant stabilization of global economic conditions and a revival of world production and trade. The widely anticipated major disruptions, and even the threat of global recession, arising from the "Y2K computer bug", turned out to be a non-event. Although the risk itself may have been exaggerated, the absence of serious disruptions is perhaps a reflection of the massive business spending undertaken to cope with the problem. While there are no reliable figures, the most widely quoted amounts for such expenditure on global information technology (IT) range from $300 billion to $600 billion,2 which is some 1B2 per cent of global GDP. It appears to have provided an important boost to the world economy, giving an additional stimulus to the United States and helping recovery in East Asia. 2. World GDP picked up significantly in 1999 to reach 2.7 per cent, having slowed to 1.8 per cent in 1998 from 3.4 per cent in 1997 (see table 1). Of particular significance is the turnaround from recession to growth in Japan and the transition economies as well as the recovery in developing countries. The major factor underlying faster growth in developing countries as a whole was the steep rebound in East Asia, which more than compensated for a mild slowdown in Africa and a more severe one in Latin America. As a consequence, overall growth in developing countries was again higher than that of developed countries, for the second time since 1988.
3. In 1999, United States output continued to maintain its expansion at a pace faster than 4 per cent. Its sustained import demand was the main driving force behind the improvement in the global economy and particularly in Asia and Europe. Following its recession in 1998, the Japanese economy rebounded sharply in the first half of 1999 but slowed again later in the year. Growth in the European Union (EU) was significantly lower in 1999 than in 1998 but developments during the year were positive. Despite increased monetary and financial convergence, growth rates continued to diverge considerably among EU countries. Prospects and forecasts 4. While the prospects for the global economy have become considerably more optimistic since the end of 1999, the risk that global imbalances may create another financial disruption has become increasingly evident. The better-than-expected performance in 1999, in particular of the United States, East Asia and Brazil, has led to an upward revision of short-term forecasts of growth for all major economic regions. This tendency has been reinforced by the fact that the global economy has continued to gather strength as the expansion of demand and output has become more widespread. However, perceptions of such developments vary widely among various international organizations and other institutions. The forecast of world output growth in 2000 ranges from 3.5 per cent to 4.3 per cent, compared to an estimate of only 2.7 per cent, achieved in 1999. There are also significant differences in growth rates forecast for different regions. For example, there is much uncertainty associated with the widely expected slowdown of the United States economy and the recovery in Japan and Europe, while in the developing world there are
2
Table 1 World output, 1990-1999 (percentage change)
Country/region
1990-1995
1996
1997
1998
1999 a
World
2.1
3.5
3.4
1.8
2.7
Developed market-economy countries
1.8
3.1
2.9
2.0
2.5 of which:
United States
2.5
3.6
4.2
4.3
4.2 Japan
1.4
5.0
1.6
-2.5
0.3
European Union
1.6
1.6
2.5
2.7
2.3 of which:
Germany
2.0
0.8
1.5
2.2
1.5 France
1.1
1.1
2.0
3.4
2.7
Italy
1.3
1.1
1.8
1.5
1.4 United Kingdom
1.6
2.6
3.5
2.2
2.0
Transition economies
-6.9
-0.1
2.2
-0.6
2.4 Developing countries
4.9
5.7
5.5
1.3
3.4
of which:
Africa
1.3
5.2
3.0
3.0
2.7
Latin America
3.6
3.6
5.3
1.9
0.1 Asia
6.1
6.8
5.9
0.9
5.1
of which:
China
12.0
9.6
8.8
7.8
7.1
Source: UNCTAD secretariat calculations, based on data in 1995 dollars. a Estimate.
questions concerning the sustainability of the rapid expansion in the Republic of Korea and the likelihood of recovery in Argentina. 5. There are already some clear signals that suggest that the United States economy is starting to slow from its rapid pace of growth at the turn of the year, while the vigour of economic activity in Europe appears to be broadening but without great momentum. This has led some forecasters to start to mark down their optimistic forecasts for these economies. Recovery in most developing economies in East Asia has been stronger than expected, but there are signs of deceleration. The slowdown in China appears to have bottomed out, but the Chinese authorities still consider stimulus necessary. While recovery in Latin America is under way, the situation in Argentina remains fragile, the financial crisis in Ecuador is unresolved, and the sustainability of
recovery in Brazil is crucially dependent on conditions in world markets. (b) Merchandise trades Recent developments in international trade 6. The deep recession and rapid recovery in emerging markets, together with the diverse movements of commodity prices, including oil, have given rise to sharp swings in international trade flows over the past few years as well as to considerable shifts in the commodity terms of trade. The widespread decline in economic activity during 1997B1998 was accompanied by a slowdown in the growth of world trade volumes. The decline in trade in 1998 was discernible in varying degrees in all developing regions and in the transition economies, but it was especially sharp for African exports and Asian imports.
7. The revival in world trade in 1999 in the wake of the economic recovery in East Asia followed a similar pattern. The increase was greater in value than in volume on account of disparate movements in the prices of internationally traded goods and services. With the major exception of the transition economies, there was a sharp turnaround in all regions, particularly in value terms, as price declines levelled off. The return of financial stability and improved growth prospects in the crisis-stricken Asian economies led to a modest recovery in certain non-oil commodity prices of interest to developing countries. 8. The expectation for 2000 is for a moderate acceleration in the growth of the volume of world trade, mainly as the result of somewhat faster growth on the part of the EU economies, and economic recovery in Latin America and the transition economies. However, prospects are significantly dependent on developments in the pace and pattern of demand generation, primarily in industrial countries, as well as on movements in exchange rates, and hence on international capital flows. Trends in imports and exports 9. The volume of world imports grew by some 5 per cent in 1999, a modest improvement over 1998, when it slowed sharply as the combined effects of the emerging-market financial crises resulted in massive cuts in imports in East Asia, Latin America and the transition economies (table 2). The improvement in 1999 was due mainly to a recovery in developing countries and also to sustained growth in developed countries, albeit at a relatively lower rate than in the previous year, whereas import volumes in the transition economies contracted by 10 per cent. 10. Among the developed countries, the United States economy maintained double-digit growth in import volumes for the third successive year. There was also a surge in Japan following a decline in 1998. By contrast, there was a significant deceleration in the EU countries. In the developing world, performance was also mixed. In Latin America, the volume of imports contracted after a relatively rapid expansion in the previous year. In Africa it stagnated, following moderate growth in 1998. For developing Asia, however, there was a sharp upturn from a contraction of almost 10 per cent in 1998 to an increase of some 7 per cent, in large part due to the impressive rebound in East Asia. 11. The volume of world exports is estimated to have risen less than in 1998. The slowdown is accounted forby a contraction of exports in the transition economies as well as somewhat slower export growth in developing
countries. For developed countries as a whole the export volume growth rate was maintained at the previous year's level. The sharp rebound in Japan, together with a high rate of expansion for the third successive year in the United States, compensated for the deceleration in the EU. Among the developing regions, there was a notable rebound in Africa and Asia, in contrast to a moderate slowdown in Latin America. (c) OECD countries' industrial production 12. The industrial production of the OECD countries is another fundamental indicator for the global maritime transport sector. In 1999, the total OECD industrial production index (1995-100) rose moderately by 3.0 per cent to 113.4 from 110.1 in 1998, when it experienced a relatively poor increase of 1.8 per cent. The OECD's positive development sustained in 1999 was primarily due to the United States industrial production, which grew by 3.5 per cent, while the European OECD countries and Japan experienced below-average growth of 1.5 per cent and 0.4 per cent respectively. World seaborne trade increased by only 1.3 per cent in 1999 as compared to 1998, when it increased by 2.2 per cent (see graph 1). B. WORLD SEABORNE TRADE
(a) Overall seaborne trade 13. Expanding world seaborne trade recorded its fourteenth consecutive annual increase in 1999, reaching a record high of 5.23 billion tons. Annual growth, however, slowed to a rate of 1.3 per cent. Sustainable demand in the United States and the Asian recovery were the main engines of the global trade expansion in 1999. The strength of United States private consumption helped the recovery in Asia. In 1999, the United States recorded a continuous import growth of consumer goods. Import expansion of Asia in 1999 offset the import contraction in terms of dry cargo volume in the previous year. On the other hand, crude oil imports to Europe from non-European countries registered a deceleration. Countries of Central and Eastern Europe recorded a marginal increase in imports, mainly due to the slowdown of imports into Russia and the Ukraine. Imports into Africa increased slightly in 1999. Socialist countries of Asia substantially increased their dry cargo imports in 1999. Despite relatively lower intraregional trade, Latin America recorded a favourable export expansion of dry cargo in 1999. Asian export growth improved substantially as

Table 2 Exports and imports by major regions and economic groupings, 1996-1999 (percentage change in volume over the previous year)
Export volume
Import volume
Country/region
1996
1997
1998
1999
1996
1997
1998
1999
World
6.1
10.7
4.7
3.9
6.9
10.0
4.5
5.3
Developed market-economy countries
4.9
10.0
4.3
4.3
5.3
9.3
8.0
6.5 of which:
Japan
1.0
12.0
-1.5
2.0
5.5
1.5
-5.5
9.5 United States
6.3
11.9
2.3
3.2
5.6
12.1
11.7
11.5
European Union
5.5
9.5
6.0
3.5
5.0
8.5
8.5
4.0 Transition economies
6.5
10.5
5.0
-3.0
16.0
13.5
5.0
-10.0
Developing countries
6.9
12.4
5.6
5.3
6.4
10.8
-3.8
4.2 of which:
Africa
8.9
6.5
-1.2
3.3
1.0
9.7
5.3
0.3 Latin America
11.0
11.5
7.5
7.0
8.5
22.5
8.5
-2.0
Asia
5.4
12.5
3.8
7.2
5.5
6.7
-9.7
7.3 of which:
Newly-industrializing economies a
9.1
11.6
3.8
5.9
6.6
7.4
-10.0
6.9
ASEAN-4 b
4.8
12.1
11.0
11.2
2.0
5.0
-22.7
9.8
China
-0.8
20.5
3.7
8.3
7.5
5.5
2.3
13.1
Memo item: ASEAN-4 plus Republic of Korea
10.9
17.7
13.7
11.2
6.3
3.5
-22.0
18.1
Source: UNCTAD secretariat calculations, based on data available from the World Trade Organization (WTO). a Hong Kong (China), Republic of Korea, Singapore and Taiwan Province of China. b Indonesia, Malaysia, the Philippines and Thailand.
both Japan's exports recovered and the five Asian developing countries (Indonesia, Malaysia, the Philippines, Thailand and the Republic of Korea), which had been affected considerably by the 1997B1998 financial crises, achieved favourable growth in their combined exports of dry cargo in 1999. The United States exports accelerated due to the dynamic performance of its intraregional trade. Export growth of Europe in the sector of dry cargo recorded a substantial
increase in 1999. Countries of Central and Eastern Europe increased their exports marginally. Crude oil exports of Africa decreased considerably, but dry cargo increased moderately in 1999. Socialist countries of Asia recorded a moderate increase in exports in 1999. Preliminary data available indicate that global maritime trade growth in 2000 is expected to be 2.0 per cent (see graph 2 and table 3).
Graph 1
Annual change in OECD industrial production and world seaborne trade, 1996-1999
0
0.5
1
1.5
2
2.5
3
3.5
4
4.5
5
1996 1997 1998 1999
OECD industrial production World seaborne trade
Source: OECD, Main Economic Indicators, April 2000.
Graph 2
International seaborne trade for selected years
0
1000
2000
3000
4000
5000
6000
1970 1975 1980 1985 1990 1995 1998 1999 2000
M ill ions of tons loaded
Crude oil and products Five major bulks Other dry
Source: Review of Maritime Transport, various issues.

6
Table 3 Development of international seaborne trade, selected years a (goods loaded)
Dry cargo
Tanker cargo
Total
of which: main bulk
commodities b
Total (all goods)
Year
Millions of tons
Percentage
annual change
Millions of tons
Percentage
annual change
Millions of tons
Percentage
annual change
Millions of tons
Percentage
annual change 1970
1 442
1 124
448
2 566
1975
1 644
1 428
635
3 072
1980
1 871
1 833
796
3 704
1985
1 459
1 923
857
3 382
1990
1 755
2 253
968
4 008
1995
2 049
2 602
1 082
4 651
1996
2 127
3.8
2 631
1.1
1 092
0.9
4 758
2.3
1997
2 172
2.1
2 781
5.7
1 157
6.0
4 953
4.1 1998
2 181
0.4
2 884
3.7
1 200
3.7
5 064
2.2
1999
2 159
-1.0
2 970
3.0
1 233
2.8
5 129
1.3 2000 c
2 202
2.0
3 028
2.0
1 257
1.9
5 230
2.0
Sources: UNCTAD secretariat on the basis of annex II and data supplied by specialized sources. a Including international cargoes loaded at ports of the Great Lakes and St. Lawrence system for unloading at ports of
the same system. b Iron ore, grain, coal, bauxite/alumina and phosphate. c Estimates.
(b) Seaborne trade in tankers Crude oil production 14. In 1999, world crude oil production decreased by 1.5 per cent or nearly 1.0 million barrels per day from the previous year. This decrease reflects production cuts in the producing regions, specifically the Organization of Petroleum Exporting Countries (OPEC). OPEC output declined by 3.9 per cent to 26.745 million barrels per day as compared to 27.828 million barrels per day in 1998. NonBOPEC production rose slightly by 0.2 per cent to 39.357 million barrels per day from 39.265 million barrels per day in the previous year. Total growth in production was marginalized, mainly because of OPEC's production curtailment. United States production decreased substantially by 5.2 per cent to 5.916 million barrels per day in 1999 as compared with its output in 1998, while Canada's output was also down by 4.9 per cent to 2.072 million barrels per day. Mexico significantly reduced its output by 5.3 per cent, to 2.913 million barrels per day. Output of the Middle East members of OPEC
declined by 3.2 per cent to 18.508 million barrels per day in 1999, while other OPEC output was also reduced, dropping by 5.4 per cent to 8.237 million barrels per day. Meanwhile, North Sea production increased strongly by 7.7 per cent to 5.967 million barrels per day, and Russia's production remained almost unchanged, standing at 5.967 million barrels per day in 1999. All other countries' total production decreased by 1.5 per cent to 13.300 million barrels per day in 1999 as compared to 13.077 million barrels per day in the previous year.3 15. OPEC's oil production restraint and the consequent considerable price increase on world markets resulted in less trade in crude oil in 1999. Thus, crude oil shipments, accounting for 75 per cent of total oil trade, declined by about 2.0 per cent in 1999, while petroleum products rose 2.0 per cent. Overall petroleum shipments in 1999 declined by 1.0 per cent in terms of trade volume from the level of the previous year. In 2000, when petroleum markets tighten and OPEC's production restraint eases, total tanker cargo volume growth is expected to rebound to around 2.0 per cent.

7
Crude oil shipments 16. In 1999, the world's crude oil shipments decreased significantly by 2.0 per cent to 1,600 million tons from 1,633 million tons recorded in the previous year. The trade structure of crude oil continues to change. The United States has been diversifying its imports from the Middle East Gulf to other regions such as Latin America and West Africa. European countries have been procuring more crude oil from European sources, relying less on other markets, in particular the Middle East Gulf producers. On the other hand, Asian economies including Japan remain largely dependent on Middle East Gulf oil. In 1999, OPEC's sustained production cut reduced export volume from most of the cartel's members. Exports from the Middle East Gulf were constrained by the production cuts by several OPEC members, although the reduction was offset somewhat by increased exports from Iraq. The volume from West Africa declined as a result of Nigeria's reduced output. Reductions in Venezuela, and in Mexico (a non-OPEC member) also curbed crude oil exports from Latin America, while Indonesia's restraint helped to trim the total volume from South-East Asia. As a result, crude oil imports fell in 1999 in major import markets. In the United States, crude oil imports declined slightly in 1999, despite rising demand. A similar decline was observed in crude oil importing countries in Asia. Over the next couple of years, crude oil seaborne trade is likely to return to an annual growth of 2 per cent, which approximately matches global oil-demand growth. This trade will be led by Middle East Gulf shipments to Asia, which represent part of a pattern of regionalization in the global crude oil trade. Latin America will increase its supply to North America, while Eastern Europe, mainly the former Soviet Union, and West Africa will supply Western Europe. Petroleum product shipments 17. The global trade in petroleum products in 1999 continued to increase steadily by 2.0 per cent to 560 million tons. One of the reasons for this sustained growth is the recovery of Asian demand, specifically the Far East newly industrialized economies (NIEs). Half of the NIEs' petroleum product imports are intra-NIEs shipments, the remainder being obtained from Japan, the United States and the Middle East Gulf. India commenced full-scale production at several refineries in 1999, thus reducing the volume of its off-shore procurements, mainly from the Middle East Gulf. In other major import markets, no significant changes were observed. The United States demand remained steady,
comparatively more being imported from Latin America and Europe than from the Middle East Gulf. European demand for petroleum products remains more regionalized, thus resulting in less imports from non-European countries. This growth trend in volume terms and the prevailing pattern of trade are expected to continue for the next couple of years. (c) Dry cargo shipments General developments 18. In 1999, overall dry cargo shipments grew at a rate of 3.0 per cent, reaching approximately 2,970 million tons, consisting of main dry bulk cargo (1,233 million tons), minor dry bulk cargo (762 million tons) and other dry commodities including containerized cargo (975 million tons). This figure is down from the 3.7 per cent growth recorded in 1998. According to the preliminary data available, the growth of seaborne trade of total dry cargo in 2000 is expected to drop further to 2.0 per cent. The increase in main dry bulk commodities, which make up nearly 42 per cent of the total dry cargo trade, will continue to be supported by coal shipments with its trade expected to grow at more than 4 per cent in 2000. Limited growth of iron ore shipments is anticipated, while shipments of bauxite, alumina and phosphate rock will remain unchanged. Forecasts are difficult to make for the seaborne grain trade mainly because of unpredictable harvests, which primarily depend on weather conditions. World crude steel production 19. World crude steel production in 1999 increased by 1.3 per cent to 787 million tons, which is the second largest quantity after the volume of 800 million tons which was registered in 1997. Asia's production regained momentum in 1999, increasing by 3.6 per cent to 308 million tons or 39.2 per cent of the world total. Most of this expansion was attributable to the increased volume in China, with its production growing by 8.0 per cent to 124 million tons or 15.7 per cent of the world total. Production in India, Japan and the Republic of Korea returned to a favourable production course, registering increases of 3.5, 0.7 and 2.9 per cent respectively. Their combined output of 160 million tons was 20.3 per cent of the world total. On the other hand, the European Union's production shrank by 3.1 per cent to 155 million tons, or 19.7 per cent of the world total, mainly due to the decreases in Germany (-4.5 per cent), Italy (-3.3 per cent)

8
and the United Kingdom (-5.9 per cent). Among the major producers in the European Union, only France recorded a positive but marginal increase of 0.4 per cent. The production of the United States declined by 1.4 per cent to 97 million tons or 12.4 per cent of the world total. The combined volume of the three major crude steel-producing regions, Asia, the European Union and North America, increased by 1.0 per cent to 593 million tons in 1999, and dominated world crude steel production with a combined share of 75.4 per cent of world output.4 World steel consumption 20. World steel consumption in 1999 increased marginally by 0.8 per cent to 699 million tons, approaching the record level of approximately 700 million tons in 1997. The steel consumption of Asia increased by 6.0 per cent to 303 million tons, while that of North America and the European Union declined by 5.9 per cent and 1.8 per cent respectively to 135 million tons each. The combined steel consumption of these three major regions increased slightly by 1.2 per cent to 572 million tons or 81.8 per cent of total world consumption. The consumption quantity of the three major regions corresponds to their production quantity (593 million tons). Based on the analysis by country, China's consumption in 1999 increased by 9.7 per cent to 125 million tons. Conversely, the Japanese steel market declined by 2.8 per cent to 68 million tons. Civil engineering was the only market showing growth in 1999. However, the Government of Japan's stimulus packages encouraged steel consumption. The Republic of Korea's steel consumption recovered remarkably by 28.9 per cent to 32 million tons. The United States reduced its consumption by 7.3 per cent to 109 million tons, registering, however, an import surge from Japan and the Republic of Korea.5 Iron ore trade 21. Although there was a small increase in total world steel production with Asia's increase offset by declines in the European Union and the United States, the total volume of seaborne trade in iron ore in 1999 decreased by 1.7 per cent to 410 million tons. In 1999, changes in the regional distribution of steel production have affected iron ore import patterns, with trades into Asia increasing, but those into Europe decreasing. This change in the distribution of steel production has impacted the exporters of iron ore. Exports from Australia to Asia increased by 3 per cent, whereas those from Brazil, which supplies Europe, declined by 5 per
cent. Canada's iron ore exports were reduced significantly by 14 per cent and Sweden's trade also fell 13 per cent. On the basis of the preliminary data it is expected that total world iron ore shipments in 2000 will recover as demand strengthens in Asia (Japan, China, the Far Eastern NIEs) and Northern Europe.6 Coal trade 22. Coal shipments were again the largest dry bulk cargo in 1999, increasing by 1.5 per cent to 480 million tons. Thermal coal expanded by 3.3 per cent to 306 million tons, whereas coking coal decreased by 1.7 per cent to 174 million tons. Total sales from Australia, the largest exporter, showed continued strong growth in 1999, increasing by 4 per cent. Australia strengthened her dominant supply position to Japan, while Japan's imports from the United States and Canada fell. Overall coal exports from the United States dropped by 23 per cent to approximately 40 million tons from 52 million tons in 1998. Canada also reduced its coal exports by 3 per cent in 1999. Most of the increased demand of the Far Eastern NIEs was satisfied by the supply from Australian, Chinese and South-East Asian mines rather than those in North America. China's exports rose significantly by 19 per cent while Indonesia's exports increased similarly by about 20 per cent. Shipments to the Indian subcontinent remained strong, benefitting Australian and other Asian suppliers. South Africa's exports in 1999 are expected to decrease by about 3 per cent. Various forecasts indicate that total coal shipments will grow significantly by more than 4 per cent in 2000.7 Grain trade 23. World grain shipments increased by 7.1 per cent to 210 million tons in 1999. On the supply side, exports from the United States expanded remarkably by 18.3 per cent to 87.9 million tons, while Canada's exports increased by 6.2 per cent to 19.3 million tons. Australia's supply increased by 8.7 per cent to 20.6 million tons, whereas Argentina's exports plummeted by as much as 28.7 per cent to 17.3 million tons. Exports from the European Union to third countries expanded by about 17.2 per cent as compared with the results of the previous year, reaching 18.2 million tons. On the import side, shipments moving from Australia to the Far East and from Europe to the Middle East in 1999 were greater than in previous years. Japanese demand is expected to shrink by about 5 per cent in 1999. In contrast, demand by the other Far Eastern countries in that year is expected to
9
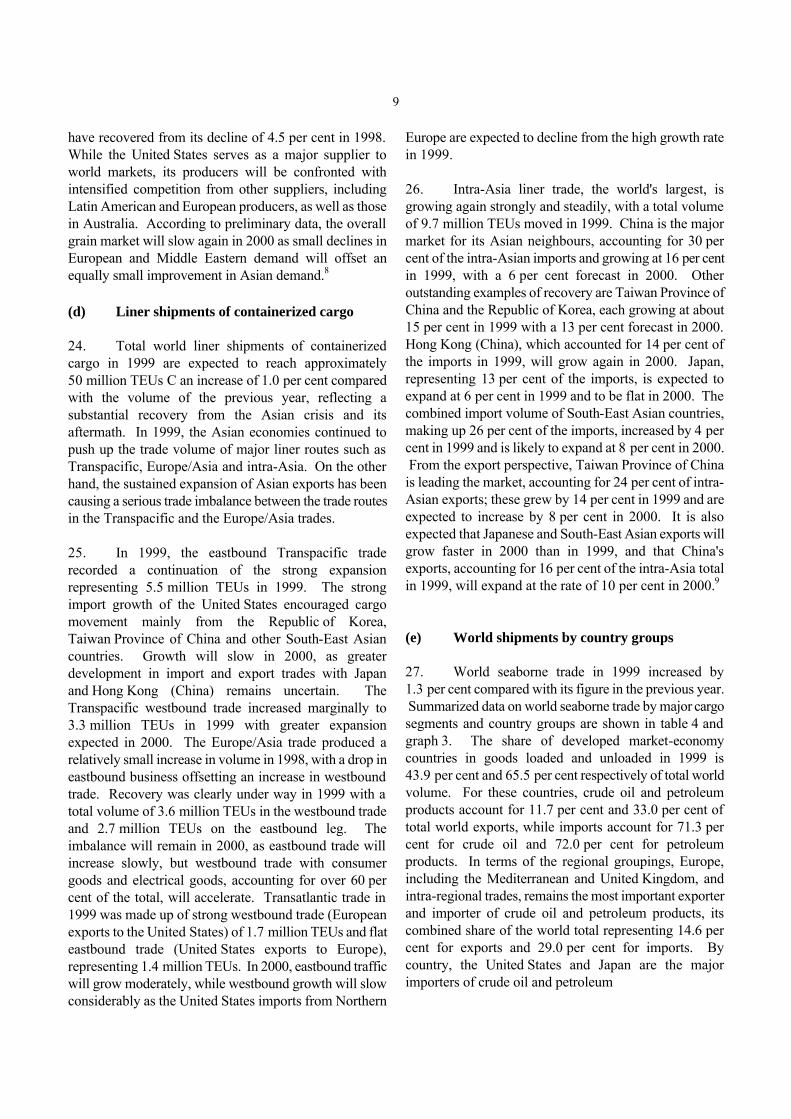
have recovered from its decline of 4.5 per cent in 1998. While the United States serves as a major supplier to world markets, its producers will be confronted with intensified competition from other suppliers, including Latin American and European producers, as well as those in Australia. According to preliminary data, the overall grain market will slow again in 2000 as small declines in European and Middle Eastern demand will offset an equally small improvement in Asian demand.8 (d) Liner shipments of containerized cargo 24. Total world liner shipments of containerized cargo in 1999 are expected to reach approximately 50 million TEUs C an increase of 1.0 per cent compared with the volume of the previous year, reflecting a substantial recovery from the Asian crisis and its aftermath. In 1999, the Asian economies continued to push up the trade volume of major liner routes such as Transpacific, Europe/Asia and intra-Asia. On the other hand, the sustained expansion of Asian exports has been causing a serious trade imbalance between the trade routes in the Transpacific and the Europe/Asia trades. 25. In 1999, the eastbound Transpacific trade recorded a continuation of the strong expansion representing 5.5 million TEUs in 1999. The strong import growth of the United States encouraged cargo movement mainly from the Republic of Korea, Taiwan Province of China and other South-East Asian countries. Growth will slow in 2000, as greater development in import and export trades with Japan and Hong Kong (China) remains uncertain. The Transpacific westbound trade increased marginally to 3.3 million TEUs in 1999 with greater expansion expected in 2000. The Europe/Asia trade produced a relatively small increase in volume in 1998, with a drop in eastbound business offsetting an increase in westbound trade. Recovery was clearly under way in 1999 with a total volume of 3.6 million TEUs in the westbound trade and 2.7 million TEUs on the eastbound leg. The imbalance will remain in 2000, as eastbound trade will increase slowly, but westbound trade with consumer goods and electrical goods, accounting for over 60 per cent of the total, will accelerate. Transatlantic trade in 1999 was made up of strong westbound trade (European exports to the United States) of 1.7 million TEUs and flat eastbound trade (United States exports to Europe), representing 1.4 million TEUs. In 2000, eastbound traffic will grow moderately, while westbound growth will slow considerably as the United States imports from Northern
Europe are expected to decline from the high growth rate in 1999. 26. Intra-Asia liner trade, the world's largest, is growing again strongly and steadily, with a total volume of 9.7 million TEUs moved in 1999. China is the major market for its Asian neighbours, accounting for 30 per cent of the intra-Asian imports and growing at 16 per cent in 1999, with a 6 per cent forecast in 2000. Other outstanding examples of recovery are Taiwan Province of China and the Republic of Korea, each growing at about 15 per cent in 1999 with a 13 per cent forecast in 2000. Hong Kong (China), which accounted for 14 per cent of the imports in 1999, will grow again in 2000. Japan, representing 13 per cent of the imports, is expected to expand at 6 per cent in 1999 and to be flat in 2000. The combined import volume of South-East Asian countries, making up 26 per cent of the imports, increased by 4 per cent in 1999 and is likely to expand at 8 per cent in 2000. From the export perspective, Taiwan Province of China is leading the market, accounting for 24 per cent of intra-Asian exports; these grew by 14 per cent in 1999 and are expected to increase by 8 per cent in 2000. It is also expected that Japanese and South-East Asian exports will grow faster in 2000 than in 1999, and that China's exports, accounting for 16 per cent of the intra-Asia total in 1999, will expand at the rate of 10 per cent in 2000.9 (e) World shipments by country groups 27. World seaborne trade in 1999 increased by 1.3 per cent compared with its figure in the previous year. Summarized data on world seaborne trade by major cargo segments and country groups are shown in table 4 and graph 3. The share of developed market-economy countries in goods loaded and unloaded in 1999 is 43.9 per cent and 65.5 per cent respectively of total world volume. For these countries, crude oil and petroleum products account for 11.7 per cent and 33.0 per cent of total world exports, while imports account for 71.3 per cent for crude oil and 72.0 per cent for petroleum products. In terms of the regional groupings, Europe, including the Mediterranean and United Kingdom, and intra-regional trades, remains the most important exporter and importer of crude oil and petroleum products, its combined share of the world total representing 14.6 per cent for exports and 29.0 per cent for imports. By country, the United States and Japan are the major importers of crude oil and petroleum
10
Table 4 World seaborne trade a in 1970, 1980, 1990, 1997-1999 and 2000 (estimates), by types of cargo and country groups b
Goods loaded
Goods unloaded
Oil
Oil
Country group
Year
Crude
Products c
Dry
cargo
Total
all goods
Crude
Products c
Dry
cargo
Total all
goods
(Trade in millions of tons)
1970
1 110
332
1 124
2 566
1 101
298
1 091
2 490 1980
1 527
344
1 833
3 704
1 530
326
1 823
3 679
1990
1 287
468
2 253
4 008
1 335
466
2 365
4 166 1997
1 626
546
2 781
4 953
1 625
522
2 890
5 037
1998
1 633
548
2 884
5 064
1 631
545
2 993
5 169 1999
1 601
559
2 970
5 129
1 598
557
3 081
5 236
World total
2000
1 635
568
3 028
5 230
1 631
566
3 133
5 330
(Percentage share of each category of goods in total) World total
1970 1980 1990 1997 1998 1999 2000
43.3 41.2 32.1 32.8 32.2 32.1 31.6
12.9
9.3 11.7 11.0 10.8 10.7 10.7
43.8 49.5 56.2 56.1 57.0 57.2 57.7
100.0 100.0 100.0 100.0 100.0 100.0 100.0
44.2 41.6 32.0 32.3 31.6 31.4 31.0
12.0
8.9 11.2 10.4 10.5 10.4 10.4
43.8 49.5 56.8 57.4 57.9 58.2 58.6
100.0 100.0 100.0 100.0 100.0 100.0 100.0
(Percentage share of trade by groups of countries) 1970
1.5
26.7
58.5
29.7
79.9
80.6
78.0
79.1
1980
6.3
25.5
64.7
37.0
72.0
79.5
67.8
70.5 1990
13.4
32.7
63.4
43.8
71.4
77.9
61.7
66.6
1997
11.9
33.7
63.2
43.1
71.6
76.7
61.9
66.9 1998
11.6
33.0
63.3
43.4
71.4
72.5
61.7
65.9
1999
11.7
33.0
63.2
43.9
71.3
72.0
61.3
65.5
Developed market- economy countries
2000
11.6
33.1
63.1
43.8
71.0
72.2
61.1
65.3
1970
3.4
7.9
7.2
5.7
1.2
1.0
3.8
2.3 1980
3.6
14.6
5.2
5.4
2.3
0.4
6.0
4.0
1990
4.6
11.8
3.8
5.0
2.6
0.3
5.8
4.1 1997
2.8
9.4
3.2
3.7
1.3
0.2
4.6
3.1
1998
2.8
9.5
3.2
3.7
1.4
0.2
4.6
3.1 1999
2.9
9.4
3.2
3.7
1.4
0.2
4.5
3.1
Countries of Central and Eastern Europe
2000
2.8
9.3
3.2
3.7
1.4
0.2
4.6
3.2
1970
-
-
1.2
0.5
0.5
0.1
2.2
1.2 1980
1.4
1.7
1.0
1.2
1.4
1.6
4.0
2.7
1990
2.5
0.9
2.0
2.0
1.8
4.6
3.4
3.0 1997
1.6
0.9
2.3
1.9
1.8
6.0
3.6
3.4
1998
1.5
0.9
2.3
1.9
2.4
6.1
3.6
3.5 1999
1.5
1.3
2.3
1.9
2.4
6.3
3.7
3.6
Socialist countries of Asia d
2000
1.5
1.2
2.3
1.9
2.5
6.4
3.7
3.6
1970
95.0
65.4
33.2
64.1
18.4
18.3
16.0
17.3 1980
88.7
58.2
29.0
56.3
24.3
18.5
22.3
22.8
1990
79.5
54.7
30.8
49.2
24.2
17.2
29.1
26.2 1997
83.7
56.0
31.3
51.2
26.0
20.8
29.9
27.7
1998
84.2
56.6
31.2
51.0
24.8
21.1
30.2
27.5
Developing countries
1999
83.9
56.4
31.3
50.5
24.8
21.5
30.5
27.8
11
Goods loaded
Goods unloaded
Oil
Oil
Country group
Year
Crude
Products c
Dry
cargo
Total
all goods
Crude
Products c
Dry
cargo
Total all
goods
2000
84.1
56.3
31.4
50.6
25.1
21.2
30.6
27.9
1970
25.4
2.3
9.4
15.4
1.7
4.2
3.8
2.9 1980
19.0
1.5
5.6
10.8
4.0
2.9
4.7
4.2
1990
24.1
7.6
4.3
11.0
5.5
2.2
4.3
4.5 1997
23.8
5.7
3.8
10.6
5.0
2.0
3.9
4.0
1998
22.8
5.3
3.8
10.1
4.9
2.0
3.9
4.0 1999
22.7
5.3
3.7
9.8
5.0
1.9
3.8
4.0
of which: Africa
2000
22.6
5.4
3.8
9.8
5.0
2.0
3.8
4.0
1970
12.2
36.0
14.3
16.2
10.5
5.2
4.6
7.3 1980
12.4
28.4
13.2
14.3
13.3
4.9
5.4
8.7
1990
13.3
11.9
13.2
13.1
5.6
3.6
4.0
4.5 1997
15.8
12.6
13.0
13.9
5.0
3.2
4.0
4.3
1998
16.9
13.7
12.9
14.3
5.1
3.2
4.1
4.3 1999
16.7
13.8
12.8
14.1
5.2
3.4
4.1
4.3
America
2000
16.8
13.8
12.8
14.2
5.2
3.3
4.1
4.3
1970
57.4
27.0
8.6
32.0
6.1
8.4
7.4
7.0 1980
57.3
28.1
9.7
31.0
6.9
9.8
12.0
9.7
1990
42.1
34.9
12.6
24.7
12.4
10.5
19.9
16.4 1997
44.1
37.4
13.8
26.4
15.5
14.8
21.4
18.8
1998
44.4
37.3
13.8
26.2
14.3
15.0
21.5
18.6 1999
44.5
37.0
14.1
26.1
14.1
15.3
21.9
18.8
Asia
2000
44.6
36.8
14.1
26.1
14.4
15.0
21.6
18.9
1970
-
-
-
-
-
-
-
- 1980
-
-
-
-
-
0.2
-
-
1990
-
0.2
0.3
0.2
0.7
0.5
0.7
0.7 1997
-
0.2
0.3
0.2
0.5
0.4
0.6
0.5
1998
-
0.2
0.3
0.2
0.5
0.5
0.6
0.6 1999
-
0.2
0.3
0.2
0.5
0.4
0.6
0.6
Europe d
2000
-
0.2
0.3
0.2
0.5
0.4
0.6
0.6
1970
-
0.1
0.8
0.4
0.1
0.5
0.3
0.2 1980
-
0.2
0.5
0.2
0.1
0.7
0.2
0.2
1990
-
0.1
0.4
0.2
-
0.5
0.2
0.1 1997
-
0.1
0.4
0.2
-
0.4
0.1
0.1
1998
-
0.1
0.4
0.2
-
0.5
0.1
0.1 1999
-
0.1
0.4
0.2
-
0.4
0.1
0.1
Oceania d
2000
-
0.1
0.4
0.2
-
0.4
0.1
0.1
Sources: UNCTAD secretariat on the basis of data supplied by reporting countries and other specialized sources. a Including international cargoes loaded at ports of the Great Lakes and St. Lawrence system for unloading at ports of the
same system. b See annex I for the composition of these groups, and note 4 thereto regarding the recording of trade of landlocked countries.
c Including liquiefied natural gas (LNG), liquefied petroleum gas (LPG), naphtha, gasoline, jet fuel, kerosene, light oil, heavy
fuel oil and others. d Estimates.

Graph 3
World seaborne trade by country groups
Source: UNCTAD secretariat on the basis of data supplied by reporting countries and other specialized sources. products, with 23.7 per cent and 16.4 per cent respectively of total world imports. In the dry bulk segment, developed market-economy countries remain at 63.2 per cent for exports and 61.3 per cent for imports. Based on regional distribution, Europe is also the largest dry cargo market for exports and imports, with 21.2 per cent and 32.5 per cent respectively. A constant increase in the volume of intra-regional trade has been observed, while overall dry cargo export and import trades with third country groups are comparatively flat or slightly downward. By country, the United States' exports in 1999 were driven by grain shipments, representing an 18 per cent increase over the previous year. The increase in cargo unloaded is mainly attributable to the continued expansion of liner cargo from Asia. In 1999, Australia increased its exports of three major commodities C iron ore, coal and grain C by 3.0, 4.0 and nearly 9 per cent respectively. Japan's coal imports from Australia in 1999 expanded, whilst those from the United States and Canada weakened. Its demand for grain shrank in 1999, offsetting somewhat the expansion of other main dry bulk commodities. 28. The developing countries' share in total world exports remained at 50.5 per cent, while their share of imports stood at 27.8 per cent in 1999. Their trade
structure in terms of volume reflected a sharp contrast with that of developed market-economy countries. The developing countries' combined share in crude oil and its products represented 76.8 per cent for exports and 24.0 per cent for imports in the world total, while in the case of the developed market-economy countries their combined share was at 17.2 per cent for exports and 71.5 per cent for imports. In the dry cargo segment, the developed market-economy countries share as a group in exports and imports represented 63.2 per cent and 61.3 per cent, which was almost double the developingcountries' group share of 31.3 per cent for exports and 30.5 per cent for imports. 29. There are some variations observable in the volume of goods loaded or unloaded among the developing countries, specifically in Asia. In 1999, Asian countries maintained 26.1 per cent and 18.8 per cent for exports and imports respectively of total world trade. The majority of crude oil exports (44.5 per cent of the world total or 53.0 per cent of the developing countries' total) was shipped in 1999 from Western Asia (the Middle East Gulf). Petroleum products loaded (37.0 per cent of the world total or 65.7 per cent of the developing countries' total) were traded mainly in the intra-Asian markets, including Japan. The increasing
13
share in the volume of dry cargo loaded reflected primarily the expansion of Asia's containerized trades in both international and intra-Asian markets. In the import segment, Asian countries kept a relatively higher share of 21.9 per cent in world shipments or 71.8 per cent of the developing countries' total. The majority of dry cargo unloaded consisted of three main dry bulk commodities from non-Asian countries. 30. The share of shipments for the developing countries of America has remained stable at 13-14 per cent for exports and unchanged at 4.3 per cent for imports since the early 1990s. Crude oil and petroleum products from Mexico and Venezuela, iron ore from Brazil and grain from Argentina are dominant in the region's outward trade volume, boosting the region's total dry cargo share to 12.8 per cent of the world total, while the dry cargo imports of the region remains at 4.1 per cent. The majority of these represent trades of manufactures with the United States and Europe, and imports of coking coal from North America and Australia. 31. The share of goods loaded by African developing countries continued to shrink to slightly lower than 10 per cent of the world total. In 1999 their share in loading crude oil, petroleum products and dry cargo was 22.7 per cent, 5.3 per cent, and 3.7 per cent respectively in total world trade. Crude oil shipments are generated mainly in Western and Northern Africa. Coal exports from southern Africa share a major portion of dry cargo exports. For imports, their trades have been stagnant at the low level of 4 per cent of world trade since the 1980s, distributed evenly over crude oil and petroleum products, and the dry cargo group. The share of countries in Central and Eastern Europe in 1999 continued to be stagnant at 3.7 per cent for loading, mainly owing to a marginal increase in both crude oil and its products. Their imports have remained at 3.1 per cent since the middle of the 1990s. Figure for the socialist countries in Asia have primarily reflected the trade activities of China, which are composed mainly of exports of coal and manufactures, and imports of iron ore.
(f) Demand for shipping services 32. Table 5 provides data on total demand for shipping services in terms of ton-miles. World seaborne trade in volume increased marginally by 1.3 per cent to 5,129 million tons in 1999, whilst the total shipping performance measured in ton-miles decreased to 21,480 billion ton-miles in 1999 from 21,492 billion ton-miles in the previous year. This represents the second consecutive decline after 14 years of continuous growth. By commodity, crude oil shipments in volume dropped by 2.0 per cent due to OPEC'c production cuts, whereas oil products increased by 2.0 per cent. In terms of transportation performance, crude oil decreased by 3.8 per cent to 7,500 billion ton-miles, whilst petroleum products increased by 2.0 per cent to 2,010 billion ton-miles. The decrease in ton-miles for crude oil was attributable mainly to the shortening of average transport distances brought about by changing trade routes as a result of production cuts in the Middle East Gulf OPEC members and the reduction in trade. One of the reasons for the increase in ton-miles for petroleum products may be that India and the Republic of Korea increased production, so the Middle East Gulf refineries had to develop markets in other consumer areas such as Europe and the United States. Consequently, average transportation distances for petroleum products increased. 33. In the dry bulk segment in 1999, iron ore decreased in volume for the second consecutive year. Accordingly, its transport performance declined by 3.7 per cent to 2,220 billion ton-miles. Coal and grain increased in volume by 4.2 per cent and 10.0 per cent respectively, pushing their shipping demand up to the highest level of 2,430 billion ton-miles and 1,170 billion ton-miles respectively. The shipping performance for the three main dry bulk commodities combined increased by 0.5 per cent to 5,820 billion ton-miles in 1999. In the category of other cargo, shipping performance also improved by 3.5 per cent to 6,150 billion ton-miles in 1999. The trade in containers is the most important commodity affecting the performance in ton-miles.

14
Table 5
World shipping performance by types of cargo, selected years (billions of ton-miles)
Oil Year
Crude
Products
Iron ore
Coal
Grain a
Other cargo
Total trade
1970
5 597
890
1 093
481
475
2 118
10 654
1980
8 385
1 020
1 613
952
1 087
3 720
16 777
1985
4 007
1 150
1 675
1 479
1 004
3 750
13 065
1990
6 261
1 560
1 978
1 849
1 073
4 440
17 161
1995
7 225
1 945
2 287
2 176
1 160
5 395
20 188
1996
7 363
2 040
2 227
2 217
1 126
5 705
20 678
1997
7 830
2 050
2 444
2 332
1 169
6 000
21 825
1998
7 793
1 970
2 306
2 419
1 064
5 940
21 492 1999
7 500
2 010
2 220
2 430
1 170
6 150
21 480
Source: Fearnleys (Oslo), Review 1999. a Including wheat, maize, barley, oats, rye, sorghum and soya beans.
Chapter II
STRUCTURE AND OWNERSHIP OF THE WORLD FLEET This chapter reviews the supply-side dynamics of the world maritime industry. The information and data provided comprehensively cover the structure and ownership of the world fleet. The chapter also reviews deliveries and demolition of vessels, tonnage on order and markets for second-hand tonnage.
A. STRUCTURE OF THE WORLD FLEET Principal types of vessel 34. Comparative time-series data on the world fleet for 1997, 1998 and 1999 are provided in table 6 and graph 4. The world merchant fleet amounted to 799.0 million deadweight tons (dwt) at the end of 1999. This represents a 1.3 per cent increase over 1998, when the world fleet had expanded at a rate of 1.6 per cent from the tonnage in 1997. The relatively low rate of fleet expansion was attributable primarily to an increase to 30.7 million dwt of tonnage broken up and lost, while the newbuilding deliveries increased slightly to 40.5 million dwt, leaving a net gain of 9.8 million dwt in 1999 as compared with a net gain of 12.0 million dwt in 1998. 35. The tonnage of oil tankers and dry bulk carriers continued to increase in 1999 by 1.1 per cent and 0.2 per cent respectively, representing 70.0 per cent of total tonnage in 1999, a slight decline from 70.3 per cent in the previous year. The fleet of general cargo ships increased in 1999 slightly by 0.2 per cent representing 12.7 per cent of the world total fleet. Containerships in terms of deadweight tonnage increased by 2.5 million dwt or 4.1 per cent, which now represented 7.9 per cent of the world total fleet. This relatively high rate of increase reflected the growing portion of manufactured goods being traded which are generally moving in containers. Tonnage of liquid gas carriers (mainly LNG and LPG carriers) and ferries/passenger ships have been steadily increasing in absolute terms (deadweight tonnage).
World containership fleet 36. The world fleet of fully cellular containerships continued to expand substantially in 1999 in terms of both number of ships and their TEU capacity, reaching 2,433 ships with a total capacity of 4,298,000 TEUs by the end of 1999, representing an increase of 2.9 per cent in the number of ships and 5.8 per cent in TEU capacity over the previous year (see table 7). Ship sizes also continued to increase with average carrying capacity per ship growing from 1,717 TEUs in 1998 to 1,766 TEUs in 1999, reflecting economies of scale for reduction in operating costs. At the end of 1999, 98 post-Panamax ships with an aggregated capacity of 523,500 TEUs were in service (average carrying capacity 5,342 TEUs), representing 4.1 per cent of the number of ships and 12.4 per cent of the TEU capacity of the world containership fleet. This development will continue, judging by the upward trend of post-Panamax newbuilding orders. Towards the end of 1999, the newbuilding orders for all sizes stood at 247 ships, with a total capacity of 803,000 TEUs, which were scheduled to enter into service over the next couple of years. Within these newbuildings, 56 ships with a total capacity of 324,700 TEUs were post-Panamax size, accounting for 22.7 per cent of the number of ships and 40.4 per cent in the capacity of the world order book. 37. The world containership fleet registered in major open-registry countries continued to expand in 1999 to 39.5 per cent of the world TEU capacity as compared to 38.1 per cent in 1998.

16
Table 6 World fleet size by principal types of vessel, 1997-1999 a (end-of-year figures, in thousands of dwt)
Principal types
1997
1998
1999
Percentage change
1998/1999
272 023
279 509 282 458
1.1
Oil tankers
35.1
35.4
35.4
281 012
275 519
276 091
0.2
Bulk carriers
36.2
34.9
34.6
20 256
17 720
16 723
-5.6
Ore/bulk/oil
2.6
2.2
2.1
260 756
257 799
259 368
0.6
Ore/bulk
33.6
32.7
32.5
103 880
101 259
101 481
0.2
General cargo ships
13.4
12.8
12.7
56 108
61 147
63 637
4.1
Container ships
7.2
7.8
8.0
62 904
71 291
75 328
5.7
Other types of ships
8.1
9.0
9.4
16 021
16 471
17 334
5.2
Liquefied gas carriers
2.1
2.1
2.2
7 846
7 740
7 813
0.9
Chemical tankers
1.0
1.0
1.0
920
885
849
-4.1
Miscellaneous tankers
0.1
0.1
0.1
4 614
4 803
4 944
2.9
Ferries and passenger ships
0.6
0.6
0.6
33 503
41 392
44 388
7.2
Others
4.3
5.2
5.6
World total
775 927
788 725
798 995
1.3
100.0
100.0
100.0
Source: UNCTAD secretariat on the basis of data supplied by Lloyd's Maritime Information Services (London). a Percentage shares are shown in italics.
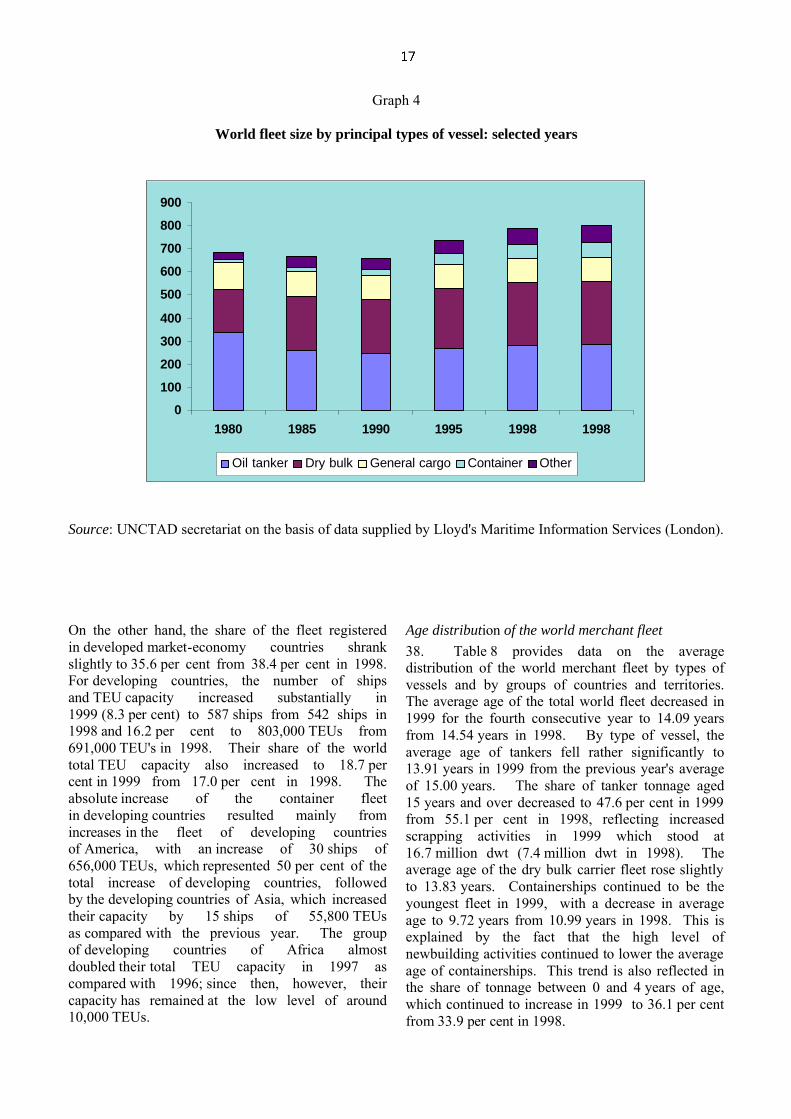
Graph 4
World fleet size by principal types of vessel: selected years
0
100
200
300
400
500
600
700
800
900
1980 1985 1990 1995 1998 1998
Oil tanker Dry bulk General cargo Container Other
Source: UNCTAD secretariat on the basis of data supplied by Lloyd's Maritime Information Services (London). On the other hand, the share of the fleet registered in developed market-economy countries shrank slightly to 35.6 per cent from 38.4 per cent in 1998. For developing countries, the number of ships and TEU capacity increased substantially in 1999 (8.3 per cent) to 587 ships from 542 ships in 1998 and 16.2 per cent to 803,000 TEUs from 691,000 TEU's in 1998. Their share of the world total TEU capacity also increased to 18.7 per cent in 1999 from 17.0 per cent in 1998. The absolute increase of the container fleet in developing countries resulted mainly from increases in the fleet of developing countries of America, with an increase of 30 ships of 656,000 TEUs, which represented 50 per cent of the total increase of developing countries, followed by the developing countries of Asia, which increased their capacity by 15 ships of 55,800 TEUs as compared with the previous year. The group of developing countries of Africa almost doubled their total TEU capacity in 1997 as compared with 1996; since then, however, their capacity has remained at the low level of around 10,000 TEUs.
Age distribution of the world merchant fleet 38. Table 8 provides data on the average distribution of the world merchant fleet by types of vessels and by groups of countries and territories. The average age of the total world fleet decreased in 1999 for the fourth consecutive year to 14.09 years from 14.54 years in 1998. By type of vessel, the average age of tankers fell rather significantly to 13.91 years in 1999 from the previous year's average of 15.00 years. The share of tanker tonnage aged 15 years and over decreased to 47.6 per cent in 1999 from 55.1 per cent in 1998, reflecting increased scrapping activities in 1999 which stood at 16.7 million dwt (7.4 million dwt in 1998). The average age of the dry bulk carrier fleet rose slightly to 13.83 years. Containerships continued to be the youngest fleet in 1999, with a decrease in average age to 9.72 years from 10.99 years in 1998. This is explained by the fact that the high level of newbuilding activities continued to lower the average age of containerships. This trend is also reflected in the share of tonnage between 0 and 4 years of age, which continued to increase in 1999 to 36.1 per cent from 33.9 per cent in 1998.

18
Table 7
Distribution of the world fleet and TEU capacity of fully cellular container ships by groups of countries, in 1997, 1998 and 1999
(end-of-year figures)
Number of ships
TEU capacity and percentage shares a
Flags of registration by groups of countries
1997 1998
1999
1997
1998
1999
2 204
2 365
2 433
3 632 070
4 061 653
4 297 874
World total
100.0
99.9
100.0
675
728
693
1 398 781
1 561 060
1 530 655
Developed market-economy countries
38.5
38.4
35.6
800
887
944
1 315 130
1 545 818
1 698 576
Major open-registry countries
36.2
38.1
39.5
1 475
1 615
1 637
2 713 911
3 106 878
3 229 231
Total, developed market-economy and major open-registry countries
74.7
76.5
75.1
35
35
34
23 276
26 331
26 699 Countries of Central and Eastern Europe (including the former USSR)
0.6
0.6
0.6
99
90
89
96 739
94 863
96 450 Socialist countries of Asia
2.7
2.3
2.2
504
542
587
628 999
691 328
803 135
Developing countries
17.3
17.0
18.7
8
10
10
9 117
11 026
10 719
of which in: Africa
0.3
0.3
0.2
138
162
192
119 299
157 836
214 153
America
3.3
3.9
5.0
353
365
380
496 028
516 431
572 212
Asia
13.7
12.7
13.3
5
5
5
4 555
6 035
6 051
Europe
0.1
0.1
0.1
-
-
-
..
..
..
Oceania
..
..
..
Other, unallocated
91
83
86
169 145
142 253
142 359
4.7
3.5
3.3
Source: UNCTAD secretariat on the basis of data supplied by Lloyd's Maritime Information Services (London). a Percentage shares are shown in italics.
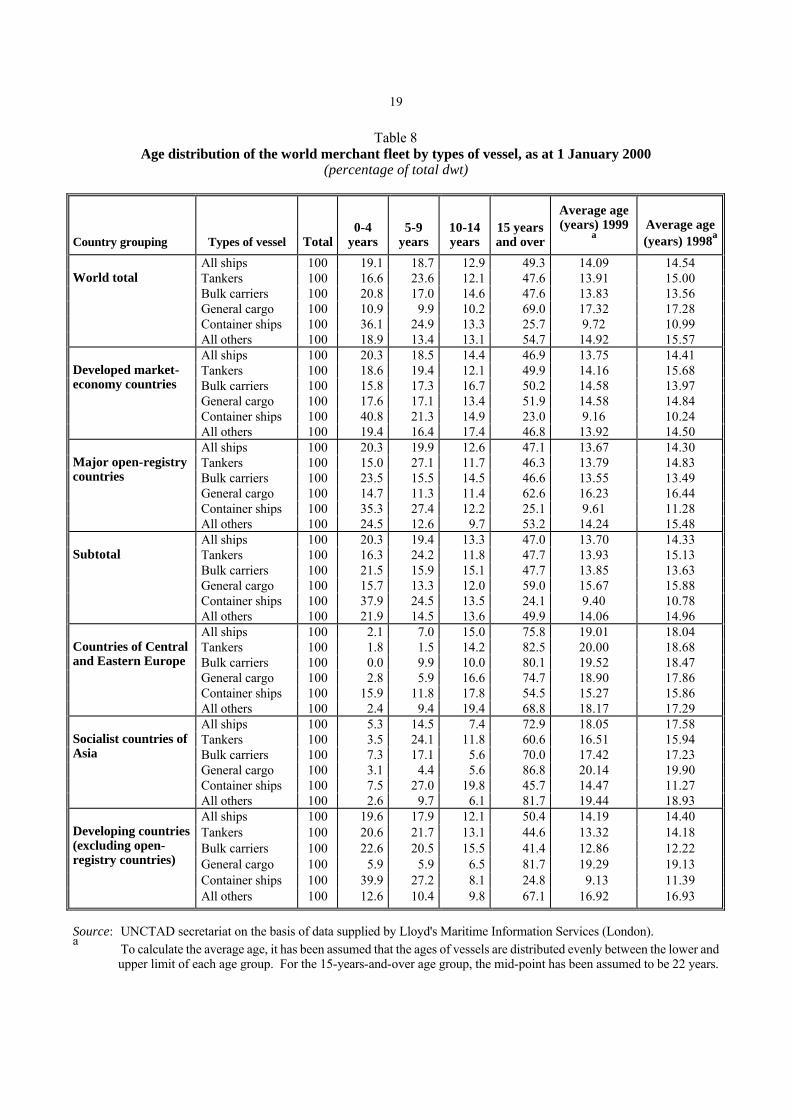
19
Table 8 Age distribution of the world merchant fleet by types of vessel, as at 1 January 2000
(percentage of total dwt)
Country grouping
Types of vessel
Total
0-4
years
5-9
years
10-14 years
15 years and over
Average age (years) 1999
a
Average age (years) 1998a
All ships 100 19.1 18.7 12.9 49.3 14.09 14.54 Tankers 100 16.6 23.6 12.1 47.6 13.91 15.00 Bulk carriers 100 20.8 17.0 14.6 47.6 13.83 13.56 General cargo 100 10.9 9.9 10.2 69.0 17.32 17.28 Container ships 100 36.1 24.9 13.3 25.7 9.72 10.99
World total
All others 100 18.9 13.4 13.1 54.7 14.92 15.57 All ships 100 20.3 18.5 14.4 46.9 13.75 14.41 Tankers 100 18.6 19.4 12.1 49.9 14.16 15.68 Bulk carriers 100 15.8 17.3 16.7 50.2 14.58 13.97 General cargo 100 17.6 17.1 13.4 51.9 14.58 14.84 Container ships 100 40.8 21.3 14.9 23.0 9.16 10.24
Developed market-economy countries
All others 100 19.4 16.4 17.4 46.8 13.92 14.50 All ships 100 20.3 19.9 12.6 47.1 13.67 14.30 Tankers 100 15.0 27.1 11.7 46.3 13.79 14.83 Bulk carriers 100 23.5 15.5 14.5 46.6 13.55 13.49 General cargo 100 14.7 11.3 11.4 62.6 16.23 16.44 Container ships 100 35.3 27.4 12.2 25.1 9.61 11.28
Major open-registry countries
All others 100 24.5 12.6 9.7 53.2 14.24 15.48 All ships 100 20.3 19.4 13.3 47.0 13.70 14.33 Tankers 100 16.3 24.2 11.8 47.7 13.93 15.13 Bulk carriers 100 21.5 15.9 15.1 47.7 13.85 13.63 General cargo 100 15.7 13.3 12.0 59.0 15.67 15.88 Container ships 100 37.9 24.5 13.5 24.1 9.40 10.78
Subtotal
All others 100 21.9 14.5 13.6 49.9 14.06 14.96 All ships 100 2.1 7.0 15.0 75.8 19.01 18.04 Tankers 100 1.8 1.5 14.2 82.5 20.00 18.68 Bulk carriers 100 0.0 9.9 10.0 80.1 19.52 18.47 General cargo 100 2.8 5.9 16.6 74.7 18.90 17.86 Container ships 100 15.9 11.8 17.8 54.5 15.27 15.86
Countries of Central and Eastern Europe
All others 100 2.4 9.4 19.4 68.8 18.17 17.29 All ships 100 5.3 14.5 7.4 72.9 18.05 17.58 Tankers 100 3.5 24.1 11.8 60.6 16.51 15.94 Bulk carriers 100 7.3 17.1 5.6 70.0 17.42 17.23 General cargo 100 3.1 4.4 5.6 86.8 20.14 19.90 Container ships 100 7.5 27.0 19.8 45.7 14.47 11.27
Socialist countries of Asia
All others 100 2.6 9.7 6.1 81.7 19.44 18.93 All ships 100 19.6 17.9 12.1 50.4 14.19 14.40 Tankers 100 20.6 21.7 13.1 44.6 13.32 14.18 Bulk carriers 100 22.6 20.5 15.5 41.4 12.86 12.22 General cargo 100 5.9 5.9 6.5 81.7 19.29 19.13 Container ships 100 39.9 27.2 8.1 24.8 9.13 11.39
Developing countries (excluding open-registry countries)
All others 100 12.6 10.4 9.8 67.1 16.92 16.93
Source: UNCTAD secretariat on the basis of data supplied by Lloyd's Maritime Information Services (London). a To calculate the average age, it has been assumed that the ages of vessels are distributed evenly between the lower and
upper limit of each age group. For the 15-years-and-over age group, the mid-point has been assumed to be 22 years.

39. By country grouping, the major open-registry countries continued to have the lowest average age of all ships (13.67 years in 1999 versus 14.30 years in 1998), as a growing tendency to register newbuildings under open-registry flags was observed. The group's share of tonnage between 0 and 4 years of age increased in 1999 to 20.3 per cent from 19.1 per cent in 1998. On the other hand, their share of tonnage of 15 years and over decreased in 1999 to 47.1 per cent from 50.7 per cent in 1998. Developed market-economy countries also reduced the average age of their fleet to 13.75 years in 1999 compared to 14.41years in 1998. In this group, the average age of containerships was 9.16 years in 1999 as compared with 10.24 years in 1998. The share of ships aged between 0 and 4 years increased to 40.8 per cent in 1999 from 37.9 per cent in 1998. The average age of all ships registered in developing countries (excluding major open-registry countries) decreased slightly in 1999 to 14.19 years as compared with 14.40 years in 1998. This group's containerships' average age improved substantially to 9.13 years in 1999 from 11.39 years in 1998, reflecting the high share of 39.9 per cent of ships between 0 and 4 years of age. The average age of tonnage registered in the socialist countries of Asia continued to increase to 18.05 years in 1999 from 17.58 years in 1998. The countries of Central and Eastern Europe continued to have the oldest fleet (19.01 years in 1999 versus 18.04 years in 1998) with vessels built more than 15 years ago representing 75.8 per cent of their total fleet (67.7 per cent in 1998). Delivery of newbuildings 40. Newbuilding activities attained the highest level ever recorded in terms of deadweight tons with deliveries amounting to 40.5 million dwt in 1999 (see table 9). However, the total number of vessels delivered decreased to 940 units from 1,041 units in 1998. Thus the average size of tonnage increased to 43,000 dwt from 34,000 dwt in the previous year. This high level of delivery continued to be sustained primarily by tanker deliveries of 19.1 million dwt, which was up 51.1 per cent from the 1998 level. Another features was that more of the larger tankers were delivered in 1999 than in the previous year, with an average deadweight tonnage of 119,000 in 1999 compared to 105,000 in 1998. A similar trend was observed in the dry bulk carriers sector. The number of newbuildings decreased to 191 units in 1999 from 217
units in 1998, while total tonnage expanded to 12.6 million dwt from 11.6 million dwt, with the average deadweight tons per vessel increasing to 66,000 from 53,000 in 1998. Newbuildings for other types of vessels including general cargo ships and containerships as a whole shrank both in number and in deadweight tonnage to 585 units of 8.4 million dwt from 704 units of 11.1 million dwt in 1998. Demolition of ships 41. Trends in tonnage, types and average age of broken-up vessels are shown in tables 10, 11 and 12. In 1999, total tonnage sold for demolition continued to increase substantially by 21.8 per cent from the tonnage of the previous year to 30.7 million dwt, which accounted for 3.9 per cent of the world total deadweight tons, as compared to 3.2 per cent in 1998. Sales of tankers for breaking up increased significantly by 124.3 per cent to 16.7 million dwt, which was more than double the 7.4 million dwt broken up in 1998. These sales were strongly influenced by the increasing pressure from law-enforcing governmental agents and environmental groups, coupled with the availability of newbuildings. ULCC/VLCC sales doubled from 16 units in 1998 to 35 units in 1999. Suezmaxes also doubled from 13 units in 1998 to 26 units in 1999, while Aframaxes actually tripled from 10 units in 1998 to 30 units in 1999. In the smaller category of crude oil tankers, 21 ships were sold for scrap in 1999, as compared to 13 units in the previous year. Due to the increased scrapping activity, the average age of tankers sold for demolition was significantly down from 28.2 years in 1998 to 26.2 years in 1999. Dry bulk carriers sold for scrap amounted to only 9.7 million dwt in 1999, down from 12.8 million dwt in 1998. Most of this reduction was accounted for by the reduction in the scrapping of larger size bulk carriers. Capesize units decreased to 19 in 1999 from 28 in 1998 while Panamax size showed less reduction, from 60 units in 1998 to 56 units in 1999. Sales of handy-size dry bulkers were down to 135 units in 1999 from 178 in the previous year. The average age of all dry bulk carriers broken up was 25.0 years in 1999. Other ship types also have a similar trading life with containerships being sold to breakers with an average age of 24.8 years and general cargo ships with an average age of 26.7 years in 1999.
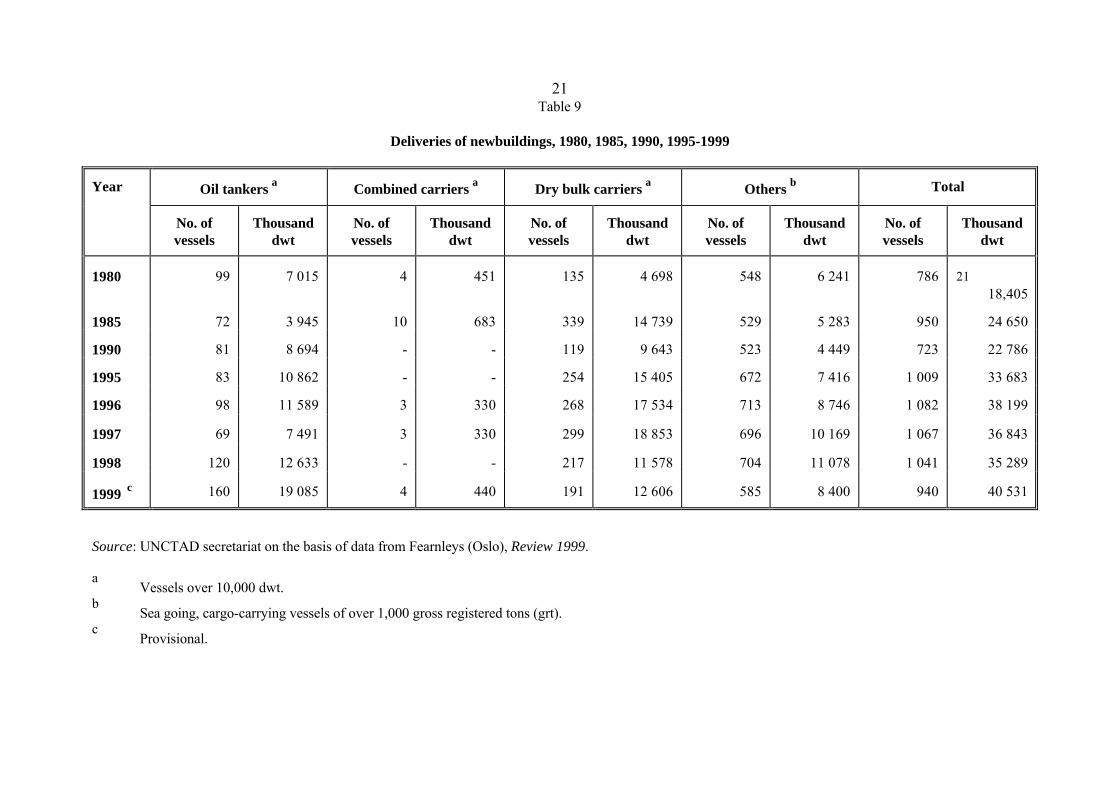
21 Table 9 Deliveries of newbuildings, 1980, 1985, 1990, 1995-1999
Oil tankers a
Combined carriers a
Dry bulk carriers a
Others b
Total
Year
No. of vessels
Thousand
dwt
No. of vessels
Thousand
dwt
No. of vessels
Thousand
dwt
No. of vessels
Thousand
dwt
No. of vessels
Thousand
dwt 1980
99
7 015
4
451
135
4 698
548
6 241
786
21
18,405 1985
72
3 945
10
683
339
14 739
529
5 283
950
24 650
1990
81
8 694
-
-
119
9 643
523
4 449
723
22 786
1995
83
10 862
-
-
254
15 405
672
7 416
1 009
33 683
1996
98
11 589
3
330
268
17 534
713
8 746
1 082
38 199
1997
69
7 491
3
330
299
18 853
696
10 169
1 067
36 843
1998
120
12 633
-
-
217
11 578
704
11 078
1 041
35 289
1999 c
160
19 085
4
440
191
12 606
585
8 400
940
40 531
Source: UNCTAD secretariat on the basis of data from Fearnleys (Oslo), Review 1999. a Vessels over 10,000 dwt.
b Sea going, cargo-carrying vessels of over 1,000 gross registered tons (grt).
c Provisional.

22
Table 10 Broken-up tonnage trends, 1980 and 1993-1999
Broken-up tonnage
1980
1993
1994
1995
1996
1997
1998
1999
Tonnage sold for breaking (million dwt)
10.0
16.9
20.8
15.3
18.1
14.8
25.2
30.7
Share of broken-up tonnage in the total world fleet (percentage)
1.5
2.4
2.9
2.1
2.4
1.9
3.2
3.9
Sources: UNCTAD secretariat on the basis of data supplied by Fearnleys (Oslo), Review, various issues; and Lloyd's Maritime Information Services (London).
Table 11
Tonnage reported sold for breaking by types of vessel, 1995-1999 (thousands of dwt and percentage shares)
Thousand dwt
Percentages
Types of vessel
1995
1996
1997
1998
1999
1995
1996
1997
1998
1999
Tankers
10 877
6 550
3 578
7 426
16 654
71.0
36.1
24.2
29.4
54.2
Combined carriers
1 228
1 861
423
1 435
1 130
8.0
10.3
2.9
5.7
3.7
Dry bulk carriers
2 135
7 632
8 161
12 847
9 687
13.9
42.1
55.1
50.9
31.5
Others
1 081
2 092
2 646
3 533
3 253
7.1
11.5
17.9
14.0
10.6
Total
15 321
18 135
14 808
25 241
30 724
100.0
100.0
100.0
100.0
100.0
Source: UNCTAD secretariat on the basis of data supplied by Fearnleys (Oslo), Review, various issues.
Table 12
Average age of broken-up ships by type from 1991 to 1999 a (years)
Year
Tankers
Dry bulk carriers
Container ships
General cargo ships
1991 1992 1993 1994 1995 1996 1997 1998 1999
25.3 25.8 24.7 24.6 26.1 26.0 28.2 28.2 26.2
22.0 22.9 24.0 24.1 24.5 24.3 25.3 25.2 25.0
19.0 19.1 22.9 24.0 24.0 26.2 22.8 25.5 24.8
24.8 25.7 26.4 27.1 25.8 27.8 26.9 26.7 26.7
Source: UNCTAD secretariat on the basis of data supplied by Institute of Shipping Economics and Logistics (Bremen), Shipping Statistics, 2000, Nos. 1-2.
a Ships of 300 grt and over.
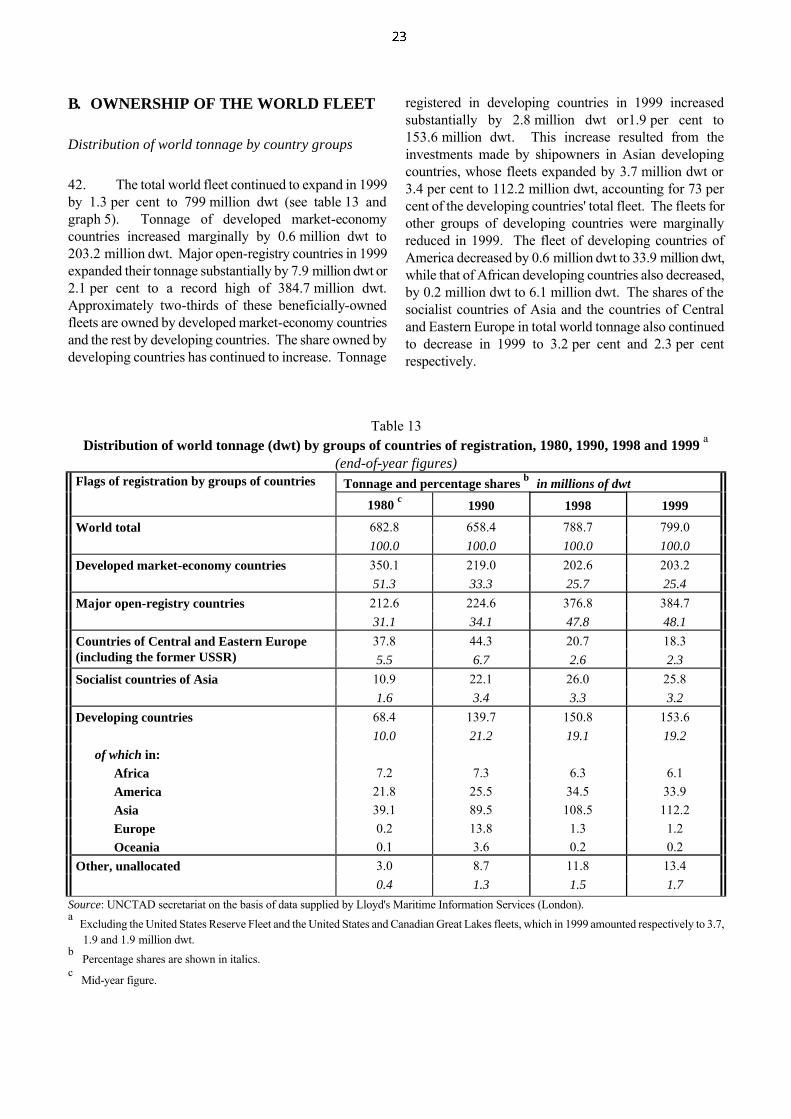
B. OWNERSHIP OF THE WORLD FLEET Distribution of world tonnage by country groups
42. The total world fleet continued to expand in 1999 by 1.3 per cent to 799 million dwt (see table 13 and graph 5). Tonnage of developed market-economy countries increased marginally by 0.6 million dwt to 203.2 million dwt. Major open-registry countries in 1999 expanded their tonnage substantially by 7.9 million dwt or 2.1 per cent to a record high of 384.7 million dwt. Approximately two-thirds of these beneficially-owned fleets are owned by developed market-economy countries and the rest by developing countries. The share owned by developing countries has continued to increase. Tonnage
registered in developing countries in 1999 increased substantially by 2.8 million dwt or1.9 per cent to 153.6 million dwt. This increase resulted from the investments made by shipowners in Asian developing countries, whose fleets expanded by 3.7 million dwt or 3.4 per cent to 112.2 million dwt, accounting for 73 per cent of the developing countries' total fleet. The fleets for other groups of developing countries were marginally reduced in 1999. The fleet of developing countries of America decreased by 0.6 million dwt to 33.9 million dwt, while that of African developing countries also decreased, by 0.2 million dwt to 6.1 million dwt. The shares of the socialist countries of Asia and the countries of Central and Eastern Europe in total world tonnage also continued to decrease in 1999 to 3.2 per cent and 2.3 per cent respectively.
Table 13 Distribution of world tonnage (dwt) by groups of countries of registration, 1980, 1990, 1998 and 1999 a
(end-of-year figures)
Tonnage and percentage shares b in millions of dwt Flags of registration by groups of countries
1980 c 1990
1998
1999
682.8
658.4
788.7
799.0 World total
100.0
100.0
100.0
100.0 350.1
219.0
202.6
203.2
Developed market-economy countries
51.3
33.3
25.7
25.4 212.6
224.6
376.8
384.7
Major open-registry countries
31.1
34.1
47.8
48.1 37.8
44.3
20.7
18.3
Countries of Central and Eastern Europe (including the former USSR)
5.5
6.7
2.6
2.3
10.9
22.1
26.0
25.8 Socialist countries of Asia
1.6
3.4
3.3
3.2 68.4
139.7
150.8
153.6
Developing countries
10.0
21.2
19.1
19.2 of which in:
Africa
7.2
7.3
6.3
6.1 America
21.8
25.5
34.5
33.9
Asia
39.1
89.5
108.5
112.2 Europe
0.2
13.8
1.3
1.2
Oceania
0.1
3.6
0.2
0.2 3.0
8.7
11.8
13.4
Other, unallocated
0.4
1.3
1.5
1.7
Source: UNCTAD secretariat on the basis of data supplied by Lloyd's Maritime Information Services (London). a Excluding the United States Reserve Fleet and the United States and Canadian Great Lakes fleets, which in 1999 amounted respectively to 3.7,
1.9 and 1.9 million dwt. b Percentage shares are shown in italics.
c Mid-year figure.

Graph 5 World tonnage by country groups, 1999 (percentage distribution of dwt)
Source: UNCTAD secretariat on the basis of data supplied by Lloyd's Maritime Information Services (London) Distribution of world tonnage by types of vessel 43. Table 14 provides more detailed data on fleet distribution by types of vessel and country groups for 1980, 1998 and 1999. In the oil tanker sector, the share of developed market-economy countries stopped its continuous decrease, but increased only marginally to 30.5 per cent in 1999 from 29.8 per cent in 1998. Conversely, the open-registry countries' share decreased slightly to 50.2 per cent, as compared to 51.2 per cent in the previous year. These very small fluctuations in both country groups still reflect the continuous trend, specifically for owners in developed market-economy countries, to prefer to register tanker tonnage under open registry. Developing countries continued in 1999 to increase their share from 15.9 per cent to 16.2 per cent; this represented in particular the continuously increasing share of Asian developing countries, which expanded in 1999 to 12.9 per cent of the world tanker fleet. 44. In the dry bulk carrier sector, the tonnage share of developed market-economy countries in the world total continued to decrease to 17.0 per cent in 1999, which stood at one third of the share in 1980 (52.7 per cent). Major open-registry countries continuously expanded their share, amounting to 54.9 per cent in 1999, as compared to 53.5 per cent in
1998. The developing countries' share remained flat in 1999 at 20.1 per cent, while the share of developing countries of Asia in 1999 was also at virtually the same level (15.7 per cent) as in the previous year (15.6 per cent). Dry bulk carriers represent the most important fleet of developing countries with a share of nearly 36 per cent in 1999 (37 per cent in 1998) of the total tonnage owned and registered in this group (see annex IIIb). The fleet developments, in the sector of general cargo ships, of the three major country groups, including developing Asia, were very similar to that of the dry bulk carrier sector. Nevertheless, the developing countries' share in the general cargo ship sector, represents 26.5 per cent, which is the highest in this country group's share in the five principal types of vessel. 45. The world containership fleet remained at 8 per cent of the world total deadweight tons in 1999. Developed market-economy countries decreased their share of containership deadweight tonnage to 34.6 per cent in 1999. On the other hand, the major open-registry countries' share continued to expand, reaching 39.8 per cent in that year, approximately two-thirds of which represented containerships beneficially owned by owners in developed market-economy countries. The share of developing countries increased very slightly to 18.8 per cent, of which 13.6 per cent was shared by Asian developing countries.
C.&E. Europe2.3%
Major open-registry48.1%
Socialist Asia3.2%
DMECs25.4%
Other1.7%
Developing19.2%
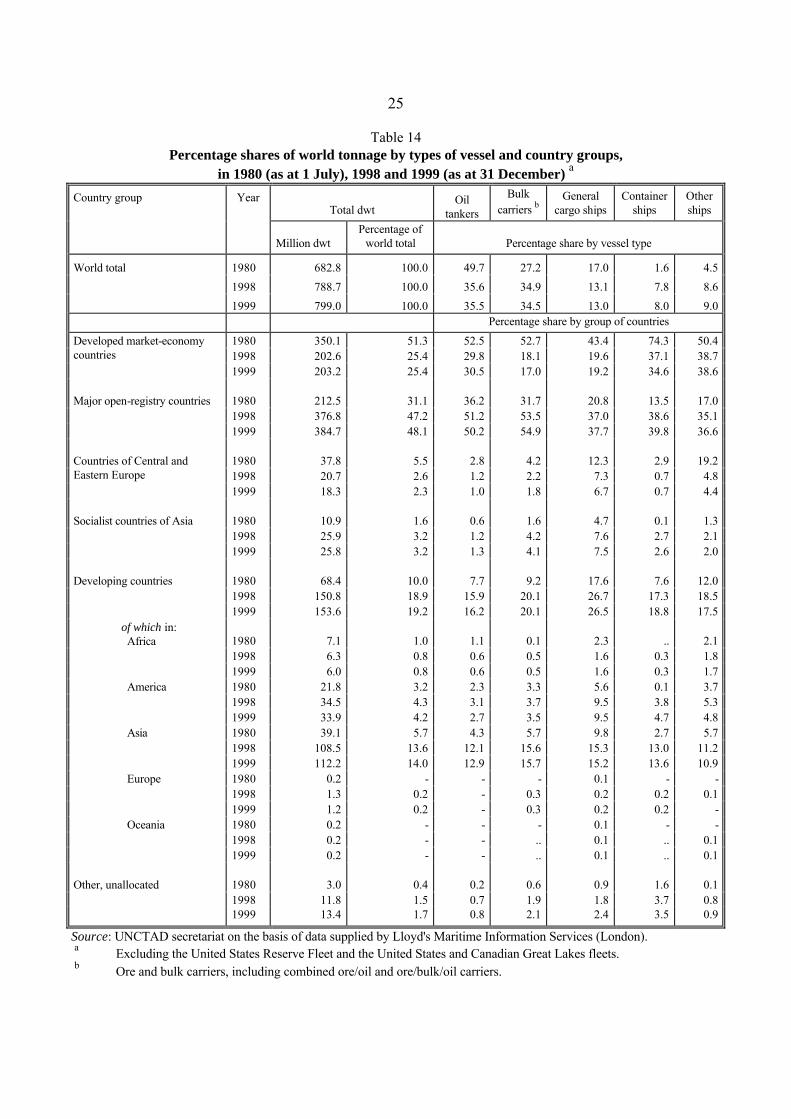
25
Table 14 Percentage shares of world tonnage by types of vessel and country groups,
in 1980 (as at 1 July), 1998 and 1999 (as at 31 December) a
Total dwt Oil
tankers
Bulk carriers b
General cargo ships
Container ships
Other ships
Country group
Year
Million dwt Percentage of
world total Percentage share by vessel type 1980
682.8
100.0
49.7
27.2
17.0
1.6
4.5
1998
788.7
100.0
35.6
34.9
13.1
7.8
8.6
World total
1999
799.0
100.0
35.5
34.5
13.0
8.0
9.0
Percentage share by group of countries 1980
350.1
51.3
52.5
52.7
43.4
74.3
50.4
1998
202.6
25.4
29.8
18.1
19.6
37.1
38.7
Developed market-economy countries
1999
203.2
25.4
30.5
17.0
19.2
34.6
38.6 1980
212.5
31.1
36.2
31.7
20.8
13.5
17.0 1998
376.8
47.2
51.2
53.5
37.0
38.6
35.1
Major open-registry countries
1999
384.7
48.1
50.2
54.9
37.7
39.8
36.6
1980
37.8
5.5
2.8
4.2
12.3
2.9
19.2 1998
20.7
2.6
1.2
2.2
7.3
0.7
4.8
Countries of Central and Eastern Europe
1999
18.3
2.3
1.0
1.8
6.7
0.7
4.4 1980
10.9
1.6
0.6
1.6
4.7
0.1
1.3 1998
25.9
3.2
1.2
4.2
7.6
2.7
2.1
Socialist countries of Asia
1999
25.8
3.2
1.3
4.1
7.5
2.6
2.0
1980
68.4
10.0
7.7
9.2
17.6
7.6
12.0 1998
150.8
18.9
15.9
20.1
26.7
17.3
18.5
Developing countries
1999
153.6
19.2
16.2
20.1
26.5
18.8
17.5
1980
7.1
1.0
1.1
0.1
2.3
..
2.1 1998
6.3
0.8
0.6
0.5
1.6
0.3
1.8
of which in: Africa
1999
6.0
0.8
0.6
0.5
1.6
0.3
1.7
1980
21.8
3.2
2.3
3.3
5.6
0.1
3.7 1998
34.5
4.3
3.1
3.7
9.5
3.8
5.3
America
1999
33.9
4.2
2.7
3.5
9.5
4.7
4.8
1980
39.1
5.7
4.3
5.7
9.8
2.7
5.7 1998
108.5
13.6
12.1
15.6
15.3
13.0
11.2
Asia
1999
112.2
14.0
12.9
15.7
15.2
13.6
10.9
1980
0.2
-
-
-
0.1
-
- 1998
1.3
0.2
-
0.3
0.2
0.2
0.1
Europe
1999
1.2
0.2
-
0.3
0.2
0.2
-
1980
0.2
-
-
-
0.1
-
- 1998
0.2
-
-
..
0.1
..
0.1
Oceania
1999
0.2
-
-
..
0.1
..
0.1
1980
3.0
0.4
0.2
0.6
0.9
1.6
0.1 1998
11.8
1.5
0.7
1.9
1.8
3.7
0.8
Other, unallocated
1999
13.4
1.7
0.8
2.1
2.4
3.5
0.9
Source: UNCTAD secretariat on the basis of data supplied by Lloyd's Maritime Information Services (London). a Excluding the United States Reserve Fleet and the United States and Canadian Great Lakes fleets. b Ore and bulk carriers, including combined ore/oil and ore/bulk/oil carriers.
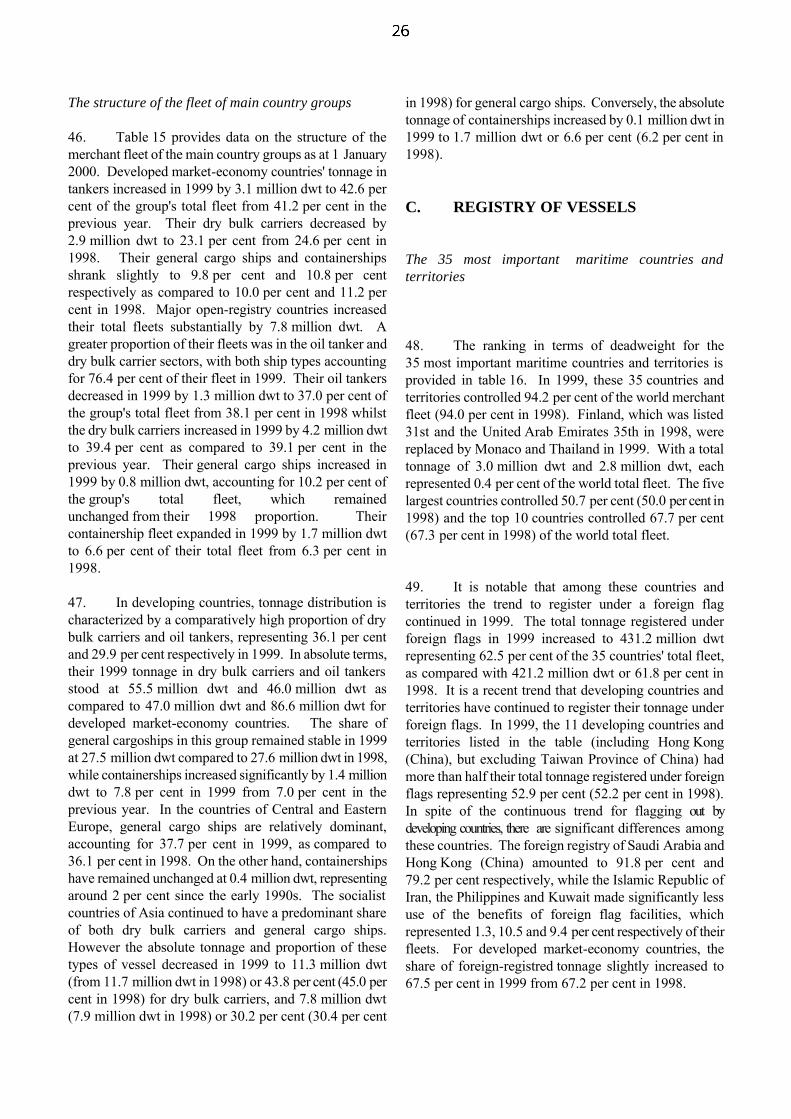
The structure of the fleet of main country groups 46. Table 15 provides data on the structure of the merchant fleet of the main country groups as at 1 January 2000. Developed market-economy countries' tonnage in tankers increased in 1999 by 3.1 million dwt to 42.6 per cent of the group's total fleet from 41.2 per cent in the previous year. Their dry bulk carriers decreased by 2.9 million dwt to 23.1 per cent from 24.6 per cent in 1998. Their general cargo ships and containerships shrank slightly to 9.8 per cent and 10.8 per cent respectively as compared to 10.0 per cent and 11.2 per cent in 1998. Major open-registry countries increased their total fleets substantially by 7.8 million dwt. A greater proportion of their fleets was in the oil tanker and dry bulk carrier sectors, with both ship types accounting for 76.4 per cent of their fleet in 1999. Their oil tankers decreased in 1999 by 1.3 million dwt to 37.0 per cent of the group's total fleet from 38.1 per cent in 1998 whilst the dry bulk carriers increased in 1999 by 4.2 million dwt to 39.4 per cent as compared to 39.1 per cent in the previous year. Their general cargo ships increased in 1999 by 0.8 million dwt, accounting for 10.2 per cent of the group's total fleet, which remained unchanged from their 1998 proportion. Their containership fleet expanded in 1999 by 1.7 million dwt to 6.6 per cent of their total fleet from 6.3 per cent in 1998. 47. In developing countries, tonnage distribution is characterized by a comparatively high proportion of dry bulk carriers and oil tankers, representing 36.1 per cent and 29.9 per cent respectively in 1999. In absolute terms, their 1999 tonnage in dry bulk carriers and oil tankers stood at 55.5 million dwt and 46.0 million dwt as compared to 47.0 million dwt and 86.6 million dwt for developed market-economy countries. The share of general cargoships in this group remained stable in 1999 at 27.5 million dwt compared to 27.6 million dwt in 1998, while containerships increased significantly by 1.4 million dwt to 7.8 per cent in 1999 from 7.0 per cent in the previous year. In the countries of Central and Eastern Europe, general cargo ships are relatively dominant, accounting for 37.7 per cent in 1999, as compared to 36.1 per cent in 1998. On the other hand, containerships have remained unchanged at 0.4 million dwt, representing around 2 per cent since the early 1990s. The socialist countries of Asia continued to have a predominant share of both dry bulk carriers and general cargo ships. However the absolute tonnage and proportion of these types of vessel decreased in 1999 to 11.3 million dwt (from 11.7 million dwt in 1998) or 43.8 per cent (45.0 per cent in 1998) for dry bulk carriers, and 7.8 million dwt (7.9 million dwt in 1998) or 30.2 per cent (30.4 per cent
in 1998) for general cargo ships. Conversely, the absolute tonnage of containerships increased by 0.1 million dwt in 1999 to 1.7 million dwt or 6.6 per cent (6.2 per cent in 1998). C. REGISTRY OF VESSELS The 35 most important maritime countries and territories 48. The ranking in terms of deadweight for the 35 most important maritime countries and territories is provided in table 16. In 1999, these 35 countries and territories controlled 94.2 per cent of the world merchant fleet (94.0 per cent in 1998). Finland, which was listed 31st and the United Arab Emirates 35th in 1998, were replaced by Monaco and Thailand in 1999. With a total tonnage of 3.0 million dwt and 2.8 million dwt, each represented 0.4 per cent of the world total fleet. The five largest countries controlled 50.7 per cent (50.0 per cent in 1998) and the top 10 countries controlled 67.7 per cent (67.3 per cent in 1998) of the world total fleet. 49. It is notable that among these countries and territories the trend to register under a foreign flag continued in 1999. The total tonnage registered under foreign flags in 1999 increased to 431.2 million dwt representing 62.5 per cent of the 35 countries' total fleet, as compared with 421.2 million dwt or 61.8 per cent in 1998. It is a recent trend that developing countries and territories have continued to register their tonnage under foreign flags. In 1999, the 11 developing countries and territories listed in the table (including Hong Kong (China), but excluding Taiwan Province of China) had more than half their total tonnage registered under foreign flags representing 52.9 per cent (52.2 per cent in 1998). In spite of the continuous trend for flagging out by developing countries, there are significant differences among these countries. The foreign registry of Saudi Arabia and Hong Kong (China) amounted to 91.8 per cent and 79.2 per cent respectively, while the Islamic Republic of Iran, the Philippines and Kuwait made significantly less use of the benefits of foreign flag facilities, which represented 1.3, 10.5 and 9.4 per cent respectively of their fleets. For developed market-economy countries, the share of foreign-registred tonnage slightly increased to 67.5 per cent in 1999 from 67.2 per cent in 1998.
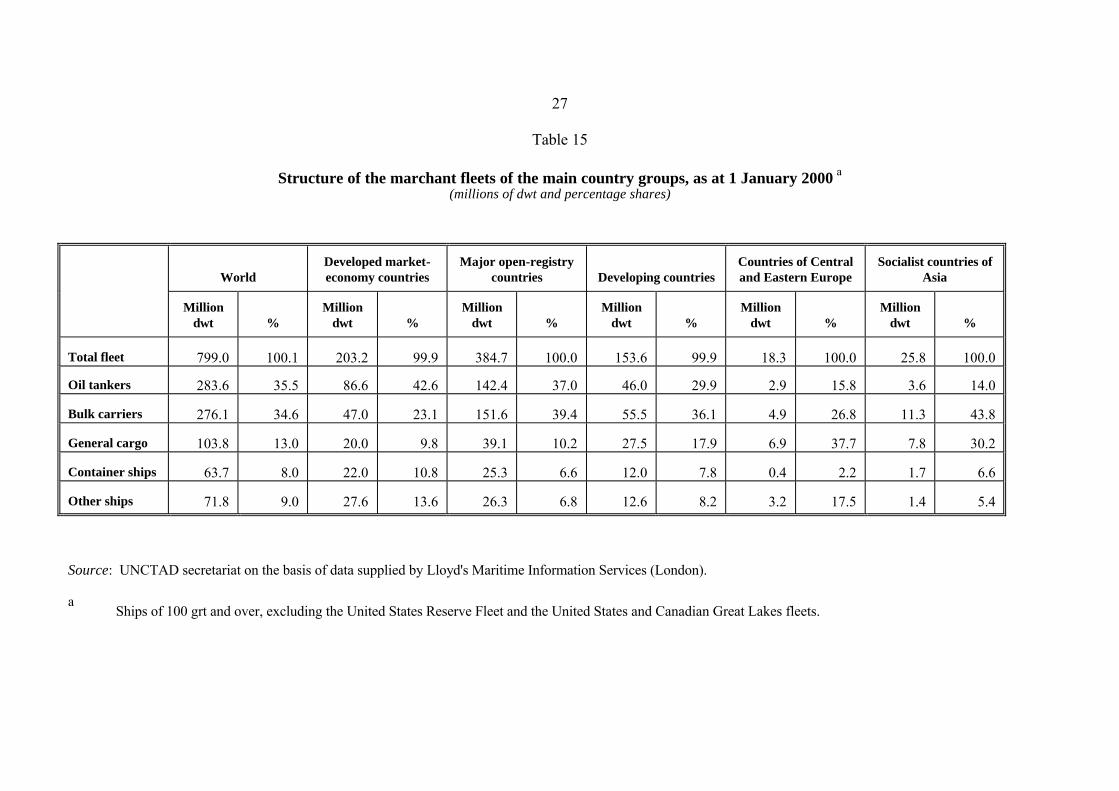
27
Table 15
Structure of the marchant fleets of the main country groups, as at 1 January 2000 a
(millions of dwt and percentage shares)
World
Developed market-economy countries
Major open-registry
countries Developing countries
Countries of Central and Eastern Europe
Socialist countries of
Asia
Million
dwt
%
Million
dwt
%
Million
dwt
%
Million
dwt
%
Million
dwt
%
Million
dwt
% Total fleet
799.0
100.1
203.2
99.9
384.7
100.0
153.6
99.9
18.3
100.0
25.8
100.0
Oil tankers
283.6
35.5
86.6
42.6
142.4
37.0
46.0
29.9
2.9
15.8
3.6
14.0
Bulk carriers
276.1
34.6
47.0
23.1
151.6
39.4
55.5
36.1
4.9
26.8
11.3
43.8
General cargo
103.8
13.0
20.0
9.8
39.1
10.2
27.5
17.9
6.9
37.7
7.8
30.2
Container ships
63.7
8.0
22.0
10.8
25.3
6.6
12.0
7.8
0.4
2.2
1.7
6.6
Other ships
71.8
9.0
27.6
13.6
26.3
6.8
12.6
8.2
3.2
17.5
1.4
5.4
Source: UNCTAD secretariat on the basis of data supplied by Lloyd's Maritime Information Services (London). a Ships of 100 grt and over, excluding the United States Reserve Fleet and the United States and Canadian Great Lakes fleets.
28
Table 16 The 35 most important maritime countries and territories, as at 1 January 2000 a
Number of vessels
Deadweight tonnage Country or territory of domicile b
National flag c
Foreign
flag
Total
National
flag
Foreign
flag
Total
Foreign flag
as percentage of total
Total as
percentage of world total
Greece
752
2 495
3 247
40 677 401
92 704 187
133 381 588
69.50
18.21
Japan
809
2 093
2 902
17 397 386
76 076 404
93 473 790
81.39
12.76
Norway
905
737
1 642
28 727 816
27 202 931
55 930 747
48.64
7.64
United States
502
926
1 428
12 009 757
36 857 906
48 867 663
75.42
6.67
China
1 621
551
2 172
22 316 216
17 179 402
39 495 618
43.50
5.39
Hong Kong (China)
132
424
556
6 573 740
24 965 979
31 539 719
79.16
4.31
Germany
498
1 445
1 943
7 500 404
21 813 852
29 314 256
74.41
4.00
Republic of Korea
455
441
896
7 199 786
18 033 248
25 233 034
71.47
3.44
Taiwan Province of China
163
346
509
7 603 196
12 088 206
19 691 402
61.39
2.69
United Kingdom
405
454
859
7 168 426
11 858 280
19 026 706
62.32
2.60
Singapore
459
277
736
11 569 710
7 190 637
18 760 347
38.33
2.56
Denmark
418
297
715
7 192 069
8 904 651
16 096 720
55.32
2.20
Russian Federation
2 142
348
2 490
8 539 161
7 455 812
15 994 973
46.61
2.18
Sweden
174
222
396
1 552 409
13 638 886
15 191 295
89.78
2.07
Italy
489
142
631
8 752 856
4 819 852
13 572 708
35.51
1.85
India
372
59
431
10 797 389
1 277 592
12 074 981
10.58
1.65
Saudi Arabia
52
71
123
902 652
10 124 808
11 027 460
91.81
1.51
Turkey
465
82
547
8 793 721
843 505
9 637 226
8.75
1.32
Brazil
168
23
191
6 087 542
2 802 672
8 890 214
31.53
1.21
Belgium
24
143
167
114 514
7 505 297
7 619 811
98.50
1.04
Malaysia
242
54
296
5 366 937
1 059 726
6 426 663
16.49
0.88
Iran, Islamic Rep. of
152
2
154
6 031 318
82 087
6 113 405
1.34
0.83
Switzerland
13
203
216
720 545
5 383 154
6 103 699
88.19
0.83
Netherlands
548
202
750
3 393 197
2 688 357
6 081 554
44.21
0.83
France
177
103
280
2 554 922
2 894 052
5 448 974
53.11
0.74
Philippines
339
20
359
4 354 359
509 739
4 864 098
10.48
0.66
Indonesia
489
108
597
3 176 111
1 297 135
4 473 246
29.00
0.61
Kuwait
33
6
39
3 433 393
356 216
3 789 609
9.40
0.52
Spain
106
217
323
299 914
3 453 705
3 753 619
92.01
0.51
Australia
58
28
86
2 065 838
1 104 147
3 169 985
34.83
0.43
Ukraine
393
100
493
1 473 874
1 677 408
3 151 282
53.23
0.43
Canada
163
66
229
770 619
2 350 462
3 121 081
75.31
0.43
Monaco
-
122
122
-
3 045 840
3 045 840
100.00
0.42
Thailand
227
51
278
2 270 436
569 787
2 840 223
20.06
0.39
Romania
129
35
164
1 273 537
1 423 366
2 696 903
52.78
0.37
Total (35 countries)
14 074
12 893
26 967
258 661 151
431 239 288
689 900 439
62.51
94.18
Percentage
52.2
47.8
100.0
37.5
62.5
100.0
World total
16 359
13 985
30 344
281 458 796
451 076 290
732 535 086
Percentage
53.9
46.1
100.0
38.4
61.6
100.0
Source: UNCTAD secretariat on the basis of data supplied by Lloyd's Maritime Information Services (London). a Vessels of 1,000 grt and above, excluding the United States Reserve Fleet and the United States and Canada Great Lakes fleets. b The country of domicile indicates where the controlling interest of the fleet is located, in terms of the parent company. In several cases,
this has required certain judgements to be made. Thus, for instance, Greece is shown as the country of domicile with respect to vessels owned by a Greek owner with representative offices in New York, London and Piraeus, although the owner may be domiciled in the United States.
c Including vessels flying the national flag but registered in territorial dependencies or associated self-governing territories. For the United Kingdom, British flag vessels are included under the national flag, except for Bermuda (listed in table 17 as an open-registry country).

29
Major open registries 50. The share of the world merchant fleet in foreign registers continued to expand but to a lesser extent in 1999 than in the previous year. Tonnage distribution of the seven major open-registry countries by principal types of vessel is shown in table 17. The total tonnage registered in 1999 increased moderately by 2.2 per cent to 362.1 million dwt from 354.1 million dwt in the previous year, which had expanded significantly by 7.7 per cent. Panama continued to lead the list, enlarging its fleet in 1999 by 4.2 million dwt or 3.0 per cent. Liberia had the second largest increase with its fleet growing marginally by 1.7 per cent. The combined tonnage of these two countries amounts to one third of the total tonnage of the seven major open-registry countries. In 1999, Malta increased its fleet substantially by 7.0 per cent to 40.3 million dwt while Cyprus and the Bahamas reduced their tonnage by 2.3 per cent and 0.4 per cent to 32.7 million dwt and 39.8 million dwt respectively. The analysis by type of vessel indicated that dry bulk stood at 39.4 per cent of the total deadweight in 1999 as compared with 39.2 per cent in 1998, followed by oil tankers, which cut back their share to 37.6 per cent in 1999 from 38.6 per cent in the previous year. Combined tonnage of these two types of vessels accounts for 77.0 per cent of the total deadweight. General cargo ships (3,333 ships) accounted for 33.5 per cent of the total number of ships, reflecting the trend of the maritime industry to flag out in this sector, followed by dry bulk carriers of 2,678 ships or 26.9 per cent of the total. Nationality of vessels 51. Table 18 indicates the participation of nationals in the registry of the most important open or
international registers. The data compare the total tonnage registered in selected countries of registry with the tonnage owned by the nationals of, and registered in, the countries of registry. The share of tonnage owned by nationals of open-registry countries is minimal or zero, while ownership of nationals of the two international registries was nearly 85 and 100 per cent. These two countries (Norway and Denmark) were ranked third and twelfth of the 35 most important maritime countries in 1999. 52. The true nationality of the vessels registered in the seven major open-registries is analysed in table 19. In 1999, total tonnage of the 22 countries or territories accounted for 92.1 per cent of the total seven major open-registry fleets, which was the same level as in 1998. However, Croatia, which had been listed as twenty-first in 1998, disappeared from the list, and was replaced by Monaco. Ownership is concentrated in the 10 largest countries or territories, which control 78.1 per cent of the deadweight of vessels registered in the seven major open-registry countries, as compared with 78.2 per cent in the previous year. Similarly, the top five countries or territories control 60.6 per cent (59.9 per cent in 1998). Greece was ranked first in 1999 for the sixth consecutive year with the largest share (22.5 per cent) of the total seven major open-registry fleets. In 1999, this country also had the largest foreign-flag ownership, representing 88.17 million dwt or 19.4 per cent of the total world foreign-flag tonnage, followed by Japan with 76.72 million dwt or 16.9 per cent of the total tonnage. Both countries' combined foreign-flag tonnage accounted for one-third of the total world tonnage under foreign flags.

Table 17
Tonnage distribution of major open-registry fleets, a as at 1 January 2000
Oil tankers
Dry bulk carriers
General cargo
Container ships
Others
1999 total
1998 total
Country
Ships
Thousand
dwt Ships
Thousand
dwt Ships
Thousand
dwt Ships
Thousand
dwt Ships
Thousand
dwt Ships
Thousand
dwt Ships
Thousand
dwt Panama
415
39 623
1 273
71 097
1 413
12 914
457
13 371
795
9 388
4 353
146 393
4 206
142 179
Liberia
389
46 549
411
27 145
281
4 853
198
5 494
354
8 947
1 633
92 988
1 590
91 466
Cyprus
128
6 287
419
17 348
578
5 546
107
2 365
93
1 151
1 325
32 697
1 347
33 456
Bahamas
153
21 303
149
8 175
485
6 786
50
1 105
258
2 472
1 095
39 841
1 076
39 982
Malta
297
18 551
375
14 945
514
5 011
42
718
85
1 118
1 313
40 343
1 194
37 717
Bermuda
24
3 967
22
2 628
21
232
17
478
27
555
111
7 860
112
7 571
Vanuatu
1
5
29
1 236
41
373
1
28
56
296
128
1 938
122
1 755
Total
1 407
136 285
2 678
142 574
3 333
35 715
872
23 559
1 668
23 927
9 958
362 060
9 647
354 126
Source: UNCTAD secretariat on the basis of data supplied by Lloyd's Maritime Information Services (London). a Ships of 1,000 grt and above: this table is not fully comparable with tables 13 and 15, which list ships of 100 grt and above as the base.

31
Table 18 Tonnage owned by the nationals of, and registered in, the country or territory of registry in the total fleet of
the most important open and international registers, as at 1 January 2000 a (thousands of dwt)
Country or territory of registry
Total tonnage
registered in the country of registry
Tonnage owned by
nationals of, and registered in, the
country of registry
Share of tonnage
owned by nationals in the total
registered fleet (%) Panama
146 393
0
0.0
Liberia
92 988
0
0.0
Cyprus
32 697
683
2.1
Bahamas
39 841
288
0.7
Norwegian International Ship Registry
29 301
24 765
84.5
Malta
40 343
36
0.1
Danish International Ship Registry
6 561
6 465
98.5
Bermuda
7 860
0
0.0
Vanuatu
1 938
0
0.0
Source: UNCTAD secretariat on the basis of data supplied by Lloyd's Maritime Information Services (London). a Ships of 1,000 grt and above: this table is not fully comparable with tables 13 and 15, which list ships of 100 grt and
above as the base.
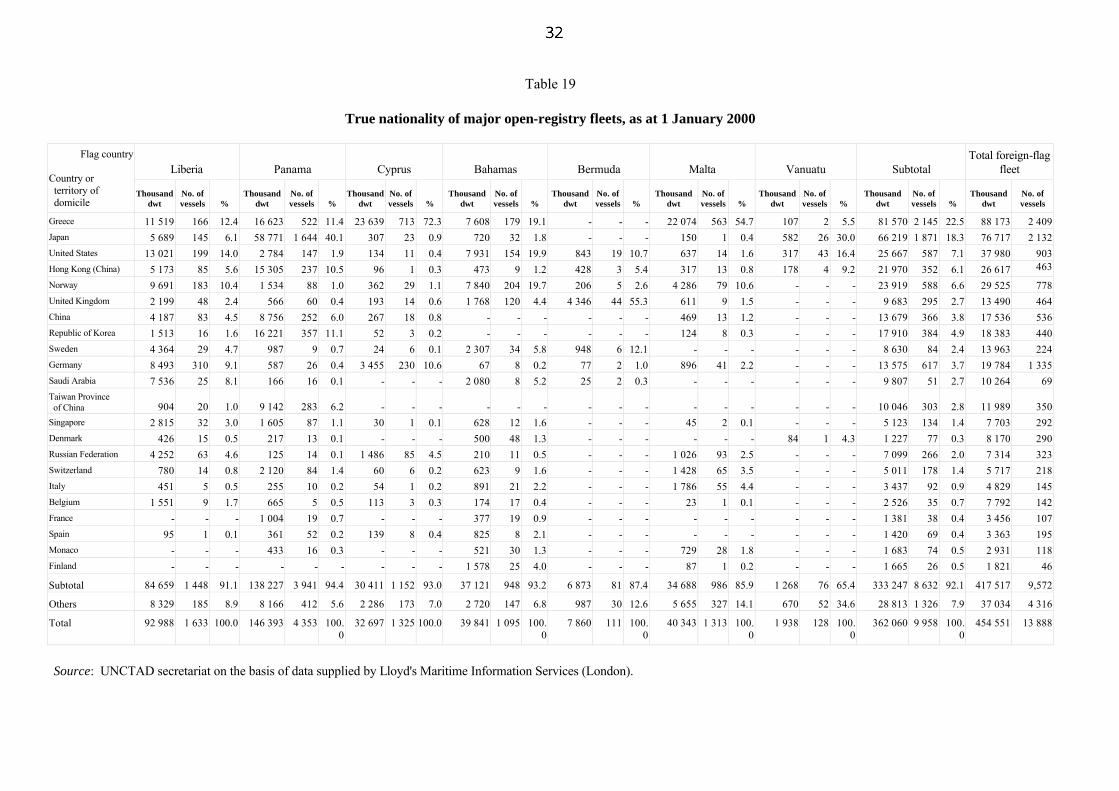
Table 19 True nationality of major open-registry fleets, as at 1 January 2000
Liberia
Panama
Cyprus
Bahamas
Bermuda
Malta
Vanuatu
Subtotal
Total foreign-flag
fleet
Flag country Country or territory of domicile
Thousand
dwt
No. of vessels
%
Thousand
dwt
No. of vessels
%
Thousand
dwt
No. of vessels
%
Thousand
dwt
No. of vessels
%
Thousand
dwt
No. of vessels
%
Thousand
dwt
No. of vessels
%
Thousand
dwt
No. of vessels
%
Thousand
dwt
No. of vessels
%
Thousand
dwt
No. of vessels
Greece
11 519
166
12.4
16 623
522
11.4
23 639
713
72.3
7 608
179
19.1
-
-
-
22 074
563
54.7
107
2
5.5
81 570
2 145
22.5
88 173
2 409
Japan
5 689
145
6.1
58 771
1 644 40.1
307
23
0.9
720
32
1.8
-
-
-
150
1
0.4
582
26
30.0
66 219
1 871
18.3
76 717
2 132
United States
13 021
199
14.0
2 784
147
1.9
134
11
0.4
7 931
154 19.9
843
19
10.7
637
14
1.6
317
43
16.4
25 667
587
7.1
37 980
903
Hong Kong (China)
5 173
85
5.6
15 305
237 10.5
96
1
0.3
473
9
1.2
428
3
5.4
317
13
0.8
178
4
9.2
21 970
352
6.1
26 617 463
Norway
9 691
183
10.4
1 534
88
1.0
362
29
1.1
7 840
204
19.7
206
5
2.6
4 286
79
10.6
-
-
-
23 919
588
6.6
29 525
778
United Kingdom
2 199
48
2.4
566
60
0.4
193
14
0.6
1 768
120
4.4
4 346
44 55.3
611
9
1.5
-
-
-
9 683
295
2.7
13 490
464
China
4 187
83
4.5
8 756
252
6.0
267
18
0.8
-
-
-
-
-
-
469
13
1.2
-
-
-
13 679
366
3.8
17 536
536 Republic of Korea
1 513
16
1.6
16 221
357
11.1
52
3
0.2
-
-
-
-
-
-
124
8
0.3
-
-
-
17 910
384
4.9
18 383
440
Sweden
4 364
29
4.7
987
9
0.7
24
6
0.1
2 307
34
5.8
948
6 12.1
-
-
-
-
-
-
8 630
84
2.4
13 963
224
Germany
8 493
310
9.1
587
26
0.4
3 455
230
10.6
67
8
0.2
77
2
1.0
896
41
2.2
-
-
-
13 575
617
3.7
19 784
1 335 Saudi Arabia
7 536
25
8.1
166
16
0.1
-
-
-
2 080
8
5.2
25
2
0.3
-
-
-
-
-
-
9 807
51
2.7
10 264
69
Taiwan Province of China
904
20
1.0
9 142
283
6.2
-
-
-
-
-
-
-
-
-
-
-
-
-
-
-
10 046
303
2.8
11 989
350
Singapore
2 815
32
3.0
1 605
87
1.1
30
1
0.1
628
12
1.6
-
-
-
45
2
0.1
-
-
-
5 123
134
1.4
7 703
292 Denmark
426
15
0.5
217
13
0.1
-
-
-
500
48
1.3
-
-
-
-
-
-
84
1
4.3
1 227
77
0.3
8 170
290
Russian Federation
4 252
63
4.6
125
14
0.1
1 486
85
4.5
210
11
0.5
-
-
-
1 026
93
2.5
-
-
-
7 099
266
2.0
7 314
323 Switzerland
780
14
0.8
2 120
84
1.4
60
6
0.2
623
9
1.6
-
-
-
1 428
65
3.5
-
-
-
5 011
178
1.4
5 717
218
Italy
451
5
0.5
255
10
0.2
54
1
0.2
891
21
2.2
-
-
-
1 786
55
4.4
-
-
-
3 437
92
0.9
4 829
145 Belgium
1 551
9
1.7
665
5
0.5
113
3
0.3
174
17
0.4
-
-
-
23
1
0.1
-
-
-
2 526
35
0.7
7 792
142
France
-
-
-
1 004
19
0.7
-
-
-
377
19
0.9
-
-
-
-
-
-
-
-
-
1 381
38
0.4
3 456
107 Spain
95
1
0.1
361
52
0.2
139
8
0.4
825
8
2.1
-
-
-
-
-
-
-
-
-
1 420
69
0.4
3 363
195
Monaco
-
-
-
433
16
0.3
-
-
-
521
30
1.3
-
-
-
729
28
1.8
-
-
-
1 683
74
0.5
2 931
118 Finland
-
-
-
-
-
-
-
-
-
1 578
25
4.0
-
-
-
87
1
0.2
-
-
-
1 665
26
0.5
1 821
46
Subtotal
84 659
1 448
91.1
138 227
3 941 94.4
30 411
1 152
93.0
37 121
948
93.2
6 873
81
87.4
34 688
986
85.9
1 268
76
65.4
333 247
8 632
92.1
417 517
9,572
Others
8 329
185
8.9
8 166
412
5.6
2 286
173
7.0
2 720
147
6.8
987
30 12.6
5 655
327
14.1
670
52
34.6
28 813
1 326
7.9
37 034
4 316
Total
92 988
1 633 100.0
146 393
4 353
100.
0
32 697
1 325
100.0
39 841
1 095
100.
0
7 860
111
100.
0
40 343
1 313
100.
0
1 938
128
100.
0
362 060
9 958
100.
0
454 551
13 888
Source: UNCTAD secretariat on the basis of data supplied by Lloyd's Maritime Information Services (London).

33
D. SHIPBUILDING AND THE SECOND-HAND MARKET
Newbuilding orders 53. In 1999, newbuilding contracts for six major ship types, aggregating 49.6 million dwt, were placed, increasing by 16.9 per cent in comparison with the contracts in 1998 (see table 20). In the tanker sector, deteriorating world trade in crude oil in 1999 further pressured the freight level in overall tanker markets, particularly in the middle-larger crude oil tankers. Owners and speculators who expected uncertain near-future tanker markets were reluctant to place new orders for tanker tonnage, although newbuilding prices were at a significantly low level. Eventually, 206 units aggregating 16.8 million dwt were ordered in 1999, as compared with 280 units totalling 21.9 million dwt in 1998. The 1999 newbuilding orders for dry bulk carriers more than doubled the record of the previous year to 346 units of 23.9 million dwt, concentrating on the last quarter of the year. This reflects the fact that in 1999 the dry bulk supply and demand balance improved, in particular as the growth in demand was remarkably higher during the second half of 1999 than in the first six months. 54. Newbuilding orders for containerships continued to rise substantially by 20 per cent to 170 units totalling 7.2 million dwt in 1999 as compared to 178 units of 6.0 million dwt. These newbuilding tonnages reflect the recent trend for the enlargement of ships such as post-Panamax containerships, which represented an average tonnage of 42,000 dwt in 1999 in comparison with 34,000 dwt in 1998. The newbuilding orders for general cargo ships declined signficiantly in 1999 to 162 units of 1.3 million dwt from 333 units totalling 2.5 million dwt in 1998. On the other hand, the orders for passenger ferries were flat as regards the number of vessels, but increased substantially to a total of 348,000 dwt in 1999 from 231,000 dwt in the previous year, also reflecting the existence of larger vessels in 1999 (average 3,000 dwt) than in 1998 (average of 2,000 dwt).
Tonnage on order
55. World tonnage on order, by groups of countries of registry and by principal types of vessel are shown in table 21. World tonnage on order at the end of 1999 stood at 83.5 million dwt, representing a marginal increase of 1.6 per cent over the previous year. Tonnage
on order by developed market-economy countries amounted to 26.6 million dwt, accounting for 31.8 per cent of the world total tonnage on order, as compared with 25.5 million dwt or 31.0 per cent in 1998. Major open-registry countries had 41.4 million dwt or 49.5 per cent of world tonnage on order, as compared with 45.4 million dwt or 55.2 per cent in 1998. The share of the countries of Central and Eastern Europe continued to decrease in 1999, to 0.7 million dwt or 0.9 per cent of the world total on order, whilst the share of the socialist countries of Asia increased in 1999, ending the year with 2.1 million dwt or 2.5 per cent of the world total on order compared with 1.4 million dwt or 1.7 per cent in 1998. 56. Developing countries' tonnage increased significantly to 10.5 million dwt or 12.6 per cent of the world total tonnage on order at the end of 1999, as compared with 8.0 million dwt or 9.8 per cent in 1998. Tonnage on order by Asian developing countries increased substantially by 2.7 million dwt to 9.4 million dwt at the end of 1999, which accounted for 89.3 per cent of the developing countries' total tonnage on order. There was some growth in the African newbuilding orders, rising to 0.15 per cent of the world total on order at the end of 1999, as compared with only 0.01 per cent in 1998, while American developing countries reduced their share to 1.13 per cent of the world total on order in 1999 from 1.60 per cent in the previous year. 57. In 1999, dry bulk carriers on order at the end of the year increased substantially by 23.9 per cent to 24.5 million dwt accounting for 29.4 per cent of the world total on order. For this type of vessel, developed market-economy countries and major open-registry countries accounted for 19.4 per cent and 64.8 per cent, representing a combined share of more than 80 per cent. The volume of containerships on order also expanded in 1999 by 33.3 per cent to 10 million dwt at the year end, representing 11.9 per cent of the world total on order. For containerships on order, developed market-economy countries and major open-registry countries accounted for 40 per cent each. Developing countries' containership orders increased from 0.3 million dwt in 1998 to 1.0 million dwt in 1999, which accounted for 10 per cent of the total. Asian developing countries had 0.9 million dwt or 87.5 per cent of the developing countries' total on order. Oil tanker orders declined in 1999 by 10.4 per cent to 37.0 million dwt, accounting for 44.2 per cent of the world total on order. Developing countries had 6.9 million dwt on order, representing 18.7 per cent of the total, of which Asian developing countries increased by 53.0 per cent to 6.5 million dwt or 94.4 per cent of the developing countries' total.

Table 20
Newbuilding contracts placed for the main types of ship a during 1995-1999 and 2000 (number of ships, thousands of dwt)
Tankers
Bulk carriers
Combined carriers
General cargo ships
Container vessels
Passenger ferries
Total b
Year No.
Thousand dwt
No.
Thousand dwt
No.
Thousand dwt
No.
Thousand dwt
No.
Thousand dwt
No.
Thousand dwt
No.
Thousand dwt
1995
243
9 143
381
22 418
4
440
345
2 449
345
8 562
144
224
1 462
43 236
1996
274
13 875
271
14 250
-
-
257
2 107
292
6 978
144
155
1 238
37 365
1997
428
32 516
282
17 983
2
220
299
2 701
166
3 618
96
149
1 273
57 187
1998
280
21 922
166
11 835
0
0
333
2 488
178
5 975
117
231
1 074
42 451
January 1999
18
965
7
268
-
-
11
133
5
68
8
22
49
1 456 February 1999
12
915
22
909
-
-
19
187
3
81
15
43
71
2 135
March 1999
9
168
4
205
-
-
14
138
10
501
7
26
44
1 038 April 1999
17
1 015
24
2 064
-
-
11
56
14
480
10
11
76
3 626
May 1999
22
2 199
22
1 370
-
-
15
114
1
5
13
30
73
3 718 June 1999
19
1 521
28
1 980
-
-
14
136
8
531
10
73
79
4 241
July 1999
14
1 159
47
3 318
-
-
14
93
27
1 141
11
30
113
5 741 August 1999
16
2 029
28
1 504
-
-
6
62
27
1 232
6
26
83
4 853
September 1999
20
1 515
47
3 058
-
-
1
39
12
597
4
12
84
5 221 October 1999
23
1 815
37
3 054
-
-
28
113
9
156
16
24
113
5 162
November 1999
24
2 223
40
2 955
-
-
13
40
24
1 349
8
34
109
6 601 December 1999
12
1 298
40
3 249
-
-
16
212
30
1 042
8
17
106
5 818
Total 1999
206
16 822
346
23 934
-
-
162
1 323
170
7 183
116
348
1 000
49 610
January 2000
17
1 337
37
2 095
-
-
16
84
18
904
20
20
108
4 440 February 2000
12
786
39
3 138
-
-
17
130
37
2 095
7
18
112
6 167
March 2000
33
2 366
29
1 110
-
-
10
64
19
930
6
7
97
4 477
Source: UNCTAD secretariat on the basis of data from Shipping Statistics and Market Review, 1999, Institute of Shipping Economics and Logistics (Bremen), Nos. 1/2.
a Ships of 300 grt and over.
b Total does not include data on newbuilding contracts for other types of ship.
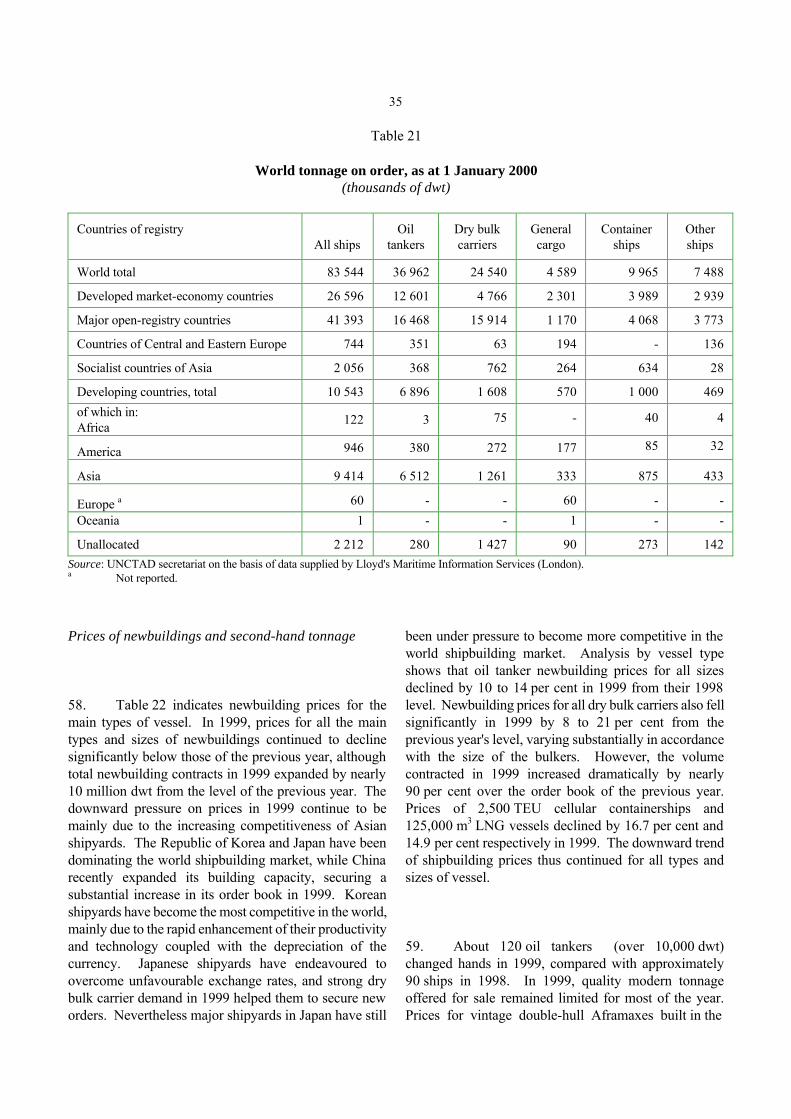
35
Table 21 World tonnage on order, as at 1 January 2000 (thousands of dwt)
Countries of registry
All ships
Oil
tankers
Dry bulk carriers
General cargo
Container
ships
Other ships
World total
83 544
36 962
24 540
4 589
9 965
7 488
Developed market-economy countries
26 596
12 601
4 766
2 301
3 989
2 939
Major open-registry countries
41 393
16 468
15 914
1 170
4 068
3 773
Countries of Central and Eastern Europe
744
351
63
194
-
136
Socialist countries of Asia
2 056
368
762
264
634
28
Developing countries, total
10 543
6 896
1 608
570
1 000
469
of which in: Africa
122 3 75 - 40 4
America 946 380 272 177 85 32
Asia 9 414 6 512 1 261 333 875 433
Europe a 60 - - 60 - -
Oceania 1 - - 1 - - Unallocated
2 212
280
1 427
90
273
142
Source: UNCTAD secretariat on the basis of data supplied by Lloyd's Maritime Information Services (London). a Not reported. Prices of newbuildings and second-hand tonnage 58. Table 22 indicates newbuilding prices for the main types of vessel. In 1999, prices for all the main types and sizes of newbuildings continued to decline significantly below those of the previous year, although total newbuilding contracts in 1999 expanded by nearly 10 million dwt from the level of the previous year. The downward pressure on prices in 1999 continue to be mainly due to the increasing competitiveness of Asian shipyards. The Republic of Korea and Japan have been dominating the world shipbuilding market, while China recently expanded its building capacity, securing a substantial increase in its order book in 1999. Korean shipyards have become the most competitive in the world, mainly due to the rapid enhancement of their productivity and technology coupled with the depreciation of the currency. Japanese shipyards have endeavoured to overcome unfavourable exchange rates, and strong dry bulk carrier demand in 1999 helped them to secure new orders. Nevertheless major shipyards in Japan have still
been under pressure to become more competitive in the world shipbuilding market. Analysis by vessel type shows that oil tanker newbuilding prices for all sizes declined by 10 to 14 per cent in 1999 from their 1998 level. Newbuilding prices for all dry bulk carriers also fell significantly in 1999 by 8 to 21 per cent from the previous year's level, varying substantially in accordance with the size of the bulkers. However, the volume contracted in 1999 increased dramatically by nearly 90 per cent over the order book of the previous year. Prices of 2,500 TEU cellular containerships and 125,000 m3 LNG vessels declined by 16.7 per cent and 14.9 per cent respectively in 1999. The downward trend of shipbuilding prices thus continued for all types and sizes of vessel. 59. About 120 oil tankers (over 10,000 dwt) changed hands in 1999, compared with approximately 90 ships in 1998. In 1999, quality modern tonnage offered for sale remained limited for most of the year. Prices for vintage double-hull Aframaxes built in the
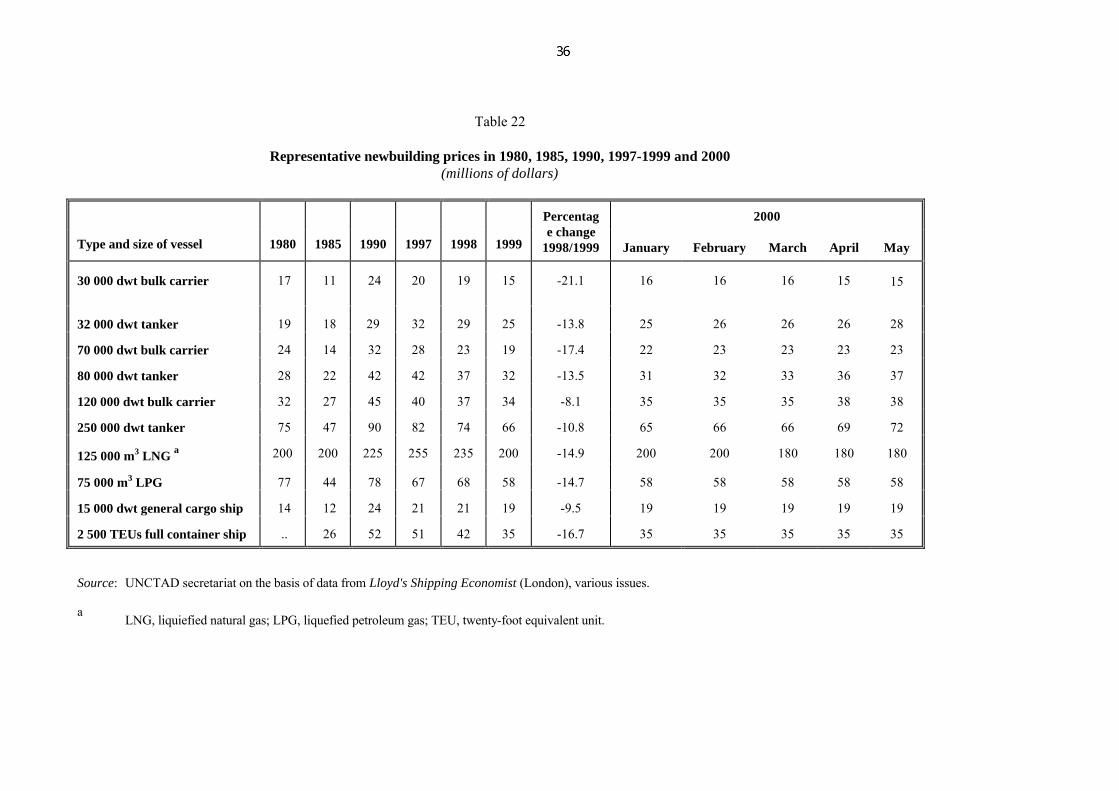
Table 22 Representative newbuilding prices in 1980, 1985, 1990, 1997-1999 and 2000 (millions of dollars)
2000
Type and size of vessel
1980
1985
1990
1997
1998
1999
Percentage change
1998/1999 January
February
March
April
May
30 000 dwt bulk carrier
17
11
24
20
19
15
-21.1
16
16
16
15
15
32 000 dwt tanker
19
18
29
32
29
25
-13.8
25
26
26
26
28
70 000 dwt bulk carrier
24
14
32
28
23
19
-17.4
22
23
23
23
23
80 000 dwt tanker
28
22
42
42
37
32
-13.5
31
32
33
36
37
120 000 dwt bulk carrier
32
27
45
40
37
34
-8.1
35
35
35
38
38
250 000 dwt tanker
75
47
90
82
74
66
-10.8
65
66
66
69
72
125 000 m3 LNG a
200
200
225
255
235
200
-14.9
200
200
180
180
180
75 000 m3 LPG
77
44
78
67
68
58
-14.7
58
58
58
58
58
15 000 dwt general cargo ship
14
12
24
21
21
19
-9.5
19
19
19
19
19
2 500 TEUs full container ship
..
26
52
51
42
35
-16.7
35
35
35
35
35
Source: UNCTAD secretariat on the basis of data from Lloyd's Shipping Economist (London), various issues. a LNG, liquiefied natural gas; LPG, liquefied petroleum gas; TEU, twenty-foot equivalent unit.
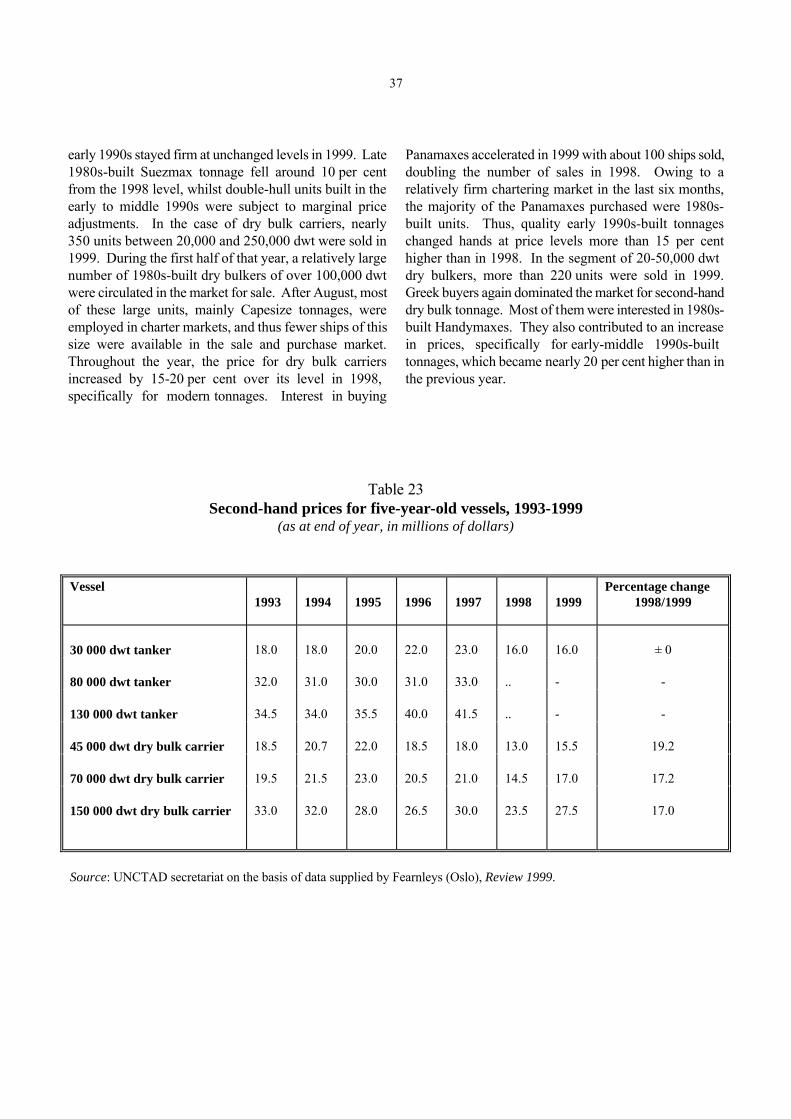
37
early 1990s stayed firm at unchanged levels in 1999. Late 1980s-built Suezmax tonnage fell around 10 per cent from the 1998 level, whilst double-hull units built in the early to middle 1990s were subject to marginal price adjustments. In the case of dry bulk carriers, nearly 350 units between 20,000 and 250,000 dwt were sold in 1999. During the first half of that year, a relatively large number of 1980s-built dry bulkers of over 100,000 dwt were circulated in the market for sale. After August, most of these large units, mainly Capesize tonnages, were employed in charter markets, and thus fewer ships of this size were available in the sale and purchase market. Throughout the year, the price for dry bulk carriers increased by 15-20 per cent over its level in 1998, specifically for modern tonnages. Interest in buying
Panamaxes accelerated in 1999 with about 100 ships sold, doubling the number of sales in 1998. Owing to a relatively firm chartering market in the last six months, the majority of the Panamaxes purchased were 1980s-built units. Thus, quality early 1990s-built tonnages changed hands at price levels more than 15 per cent higher than in 1998. In the segment of 20-50,000 dwt dry bulkers, more than 220 units were sold in 1999. Greek buyers again dominated the market for second-hand dry bulk tonnage. Most of them were interested in 1980s-built Handymaxes. They also contributed to an increase in prices, specifically for early-middle 1990s-built tonnages, which became nearly 20 per cent higher than in the previous year.
Table 23 Second-hand prices for five-year-old vessels, 1993-1999
(as at end of year, in millions of dollars)
Vessel 1993
1994
1995
1996 1997 1998
1999
Percentage change 1998/1999
30 000 dwt tanker
18.0
18.0
20.0
22.0
23.0
16.0
16.0
± 0
80 000 dwt tanker
32.0
31.0
30.0
31.0
33.0
..
-
-
130 000 dwt tanker
34.5
34.0
35.5
40.0
41.5
..
-
-
45 000 dwt dry bulk carrier
18.5
20.7
22.0
18.5
18.0
13.0
15.5
19.2
70 000 dwt dry bulk carrier
19.5
21.5
23.0
20.5
21.0
14.5
17.0
17.2
150 000 dwt dry bulk carrier
33.0
32.0
28.0
26.5
30.0
23.5
27.5
17.0
Source: UNCTAD secretariat on the basis of data supplied by Fearnleys (Oslo), Review 1999.
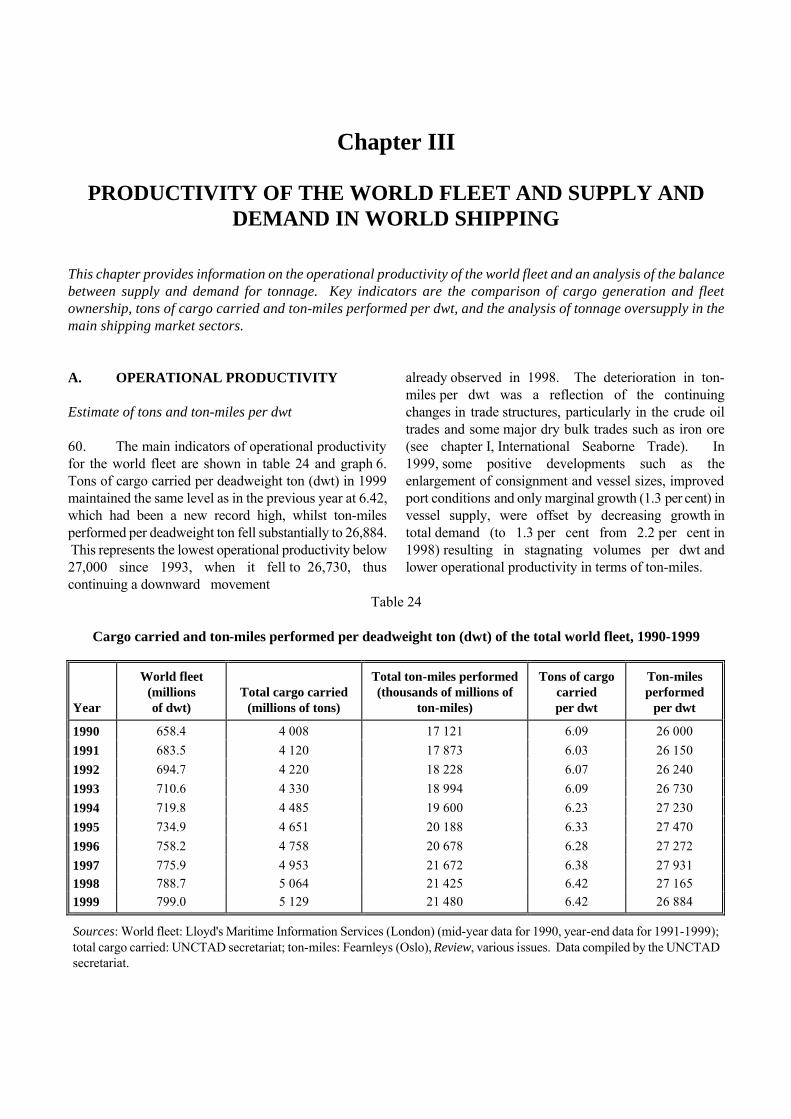
Chapter III
PRODUCTIVITY OF THE WORLD FLEET AND SUPPLY AND DEMAND IN WORLD SHIPPING
This chapter provides information on the operational productivity of the world fleet and an analysis of the balance between supply and demand for tonnage. Key indicators are the comparison of cargo generation and fleet ownership, tons of cargo carried and ton-miles performed per dwt, and the analysis of tonnage oversupply in the main shipping market sectors. A. OPERATIONAL PRODUCTIVITY Estimate of tons and ton-miles per dwt 60. The main indicators of operational productivity for the world fleet are shown in table 24 and graph 6. Tons of cargo carried per deadweight ton (dwt) in 1999 maintained the same level as in the previous year at 6.42, which had been a new record high, whilst ton-miles performed per deadweight ton fell substantially to 26,884. This represents the lowest operational productivity below 27,000 since 1993, when it fell to 26,730, thus continuing a downward movement
already observed in 1998. The deterioration in ton-miles per dwt was a reflection of the continuing changes in trade structures, particularly in the crude oil trades and some major dry bulk trades such as iron ore (see chapter I, International Seaborne Trade). In 1999, some positive developments such as the enlargement of consignment and vessel sizes, improved port conditions and only marginal growth (1.3 per cent) in vessel supply, were offset by decreasing growth in total demand (to 1.3 per cent from 2.2 per cent in 1998) resulting in stagnating volumes per dwt and lower operational productivity in terms of ton-miles.
Table 24 Cargo carried and ton-miles performed per deadweight ton (dwt) of the total world fleet, 1990-1999
Year
World fleet
(millions of dwt)
Total cargo carried
(millions of tons)
Total ton-miles performed (thousands of millions of
ton-miles)
Tons of cargo
carried per dwt
Ton-miles performed
per dwt 1990
658.4
4 008
17 121
6.09
26 000
1991
683.5
4 120
17 873
6.03
26 150 1992
694.7
4 220
18 228
6.07
26 240
1993
710.6
4 330
18 994
6.09
26 730 1994
719.8
4 485
19 600
6.23
27 230
1995
734.9
4 651
20 188
6.33
27 470 1996
758.2
4 758
20 678
6.28
27 272
1997
775.9
4 953
21 672
6.38
27 931 1998
788.7
5 064
21 425
6.42
27 165
1999
799.0
5 129
21 480
6.42
26 884 Sources: World fleet: Lloyd's Maritime Information Services (London) (mid-year data for 1990, year-end data for 1991-1999); total cargo carried: UNCTAD secretariat; ton-miles: Fearnleys (Oslo), Review, various issues. Data compiled by the UNCTAD secretariat.
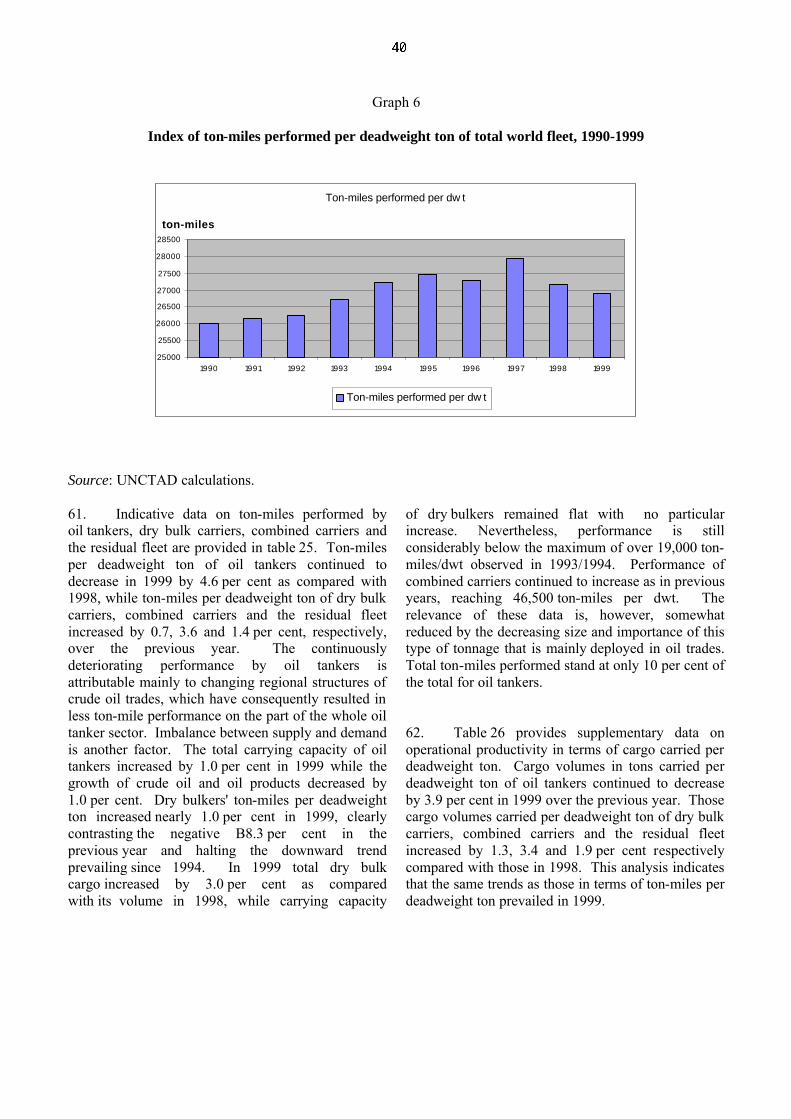
Graph 6
Index of ton-miles performed per deadweight ton of total world fleet, 1990-1999
Ton-miles performed per dw t
25000
25500
26000
26500
27000
27500
28000
28500
1990 1991 1992 1993 1994 1995 1996 1997 1998 1999
ton-miles
Ton-miles performed per dw t
Source: UNCTAD calculations. 61. Indicative data on ton-miles performed by oil tankers, dry bulk carriers, combined carriers and the residual fleet are provided in table 25. Ton-miles per deadweight ton of oil tankers continued to decrease in 1999 by 4.6 per cent as compared with 1998, while ton-miles per deadweight ton of dry bulk carriers, combined carriers and the residual fleet increased by 0.7, 3.6 and 1.4 per cent, respectively, over the previous year. The continuously deteriorating performance by oil tankers is attributable mainly to changing regional structures of crude oil trades, which have consequently resulted in less ton-mile performance on the part of the whole oil tanker sector. Imbalance between supply and demand is another factor. The total carrying capacity of oil tankers increased by 1.0 per cent in 1999 while the growth of crude oil and oil products decreased by 1.0 per cent. Dry bulkers' ton-miles per deadweight ton increased nearly 1.0 per cent in 1999, clearly contrasting the negative B8.3 per cent in the previous year and halting the downward trend prevailing since 1994. In 1999 total dry bulk cargo increased by 3.0 per cent as compared with its volume in 1998, while carrying capacity
of dry bulkers remained flat with no particular increase. Nevertheless, performance is still considerably below the maximum of over 19,000 ton-miles/dwt observed in 1993/1994. Performance of combined carriers continued to increase as in previous years, reaching 46,500 ton-miles per dwt. The relevance of these data is, however, somewhat reduced by the decreasing size and importance of this type of tonnage that is mainly deployed in oil trades. Total ton-miles performed stand at only 10 per cent of the total for oil tankers. 62. Table 26 provides supplementary data on operational productivity in terms of cargo carried per deadweight ton. Cargo volumes in tons carried per deadweight ton of oil tankers continued to decrease by 3.9 per cent in 1999 over the previous year. Those cargo volumes carried per deadweight ton of dry bulk carriers, combined carriers and the residual fleet increased by 1.3, 3.4 and 1.9 per cent respectively compared with those in 1998. This analysis indicates that the same trends as those in terms of ton-miles per deadweight ton prevailed in 1999.

Table 25 Estimated productivity of tankers, bulk carriers, combined carriers a and the residual fleet,b 1990-1999 (ton-miles performed per dwt)
Year
Ton-miles of
oil by tankers
(thousands of millions)
Ton-miles per dwt
of tankers
Ton-miles of dry
bulk cargo by dry bulk carriers (thousands of
millions)
Ton-miles per dwt of
bulk carriers
Ton-miles of oil and dry bulk cargo by combined carriers
(thousands of millions)
Ton-miles per dwt of combined carriers
Ton-miles of the residual
fleet (thousands of
millions)
Ton-miles per dwt of
the residual fleet
1990
7 376
30 810
3 804
18 770
1 164
36 040
4 777
25 960
1991
7 884
30 920
4 035
18 680
1 049
33 620
4 905
26 980
1992
8 190
31 420
4 061
18 770
1 012
32 440
4 965
26 620
1993
8 735
32 900
4 257
19 297
1 012
34 896
4 967
25 524
1994
9 001
34 250
4 435
19 392
908
34 789
5 256
26 007
1995
8 980
34 393
4 500
18 672
925
38 542
5 785
27 706
1996
9 061
34 663
4 442
18 371
926
41 712
5 993
28 350
1997
9 251
34 923
4 660
18 253
955
43 807
6 269
29 063
1998
9 307
34 845
4 464
16 744
944
44 952
6 206
29 880
1999
9 065
33 242
4 486
16 858
931
46 550
6 423
30 297
Source: UNCTAD secretariat on the basis of data from Fearnleys (Oslo), Review, World Bulk Trades and World Bulk Fleet, various issues, and other specialized sources. a Tankers, bulk carriers and combined carriers of 50,000 dwt and above.
b The residual fleet refers to all vessels included in table 15, excluding tankers, bulk carriers and combined bulk carriers of the size range indicated in footnote
a.

Table 26
Estimated productivity of tankers, bulk carriers, combined carriers and the residual fleet, 1990-1999 (tons carried per dwt)
Year
Tons of oil carried by tankers of
over 50,000 dwt (millions)
Tons carried
per dwt of tankers
Tons of dry cargo
carried by bulk carriers of over
18,000 dwt (millions)
Tons carried
per dwt of bulk carriers
Tons of oil and dry
bulk cargo carried by combined carriers of
over 18,000 dwt (millions)
Tons carried
per dwt of combined carriers
Tons carried
by the residual fleet a
(millions)
Tons carried
per dwt of the residual
fleet 1990
1 427
5.96
667
3.29
203
6.28
1 680
9.13
1991
1 485
5.82
707
3.27
196
6.38
1 722
9.47
1992
1 550
5.95
709
3.28
194
6.22
1 762
9.45
1993
1 665
6.27
744
3.37
192
6.62
1 738
8.89
1994
1 702
6.48
769
3.36
174
6.67
1 861
9.21
1995
1 738
6.66
770
3.20
177
7.38
1 993
9.55
1996
1 785
6.83
765
3.16
177
7.97
2 057
9.71
1997
1 847
6.97
810
3.17
185
8.49
2 152
9.88
1998
1 848
6.92
797
2.99
184
8.80
2 130
10.06
1999
1 813
6.65
807
3.03
182
9.10
2 192
10.25
Sources: UNCTAD secretariat on the basis of data from Fearnleys (Oslo), Review, World Bulk Trades and World Bulk Fleet, various issues, and other specialized sources. a See footnote b to table 25.

43
The supply and demand mechanism by type of vessel 63. Tonnage supply in the oil tanker sector decreased substantially in 1999 by 9.2 million dwt to 281.8 million dwt. This indicates that oil tanker newbuildings delivered in 1999 stood at 6.5 million dwt while deleted tonnage reached nearly 16 million dwt. As a result overcapacity was reduced to 14.0 million dwt or 5.0 per cent of the total world tanker fleet, while seaborne trade for oil tankers declined by 1.0 per cent in 1999 compared with the previous year (see table 27 and graph 7). In 1999, nearly 1.0 million dwt of dry bulker newbuildings were delivered while tonnages of nearly 12.5 million dwt were deleted from shipping industries. Thus the total dry bulk fleet supply was reduced substantially by 11.4 million dwt. On the other hand, main dry bulk commodities increased by 2.8 per cent in 1999 over the previous year. Despite some favourable factors, overcapacity in the dry bulk sector increased significantly in 1999 to 7.9 million dwt,
representing an increase of 2.1 million dwt and accounting for 3.2 per cent of the world dry bulk fleet. In actual fact the tonnage deleted in 1999 decreased by approximately 25 per cent over the previous year's figure. This means that further deletion of aged uneconomical dry bulkers should be promoted in order to bring the supply and demand mechanism into better balance. In the sector of the general cargo fleet, overcapacity remained relatively stable in 1999 with supply capacity exceeding demand by 1.8 million dwt or 3.0 per cent for the world fleet of this sector. The surplus tonnage of general cargo vessels has followed a downward trend since the early 1990s. In the unitized fleet sector, 3.0 million dwt of containership newbuildings were delivered in 1999, topping up the 8 million dwt tonnage delivered in the previous year. Although newbuildings of this sector have been increasing, liner shipping industry markets have been able to absorb these tonnages, thus resulting in full employment of the world unitized fleet.
Table 27 Analysis of tonnage oversupply by main type of vessel, 1992-1999 a
(average yearly figures in millions of dwt)
1992
1993
1994
1995
1996
1997
1998
1999
Supply of world tanker fleet
283.4
284.6
282.9
277.0
285.1
290.6
291.0
281.8
Total tanker fleet surplus b
41.8
43.5
39.0
28.8
28.8
17.0
17.3
14.0 Share of surplus fleet in the world tanker fleet (per cent)
14.7
15.3
13.8
10.4
10.1
5.8
5.9
5.0
Supply of world dry bulk fleet 237.3
238.6
242.6
252.9
257.2
260.9
257.1
245.7
Dry bulk fleet surplus b
25.1
23.6
20.3
17.9
17.2
10.3
5.8
7.9 Share of surplus in the world dry bulk fleet (per cent)
10.6
9.9
8.4
7.1
6.7
3.9
2.3
3.2
Supply of world conventional general cargo fleet
63.0
62.1
61.9
62.0
62.7
62.0
60.5
59.9 Conventional general cargo fleet surplus
2.7
2.8
2.2
2.0
1.4
1.7
1.6
1.8
Share of surplus in the world conventional general cargo fleet (per cent)
4.3
4.5
3.6
3.2
2.2
2.7
2.6
3.0
Supply of world unitized fleet c
43.0
45.7
49.8
53.4
59.3
65.7
73.1
76.1 Surplus of unitized fleet
0.7
0.7
0.5
0.7
0
0
0
0
Share of surplus in the world unitized fleet (per cent)
1.6
1.5
1.0
1.3
0.0
0.0
0.0
0.0
Source: UNCTAD secretariat on the basis of data from Lloyd's Shipping Economist (London), various issues. a Aggregates for all sectors shown in this table are averages for the years indicated and therefore differ from the world
figures in table 28. This table excludes tankers and dry bulk carriers of less than 10,000 dwt and conventional general cargo/unitized vessels of less than 5,000 dwt.
b Including 50 per cent of combined ore/bulk/oil carriers.
c Unitized fleet includes here fully cellular container ships, partly cellular container ships, ro-ro ships and barge carriers.
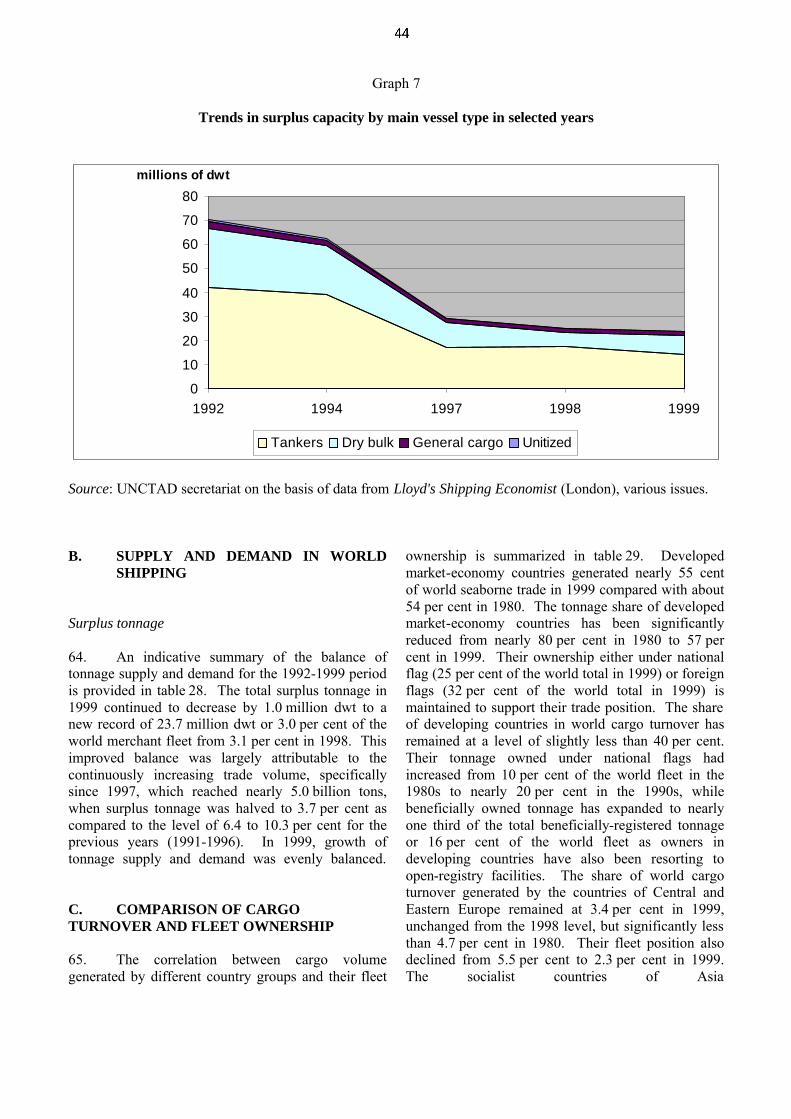
Graph 7
Trends in surplus capacity by main vessel type in selected years
0
10
20
30
40
50
60
70
80
1992 1994 1997 1998 1999
millions of dwt
Tankers Dry bulk General cargo Unitized
Source: UNCTAD secretariat on the basis of data from Lloyd's Shipping Economist (London), various issues. B. SUPPLY AND DEMAND IN WORLD
SHIPPING Surplus tonnage 64. An indicative summary of the balance of tonnage supply and demand for the 1992-1999 period is provided in table 28. The total surplus tonnage in 1999 continued to decrease by 1.0 million dwt to a new record of 23.7 million dwt or 3.0 per cent of the world merchant fleet from 3.1 per cent in 1998. This improved balance was largely attributable to the continuously increasing trade volume, specifically since 1997, which reached nearly 5.0 billion tons, when surplus tonnage was halved to 3.7 per cent as compared to the level of 6.4 to 10.3 per cent for the previous years (1991-1996). In 1999, growth of tonnage supply and demand was evenly balanced. C. COMPARISON OF CARGO TURNOVER AND FLEET OWNERSHIP 65. The correlation between cargo volume generated by different country groups and their fleet
ownership is summarized in table 29. Developed market-economy countries generated nearly 55 cent of world seaborne trade in 1999 compared with about 54 per cent in 1980. The tonnage share of developed market-economy countries has been significantly reduced from nearly 80 per cent in 1980 to 57 per cent in 1999. Their ownership either under national flag (25 per cent of the world total in 1999) or foreign flags (32 per cent of the world total in 1999) is maintained to support their trade position. The share of developing countries in world cargo turnover has remained at a level of slightly less than 40 per cent. Their tonnage owned under national flags had increased from 10 per cent of the world fleet in the 1980s to nearly 20 per cent in the 1990s, while beneficially owned tonnage has expanded to nearly one third of the total beneficially-registered tonnage or 16 per cent of the world fleet as owners in developing countries have also been resorting to open-registry facilities. The share of world cargo turnover generated by the countries of Central and Eastern Europe remained at 3.4 per cent in 1999, unchanged from the 1998 level, but significantly less than 4.7 per cent in 1980. Their fleet position also declined from 5.5 per cent to 2.3 per cent in 1999. The socialist countries of Asia

45
increased their share in world trade to 2.8 per cent in 1999, while they improved their share in world tonnage from 1.6 per cent in 1980 to 3.2 per cent in 1999. The short-term analysis indicates a different aspect in that these countries increased their share in world trade from 2.2 per cent in 1996 to 2.8 per cent in 1999, while
their share of national flags in world tonnage decreased from 3.8 per cent in 1996 to 3.2 per cent in 1999. On the other hand, China increased its tonnage under foreign flags to 43.5 per cent of its total fleet in 1999 from 36.12 per cent in 1996.
Table 28 Tonnage oversupply in the world merchant fleet, 1992-1999 (end-year figures)
1992
1993
1994
1995
1996
1997
1998
1999
Million dwt
World merchant fleet
694.7
710.6
719.8
734.9
758.2
775.9
788.7
799.0
Surplus tonnage a
71.7
72.0
63.4
50.8
48.8
29.0
24.7
23.7
Active fleet b
623.0
638.6
656.4
684.1
709.4
746.9
764.0
775.3
Percentages
Surplus tonnage as a percentage of the world merchant fleet
10.3
10.1
8.8
6.9
6.4
3.7
3.1
3.0
Sources: UNCTAD secretariat on the basis of data supplied by Lloyd's Maritime Information Services (London), and Lloyd's Shipping Economist (London), various issues. a Estimates of average year figures. Surplus tonnage is defined as tonnage that is not fully utilized owing to slow steaming
or lay-up status, or because it is lying idle for other reasons. b World fleet minus surplus tonnage.
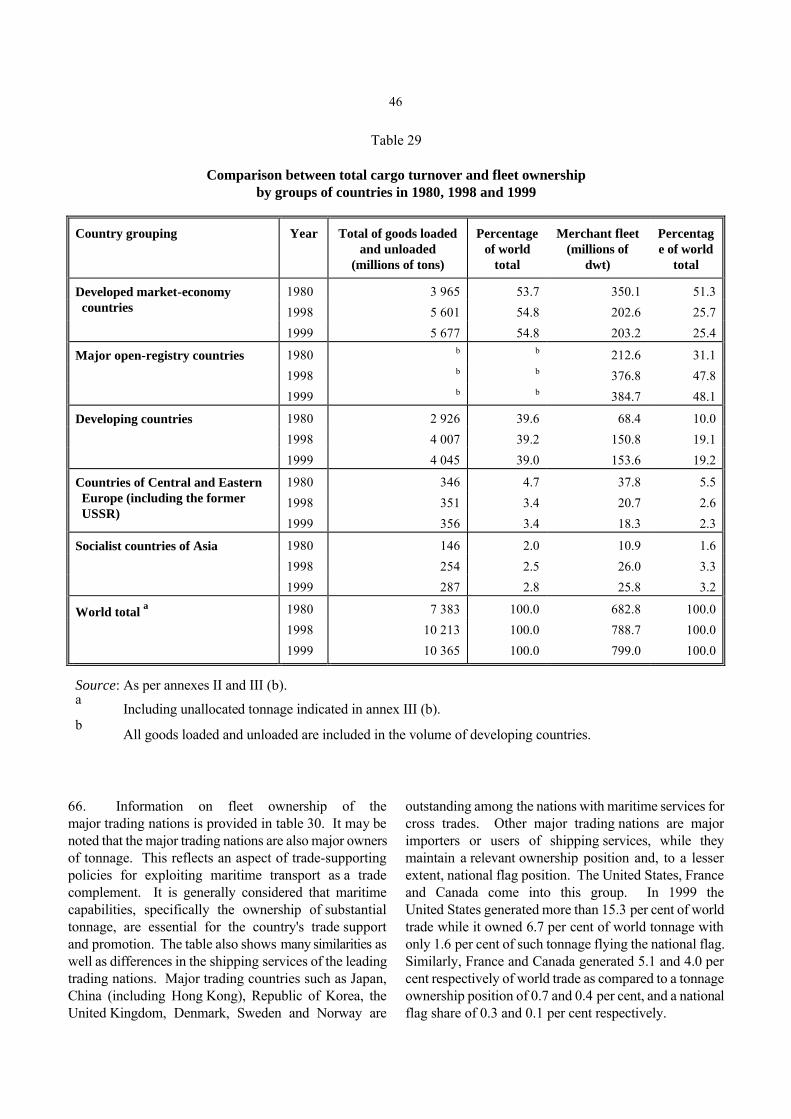
46
Table 29 Comparison between total cargo turnover and fleet ownership by groups of countries in 1980, 1998 and 1999
Country grouping
Year
Total of goods loaded
and unloaded (millions of tons)
Percentage
of world total
Merchant fleet
(millions of dwt)
Percentage of world
total 1980
3 965
53.7
350.1
51.3
1998
5 601
54.8
202.6
25.7
Developed market-economy countries
1999
5 677
54.8
203.2
25.4
1980
b
b
212.6
31.1 1998
b
b
376.8
47.8
Major open-registry countries
1999
b
b
384.7
48.1 1980
2 926
39.6
68.4
10.0
1998
4 007
39.2
150.8
19.1
Developing countries
1999
4 045
39.0
153.6
19.2
1980
346
4.7
37.8
5.5
1998
351
3.4
20.7
2.6
Countries of Central and Eastern Europe (including the former USSR)
1999
356
3.4
18.3
2.3 1980
146
2.0
10.9
1.6
1998
254
2.5
26.0
3.3
Socialist countries of Asia
1999
287
2.8
25.8
3.2
1980
7 383
100.0
682.8
100.0
1998
10 213
100.0
788.7
100.0
World total a
1999
10 365
100.0
799.0
100.0
Source: As per annexes II and III (b). a Including unallocated tonnage indicated in annex III (b).
b All goods loaded and unloaded are included in the volume of developing countries.
66. Information on fleet ownership of the major trading nations is provided in table 30. It may be noted that the major trading nations are also major owners of tonnage. This reflects an aspect of trade-supporting policies for exploiting maritime transport as a trade complement. It is generally considered that maritime capabilities, specifically the ownership of substantial tonnage, are essential for the country's trade support and promotion. The table also shows many similarities as well as differences in the shipping services of the leading trading nations. Major trading countries such as Japan, China (including Hong Kong), Republic of Korea, the United Kingdom, Denmark, Sweden and Norway are
outstanding among the nations with maritime services for cross trades. Other major trading nations are major importers or users of shipping services, while they maintain a relevant ownership position and, to a lesser extent, national flag position. The United States, France and Canada come into this group. In 1999 the United States generated more than 15.3 per cent of world trade while it owned 6.7 per cent of world tonnage with only 1.6 per cent of such tonnage flying the national flag. Similarly, France and Canada generated 5.1 and 4.0 per cent respectively of world trade as compared to a tonnage ownership position of 0.7 and 0.4 per cent, and a national flag share of 0.3 and 0.1 per cent respectively.
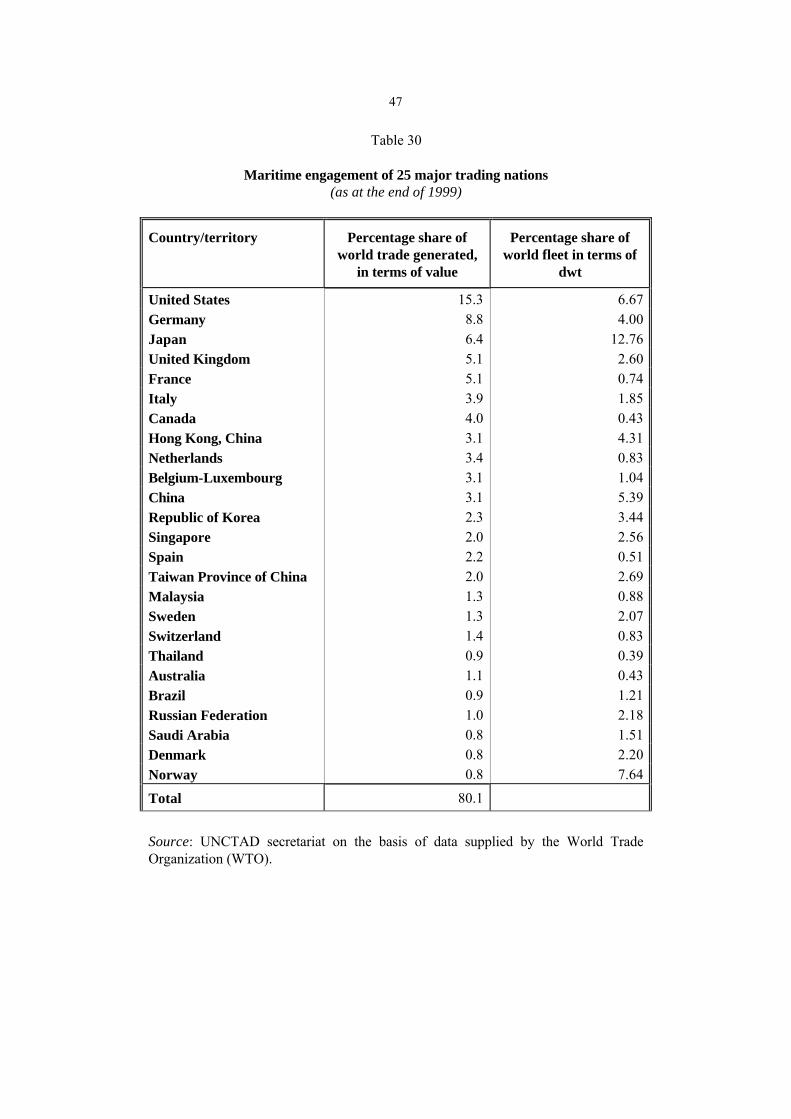
47
Table 30 Maritime engagement of 25 major trading nations (as at the end of 1999)
Country/territory
Percentage share of
world trade generated, in terms of value
Percentage share of
world fleet in terms of dwt
United States
15.3
6.67
Germany
8.8
4.00 Japan
6.4
12.76
United Kingdom
5.1
2.60 France
5.1
0.74
Italy
3.9
1.85 Canada
4.0
0.43
Hong Kong, China
3.1
4.31 Netherlands
3.4
0.83
Belgium-Luxembourg
3.1
1.04 China
3.1
5.39
Republic of Korea
2.3
3.44 Singapore
2.0
2.56
Spain
2.2
0.51 Taiwan Province of China
2.0
2.69
Malaysia
1.3
0.88 Sweden
1.3
2.07
Switzerland
1.4
0.83 Thailand
0.9
0.39
Australia
1.1
0.43 Brazil
0.9
1.21
Russian Federation
1.0
2.18 Saudi Arabia
0.8
1.51
Denmark
0.8
2.20 Norway
0.8
7.64
Total
80.1
Source: UNCTAD secretariat on the basis of data supplied by the World Trade Organization (WTO).
Chapter IV
TRADE AND FREIGHT MARKETS
This chapter describes the conditions and trends in trade and freight markets, covering the major liner and bulk cargo sectors, gives liner freight rates as a percentage of commodity prices and estimates freight payments and freight costs as a percentage of import value in world trade . A. LINER SHIPPING MARKET (a) Developments in liner markets General developments 67. Total world liner shipments of containerized cargo in 1999 have reached approximately 50 million TEUs, with forecasts for up to 53 million TEUs in 2000. With trade prospects buoyant, major liner operators are upgrading their containership fleets with larger containerships such as post-Panamax on East-West trunk liner routes. The world fleet of fully cellcular containerships continued to expand substantially in 1999 in terms of both number of ships and their TEU capacity, reaching 2,433 ships with a total capacity of 4,298,000 TEUs by the end of 1999, representing an increase of 2.9 per cent in the number of ships and 5.8 per cent in TEU capacity over the previous year. Groupings of liner operators 68. The processes of competitive positioning of liner operating companies, the majority of which were made during the three-year period (1997B1999), led eventually to the emergence of new mega-carriers. Table 31 gives the latest profile of the supply-side dynamics of container shipping through concentration processes. The top 10 companies' total carrying capacity at the beginning of 2000 increased by 11 per cent from that of the previous year, accounting for 51 per cent of the world total capacity. Similarly the top 20s increased by 9 per cent, sharing 69 per cent of the world total. The need to respond to rapidly increasing global transport requirements and to rationalize the use of existing assets and new investments led major carriers to enter into groupings or "alliances" in the endeavour to reduce operation costs and promote their marketing strength by
integrating service structures through tie-ups or groupings. Under strategic programmes of major carriers, carrying capacity of the containerships in service on the East-West trunk routes continued to increase. At the beginning of 2000, 98 post-Panamax ships with an average carrying capacity of 5,300 TEUs per ship, were in service on the main East-West liner routes. At the end of 1999, 56 post-Panamax ships with a total capacity of 325,000 TEUs were on order. Given the delivery of these large newbuildings in the next couple of years, total carrying capacity of post-Panamaxes will be nearly 850,000 TEU. Table 32 provides estimated carrying capacity of "alliances" on the three major liner trades (Asia/North America, Asia/Europe-Mediterranean and North America/Europe-Mediterranean). At the beginning of 2000, all the alliances' carrying capacity reached 2.17 million TEUs, which accounted for approximately 45 per cent of the world total containerships' carrying capacity. Other liner operators, particularly mid-sized companies, still have to make the necessary decisions on their future competitive positioning, either as a global operator or as more of a niche carrier. Containership market developments 69. Global liner shipping market developments are best reflected in movements of the containership charter market. This market is largely dominated by German owners, and more particularly by members of the Association of Hamburg Brokers and Agents, who control about 75 per cent of freely available containership charter tonnage. Since 1998, the association publishes the "Hamburg Index" providing for a market analysis of containership time charter rates. Rates on 14-ton slot (TEU) per day are published on a monthly basis for three gearless and six geared size groups and compared to those obtained on average in
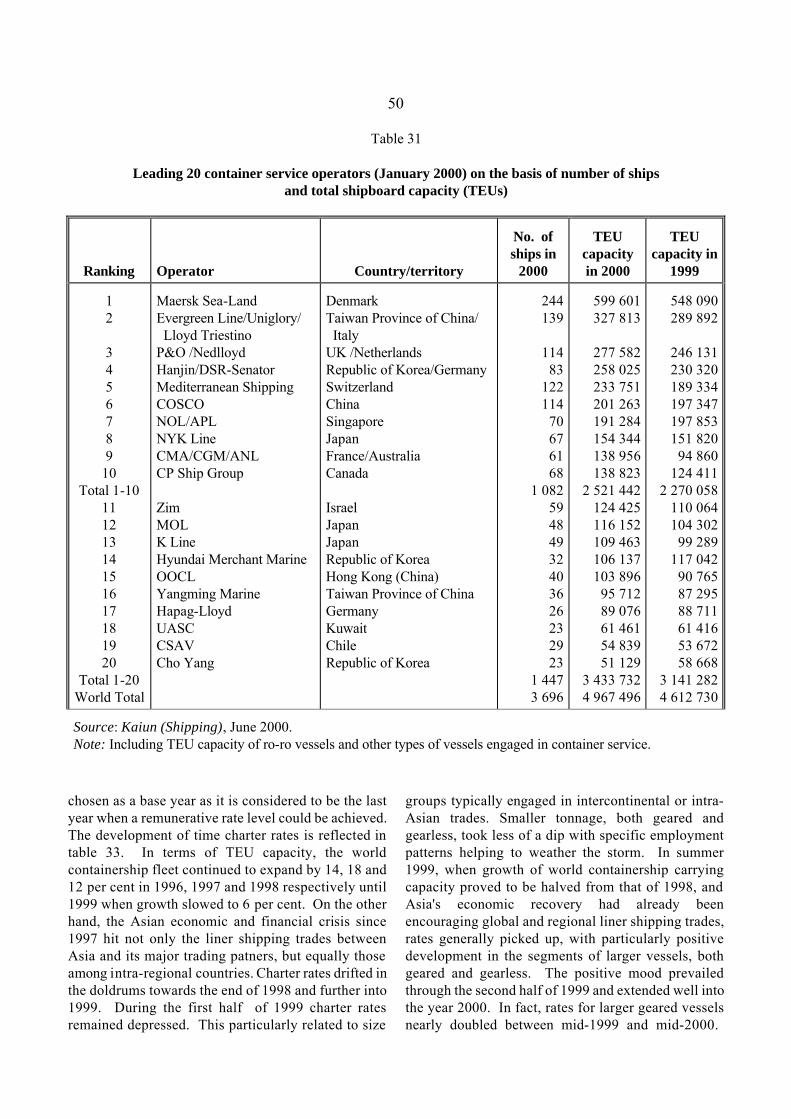
50 Table 31 Leading 20 container service operators (January 2000) on the basis of number of ships and total shipboard capacity (TEUs)
Ranking
Operator
Country/territory
No. of ships in
2000
TEU
capacity in 2000
TEU
capacity in 1999
1 2 3 4 5 6 7 8 9
10 Total 1-10
11 12 13 14 15 16 17 18 19 20
Total 1-20 World Total
Maersk Sea-Land Evergreen Line/Uniglory/ Lloyd Triestino P&O /Nedlloyd Hanjin/DSR-Senator Mediterranean Shipping COSCO NOL/APL NYK Line CMA/CGM/ANL CP Ship Group Zim MOL K Line Hyundai Merchant Marine OOCL Yangming Marine Hapag-Lloyd UASC CSAV Cho Yang
Denmark Taiwan Province of China/ Italy UK /Netherlands Republic of Korea/Germany Switzerland China Singapore Japan France/Australia Canada Israel Japan Japan Republic of Korea Hong Kong (China) Taiwan Province of China Germany Kuwait Chile Republic of Korea
244 139
114
83 122 114
70 67 61 68
1 082 59 48 49 32 40 36 26 23 29 23
1 447 3 696
599 601 327 813
277 582 258 025 233 751 201 263 191 284 154 344 138 956 138 823
2 521 442 124 425 116 152 109 463 106 137 103 896
95 712 89 076 61 461 54 839 51 129
3 433 732 4 967 496
548 090 289 892
246 131 230 320 189 334 197 347 197 853 151 820
94 860 124 411
2 270 058 110 064 104 302
99 289 117 042
90 765 87 295 88 711 61 416 53 672 58 668
3 141 282 4 612 730
Source: Kaiun (Shipping), June 2000. Note: Including TEU capacity of ro-ro vessels and other types of vessels engaged in container service.
chosen as a base year as it is considered to be the last year when a remunerative rate level could be achieved. The development of time charter rates is reflected in table 33. In terms of TEU capacity, the world containership fleet continued to expand by 14, 18 and 12 per cent in 1996, 1997 and 1998 respectively until 1999 when growth slowed to 6 per cent. On the other hand, the Asian economic and financial crisis since 1997 hit not only the liner shipping trades between Asia and its major trading patners, but equally those among intra-regional countries. Charter rates drifted in the doldrums towards the end of 1998 and further into 1999. During the first half of 1999 charter rates remained depressed. This particularly related to size
groups typically engaged in intercontinental or intra-Asian trades. Smaller tonnage, both geared and gearless, took less of a dip with specific employment patterns helping to weather the storm. In summer 1999, when growth of world containership carrying capacity proved to be halved from that of 1998, and Asia's economic recovery had already been encouraging global and regional liner shipping trades, rates generally picked up, with particularly positive development in the segments of larger vessels, both geared and gearless. The positive mood prevailed through the second half of 1999 and extended well into the year 2000. In fact, rates for larger geared vessels nearly doubled between mid-1999 and mid-2000.
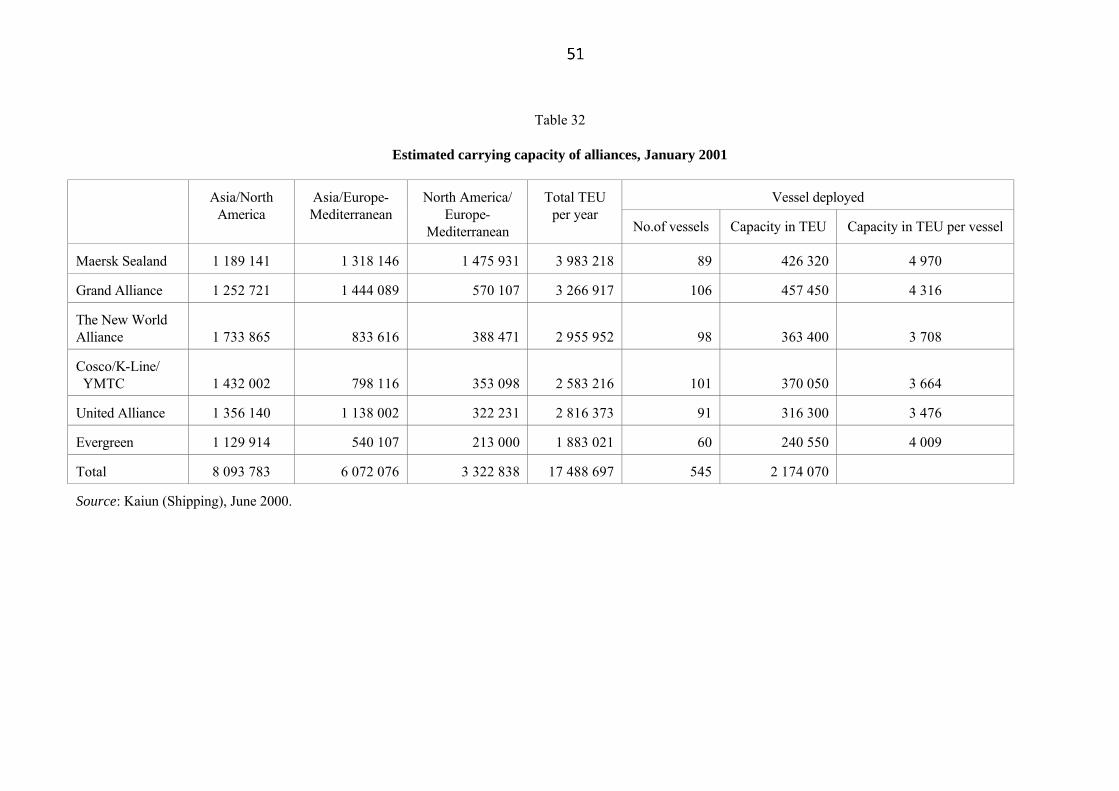
Table 32 Estimated carrying capacity of alliances, January 2001
Vessel deployed
Asia/North
America
Asia/Europe-Mediterranean
North America/
Europe-Mediterranean
Total TEU
per year No.of vessels
Capacity in TEU
Capacity in TEU per vessel
Maersk Sealand
1 189 141
1 318 146
1 475 931
3 983 218
89
426 320
4 970
Grand Alliance
1 252 721
1 444 089
570 107
3 266 917
106
457 450
4 316
The New World Alliance
1 733 865
833 616
388 471
2 955 952
98
363 400
3 708
Cosco/K-Line/ YMTC
1 432 002
798 116
353 098
2 583 216
101
370 050
3 664
United Alliance
1 356 140
1 138 002
322 231
2 816 373
91
316 300
3 476
Evergreen
1 129 914
540 107
213 000
1 883 021
60
240 550
4 009
Total
8 093 783
6 072 076
3 322 838
17 488 697
545
2 174 070
Source: Kaiun (Shipping), June 2000.
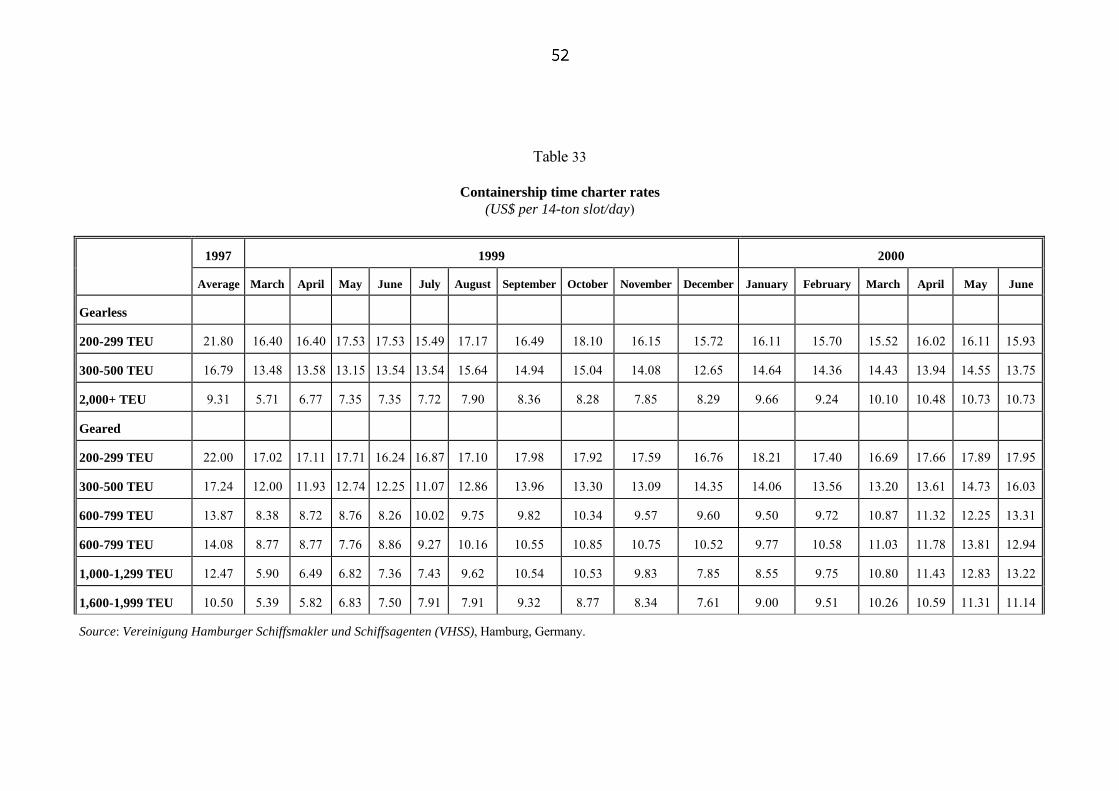
Table 33 Containership time charter rates (US$ per 14-ton slot/day)
1997
1999
2000
Average
March
April
May
June
July
August
September
October
November
December
January
February
March
April
May
June
Gearless
200-299 TEU
21.80
16.40
16.40
17.53
17.53
15.49
17.17
16.49
18.10
16.15
15.72
16.11
15.70
15.52
16.02
16.11
15.93
300-500 TEU
16.79
13.48
13.58
13.15
13.54
13.54
15.64
14.94
15.04
14.08
12.65
14.64
14.36
14.43
13.94
14.55
13.75
2,000+ TEU
9.31
5.71
6.77
7.35
7.35
7.72
7.90
8.36
8.28
7.85
8.29
9.66
9.24
10.10
10.48
10.73
10.73
Geared
200-299 TEU
22.00
17.02
17.11
17.71
16.24
16.87
17.10
17.98
17.92
17.59
16.76
18.21
17.40
16.69
17.66
17.89
17.95
300-500 TEU
17.24
12.00
11.93
12.74
12.25
11.07
12.86
13.96
13.30
13.09
14.35
14.06
13.56
13.20
13.61
14.73
16.03
600-799 TEU
13.87
8.38
8.72
8.76
8.26
10.02
9.75
9.82
10.34
9.57
9.60
9.50
9.72
10.87
11.32
12.25
13.31
600-799 TEU
14.08
8.77
8.77
7.76
8.86
9.27
10.16
10.55
10.85
10.75
10.52
9.77
10.58
11.03
11.78
13.81
12.94
1,000-1,299 TEU
12.47
5.90
6.49
6.82
7.36
7.43
9.62
10.54
10.53
9.83
7.85
8.55
9.75
10.80
11.43
12.83
13.22
1,600-1,999 TEU
10.50
5.39
5.82
6.83
7.50
7.91
7.91
9.32
8.77
8.34
7.61
9.00
9.51
10.26
10.59
11.31
11.14
Source: Vereinigung Hamburger Schiffsmakler und Schiffsagenten (VHSS), Hamburg, Germany.

53
In June 2000, rates for 2000+ TEU gearless and 1000+ TEU geared vessels for the first time surpassed the average 1997 levels and thus terminated an extended period of depressed markets with rates not covering operating costs. At the same time, it was observed that longer period charters of up to two years gained momentum. It has to be noted though, that these positive developments were partly compensated by bunker cost increases reflecting general movements of oil prices. In June 2000 prices went up to about US$ 152/t from about US$ 87/t 12 months earlier. It can thus be estimated, that a 1600 TEU ship with a consumption of 53 t per day at sea incurred bunker cost of more than US$ 8000 per day as compared to US$ 4600 in June 1999. (b) Freight level of main liner services 70. In the transpacific trades, during the fourth quarter of 1999, eastbound rates per TEU fell by 1.0 per cent from those of the previous quarter, whilst the average annual revenue per TEU in 1999 increased by 34.1 per cent to $ 2,005 per TEU as compared with that in the previous year (see table 34). The United States Ocean Shipping Act 1998 was implemented in May 1999, and new carriers made inroads into the trade in 1999. In these conditions, the rates increased in 1999. That was attributable to strong growth in eastbound trades, which continued to be driven primarily by exports from the Republic of Korea, China and Thailand. In the westbound trade, the market in the fourth quarter of 1999 remained stagnant at the low level, with rates declining by another 10.0 per cent from the previous quarter or by 13.0 per cent lower than in the fourth quarter in 1998. The average annual rate per TEU in 1999 declined by as much as 18.1 per cent from its level in 1998. Cargo volume on this trade route remained sluggish (see tables 35 and 36). United States exports, such as waste paper, rags and resins, for example, were affected by increasing pressure from European suppliers of these cargoes. In 2000, the trades are expected to expand at a minimum of 5 per cent both eastbound and westbound. Estimated growth of tonnage supply vary from 5 per cent to 10 per cent, thus maintaining space utilization at about the same level as in 1999. Consequently, it is not expected that average east or westbound freight levels will change significantly in 2000. 71. In the Asia-Europe trades, during the second quarter of 1999, freight rates on both westbound and eastbound routes showed relatively stable trends with revenue per TEU edging up by 1.0 per cent in both directions. The Far Eastern Freight Conference was
somewhat optimistic about the trade. Actually the various operating units such as the Eastbound Management Agreement, Asia Westbound Rate Agreement and Japan/Europe Freight Conference imposed a series of rate restoration measures in 1999. Continuous expansion of cargo movements in both directions during the third and fourth quarters in 1999 raised freight levels by 1.0 and 6.0 per cent respectively on the Europe to Asia route, and 2.8 and 3.0 per cent respectively on the Asia-Europe route. In 2000, with cargo movements strong and ship-tonnage supply in relatively better balance with cargo demand, higher freight rates than in 1999 are expected by carriers. 72. The transatlantic trade remained the most problematic liner market in 1999. Freight rates on the eastbound trade fell further by 6.4 per cent. Relatively unfavourable economic conditions in Europe continued to pressurize growth in containerized traffic volume in both directions of this trade (see tables 35 and 36). The average annual rates for 1999 fell significantly by 22.8 per cent in the United States to Europe trade and 11.7 per cent in the opposite direction as compared with those in 1998. Nevertheless, a strong United States dollar and a weakening Euro caused Europe's exports to the United States to grow rather strongly in the second half of 1999, consequently helping rates to move upwards during that period. In 2000, the two basic developments of 1999 will continue to prevail, i.e. continuous United States dollar strength will maintain directional imbalances, and the supply of ship tonnage will continue to exceed demand, thus further intensifying competition among carriers. (c) Supply and demand in respect of main liner
services 73. In 1999 liner trades continued to suffer from overcapacity and structural imbalances, even though some signs of improvement could be observed in late 1999 and in 2000. In the trade between Asia and the United States (transpacific), average space utilization on both trade routes (eastbound and westbound) improved marginally. At the same time, however, the gap between supply and demand widened. Ships' annual total carrying capacity eastbound or westbound increased by 4 per cent in 1999, while eastbound cargo volume grew 11.9 per cent and the space utilization improved from 77.6 per cent in 1998 to 83.5 per cent. As westbound growth remained below capacity increase, utilization rates decreased to 48.2 per cent from 49.8 per cent in 1998. Based on preliminary
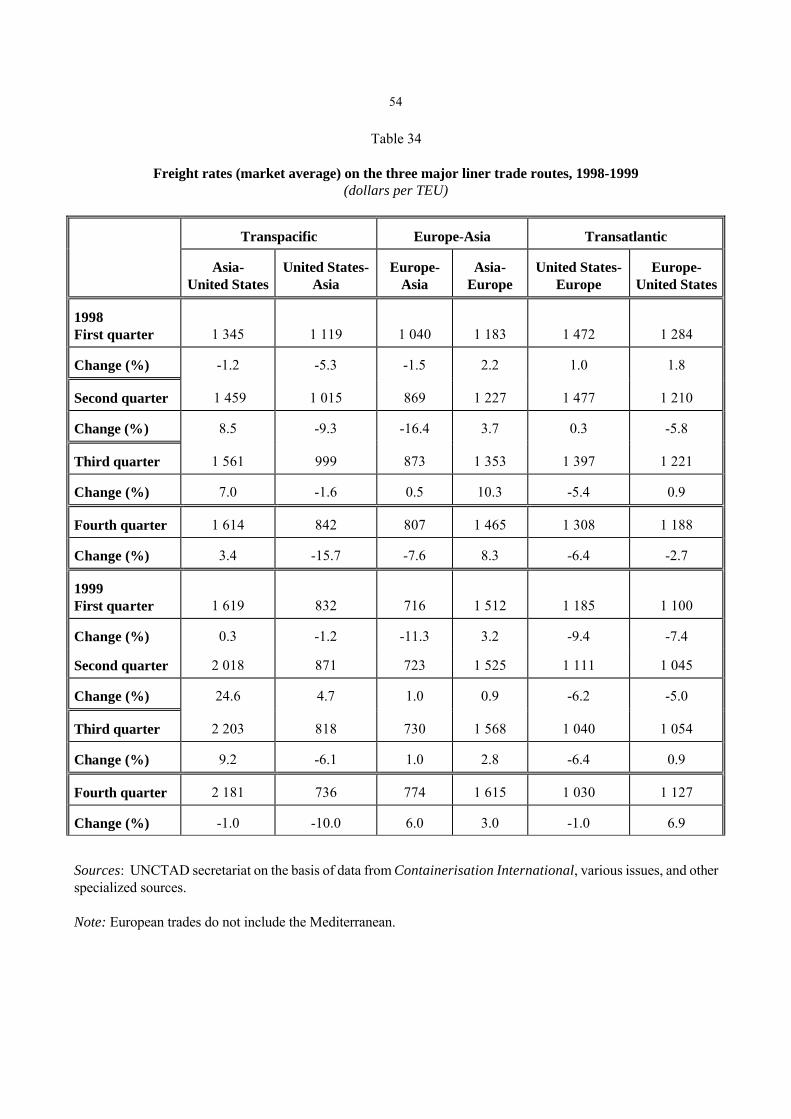
54
Table 34
Freight rates (market average) on the three major liner trade routes, 1998-1999 (dollars per TEU)
Transpacific
Europe-Asia
Transatlantic
Asia-
United States
United States-
Asia
Europe-
Asia
Asia-
Europe
United States-
Europe
Europe-
United States 1998 First quarter
1 345
1 119
1 040
1 183
1 472
1 284 Change (%)
-1.2
-5.3
-1.5
2.2
1.0
1.8
Second quarter
1 459
1 015
869
1 227
1 477
1 210
Change (%)
8.5
-9.3
-16.4
3.7
0.3
-5.8
Third quarter
1 561
999
873
1 353
1 397
1 221
Change (%)
7.0
-1.6
0.5
10.3
-5.4
0.9
Fourth quarter
1 614
842
807
1 465
1 308
1 188
Change (%)
3.4
-15.7
-7.6
8.3
-6.4
-2.7
1999 First quarter
1 619
832
716
1 512
1 185
1 100 Change (%)
0.3
-1.2
-11.3
3.2
-9.4
-7.4
Second quarter
2 018
871
723
1 525
1 111
1 045
Change (%)
24.6
4.7
1.0
0.9
-6.2
-5.0
Third quarter
2 203
818
730
1 568
1 040
1 054
Change (%)
9.2
-6.1
1.0
2.8
-6.4
0.9
Fourth quarter
2 181
736
774
1 615
1 030
1 127
Change (%)
-1.0
-10.0
6.0
3.0
-1.0
6.9
Sources: UNCTAD secretariat on the basis of data from Containerisation International, various issues, and other specialized sources. Note: European trades do not include the Mediterranean.
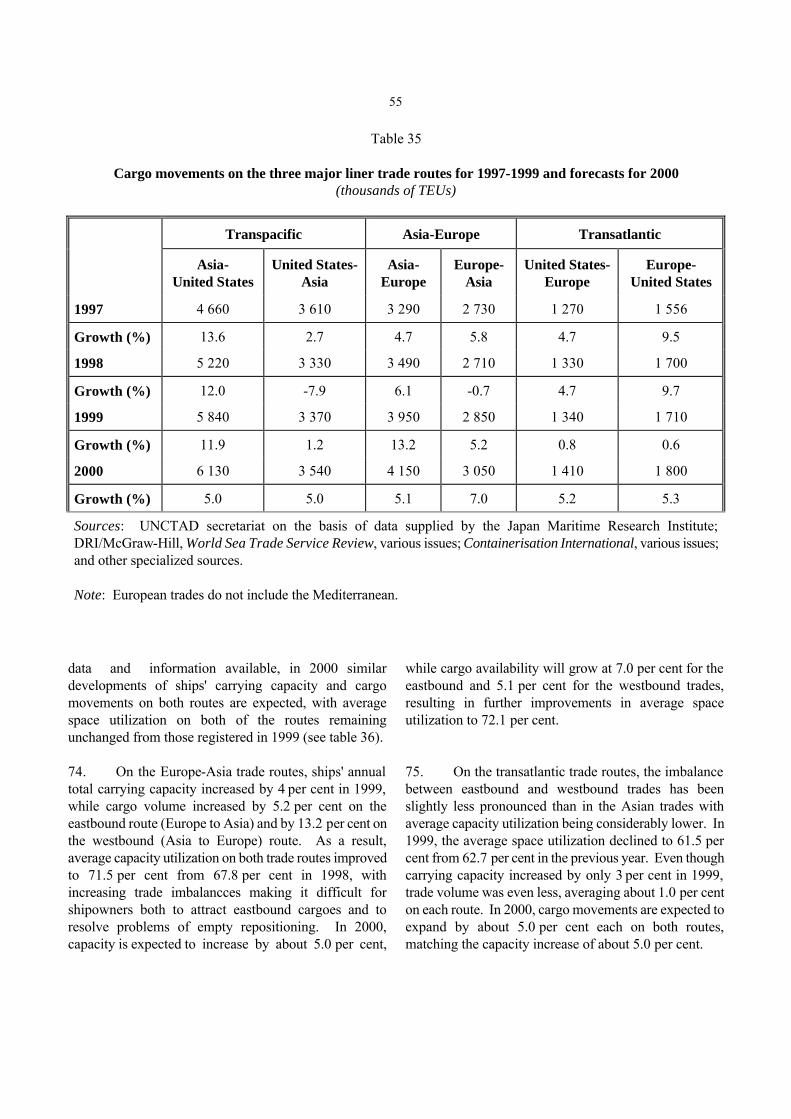
55
Table 35 Cargo movements on the three major liner trade routes for 1997-1999 and forecasts for 2000 (thousands of TEUs)
Transpacific
Asia-Europe
Transatlantic
Asia-
United States
United States-
Asia
Asia-
Europe
Europe-
Asia
United States-
Europe
Europe-
United States 1997
4 660
3 610
3 290
2 730
1 270
1 556
Growth (%)
13.6
2.7
4.7
5.8
4.7
9.5
1998
5 220
3 330
3 490
2 710
1 330
1 700
Growth (%)
12.0
-7.9
6.1
-0.7
4.7
9.7
1999
5 840
3 370
3 950
2 850
1 340
1 710
Growth (%)
11.9
1.2
13.2
5.2
0.8
0.6
2000
6 130
3 540
4 150
3 050
1 410
1 800
Growth (%)
5.0
5.0
5.1
7.0
5.2
5.3
Sources: UNCTAD secretariat on the basis of data supplied by the Japan Maritime Research Institute; DRI/McGraw-Hill, World Sea Trade Service Review, various issues; Containerisation International, various issues; and other specialized sources. Note: European trades do not include the Mediterranean.
data and information available, in 2000 similar developments of ships' carrying capacity and cargo movements on both routes are expected, with average space utilization on both of the routes remaining unchanged from those registered in 1999 (see table 36). 74. On the Europe-Asia trade routes, ships' annual total carrying capacity increased by 4 per cent in 1999, while cargo volume increased by 5.2 per cent on the eastbound route (Europe to Asia) and by 13.2 per cent on the westbound (Asia to Europe) route. As a result, average capacity utilization on both trade routes improved to 71.5 per cent from 67.8 per cent in 1998, with increasing trade imbalancces making it difficult for shipowners both to attract eastbound cargoes and to resolve problems of empty repositioning. In 2000, capacity is expected to increase by about 5.0 per cent,
while cargo availability will grow at 7.0 per cent for the eastbound and 5.1 per cent for the westbound trades, resulting in further improvements in average space utilization to 72.1 per cent. 75. On the transatlantic trade routes, the imbalance between eastbound and westbound trades has been slightly less pronounced than in the Asian trades with average capacity utilization being considerably lower. In 1999, the average space utilization declined to 61.5 per cent from 62.7 per cent in the previous year. Even though carrying capacity increased by only 3 per cent in 1999, trade volume was even less, averaging about 1.0 per cent on each route. In 2000, cargo movements are expected to expand by about 5.0 per cent each on both routes, matching the capacity increase of about 5.0 per cent.
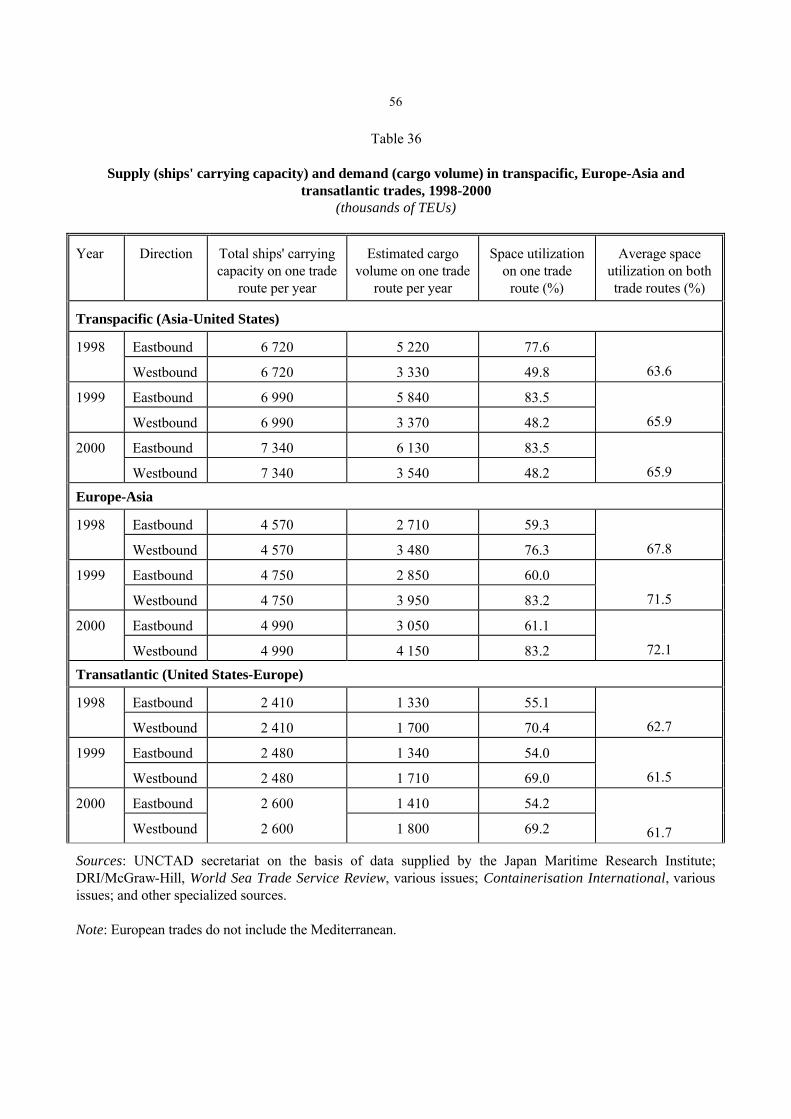
56
Table 36 Supply (ships' carrying capacity) and demand (cargo volume) in transpacific, Europe-Asia and transatlantic trades, 1998-2000 (thousands of TEUs)
Year
Direction
Total ships' carrying capacity on one trade
route per year
Estimated cargo
volume on one trade route per year
Space utilization
on one trade route (%)
Average space
utilization on both trade routes (%)
Transpacific (Asia-United States)
Eastbound
6 720
5 220
77.6
1998
Westbound
6 720
3 330
49.8
63.6
Eastbound
6 990
5 840
83.5
1999
Westbound
6 990
3 370
48.2
65.9
Eastbound
7 340
6 130
83.5
2000
Westbound
7 340
3 540
48.2
65.9
Europe-Asia
Eastbound
4 570
2 710
59.3
1998
Westbound
4 570
3 480
76.3
67.8
Eastbound
4 750
2 850
60.0
1999
Westbound
4 750
3 950
83.2
71.5
Eastbound
4 990
3 050
61.1
2000
Westbound
4 990
4 150
83.2
72.1
Transatlantic (United States-Europe)
Eastbound
2 410
1 330
55.1
1998
Westbound
2 410
1 700
70.4
62.7
Eastbound
2 480
1 340
54.0
1999
Westbound
2 480
1 710
69.0
61.5
Eastbound
2 600
1 410
54.2
2000
Westbound
2 600
1 800
69.2
61.7
Sources: UNCTAD secretariat on the basis of data supplied by the Japan Maritime Research Institute; DRI/McGraw-Hill, World Sea Trade Service Review, various issues; Containerisation International, various issues; and other specialized sources. Note: European trades do not include the Mediterranean.
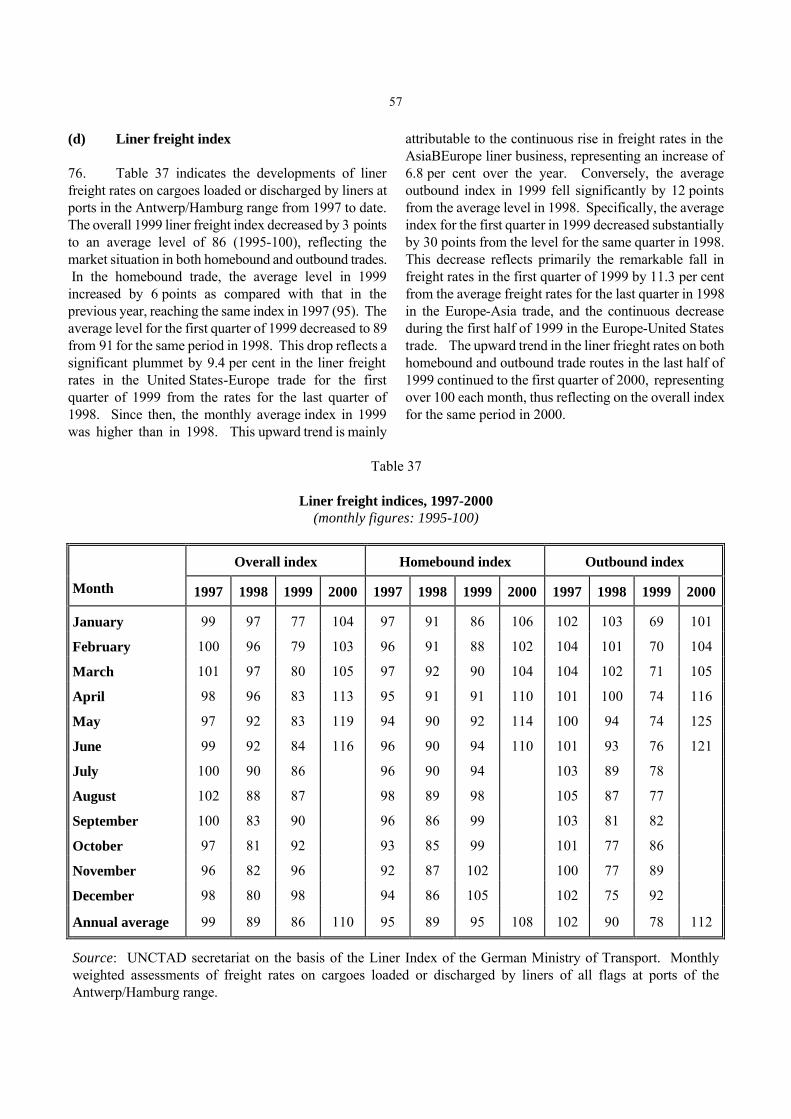
57
(d) Liner freight index 76. Table 37 indicates the developments of liner freight rates on cargoes loaded or discharged by liners at ports in the Antwerp/Hamburg range from 1997 to date. The overall 1999 liner freight index decreased by 3 points to an average level of 86 (1995-100), reflecting the market situation in both homebound and outbound trades. In the homebound trade, the average level in 1999 increased by 6 points as compared with that in the previous year, reaching the same index in 1997 (95). The average level for the first quarter of 1999 decreased to 89 from 91 for the same period in 1998. This drop reflects a significant plummet by 9.4 per cent in the liner freight rates in the United States-Europe trade for the first quarter of 1999 from the rates for the last quarter of 1998. Since then, the monthly average index in 1999 was higher than in 1998. This upward trend is mainly
attributable to the continuous rise in freight rates in the AsiaBEurope liner business, representing an increase of 6.8 per cent over the year. Conversely, the average outbound index in 1999 fell significantly by 12 points from the average level in 1998. Specifically, the average index for the first quarter in 1999 decreased substantially by 30 points from the level for the same quarter in 1998. This decrease reflects primarily the remarkable fall in freight rates in the first quarter of 1999 by 11.3 per cent from the average freight rates for the last quarter in 1998 in the Europe-Asia trade, and the continuous decrease during the first half of 1999 in the Europe-United States trade. The upward trend in the liner frieght rates on both homebound and outbound trade routes in the last half of 1999 continued to the first quarter of 2000, representing over 100 each month, thus reflecting on the overall index for the same period in 2000.
Table 37 Liner freight indices, 1997-2000 (monthly figures: 1995-100)
Overall index
Homebound index
Outbound index
Month
1997
1998
1999
2000
1997
1998
1999
2000
1997
1998
1999
2000
January
99
97
77
104
97
91
86
106
102
103
69
101
February
100
96
79
103
96
91
88
102
104
101
70
104
March
101
97
80
105
97
92
90
104
104
102
71
105
April
98
96
83
113
95
91
91
110
101
100
74
116
May
97
92
83
119
94
90
92
114
100
94
74
125
June
99
92
84
116
96
90
94
110
101
93
76
121
July
100
90
86
96
90
94
103
89
78
August
102
88
87
98
89
98
105
87
77
September
100
83
90
96
86
99
103
81
82
October
97
81
92
93
85
99
101
77
86
November
96
82
96
92
87
102
100
77
89
December
98
80
98
94
86
105
102
75
92
Annual average
99
89
86
110
95
89
95
108
102
90
78
112
Source: UNCTAD secretariat on the basis of the Liner Index of the German Ministry of Transport. Monthly weighted assessments of freight rates on cargoes loaded or discharged by liners of all flags at ports of the Antwerp/Hamburg range.
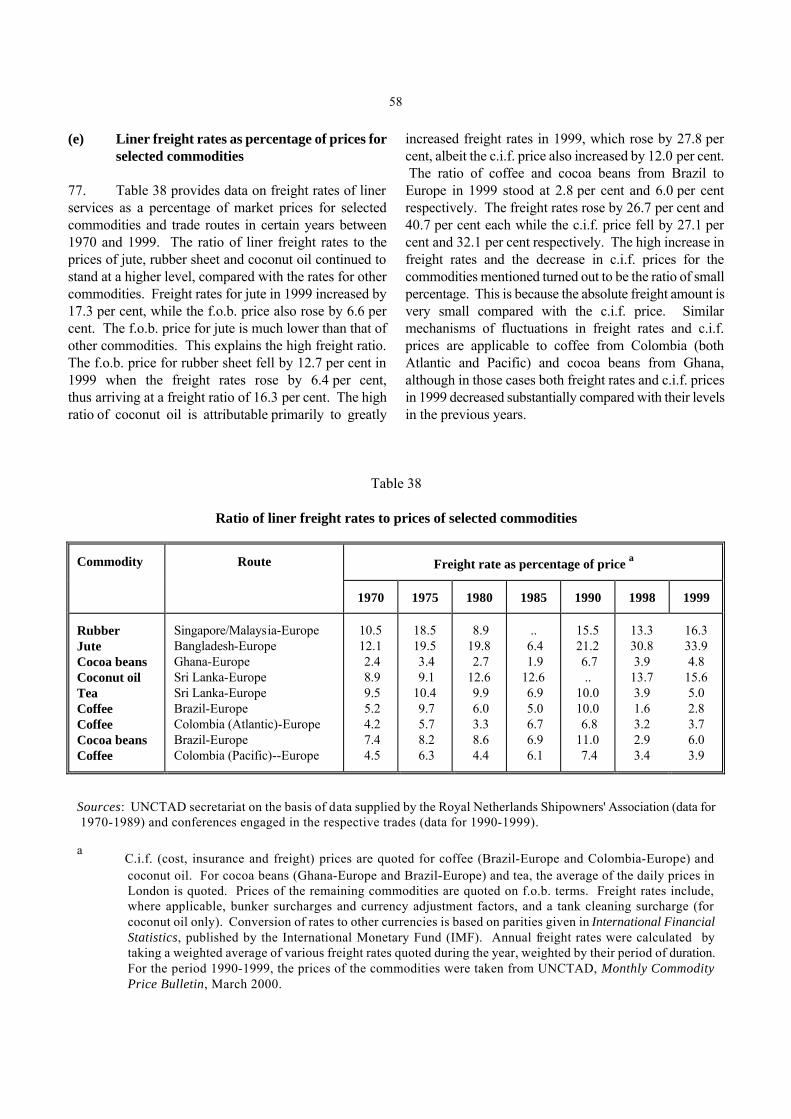
58
(e) Liner freight rates as percentage of prices for selected commodities
77. Table 38 provides data on freight rates of liner services as a percentage of market prices for selected commodities and trade routes in certain years between 1970 and 1999. The ratio of liner freight rates to the prices of jute, rubber sheet and coconut oil continued to stand at a higher level, compared with the rates for other commodities. Freight rates for jute in 1999 increased by 17.3 per cent, while the f.o.b. price also rose by 6.6 per cent. The f.o.b. price for jute is much lower than that of other commodities. This explains the high freight ratio. The f.o.b. price for rubber sheet fell by 12.7 per cent in 1999 when the freight rates rose by 6.4 per cent, thus arriving at a freight ratio of 16.3 per cent. The high ratio of coconut oil is attributable primarily to greatly
increased freight rates in 1999, which rose by 27.8 per cent, albeit the c.i.f. price also increased by 12.0 per cent. The ratio of coffee and cocoa beans from Brazil to Europe in 1999 stood at 2.8 per cent and 6.0 per cent respectively. The freight rates rose by 26.7 per cent and 40.7 per cent each while the c.i.f. price fell by 27.1 per cent and 32.1 per cent respectively. The high increase in freight rates and the decrease in c.i.f. prices for the commodities mentioned turned out to be the ratio of small percentage. This is because the absolute freight amount is very small compared with the c.i.f. price. Similar mechanisms of fluctuations in freight rates and c.i.f. prices are applicable to coffee from Colombia (both Atlantic and Pacific) and cocoa beans from Ghana, although in those cases both freight rates and c.i.f. prices in 1999 decreased substantially compared with their levels in the previous years.
Table 38 Ratio of liner freight rates to prices of selected commodities
Freight rate as percentage of price a
Commodity
Route
1970
1975
1980
1985
1990
1998
1999
Rubber Jute Cocoa beans Coconut oil Tea Coffee Coffee Cocoa beans Coffee
Singapore/Malaysia-Europe Bangladesh-Europe Ghana-Europe Sri Lanka-Europe Sri Lanka-Europe Brazil-Europe Colombia (Atlantic)-Europe Brazil-Europe Colombia (Pacific)--Europe
10.5 12.1 2.4 8.9 9.5 5.2 4.2 7.4 4.5
18.5 19.5 3.4 9.1 10.4 9.7 5.7 8.2 6.3
8.9 19.8 2.7 12.6 9.9 6.0 3.3 8.6 4.4
..
6.4 1.9 12.6 6.9 5.0 6.7 6.9 6.1
15.5 21.2 6.7
.. 10.0 10.0 6.8 11.0 7.4
13.3 30.8 3.9
13.7 3.9 1.6 3.2 2.9 3.4
16.3 33.9 4.8
15.6 5.0 2.8 3.7 6.0 3.9
Sources: UNCTAD secretariat on the basis of data supplied by the Royal Netherlands Shipowners' Association (data for 1970-1989) and conferences engaged in the respective trades (data for 1990-1999). a C.i.f. (cost, insurance and freight) prices are quoted for coffee (Brazil-Europe and Colombia-Europe) and
coconut oil. For cocoa beans (Ghana-Europe and Brazil-Europe) and tea, the average of the daily prices in London is quoted. Prices of the remaining commodities are quoted on f.o.b. terms. Freight rates include, where applicable, bunker surcharges and currency adjustment factors, and a tank cleaning surcharge (for coconut oil only). Conversion of rates to other currencies is based on parities given in International Financial Statistics, published by the International Monetary Fund (IMF). Annual freight rates were calculated by taking a weighted average of various freight rates quoted during the year, weighted by their period of duration. For the period 1990-1999, the prices of the commodities were taken from UNCTAD, Monthly Commodity Price Bulletin, March 2000.

59
B. DRY BULK SHIPPING MARKET (a) Dry bulk trade 78. In 1999, overall dry cargo shipments increased at the relatively higher rate of 3.0 per cent, reaching approximately 2,970 million tons, of which main dry bulk commodities stood at 1,233 million tons or 41.5 per cent of total dry bulk cargo shipments. World crude steel production in 1999 increased very marginally by 1.3 per cent to 787 million tons. Iron ore shipments declined slightly by 1.7 per cent to 410 million tons in 1999. Coking coal also decreased marginally by 1.7 per cent to 174 million tons whilst thermal coal increased by 3.3 per cent to 306 million tons, with total coal seaborne trade expanding by 1.5 per cent to reach 480 million tons. World trade in grain increased by 7.1 per cent to 210 million tons in 1999. Steel production, iron ore and coal trades 79. World crude steel production increased by 1.3 per cent to 787 million tons in 1999. As in the previous year, strong regional differences in production prevailed in 1999. In Asia, China's crude steel production rose by 8.0 per cent to 123.7 million tons in 1999 from the previous year's level, while Japan's crude steel production increased to 94.2 million tons from 93.5 million tons in 1998. The Republic of Korea expanded its production by 2.9 per cent to 41.0 million tons whilst that of Taiwan Province of China decreased by 9.0 per cent to 15.4 million tons. Total production of the four major Asian producers grew by 3.5 per cent to 274.3 million tons or 34.9 per cent of the world total. The output of European Union member countries decreased by 3.0 per cent to 155.4 million tons. The United States' production dropped by 1.4 per cent to 97.3 million tons while the former Soviet Union experienced a strong growth to 85.8 million tons in 1999 from 74.4 million tons in 1998. 80. The world seaborne trade in iron ore declined by 1.7 per cent to 410 million tons in 1999 from 417 million tons in 1998. Exports from Brazil decreased by 5 per cent to 135 million tons, whereas Australia registered an increase of 3 per cent to 136 million tons. Canada's iron ore exports continued to decline by approximately 14 per cent to about 27 million tons in 1999, while Sweden's exports also decreased by as much as 13 per cent to 14 million tons. In 1999, world coal shipments continued to increase by 1.5 per cent to 480 million tons from 473 million tons in the previous year. Exports from Australia maintained strong growth in 1999. China's coal
exports rose significantly by 19 per cent to 38 million tons, whereas South Africa's exports fell by 3 per cent to 63 million tons. Coal exports from the United States in 1999 plunged dramatically to 37 million tons from 52 million tons in 1998, while Canada's coal exports declined by 3 per cent to 34 million tons in 1999. Coal exports from Indonesia in 1999 expanded by as much as 20 per cent to 48 million tons. On the importing side, both Japan and the Republic of Korea increased their coal imports by 4 per cent each to 137 million tons and 55 million tons respectively in 1999. Imports into Taiwan Province of China were up by 10 per cent to 41 million tons. Grain trade 81. World grain shipments in 1999 increased by 7.1 per cent to 210 million tons. Trading patterns changed with large fluctuations during the year. The United States' exports increased remarkably by about 18.3 per cent to 87.9 million tons, while Canada and Australia also expanded their respective supplies by 6.2 per cent and 8.7 per cent to 19.3 million tons and 20.6 million tons respectively. Argentina's exports plummeted by 28.7 per cent to 17.3 million tons, whilst the European Union's supply to third countries increased by 17.2 per cent to 21.3 million tons. (b) Dry bulk freight rates 82. In 1999, the dry bulk supply and demand balance showed a clear improvement. The year ended with rates for all sizes of dry bulk carriers at significantly higher levels than in 1998. Total operational activities of dry bulk shipping have increased by 0.7 per cent in terms of ton-miles in sharp contrast to a decrease of 3.8 per cent in 1998. The dry bulk carrier fleet increased by 0.2 per cent to 276.1 million dwt. The growth in demand was notably higher during the second half of 1999 compared to the first half, specifically with strong demand from Asia for both coal and iron ore. Lay-up of dry bulk and combined carriers decreased to 2.2 million dwt in 1999 from 2.4 million dwt, and tonnage for storage remained minimal (see table 39). Dry bulk time-charter (trips)
83. The overall average time-charter trip rates rose favourably in 1999, as compared with those in 1998, on the four major trade routes, i.e. Atlantic round voyage, Pacific round voyage, Continent/Far East and Far East/Continent. The annual average rate for modern Capesize tonnage on the four major trade routes climbed
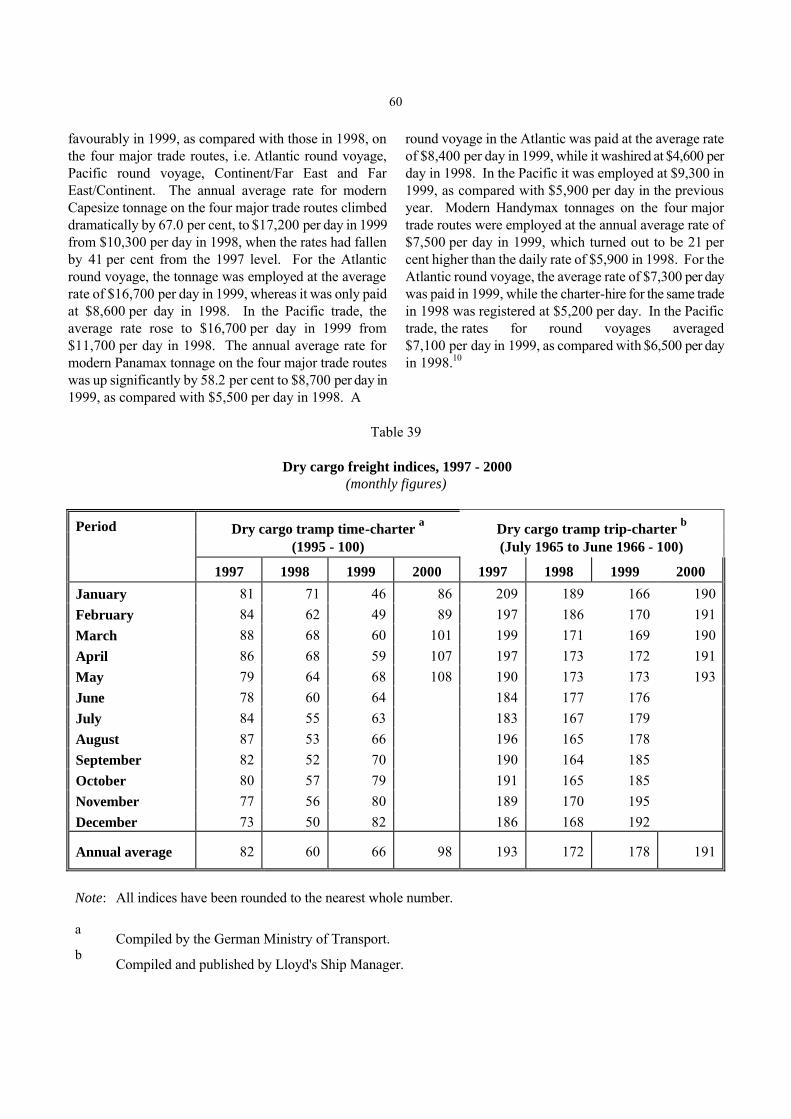
60
favourably in 1999, as compared with those in 1998, on the four major trade routes, i.e. Atlantic round voyage, Pacific round voyage, Continent/Far East and Far East/Continent. The annual average rate for modern Capesize tonnage on the four major trade routes climbed dramatically by 67.0 per cent, to $17,200 per day in 1999 from $10,300 per day in 1998, when the rates had fallen by 41 per cent from the 1997 level. For the Atlantic round voyage, the tonnage was employed at the average rate of $16,700 per day in 1999, whereas it was only paid at $8,600 per day in 1998. In the Pacific trade, the average rate rose to $16,700 per day in 1999 from $11,700 per day in 1998. The annual average rate for modern Panamax tonnage on the four major trade routes was up significantly by 58.2 per cent to $8,700 per day in 1999, as compared with $5,500 per day in 1998. A
round voyage in the Atlantic was paid at the average rate of $8,400 per day in 1999, while it washired at $4,600 per day in 1998. In the Pacific it was employed at $9,300 in 1999, as compared with $5,900 per day in the previous year. Modern Handymax tonnages on the four major trade routes were employed at the annual average rate of $7,500 per day in 1999, which turned out to be 21 per cent higher than the daily rate of $5,900 in 1998. For the Atlantic round voyage, the average rate of $7,300 per day was paid in 1999, while the charter-hire for the same trade in 1998 was registered at $5,200 per day. In the Pacific trade, the rates for round voyages averaged $7,100 per day in 1999, as compared with $6,500 per day in 1998.10
Table 39
Dry cargo freight indices, 1997 - 2000 (monthly figures)
Dry cargo tramp time-charter a
(1995 - 100)
Dry cargo tramp trip-charter b (July 1965 to June 1966 - 100)
Period
1997
1998
1999
2000
1997
1998
1999
2000
January
81
71
46
86
209
189
166
190 February
84
62
49
89
197
186
170
191
March
88
68
60
101
199
171
169
190 April
86
68
59
107
197
173
172
191
May
79
64
68
108
190
173
173
193 June
78
60
64
184
177
176
July
84
55
63
183
167
179
August
87
53
66
196
165
178
September
82
52
70
190
164
185
October
80
57
79
191
165
185
November
77
56
80
189
170
195
December
73
50
82
186
168
192
Annual average
82
60
66
98
193
172
178
191
Note: All indices have been rounded to the nearest whole number.
a Compiled by the German Ministry of Transport.
b Compiled and published by Lloyd's Ship Manager.

61
Dry bulk time-charter (periods) 84. In early 1999, a modern Capesize tonnage was hired on a 12-month time-charter at around $9,000 per day. In May, when some signals of the slow recovery of dry bulk markets in Asia emerged, a modern 150,000 dwt bulker was fixed at $9,000 per day for 12 months by an Asian operator. During the first 7 months, about 7 million dwt of dry cargo ships were destined for the scrapyard. In the middle of August 1999, it was reported that a Belgian operator had chartered about 30 modern Capesize tonners on a period time-charter. This big deal helped period time-charter markets to improve by $2,000B3,000 per day. The period time-charter market for Panamax experienced its lowest levels in the first quarter of 1999. In April, a modern Panamax was fixed at $6,250 per day for 12 months, and a similar tonnage was employed at $8,500 per day for three years with an option for a fourth and fifth year at $10,500 per day and $11,500 per day respectively. In early May a Panamax was chartered at $7,750 per day for 12 months. In the second half of 1999, the Panamax period time-charter market improved somewhat. However, in the 1999 overall Panamax time-charter markets, there was a relatively big gap between the trip market and the medium-period market. The latter remained unsatisfactory for owners mainly due to the uncertainty of cargo movements, which demanded medium-period employment of niche Panamax tonners. Average period time-charter rates for Handymax dry bulkers were about $7,400 per day for 12 months in 1999, which was somewhat of an improvement over 1998.11 Dry bulk trip-charter 85. The year 1999 started in dismal circumstances for Capesize tonnages, with no encouraging signs in sight. Rates stood at record low levels in most trades, with iron ore shipments for Tubarao (Brazil)/Rotterdam being paid at $3.50 per ton. Iron ore trades on the Brazil/China route were paid at $4.90 per ton. Tonnages for the Richards Bay/Rotterdam coal trade were hired at $4.25 per ton. From July until October 1999, charter-rates for Capesize increased significantly. Rates for the iron ore trade on the Brazil/China route stood at $8.65 per ton in October and climbed further to $11.00 per ton in November. Coal shipments from Australia to Europe moved from the lowest rate of $5.50 per ton in January 1999 to $11.25 per ton in November of that year. Taking the development of iron ore trades as a reference rate, the average freight rate for iron ore on the Brazil/Europe (Rotterdam) in Capesize vessels was up to $4.43 per ton in 1999 from $4.17 per ton in 1998. Fluctuations were significant in the rate of $3.20B6.50 with the highest rate
towards the end of 1999. The reference rate for coal from Hampton Roads/Richards Bay to the Far East in Capesize tonnages increased from an annual average of $8.68 per ton in 1998 to $8.80 per ton in 1999. 86. The year 1999 was a very volatile and unpredictable year for the Panamax dry bulker market. While the market begun by being very dull in the first half of 1999, at the end of June that year it declined sharply owing to the lack of grain cargo. After a summer of uncertainty, an optimistic view finally began to be taken as demand in key Far Eastern countries started to expand. As a reference rate level for Panamax tonnages, the average freight rate for grain on the United States Gulf/Japan route in Panamax size increased by 19 per cent from an annual average of $15.34 per ton in 1998 to $18.50 per ton in 1999. Fluctuations were significant in the range from $13.85 per ton in January to $22.79 per ton in November 1999. The trip-charter market for Handysize bulkers during the year 1999 was characterized by as many ups as downs, which did not help the market to find stability.12
C. CRUDE OIL AND PETROLEUM PRODUCTS SEABORNE FREIGHT MARKET
(a) Seaborne trade in crude oil and petroleum
products
87. In 1999, world crude oil production decreased by 1.5 per cent or approximately 1.0 million barrels per day from the level of 1998. Accordingly the overall volume of the seaborne crude oil trade declined by 2.0 per cent to 1,600.5 million tons. This was somewhat offset by shipments of petroleum products in 1999, which increased by 2.0 per cent to 559 million tons. In 1999, it was observed in the world tanker market that activities for tonnage pooling continued among major owners, and that tanker-chartering practices to combine smaller oil cargo lots into larger vessels were being adopted by charterers, such as major petroleum enterprises. Furthermore, on the chartering-in side, Petrofina, Total and Elf decided to merge their chartering activities. Similarly, Repsol, YPF and Arco decided to join BP/Amoco. Thus, there seems to be a clear tendency for major charterers to become fewer and larger.
(b) Tanker freight rates 88. The tanker balance between supply and demand deteriorated overall in 1999. The tanker fleet in 1999 increased by 1.1 per cent to 282.5 million dwt, following the growth of 2.8 per cent in 1998. Laid-up tankers
62
increased from 1.6 million dwt in 1998 to 2.1 million dwt in 1999 (0.7 per cent of the total tanker fleet) and storage also increased by 0.1 million dwt to 3.2 million dwt in 1999 (1.1 per cent of the total tanker fleet) respectively. The tonnage utilization rate was rather favourable in the first quarter of 1999; however it began to slow down in the early summer when OPEC's production was reduced. Towards the end of the year, oil output and trade volume decreased further. Under these circumstances, shipping performance for crude oil decreased by 3.8 per cent in terms of ton-miles in 1999 whilst that for petroleum products increased by 2.0 per cent. Very large crude carriers (VLCCs) 89. The year 1999 was difficult for owners of VLCCs, who were adversely affected by the shortage of cargo in the trades from the Middle East Gulf owing to the reduction of OPEC output. Consequently, VLCCs were increasingly engaged on the trade routes from West Africa in 1999, where smaller tonnages such as Suezmax tankers are typically employed. The OPEC agreement to cut crude oil output hit any hopes of a recovery of rates in the large tanker sector, for the Middle East Gulf loading in particular. VLCC shipments from the Middle East Gulf fell to the low WS 40s to Asian destinations by April 1999, with one fixture dropping to the high WS 30s. Depressed VLCC rates had a knock-on effect in the markets other than the Middle East Gulf, as owners sought cargoes for their VLCCs elsewhere, such as West Africa to the United States where freights were around WS 50B55 and to Asia where rates of up to WS 42 were paid. In May 1999, increased liftings booked for July 1999 loading boosted VLCC rates from the Middle East Gulf, especially eastbound. Asian discharge trades pushed into the WS 50s and as high as WS 57 for Japanese ports. However, this was only a temporary peak, and later in the period rates eased down to around WS 50. In June and July 1999, rates for VLCCs from the Middle East Gulf plunged back below WS 40 as cargo for Far Eastern destinations dried up. From August 1999, high crude oil prices actually dampened what owners had hoped to be an upturn in demand as the northern winter approached and stockpiling took place as usual, while VLCCs were fixed from the Middle East Gulf to Asian destinations at WS 50, rising by the end of September 1999 to WS 55. On the other hand, western destinations earned about WS 50. In October 1999, despite strong trading volumes for crude oil shipments, VLCC rates slipped back slightly, to about WS 45 to eastern destinations, with rates for Europe-bound cargo about 2 points below that. Liftings from West Africa for Asian destinations were also hovering in the WS 40s. In November 1999, VLCC rates to the Far East, such as the
Republic of Korea and Japan, fluctuated around WS 50 as demand picked up. Similarly, in West Africa rates for VLCCs also reflected favourable returns, paid at WS 55 to the United States Gulf. Towards the end of the year, a lack of VLCC tonnage and owners holding out caused rates to firm. Rates for over 250,000 tonners from the Middle East Gulf to the Republic of Korea reached the mid- to high WS 60s. 90. In 1999 the average rates paid for VLCC transportation from the Middle East Gulf declined; the average rate for voyages to the West was WS 46.16, as compared with WS 58.2 recorded in 1998. On voyages to Japan, the average was WS 50.78 while it was WS 66.9 in 1998. These lower rates, coupled with doubled bunker prices during the whole year, strained the operational economies of most VLCC owners. In this context it is notable that 36 VLCC/ULCC units were sold for demolition in 1999, of which 32 were turbine tankers which proved to be uneconomical to operate in a market with low freight rates and increased bunker prices. Medium-sized crude carriers 91. In the West African market, Suezmax tankers were paid at an average rate of only WS 75.28 in 1999 on voyages to the United States Atlantic coast, which compares with WS 82.80 in 1998. In 1999, 18 Suezmax newbuildings were delivered, while 27 Suezmax units were sold for demolition, thus the size of the Suezmax fleet actually diminished, but remained the major tonnage in the whole area of the Atlantic basin. However, the rates for this size of tonnage were poor. One of the reasons for this weak market can be seen in the increasing utilization of VLCCs in markets such as West Africa, which had been traditional domains of Suezmax tonnages. The main operating routes of Suezmax are transatlantic from West African loading areas into the relatively shallow-draught United States East Coast where Suezmaxes' lesser draught makes it easier for them to approach these ports than VLCCs. On these trade routes, Suezmax with 1 million-barrel capacity competes very often with VLCC (2 million-barrel capacity) to secure cargo lots of more than 2 million-barrels if the discharging ports can accommodate VLCCs. When VLCC markets are depressed in the Middle East Gulf, owners search employments for loading in West Africa on the way back after discharge in Europe. As freight rates for Suezmax tonnage are expected to rise and VLCCs are available for loading in West Africa, charterers are induced to combine two one-million-barrel cargo lots into one for a VLCC. When rates for VLCCs rise in their main trades from the Middle East Gulf, rates for Suezmaxes for loading in West Africa also pick up
63
under less competition with the VLCCs for West African loading. In January 1999, average VLCC rates were WS 62, then coming down and stagnating at around WS 40 from the end of the first quarter to the middle of the third quarter, when rates picked up. A similar trend was observed in Suezmaxes' chartering activities from West Africa to the United States. In January 1999, freight rates were paid at WS 85, since then continuously plummeting and were in the doldrums at WS 50B60 from the second quarter to the beginning of the third quarter. For the third quarter of 1999, Suezmax fixtures in West Africa had been maintained at the level of high WS 70s. During the next four months, Suezmax liftings from West Africa managed to obtain WS 67 for European discharge and WS 65 to the United States Gulf. Similarly, Mediterranean loading tonnages were paid at WS 65B75 to Northern European destinations. In August 1999, lack of cargoes sent Suezmax rates plummeting. Rates for intra-Mediterranean cargoes dipped below WS 60 to about WS 55, while cargoes from West Africa for the United States managed to secure WS 52. When the last quarter began, demand for crude oil in preparation for the winter season in the northern hemisphere increased gradually. Suezmax demand remained relatively stable with North Sea fixtures at around WS 70 for the United States discharge, and West African liftings at WS 72 for the same destination. Towards the end of the year, these rates further improved up to the same level as at the end of 1998, at around WS 90. 92. Aframax tonnages experienced unfavourable markets, specifically in the first half of 1999. Forty-three Aframax newbuildings were delivered against only 27 units sold to the breakers. The average rates in the three major loading areas for Aframax tankers, the Mediterranean, North Sea and Caribbean, were down by about 5 per cent in 1999 compared to the average paid in 1998. Approximately 27 per cent of the Aframax fleet existing in 1999 was built in 1980 or before. These old Aframaxes were virtually excluded from trading to the United States owing to that country's regulations, and thus were employed for other destinations, adversely affecting market rates thereof. During the first quarter of 1999, Aframax tonnages for North Sea loading were paid at WS 85B95 for European discharge. As the summer season approached in the northern hemisphere, Aframax tonnages suffered a fall in freights as the summer maintenance period in the North Sea, coupled with the seasonal reduction in volumes from the Caribbean, reduced rates for 80,000 tons to WS 80 for North Sea liftings. From May to August 1999, Aframax rates edged down, with 80,000 tons for North Sea loading to
European continental destinations paid at WS 80, and further slipped to the middle of the WS 70s. Similar trends in freights were observed in the Caribbean and Mediterranean markets. Towards the end of 1999, demand for Aframax tonnages became firmer with increased cargo bookings creating a shortage of this size of tanker. Rates for 80,000 tons to Japan from the Middle East Gulf went as high as WS 120, while freights for cargoes from the Mediterranean to northern Europe reached WS 115. Intra-Europe trades in 80,000 tonners paid up to WS 160. Small crude and product carriers 93. In 1999, many of the major markets for product carriers took a beating. This was coupled with the entry of larger product carriers such as Aframaxes, both coated and uncoated, to replace niche tankers which dominated the 50,000B60,000 ton market, i.e. the Middle East Gulf to the Far East. The product market was already down to WS 135 for 55,000 tons and WS 110 for 75,000 tons at the beginning of 1999. The rates continued to be under pressure and drifted at the level of WS 100B110 for 60,000B70,000 tons until October. Towards the end of the year, owing to the relatively brighter prospect for winter consumption, rates recovered to the WS 150s. Handy-size clean and dirty carriers 94. In 1999 the Republic of Korea increased refinery capacity and developed its trade in products for the Japanese and Chinese markets, while expanding further to North and South America. India also increased its production capacity with new refineries, and Venezuela secured a larger market share in central and west coast South America. These developments affected movements of oil products from the Middle East Gulf. Rates for 30,000 tons on the Middle East GulfBIndian subcontinent route stagnated at WS 140s in the first half of 1999. As West African suppliers came on stage during the second and third quarters in 1999, attracting this sector of ships, rates for loading at the Middle East Gulf improved, standing at WS 175 for 40,000 tons destined for the Indian subcontinent towards the end of the year. The Atlantic market remained stable, specifically in the firsthalf of the year. A 33,000 ton lot for Europe/United States stood at the rate of WS 165-175. In the second half of the year, this rate came down to WS 140-145. The relatively volatile Caribbean market started off in 1999 above the WS 200 level for 30,000 tons on the Caribbean/United States Atlantic Coast,

Table 40 Tanker freight indices, 1997-2000
(monthly figures)
Tanker freight indices a
VLCC/ULCC b
Medium-size crude carriers
Small crude and product
carriers
Handy-size clean
Handy-size dirty
Period
1997
1998
1999
2000
1997
1998
1999
2000
1997
1998
1999
2000
1997
1998
1999
2000
1997
1998
1999
2000
January
59
55
62
58
114
105
92
116
164
142
114
164
256
171
159
189
198
155
164
167
February
58
69
49
70
109
97
94
135
156
133
137
196
238
176
144
197
201
147
168
186
March
62
72
38
81
120
106
89
127
201
146
128
177
223
162
158
205
194
161
177
187
April
52
70
41
96
110
92
86
136
182
122
121
174
214
155
157
210
181
157
210
194
May
63
75
49
101
111
98
76
153
183
120
124
245
203
152
165
218
203
171
196
261
June
64
74
42
106
107
105
74
197
173
136
113
266
181
161
159
234
186
167
160
243
July
70
75
41
100
100
73
160
129
108
176
160
148
176
168
162
August
83
60
47
111
89
71
148
120
110
170
152
151
180
165
154
September
76
47
50
114
79
83
153
107
111
164
151
150
182
158
142
October
90
54
45
115
82
91
167
117
106
150
161
144
165
147
147
November
74
49
48
111
88
93
139
120
126
184
182
148
180
133
146
December
55
59
53
110
96
108
150
138
141
175
166
170
141
161
154
Annual average
67
63
47
85
111
95
86
144
165
127
120
204
194
162
154
209
182
157
165
206
Note: All indices have been rounded to the nearest whole number. a Compiled and published by Lloyd's Ship Manager. Worldscale - 100, as effective in each year. For tankers, vessel size groups are as follows: VLCC/ULCC:
150,000 dwt and upwards; medium-sized crude carriers: 60,000 - 150,000 dwt; small crude and product carriers: 30,000 - 60,000 dwt; and handy-size clean and dirty tankers: below 30,000 dwt.
b VLCC, very large crude carrier; ULCC, ultra-large crude carrier.
65
but dropped to the WS 175 level in the following months. Rates remained at this level until the middle of the year. An active seasonal market came to the Caribbean where rates reached as high as WS 240 for 30,000 tons in July, but declined somewhat in August. The Caribbean trades remained flat just below WS 200 for this size through September-November. As usual, towards the end of the year, a temporary increase in demand lifted the rates up to WS 230 for 30,000-ton cargoes destined for the United States East Coast. Tanker period-charter market 95. The period time-charter market was directly influenced by the weak spot market, which prevailed throughout the year. Many charterers were reluctant to take period coverage when relatively cheap employment of tankers was available in the spot market. In general in 1999, the period-charter market was therefore less active than observed in previous years. A major operator took three VLCCs for a period of five years at the rate of approximately $29,500 per day. Activity in the Suezmax sector of the period market was also very limited. Early in the year, a European charterer extended a double-hull Suezmax at a minimum rate and profit-sharing; the minimum rate on this deal was about $18,000 per day. A Norwegian charterer extended two Suezmaxes with a floor rate as well as $14,000 per day and a profit sharing above this level. A Venezuelan charterer secured a double-hull Suezmax at $17,200 per day. Owners of Aframaxes also experienced poor period chartering activities during 1999. The only positive aspect was that the Aframax period market was more active than other sectors and offered a wider field of choice. A newbuilding double-hull Aframax was chartered by a Norwegian charterer at the beginning of the year at $15,300 per day for 12 months. As the year approached its end, rates for a double-hull Aframax were closer to $13,000 per day. 96. The period time-charter market for petroleum products reflected the gloom in the spot market and the flood of newbuilding deliveries. At the beginning of the year, an early 1990s-built 47,000 dwt product carrier obtained $12,500 per day for a 12-month charter. Since then, the market continued to slide. In May, a 1990s-
built 41,000 dwt product tanker was paid at $11,000 per day for 12 months. In June, another 1991-built unit was fixed at a relatively higher rate of $12,600 per day. The July-September period marked the doldrums when period time-charter rates for 30,000 dwt product carriers built in the early 1990s went to around $10,000 per day for a 12-month charter. Activity for clean, product carriers remained low until December, when eight vessels were chartered with 45,000 dwt class paid at $12,000 per day and 30,000 dwt class at $10,500 per day. D. ESTIMATES OF TOTAL FREIGHT COSTS
IN WORLD TRADE Trends in global import value and freight costs 97. International trade involves various services such as production, marketing, transaction and transport, and the related flow of information thereof. In the transport sector, table 41 provides estimates of total freight payments for imports and the percentage of total import value by country groups (see also graph 8). In 1998, the world total value of imports (c.i.f.) decreased by 2.2 per cent, while total freights paid for transport services also declined by 5.6 per cent. Notwithstanding the above, the share of global freight payments in import value further improved to 5.06 per cent from 5.24 per cent in 1997. In 1980 the share of freight costs in import value stood at 6.64 per cent or nearly 30 per cent higher than the average ratio in the 1990s. The regional comparison indicates that freight costs incurred in the imports of developed market-economy countries continue to be nearly half that of developing countries, with the difference between the two groups remaining almost unchanged or tending to widen slightly. For 1998, the total value of imports by developed market-economy countries increased by 1.7 per cent while total freight costs decreased by 0.7 per cent, thus standing at 4.07 per cent (4.17 per cent in 1997) as compared to 8.06 per cent (8.04 per cent in 1997) in developing countries. This was mainly attributable to differences in trade structures, regional infrastructure facilities, distribution systems, and the more influential shipping strategy of shippers of developed market-economy countries.
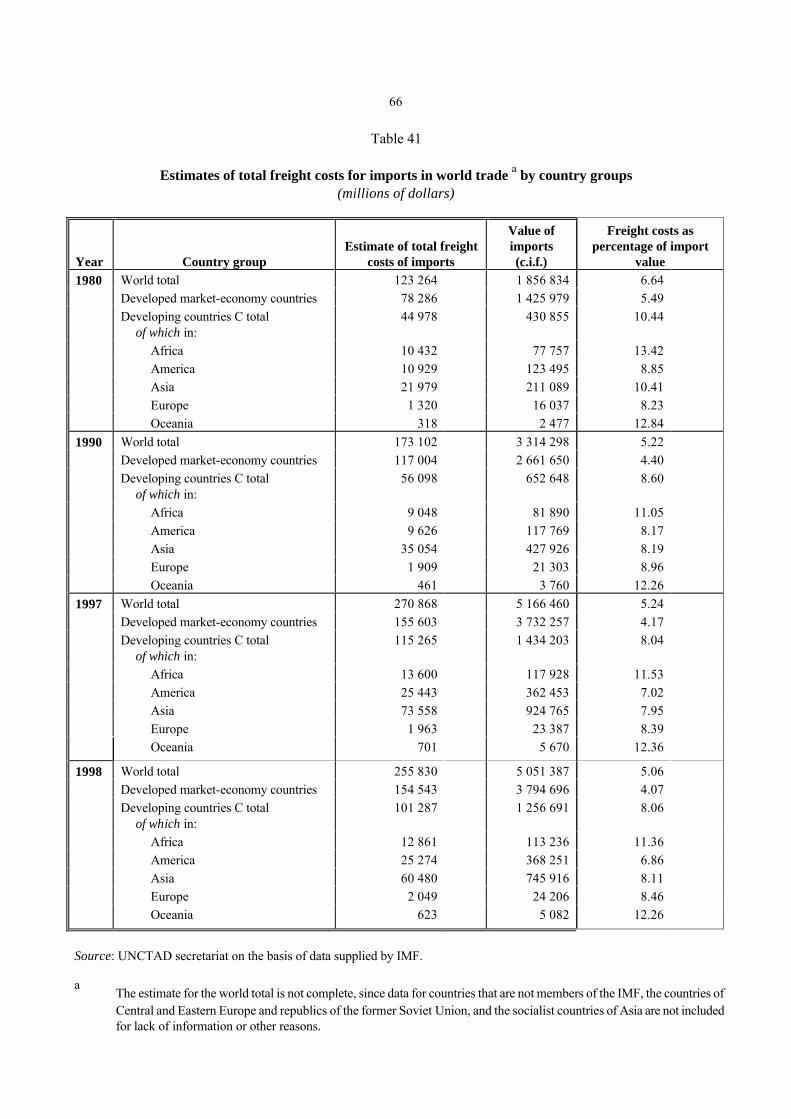
66
Table 41 Estimates of total freight costs for imports in world trade a by country groups (millions of dollars)
Year
Country group
Estimate of total freight
costs of imports
Value of imports (c.i.f.)
Freight costs as
percentage of import value
World total
123 264
1 856 834
6.64
Developed market-economy countries
78 286
1 425 979
5.49
Developing countries C total of which in:
44 978
430 855
10.44
Africa
10 432
77 757
13.42
America
10 929
123 495
8.85
Asia
21 979
211 089
10.41
Europe
1 320
16 037
8.23
1980
Oceania
318
2 477
12.84
World total
173 102
3 314 298
5.22
Developed market-economy countries
117 004
2 661 650
4.40
Developing countries C total of which in:
56 098
652 648
8.60
Africa
9 048
81 890
11.05
America
9 626
117 769
8.17
Asia
35 054
427 926
8.19
Europe
1 909
21 303
8.96
1990
Oceania
461
3 760
12.26
World total
270 868
5 166 460
5.24
Developed market-economy countries
155 603
3 732 257
4.17
Developing countries C total of which in:
115 265
1 434 203
8.04
Africa
13 600
117 928
11.53
America
25 443
362 453
7.02
Asia
73 558
924 765
7.95
Europe
1 963
23 387
8.39
1997
Oceania
701
5 670
12.36
World total
255 830
5 051 387
5.06
Developed market-economy countries
154 543
3 794 696
4.07
Developing countries C total
of which in:
101 287
1 256 691
8.06
Africa
12 861
113 236
11.36
America
25 274
368 251
6.86
Asia
60 480
745 916
8.11
Europe
2 049
24 206
8.46
1998
Oceania
623
5 082
12.26
Source: UNCTAD secretariat on the basis of data supplied by IMF. a
The estimate for the world total is not complete, since data for countries that are not members of the IMF, the countries of Central and Eastern Europe and republics of the former Soviet Union, and the socialist countries of Asia are not included for lack of information or other reasons.

Graph 8 Estimates of total freight costs for imports in world trade by groups
0
2
4
6
8
10
12
1980 1990 1996 1997 1998
Percentage of total freight costs of total import value
World
DMECs
Developing
Source: Table 41. Regional trends 98. Large variations in freight costs ratios were observed among the countries of each of the groups. Among the major trading nations with an import value of more than $100 billion, in the group of developed market-economy countries Canada, Germany and the United Kingdom incurred lower freight cost ratios in the range of 2.4B2.8 per cent. The United States and France registered moderate ratios of 3.2 per cent in 1998. On the other hand, Japan recorded a ratio as high as 8.1 per cent followed by Italy (6.4 per cent) and Spain (5.6 per cent), in comparison to 4.1 per cent for the developed market-economy countries as a group. The higher ratios of these countries can be attributable primarily to higher distribution costs including involvement of many traders. 99. Total freight costs of developing countries steadily decreased from 8.60 per cent in 1990 to 8.06 per cent in 1998. Within this group, African developing countries, however, continued slowly but steadily on an upward trend in freight costs from 11.05 per cent in 1990 to 11.53 per cent in 1997 and 11.36 per cent in 1998. This trend towards higher ratios mainly reflects insufficient infrastructure
facilities and inadequate management practices, specifically for transit transport, and low productivity of inland-transport and terminal equipment. The subregional breakdown shows that the freight costs of West Africa slightly increased to 13.40 per cent in 1998 while those of Eastern and Southern Africa including the Indian Ocean stood at 13.71 per cent. The ratio of Northern Africa remained almost unchanged at 9.00 per cent, reflecting benefit from a relatively more efficient transport system compared to those of other African subregions. The imports of African landlocked countries continued to suffer from high freight costs, which primarily reflect inefficient transport organization and facilities, poor utilization of assets and weak managerial, procedural, regulatory and institutional systems, apart from inadequate overall infrastructure conditions: the ratio of Malawi remained at 39 per cent, while for Mali and Rwanda the ratio was 30 per cent each, and for Burkina Faso and Chad it was in the range of 21B26 per cent. 100. Developing countries in Asia accounted for nearly 60 per cent of import value in 1998 and also of freight payments of all developing countries as compared to 64 per cent each in 1997. This decline
68
explained by a remarkable decrease in imports of manufactures from non-Asian countries, owing to the adverse effect of a substantial depreciation in the value of Asian currency. The freight factor of this region has fluctuated around 8 per cent since 1990, standing at 8.11 per cent in 1998, as compared with 7.95 per cent in 1997. The freight factor in West Asia was 8.73 per cent in 1998, with about 13 per cent for Kuwait and the Islamic Republic of Iran as the highest in this subregion. The freight factor in South and East Asia was 7.98 per cent in 1998. The Republic of Korea and Singapore paid freight costs at about 5.5 per cent, the lowest level in this region, whilst India and Indonesia incurred the highest freight costs in the subregion at about 10.5 per cent. Malaysia and Thailand also paid freight costs as high as around 9.5 per cent. These variations in freight factors can be attributed mainly to differences in trade structure and shipping patterns in the liner sector, where countries not covered by main line services tend to be placed at a relative disadvantage. 101. Developing countries in America as a whole continued to pay the cheapest freight costs for their imports of all the developing countries, with a freight factor of 6.86 per cent in 1998 compared to 8.17 per cent in 1990. Within this region, Central America had the lowest freight factor of 5.12 per cent in 1997. This relatively low ratio is largely attributable to the fact that Mexico, the biggest trading nation in the region, had the lowest freight factor of 4.42 per cent, while actually
accounting for 85.6 per cent of the total c.i.f. value of imports of the subregion (37.4 per cent of all American developing countries) and paying 73.9 per cent of the total freight costs of the subregion (24.1 per cent for the whole region) in 1998. The countries of the South American eastern seaboard continued to pay relatively low freight costs at 6.65 per cent. Among these countries, Uruguay benefited from the advantage of direct services, paying as little as 4.5 per cent. Argentina and Brazil followed, paying 6.5 per cent each. The countries of the South American western seaboard registered the rate of 8.88 per cent. Colombia paid the cheapest freights of this subregion at 6.4 per cent, while Peru incurred the highest freight factor of 16.4 per cent. The countries on the northern seaboard continued to pay relatively higher freights at 10.2 per cent. The landlocked countries in the Americas, Bolivia and Paraguay, continued to remain among the high-freight-paying countries in the region with the ratio of 11.0 per cent each, while their freight factor was much lower than those of African landlocked countries. 102. Small island developing countries in the Caribbean and Oceania continued to pay higher freights at 11-12 per cent in 1998. These high costs reflect the high freight rates for ocean transport, which is the most important life-line for island developing countries. The long distances from major trade partners, low cargo volumes, high transhipment and feeder costs also largely contribute to the high levels of freight costs.

Chapter V
PORT DEVELOPMENT This chapter covers container port hroughput for developing countries, improving port performance, institutional changes in ports and special needs of small ports. A. CONTAINER PORT TRAFFIC 103. Table 42 gives the latest available figures on reported world container port traffic in developing countries and territories for 1997 and 1998. The world growth rate for container port throughput (number of movements measured in TEUs) increased to 6.7 per cent in 1998 from 2.6 per cent in 1997, which is closer to the annual containerized throughput growth rate of 9 per cent experienced during the first half of the decade. The throughput for 1998 (1997) was over 165.0 (as against 154.6) million TEUs, which is an annual increase of slightly over 10.4 (3.9) million TEUs. 104. The rate of growth for developing countries and territories was 12.6 per cent in 1998 with a total throughput of 88.5 million TEUs (accounting for slightly more than 53 per cent of total throughput), which was an increase compared to the 3.1 per cent growth rate in 1997. Countries with double digit growth in both 1997 and 1998 were the Republic of Korea, Panama, Malta, Venezuela, Argentina, Honduras, Bangladesh, Trinidad and Tobago and Mauritius. The growth in developing countries is uneven from year to year, owing sometimes to strong fluctuations in trade and sometimes to improved data or lack of data. 105. Initial figures for 1999 are available for the main ports, including those of developing countries and of the socialist countries of Asia, with seven ports from these countries ranking among the top 20 container ports. Their throughput is shown in table 43, together with the annual percentage increase for each of the past two years. In 1999, Hong Kong (China) bounced back with double digit growth to become the world leader in total number of movements, overtaking Singapore which had its growth rate fall to 5.3 per cent. This is a good result for Hong Kong, reflecting
the economic recovery in Asia and paralleled with strong growth through other Chinese ports on the mainland. The port of Shanghai had a percentage change of 37.3 per cent or an increase of 1,144,000 TEUs and the ports of Yantian and Qingdao were also in the top 30 ports for the first time. This reflects the continued growth of Chinese exports, especially to North America and Europe. B. IMPROVING PORT PERFORMANCE 106. Changing trade flows and the competitive strategies of the vessel operators are impinging on the way in which port authorities and terminal operators must adapt. Pressure is being exerted to cut costs and to provide services for a new fleet of mega-vessels now being brought on stream. At the same time port investment requirements have skyrocketed. The expansion is being driven by two pressures. First, the overall container volume continues to grow and outlook for trade expansion appears favourable. Secondly, the arrival of the mega-vessels, 5,000 TEUs and greater, is driving the need for transhipment hubs and for feeder ports. To be considered as a hub, ports must have post-Panamax cranes, deep water, a large amount of back-up land, and direct intermodal connections, often via on-dock rail. However few ports have meaningful guarantees that their investment in facilities will be recaptured. Ports choosing to become hubs are extremely vulnerable to the changing fortunes and desires of both large shipping lines and alliances. 107. One means of cutting costs that is appropriate for terminals with high labour costs and with proven ability to maintain hi-tech equipment is through automation. ECT's Rotterdam operation is roughly 50 per cent automated and PSA Corp has invested in this type of technology for its Pasir Panjang terminal. Thamesport in England, as a relatively new t erminal, has
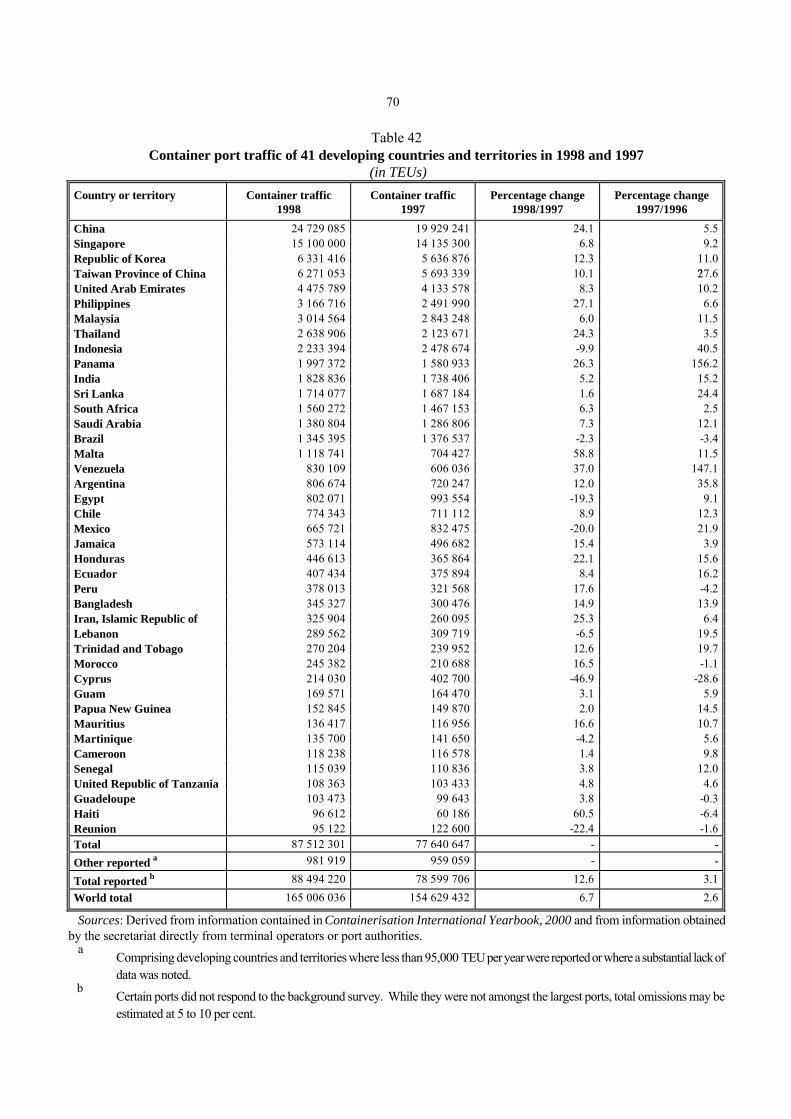
70
Table 42 Container port traffic of 41 developing countries and territories in 1998 and 1997
(in TEUs) Country or territory
Container traffic
1998
Container traffic
1997
Percentage change
1998/1997
Percentage change
1997/1996
China 24 729 085 19 929 241 24.1 5.5 Singapore 15 100 000 14 135 300 6.8 9.2 Republic of Korea 6 331 416 5 636 876 12.3 11.0 Taiwan Province of China 6 271 053 5 693 339 10.1 ?27.6 United Arab Emirates 4 475 789 4 133 578 8.3 10.2 Philippines 3 166 716 2 491 990 27.1 6.6 Malaysia 3 014 564 2 843 248 6.0 11.5 Thailand 2 638 906 2 123 671 24.3 3.5 Indonesia 2 233 394 2 478 674 -9.9 40.5 Panama 1 997 372 1 580 933 26.3 156.2 India 1 828 836 1 738 406 5.2 15.2 Sri Lanka 1 714 077 1 687 184 1.6 24.4 South Africa 1 560 272 1 467 153 6.3 2.5 Saudi Arabia 1 380 804 1 286 806 7.3 12.1 Brazil 1 345 395 1 376 537 -2.3 -3.4 Malta 1 118 741 704 427 58.8 11.5 Venezuela 830 109 606 036 37.0 147.1 Argentina 806 674 720 247 12.0 35.8 Egypt 802 071 993 554 -19.3 9.1 Chile 774 343 711 112 8.9 12.3 Mexico 665 721 832 475 -20.0 21.9 Jamaica 573 114 496 682 15.4 3.9 Honduras 446 613 365 864 22.1 15.6 Ecuador 407 434 375 894 8.4 16.2 Peru 378 013 321 568 17.6 -4.2 Bangladesh 345 327 300 476 14.9 13.9 Iran, Islamic Republic of 325 904 260 095 25.3 6.4 Lebanon 289 562 309 719 -6.5 19.5 Trinidad and Tobago 270 204 239 952 12.6 19.7 Morocco 245 382 210 688 16.5 -1.1 Cyprus 214 030 402 700 -46.9 -28.6 Guam 169 571 164 470 3.1 5.9 Papua New Guinea 152 845 149 870 2.0 14.5 Mauritius 136 417 116 956 16.6 10.7 Martinique 135 700 141 650 -4.2 5.6 Cameroon 118 238 116 578 1.4 9.8 Senegal 115 039 110 836 3.8 12.0 United Republic of Tanzania 108 363 103 433 4.8 4.6 Guadeloupe 103 473 99 643 3.8 -0.3 Haiti 96 612 60 186 60.5 -6.4 Reunion 95 122 122 600 -22.4 -1.6 Total
87 512 301
77 640 647
-
-
Other reported a
981 919
959 059
-
- Total reported b
88 494 220
78 599 706
12.6
3.1
World total
165 006 036
154 629 432
6.7
2.6
Sources: Derived from information contained in Containerisation International Yearbook, 2000 and from information obtained by the secretariat directly from terminal operators or port authorities.
a Comprising developing countries and territories where less than 95,000 TEU per year were reported or where a substantial lack of
data was noted.
b Certain ports did not respond to the background survey. While they were not amongst the largest ports, total omissions may be
estimated at 5 to 10 per cent.

71
Table 43 Top 20 container terminals and their throughput, 1999 and 1998
(in TEUs)
Ranking 1999
Ranking
1998
Port
1999 TEU
1998 TEU
Change
1999
Change
1998
1
2 Hong Kong, China
16 100 000
14 582 000
10.4
0.6
2
1 Singapore
15 900 000
15 100 000
5.3
9.1
3
3 Kaohsiung
6 985 360
6 271 050
11.4
10.1
4
5 Busan
6 439 590
5 945 610
8.3
1.6
5
4 Rotterdam
6 400 000
6 010 500
6.5
10.7
6
6 Long Beach
4 408 480
4 097 690
7.6
17.0
7
10 Shanghai
4 210 000
3 066 000
37.3
20.6
8
8 Los Angeles
3 828 850
3 378 220
13.3
14.3
9
7 Hamburg
3 750 000
3 550 000
5.6
6.7
10
9 Antwerp
3 614 260
3 265 750
10.7
10.4
11
13 New York
2 863 340
2 465 990
16.1
2.5
12
11 Dubai
2 844 630
2 804 104
1.4
7.8
13
12 Felixstowe
2 700 000
2 523 640
7.0
4.8
14
21 Port Klang
2 550 419
1 820 020
40.1
8.0
15
13 Tokyo
2 399 000
2 198 690
9.1
2.8
16
19 Tanjung Priok
2 273 300
1 898 070
19.8
-0.6
17
16 Gioia Tauro
2 253 400
2 125 640
6.0
46.4
18
22 Bremenhaven
2 180 960
1 812 441
20.3
8.6
19
17 Kobe
2 176 000
2 100 880
3.6
-5.5
20
15 Yokohama
2 172 920
2 091 420
3.9
-12.1
Source: Containerisation International, March 2000 and Port Development International, April 2000. invested considerably in this technology. In 1998, the terminal handled over 500,000 TEU with 360 staff, of which 150 are traditional dock workers. All operations at the terminal are regulated by a central computer system. Six post-Panamax ship-to-shore cranes work the vessels. For the discharge operation, the crane driver inputs the container serial number into the central computer. The computer then informs the tractor driver to which of the nine stacks in the container yard he has to deliver the container. There are 18 rail? mounted gantries (RMG), which are fully automated without drivers. The RMG picks up the container and the central computer informs the crane where to stack it. Lorry drivers coming to pick up imports or drop off exports are given smart cards. These allow the control centre to place drivers in queues
and regulate loading and unloading to maximize efficiency. Lorry drivers go to the stack entrances where their containers are taken from or into the stack by the RMG. The next step in automation is the planned installation of automatic guided vehicles for the transfer operation between stack and ship. 108. Increasing terminal productivity and performance will increase terminal capacity without capital investment. To achieve this, efficient and cost effective connections to the hinterland of a port are required. On-dock rail systems are one method of providing freight transport efficiency. This is a system where the rail-heads end as near to the quayside as possible, so that the boxes can be transferred from the ship into the yard and then on to rail.

This lessens the need for sizable terminal yards and separate intermodal exchange facilities. An added advantage of the system is the use of the more environmentally-friendly transport mode of rail rather than road. 109. An example of this system is in the US port of Tacoma at Hyundai Merchant Marine Terminal. The terminal has a quay length of 600 meters, a container yard area of 24.3 hectares and a rail yard of 8.1 hectares. The handling equipment consists of four post-Panamax ship-to-shore gantries, a fleet of reach stackers and terminal tractors. The direct ship to rail transfer works with the tractor-trailers taking the containers from the cranes and hauling them 300 meters to the rail yard where the reach stackers transfer them on to the rail wagons. Container dwell time in the terminal has been reduced to 8 to 12 hours versus the normal dwell time of 6 to 7 days with road trucks. 110. In October 1999, Ceres Terminals Incorporated, through their Dutch company, and Amsterdam Port Authority, started work on a new container terminal concept for the mega-ships. The first phase of the terminal will have three berths, two marginal ones and one 'indented' berth - totalling 1,050 meters of berthing capacity. The indented berth will allow a minimum of 300 moves per hour with up to ten cranes working both sides of the ship. The indented berth is 64 metres wide and 400 metres long and can accommodate ships with a maximum beam of 50 metres. The cranes have an outreach of 22 containers and will be serviced by a fleet of 39 of the latest straddle carriers. The straddle carriers have a lifting capacity of 50 tons, lift one-over-three and use a Global Positioning System (GPS) linked to a yard management computer system. Two-thirds of the costs are being financed by the Amsterdam Port Authority and the remainder by Ceres. The area of the first phase is 50.6 hectares and is scheduled to be completed in 2001, and a second phase of 68.8 hectares with a second indented berth will be operational in 2003. C. INSTITUTIONAL CHANGE 111. Large multi-port operating companies continued to seek new operating concessions, thus consolidating the trend towards public/private partnerships in the container terminal sector. The major international firms are Hutchinson Port Holdings (HPH), PSA Corp, P&O Ports, International Container Terminals Incorporated.
112. HPH operates at present in 18 ports in the Bahamas, China, Indonesia, Myanmar and Panama, and in 1999 estimated that it handled about 10 per cent of global port container throughput. Other major terminal operators are P&O Ports with 21 container terminals in 19 countries and interests in a further 30 ports. Their terminals are found in the following developing countries with the approximate volumes in thousands of TEUs shown in brackets (Argentina (500), China (750), India (470), Indonesia (1,100), Mozambique (25), Pakistan (190), the Philippines (540), Sri Lanka (310), and Thailand (340)). PSA Corp, in addition to four terminals in Singapore, operates eight others in Brunei, China (Dalian and Fuzhou), India (Tuticorin and Pipavav), Italy, Portugal and Yemen and has entered into an agreement to manage a terminal in Inchon, Republic of Korea. International Container Terminal Services, Inc. (ICTSI), in addition to Manila, operates one terminal in Argentina, two in Mexico, and one each in Pakistan, Saudi Arabia and the United Republic of Tanzania. Stevedoring Services of America (SSA) and Ceres Terminals operate mostly in the United States. SSA operates seven terminals in the United States and one terminal in Panama. Ceres provides stevedoring and terminal operations in 20 locations throughout North America as well as in Amsterdam, Odessa and Moscow. 113. South America's privatization of ports is continuing, especially in the Mercosur countries, with the exception of Uruguay, where several attempts to privatize the container terminal in Montevideo have failed. In Chile, the container terminals in Valparaiso and San Antonio, plus the multi-purpose terminal at San Vicente have been leased to private companies as operating concessions. In each case the prices paid were well above initial expectations. 114. In Brazil, the privatized terminals in Santos, Rio de Janeiro, Rio Grande and Paranagua have all achieved better traffic performances. The terminal operators in Santos have made big improvements in productivity rates and efficiency levels. This has resulted from the programme to upgrade equipment, from the improved balance in trade and from fewer ships with more cargo. In Rio de Janeiro, since privatization, the waiting time for a berth of from 24 to 30 hours has been eliminated, and crane productivity has improved from six moves per hour up to 20. There is still need for reform in the high manning levels for working container vessels and that will allow the lowering of cargo handling charges. There are a number of smaller Brazilian ports that are
in the process of asking for tenders from private companies to operate their container facilities. 115. In Argentina, the various private terminal operators in Buenos Aires have continued to invest in new equipment, although cargo flows are expected to decline by at least 10 per cent in 1999 as a result of the Brazilian currency devaluation. A consortium led by Manila-based ICTSI won a concession to operate the container terminal in the port of Rosario and a programme to upgrade the facilities was started. However, the operator faced heavy losses and the consortium has subsequently withdrawn from the lease. D. SPECIAL NEEDS OF SMALL PORTS 116. To better understand the needs of the least developed countries in their port sector the following extract has been made from a study on port development for an island least developed country. The Republic of Kiribati consists of 33 islands scattered over 4,500 km east-west and 1,800 km north-south of a wide expanse of the Central Pacific Ocean and has at present a population of about 80,000. Tarawa atoll, where Betio Port is located, is isolated at a distance of about 4,500 km from a major trade partner Australia, about 4,300 km from New Zealand, and 5,200 km from Japan. Almost all the islands of the country consist of coral atolls with poor soil for agricultural activities and hence depend on imports for most foods and other necessities. Major export commodities are copra and fish. However, the trade balance has shown a heavy deficit since the exhaustion of phosphate reserves in 1979. Due to these peculiar geographical and social conditions, sea transport constitutes a lifeline supporting Kiribati's economic activities, while port facilities are indispensable infrastructure connecting sea and land transport for foreign and domestic cargoes. 117. The major port of the country, Betio, the most important port of the Line Islands Group, London Wharf in Christmas Island and all the other outer island ports are suffering from a serious deterioration of their services because of a long absence of investment to improve facilities. Betio Port is the sole gateway for foreign trade and the centre of domestic sea transport. However, no significant work has been done on improving the port since the development works for port facilities for small boats
that were undertaken about 30 years ago. In consequence, Betio Port experiences problems of inefficient and unsafe port operations due to the deterioration of its facilities that lack the necessary capacity for the present trade. 118. The current situation of the deteriorated port is such that the port is unable to perform the functions required for modern trade without urgent rehabilitation and improvement. Betio Port further lacks the capacity to deal with containerization. Since large container ships cannot berth alongside the quay wall in the port, containers are transferred from ship to shore, or vice-versa, by using barges and a tug. This handling system reduces cargo handling efficiency. Full containers are handled only with a fixed tower crane in the container yard and are stacked 5 high within the reach of the crane. Average handling time for these containers stacked at random is about twice that of containers normally handled in other international ports. The extremely small area for stacking containers makes handling efficiency worse. Better management information systems could assist the port operator to improve performance in the port. 119. In Betio and the other outer island ports, maintenance dredging has been neglected resulting in difficult and inefficient entry and berthing operations for small vessels. In terms of containerized imports, container traffic is expected to increase from 1,600 TEU in 1993, to 2,500 in 2000 and 3,200 in 2005. Total tonnage will rise from about 62,000 tons in 1993 to 86,000 tons in 2000 and to 109,000 tons in 2005. A development plan to construct a new wharf allowing alongside berthing of 90 per cent of the ships calling at Betio Port has been drawn up. However, an economic analysis of the project shows a low internal rate of return because of the small volume of cargo and the large capital investment required to bring the facilities up to an international standard. 120. While this is an extreme case, it illustrates the problem that ports in the least developing countries are facing. There are 32 LDCs that border the ocean, of which 11 are island countries. The improvements required are essential for the sound growth of the countries' economies, but the low rate of return deters the private sector from either lending or investing funds. Consequently governments must often depend on ODA or loans on concessionary terms to make the required improvements, although the amount of these funds continues to decline.
Chapter VI
TRADE AND TRANSPORT EFFICIENCY This chapter provides an update on the impact of the latest developments in the field of multimodal transport and on the emerging role of internet-based transportation service providers, as well as providing information developments in the legal sector and with training. A. DEVELOPMENTS IN MULTIMODAL
TRANSPORT (a) General developments 121. The year 1999 passed with one disturbing question about what might happen after New Year's eve on 31 December 1999. The Year 2000 bug, commonly known as Y2K, was one of numerous potential disasters that many people, including transport operators, were doing their utmost to avoid. The bug was taken seriously because virtually everyone would be affected through the global interconnectivity of computer networks. Solving the problem would mean making sure that all computers correctly stated the date and time when they entered the millennium. Ignoring the problem would have a directly disruptive effect on institutions whose data precisions depended on the time element of database information, such as bank accounting, airline scheduling, market analysis, and many more. This disquiet had driven most of the world's major institutions to undertake basic computer software and hardware preparations to ensure that their worldwide computing networks were Y2K compliant. 122. International trading flows were among those heavily affected by the financial crisis experienced by Asia and Russia. In the area of trade facilitation, the impact of the crisis was also reflected by the negative growth and revenue of the container leasing and production industries that these countries had to endure during that period. The crisis was short-lived, however, and by the third quarter of 1999 demand had gradually improved in Asia and Russia alike.
123. E-commerce started to have an impact on the logistic industry. It began to redefine the efficiency of distribution by adding yet another dimension in the area of the supply chain. Bigger companies had begun cultivating the power of e-commerce to address the needs of their individual clients and distributors more efficiently by forming a community of supply-chains. The hope was that the new model of distribution would eventually reduce unnecessary inventory buildups held by trading partners. Analysts suggested that such a model would allow the distribution system to flow not in the traditional linear way but in more of a networked manner. In a similar way, E-trade facilitation had also given rise to a new type of trader who would offer and be able to facilitate interchanges of container equipment for shipping lines. Such traders, now called e-lessors, would grow to become an integral and important part of the players in the container leasing industry. (b) E-trade facilitation 124. Trade facilitation now has a new dimension "trade facilitation" (etf). The newly developed Internet technology, when combined with the vast knowledge and expertise of the shipping world, may become the centralizing environment for the complex and dispersed global industry of shipping. At one level, an etf web site may become a virtual marketplace that brings together transport users and providers from around the world. As a system, it helps to streamline the current overburdened administrative aspect of the transport industry. E-trade facilitation can be the catalyst for a substantial change which will redefine the management of trade within the industry.
76
125. A good example of an etf site may be the LevelSeas.com site. This provides market intelligence, online charting, pre- and post-fixture activities, risk management tools, and freight derivatives to constitute a comprehensive freight management service for the seaborne wet and dry bulk commodity shipping community. The site delivers added value to the participants of the industry by providing greater market access and greater efficiency, and by lowering costs. The site does not discriminate against any player in the industry. 126. Another type of etf instrument serves as a tool in helping to manage one segment of the supply chain. An example is that of stevedores and chief officers working interactively on the same stowage plan. Currently, a website developed by a joint effort of Canada-based Autoship Systems Corporation (ASC) and the Internet Service Provider/Active Server Pages (ISP/ASP)-provider Stargate allows for a load-planning software to be used remotely through the site. All that a user needs is a PC with an internet connection. Another site, called Vendor Interface, is also a new etf instrument, which provides a channel for managing the drayage segment of intermodal shipments. The site is developed by Cysive Inc. and Hub Group. The idea is to enable Hub Group and its drayage partners to keep permanently in touch by means of the Internet. The site is designed to improve operational efficiency, eliminate redundancy and provide processing of orders all day long. For shippers, the site offers increased information visibility throughout the supply chain, and high quality communication and tracking. For operators, such as Multimodal Transport Operators, on the other hand, the site become a means to select appropriate carriers for each shipment based on cost, dates, location and cargo. This is all done online, where shipments are offered for carriers, terms are set, and deliveries identified and authorized. 127. With a digitial camera, etf may help to reduce truck queues at marine container and intermodal terminal gates. By having webcams, digital cameras designed for the Internet, installed at the gates, one may access a designated site for information that would cut down on idle trucking time and help to track containers. Sites, such as eModal.com, gather information from shipping lines and sort and consolidate it into an easy-to-read format ready for enquiries on specific containers. 128. A more advanced etf system uses the latest and more sophisticated Global Positioning System/Global System for Mobile Communication (GPS/GSM) tracking
unit. It has an antenna and dual band GSM modem. The unit is designed to locate moving units such as containers, trailers, trucks or rail freight cars. As a system, it gathers data from the unit to be processed and stored in an information centre where customers may obtain relevant information via fax, telephone, Short Message Service (SMS), Wireless Application Protocol (WAP) or over the Internet. As regards tracking transport equipments, the system would gather the positions and status of any number of tracking units installed on the equipment and process them into a formatted table that could be evaluated by any combination of fleet management or dispatching systems owned by customers. This system is now being used in Europe and is commonly known as the MobileHound SAM Cargo System. The system sends the gathered data to proTime "Fleet Services" information centre to be processed. 129. A simpler yet integrated system for monitoring all stages of the supply chain is also starting to evolve as another type of etf system. This supply chain monitoring system relies heavily on the information coming from all those involved with a shipment, such as producers, transporters and storage providers, freight forwarders and surveyors. The system processes the information to provide an unobstructed and timely view of critical logistics data. It also allows participants to sequence and optimize the bulk material supply function. Stolt-Nielsen SA is currently implementing the system, calling it TransLink, an internet-based, open logistics system for chemical and related materials shipped in bulk. 130. Sea Box, a US container trading and design company, established a virtual marketplace on the Internet, which is called ISOContainers.com, a site for buying intermodal equipment worldwide. It is a 24-hour service, which includes a real-time inventory that is globally available in over 200 international inland and port cities. Customers may enquire about the type, location, condition and cost of the equipment, as the facts are always updated every quarter of an hour. This is just another new feature of the evolving E-trade facilitation.
(c) Container leasing industry
A general overview 131. The container leasing industry has been in a difficult leasing market for the past few years. The utilization rate has deteriorated. The per diem rental rates and the prices of new boxes have plummeted, affecting the direct investment strategies of carriers and lessors alike.
77
132. Lessors have found themselves in direct competition with shipping lines and other transport operators in terms of acquiring new containers. Responding to the drop in prices of new boxes, lines and other transport operators acquired about 720,000 TEU in 1998, which was a 30 per cent jump from the purchases made a year earlier. Lessors, on the other hand, were not fully able to adjust their rental rates to the fall in prices of new containers because of the massive number of boxes they bought when prices were substantially higher. The rental rates had to remain somewhat rigid in order to cover the depreciation cost of older boxes. The new and cheaper boxes acquired by carriers thus significantly reduced carriers' demand for the relatively more expensive leased containers. Responding to the weak world demand for containers, lessors consequently had to curtail their purchases for new containers, and in 1998 acquired only 755,000 TEU containers, i.e. 45,000 TEU less than what they bought a year earlier. The share of boxes owned by carriers, in the meantime, increased substantially in meeting world demand for containers. 133. In general, the weak world demand for leased containers had led to the worsening of the utilization rates of leased boxes and the growing stockpiles of idle containers at unattractive locations in Europe and North America. Indeed, lessors were facing tough times in generating a profit. Compared with the newcomers to the industry, long-established lessors were holding a wide range of equipment that had higher depreciation rates than their own replacement cost. 134. Thus, besides restricting their purchases of new containers, lessors began to look for other cost-saving strategies, such as fleet mergers and management takeovers, mainly to achieve economies of scale. As shown in table 44, Genstar and Sea Containers merged in 1998 to form GE SeaCo with a more than 1.1 million TEU making it the second largest player in the industry. Textainer Group decided to expand its fleet by acquiring smaller sized PriceSource in 1998 and Xtra International in 1999. Such consolidations obliged the newly formed leasing companies to retire a large number of old containers that were classified as uneconomic. As a result, for the past few years, the fall in the lessors' direct investment was minimized as the yearly disposal rate was maintained at around 300,000 TEU (see table 45). The fact that older containers were retired earlier through consolidations, and that the top five leasing companies controlled about 70 per cent of the leasing market share, the rental rates adjusted better to the changes in
prices of new containers. This, in turn, helped to prevent the utilization rate of leased containers from falling too fast. 135. Retiring older containers through consolidations, however, did not entirely remove the problem of idle containers at low-demand areas. The companies with the largest stockpiles had to relocate their idle containers to areas with higher demand for export containers as this was cheaper in the long run than paying the mounting storage cost. 136. As mergers promote economies of scale that streamline performance within the industry, e-commerce also has contributed some degree of efficiency. Despite its young age, e-commerce has encouraged the birth of a new category of transport operators who own very few or not even a single container. Lessors are beginning to realize the growing importance of the role of e-commerce in marketing and servicing as part of their cost-saving strategies. 137. The fundamental challenges for lessors may be summarized as finding ways to meet the actual demand for leasing containers while generating profit near the break-even point and managing the reallocation of the growing mountains of idle boxes stranded at low demand locations around the world. Lessors agree that the answer to such challenges may begin with a substantial recovery of the market for leasing containers, in which an increase in demand for new boxes is generated by the growth of a more balanced world trade. 138. Entering the year 2000, the industry faced the lingering question of when the market would improve sufficiently to allow for a substantial return on their investment. Recent signs, however, supported a growing anticipation of the long awaited arrival of better market condition. The leasing companies, on the other hand, were hard to convince. Two years ago, similar signs had appeared showing a world market demand initially headed for improvement as containers' utilization rate increased to almost 85 per cent towards the beginning of 1998. The price of new containers also showed an improvement as it was expected to increase for two reasons: first, it was assumed that it had reached its lowest price level and, second, the Chinese Government had established a price floor for new containers in the first quarter of 1998.
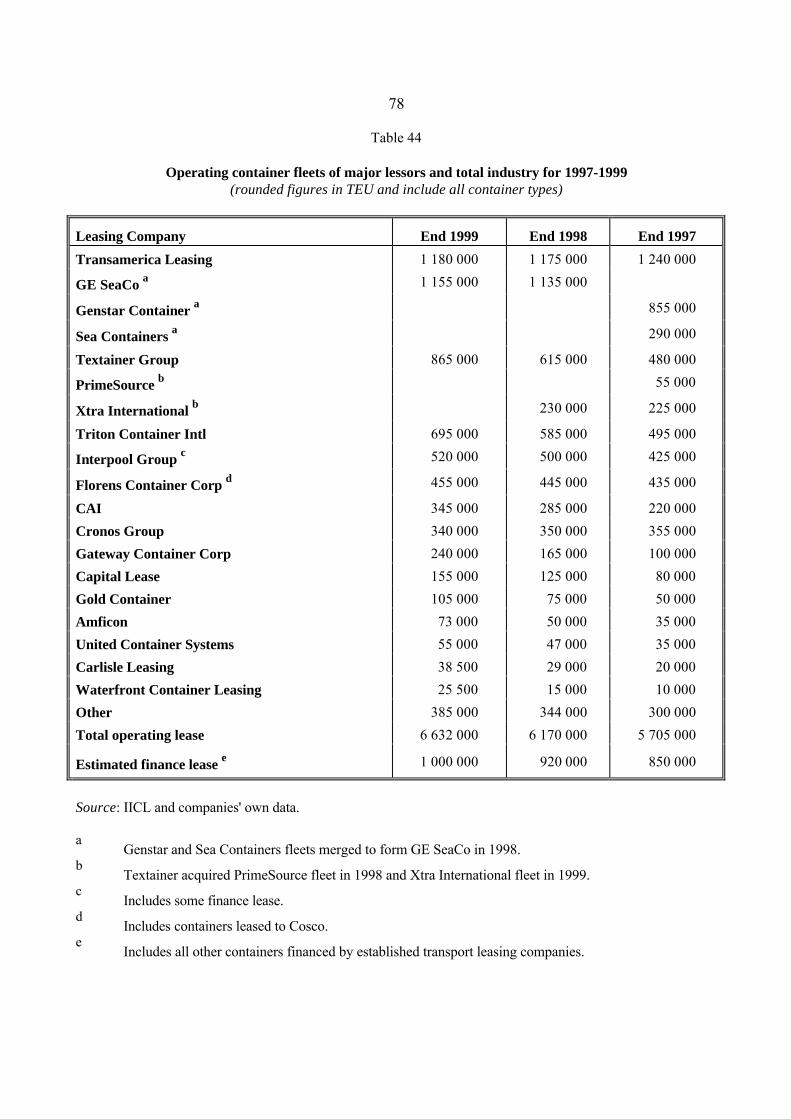
78
Table 44 Operating container fleets of major lessors and total industry for 1997-1999 (rounded figures in TEU and include all container types)
Leasing Company
End 1999
End 1998
End 1997
Transamerica Leasing
1 180 000
1 175 000
1 240 000 GE SeaCo a
1 155 000
1 135 000
Genstar Container a
855 000
Sea Containers a
290 000
Textainer Group
865 000
615 000
480 000
PrimeSource b
55 000 Xtra International b
230 000
225 000
Triton Container Intl
695 000
585 000
495 000
Interpool Group c
520 000
500 000
425 000 Florens Container Corp d
455 000
445 000
435 000
CAI
345 000
285 000
220 000
Cronos Group
340 000
350 000
355 000 Gateway Container Corp
240 000
165 000
100 000
Capital Lease
155 000
125 000
80 000 Gold Container
105 000
75 000
50 000
Amficon
73 000
50 000
35 000 United Container Systems
55 000
47 000
35 000
Carlisle Leasing
38 500
29 000
20 000 Waterfront Container Leasing
25 500
15 000
10 000
Other
385 000
344 000
300 000 Total operating lease
6 632 000
6 170 000
5 705 000
Estimated finance lease e
1 000 000
920 000
850 000
Source: IICL and companies' own data. a Genstar and Sea Containers fleets merged to form GE SeaCo in 1998.
b Textainer acquired PrimeSource fleet in 1998 and Xtra International fleet in 1999.
c Includes some finance lease.
d Includes containers leased to Cosco.
e Includes all other containers financed by established transport leasing companies.

79
Table 45 New container purchases by major lessors in 1997-1999
(rounded figures in TEU and include all container types) Leasing company
1999
1998
1997
Transamerica Leasing
55 000
50 000
40 000 GE SeaCo
a
60 000
30 000
35 000
Textainer Group
75 000
105 000
65 000
PrimeSource b
5 000 Xtra International
b
15 000
25 000
Triton Container Intl
135 000
120 000
95 000
Interpool Group c
70 000
85 000
85 000
Florens Container Corp
d
45 000
35 000
100 000
CAI
65 000
70 000
45 000
Cronos Group
5 000
30 000 Gateway Container Corp
75 000
65 000
100 000
Capital Lease
36 000
45 000
80 000 Gold Container
30 000
25 000
20 000
Amficon
25 000
17 000
8 000 United Container Systems
10 000
12 000
8 000
Carlisle Leasing
9 500
9 000
8 000 Waterfront Container Leasing
12 500
7 000
6 000
Other
38 000
65 000
45 000 Total fleet purchases
746 000
755 000
800 000
Total fleet disposals
305 000
290 000
310 000 Total net increase
441 000
465 000
490 000
Source: IICL and companies' own data. a Genstar and Sea Containers fleets merged to form GE SeaCo in 1998. b PrimeSource fleet acquired by Textainer in 1998, Xtra International fleet acquired by Textainer in 1999. c Includes some finance lease, but excludes around 50,000 TEU acquired through buy/lease-back. d Includes equipment leased to Cosco. 139. The 1998 signs turned out to be a disappointment as prices of new boxes fell further while the availability of low interest rates in the financial market continued. Such a combination sent carriers and other transport operators out on a buying spree for new boxes. The outcome was a sharp increase of lines' and other transport operators' holdings of new boxes as they purchased 31 per cent more than the previous year. Lessors, on the other hand, restricted their procurement behaviour, as in 1998 their direct investment had dropped almost 6 per cent to 755,000 TEU from the 800,000 TEU purchased a year earlier.
140. Moreover, the Asian financial crisis worsened the situation. Over the rest of 1998 and the first half of 1999, the procurement behaviour of both lines and lessors was curtailed heavily. In 1999, carriers and transport operators acquired only 5,000 TEU more than their 1998 purchases of 720,000 TEU, while lessors maintained their procurement level at about 9,000 TEU below their 1998 purchases of 755,000 TEU. 141. The drop in demand for import and export containers in and out of Russia and countries in Asia was so significant that it caused an unbalanced flow of
containers worldwide, which again put additional pressure on the off-hire boxes buildups that accounted for 25-30 per cent of available equipment for hire. The severity of the imbalance in the flow of trade worsened as the United States economy grew stronger. It caused the utilization rate to fall to a little above 80 per cent at the beginning of 1999; a 5 per cent drop from the level attained a year earlier as more than 1.2 million TEU were off-hired from the total available fleet of 5.8 million. At this point, the lease rates had fallen approximately 40 per cent over the past four years, which was proportional to the fall in new container prices over the same period. All of these factors thus contributed to the 15 per cent decrease in revenues for the container leasing industry between 1998 and 1999. 142. The crisis in Asia and Russia turned out to be short-lived. Starting in the third quarter of 1999, signs of recovery appeared. First of all, in addition to the improved flow of traded goods, prices of new containers started to increase, partly because of the higher cost of plywood flooring needed in the production of containers. Lines and transport operators responded by not buying as many new containers as the previous year; in other words, they acquired only 5,000 TEU more than the 720,000 TEU purchased a year earlier, and allocated more of their requirements to the leasing of additional boxes. An increase of interest rates in the United States and a temporary slowdown in the rate of containership deliveries also contributed to the change in the direct investment behaviour of carriers. The increase in leasing demand was reflected through the 2 per cent increase of average utilization rates due to the rehiring of idle containers. 143. In short, the stronger world demand for trade and the increase in prices of new containers strengthened the belief that the price increase will continue and contribute to a sustainable recovery of the leasing industry. If this recovery persists, lessors are likely to increase their procurement levels in 2000. Anticipation of recovery 144. However, lessors have yet to see a significant improvement in per diem lease rates. As the new box prices are on the rise, lessors hope for leasing rates to increase.
145. When carriers resorted to leasing to meet their demand for containers, they preferred to engage in a transaction that locked in low-priced deals for a three-to-five year period. This is possible with lessors placing their new containers on term lease. For lessors, the term lease is also favourable because, in the long run, its capital investment cost will be lower than average. By the end of 1999, the volume of rental fleets on term-lease contract had reached 50 per cent, while 35 per cent were tied to master-lease contract and the remaining 15 per cent were off-hired. 146. Traditionally, master-lease option would have earned 30 per cent more than those generated by term lease. Currently, however, the master-lease option has become less attractive because, in addition to its return being almost no different from the return generated by term lease, it would generate higher revenue only when the world demand for trade becomes much stronger and the stockpile of idle containers is substantially reduced. For now, the competitive term-lease contracts will continue to be the major source of income for the leasing industry. 147. Overall, in 2000, lessors are expected to continue their procurement strategy as the certainty of recovery grows. There is also a prospect for further mergers and management takeover, as revenue and container reallocation problems continue in 2000. Container replacement will remain an important task undertaken mostly by larger companies. The tendency to expand the fleet will remain part of the strategies of mid- and smaller-sized companies to generate higher returns. 148. The total leased fleet has grown by 7-8 per cent during the past two years and will continue to grow in the new millennium. In particular, leasing demand is likely to continue pushing for the expansion of the dry freight high cube container fleet. Table 46 shows that dry freight high cube has steadily expanded about 30 per cent every year for the past three years. The volume of dry freight special boxes, however, has increased slightly, suggesting that purchases made for this type of container were mainly for replacement. 149. Table 47, in addition, clearly shows that leasing demand for all sizes is growing except for the 48 ft containers. The demand for 20 foot, 40 foot, and 45 foot containers has increased by 14.16 per cent, 25.08 per cent, and 28.79 per cent, respectively.
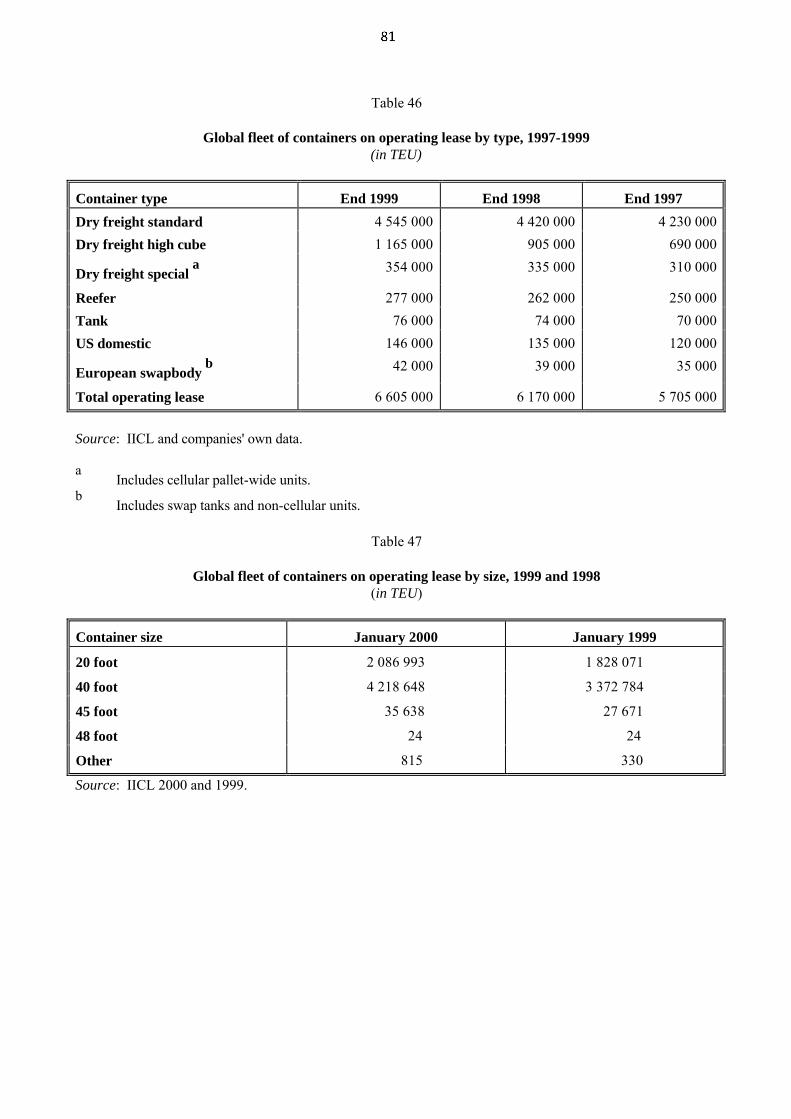
Table 46 Global fleet of containers on operating lease by type, 1997-1999 (in TEU)
Container type
End 1999
End 1998
End 1997
Dry freight standard
4 545 000
4 420 000
4 230 000 Dry freight high cube
1 165 000
905 000
690 000
Dry freight special a
354 000
335 000
310 000
Reefer
277 000
262 000
250 000
Tank
76 000
74 000
70 000 US domestic
146 000
135 000
120 000
European swapbody b
42 000
39 000
35 000 Total operating lease
6 605 000
6 170 000
5 705 000
Source: IICL and companies' own data.
a Includes cellular pallet-wide units.
b Includes swap tanks and non-cellular units.
Table 47 Global fleet of containers on operating lease by size, 1999 and 1998 (in TEU)
Container size
January 2000
January 1999
20 foot
2 086 993
1 828 071
40 foot
4 218 648
3 372 784
45 foot
35 638
27 671
48 foot
24
24
Other
815
330
Source: IICL 2000 and 1999.

Container production 150. At the beginning of 1999, the price of a new 20 ft standard container was less than $1,350 and the price of a new 40 ft standard container was a little over $2,100. As the lowest in more than two decades, the 1999 container prices were also 45 per cent lower than the prices quoted four years earlier. Toward mid-1999, however, the prices started to increase and, by the third and fourth quarters, the prices of new boxes were 2-3 per cent and 5 per cent higher than the prices quoted at the start of 1999, respectively. The increase in the 1999 prices of new boxes absorbed the 50 per cent increase in the cost of Indonesian plywood for box flooring. 151. China remained the major supplier of new boxes representing 66 per cent of the global dry freight container production (see table 48). Because most of the manufacturers were located in the central and southern areas of China, where resources and raw material were relatively cheaper, China was able to produce boxes at very competitive prices dictating the world price of new containers. 152. At the end of 1999, the price of new 20 ft containers was about $1,460-1,480 across China. This increase in the price of new containers was reportedly welcomed by the industry as an inevitable result of the recovery from the Asian financial crisis, and should the price continue to increase, it would help producers in their cost-saving effort to generate revenue for the
industry. An early reaction to the price hike was the setting of prices by container producers with their larger customers on volume production for the year 2000. 153. The fall in container output in 1999, which had initially been predicted to be 10 per cent, actually stood at a 2 per cent drop (see graph 9). The reason for the output not to drop any more than 2 per cent was the increase in demand for new containers that originated from the stronger world demand for trade following the end of the Asian crisis, and from the streamlining of the industry that went through continuing consolidations, which ensured a more efficient production of new boxes. In other words, with the improvement in the terms of trade and the speedy recovery from the Asian financial crisis, the increasing demand for new boxes was expected to continue or remain at current levels, sustaining an increase in the price of new containers. 154. The composition of production in 2000 is also expected to follow the trend from the past couple of years. As shown in table 49, total production was dominated by the demand for dry containers totalling about 1.2 million TEUs. Dry freight containers produced in 1999 and 1998 constituted about 84 per cent of the global production. The other types of boxes, comprising 11.7 per cent of world box production, had changed in composition. In particular, the production of tank and special boxes fell by 25 per cent and 15 per cent, respectively. On the other hand, productions of swapbodies increased by more than 20 per cent.
Table 48 Global container production by country/region for 1998 and 1999
Container size
January 2000
January 1999
20 foot
2 086 993
1 828 071
40 foot
4 218 648
3 372 784 45 foot
35 638
27 671
48 foot
24
24 Other
815
330
Source: Containerisation International, January 2000. Note: Totals include maritime and regional container types; some 1999 totals are estimated.

Graph 9 World container output, 1990-1999
0
200,000
400,000
600,000
800,000
1,000,000
1,200,000
1,400,000
1,600,000
1990 1992 1994 1996 1998
Year
Figure 1: World Container Output 1990-1999
TEU
Source: Containerisation International, January 2000. Note: Totals include maritime and regional container types. Table 49 Global container production by main type for 1998 and 1999
Container type
1998
1999
Dry freight standard and high
1 225 000
1 210 000
Dry freight special
77 000
65 000
Reefer
95 000
87 000
Tank
15 500
12 000
European (swapbody)
34 000
42 000
US domestic
28 500
29 000
Total
1 475 000
1 445 000
Source: Containerisation International, January 2000.
84
B. ELECTRONIC COMMERCE AND ITS IMPACT ON TRANSPORT
The emerging role of Internet-based transportation service providers 155. Major transport companies, including maritime carriers, are now providing a variety of information about their services on the Internet as well as enabling customers to process transactions online. In addition, in recent years there has been a considerable growth of infomediaries, which are creating marketplaces, and exchanges for transportation services. This section provides a brief description and selected examples of such infomediaries or Internet transport portals. 156. Internet transport portals are websites that are designed to bring together large numbers of transportation service buyers and sellers and thus match their offers and requirements. They function in the same way as more general web portals such as Yahoo, Excite, Infoseek, etc., except that they specialize in enabling the search for information on, and carrying of transactions in, transport. 157. The following are examples of online capabilities that they provide:
Shippers posting their requirements for tonnage, rates, delivery time and other conditions; Carriers posting their available capacity, rates, routing, delivery time and other conditions; Shippers viewing rates and information on capacity available from carriers; Shippers responding to offers of capacity, delivery time and rates set by carriers; Carriers responding to loads offered by shippers at carriers' posted rates; Carriers and shippers making contracts based on mutually agreed offers; Printing and receiving bills of lading; Cargo booking and confirmation; Cargo notification; Payment;
Tracking movements of shipments along the transport chain.
158. Box 2 gives selected example of Internet transport portals. They demonstrate the range of services being offered and the ways in which they affect the activities of carriers and intermediaries. While there is a high degree of similarity or overlap between the services being offered by the different Internet portals, there are at the same time important variations as regards their scope and the objectives they pursue.13 159. A number of features can be summarized from the examples outlined in Box 2. Many of the services are designed for accessing by carriers, intermediaries and shippers. In such cases, in theory, the systems should benefit all the three groups. Some of the services are intended to arrange direct transactions between carriers and shippers and to bypass intermediaries. To the extent that the services do indeed bypass the intermediaries, the net effect would be to reduce their participation in the transportation chain. However, in so far as forwarders and other intermediaries can, in practice, have the same access as shippers to the services concerned, there appears to be no mechanism for them to be excluded. 160. A few service providers, such as FreightDesk, are dedicated to transportation intermediaries and the shippers they serve. Such services would enhance the role of intermediaries rather that diminish it. The argument advanced by the developers of FreightDesk is that intermediaries will always be needed because they have trading knowledge that carriers and shippers lack. This may be the case in most existing business-to-business transactions in which the professional expertise of intermediaries may be required to organize shipments. 161. Intermediaries may offer a number of advantages which may ensure continued demand for them. The main attraction in using intermediaries, such as forwarders, lies in their experience and specialized knowledge of a wide range of matters regarding transportation, packing, formalities related to letters of credit, customs, import licenses, etc.
Box 2
Selected examples of Internet-based transportation service providers TRADIANT Tradiant offers a business-to-business market exchange for freight transportation services that brings together carriers, shippers and freight forwarders. It enables carriers and shippers to participate in a global online market for containerised cargo. On Tradiant's website, shippers or forwarders can request rate quotes for one-time shipments and also for contracts for periodic shipments over time. On the other hand, carriers can provide quotes in response to requests initiated by shippers. When requesting quotes, shippers or forwarders can specify a price and also choose to send a request to all carriers, carriers of a certain type or class, or named carriers. Having received quotes, a shipper may then accept or act on a quote accordingly. In addition to enabling the request and offer process, Tradiant facilitates the handling of actual transactions between carriers and shippers. This includes the establishment of a physical contract, online cargo booking, documentation, shipment control and payment across all modes of transport. According to Tradiant, its system helps small to medium-sized forwarders by providing them with a state-of-the-art technology platform that is normally available to freight forwarders with large technology budgets. It enables forwarders to manage a large number of quotes and contracts from many shippers in a short time and at relatively low cost. Tradiant's services are free for shippers. It charges the carriers a transaction fee for each quote or offer that results in a booking. iShip iShip provides an Internet-based shipping service that allows shippers and carriers to make shipping transactions online. Its focus is mainly on small-sized shipments. It allows users of shipping services to access and compare rates and services that are provided by major integrated carriers, such as UPS, FedEx, Airborne, U.S. Postal Services, Yellow Freight System, etc. It provides answers to basic shipping questions, such as the cost of shipment by alternative carriers, delivery times, by weight and destination, etc. Users of shipping services can obtain information on a range of providers of shipping services. They can also get access to shipment tracking tools and secure data for billing purposes. Online vendors can add shipping features to their website by linking to the appropriate iShip.com URLs and thus provide buyers with information on shipping prices and options. iShip also gives buyers of shipping services the possibility of bidding for rates. It assembles information from sellers of shipping services which is then matched with preferences expressed by users of the services. The bidding is completed by iShip providing a matrix of shipping rates for various carriers selected by the user. GoCargo GoCargo is a web-based auction for transport services. It is independent, without any affiliation with shippers or service providers. Through its Internet website, it provides access to shippers of all sizes to receive multiple competing bids from service providers in an auction format. By viewing and evaluating alternative options that match their needs, shippers are able to select services. For service providers, GoCargo receives information on cargo opportunities that match the provider's profile. National Transportation Exchange (NTE) The NTE is a United States national business-to-business e-commerce trading exchange for member shippers and truck carriers. It is used by shippers, forwarders, brokers, third party logistics intermediaries and truckload freight carriers. It creates a transportation-trading marketplace by providing shared information on shipment time, transport availability, prices, routing and service levels.14 NTE has around 500 industry user members. Users of truck transport looking for truck capacity service post their requirements on the Exchange and these are matched with available carriers' capacity. Carriers use the Exchange to find compatible freight that would fill out empty space on their trucks. The Exchange determines minimum, market-based prices on every shipment entered and consignors can enter freight at any price at or above the set minimum. Shipments quoted at lower than the minimum are not accepted. The Exchange also provides users with up-to-date information on the movement of shipments.
Celarix Celarix is a provider of a web-based transport exchange that combines the ability to buy and sell transportation services and also to manage and monitor the entire logistics process. Through the exchange, information is provided from sellers, carriers, customs brokers, freight forwarders and consolidators (NVCCs). Shippers can buy transportation services online. They can instantly communicate their requirements to many service providers, while service providers can offer available shipping space to the entire marketplace or selected users. Negotiations are thus permitted, leading to the securing of transportation service contracts and online cargo booking and confirmation.15 FreightDesk This is an online transportation service provider dedicated to transportation intermediaries and the shippers served by the intermediaries. It is not an online auction but deals with managing logistics processes from the standpoint of freight forwarders, customs brokers, NVOCCs and their customers. The founders of FreightDesk take the view that forwarders and other intermediaries will always be needed on the transportation chain because they have "the domain knowledge of trading that carriers and shippers intrinsically lack". They contend that freight forwarders should not have to face extinction because of the new market in online transportation auctions through which shippers of any size theoretically can buy their transportation directly from carriers. The intermediary is a domain expert which cannot be replaced by software. The complexity of international trading means that there is a need for middlemen.16 The approach of FreightDesk is to use Internet-based communications capabilities to give forwarders a range of up-to-date tools that make them more effective and attractive to shippers and more economically viable. Such tools also enable small and medium-sized freight forwarders to survive alongside much bigger intermediaries. Thus unlike some other service providers, FreightDesk develops a partnership with freight intermediaries instead of trying to bypass them in the transportation chain. Carrierpoint Carrierpoint is an online transportation market that allows shippers and carriers to offer shipments, communicate prices and share information. Its founders aim at permitting carriers and shippers to create a true market environment free of middlemen or hidden charges. Shippers post available shipments on the marketplace and then matching carriers are notified, upon which they can communicate their current market prices. The carriers' prices are then communicated to the posting shippers along with each carrier's service characteristics. The shipper uses this information to select the best carrier for their posted shipments.17 The providers of CarrierPoint point out that their service is not an auction. Shippers are not required to accept the lowest bid. Both the shippers and carriers can set bid terms and reserves are not binding. Also postings can be discriminatory in that shippers can specify who will see their shipments. Tranzlink Tranzlink is an electronic marketplace for freight transportation transactions for truckload shippers, brokers and carriers in North America. Participants in the trading system can match loads, negotiate contracts and confirm pick-ups and delivery details online. The system provides a dual-track capability, that is broker/carrier and shipper/carrier trading environments.18 Through the Internet, shippers post available loads showing pick-up date, origin, destination, type of equipment needed, type of commodity, estimated target price and other additional information. Carriers can accept a job as posted or bid online along with other carriers, until an arrangement is agreed upon between the shipper and a carrier. Similarly, carriers post details of available equipment, including locations and desired destinations. Shippers, brokers and logistics companies can view these and enter competitive bids. When a bid is accepted a confirmation containing essential details such as costs, delivery times and cargo weight is sent to the shipper. E-Transport E-Transport is a marketplace where buyers and sellers of transportation services can conduct transactions electronically. It is designed to connect all trading partners including shippers, carriers and transportation intermediaries and ports. Users of transportation services can check tariff rates for shipping specific commodities from origin to destination. Through the marketplace shippers and carriers can negotiate rates and service contracts. They can use E-Transport's browser tools to enter shipment details, book cargo, generate documentation, rate and audit bills and track shipments.19
162. More importantly, though, many freight forwarders have now expanded the scope of their services to become door-to-door logistics providers. Thus, while an individual shipper may search the required information on the Internet, the range of services that a forwarder can offer creates a value added service which shippers are prepared to continue to buy from forwarders. Also experience gained so far indicates that the rapid growth of e-commerce is placing heavy demands on e-retailers in fulfilling orders. In many cases such retailers lack the necessary logistics networks needed to meet the requirements of buyers. There has therefore been a tendency for them to outsource services from third party logistics providers, including forwarders. The emerging Internet-based transportation services provide the intermediaries with tools for improving their efficiency and access to shippers. Thus, rather than being bypassed their positions may be strengthened. Other related impacts of Internet transport portals 163. Increased competition between carriers: The growth of Internet transport portals and related exchanges, auctions and other market mechanisms are likely to intensify competition between carriers in the supply of transportation services. Even though carriers of all sizes would have access to cargoes through the Internet, the competition is likely to drive out small carriers from the industry. This in turn would encourage higher degrees of concentration in the industry in the form of domination by large integrators or carriers operating in large consortia or global alliances. However, even cooperation arrangements such as global alliances are likely to be unstable due to the intra-alliance competition that would be encouraged by transport exchanges, auctions, etc. In the long run, this scenario may favour the domination of freight markets by large integrators and other large individual carriers "protected" from competition via vertical integration or mergers. 164. Pricing in liner conference services: The growth of transport exchanges and auctions provide opportunities for direct contact between carriers and shippers and thus greater partnership between them. This would lead to further reduction of the already diminishing role of liner conferences in influencing the pricing of services. There will be greater reliance on confidential price negotiations and contracts between shippers and individual lines. In some major trades individual contracts already account for the majority of liner shipments.
165. An empirical assessment of the real impact of web transport portals is generally hard to make, however. There are no consistent data or information on the overall volume of transport services that are traded on the portals. This problem is likely to persist if carriers and shippers place emphasis on confidentiality, for example with regard to rates. 166. In addition to the data problem, there is a perception in the industry that carriers may be uncertain as regards the legal position of the transactions that may be carried out on the portals. For example carriers could fear that posting rates on a portal by a number of them could be interpreted as price fixing by collusive means in contravention of certain antitrust laws. The position of developing countries 167. The majority of Internet transport portals that have been established so far are located in developed countries. However, the services they provide are, in principle, accessible to carriers and shippers around the world, including developing countries. Thus, in as far as trade access is concerned, buyers and sellers of transport services in developing countries are not disadvantaged by the geographical location of the portals. Indeed for e-commerce generally, there is evidence that some e-retailers in developing countries prefer to market their products on websites located in developed countries where the markets are larger, payment mechanisms are suitable and the degree of sellers' and buyer's confidence is higher. 168. On the other hand, however, the location in developing countries of Internet portals, including those for transport services, would benefit developing countries in the form of service revenues and also greater control of overall website operations for the services provided.
C. EXPERT MEETING ON CAPACITY- BUILDING IN THE AREA OF ELECTRONIC COMMERCE: LEGAL AND REGULATORY DIMENSIONS
169. In order to assess the potential impact developing countries of the legal and regulatory proposals currently being discussed in international forums and the policies to be considered by developing countries and the international community to stimulate the participation of smaller players in global electronic commerce,20 an Expert Meeting on Legal Dimensions of Electronic Commerce was convened under UNCTAD auspices in Geneva in July

88
1999. The Expert Meeting, having acknowledged that most of the existing rules and legislation would in general also apply to electronic commerce, expressed concern that the existing paper-based legal systems might be insufficient to accommodate electronic commerce and might create uncertainty. In particular, the requirements in national laws for written, signed or original documents were considered as constituting barriers to the development of electronic commerce. The importance of establishing an internationally acceptable harmonized legal framework for electronic signatures and authentication was particularly highlighted by the Experts. During the Meeting the following specific concerns21 of developing countries were singled out:
The lack of internationally acceptable rules and guidelines for the recognition of electronic signatures, digital signatures and certification authorities; Restrictions imposed on the export of technology, especially with respect to state-of-the-art encryption standards;
The need for an international scheme for registration of domain names;
Problems arising from the application of traditional principles on jurisdiction and applicable law in an electronic environment; The need for wider dissemination of information on international developments pertaining to the legal and regulatory aspects of electronic commerce, as well as a need for training and education, especially for small and medium-sized enterprises; The need for technical assistance to developing countries, and particularly the least developed countries (LDCs), in adapting their national law to accommodate electronic commerce.
170. To address some of those concerns, the Expert Meeting adopted a number of recommendations22 addressed to national Governments, to the international community as well as to UNCTAD. The following reflect some of the recommendations adopted at the Expert Meeting:
To examine the existing national legal infrastructure to assess if paper-based form requirements prevent laws from being applied to electronic transactions and to determine whether such form requirements should be adjusted to make their laws technology-
neutral and permit their interpretation and application in an electronic environment.
171. In reviewing their legal infrastructures, Governments are encouraged to give consideration to using the UNCITRAL Model Law on Electronic Commerce, as well as other instruments on electronic commerce prepared by UNCITRAL and other organizations, as a basis for preparing new laws or adjusting current laws. Where appropriate, Governments should also consider the introduction of rules to give certainty with regard to the legal effect of using specific technologies within a technologically neutral legal infrastructure. 172. Developed country Governments are urged to dismantle barriers to global electronic commerce for developing countries by removing restrictions on the export of technology, especially with respect to state-of-the-art encryption systems and products, as well as associated technologies and computer systems. 173. Governments of developed and developing countries, especially those that are members of regional economic groupings, are encouraged to establish cooperative relationships so as to increase their capacity to deal with the complexity of the issues that have arisen due to the development of information and communication technologies in such areas as taxation, customs, intellectual property, domain names, computer crime, Internet content regulation, privacy and data protection, consumer protection, certification authorities, and the role of accreditation and standardization bodies. 174. Governments of developing countries are encouraged to participate in the preparation of various legal instruments being considered in international forums and to promote public awareness and education of all aspects of electronic commerce and the opportunities and benefits it offers. 175. Finally, the international community is requested to provide assistance to developing countries in reviewing and adapting their national laws to accommodate electronic commerce, promoting awareness, education and training in the legal and regulatory aspects affecting electronic commerce. 176. Box 3 provides the status of international maritime conventions adopted under the auspices of UNCTAD as at 10 July 2000.

89
Box 3
Contracting States of selected conventions on maritime transport as at 10 July 2000
Title of Convention Date of entry into force or conditions for entry into
force
Contracting States
United Nations Convention on a Code of Conduct for Liner Conferences, 1974
Entered into force 6 October 1983
Algeria, Bangladesh, Barbados, Belgium, Benin, Bulgaria, Burkina Faso, Cameroon, Cape Verde, Central African Republic, Chile, China, Congo, Costa Rica, Côte d'Ivoire, Cuba, Czech Republic, Democratic Republic of the Congo, Denmark, Egypt, Ethiopia, Finland, France, Gabon, Gambia, Germany, Ghana, Guatemala, Guinea, Guyana, Honduras, India, Indonesia, Iraq, Italy, Jamaica, Jordan, Kenya, Kuwait, Lebanon, Madagascar, Malaysia, Mali, Mauritania, Mauritius, Mexico, Morocco, Mozambique, the Netherlands, Niger, Nigeria, Norway, Pakistan, Peru, the Philippines, Portugal, Qatar, Republic of Korea, Romania, Russian Federation, Saudi Arabia, Senegal, Sierra Leone, Slovakia, Somalia, Spain, Sri Lanka, Sudan, Sweden, Togo, Trinidad and Tobago, Tunisia, United Kingdom of Great Britain and Northern Ireland, United Republic of Tanzania, Uruguay, Venezuela, Yugoslavia, Zambia (78)
United Nations Convention on the Carriage of Goods by Sea, 1978 (Hamburg Rules)
Entered into force 1 November 1992
Austria, Barbados, Botswana, Burkina Faso, Burundi, Cameroon, Chile, Czech Republic, Egypt, Gambia, Georgia, Guinea, Hungary, Kenya, Lebanon, Lesotho, Malawi, Morocco, Nigeria, Romania, Senegal, Sierra Leone,Tunisia, Uganda, United Republic of Tanzania, Zambia (26)
United Nations Convention on International Multimodal Transport of Goods, 1980
Not yet in force - 30 contracting parties
Burundi, Chile, Georgia, Malawi, Mexico, Morocco, Rwanda, Senegal, Zambia (9)
United Nations Convention on Conditions for Registration of Ships, 1986
Not yet in force - 40 contracting parties with at least 25 per cent of the world's tonnage as per annex III to the Convention
Bulgaria, Côte d'Ivoire, Egypt, Georgia, Ghana, Haiti, Hungary, Iraq, Libyan Arab Jamahiriya, Mexico, Oman
(11)
International Convention on Maritime Liens and Mortgages, 1993
Not yet in force - 10 contracting parties
Monaco, Russian Federation, St. Vincent and the Grenadines, Tunisia, Vanuatu (5)
International Convention on Arrest of Ships, 1999
Not yet in force - 10 contracting parties
-
Source: For official status see www.un.org/Depts/Treaty.
90
D. OTHER DEVELOPMENTS 177. The TRAINMAR programme provides a system for locally-managed training for shore-based professionals in the fields of international transport, port management, and logistics, with a view to improve maritime trade. It ensures, through continuous and flexible cooperation among Training Centres, that a wide range of training is available effectively and economically. Each cooperating centre joins a regional network, maintaining regular contact with other centres; the regional networks also remain in contact and all are linked to a Central Support Team (CST) at UNCTAD's headquarters in Geneva. Efforts and resources are shared and each member has access to the latest information, experience and products. The training that results is organized and conducted professionally by local staff trained in the TRAINMAR approach, and is shaped to meet the needs of the community. Trainers who have gained experience through TRAINMAR have been able to conduct wider training in other countries, and in topics not considered to be the domain of UNCTAD, such as portworker training using materials prepared by the International Labour Organisation (ILO) and increasingly implemented through TRAINMAR. Asia/Pacific Region 178. In this region, TRAINMAR is currently active in Egypt, India, Malaysia, Pakistan, Papua New Guinea, the Philippines, Sri Lanka and Thailand. Members meet periodically to prepare plans for joint actions, which in 1999 have included a regional system of quality control applied to new courses being developed, and with help from the CST at members' request, the initiation of two projects to bring technology-based training methods into regular use for meeting the demands of an increasingly privatized maritime trade sector. 179. New interest has been expressed during 1999 from institutes in countries not currently involved with TRAINMAR, notably in Western Asia but also in Nepal, the first landlocked country of the region to recognise the benefits offered by network membership, and Australia where there is a willingness to help as well as share with centres in other countries. Greater membership in Western Asia may lead to the creation of a separate network there. Also, following contacts with countries of the Pacific, a project proposal has been prepared to support the creation of a separate TRAINMAR network.
Latin America and the Caribbean 180. The TRAINMAR network has been very active in the Latin America and Caribbean region thanks to the more than 20 associate members, gathered in three regional networks (Southern Cone, Central America and Caribbean Basin). Faced with changing structures, partners and clients in the maritime business, TRAINMAR capacities had to be adapted to reflect new training demands, which include transport logistics, quality and environmental aspects, information technology and the concept of port community services. To meet these new challenges, new products and services have been developed over the past year, to the growing satisfaction of the wider port, transport and shipping communities served by TRAINMAR. 181. In South America, the TRAINMAR South American Association (ATAS), a non-profit private organization was created in 1996 to enhance the coordination of the regional TRAINMAR activities and better represent the interests and objectives of the TRAINMAR members in South America. Since that date, the association, jointly supported by UNCTAD and the German Agency for Technical Cooperation (GTZ), has developed an important number of new training materials and additional services to training. 182. In Central America, TRAINMAR has been working hand in hand since 1987 with COCATRAM, the Central American Commission for Maritime Transport. National port authorities or responsible commissions in each of the six countries of the Central American isthmus, excluding Panama, have been implementing TRAINMAR through their respective training or human resources sections. After privatization of port activities touched Panama, TRAINMAR activities have been coordinated there by the Panama Maritime Authority. Strong and long-lasting horizontal cooperation mechanisms among members allow for an intensive annual work programme, with more than 80 per cent of the courses being port centered. 183. The Caribbean Basin network is a successful combination of public and private port companies, universities and non-profit organizations working towards the goal of providing high quality training services, in three languages, with a strong emphasis on the transport logistics sector. A diploma programme in The Logistics of International Transport of Goods has been successfully developed and implemented in

91
Colombia, Panama and Guadeloupe, thanks to a technical and financial partnership with the French Ministry of Foreign Affairs. Contrary to most TRAINMAR network members around the world, each Caribbean network member is specialized in one activity: course development, multimedia development, course delivery, consulting, etc. To accelerate its integration as an efficient training provider, the Caribbean Basin network decided in 1998 to standardize all its working procedures in order to obtain a quality certification following ISO 9002 quality standard. Other regions 184. In Eastern Europe, TRAINMAR has established two centres in Constanza, Romania, and Batumi, Georgia, with the hope of creating a regional network by the Black Sea. So far, the training needs analysis has been completed in both countries, and training plans are being prepared for 2000. In Romania, 8 courses were
delivered for the benefit of the local port and shipping community, as well as future TRAINMAR course developers. In Georgia, traditional TRAINMAR and IPP (Improving Port Performance) courses are being translated into Russian with a view to a wider use in Russian speaking countries. In both countries, TRAINMAR is cooperating with the German Agency for Technical Cooperation (GTZ) in the framework of port modernization technical assistance projects. 185. In Africa, cooperation between centres is being reactivated after a period without structured cooperation among the various qualified centres still active individually. In March 2000, trainers or managers from Angola, Benin, Cameroon, Cape Verde, Gabon, The Gambia, Guinea, Senegal, Togo and the United Republic of Tanzania met in Las Palmas, Canary Islands, where UNCTAD was requested to support renewed cooperation among the interested countries.

Chapter VII
REVIEW OF REGIONAL DEVELOPMENTS: SUB-SAHARAN AFRICA
This chapter reviews and analyses the global and intraregional trades in sub-Saharan Africa, along with developments in transport and related services. A. ECONOMIC BACKGROUND (a) General situation 186. The economies of sub-Saharan Africa have recently been influenced by three main developments. The first were movements in commodity prices. The persistent weakness of non-oil commodity prices continues to constrain growth in many countries in sub-Saharan Africa. Secondly, pressures for structural reforms have increased, in some cases because of the economic difficulties brought on by depressed commodity prices in recent years. Thus, increased attention has been given by Governments to preparations for the privatization of public utility and transportation companies in many of the sub-Saharan African countries, in order to improve the business and investment environment. Thirdly, the economic outlook is also being shaped by various improvements in trade and political cooperation. Several positive developments have been cited, including the implementation of the common external tariff by the West African Economic and Monetary Union, and plans for establishing free-trade areas in the Common Market for Eastern and Southern Africa and also in the Southern African Development Community in 2000. 187. For sub-Saharan Africa as a whole, growth in economic activities, measured by GDP, has been projected to grow by around 3 per cent in 1999 and 5 per cent in 2000. This aggregate figure masks the fact that some countries such as Cameroon, Côte d'Ivoire, Ghana, Sudan, United Republic of Tanzania and Uganda have been performing relatively well in macroeconomic terms. Growth of 4.0-5.5 per cent was projected for most of these countries in 1999, with further strengthening expected in 2000, and inflation has in general been
held at low-to-moderate single-digit levels. This relatively strong performance can be attributed in part to continued appropriate macroeconomic policies. (b) Macroeconomic performances Real GDP 188. The GDP growth of sub-Saharan Africa was stagnant for the period from 1991 through 1994, compared to the average annual growth of 2.3 per cent for the 1981-1990 period. Their overall economic activities regained some momentum in 1995, and sustained this positive development until 1998, when the growth rate fell below 3.0 per cent, and was also less than 3.0 per cent in 1999. A similar trend is observed in the GDP growth rate fluctuation of developed market-economy countries. This reflects how sub-Saharan African countries' economic performance as a whole has been closely related to those of the advanced economies. However, the trend in sub-Saharan Africa was in sharp contrast with that of all developing countries, specifically Asian developing countries, until the end of 1997. In 1998, the Asian economic and financial crisis adversely affected the overall economic performance of all country groups, including sub-Saharan developing countries. In 1999 all groups, including the sub-Saharan group, seem to be recovering gradually from the economic and financial slowdown (see table 50). 189. In West Africa, the economies of this subregion have continued to develop favourably since 1995, after a number of countries went through a phase of negative growth in previous years. In 1998, despite the Asian crisis, countries in this subregion generally performed well, recording positive growth rates which had been above the average rate of sub-Saharan Africa, with the
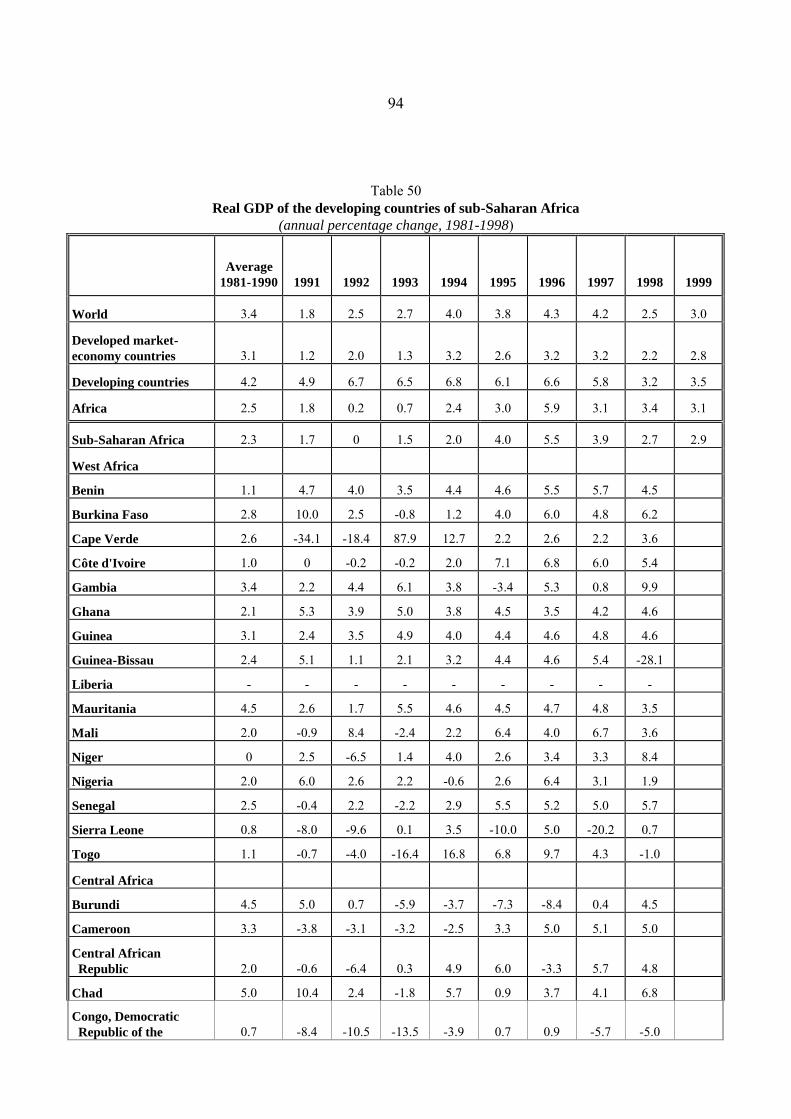
94
Table 50 Real GDP of the developing countries of sub-Saharan Africa
(annual percentage change, 1981-1998)
Average 1981-1990
1991
1992
1993
1994
1995
1996
1997
1998
1999
World
3.4
1.8
2.5
2.7
4.0
3.8
4.3
4.2
2.5
3.0
Developed market-economy countries
3.1
1.2
2.0
1.3
3.2
2.6
3.2
3.2
2.2
2.8
Developing countries
4.2
4.9
6.7
6.5
6.8
6.1
6.6
5.8
3.2
3.5
Africa
2.5
1.8
0.2
0.7
2.4
3.0
5.9
3.1
3.4
3.1
Sub-Saharan Africa
2.3
1.7
0
1.5
2.0
4.0
5.5
3.9
2.7
2.9
West Africa
Benin
1.1
4.7
4.0
3.5
4.4
4.6
5.5
5.7
4.5
Burkina Faso
2.8
10.0
2.5
-0.8
1.2
4.0
6.0
4.8
6.2
Cape Verde
2.6
-34.1
-18.4
87.9
12.7
2.2
2.6
2.2
3.6
Côte d'Ivoire
1.0
0
-0.2
-0.2
2.0
7.1
6.8
6.0
5.4
Gambia
3.4
2.2
4.4
6.1
3.8
-3.4
5.3
0.8
9.9
Ghana
2.1
5.3
3.9
5.0
3.8
4.5
3.5
4.2
4.6
Guinea
3.1
2.4
3.5
4.9
4.0
4.4
4.6
4.8
4.6
Guinea-Bissau
2.4
5.1
1.1
2.1
3.2
4.4
4.6
5.4
-28.1
Liberia
-
-
-
-
-
-
-
-
-
Mauritania
4.5
2.6
1.7
5.5
4.6
4.5
4.7
4.8
3.5
Mali
2.0
-0.9
8.4
-2.4
2.2
6.4
4.0
6.7
3.6
Niger
0
2.5
-6.5
1.4
4.0
2.6
3.4
3.3
8.4
Nigeria
2.0
6.0
2.6
2.2
-0.6
2.6
6.4
3.1
1.9
Senegal
2.5
-0.4
2.2
-2.2
2.9
5.5
5.2
5.0
5.7
Sierra Leone
0.8
-8.0
-9.6
0.1
3.5
-10.0
5.0
-20.2
0.7
Togo
1.1
-0.7
-4.0
-16.4
16.8
6.8
9.7
4.3
-1.0
Central Africa
Burundi
4.5
5.0
0.7
-5.9
-3.7
-7.3
-8.4
0.4
4.5
Cameroon
3.3
-3.8
-3.1
-3.2
-2.5
3.3
5.0
5.1
5.0
Central African Republic
2.0
-0.6
-6.4
0.3
4.9
6.0
-3.3
5.7
4.8
Chad
5.0
10.4
2.4
-1.8
5.7
0.9
3.7
4.1
6.8
Congo, Democratic Republic of the
0.7
-8.4
-10.5
-13.5
-3.9
0.7
0.9
-5.7
-5.0
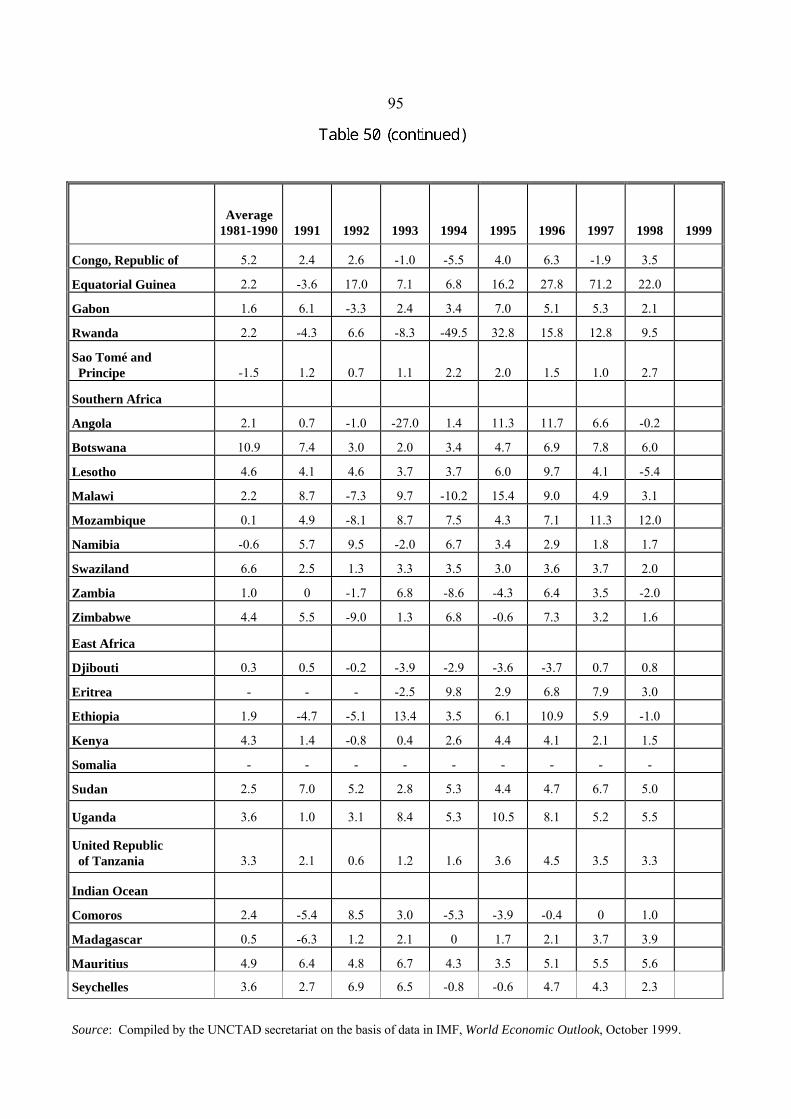
95
Average 1981-1990
1991
1992
1993
1994
1995
1996
1997
1998
1999
Congo, Republic of
5.2
2.4
2.6
-1.0
-5.5
4.0
6.3
-1.9
3.5
Equatorial Guinea
2.2
-3.6
17.0
7.1
6.8
16.2
27.8
71.2
22.0
Gabon
1.6
6.1
-3.3
2.4
3.4
7.0
5.1
5.3
2.1
Rwanda
2.2
-4.3
6.6
-8.3
-49.5
32.8
15.8
12.8
9.5
Sao Tomé and Principe
-1.5
1.2
0.7
1.1
2.2
2.0
1.5
1.0
2.7
Southern Africa
Angola
2.1
0.7
-1.0
-27.0
1.4
11.3
11.7
6.6
-0.2
Botswana
10.9
7.4
3.0
2.0
3.4
4.7
6.9
7.8
6.0
Lesotho
4.6
4.1
4.6
3.7
3.7
6.0
9.7
4.1
-5.4
Malawi
2.2
8.7
-7.3
9.7
-10.2
15.4
9.0
4.9
3.1
Mozambique
0.1
4.9
-8.1
8.7
7.5
4.3
7.1
11.3
12.0
Namibia
-0.6
5.7
9.5
-2.0
6.7
3.4
2.9
1.8
1.7
Swaziland
6.6
2.5
1.3
3.3
3.5
3.0
3.6
3.7
2.0
Zambia
1.0
0
-1.7
6.8
-8.6
-4.3
6.4
3.5
-2.0
Zimbabwe
4.4
5.5
-9.0
1.3
6.8
-0.6
7.3
3.2
1.6
East Africa
Djibouti
0.3
0.5
-0.2
-3.9
-2.9
-3.6
-3.7
0.7
0.8
Eritrea
-
-
-
-2.5
9.8
2.9
6.8
7.9
3.0
Ethiopia
1.9
-4.7
-5.1
13.4
3.5
6.1
10.9
5.9
-1.0
Kenya
4.3
1.4
-0.8
0.4
2.6
4.4
4.1
2.1
1.5
Somalia
-
-
-
-
-
-
-
-
-
Sudan
2.5
7.0
5.2
2.8
5.3
4.4
4.7
6.7
5.0
Uganda
3.6
1.0
3.1
8.4
5.3
10.5
8.1
5.2
5.5
United Republic of Tanzania
3.3
2.1
0.6
1.2
1.6
3.6
4.5
3.5
3.3
Indian Ocean
Comoros
2.4
-5.4
8.5
3.0
-5.3
-3.9
-0.4
0
1.0
Madagascar
0.5
-6.3
1.2
2.1
0
1.7
2.1
3.7
3.9
Mauritius
4.9
6.4
4.8
6.7
4.3
3.5
5.1
5.5
5.6
Seychelles
3.6
2.7
6.9
6.5
-0.8
-0.6
4.7
4.3
2.3
Source: Compiled by the UNCTAD secretariat on the basis of data in IMF, World Economic Outlook, October 1999.
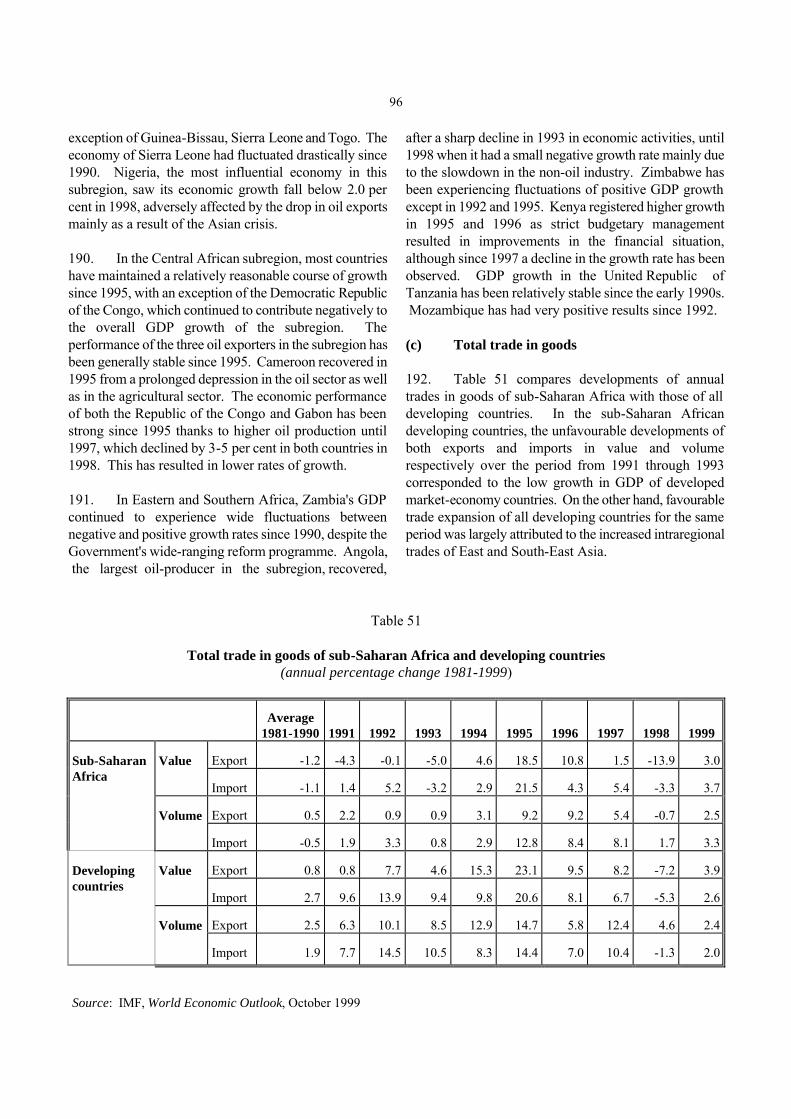
96
exception of Guinea-Bissau, Sierra Leone and Togo. The economy of Sierra Leone had fluctuated drastically since 1990. Nigeria, the most influential economy in this subregion, saw its economic growth fall below 2.0 per cent in 1998, adversely affected by the drop in oil exports mainly as a result of the Asian crisis. 190. In the Central African subregion, most countries have maintained a relatively reasonable course of growth since 1995, with an exception of the Democratic Republic of the Congo, which continued to contribute negatively to the overall GDP growth of the subregion. The performance of the three oil exporters in the subregion has been generally stable since 1995. Cameroon recovered in 1995 from a prolonged depression in the oil sector as well as in the agricultural sector. The economic performance of both the Republic of the Congo and Gabon has been strong since 1995 thanks to higher oil production until 1997, which declined by 3-5 per cent in both countries in 1998. This has resulted in lower rates of growth. 191. In Eastern and Southern Africa, Zambia's GDP continued to experience wide fluctuations between negative and positive growth rates since 1990, despite the Government's wide-ranging reform programme. Angola, the largest oil-producer in the subregion, recovered,
after a sharp decline in 1993 in economic activities, until 1998 when it had a small negative growth rate mainly due to the slowdown in the non-oil industry. Zimbabwe has been experiencing fluctuations of positive GDP growth except in 1992 and 1995. Kenya registered higher growth in 1995 and 1996 as strict budgetary management resulted in improvements in the financial situation, although since 1997 a decline in the growth rate has been observed. GDP growth in the United Republic of Tanzania has been relatively stable since the early 1990s. Mozambique has had very positive results since 1992. (c) Total trade in goods 192. Table 51 compares developments of annual trades in goods of sub-Saharan Africa with those of all developing countries. In the sub-Saharan African developing countries, the unfavourable developments of both exports and imports in value and volume respectively over the period from 1991 through 1993 corresponded to the low growth in GDP of developed market-economy countries. On the other hand, favourable trade expansion of all developing countries for the same period was largely attributed to the increased intraregional trades of East and South-East Asia.
Table 51
Total trade in goods of sub-Saharan Africa and developing countries (annual percentage change 1981-1999)
Average
1981-1990 1991
1992
1993
1994
1995
1996
1997
1998
1999
Export
-1.2
-4.3
-0.1
-5.0
4.6
18.5
10.8
1.5
-13.9
3.0
Value
Import
-1.1
1.4
5.2
-3.2
2.9
21.5
4.3
5.4
-3.3
3.7
Export
0.5
2.2
0.9
0.9
3.1
9.2
9.2
5.4
-0.7
2.5
Sub-Saharan Africa
Volume
Import
-0.5
1.9
3.3
0.8
2.9
12.8
8.4
8.1
1.7
3.3
Export
0.8
0.8
7.7
4.6
15.3
23.1
9.5
8.2
-7.2
3.9
Value
Import
2.7
9.6
13.9
9.4
9.8
20.6
8.1
6.7
-5.3
2.6
Export
2.5
6.3
10.1
8.5
12.9
14.7
5.8
12.4
4.6
2.4
Developing countries
Volume
Import
1.9
7.7
14.5
10.5
8.3
14.4
7.0
10.4
-1.3
2.0
Source: IMF, World Economic Outlook, October 1999

97
193. Over the period from 1995 through 1999, the exports of sub-Saharan African countries increased at an average annual rate of 4.0 per cent in value and 5.1 per cent in volume, with imports increasing at 6.3 per cent per year in value and 6.9 per cent in volume. Over the same period, the exports of all developing countries expanded at an average annual growth rate of 7.5 per cent in value and 8.0 per cent in volume, while imports also increased at 6.5 per cent in value as well as in volume. In 1998, growth of trades (exports and imports) of sub-Saharan African countries as well as all developing countries fell drastically to a negative level, while those of the previous three years (1995-1997) represented an average growth rate of 10-14 per cent per year. This particular decline in growth is largely attributable to the adverse effects of the Asian crisis. B. GENERAL SITUATION OF MERCHANT
FLEETS OF AFRICA Merchant fleets in sub-Saharan African countries 194. Table 52 provides data on the overall development of the merchant fleets of the world and sub-Saharan African countries by principal types of ship. Total tonnage of all the sub-Saharan African countries decreased from 0.29 per cent of the world total in 1980 to 0.23 per cent in 1990 and reached 0.15 per cent in 1999.
Tankers and general cargo ships account for 46.4 per cent and 29.1 per cent respectively of the total sub-Saharan fleets. Tanker tonnage increased very slowly but steadily from 459,000 dwt in 1980 to 561,000 dwt in 1999, whilst total tonnage of general cargo ships has been shrinking constantly from 1.4 million dwt in 1980 to 0.8 million dwt in 1990, and further down to 0.35 million dwt in 1999. Dry bulker tonnage increased to 74,000 dwt in 1999 from 20,000 dwt in the previous year, which only accounted for a minimal portion of the world dry bulker fleet. No containerships were registered in this subregion. West Africa shares 75.6 per cent of the total tonnage of this subregion, standing at 0.9 million dwt in 1999 as compared with 1.3 million dwt in 1980 and 1.1 million dwt in 1990. While West Africa's tankers almost doubled the tonnage in 1980 to 535,000 dwt in 1999, general cargo ships in deadweight tons have plummeted from 966,000 dwt in 1980 to only 137,000 dwt in 1999. The merchant fleet of East Africa makes up 15.0 per cent of the total sub-Saharan fleet, representing 182,000 dwt, which remain unchanged from the tonnage in 1980, albeit with large year-to-year fluctuations since then. The majority of this area's fleet is made up of general cargo ships, the tonnage of which remained unchanged since the early 1990s representing 147,000 dwt in 1999 (148,000 dwt in 1980 and 91,000 dwt in 1985). Total tonnage of Central Africa and Southern Africa has been steadily declining, reaching 18,000 dwt and 95,000 dwt respectively in 1999.
Table 52
Merchant fleets of the world and those registered in sub-Saharan African countries, selected years
(in thousand dwt)
Year
Total Tanker
Dry
bulker
General cargo
Container
Others
1980
682 768
339 324
185 652
115 824
11 243
30 725
1985
664 800
261 439
232 107
105 846
19 939
45 469
1990
658 377
245 936
234 659
102 676
25 955
49 151
1995
734 917
267 650
261 628
104 129
43 849
57 660
1998
788 725
280 668
275 514
103 388
61 183
67 972
World total
1999
798 995
283 617
276 072
103 862
63 669
71 776
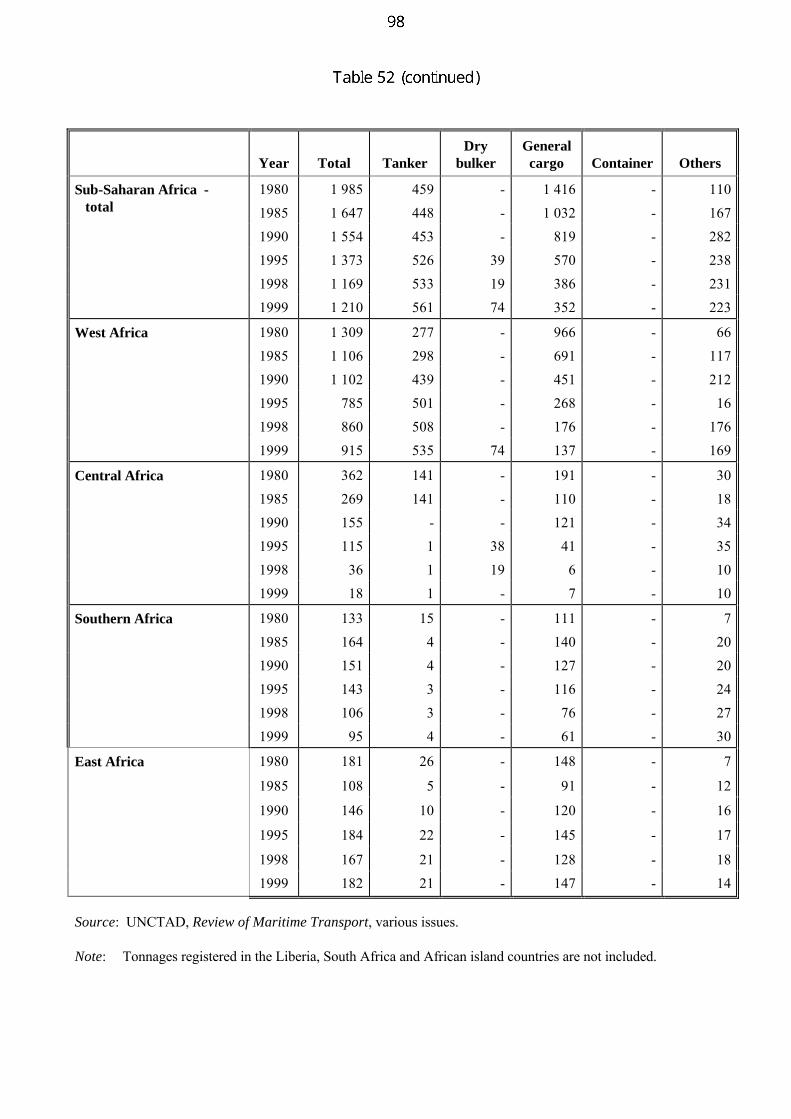
Year
Total Tanker
Dry
bulker
General cargo
Container
Others
1980
1 985
459
-
1 416
-
110
1985
1 647
448
-
1 032
-
167
1990
1 554
453
-
819
-
282
1995
1 373
526
39
570
-
238
1998
1 169
533
19
386
-
231
Sub-Saharan Africa - total
1999
1 210
561
74
352
-
223
1980
1 309
277
-
966
-
66
1985
1 106
298
-
691
-
117
1990
1 102
439
-
451
-
212
1995
785
501
-
268
-
16
1998
860
508
-
176
-
176
West Africa
1999
915
535
74
137
-
169
1980
362
141
-
191
-
30
1985
269
141
-
110
-
18
1990
155
-
-
121
-
34
1995
115
1
38
41
-
35
1998
36
1
19
6
-
10
Central Africa
1999
18
1
-
7
-
10
1980
133
15
-
111
-
7
1985
164
4
-
140
-
20
1990
151
4
-
127
-
20
1995
143
3
-
116
-
24
1998
106
3
-
76
-
27
Southern Africa
1999
95
4
-
61
-
30
1980
181
26
-
148
-
7
1985
108
5
-
91
-
12
1990
146
10
-
120
-
16
1995
184
22
-
145
-
17
1998
167
21
-
128
-
18
East Africa
1999
182
21
-
147
-
14
Source: UNCTAD, Review of Maritime Transport, various issues. Note: Tonnages registered in the Liberia, South Africa and African island countries are not included.
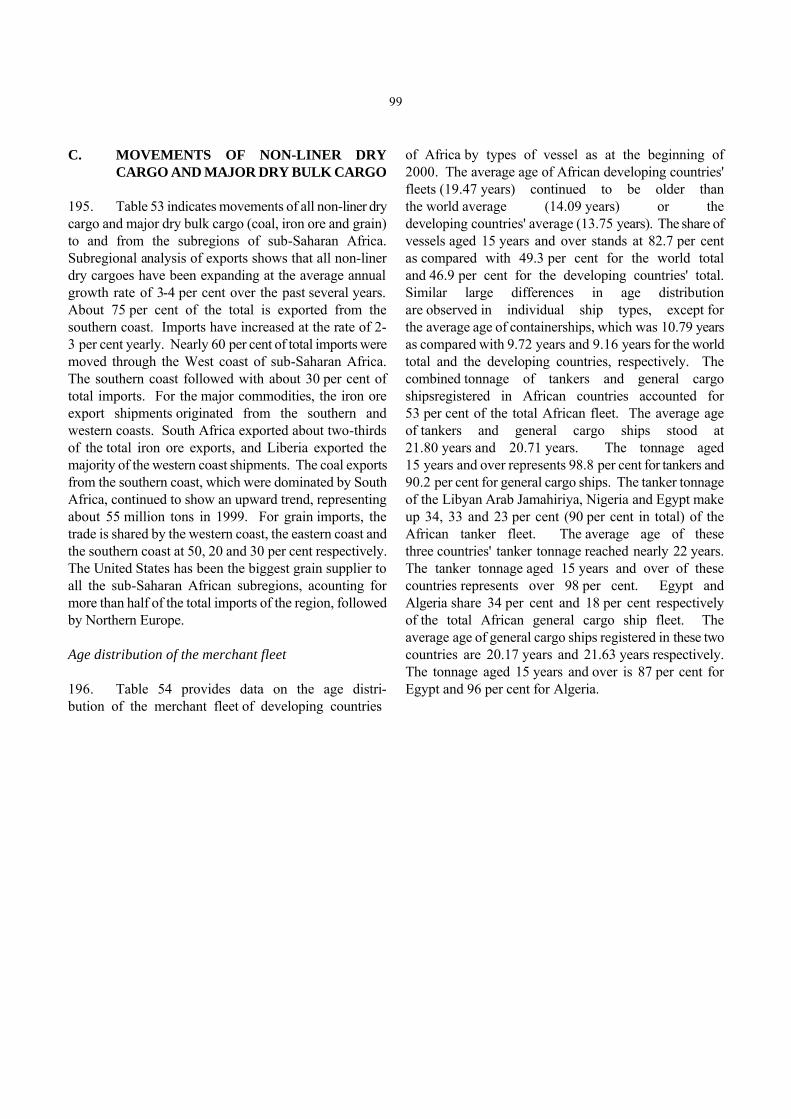
99
C. MOVEMENTS OF NON-LINER DRY CARGO AND MAJOR DRY BULK CARGO
195. Table 53 indicates movements of all non-liner dry cargo and major dry bulk cargo (coal, iron ore and grain) to and from the subregions of sub-Saharan Africa. Subregional analysis of exports shows that all non-liner dry cargoes have been expanding at the average annual growth rate of 3-4 per cent over the past several years. About 75 per cent of the total is exported from the southern coast. Imports have increased at the rate of 2-3 per cent yearly. Nearly 60 per cent of total imports were moved through the West coast of sub-Saharan Africa. The southern coast followed with about 30 per cent of total imports. For the major commodities, the iron ore export shipments originated from the southern and western coasts. South Africa exported about two-thirds of the total iron ore exports, and Liberia exported the majority of the western coast shipments. The coal exports from the southern coast, which were dominated by South Africa, continued to show an upward trend, representing about 55 million tons in 1999. For grain imports, the trade is shared by the western coast, the eastern coast and the southern coast at 50, 20 and 30 per cent respectively. The United States has been the biggest grain supplier to all the sub-Saharan African subregions, acounting for more than half of the total imports of the region, followed by Northern Europe. Age distribution of the merchant fleet 196. Table 54 provides data on the age distri- bution of the merchant fleet of developing countries
of Africa by types of vessel as at the beginning of 2000. The average age of African developing countries' fleets (19.47 years) continued to be older than the world average (14.09 years) or the developing countries' average (13.75 years). The share of vessels aged 15 years and over stands at 82.7 per cent as compared with 49.3 per cent for the world total and 46.9 per cent for the developing countries' total. Similar large differences in age distribution are observed in individual ship types, except for the average age of containerships, which was 10.79 years as compared with 9.72 years and 9.16 years for the world total and the developing countries, respectively. The combined tonnage of tankers and general cargo shipsregistered in African countries accounted for 53 per cent of the total African fleet. The average age of tankers and general cargo ships stood at 21.80 years and 20.71 years. The tonnage aged 15 years and over represents 98.8 per cent for tankers and 90.2 per cent for general cargo ships. The tanker tonnage of the Libyan Arab Jamahiriya, Nigeria and Egypt make up 34, 33 and 23 per cent (90 per cent in total) of the African tanker fleet. The average age of these three countries' tanker tonnage reached nearly 22 years. The tanker tonnage aged 15 years and over of these countries represents over 98 per cent. Egypt and Algeria share 34 per cent and 18 per cent respectively of the total African general cargo ship fleet. The average age of general cargo ships registered in these two countries are 20.17 years and 21.63 years respectively. The tonnage aged 15 years and over is 87 per cent for Egypt and 96 per cent for Algeria.

Table 53 Exports and imports of all dry cargo, a iron ore, coal and grain of sub-Saharan African subregions, 1998-2000 (thousands of tons)
West coast
East coast
Southern coast
Total
1998
1999
2000
1998
1999
2000
1998
1999
2000
1998
1999
2000
Export
34 519
34 248
34 671
782
812
860
92 887
97 597
104 368
128 188
132 657
139 899
All dry cargo a
Import 14 793
15 139
15 239
2 437
2 626
2 740
6 973
7 176
7 288
24 203
24 941
25 267
Export
12 065
12 159
12 516
0
0
0
23 648
24 235
26 186
35 713
36 394
38 702
Iron ore
Import
0
0
0
0
0
0
19
20
20
19
20
20
Export
83
96
108
1
1
1
50 919
54 776
59 073
51 003
54 873
59 182
Coal
Import
5
6
6
3
4
4
1 815
1 799
1 824
1 823
1 809
1 834
Export
447
461
481
158
166
173
723
757
764
1 328
1 384
1 418
Grain
Import
3 226
3 521
3 561
1 182
1 356
1 443
1 898
2 108
2 162
6 306
6 985
7 166
Source: Compiled by the UNCTAD secretariat on the basis of data supplied by DRI/McGraw-Hill, World Sea Trade Service Review, 1999; and other specialized sources.
a Non-liner dry cargo
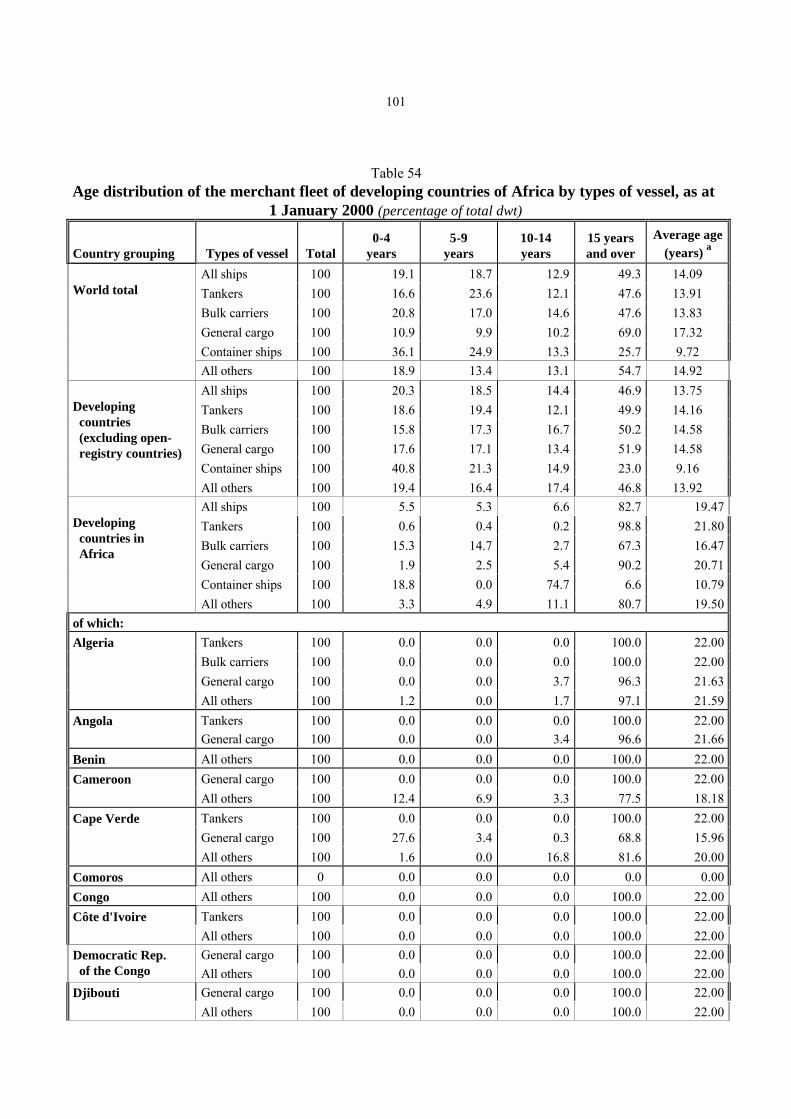
101
Table 54 Age distribution of the merchant fleet of developing countries of Africa by types of vessel, as at
1 January 2000 (percentage of total dwt)
Country grouping
Types of vessel
Total
0-4
years
5-9
years
10-14 years
15 years and over
Average age
(years) a All ships
100
19.1
18.7
12.9
49.3
14.09
Tankers
100
16.6
23.6
12.1
47.6
13.91 Bulk carriers
100
20.8
17.0
14.6
47.6
13.83
General cargo
100
10.9
9.9
10.2
69.0
17.32 Container ships
100
36.1
24.9
13.3
25.7
9.72
World total
All others
100
18.9
13.4
13.1
54.7
14.92
All ships
100
20.3
18.5
14.4
46.9
13.75 Tankers
100
18.6
19.4
12.1
49.9
14.16
Bulk carriers
100
15.8
17.3
16.7
50.2
14.58 General cargo
100
17.6
17.1
13.4
51.9
14.58
Container ships
100
40.8
21.3
14.9
23.0
9.16
Developing countries (excluding open- registry countries)
All others
100
19.4
16.4
17.4
46.8
13.92
All ships
100
5.5
5.3
6.6
82.7
19.47 Tankers
100
0.6
0.4
0.2
98.8
21.80
Bulk carriers
100
15.3
14.7
2.7
67.3
16.47 General cargo
100
1.9
2.5
5.4
90.2
20.71
Container ships
100
18.8
0.0
74.7
6.6
10.79
Developing countries in Africa
All others
100
3.3
4.9
11.1
80.7
19.50
of which: Tankers
100
0.0
0.0
0.0
100.0
22.00
Bulk carriers
100
0.0
0.0
0.0
100.0
22.00 General cargo
100
0.0
0.0
3.7
96.3
21.63
Algeria
All others
100
1.2
0.0
1.7
97.1
21.59
Tankers
100
0.0
0.0
0.0
100.0
22.00 Angola
General cargo
100
0.0
0.0
3.4
96.6
21.66 Benin
All others
100
0.0
0.0
0.0
100.0
22.00
General cargo
100
0.0
0.0
0.0
100.0
22.00 Cameroon
All others
100
12.4
6.9
3.3
77.5
18.18 Tankers
100
0.0
0.0
0.0
100.0
22.00
General cargo
100
27.6
3.4
0.3
68.8
15.96
Cape Verde
All others
100
1.6
0.0
16.8
81.6
20.00
Comoros All others
0
0.0
0.0
0.0
0.0
0.00
Congo All others
100
0.0
0.0
0.0
100.0
22.00
Tankers
100
0.0
0.0
0.0
100.0
22.00 Côte d'Ivoire
All others
100
0.0
0.0
0.0
100.0
22.00 General cargo
100
0.0
0.0
0.0
100.0
22.00
Democratic Rep. of the Congo
All others
100
0.0
0.0
0.0
100.0
22.00
General cargo
100
0.0
0.0
0.0
100.0
22.00 Djibouti
All others
100
0.0
0.0
0.0
100.0
22.00

Table 54 (continued)
102
Country grouping
Types of vessel
Total
0-4
years
5-9
years
10-14 years
15 years and over
Average age
(years) a
Tankers Bulk carriers
100 100
0.0
27.4
0.1
13.5
0.5
31.0
99.4 28.1
21.94 11.40
General cargo
100
3.0
4.7
5.5
86.9
20.17 Container ships
100
100.0
0.0
0.0
0.0
2.00
Egypt
All others
100
5.0
15.8
12.1
67.1
17.42
General cargo
100
0.0
0.0
0.0
100.0
22.00 Equatorial Guinea
All others
100
0.0
0.0
4.4
95.6
21.56 Tankers
100
0.0
0.0
100.0
0.0
12.00
Ethiopia
General cargo
100
0.0
15.6
56.0
28.4
14.06 Tankers
100
0.0
0.0
0.0
100.0
22.00
General cargo
100
0.0
0.0
15.0
85.0
20.50
Gabon
All others
100
0.0
9.3
18.4
72.3
18.77
Gambia All others
100
28.4
0.0
10.1
61.4
15.29
Tankers
100
0.0
0.0
0.0
100.0
22.00 Bulk carriers
100
0.0
0.0
0.0
100.0
22.00
General cargo
100
0.0
0.0
0.0
100.0
22.00
Ghana
All others
100
0.8
1.0
3.0
95.1
21.37
General cargo
100
0.0
0.0
0.0
100.0
22.00 Guinea
All others
100
0.0
0.0
0.0
100.0
22.00 General cargo
100
0.0
0.0
0.0
100.0
22.00
Guinea-Bissau
All others
100
0.0
0.0
9.1
90.9
21.09 Tankers
100
0.0
0.0
0.0
100.0
22.00
General cargo
100
0.0
76.9
0.0
23.1
10.47
Kenya
All others
100
3.0
19.7
2.1
75.1
18.21
Tankers
100
1.7
0.0
0.0
98.3
21.66 General cargo
100
0.0
0.0
21.0
79.0
19.90
Libyan Arab Jamahiriya
All others
100
10.5
27.5
0.8
61.3
15.72
Tankers
100
0.0
0.0
0.0
100.0
22.00 General cargo
100
0.0
0.0
0.0
100.0
22.00
Madagascar
All others
100
6.2
18.3
10.3
65.2
16.99
General cargo
100
0.0
0.0
0.0
100.0
22.00 Mauritania
All others
100
1.0
0.9
22.4
75.7
19.43 General cargo
100
0.0
11.9
0.0
88.1
20.22
Container ships
100
0.0
0.0
100.0
0.0
12.00
Mauritius
All others
100
42.8
0.7
1.4
55.2
13.22
Tankers
100
0.0
32.6
0.0
67.4
17.11 General cargo
100
1.0
4.8
0.0
94.2
21.08
Container ships
100
60.3
0.0
0.0
39.7
9.94
Morocco
All others
100
0.2
9.3
36.3
54.2
16.94
General cargo
100
0.0
6.3
0.0
93.7
21.06 Mozambique
All others
100
3.6
7.6
31.0
57.9
17.06

Table 54 (continued)
103
Country grouping
Types of vessel
Total
0-4
years
5-9
years
10-14 years
15 years and over
Average age
(years) a Tankers
100
0.0
0.0
0.0
100.0
22.00
General cargo
100
6.0
0.0
0.0
94.0
20.80
Nigeria
All others
100
8.5
2.2
3.3
86.0
19.64
St. Helena All others
100
0.0
0.0
0.0
100.0
22.00
Tankers
100
0.0
0.0
0.0
100.0
22.00 General cargo
100
0.0
0.0
0.0
100.0
22.00
Container ships
100
0.0
0.0
0.0
100.0
22.00
Sao Tome and Principe
All others
100
0.0
0.0
0.0
100.0
22.00
General cargo
100
0.0
0.0
49.2
50.8
17.08 Senegal
All others
100
0.0
5.0
8.2
86.8
20.43 General cargo
100
3.9
0.0
0.0
96.1
21.22
Seychelles
All others
100
33.5
59.3
7.2
0.0
5.69 Tankers
100
0.0
0.0
0.0
100.0
22.00
General cargo
100
0.0
0.0
0.0
100.0
22.00
Sierra Leone
All others
100
0.0
13.4
10.5
76.2
18.96
Tankers
100
0.0
0.0
0.0
100.0
22.00 General cargo
100
0.0
0.0
0.0
100.0
22.00
Somalia
All others
100
0.0
0.0
0.0
100.0
22.00
Tankers
100
0.0
0.0
0.0
100.0
22.00 General cargo
100
0.0
0.0
0.0
100.0
22.00
Sudan
All others
100
0.0
0.0
6.3
93.7
21.37
Bulk carriers
100
0.0
0.0
0.0
100.0
22.00 Togo
All others
100
0.0
0.0
11.5
88.5
20.85 Tankers
100
0.0
0.0
0.0
100.0
22.00
Bulk carriers
100
0.0
0.0
0.0
100.0
22.00 General cargo
100
0.0
0.0
0.0
100.0
22.00
Tunisia
All others
100
14.5
0.6
1.0
83.9
18.91
Uganda General cargo
100
0.0
0.0
0.0
100.0
22.00
Tankers
100
0.0
0.0
0.0
100.0
22.00 General cargo
100
0.0
0.0
0.0
100.0
22.00
United Republic of Tanzania
All others
100
6.9
3.9
23.7
65.4
17.64
Source: UNCTAD secretariat on the basis of data supplied by Lloyd's Maritime Information Services (London). a To calculate the average age, it has been assumed that the ages of vessels are distributed evenly between the lower and
upper limit of each age group. For the 15-years-and-over age group, the mid-point has been assumed to be 22 years.

104
D. MOVEMENTS OF CRUDE OIL AND PETROLEUM PRODUCTS
197 Crude oil and petroleum products movements of sub-Saharan Africa are shown in table 55. Crude oil shipments from the West coast represented more than two-thirds of the total, and were mainly exported by Nigeria in West Africa, and the other smaller producers such as Cameroon, the Democratic Republic of the Congo and Gabon in Central Africa. Angola, the second largest oil producing country in sub-Saharan Africa, exported nearly one-fifth of the region's total, dominating the crude oil shipments from the southern coast. By destination of crude oil shipments, nearly half the total was destined for the United States, followed by Northern Europe (a share of nearly a quarter) and Southern Europe (about 10 per cent). Exports of petroleum products, the majority of which are fuels for the United States, were dominated by the West coast (Nigeria), with more than 90 per cent of the total quantity shipped. Imports of petroleum products, which were mainly supplied equally by Northern and Southern Europe, moved through the West coast, and represented nearly 80 per cent of the total imports. E. LINER CARGO MOVEMENTS 198. Table 56 shows movements of containerized liner cargo from 1998 to 2000 between the sub-Saharan African countries (including South Africa) and the three major trading partners (North America, Asia and Europe). Total traffic of both imports (54 per cent) and exports (46 per cent) have increased at an average
annual rate of 2.1 per cent (imports at 0.8 per cent and exports at 3.6 per cent) from 2.0 million TEUs in 1998 to nearly 2.1 million TEUs in 2000, of which approximately half are loaded or discharged on the Southern coast. About two-thirds of the volume through the Southern coast are traded by South Africa. The West coast accounts for about one-third of the total trade volume. 199. In terms of trade partners, trades with Europe, the most important trade partner, have increased at an average annual rate of 2.3 per cent, reaching nearly 60 per cent of the total trade in 2000. The average shares of European trade generated by the western, eastern and southern African subregions were at 44 per cent, 13 per cent and 43 per cent respectively and also represented 70 per cent, 60 per cent and 50 per cent of the total trade transacted by each of the three subregions for the period from 1998 to 2000. For Europe, the import and export ratio was 53 to 47. Trades with North America have been growing slowly (2.0 per cent yearly). The total volume traded in 1998 amounted to 227,000 TEUs, and is estimated to reach 236,000 TEUs in 2000 or 11.4 per cent of the total trade. The regional distribution of North American trade among the West, East and Southern coasts was 30, 10 and 60 per cent respectively, and the ratio between imports and exports was 56 to 44. The trade with Japan, the Far Eastern NIEs and South-East Asia was nearly one-fifth of the total trade, but its share has declined since 1998. The ratio between import and export boxes was almost even, and two-thirds of this trade are with southern Africa (mainly South Africa).
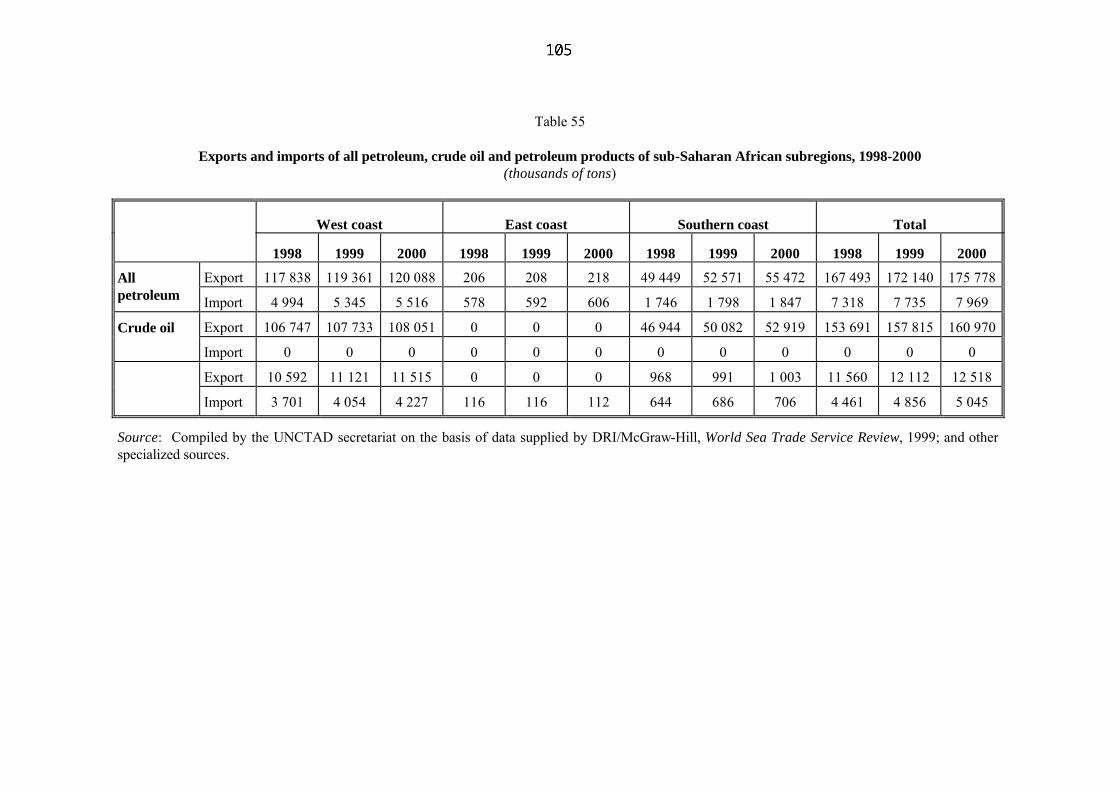
Table 55 Exports and imports of all petroleum, crude oil and petroleum products of sub-Saharan African subregions, 1998-2000 (thousands of tons)
West coast
East coast
Southern coast
Total
1998
1999
2000
1998
1999
2000
1998
1999
2000
1998
1999
2000 Export
117 838
119 361
120 088
206
208
218
49 449
52 571
55 472
167 493
172 140
175 778
All petroleum
Import
4 994
5 345
5 516
578
592
606
1 746
1 798
1 847
7 318
7 735
7 969 Export
106 747
107 733
108 051
0
0
0
46 944
50 082
52 919
153 691
157 815
160 970
Crude oil
Import
0
0
0
0
0
0
0
0
0
0
0
0
Export
10 592
11 121
11 515
0
0
0
968
991
1 003
11 560
12 112
12 518
Import
3 701
4 054
4 227
116
116
112
644
686
706
4 461
4 856
5 045
Source: Compiled by the UNCTAD secretariat on the basis of data supplied by DRI/McGraw-Hill, World Sea Trade Service Review, 1999; and other specialized sources.

Table 56
Liner cargo movements (containerized) between the West, East and Southern coasts of sub-Saharan Africa and country groups of major trading partners,
and all countries of the world, 1998-2000 (thousands of TEUs)
West coast of Africa
East coast of Africa
Southern Africa
a
Total
1998
1999
2000
1998
1999
2000
1998
1999
2000
1998
1999
2000
In
17
18
19
6
6
6
54
57
59
77
81
84
Out
39
39
38
15
14
14
63
64
64
117
117
116
United States
Subtotal
56
57
57
21
20
20
117
121
123
194
198
200
In
8
8
9
1
1
1
8
9
9
17
18
19 Out
5
5
5
3
3
3
8
9
9
16
17
17
Canada
Subtotal
13
13
14
4
4
4
16
18
18
33
35
36
In
25
26
28
7
7
7
62
66
68
94
99
103 Out
44
44
43
18
17
17
71
73
73
133
134
133
Subtotal
Subtotal
69
70
71
25
24
24
133
139
141
227
233
236
In
6
6
5
5
4
4
49
49
48
60
59
57 Out
7
6
6
4
3
4
25
23
23
36
32
33
Japan
Subtotal
13
12
11
9
7
8
74
72
71
96
91
90
In
10
11
11
3
3
3
55
54
55
68
68
69 Out
18
16
17
9
8
9
46
42
43
73
66
69
Far Eastern NIEs
Subtotal
28
27
28
12
11
12
101
96
98
141
134
138

West coast of Africa
East coast of Africa
Southern Africa
a
Total
1998
1999
2000
1998
1999
2000
1998
1999
2000
1998
1999
2000
In
18
18
20
7
8
8
35
34
37
60
60
65
Out
41
39
40
16
16
17
37
37
39
94
92
96
South-East Asia
Subtotal
59
57
60
23
24
25
72
71
76
154
152
161
In
34
35
36
15
15
15
139
137
140
188
187
191 Out
66
61
63
29
27
30
108
102
105
203
190
198
Subtotal
Subtotal
100
96
99
44
42
45
247
239
245
391
377
389
In
162
166
172
54
56
57
179
188
197
395
410
426 Out
227
227
226
55
55
56
185
187
190
467
469
472
Northern Europe
Subtotal
389
393
398
109
111
113
364
375
387
862
879
898
In
55
58
60
18
19
20
53
56
58
126
133
138 Out
66
69
69
21
22
22
67
68
68
154
159
159
Southern Europe
Subtotal
121
127
129
39
41
42
120
124
126
280
292
297
In
217
224
232
72
75
77
232
244
255
521
543
564 Out
293
296
295
76
77
78
252
255
258
621
628
631
Subtotal
Subtotal
510
520
527
148
152
155
484
499
513
1 142
1 171
1 195
In
276
285
296
94
97
99
433
447
463
803
829
858
Out
403
401
401
123
121
125
431
430
436
957
952
962
Total
Total
679
686
697
217
218
224
864
877
899
1 760
1 781
1 820
In
296
306
318
103
106
110
494
509
529
893
921
957 Out
448
449
450
144
145
149
506
508
517
1 098
1 102
1 116
World total
Total
744
755
768
247
251
259
1 000
1 017
1 046
1 991
2 023
2 073
Source: Compiled by the UNCTAD secretariat on the basis of data supplied by DRI/McGraw-Hill, World Sea Trade Service Review, Fourth Quarter, 1999. a Including South Africa.
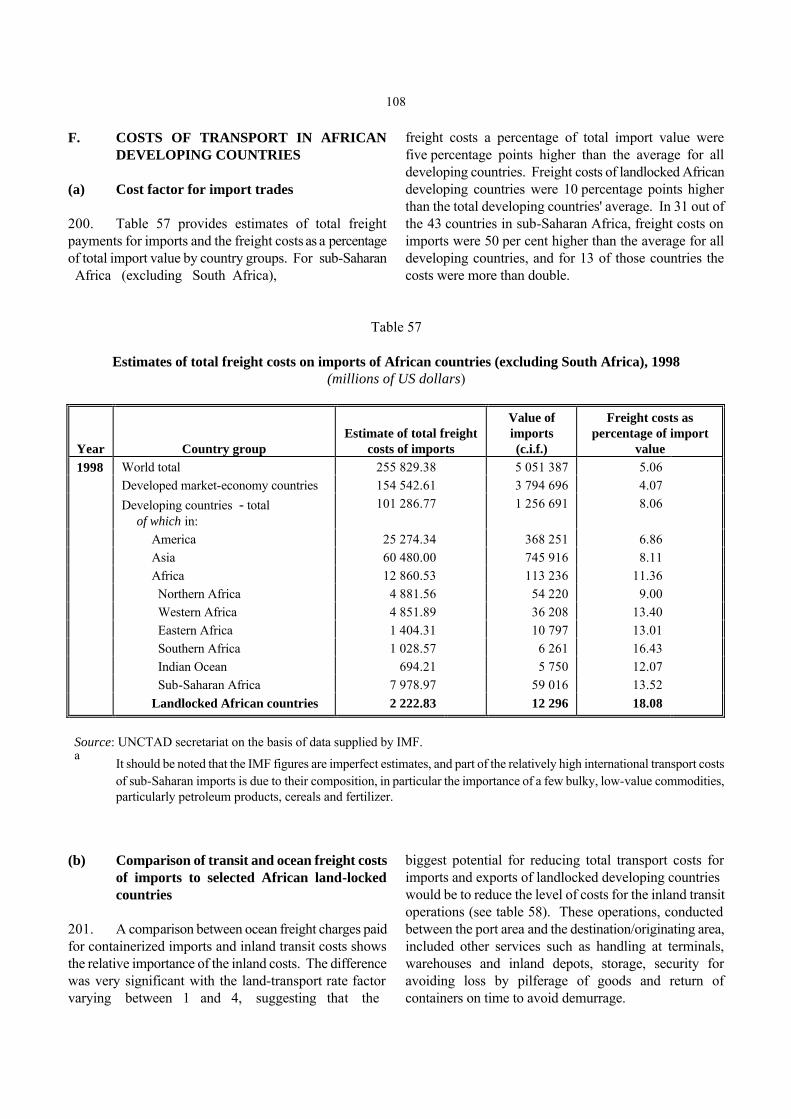
108
F. COSTS OF TRANSPORT IN AFRICAN DEVELOPING COUNTRIES
(a) Cost factor for import trades 200. Table 57 provides estimates of total freight payments for imports and the freight costs as a percentage of total import value by country groups. For sub-Saharan Africa (excluding South Africa),
freight costs a percentage of total import value were five percentage points higher than the average for all developing countries. Freight costs of landlocked African developing countries were 10 percentage points higher than the total developing countries' average. In 31 out of the 43 countries in sub-Saharan Africa, freight costs on imports were 50 per cent higher than the average for all developing countries, and for 13 of those countries the costs were more than double.
Table 57 Estimates of total freight costs on imports of African countries (excluding South Africa), 1998 (millions of US dollars)
Year
Country group
Estimate of total freight
costs of imports
Value of imports (c.i.f.)
Freight costs as
percentage of import value
World total
255 829.38
5 051 387
5.06
Developed market-economy countries
154 542.61
3 794 696
4.07
Developing countries - total of which in:
101 286.77
1 256 691
8.06
America
25 274.34
368 251
6.86
Asia
60 480.00
745 916
8.11
Africa
12 860.53
113 236
11.36
Northern Africa
4 881.56
54 220
9.00
Western Africa
4 851.89
36 208
13.40
Eastern Africa
1 404.31
10 797
13.01
Southern Africa
1 028.57
6 261
16.43
Indian Ocean
694.21
5 750
12.07
Sub-Saharan Africa
7 978.97
59 016
13.52
1998
Landlocked African countries
2 222.83
12 296
18.08
Source: UNCTAD secretariat on the basis of data supplied by IMF. a
It should be noted that the IMF figures are imperfect estimates, and part of the relatively high international transport costs of sub-Saharan imports is due to their composition, in particular the importance of a few bulky, low-value commodities, particularly petroleum products, cereals and fertilizer.
(b) Comparison of transit and ocean freight costs
of imports to selected African land-locked countries
201. A comparison between ocean freight charges paid for containerized imports and inland transit costs shows the relative importance of the inland costs. The difference was very significant with the land-transport rate factor varying between 1 and 4, suggesting tha t the
biggest potential for reducing total transport costs for imports and exports of landlocked developing countries would be to reduce the level of costs for the inland transit operations (see table 58). These operations, conducted between the port area and the destination/originating area, included other services such as handling at terminals, warehouses and inland depots, storage, security for avoiding loss by pilferage of goods and return of containers on time to avoid demurrage.

Table 58 Comparison of transit and ocean freight costs of imports to selected African landlocked countries from north-western Europe, 1999 (US dollars per TEU)
Approximate land transit distance and freight
rate
Approximate ocean freight rate
Distance (km)
Mode
Freight rate
(US$)
Port
Freight rate
(US$) Ndola (Zambia)
3 119
Rail
4 174
Durban (South Africa)
1 125
3.7
Ndola (Zambia)
1 424
Road
3 751
Beira (Mozambique)
1 050
3.5
Blantyre (Malawi)
825
Road
3 360
Beira (Mozambique)
1 200
2.8
Kigali (Rwanda)
1 867
Road
4 400
Mombasa (Kenya)
1 350
3.3
Kampala (Uganda)
1 187
Road
1 375
Mombasa (Kenya)
1 200
1.2
Ouagadougou (Burkina Faso)
1 192
Road
1 192 a
Abidjan (Côte d'Ivoire)
1 250
0.9
Niamey (Niger)
1 170
Road
2 500
Lomé (Togo)
1 350
1.6
Source: UNCTAD secretariat. a Charges for loading/discharging to/from vehicles at port area are not included.

110
(c) Freight costs in selected landlocked countries in Africa
202. Landlocked developing countries in Africa continued to suffer from excessive transport costs. High import transport costs inflated the consumer prices of imported goods, and high transport costs for exports undermined their competitiveness in foreign markets.
International transport costs are defined as the direct and indirect costs which are incidental to the transportation of goods from their point of loading to their destinations. The major elements accounting for the high freight costs for landlocked developing countries included inefficient transport facilities and their management, imbalanced trades, inadequate overall infrastructure, and inefficient or cumbersome government regulations (see table 59).
Table 59
Estimates of total freight costs of total import value in world trade by selected African landlocked countries, 1998
(millions of US dollars)
Estimate of total freight
costs of imports
Total import
value
Freight costs as percentage
of import value West Africa
Burkina Faso
138.89
641
21.67
Mali
365.79
1 237
29.57
Niger
91.52
630
14.53
East Africa
Burundi
20.17
157
12.85
Rwanda
85.53
286
29.91
Uganda
86.88
890
9.76
Southern Africa
Malawi
319.63
811
39.41
Zambia
183.70
1 119
16.42
Zimbabwe
381.71
2 971
12.85
Source: UNCTAD secretariat on the basis of data supplied by IMF.

111
G. IMPROVING TRANSPORT OPERATIONS AND SERVICES THROUGH ACIS
203. As a response to high transport costs and low operational efficiency on African transport routes, the UNCTAD secretariat has developed the Advance Cargo Information System (ACIS), an IT-based tracking system designed to improve transport operations and services to customers. ACIS gives information on cargo in advance of its arrival across different modes and interfaces. By making appropriate information available, ACIS allows the effective logistics management of a transport chain. It is composed of a railway system called RailTracker, PortTracker for ports, LakeTracker for lakes, and RoadTracker which is still under development. 204. RailTracker is a computerized wagon, loco-motive and train reporting system that tracks cargo and wagons throughout their movement. It thus increases the efficiency of freight operations, enabling railways to plan the movement of wagons much more effectively by always knowing where the wagons are, and whether they are fit for running, empty or loaded. This improves the short-term train planning by providing information on when empties will be available. In addition, based on up-to-date records of usage of equipment, it enhances the planning of maintenance of rolling stock and loco-motives. RailTracker also enables the railways to satisfy customer's requests for information about the where-abouts of their goods at any given time and generates statistics and performance indicators for decision making. 205. Tanzania Railways Corporation (TRC) is one of the railways on which RailTracker has been successfully installed.13 While it has provided customers with current information on the location of their consignments, the system has provided TRC management with useful information enabling them to better serve customers. The successful installation and implementation of the RailTracker computer system has had significant benefits to TRC at both strategic and tactical management levels. The major achievements of the information system have been: (a) Reduction of:
(i) Wagon turn-around time from an average of 18 days in 1994 to currently 13 days;
(ii) Wagon detention at terminals from an average of 8 days to 4 days;
(iii) Average daily interchange balance from 203 to 108 wagons;
(iv) Average dwell time of foreign wagons from an average of 28 days to 12 days;
(v) Locomotive detention at terminal and in transit yards;
(vi) Transit times from an average of 15 days to 3 days.
(b) Increase of:
(i) Locomotive and wagon utilization, when in use, from 280 km per day to 380 km for locomotives and from 73 km per day to 120 km for wagons;
(ii) Wagon productivity from an average of 20 loadings to 28 loadings per annum.
(c) Production of on-time performance statistics which allow the development of strategies for improve-ment of the business and organization in general. (d) Commercial benefits:
(i) The ability to respect delivery times, either agreed with customers or set by TRC, through daily monitoring of wagon movements;
(ii) The ability to inform customers of the status and position of their cargo while on the TRC network;14
(iii) The more reliable supply of wagons to customers through the ability to trace and control wagons;
(iv) Daily information on payments received and outstanding, assists in the control of cash flow and allocation of equipment;
(v) Daily freight loading statistics assist in meeting weekly targets.
206. RailTracker has contributed to improving services to TRC customers and utilization of rolling stock. Surveys done by TRC on customer needs have indicated that the second most important requirement was information on the location of cargo. RailTracker has provided a tool to allow TRC to progress from the days of "ask tomorrow" to nearly perfect information on the location of cargo. The improvements in information systems, together with other corporate strategies, has enabled TRC to increase and sustain their market share for services compared to the low demand of the early 1990s.

112
Box 4 Transit transport services accessing to sea ports in selected landlocked countries in Africa West Africa Burkina Faso
As a landlocked country, with the nearest coastal ports in neighbouring Côte d'Ivoire, Ghana and Togo, Burkina Faso's transport costs are a significant consideration for any business with export or import activities. The Government is undertaking a $360 million transport sector development programme, funded by the World Bank, which aims to develop a coherent transport policy and regulatory framework, rehabilitate the road and rail networks, and restructure the transport parastatals. There are 12,100 km of road networks, but only 16 per cent are paved. Some 90 per cent of the transport programme's funds have thus been allocated to road maintenance and construction. Mali
Even by regional standards, transport communications are poor, especially in the isolated western region. This region is only linked to Bamako by the extremely dilapidated railway line between Bamako and Dakar (Senegal), which has been virtually unchanged since its completion in 1924. Road transport in the north has been further disrupted by a conflict. A five-year $250 million road maintenance programme repair scheme is under way, mostly funded by donors. Total road networks represent 15,100 km, but only12.1 per cent of which are paved. Niger
Despite considerable donor-funded expansion work, Niger's transport system remains inadequate. In 1994, for example, less than 8 per cent of the country's road network (10,100 km) was paved, although access to neighbouring countries has improved following work on the 428-km road between Zinder and Agadès, which is scheduled to form part of the trans-Sahara highway. Although there is no railway system as yet, the emphasis in transport development is on diversifying and improving access to seaports: as a landlocked country, Niger has to rely on the ports of Lomé (Togo) and Tema (Ghana) for its maritime transport. Eastern Africa Burundi
Burundi has no railways and 14,500 km of roads, 7 per cent of which are paved. Burundi's main export routes are by road to Mombasa (Kenya) via Rwanda and Uganda, and to Dar es Salaam (United Republic of Tanzania). The road to Mombasa is better, although the Tanzanian route crosses only one border. The Burundi transport parastatal, Otraco, is barely surviving. The once vibrant privately-owned public transport sector has been harmed since 1993 by increased insecurity on most routes, fuel price increases and shortages of spare parts. Rwanda
Nearly all of Rwanda's imports and exports travel over 1,500 km to Mombasa (Kenya) and Dar es Salaam (United Republic of Tanzania) via the region's road network. This keeps transport costs high, particularly since new weight limits for freight travelling through East Africa were imposed in 1998 and 1999. Rwanda's arterial roads are serviceable and better than their Ugandan and Tanzanian counterparts. Rwanda has about 1,200 km of tarred roads and another 12,000 km of unpaved main and secondary roads, which are vulnerable to damage from heavy rain. After years of State control, commercial transport is now largely in private hands.

Box 4 (continued)
113
Uganda
The road network was earmarked for priority spending, not only on the major routes, but also on rural feeder roads, because of their importance in agricultural marketing. Landlocked Uganda is heavily dependent on transport links through Kenya and most of its foreign trade passes through Mombasa. The Government wants to reduce this dependence by developing links through the United Republic of Tanzania, via the lake port of Mwanja. Huge progress has been made in the road rehabilitation programme. Major trunk roads, such as the "northern corridor" route, have been completely resurfaced, and the condition of most urban and regional roads is much improved (although funding for upkeep is a problem). The road transport system still suffers from a shortage of vehicles and spares, but the situation is improving rapidly, with about 126,214 vehicles in use in 1996 compared with 31,000 in 1987.
Competition for business between the ocean ports of Mombasa and Dar es Salaam has produced some benefits for Uganda's traders. The Tanzanian port has attracted business from Mombasa by cutting down transit times from 10-14 days to 5-10 days, granting a 60-day moratorium on demurrage and opening shipping offices in Kampala. Goods shipped through Dar es Salaam use the Tanzanian railway link to Mwanza, from where there is a wagon ferry link to Port Bell almost daily. In response, the Kenyan authorities have introduced more trains between Kampala and Mombasa, which now run on a daily basis, subject to cargo availability. Meanwhile, a scheme to open a third route to the Indian Ocean, between Kampala, and Durban in South Africa, is suffering delays. Southern Africa Malawi
As a landlocked country highly dependent on overland movement of exports and imports, Malawi's transport network and its connections to neighbouring countries is of the utmost economic importance. The shortest, cheapest trade routes are to the Mozambican ports of Nacala and Beira. Until 1982 around 95 per cent of Malawi's trade passed through those two ports, but throughout the 1980s and early 1990s the Mozambican civil war severely disrupted these crucial external trade routes, forcing much of the export and import traffic to be routed through distant ports in South Africa and the United Republic of Tanzania. Total transport costs increased by $50 million to $75 million per year, with insurance and freight costs rising from around 20 per cent of the cif import value in the early 1980s to 40 per cent by the later 1980s and only falling to 35-40 per cent in the mid-1990s.
The end of the hostilities in Mozambique should benefit Malawi in the form of shorter and cheaper rail and road routes to the ports on the Mozambican coast. Railway routes in Mozambique sustained severe damage during the civil war and comprehensive rehabilitation on both sides of the border has been slow despite World Bank financing. The improved security situation in Mozambique has already led to a rise in traffic through Beira port, although traffic on the railway line between Blantyre and Beira has not increased significantly.
Malawi's domestic road network is inadequate. At the time of independence in 1964 the country had 10,124 km of roads, of which only 431 km were bitumen-paved. By 1985 the road network had increased to only 11,051 km, although the length of bitumen roads had increased to 2,061 km. By 1999 the road system had been expanded to 16,500 km, 19 per cent of which were paved.

Box 4 (continued)
114
Zambia
Zambian post-independence transport policy has primarily been concerned with securing access to regional ports. Beira in Mozambique is the nearest major port and is linked by rail to Lusaka, via Harare in Zimbabwe. Further away, but better equipped and also accessible by rail, is Durban (South Africa). Dar es Salaam (United Republic of Tanzania), which was extensively used for Zambian trade when Beira and Durban were inaccessible for political reasons, has recently experienced a shrinking of its market share, but continues to handle around 70 per cent of Zambia's exports and 40 per cent of its imports.
Zambia has 66,800 km of roads, of which approximately 12,000 km are paved. The road network was in poor condition, but in 1998 the National Roads Board announced a $1 billion investment programme for the road sector, to run for 10 years. Money for this is derived from donors, a fuel levy and counterpart funding, but some form of user charges are also envisaged. Zimbabwe
Zimbabwe is a landlocked country with a well-developed road network that includes 15,000 km of tarred roads. Its closest access to the sea which is the port of Beira, lies eastwards through Mozambique. From the mid-1960s until the mid-1980s successive border closures, first by Zambia and then by Mozambique, followed by South Africa's destabilization war in Mozambique, forced Zimbabwe to reroute nearly all its overseas traffic through distant South African ports. With the return of peace, Beira has slowly regained its former importance.
Zimbabwe has a direct rail link with Zambia via the Victoria Falls, which in theory continues to the Tanzanian port of Dar es Salaam; in addition, there are two links with Mozambique, to the ports of Beira and Maputo, and two links with South Africa, one through Botswana, the other via Beitbridge. Another link is planned between Beitbridge and Bulawayo. The National Railways of Zimbabwe (NRZ) has been reformed with the aid of the World Bank. It is now required to operate commercially in preparation for privatization. Source: EIU (The Economic Intelligence Unit), Country Profile and Country Report, various issues, 1999 and 2000; and UNCTAD secretariat report, The Least Developed Countries 2000 Report, (UNCTAD/LDC/2000).
115
Notes
1. This section is based on UNCTAD's analysis of the world economic performance and prospects contained in UNCTAD, Trade and Development Report, 2000, New York and Geneva, 2000.
2. Figures given by individual companies and national estimates are not comparable,since spending on hardward replacement, for example, is not always included. Estimates higher than the $600 billion given by the Gartner Group include $675 billion by Software Productivity Research and $1,200 billion by Cap Gemini.
3. Energy Intelligence Group.
4. International Iron and Steel Institute, London.
5. International Bulk Journal, various issues.
6. International Bulk Journal, various issues; DRI/McGraw Hill, World Sea Trade Service Review, 1999; Fearnleys (Oslo), Review 1999.
7. International Bulk Journal, various issues; DRI/McGraw Hill, World Sea Trade Service Review, 1999; Fearnleys (Oslo), Review 1999.
8. International Bulk Journal, various issues; International Wheat Council, Grain Market Report, March 1999; DRI/McGraw Hill, World Sea Trade Service Review, 1999; Fearnleys (Oslo), Review 1999.
9. DRI/McGraw Hill, World Sea Trade Service Review, 1999; various specialized sources.
10. International Bulk Journal, various issues; Fearnleys (Oslo), Review 1999; Drewry Shipping Consultants, Shipping Statistics and Economics, various issues; and various other specialized sources.
11. International Bulk Journal, various issues; Fearnleys (Oslo), Review 1999; Drewry Shipping Consultants, Shipping Statistics and Economics, various issues; and various other specialized sources.
12. International Bulk Journal, various issues; Fearnleys (Oslo), Review 1999; Drewry Shipping Consultants, Shipping Statistics and Economics, various issues; and various other specialized sources.
13. The examples have been complied on the basis of information published on the Internet by the enterprises concerned. While not based on a direct survey of the enterprises, the information is nevertheless considered to be meaningful.
14. See www.nte.com
15. See www.celarix.com
16. See www.freightdesk.com
17. See www.carrierpoint.com
116
18. See www.tranzlink.com
19. See www.e-transport.com
20. See UNCTAD report Legal Dimensions of Electronic Commerce (TD/B/COM.3/EM.8/2), 4 May 1999.
21. See paras. 32 - 35 of the Report of the Expert Meeting.
22. Ibid, as regards the Agreed Conclusions and Recommendations, paras. 4 - 13.
23. Based on a paper presented by the Chief Commercial Manager, Tanzanian Railways Corporation, at the International IRCH/UIC Railway Seminar held in Stockholm, Sweden in July 1999.
24. RailTracker enables a customer to view the location of his cargo directly through the Internet or by direct connection to the system via leased communication lines.

117
Annex I Classification of countries and territories Code 1
Canada
United States of America
Code 2
Austria Belgium Denmark Faeroe Islands Finland France Germany Gibraltar Greece Iceland Ireland Israel
Italy Luxembourg Monaco Netherlands Norway Portugal Spain Sweden Switzerland Turkey United Kingdom of Great Britain and Northern Ireland
Code 3
Japan
Code 4
Australia
New Zealand
Code 5
South Africa
Code 6
Albania Armenia Azerbaijan Belarus Bulgaria Czech Republic Estonia Georgia Hungary Kazakhstan Kyrgyzstan
Latvia Lithuania Moldova Poland Romania Russian Federation Slovakia Tajikistan Turkmenistan Ukraine Uzbekistan
Code 7
China Democratic People's Republic of Korea
Viet Nam
Code 8 – 8.1
Northern Africa Algeria Egypt Libyan Arab Jamahiriya
Morocco Tunisia

118
Code 8.2
Western Africa Angola Benin Burkina Faso Cameroon Cape Verde Congo Côte d'Ivoire Democratic Republic of the Congo Equatorial Guinea Gabon Gambia Ghana
Guinea Guinea-Bissau Liberia Mali Mauritania Nigeria St. Helena Sao Tome and Principe Senegal Sierra Leone Togo
Code 8.3
Eastern Africa Burundi Comoros Djibouti Eritrea Ethiopia Kenya Madagascar Malawi Mauritius
Mozambique Reunion Seychelles Somalia Sudan Uganda United Republic of Tanzania Zambia
Code 9 – 9.1
Caribbean and North America Anguilla Antigua and Barbuda Aruba Bahamas Barbados Bermuda British Virgin Islands Cayman Islands Cuba Dominica Dominican Republic Greenland Grenada
Guadeloupe Haiti Jamaica Martinique Montserrat St. Pierre and Miquelon Saint Kitts and Nevis Saint Lucia Saint Vincent and the Grenadines Trinidad and Tobago Turks and Caicos Islands United States Virgin Islands
Code 9.2
Central America Belize Costa Rica El Salvador Guatemala
Honduras Mexico Nicaragua Panama
Code 9.3
South America — Northern Seaboard Guyana French Guyana Netherlands Antilles
Suriname Venezuela

119
Code 9.4 South America - Western Seaboard
Chile Colombia
Ecuador Peru
Code 9.5
South America - Eastern Seaboard Argentina Bolivia Brazil
Falkland Islands (Malvinas) a Paraguay Uruguay
Code 10 - 10.1
Western Asia Bahrain Cyprus Iran, Islamic Republic of Iraq Jordan Kuwait Lebanon
Oman Qatar Saudi Arabia Syrian Arab Republic United Arab Emirates Yemen
Code 10.2
Southern and Eastern Asia Bangladesh Bhutan Brunei Darussalam Cambodia Hong Kong, China India Indonesia Macau, China Malaysia
Maldives Myanmar Pakistan Philippines Republic of Korea Singapore Sri Lanka Thailand
Code 11 Bosnia and Herzegovina Croatia Malta
Slovenia Yugoslavia
Code 12
American Samoa Christmas Island (Australia) Fiji French Polynesia Guam Kiribati Nauru New Caledonia
Papua New Guinea Samoa Solomon Islands Tonga Tuvalu Vanuatu Wake Island
a A dispute exists between the Governments of Argentina and of the United Kingdom of Great Britain and Northern Ireland concerning sovereignty over the Falkland Islands (Malvinas).
120
Notes to Annex I (1) This classification is for statistical purposes only and does not imply any judgement regarding the stage
of development and the political situation of any country or territory. (2) The groups of countries or territories used for presenting statistics in this Review are made up as follows:
Developed market-economy countries and territories: Codes 1, 2, 3, 4 and 5.
Countries of Central and Eastern Europe and Republics of the former Soviet Union: Code 6.
Socialist countries of Asia: Code 7.
Developing countries and territories: Codes 8, 9, 10, 11 and 12.
of which: in Africa: Codes 8.1, 8.2 and 8.3 in America: Codes 9.1, 9.2, 9.3, 9.4 and 9.5 in Asia: Codes 10.1 and 10.2 in Europe: Code 11 in Oceania: Code 12.
(3) In certain tables, where appropriate, major open-registry countries are recorded as a separate group. The
group comprises Bahamas, Bermuda, Cyprus, Liberia, Malta, Panama and Vanuatu. (4) Trade statistics are based on data recorded at the ports of loading and unloading. Trade originating in or
destined for neighbouring countries is attributed to the country in which the ports are situated; for this reason, landlocked countries do not figure in these tabulations. On the other hand, statistical tabulations on merchant fleets include data for landlocked countries that possess fleets.
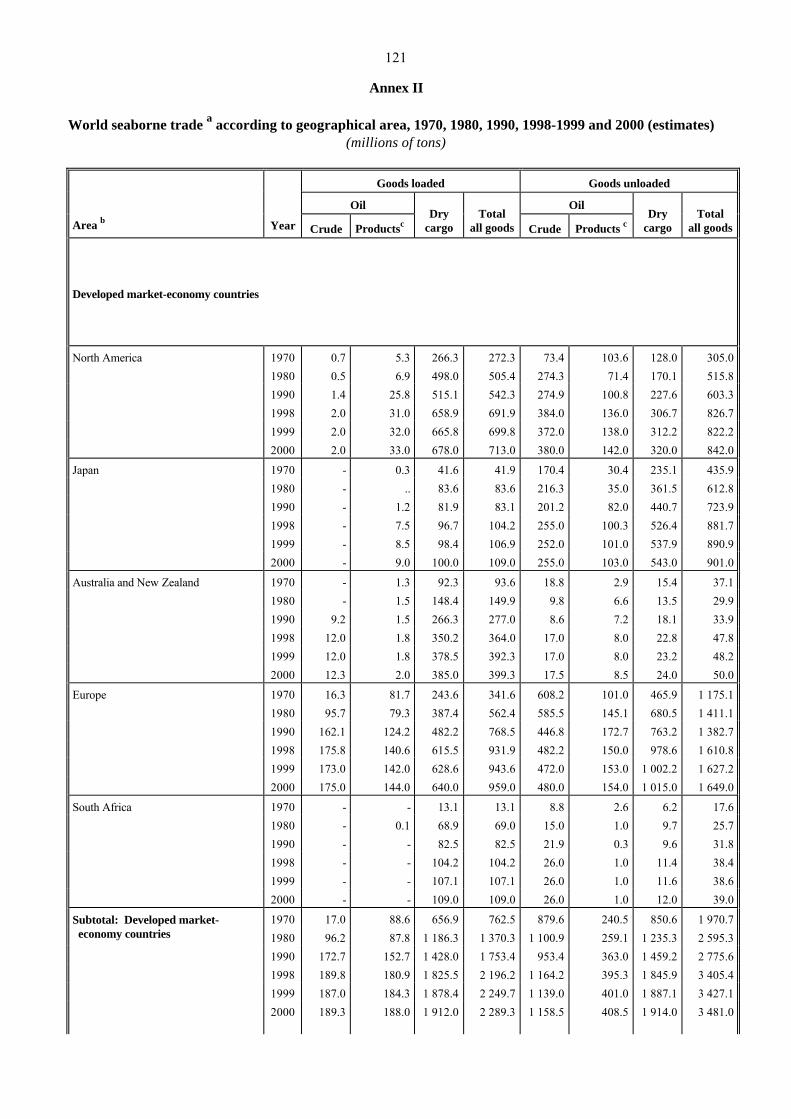
121
Annex II World seaborne trade a according to geographical area, 1970, 1980, 1990, 1998-1999 and 2000 (estimates) (millions of tons)
Goods loaded
Goods unloaded
Oil
Oil
Area b Year
Crude Productsc
Dry
cargo
Total
all goods Crude
Products c
Dry
cargo
Total
all goods Developed market-economy countries North America
1970
0.7
5.3
266.3
272.3
73.4
103.6
128.0
305.0
1980
0.5
6.9
498.0
505.4
274.3
71.4
170.1
515.8
1990
1.4
25.8
515.1
542.3
274.9
100.8
227.6
603.3
1998
2.0
31.0
658.9
691.9
384.0
136.0
306.7
826.7
1999
2.0
32.0
665.8
699.8
372.0
138.0
312.2
822.2
2000
2.0
33.0
678.0
713.0
380.0
142.0
320.0
842.0
Japan
1970
-
0.3
41.6
41.9
170.4
30.4
235.1
435.9
1980
-
..
83.6
83.6
216.3
35.0
361.5
612.8
1990
-
1.2
81.9
83.1
201.2
82.0
440.7
723.9
1998
-
7.5
96.7
104.2
255.0
100.3
526.4
881.7
1999
-
8.5
98.4
106.9
252.0
101.0
537.9
890.9
2000
-
9.0
100.0
109.0
255.0
103.0
543.0
901.0
Australia and New Zealand
1970
-
1.3
92.3
93.6
18.8
2.9
15.4
37.1
1980
-
1.5
148.4
149.9
9.8
6.6
13.5
29.9
1990
9.2
1.5
266.3
277.0
8.6
7.2
18.1
33.9
1998
12.0
1.8
350.2
364.0
17.0
8.0
22.8
47.8
1999
12.0
1.8
378.5
392.3
17.0
8.0
23.2
48.2
2000
12.3
2.0
385.0
399.3
17.5
8.5
24.0
50.0
Europe
1970
16.3
81.7
243.6
341.6
608.2
101.0
465.9
1 175.1
1980
95.7
79.3
387.4
562.4
585.5
145.1
680.5
1 411.1
1990
162.1
124.2
482.2
768.5
446.8
172.7
763.2
1 382.7
1998
175.8
140.6
615.5
931.9
482.2
150.0
978.6
1 610.8
1999
173.0
142.0
628.6
943.6
472.0
153.0
1 002.2
1 627.2
2000
175.0
144.0
640.0
959.0
480.0
154.0
1 015.0
1 649.0
South Africa
1970
-
-
13.1
13.1
8.8
2.6
6.2
17.6
1980
-
0.1
68.9
69.0
15.0
1.0
9.7
25.7
1990
-
-
82.5
82.5
21.9
0.3
9.6
31.8
1998
-
-
104.2
104.2
26.0
1.0
11.4
38.4
1999
-
-
107.1
107.1
26.0
1.0
11.6
38.6
2000
-
-
109.0
109.0
26.0
1.0
12.0
39.0
1970
17.0
88.6
656.9
762.5
879.6
240.5
850.6
1 970.7
1980
96.2
87.8 1 186.3
1 370.3
1 100.9
259.1
1 235.3
2 595.3
1990
172.7
152.7 1 428.0
1 753.4
953.4
363.0
1 459.2
2 775.6
1998
189.8
180.9 1 825.5
2 196.2
1 164.2
395.3
1 845.9
3 405.4
1999
187.0
184.3 1 878.4
2 249.7
1 139.0
401.0
1 887.1
3 427.1
Subtotal: Developed market- economy countries
2000
189.3
188.0
1 912.0
2 289.3
1 158.5
408.5
1 914.0
3 481.0

122
Goods loaded
Goods unloaded
Oil
Oil
Area b Year
Crude Productsc
Dry
cargo
Total
all goods Crude
Products c
Dry
cargo
Total
all goods Countries of Central and Eastern Europe
1970
38.2
26.3
80.8
145.3
13.3
3.0
41.1
57.4
1980
55.0
50.2
95.6
200.8
35.5
1.3
108.6
145.4 1990
58.6
55.3
85.2
199.1
34.2
1.3
137.2
172.7
1998
45.0
52.0
92.0
189.0
23.0
1.3
137.2
161.5 1999
46.0
52.5
93.7
192.2
23.0
1.3
139.7
164.0
Countries of Central and Eastern Europe (including the Former USSR)
2000
46.0
53.0
96.0
195.0
23.5
1.3
144.0
168.8
Socialist countries of Asia Socialist countries of Asia d
1970
-
0.1
13.3
13.4
5.4
0.4
24.4
30.2
1980
22.1
5.7
18.3
46.1
21.6
5.1
72.9
99.6
1990
32.0
4.0
46.1
82.1
23.9
21.3
80.4
125.6
1998
24.0
5.0
66.1
95.1
39.0
33.1
107.3
179.4
1999
24.5
7.0
67.3
98.8
39.0
35.0
114.2
188.2
2000
24.5
7.0
70.0
101.5
40.0
36.0
117.0
193.0 Developing countries and territories
1970
221.4
5.6
28.3
255.3
9.9
5.9
17.9
33.7
1980
187.7
2.5
30.0
220.2
50.0
2.0
44.9
96.9 1990
182.7
31.5
32.0
246.2
63.4
4.3
57.8
125.5
1998
231.8
25.0
36.0
292.8
69.0
4.5
66.5
140.0 1999
227.0
25.5
36.6
289.1
69.0
4.5
67.7
141.2
Northern Africa
2000
230.0
26.0
38.0
294.0
70.0
4.5
68.0
142.5
1970
60.5
1.0
61.5
123.0
3.6
4.0
14.8
22.4 1980
102.6
1.9
66.8
171.3
4.3
5.5
30.8
40.6
1990
127.1
3.4
55.2
185.7
4.0
3.2
27.7
34.9 1998
141.0
3.5
62.7
207.2
4.5
3.2
32.1
39.8
1999
136.0
3.5
63.8
203.3
4.5
3.2
32.7
40.4
Western Africa
2000
140.0
4.0
65.0
209.0
4.6
3.5
33.0
41.1
1970
-
1.2
16.1
17.3
5.5
2.6
8.3
16.4 1980
-
0.9
6.3
7.2
6.2
2.0
9.9
18.1
1990
-
0.6
9.3
9.9
6.4
2.6
16.0
25.0 1998
-
0.5
10.6
11.1
7.0
3.0
17.6
27.6
1999
-
0.5
10.8
11.3
7.0
3.0
17.9
27.9
Eastern Africa
2000
-
0.5
11.0
11.5
7.1
3.1
18.0
28.2
1970
281.9
7.8
105.9
395.6
19.0
12.5
41.0
72.5
1980
290.3
5.3
103.1
398.7
60.5
9.5
85.6
155.6 1990
309.8
35.5
96.5
441.8
73.8
10.1
101.5
185.4
1998
372.8
29.0
109.3
511.1
80.5
10.7
116.2
207.4 1999
363.0
29.5
111.2
503.7
80.5
10.7
118.3
209.5
Subtotal: Developing countries in Africa
2000
370.0
30.5
114.0
514.5
81.7
11.1
119.0
211.8
Developing countries in America
1970
-
5.1
40.3
45.4
29.5
10.0
17.7
57.2 1980
53.5
29.6
53.5
136.6
62.8
8.9
30.2
101.9
1990
95.3
18.8
47.5
161.6
33.7
11.2
35.4
80.3 1998
142.0
30.0
59.7
231.7
37.0
11.5
43.7
92.2
1999
138.0
31.0
60.8
229.8
37.0
12.0
45.0
94.0
Caribbean, Central and North America
2000
140.0
32.0
62.0
234.0
38.0
12.0
46.0
96.0
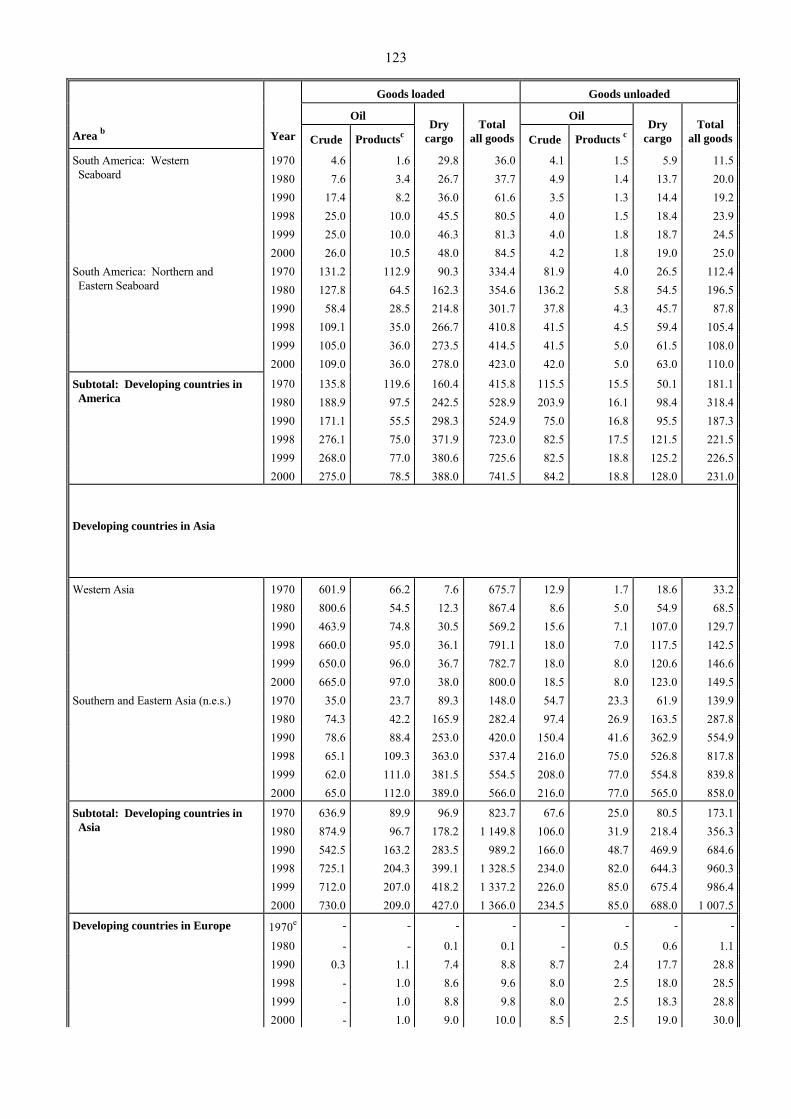
123
Goods loaded
Goods unloaded
Oil
Oil
Area b Year
Crude Productsc
Dry
cargo
Total
all goods Crude
Products c
Dry
cargo
Total
all goods 1970
4.6
1.6
29.8
36.0
4.1
1.5
5.9
11.5
1980
7.6
3.4
26.7
37.7
4.9
1.4
13.7
20.0 1990
17.4
8.2
36.0
61.6
3.5
1.3
14.4
19.2
1998
25.0
10.0
45.5
80.5
4.0
1.5
18.4
23.9 1999
25.0
10.0
46.3
81.3
4.0
1.8
18.7
24.5
South America: Western Seaboard
2000
26.0
10.5
48.0
84.5
4.2
1.8
19.0
25.0
1970
131.2
112.9
90.3
334.4
81.9
4.0
26.5
112.4 1980
127.8
64.5
162.3
354.6
136.2
5.8
54.5
196.5
1990
58.4
28.5
214.8
301.7
37.8
4.3
45.7
87.8 1998
109.1
35.0
266.7
410.8
41.5
4.5
59.4
105.4
1999
105.0
36.0
273.5
414.5
41.5
5.0
61.5
108.0
South America: Northern and Eastern Seaboard
2000
109.0
36.0
278.0
423.0
42.0
5.0
63.0
110.0
1970
135.8
119.6
160.4
415.8
115.5
15.5
50.1
181.1
1980
188.9
97.5
242.5
528.9
203.9
16.1
98.4
318.4 1990
171.1
55.5
298.3
524.9
75.0
16.8
95.5
187.3
1998
276.1
75.0
371.9
723.0
82.5
17.5
121.5
221.5 1999
268.0
77.0
380.6
725.6
82.5
18.8
125.2
226.5
Subtotal: Developing countries in America
2000
275.0
78.5
388.0
741.5
84.2
18.8
128.0
231.0
Developing countries in Asia
1970
601.9
66.2
7.6
675.7
12.9
1.7
18.6
33.2
1980
800.6
54.5
12.3
867.4
8.6
5.0
54.9
68.5 1990
463.9
74.8
30.5
569.2
15.6
7.1
107.0
129.7
1998
660.0
95.0
36.1
791.1
18.0
7.0
117.5
142.5 1999
650.0
96.0
36.7
782.7
18.0
8.0
120.6
146.6
Western Asia
2000
665.0
97.0
38.0
800.0
18.5
8.0
123.0
149.5
1970
35.0
23.7
89.3
148.0
54.7
23.3
61.9
139.9 1980
74.3
42.2
165.9
282.4
97.4
26.9
163.5
287.8
1990
78.6
88.4
253.0
420.0
150.4
41.6
362.9
554.9 1998
65.1
109.3
363.0
537.4
216.0
75.0
526.8
817.8
1999
62.0
111.0
381.5
554.5
208.0
77.0
554.8
839.8
Southern and Eastern Asia (n.e.s.)
2000
65.0
112.0
389.0
566.0
216.0
77.0
565.0
858.0
1970
636.9
89.9
96.9
823.7
67.6
25.0
80.5
173.1
1980
874.9
96.7
178.2
1 149.8
106.0
31.9
218.4
356.3 1990
542.5
163.2
283.5
989.2
166.0
48.7
469.9
684.6
1998
725.1
204.3
399.1
1 328.5
234.0
82.0
644.3
960.3 1999
712.0
207.0
418.2
1 337.2
226.0
85.0
675.4
986.4
Subtotal: Developing countries in Asia
2000
730.0
209.0
427.0
1 366.0
234.5
85.0
688.0
1 007.5
1970e
-
-
-
-
-
-
-
-
1980
-
-
0.1
0.1
-
0.5
0.6
1.1
1990
0.3
1.1
7.4
8.8
8.7
2.4
17.7
28.8 1998
-
1.0
8.6
9.6
8.0
2.5
18.0
28.5
1999
-
1.0
8.8
9.8
8.0
2.5
18.3
28.8
Developing countries in Europe
2000
-
1.0
9.0
10.0
8.5
2.5
19.0
30.0
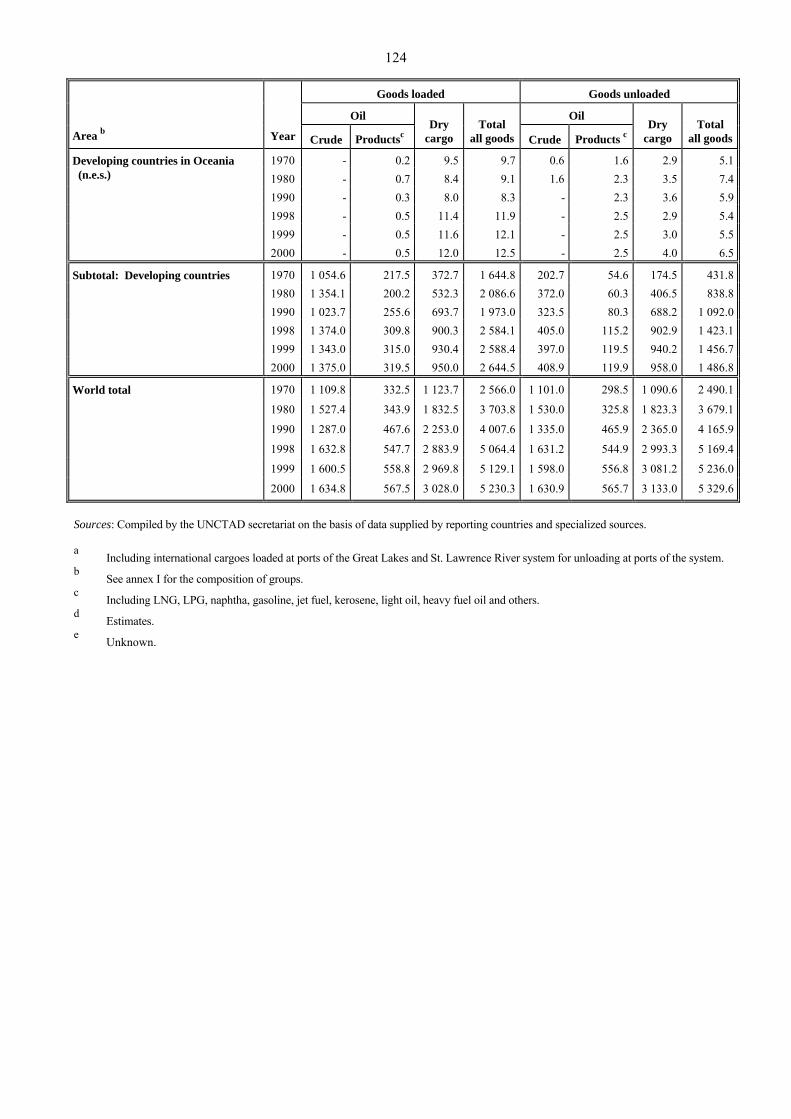
124
Goods loaded
Goods unloaded
Oil
Oil
Area b Year
Crude Productsc
Dry
cargo
Total
all goods Crude
Products c
Dry
cargo
Total
all goods 1970
-
0.2
9.5
9.7
0.6
1.6
2.9
5.1
1980
-
0.7
8.4
9.1
1.6
2.3
3.5
7.4 1990
-
0.3
8.0
8.3
-
2.3
3.6
5.9
1998
-
0.5
11.4
11.9
-
2.5
2.9
5.4 1999
-
0.5
11.6
12.1
-
2.5
3.0
5.5
Developing countries in Oceania (n.e.s.)
2000
-
0.5
12.0
12.5
-
2.5
4.0
6.5
1970
1 054.6
217.5
372.7
1 644.8
202.7
54.6
174.5
431.8
1980 1 354.1
200.2
532.3
2 086.6
372.0
60.3
406.5
838.8
1990 1 023.7
255.6
693.7
1 973.0
323.5
80.3
688.2
1 092.0
1998 1 374.0
309.8
900.3
2 584.1
405.0
115.2
902.9
1 423.1
1999 1 343.0
315.0
930.4
2 588.4
397.0
119.5
940.2
1 456.7
Subtotal: Developing countries
2000
1 375.0
319.5
950.0
2 644.5
408.9
119.9
958.0
1 486.8
1970
1 109.8
332.5
1 123.7
2 566.0
1 101.0
298.5
1 090.6
2 490.1
1980
1 527.4
343.9
1 832.5
3 703.8
1 530.0
325.8
1 823.3
3 679.1
1990
1 287.0
467.6
2 253.0
4 007.6
1 335.0
465.9
2 365.0
4 165.9
1998
1 632.8
547.7
2 883.9
5 064.4
1 631.2
544.9
2 993.3
5 169.4
1999
1 600.5
558.8
2 969.8
5 129.1
1 598.0
556.8
3 081.2
5 236.0
World total
2000
1 634.8
567.5
3 028.0
5 230.3
1 630.9
565.7
3 133.0
5 329.6
Sources: Compiled by the UNCTAD secretariat on the basis of data supplied by reporting countries and specialized sources. a
Including international cargoes loaded at ports of the Great Lakes and St. Lawrence River system for unloading at ports of the system. b
See annex I for the composition of groups. c
Including LNG, LPG, naphtha, gasoline, jet fuel, kerosene, light oil, heavy fuel oil and others. d
Estimates. e
Unknown.
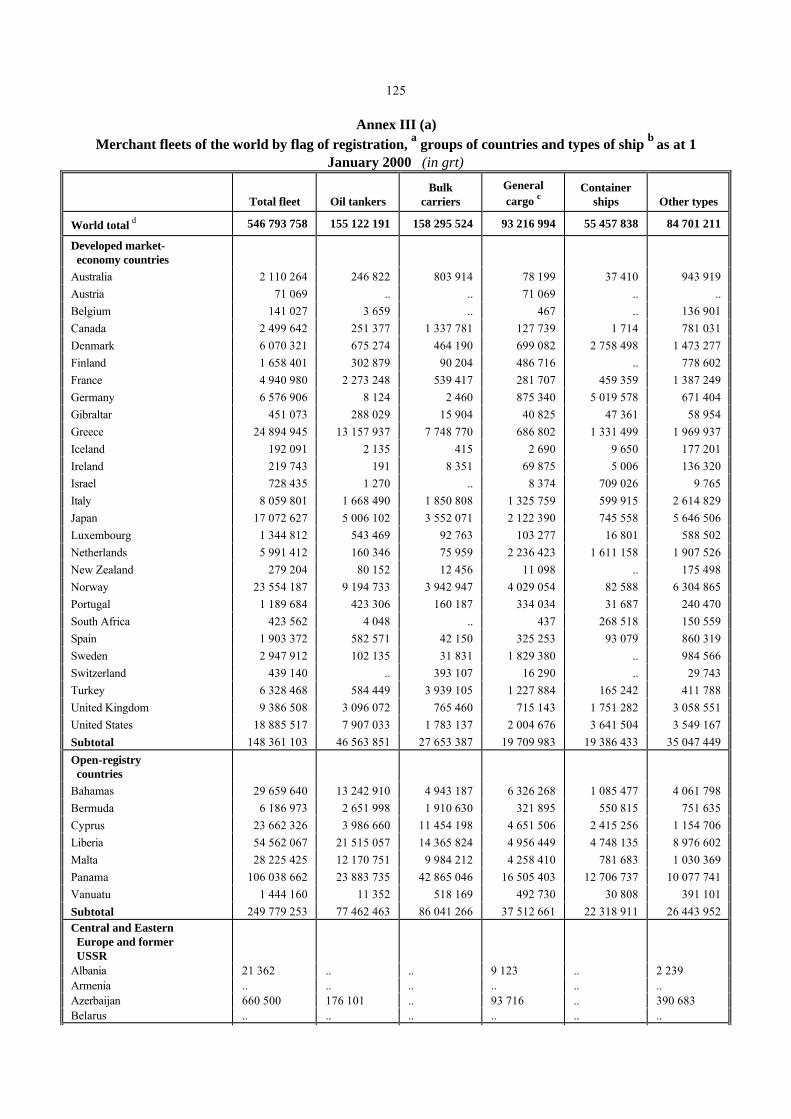
125
Annex III (a) Merchant fleets of the world by flag of registration, a groups of countries and types of ship b as at 1
January 2000 (in grt)
Total fleet Oil tankers
Bulk
carriers
General cargo c
Container
ships Other types
World total d
546 793 758
155 122 191
158 295 524
93 216 994
55 457 838
84 701 211
Developed market- economy countries
Australia
2 110 264
246 822
803 914
78 199
37 410
943 919
Austria
71 069
..
..
71 069
..
.. Belgium
141 027
3 659
..
467
..
136 901
Canada
2 499 642
251 377
1 337 781
127 739
1 714
781 031 Denmark
6 070 321
675 274
464 190
699 082
2 758 498
1 473 277
Finland
1 658 401
302 879
90 204
486 716
..
778 602 France
4 940 980
2 273 248
539 417
281 707
459 359
1 387 249
Germany
6 576 906
8 124
2 460
875 340
5 019 578
671 404 Gibraltar
451 073
288 029
15 904
40 825
47 361
58 954
Greece
24 894 945
13 157 937
7 748 770
686 802
1 331 499
1 969 937 Iceland
192 091
2 135
415
2 690
9 650
177 201
Ireland
219 743
191
8 351
69 875
5 006
136 320 Israel
728 435
1 270
..
8 374
709 026
9 765
Italy
8 059 801
1 668 490
1 850 808
1 325 759
599 915
2 614 829 Japan
17 072 627
5 006 102
3 552 071
2 122 390
745 558
5 646 506
Luxembourg
1 344 812
543 469
92 763
103 277
16 801
588 502 Netherlands
5 991 412
160 346
75 959
2 236 423
1 611 158
1 907 526
New Zealand
279 204
80 152
12 456
11 098
..
175 498 Norway
23 554 187
9 194 733
3 942 947
4 029 054
82 588
6 304 865
Portugal
1 189 684
423 306
160 187
334 034
31 687
240 470 South Africa
423 562
4 048
..
437
268 518
150 559
Spain
1 903 372
582 571
42 150
325 253
93 079
860 319 Sweden
2 947 912
102 135
31 831
1 829 380
..
984 566
Switzerland
439 140
..
393 107
16 290
..
29 743 Turkey
6 328 468
584 449
3 939 105
1 227 884
165 242
411 788
United Kingdom
9 386 508
3 096 072
765 460
715 143
1 751 282
3 058 551 United States
18 885 517
7 907 033
1 783 137
2 004 676
3 641 504
3 549 167
Subtotal 148 361 103
46 563 851
27 653 387
19 709 983
19 386 433
35 047 449
Open-registry countries
Bahamas
29 659 640
13 242 910
4 943 187
6 326 268
1 085 477
4 061 798
Bermuda
6 186 973
2 651 998
1 910 630
321 895
550 815
751 635 Cyprus
23 662 326
3 986 660
11 454 198
4 651 506
2 415 256
1 154 706
Liberia
54 562 067
21 515 057
14 365 824
4 956 449
4 748 135
8 976 602 Malta
28 225 425
12 170 751
9 984 212
4 258 410
781 683
1 030 369
Panama 106 038 662
23 883 735
42 865 046
16 505 403
12 706 737
10 077 741
Vanuatu
1 444 160
11 352
518 169
492 730
30 808
391 101 Subtotal
249 779 253
77 462 463
86 041 266
37 512 661
22 318 911
26 443 952
Central and Eastern Europe and former USSR
Albania 21 362 .. .. 9 123 .. 2 239 Armenia .. .. .. .. .. .. Azerbaijan 660 500 176 101 .. 93 716 .. 390 683 Belarus .. .. .. .. .. ..
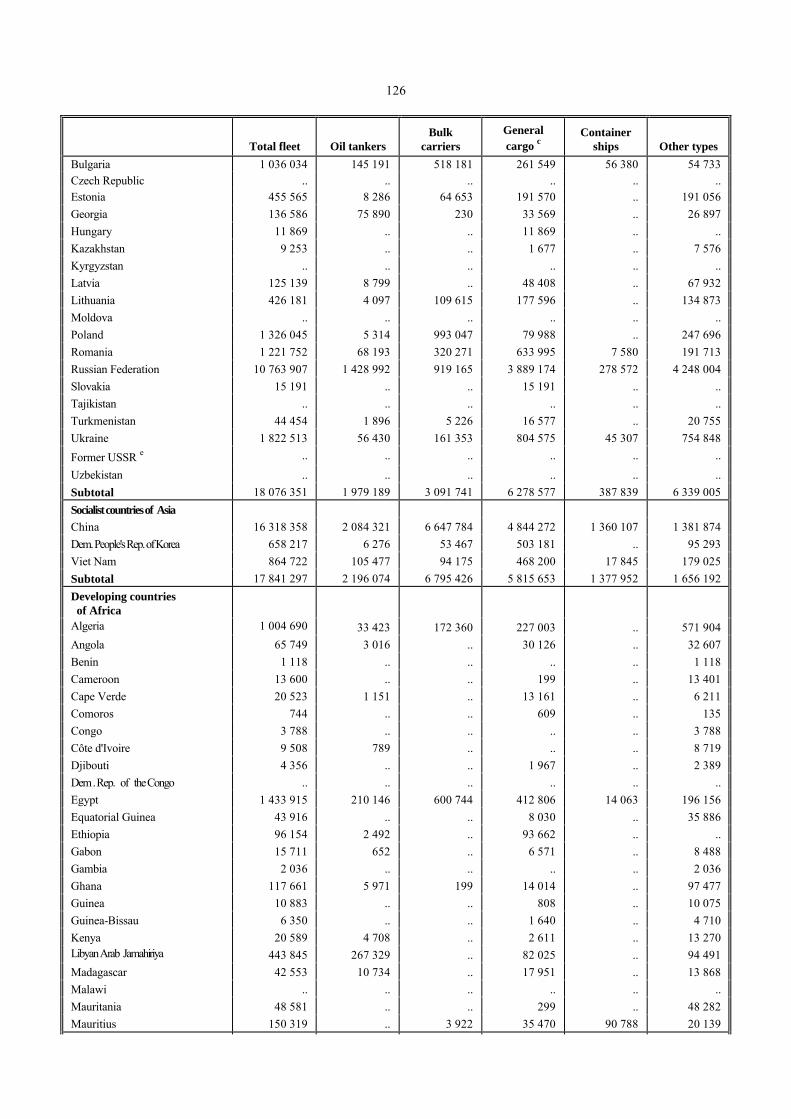
126
Total fleet Oil tankers
Bulk
carriers
General cargo c
Container
ships Other types
Bulgaria 1 036 034 145 191 518 181 261 549 56 380 54 733 Czech Republic
..
..
..
..
..
..
Estonia
455 565
8 286
64 653
191 570
..
191 056 Georgia
136 586
75 890
230
33 569
..
26 897
Hungary
11 869
..
..
11 869
..
.. Kazakhstan
9 253
..
..
1 677
..
7 576
Kyrgyzstan
..
..
..
..
..
.. Latvia
125 139
8 799
..
48 408
..
67 932
Lithuania
426 181
4 097
109 615
177 596
..
134 873 Moldova
..
..
..
..
..
..
Poland
1 326 045
5 314
993 047
79 988
..
247 696 Romania
1 221 752
68 193
320 271
633 995
7 580
191 713
Russian Federation
10 763 907
1 428 992
919 165
3 889 174
278 572
4 248 004 Slovakia
15 191
..
..
15 191
..
..
Tajikistan
..
..
..
..
..
.. Turkmenistan
44 454
1 896
5 226
16 577
..
20 755
Ukraine
1 822 513
56 430
161 353
804 575
45 307
754 848 Former USSR e
..
..
..
..
..
..
Uzbekistan
..
..
..
..
..
..
Subtotal
18 076 351
1 979 189
3 091 741
6 278 577
387 839
6 339 005 Socialist countries of Asia
China
16 318 358
2 084 321
6 647 784
4 844 272
1 360 107
1 381 874 Dem. People's Rep. of Korea
658 217
6 276
53 467
503 181
..
95 293
Viet Nam
864 722
105 477
94 175
468 200
17 845
179 025 Subtotal
17 841 297
2 196 074
6 795 426
5 815 653
1 377 952
1 656 192
Developing countries of Africa
Algeria 1 004 690
33 423
172 360
227 003
..
571 904 Angola
65 749
3 016
..
30 126
..
32 607
Benin
1 118
..
..
..
..
1 118 Cameroon
13 600
..
..
199
..
13 401
Cape Verde
20 523
1 151
..
13 161
..
6 211 Comoros
744
..
..
609
..
135
Congo
3 788
..
..
..
..
3 788 Côte d'Ivoire
9 508
789
..
..
..
8 719
Djibouti
4 356
..
..
1 967
..
2 389 Dem . Rep. of the Congo
..
..
..
..
..
..
Egypt
1 433 915
210 146
600 744
412 806
14 063
196 156 Equatorial Guinea
43 916
..
..
8 030
..
35 886
Ethiopia
96 154
2 492
..
93 662
..
.. Gabon
15 711
652
..
6 571
..
8 488
Gambia
2 036
..
..
..
..
2 036 Ghana
117 661
5 971
199
14 014
..
97 477
Guinea
10 883
..
..
808
..
10 075 Guinea-Bissau
6 350
..
..
1 640
..
4 710
Kenya
20 589
4 708
..
2 611
..
13 270 Libyan Arab Jamahiriya
443 845
267 329
..
82 025
..
94 491
Madagascar
42 553
10 734
..
17 951
..
13 868 Malawi
..
..
..
..
..
..
Mauritania
48 581
..
..
299
..
48 282 Mauritius
150 319
..
3 922
35 470
90 788
20 139

127
Total fleet Oil tankers
Bulk
carriers
General cargo c
Container
ships Other types
Morocco 448 455 12 476 .. 111 469 18 129 306 381 Mozambique
36 329
..
..
6 594
..
29 735
Nigeria
433 726
265 279
..
91 287
..
77 160 Saint Helena
789
..
..
..
..
789
Sao Tome and Principe
42 120
998
..
32 052
1 152
7 918 Senegal
47 635
..
..
1 778
..
45 857
Seychelles
23 991
..
..
9 605
..
14 386 Sierra Leone
17 430
3 126
..
490
..
13 814
Somalia
6 288
851
..
3 312
..
2 125 Sudan
43 078
832
..
39 927
..
2 319
Togo
42 823
..
40 662
..
..
2 161 Tunisia
199 547
19 678
17 066
25 094
..
137 709
Uganda
3 394
..
..
3 394
..
.. United Republic of Tanzania
37 489
4 347
..
20 632
..
12 510
Subtotal
4 939 683
847 998
834 953
1 294 586
124 132
1 838 014 Developing countries of America
Anguilla
1 387
..
..
1 278
..
109 Antigua and Barbuda
3 627 858
4 876
196 488
1 466 228
1 924 971
35 295
Argentina
502 916
100 123
33 678
101 698
..
267 417 Barbados
724 797
349 673
161 636
120 985
13 020
79 483
Belize
2 369 002
321 106
198 041
1 179 647
52 312
617 896 Bolivia
179 526
18 641
48 909
95 043
7 580
9 353
Brazil
3 950 202
1 776 880
1 453 256
356 160
133 922
229 984 Cayman Islands
1 164 588
123 053
526 339
337 602
33 682
143 912
Chile
824 471
99 767
203 168
142 926
41 311
337 299 Colombia
96 886
5 962
..
62 759
..
28 165
Costa Rica
5 732
..
..
..
..
5 732 Cuba
130 108
3 424
2 316
64 516
..
59 852
Dominica
2 233
..
..
1 522
..
711 Dominican Republic
10 078
..
..
5 854
..
4 224
Ecuador
309 223
223 047
..
2 319
..
83 857 El Salvador
1 598
..
..
..
..
1 598
Falkland Islands f
45 477
..
..
735
..
44 742 Grenada
1 009
..
..
779
..
230
Guatemala
4 561
..
..
..
..
4 561 Guyana
14 030
125
..
5 794
..
8 111
Haiti
1 172
..
..
892
..
280 Honduras
1 220 872
130 884
133 203
585 227
8 757
362 801
Jamaica
3 647
1 930
..
..
..
1 717 Mexico
919 723
463 801
..
22 390
..
433 532
Montserrat
..
..
..
..
..
.. Nicaragua
4 293
..
..
498
..
3 795
Paraguay
43 361
4 480
..
30 542
823
7 516 Peru
300 837
46 972
15 297
52 100
..
186 468
Saint Kitts and Nevis
300
..
..
300
..
.. Saint Lucia
..
..
..
..
..
..
Saint Vincent and the Grenadines
7 105 622
569 479
2 632 293
2 940 336
149 472
814 042 Suriname
6 482
1 842
..
2 525
..
2 115
Trinidad and Tobago
21 846
998
..
2 604
..
18 244 Turks and Caicos Islands
975
..
..
227
..
748
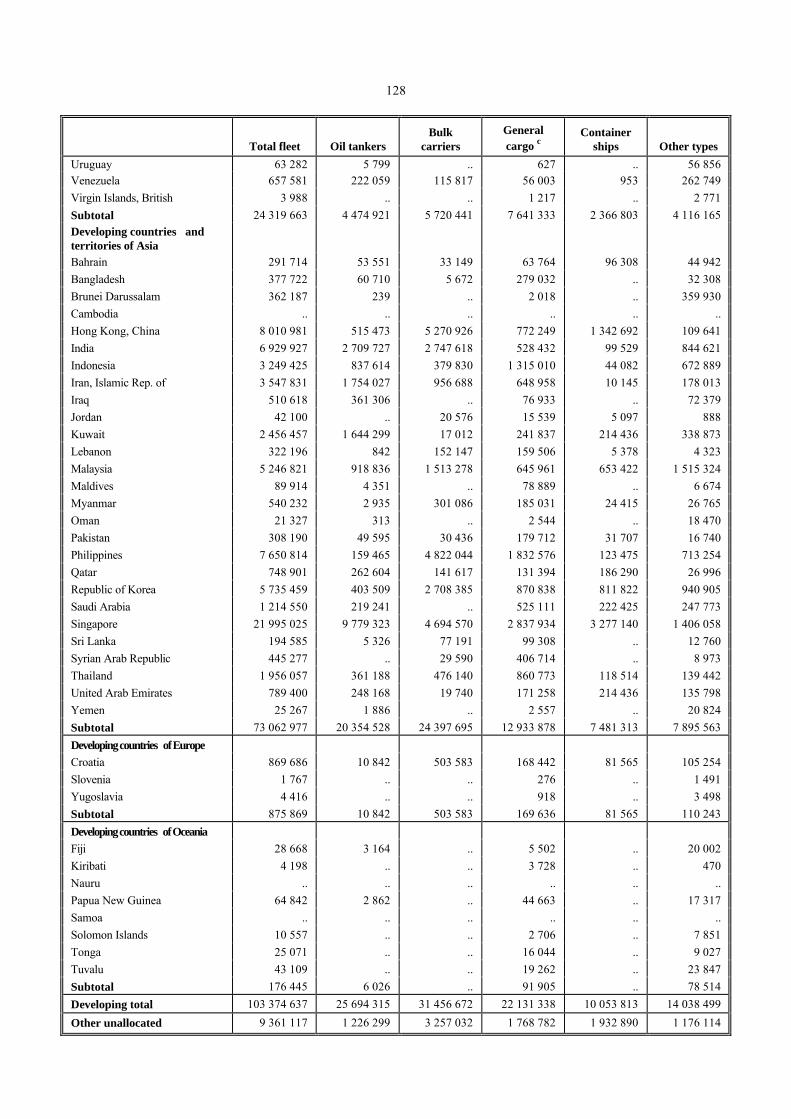
128
Total fleet Oil tankers
Bulk
carriers
General cargo c
Container
ships Other types
Uruguay 63 282 5 799 .. 627 .. 56 856 Venezuela
657 581
222 059
115 817
56 003
953
262 749
Virgin Islands, British
3 988
..
..
1 217
..
2 771 Subtotal
24 319 663
4 474 921
5 720 441
7 641 333
2 366 803
4 116 165
Developing countries and territories of Asia
Bahrain
291 714
53 551
33 149
63 764
96 308
44 942
Bangladesh
377 722
60 710
5 672
279 032
..
32 308 Brunei Darussalam
362 187
239
..
2 018
..
359 930
Cambodia
..
..
..
..
..
.. Hong Kong, China
8 010 981
515 473
5 270 926
772 249
1 342 692
109 641
India
6 929 927
2 709 727
2 747 618
528 432
99 529
844 621 Indonesia
3 249 425
837 614
379 830
1 315 010
44 082
672 889
Iran, Islamic Rep. of
3 547 831
1 754 027
956 688
648 958
10 145
178 013 Iraq
510 618
361 306
..
76 933
..
72 379
Jordan
42 100
..
20 576
15 539
5 097
888 Kuwait
2 456 457
1 644 299
17 012
241 837
214 436
338 873
Lebanon
322 196
842
152 147
159 506
5 378
4 323 Malaysia
5 246 821
918 836
1 513 278
645 961
653 422
1 515 324
Maldives
89 914
4 351
..
78 889
..
6 674 Myanmar
540 232
2 935
301 086
185 031
24 415
26 765
Oman
21 327
313
..
2 544
..
18 470 Pakistan
308 190
49 595
30 436
179 712
31 707
16 740
Philippines
7 650 814
159 465
4 822 044
1 832 576
123 475
713 254 Qatar
748 901
262 604
141 617
131 394
186 290
26 996
Republic of Korea
5 735 459
403 509
2 708 385
870 838
811 822
940 905 Saudi Arabia
1 214 550
219 241
..
525 111
222 425
247 773
Singapore
21 995 025
9 779 323
4 694 570
2 837 934
3 277 140
1 406 058 Sri Lanka
194 585
5 326
77 191
99 308
..
12 760
Syrian Arab Republic
445 277
..
29 590
406 714
..
8 973 Thailand
1 956 057
361 188
476 140
860 773
118 514
139 442
United Arab Emirates
789 400
248 168
19 740
171 258
214 436
135 798 Yemen
25 267
1 886
..
2 557
..
20 824
Subtotal
73 062 977
20 354 528
24 397 695
12 933 878
7 481 313
7 895 563 Developing countries of Europe
Croatia
869 686
10 842
503 583
168 442
81 565
105 254 Slovenia
1 767
..
..
276
..
1 491
Yugoslavia
4 416
..
..
918
..
3 498 Subtotal
875 869
10 842
503 583
169 636
81 565
110 243
Developing countries of Oceania
Fiji
28 668
3 164
..
5 502
..
20 002
Kiribati
4 198
..
..
3 728
..
470 Nauru
..
..
..
..
..
..
Papua New Guinea
64 842
2 862
..
44 663
..
17 317 Samoa
..
..
..
..
..
..
Solomon Islands
10 557
..
..
2 706
..
7 851 Tonga
25 071
..
..
16 044
..
9 027
Tuvalu
43 109
..
..
19 262
..
23 847 Subtotal
176 445
6 026
..
91 905
..
78 514
Developing total 103 374 637
25 694 315
31 456 672
22 131 338
10 053 813
14 038 499
Other unallocated
9 361 117
1 226 299
3 257 032
1 768 782
1 932 890
1 176 114

129 Annex III (b) Merchant fleets of the world by flag of registration, a groups of countries and types of ship b as at 1 January 2000 (in dwt)
Total fleet
Oil tankers
Bulk carriers General cargoc
Container ships
Other types
World total d
798 995 409
283 616 922
276 071 792
103 862 286
63 668 810
71 775 599
Developed market- economy countries
Australia
2 686 181
408 265
1 312 552
58 377
47 326
859 661
Austria
100 323
..
..
100 323
..
.. Belgium
149 459
6 725
..
594
..
142 140
Canada
1 018 437
408 324
162 507
117 769
1 910
327 927 Denmark
7 420 796
1 193 806
872 819
802 909
3 157 354
1 393 908
Finland
1 239 524
507 956
134 182
386 854
..
210 532 France
7 292 503
4 431 806
1 018 615
360 447
518 273
963 362
Germany
7 788 310
11 189
5 458
1 060 953
6 326 244
384 466 Gibraltar
728 470
553 526
27 048
35 961
62 445
49 490
Greece
42 532 146
25 056 587
13 905 133
901 756
1 406 863
1 261 807 Iceland
83 576
2 704
650
2 902
12 400
64 920
Ireland
154 409
274
12 271
101 147
6 807
33 910 Israel
832 066
2 512
..
7 276
817 795
4 483
Italy
9 768 821
2 801 375
3 496 973
926 251
652 997
1 891 225 Japan
22 722 864
8 996 357
6 543 126
2 684 016
744 744
3 754 621
Luxembourg
1 959 629
999 820
172 821
56 904
23 045
707 039 Netherlands
6 607 344
267 239
104 488
2 800 229
1 782 875
1 652 513
New Zealand
332 665
123 304
17 039
10 742
..
181 580 Norway
35 388 032
17 427 752
7 057 692
3 822 551
101 934
6 978 103
Portugal
1 630 041
732 342
287 112
385 629
40 024
184 934 South Africa
368 980
5 276
..
142
262 351
101 211
Spain
2 053 020
1 049 385
70 002
293 184
136 144
504 305 Sweden
1 846 038
161 473
43 543
1 032 700
..
608 322
Switzerland
779 020
..
714 217
28 318
..
36 485 Turkey
10 174 199
1 056 089
6 848 270
1 749 404
212 793
307 643
United Kingdom
11 913 096
5 582 545
1 410 607
653 421
1 935 935
2 330 588 United States
25 676 029
14 835 484
2 768 001
1 587 513
3 781 271
2 703 760
Subtotal 203 245 978
86 622 115
46 985 126
19 968 272
22 031 530
27 638 935
Open-registry countries
Bahamas
44 941 434
24 899 807
8 670 665
7 431 149
1 191 604
2 748 209
Bermuda
10 468 519
5 339 735
3 696 211
313 339
554 697
564 537 Cyprus
36 669 359
6 876 774
19 836 970
5 824 686
2 895 366
1 235 563
Liberia
85 186 919
39 902 879
25 282 279
4 972 475
5 589 192
9 440 094 Malta
46 749 434
22 148 889
17 079 394
5 370 264
939 802
1 211 085
Panama 158 947 251
43 181 644
76 149 410
14 833 839
14 117 996
10 664 362
Vanuatu
1 727 675
17 477
858 203
378 920
34 183
438 892 Subtotal
384 690 591
142 367 205
151 573 132
39 124 672
25 322 840
26 302 742
Central and Eastern Europe and former USSR
Albania 20 112 .. .. 18 871 .. 1 241 Armenia .. .. .. .. .. .. Azerbaijan 507 498 232 550 .. 102 685 .. 172 263 Belarus .. .. .. .. .. ..

130
Total fleet
Oil tankers
Bulk carriers General cargoc
Container ships
Other types
Bulgaria 1 501 591 269 935 812 426 311 843 67 117 40 270 Czech Republic
..
..
..
..
..
..
Estonia
363 058
13 386
100 795
188 292
..
60 585 Georgia
183 760
119 995
214
45 547
..
18 004
Hungary
14 930
..
..
14 930
..
.. Kazakhstan
4 742
..
..
787
..
3 955
Kyrgyzstan
..
..
..
..
..
.. Latvia
101 497
15 355
..
47 694
..
38 448
Lithuania
414 576
7 286
160 212
189 980
..
57 098 Moldova
..
..
..
..
..
..
Poland
1 855 351
7 458
1 648 361
71 345
..
128 187 Romania
1 618 256
103 165
520 130
830 422
8 435
156 104
Russian Federation
9 950 401
2 054 108
1 312 237
4 180 096
316 723
2 087 237 Slovakia
19 489
..
..
19 489
..
..
Tajikistan
..
..
..
..
..
.. Turkmenistan
36 524
3 389
6 690
15 198
..
11 247
Ukraine
1 667 473
89 660
265 694
880 772
45 576
385 771 Former USSR e
..
..
..
..
..
..
Uzbekistan
..
..
..
..
..
..
Subtotal
18 259 258
2 916 287
4 826 759
6 917 951
437 851
3 160 410 Socialist countries of Asia
China
23 701 202
3 383 357
11 102 133
6 450 921
1 647 825
1 116 966 Democratic People's Republic of Korea
846 600
11 687
87 797
682 804
..
64 312
Viet Nam
1 256 145
169 586
150 910
682 646
16 030
236 973 Subtotal
25 803 947
3 564 630
11 340 840
7 816 371
1 663 855
1 418 251
Developing countries of Africa
Algeria
1 110 761
52 547
288 145
295 498
..
474 571
Angola
69 697
4 523
..
48 166
..
17 008 Benin
210
..
..
..
..
210
Cameroon
5 669
..
..
298
..
5 371 Cape Verde
24 000
1 525
..
18 813
..
3 662
Comoros
1 039
..
..
1 039
..
.. Congo
660
..
..
..
..
660
Côte d'Ivoire
5 866
1 170
..
..
..
4 696 Djibouti
4 900
..
..
4 450
..
450
Democratic Republic of the Congo
..
..
..
..
..
..
Egypt
2 092 569
364 688
1 035 173
543 641
17 728
131 339 Equatorial Guinea
19 350
..
..
10 271
..
9 079
Ethiopia
119 688
3 618
..
116 070
..
.. Gabon
11 631
742
..
7 096
..
3 793
Gambia
1 865
..
..
..
..
1 865 Ghana
92 076
8 600
260
17 714
..
65 502
Guinea
4 754
..
..
285
..
4 469 Guinea-Bissau
2 187
..
..
540
..
1 647
Kenya
19 096
7 631
..
1 981
..
9 484 Libyan Arab Jamahiriya
667 090
536 832
..
91 357
..
38 901
Madagascar
45 113
16 927
..
21 432
..
6 754 Malawi
..
..
..
..
..
..
Mauritania
22 234
..
..
721
..
21 513 Mauritius
189 723
..
5 274
40 682
130 915
12 852
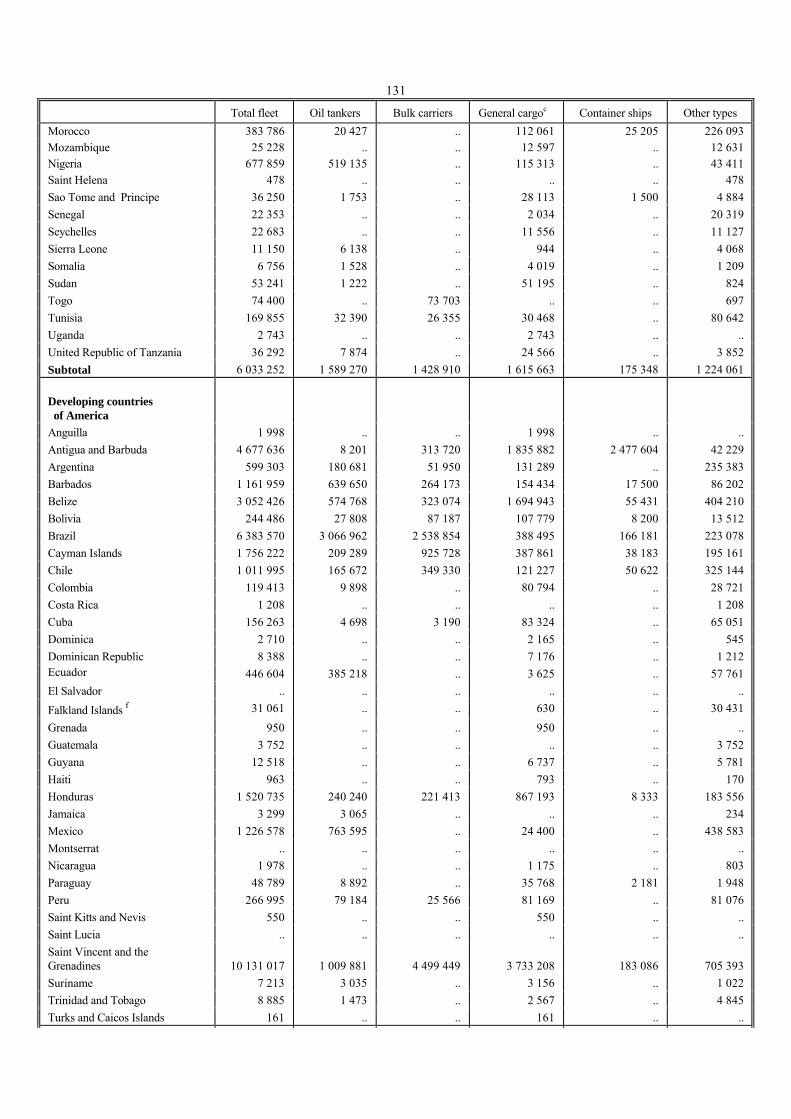
131
Total fleet
Oil tankers
Bulk carriers General cargoc
Container ships
Other types
Morocco 383 786 20 427 .. 112 061 25 205 226 093 Mozambique
25 228
..
..
12 597
..
12 631
Nigeria
677 859
519 135
..
115 313
..
43 411 Saint Helena
478
..
..
..
..
478
Sao Tome and Principe
36 250
1 753
..
28 113
1 500
4 884 Senegal
22 353
..
..
2 034
..
20 319
Seychelles
22 683
..
..
11 556
..
11 127 Sierra Leone
11 150
6 138
..
944
..
4 068
Somalia
6 756
1 528
..
4 019
..
1 209 Sudan
53 241
1 222
..
51 195
..
824
Togo
74 400
..
73 703
..
..
697 Tunisia
169 855
32 390
26 355
30 468
..
80 642
Uganda
2 743
..
..
2 743
..
.. United Republic of Tanzania
36 292
7 874
..
24 566
..
3 852
Subtotal
6 033 252
1 589 270
1 428 910
1 615 663
175 348
1 224 061 Developing countries of America
Anguilla
1 998
..
..
1 998
..
..
Antigua and Barbuda
4 677 636
8 201
313 720
1 835 882
2 477 604
42 229 Argentina
599 303
180 681
51 950
131 289
..
235 383
Barbados
1 161 959
639 650
264 173
154 434
17 500
86 202 Belize
3 052 426
574 768
323 074
1 694 943
55 431
404 210
Bolivia
244 486
27 808
87 187
107 779
8 200
13 512 Brazil
6 383 570
3 066 962
2 538 854
388 495
166 181
223 078
Cayman Islands
1 756 222
209 289
925 728
387 861
38 183
195 161 Chile
1 011 995
165 672
349 330
121 227
50 622
325 144
Colombia
119 413
9 898
..
80 794
..
28 721 Costa Rica
1 208
..
..
..
..
1 208
Cuba
156 263
4 698
3 190
83 324
..
65 051 Dominica
2 710
..
..
2 165
..
545
Dominican Republic
8 388
..
..
7 176
..
1 212 Ecuador
446 604
385 218
..
3 625
..
57 761
El Salvador
..
..
..
..
..
.. Falkland Islands f
31 061
..
..
630
..
30 431
Grenada
950
..
..
950
..
..
Guatemala
3 752
..
..
..
..
3 752 Guyana
12 518
..
..
6 737
..
5 781
Haiti
963
..
..
793
..
170 Honduras
1 520 735
240 240
221 413
867 193
8 333
183 556
Jamaica
3 299
3 065
..
..
..
234 Mexico
1 226 578
763 595
..
24 400
..
438 583
Montserrat
..
..
..
..
..
.. Nicaragua
1 978
..
..
1 175
..
803
Paraguay
48 789
8 892
..
35 768
2 181
1 948 Peru
266 995
79 184
25 566
81 169
..
81 076
Saint Kitts and Nevis
550
..
..
550
..
.. Saint Lucia
..
..
..
..
..
..
Saint Vincent and the Grenadines
10 131 017
1 009 881
4 499 449
3 733 208
183 086
705 393
Suriname
7 213
3 035
..
3 156
..
1 022 Trinidad and Tobago
8 885
1 473
..
2 567
..
4 845
Turks and Caicos Islands
161
..
..
161
..
..

132
Total fleet
Oil tankers
Bulk carriers General cargoc
Container ships
Other types
Uruguay 38 077 8 377 .. 1 241 .. 28 459 Venezuela
936 717
375 377
193 564
76 216
1 180
290 380
Virgin Islands, British
2 092
..
..
1 439
..
653 Subtotal
33 866 511
7 765 964
9 797 198
9 838 345
3 008 501
3 456 503
Developing countries and territories of Asia
Bahrain
369 750
97 002
44 110
97 950
99 848
30 840
Bangladesh
518 725
101 640
8 903
388 426
..
19 756 Brunei Darussalam
349 619
270
..
2 585
..
346 764
Cambodia
..
..
..
..
..
.. Hong Kong, China
13 190 911
930 195
9 748 471
949 012
1 482 032
81 201
India
11 209 341
4 826 148
4 626 532
656 976
131 363
968 322 Indonesia
4 153 738
1 333 425
615 756
1 808 081
56 081
340 395
Iran, Islamic Rep. of
6 097 330
3 408 113
1 612 245
904 936
11 560
160 476 Iraq
834 687
659 715
..
105 185
..
69 787
Jordan
59 344
..
33 399
19 063
6 635
247 Kuwait
3 884 391
2 960 938
26 984
306 321
226 769
363 379
Lebanon
483 216
1 490
253 750
216 087
7 285
4 604 Malaysia
7 577 465
1 633 737
2 671 072
861 506
799 368
1 611 782
Maldives
132 843
8 691
..
117 615
..
6 537 Myanmar
792 307
4 713
504 832
243 853
25 297
13 612
Oman
10 879
460
..
2 996
..
7 423 Pakistan
458 723
91 021
52 164
260 445
41 682
13 411
Philippines
11 111 975
234 182
8 300 712
2 061 088
156 811
359 182 Qatar
1 153 965
466 067
270 329
202 259
197 645
17 665
Republic of Korea
8 655 548
767 375
4 912 113
1 068 902
950 278
956 880 Saudi Arabia
1 442 954
409 275
..
570 818
216 760
246 101
Singapore
34 635 484
17 621 495
8 659 836
2 599 905
3 879 297
1 874 951 Sri Lanka
287 640
9 961
149 581
121 293
..
6 805
Syrian Arab Republic
679 412
..
44 082
625 952
..
9 378 Thailand
3 068 395
687 640
784 392
1 310 147
160 594
125 622
United Arab Emirates
1 042 535
409 830
36 720
235 923
227 034
133 028 Yemen
25 821
3 185
..
3 061
..
19 575
Subtotal 112 226 998
36 666 568
43 355 983
15 740 385
8 676 339
7 787 723
Developing countries of Europe
Croatia
1 227 748
13 826
867 682
216 709
98 334
31 197
Slovenia
782
..
..
234
..
548 Yugoslavia
2 232
..
..
1 326
..
906
Subtotal
1 230 762
13 826
867 682
218 269
98 334
32 651 Developing countries of Oceania
Fiji
24 391
3 605
..
5 764
..
15 022
Kiribati
4 100
..
..
3 446
..
654 Nauru
..
..
..
..
..
..
Papua New Guinea
70 852
2 736
..
55 103
..
13 013 Samoa
..
..
..
..
..
..
Solomon Islands
6 905
..
..
2 481
..
4 424 Tonga
29 297
..
..
18 500
..
10 797
Tuvalu
68 395
..
..
25 733
..
42 662 Subtotal
203 940
6 341
..
111 027
..
86 572
Developing total 153 561 463
46 041 969
55 449 773
27 523 689
11 958 522
12 587 510
Other unallocated
13 434 172
2 104 716
5 896 162
2 511 331
2 254 212
667 751
133 Notes to Annex III Source: Lloyd's Maritime Information Services (London). a The designations employed and the presentation of material in this table refer to flags of registration and do
not imply the expression of any opinion by the Secretariat of the United Nations concerning the legal status of any country or territory, or of its authorities, or concerning the delimitation of its frontiers.
b Ships of 100 grt and over, excluding the Great Lakes fleets of the United States and Canada and the
United States Reserve Fleet. c Including passenger/cargo.
d Excluding estimates of the United States Reserve Fleet and the United States and Canadian Great Lakes
fleets, which amounted to respectively 3.1 million grt (3.7 million dwt), 1.0 million grt (1.9 million dwt) and 1.2 million grt (1.9 million dwt).
e All republics of the former USSR that have not established new shipping registers (see box 1).
f A dispute exists between the Governments of Argentina and the United Kingdom of Great Britain and
Northern Ireland concerning sovereignty over the Falkland Islands (Malvinas).