Embed Size (px)
Citation preview

United Nations Conference on Trade and Development
WORLD INVESTMENT
PROSPECTS SURVEY
2009-2011
UNITED NATIONS
New York and Geneva, 2009

ii World Investment Prospects Survey 2009-2011
WIPS 2009-2011
NOTE
As the focal point in the United Nations system for investment and technology, and building on 30 years of experience in these areas, the United Nations Conference on Trade and Development (UNCTAD), through its Division on Investment and Enterprise (DIAE), promotes understanding of key issues, particularly matters related to foreign direct investment and transfer of technology. DIAE also assists developing countries in attracting and benefiting from FDI and in building their productive capacities and international competitiveness. The emphasis is on an integrated policy approach to investment, technological capacity building and enterprise development.
The terms country/economy as used in this report also refer, as appropriate, to territories or areas; the designations employed and the presentation of the material do not imply the expression of any opinion whatsoever on the part of the Secretariat of the United Nations concerning the legal status of any country, territory, city or area or of its authorities, or concerning the delimitation of its frontiers or boundaries. In addition, the designations of country groups are intended solely for statistical or analytical convenience and do not necessarily express a judgement about the stage of development reached by a particular country or area in the development process. The major country groupings used in this report follow the classification of the United Nations Statistical Office. These are:
Developed countries: the member countries of the Organization for Economic Cooperation and Development (OECD) (other than Mexico, the Republic of Korea and Turkey), plus the new European Union member countries which are not OECD members (Bulgaria, Cyprus, Estonia, Latvia, Lithuania, Malta, Romania and Slovenia), plus Andorra, Israel, Liechtenstein, Monaco and San Marino.
Transition economies: South-East Europe and the Commonwealth of Independent States.
Developing economies: in general all economies not specified above. For statistical purposes, the data for China do not include those for Hong Kong Special Administrative Region (Hong Kong SAR), Macao Special Administrative Region (Macao SAR) and Taiwan Province of China.
Reference to companies and their activities should not be construed as an endorsement by UNCTAD of those companies or their activities.
The boundaries and names shown and designations used on the maps presented in this publication do not imply official endorsement or acceptance by the United Nations.
The following symbols have been used in the tables:
Two dots (..) indicate that data are not available or are not separately reported. Rows in tables have been omitted in those cases where no data are available for any of the elements in the row;
A dash (–) indicates that the item is equal to zero or its value is negligible;
A blank in a table indicates that the item is not applicable, unless otherwise indicated;
A slash (/) between dates representing years, e.g. 1994/95, indicates a financial year;
Use of an en dash (–) between dates representing years, e.g. 1994–1995, signifies the full period involved, including the beginning and end years;
Reference to “dollars” ($) means United States dollars, unless otherwise indicated;
Annual rates of growth or change, unless otherwise stated, refer to annual compound rates;
Details and percentages in tables do not necessarily add up to totals because of rounding.
The material contained in this study may be freely quoted with appropriate acknowledgement.
Details and percentages in tables do not necessarily add to totals because of rounding.
The material contained in this study may be freely quoted with appropriate acknowledgement.
UNCTAD/DIAE/IA/2009/8
iii
WIPS 2009-2011
TABLE OF CONTENTS
NOTE .................................................................................... ii
PREFACE AND ACKNOWLEDGMENTS .............................. vii
EXECUTIVE SUMMARY ........................................................1
CHAPTER I. SHARP SHORT-TERM DECLINE, FOLLOWED BY A PROGRESSIVE RECOVERY IN TNCs’ FDI PLANS......... 9
Investment plans for 2009 indicate a sharp fall..................... 9
Most of respondent companies intend to reduce their FDI in 2009..9A strong negative impact of the crisis on investment plans...............11A strong aversion to uncertainty ....................................................... 13Greater recourse to non-equity entry modes?................................... 15
Factors and timing for a recovery in FDI ............................. 16
A gradual recovery as early as 2010?................................................. 16TNCs’optimism grows over time ....................................................... 17The process of internationalization is set to continue ...................... 19
CHAPTER II. THE CRISIS HAS AFFECTED FDI PLANS IN ALL REGIONS......................................................................21
TNCs’ FDI plans reveal a common pattern: a decrease followed by a rebound ..........................................................21
A widespread negative impact in the short term .............................. 21Recovery expected in all home regions in 2011.................................24
FDI plans by home region.................................................... 25
Geographical patterns of FDI: a regional perspective .......... 27
CHAPTER III. BUSINESS-CYCLE-SENSITIVE INDUSTRIES THE WORST HIT BY THE CRISIS ....................................... 33
The primary sector and services face better FDI prospects than manufacturing............................................................. 33
Key findings........................................................................................33Analysis by sector...............................................................................34
Varying FDI plans of different industries ............................ 37
Manufacturing sector.........................................................................38Services............................................................................................... 41
CHAPTER IV. DEVELOPING COUNTRIES SEEM LESS AFFECTED BY THE SLOWDOWN IN FDI............................ 45
The slowdown in FDI hits developed regions the most ........ 45
iv World Investment Prospects Survey 2009-2011
WIPS 2009-2011
TNCs continue to give developing countries high
priority for FDI....................................................................48
Particularly good prospects for Asia and Latin America ..................49Top 15 countries: what makes them attractive to FDI?......... 53
No major changes to the list of most favoured countries .................53Major location assets by country .......................................................55
Conclusions ........................................................................ 59
References ...........................................................................61
Annexes .............................................................................. 63
Questionnaire ......................................................................73
Annex 1. Methodology of the World Investment Prospects Survey ..........63Annex 2. Characteristics of the top 5,000 non-financial TNCs .................66Annex 3. Survey results: detailed statistical tables ....................................68Annex 4. Classifications used in the survey................................................70
Boxes
Box 1. The UNCTAD World Investment Prospects Survey ..................... 1 Box 2. All business functions are set to internationalize .......................20Box 3. Major location determinants.......................................................56
Figures
Figure 1. FDI inflows, global and by group of economies, 1980–2008 (Billions of dollars).................................................. 10
Figure 2. Respondent companies’ FDI expenditures plans, 2009–2011, as compared to 2008 (Per cent of responses) ........ 10
Figure 3. Impact of various aspects of the crisis on company’s investment plans for 2009–2011 (Per cent of responses) .......... 12
Figure 4. Impact of various aspects of the crisis on company’s investment plans for 2009–2011 (Average value of responses) .................... 13
Figure 5. Most likely risks and their potential impact on companies’ decisions (Average value of responses)....................................... 14
Figure 6. Importance of risk factors for FDI decisions, 2009–2011 (Average number of responses)................................................... 14
Figure 7. Different entry modes used by TNCs (Average value of responses) ....................................................... 16
Figure 8. Respondent companies’ FDI expenditure plans as compared to 2008 (Average value of responses)........................ 17
v
WIPS 2009-2011
Figure 9. Distribution of the degree of optimism/pessimism regarding the medium-term FDI outlook, globally and for the respondent company (Per cent of responses) ......... 18
Figure 10.Distribution of the degree of optimism/pessimism regarding the medium-term FDI outlook, globally and for the respondent company (Average value of responses)........ 18
Figure 11. Companies’ level of internationalization by various indicators, 2008 and 2011 (Per cent of responses) ....................................... 19
Figure 12. TNCs’s views on global FDI prospects, by home region, 2009–2011 (Average value of responses) ...................................23
Figure 13. Change in respondent TNCs’ FDI relative to 2008, by home region, 2009–2011 (Average value of responses) ........23
Figure 14. Internationalization index of respondent companies, by home region/ country, 2008 and 2011 (Average value of responses) .......................................................24
Figure 15. Internationalization of corporate functions by home region, 2008 (Average value of responses).......................29
Figure 16. European TNCs’ regional preferences for FDI, 2008 and 2011 (Average value of responses)..............................29
Figure 17. North American TNCs’ regional preferences for FDI, 2008 and 2011 (Average value of responses)..............................30
Figure 18. Japanese TNCs’ regional preferences for FDI, 2008 and 2011 (Average value of responses).............................. 31
Figure 19. Asian developing countries TNCs’ regional preferences for FDI, 2008 and 2011 (Average value of responses)................32
Figure 20. Impact of the economic downturn on TNCs’ investment plans, 2009–2011, by sector/industry (Average value of responses)..... 34
Figure 21. Expected evolution of companies’ FDI in 2011 since 2008, by industry (Average value of responses) ...................................35
Figure 22. Internationalization index of respondent companies, by industry, 2008 (average value of responses) ......................... 37
Figure 23. Regions/groups most affected by the reduction in TNCs’ investment plans for 2009–2011 (Per cent of responses) ..........47
Figure 24. Percentage of respondent companies with investments in various regions/groups (Per cent of responses) .....................47
Figure 25. Investment preferences, by host region/group, 2008 and 2011 (Average value of responses) .......................................48
Figure 26. FDI growth prospects, by host region/group, 2007–2010 and 2008–2011 (Average value of responses) ............................49
Figure 27. The 15 most attractive economies for the location of FDI, 2009–2011 (Per cent of responses) ....................................54
vi World Investment Prospects Survey 2009-2011
WIPS 2009-2011
Tables
Table 1. Summary of survey results ............................................................6Table 2. FDI outflows and cross-border M&A purchases,
by region and major economy, 2007-2008 ................................22Table 3. Percentage of companies with investments in different host
regions, by home region (Per cent of responses) ........................28Table 4. Importance of locational factors, by industry, 2009–2011
(Per cent of all responses per sector) ..........................................44Table 5. FDI inflows and cross-border M&A sales, by region and
major economy, 2007-2008........................................................46Table 6. Main investment indicators by region ........................................50Table 7. Top FDI destinations, by home region........................................55Table 8. Top 15 countries for FDI, by factors favouring investment,
2009–2011 ...................................................................................57
Box figures
Box figure 2.1. Proportion of various corporate functions undertaken abroad, 2008 and 2011 (average value of responses) .......20
Box figure 3.1. Locational criteria in order of importance, 2009-201 (per cent of responses).......................................................56
Annex tables
Annex table 1. Comparing the representation of the frame, sample and survey responses, by region...........................64
Annex table 2. Comparing the representation of the frame, sample and survey responses, by sector ...........................64
Annex table 3. List of WIPS regional experts............................................65Annex table 4. Top 5,000 companies by sector and industry...................66Annex table 5. Top 5,000 companies by size of total assets .....................67Annex table 6. Top 5,000 companies by total assets,
by home country of the parent company ..........................67Annex table 7. Respondents by sector and industry .................................68Annex table 8. Respondents by size of total assets ...................................69Annex table 9. Respondents by home region ............................................69Annex table 10. Classification by home region ...........................................70Annex table 11. Classification by host region .............................................70Annex table 12. Classification by industry .................................................. 71

vii
WIPS 2009-2011
ABBREVIATIONS
CIS Commonwealth of Independent States
EU European Union
FDI foreign direct investment
JBIC Japan Bank for International Cooperation
M&A merger and acquisition
PWC PricewaterhouseCoopers
R&D research and development
SEE South-East Europe
TNC transnational corporation
UNCTAD United Nations Conference on Trade and Development
WIPS World Investment Prospects Survey


ix
WIPS 2009-2011
PREFACE AND ACKNOWLEDGMENTS
UNCTAD’s World Investment Prospects Survey 2009–2011provides an outlook on future trends in foreign direct investment (FDI)by the largest transnational corporations (TNCs). The present publication is the most recent in a series of similar surveys that have been conducted regularly by UNCTAD since 1995 as part of the background work for its World Investment Reports. The series includes InternationalInvestment: Towards the Year 2001 and International Investment: Towards the Year 2002 (UNCTAD, 1997; UNCTAD, 1998), published jointly by Arthur Andersen, Invest in France Mission and UNCTAD, as well as two UNCTAD publications entitled Prospects for Foreign Direct Investment and the Strategies of Transnational Corporationsfor the years 2004–2007 and 2005–2008 respectively (UNCTAD, 2004; UNCTAD, 2005). The present survey and the two previous ones, published in 2007 and 2008 respectively, are entitled World Investment Prospects Survey (UNCTAD, 2007, UNCTAD 2008a).
Research collaboration for the present survey and analysis of the results were conducted principally by Fabrice Hatem and by an UNCTAD team including Michael Hanni and Sara Tougard de Boismilon, under the overall guidance of Masataka Fujita and Anne Miroux. The report was finalized under the direction of James Zhan.
Assistance was provided at various stages by Kumi Endo, Jovan Licina and Lizanne Martinez. The text benefited from comments and feedback by Torbjorn Fredriksson, Guoyong Liang, Kornel Mahlstein and Joerg Weber. Séverine Excoffier and Katia Vieu provided secretarial assistance and desktop publishing was done by Teresita Ventura. It was edited by Praveen Bhalla.
A panel of location experts was established to provide qualitative analysis on FDI trends and to contribute to assessing the results of the survey. We would like to thank in particular Oscar Alvarez, Jan Atteslander, Chantal Chan Yone, Hugues Chevalier, Fang Fang, Nicolas Forsans, Parul Jain, Thomas Jost, Jean-François Outreville, Magnus Runnbeck and Susumu Ushida. The following institutions provided support: Association française des économistes d’entreprise (France), Economiesuisse (Switzerland), National Association for Business Economics (United States), University of HEC Montréal (Canada), University of Leeds (United Kingdom), Shanghai University of Finance and Economics (China).


EXECUTIVE SUMMARY
Like other economic activities, foreign direct investment (FDI) has been going through dramatic changes since the end of 2008. The unusual magnitude of the ongoing economic and financial crisis – the worst in the last 60 years – raises major concerns about the propensity and capability of TNCs to continue investing and expanding abroad. Faltering profits, reduced access to financial resources, declining market opportunities, as well as the risk of a possible worsening of the current global economic downturn are obvious causes for a fall in FDI flows. This in turn also raises concerns among host countries – especially in the developing world – which rely heavily on international investments to finance their domestic growth and employment creation.
To what extent will the crisis affect FDI flows? When can a rebound be expected? Which host regions and industries will be most affected? One possible way to gain insights into these issues is to question TNC executives about the effect of the crisis on their international investment strategies. This is the major focus of this year’s World Investment Prospects
Survey (box 1).
Box 1. The UNCTAD World Investment Prospects Survey:a methodological brief
In order to complement its analysis of FDI trends in its annual World Investment Reports, UNCTAD conducts an annual survey of a sample of company executives selected among the largest non-financial transnational corporations (TNCs) (annex 1). This survey, published as the World Investment Prospects Survey (WIPS), aims at providing insights into FDI patterns over the subsequent three years. Rather than providing a quantitative projection, it offers an assessment of respondents’ views at the time the survey was undertaken.
This year’s WIPS 2009–2011 is based on 241 responses collected by mail, e-mail and direct answers to a dedicated website between February and May 2009. About 20 direct interviews with respondents were also conducted in order to gain a more in-depth understanding of companies’ internationalization strategies.
To explore medium-term opportunities and analyse risks and uncertainties affecting FDI, interviews were also conducted with a number of location experts – consultants, academics and members of investment promotion agencies (listed in annex table 3).
WIPS 2009–2011 is based on the same methodology as the 2007 and 2008 surveys, thereby allowing a comparison of the results (annex 1).
Source: UNCTAD.
2 World Investment Prospects Survey 2009-2011
WIPS 2009-2011
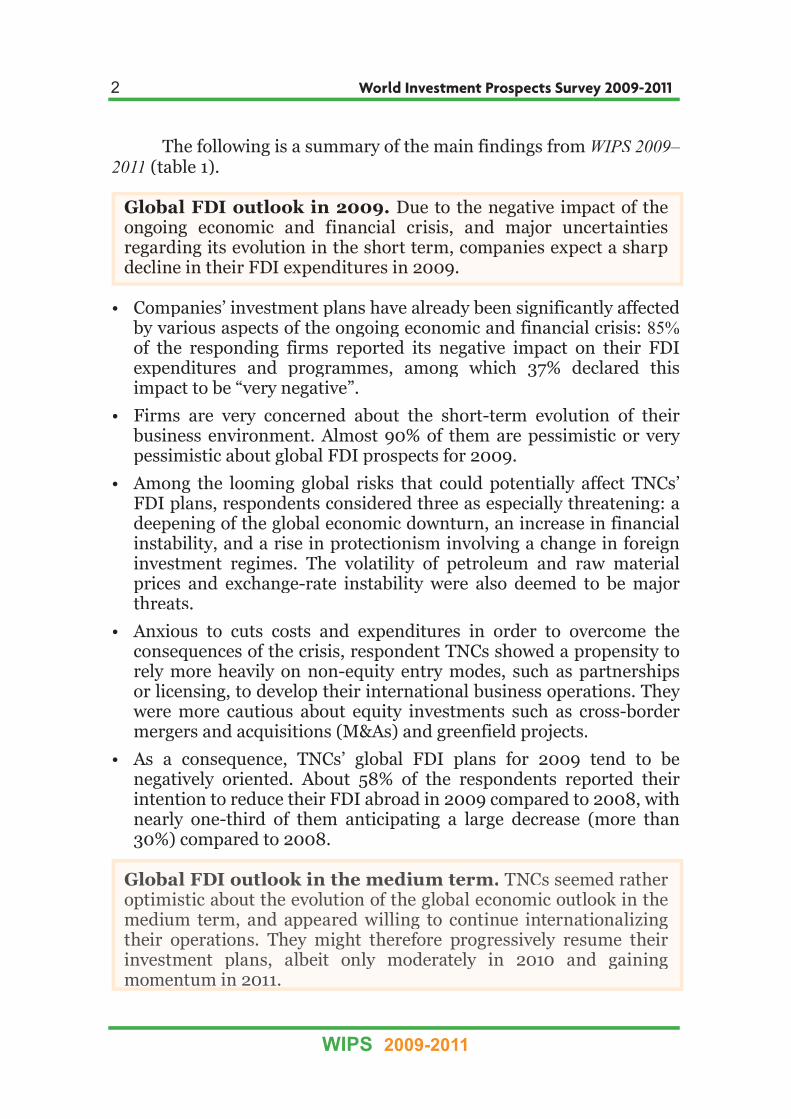
The following is a summary of the main findings from WIPS 2009–
2011 (table 1).
Global FDI outlook in 2009.Global FDI outlook in 2009. Due to the negative impact of the Due to the negative impact of the ongoing economic and financial crisis, and major uncertainties ongoing economic and financial crisis, and major uncertainties regarding its evolution in the short term, companies expect a sharp regarding its evolution in the short term, companies expect a sharp decline in their FDI expenditures in 2009.decline in their FDI expenditures in 2009.
Companies’ investment plans have already been significantly affectedby various aspects of the ongoing economic and financial crisis: 85%of the responding firms reported its negative impact on their FDIexpenditures and programmes, among which 37% declared thisimpact to be “very negative”.
Firms are very concerned about the short-term evolution of theirbusiness environment. Almost 90% of them are pessimistic or very pessimistic about global FDI prospects for 2009.
Among the looming global risks that could potentially affect TNCs’FDI plans, respondents considered three as especially threatening: adeepening of the global economic downturn, an increase in financialinstability, and a rise in protectionism involving a change in foreigninvestment regimes. The volatility of petroleum and raw materialprices and exchange-rate instability were also deemed to be majorthreats.
Anxious to cuts costs and expenditures in order to overcome theconsequences of the crisis, respondent TNCs showed a propensity to rely more heavily on non-equity entry modes, such as partnershipsor licensing, to develop their international business operations. They were more cautious about equity investments such as cross-bordermergers and acquisitions (M&As) and greenfield projects.
As a consequence, TNCs’ global FDI plans for 2009 tend to benegatively oriented. About 58% of the respondents reported theirintention to reduce their FDI abroad in 2009 compared to 2008, withnearly one-third of them anticipating a large decrease (more than30%) compared to 2008.
Global FDI outlook in the medium term.Global FDI outlook in the medium term. TNCs seemed ratherTNCs seemed ratheroptimistic about the evolution of the global economic outlook in theoptimistic about the evolution of the global economic outlook in themedium term, and appeared willing to continue internationalizingmedium term, and appeared willing to continue internationalizingtheir operations. They might therefore progressively resume their their operations. They might therefore progressively resume their investment plans, albeit only moderately in 2010 and gaininginvestment plans, albeit only moderately in 2010 and gainingmomentum in 2011.momentum in 2011.
3
WIPS 2009-2011
Business executives expressed less negative views for the medium term than for 2009. Roughly 45% of them were “optimistic” or “very optimistic” about the global business environment for 2011, as compared to 10% for 2010 and 0% for 2009.
In addition, the crisis will not affect the overall trend towards furtherinternationalization of companies’ activities. For instance, nearly 48%of respondents said they intended to carry out more than half of their investments abroad in 2011, as against only 41% in 2008.
This trend towards greater internationalization appears to cover all business functions, including those that are at present less internationalized, such as research and development (R&D). Around48% of respondent companies reported their intention to undertake more than half of their R&D abroad in 2011, compared with 41% in 2008.
Companies thus expect a progressive resumption of their international investments after the low point of 2009. Half of TNC respondentsexpected their FDI expenditures to be higher in 2011 than their 2008 levels, as against only 33% in 2010 and 22% in 2009.
FDI plans of respondent TNCs’ for the three years ahead do not show substantial differences by the nationality of the company. In all homeregions, a marked decline in 2009 may be followed by a moderaterebound in 2010, which will gain some momentum in 2011.
However, European TNCs, which already witnessed a strong pullback in outward FDI in 2008, seem slightly less optimistic than average. In contrast, TNCs from developing countries, whose FDI outflows wererelatively resilient in 2008, indicate more dynamism for the comingthree years than companies from other region. Japanese TNCs, afterhaving posted a very strong year in 2008, do not show much appetite for further increasing their FDI until 2011. As for North American TNCs, they seem quite eager to resume growth in FDI expenditure following a setback in 2008 and, most probably, in 2009.
FDI prospects by home region.FDI prospects by home region. The “decrease-then-rebound” The “decrease-then-rebound” pattern in TNCs’ investment plans for 2009–2011 seems similarpattern in TNCs’ investment plans for 2009–2011 seems similaracross all regions. However, companies from emerging economiesacross all regions. However, companies from emerging economiesappear to be slightly more optimistic than those from developed appear to be slightly more optimistic than those from developed countries, especially the European countries. countries, especially the European countries.

4 World Investment Prospects Survey 2009-2011
WIPS 2009-2011
Many business-cycle-sensitive industries such as automotives and other transport materials, metal and non-metal products, chemicals, and, more generally, the manufacturing sector as a whole, have been among the worst affected by the crisis, resulting in a direct negativeimpact on their FDI plans. 1
On the other hand, some less cyclical activities that rely more onstable demand, such as agri-food and many services, or on supplyingmarkets with quick growth prospects in the medium term, such as pharmaceuticals, have been less affected.
The preference of TNCs for developing countries in their investment plans may further increase over the next three years, mainly to the benefit of East, South and South-East Asia. Respondents consider the growth of markets, and, to a very limited extent, the availability of cheap labour, as the most attractive factors in these subregions.
In contrast, so far, developed economies in Europe and North America have been the worst affected by the recent setback in TNCs’ FDI plans. However, these regions, which at present host the largest proportion of FDI flows and stocks, still rank very high on TNCs’ priority lists. The quality of their business environment (including such factors as government efficiency, quality of infrastructure and availability of skills and talent) is frequently mentioned by TNCs as one of their major assets.
Asian countries are well represented among the 15 most favoured locations. In this list, five countries are from developing Asia (including
FDI prospects by host region.FDI prospects by host region. Developed countries in Europe and Developed countries in Europe and North America may be severely affected by the downsizing of TNCs’North America may be severely affected by the downsizing of TNCs’investment plans and by their increasing preference for emerginginvestment plans and by their increasing preference for emergingeconomies. However, they still enjoy major advantages in terms of economies. However, they still enjoy major advantages in terms of market size and business environment, thus remaining among the market size and business environment, thus remaining among the top priority countries for investors.top priority countries for investors.
FDI prospects by industry.FDI prospects by industry. TNCs in industries sensitive to the TNCs in industries sensitive to thebusiness cycle, which have been severely affected by the crisis, such asbusiness cycle, which have been severely affected by the crisis, such asautomotives, metals and chemicals, are among those that expressed automotives, metals and chemicals, are among those that expressed the most negative views concerning their FDI plans. Even in lessthe most negative views concerning their FDI plans. Even in lessaffected industries, such as pharmaceuticals, food and beverages,affected industries, such as pharmaceuticals, food and beverages,and most service industries, the crisis has had a significantly negative and most service industries, the crisis has had a significantly negative impact on their investments plans. impact on their investments plans.

5
WIPS 2009-2011
China and India, ranked 1st and 3rd respectively), three countries are from the EU-15, two each from North America and South America, and one each from the Commonwealth of Independent States/South-East Europe (CIS/SEE), other developed and the new EU-12. 2
Few changes have occurred in the list of 15 most favoured locations since last year’s survey: the number of countries from South, East and South-East Asia has increased from 4 to 5, while the ranking of some developed countries (such as the United States and the United Kingdom) has improved slightly.
This report is divided into four chapters. Chapter 1 provides an assessment of the global FDI outlook for 2009–2011. Chapters 2 and 3 offer insights into specific trends by home region and industry respectively, and chapter 4 focuses on prospects by host region and country.

6 World Investment Prospects Survey 2009-2011
WIPS 2009-2011
Table 1. Summary of survey results (Per cent of responses)
A. Global prospects (% of respondents)
FDI growth prospects (compared with 2008) IncreaseRemain
the SameDecrease
2009 22 20 582010 33 26 412011 50 31 19
Impact of the economic and financial crisis on FDI plans
Negative No Impact Positive
Global economic downturn 85 13 2Financial crisis and credit crunch 79 18 3Exchange rate fluctuations 48 38 14State intervention in the financial sector 14 70 16
Level of expected internationalization in 2011Less than
10% 10% - 50%
Morethan 50%
Corporate functionsProduction of goods and services 18 34 48Sales offices 16 37 48Logistics and distribution 27 37 37Call centres and customer relations management 44 28 28Administrative support and shared service centres 40 40 20Research and development 41 43 15Finance 45 45 10Headquarters and decision-making centres 61 33 6
Common indicatorsSales 2 31 68Investment expenditures 12 40 48Employment 12 42 46Capital stocks 26 49 25
Major risk factors for global FDI flows, 2009–2011Very
unlikelyUnlikely Neutral Likely
Very likely
Exchange rate fluctuation 1 4 20 54 23
Worsening of the global economic downturn 1 15 28 39 17
Volatility of petroleum and raw material prices 2 10 23 53 13
Volatility of prices in general (inflation or deflation) 3 11 27 49 10
Increased financial instability 1 18 32 40 10
Growing protectionism and changes in investment regimes
5 12 22 53 9
Environmental crisis (e.g. climate change) 13 27 32 23 6
War and political instability 19 31 31 16 4Threats to personal and business safety (e.g. terrorism, crime)
13 32 31 21 4
Food crisis (e.g. shortage in supplies, retail price volatility)
13 30 36 18 3
/…

7
WIPS 2009-2011
Table 1. Summary of survey results (concluded)(Per cent of responses to the UNCTAD survey)
Top six destinations for FDI in 2009–2011China 56United States 47India 34Brazil 25Russian Federation 21United Kingdom 18
Leading factors influencing the location of companies, 2009–2011 (per cent of responses)Size of local market 17Growth of market 16Presence of suppliers and partners 10Access to international/regional markets 10Stable and business-friendly environment 8
Most important location criteria by sector, 2009–2011
Primary sector Manufacturing sector Services sectorAccess to natural resources Size of local market Size of local market
Stable and business-friendly environment Growth of market Growth of market
Size of local market Presence of suppliers and partners Presence of suppliers and partners
Growth of market Access to international/regional markets Access to international/regional market
B. Regional prospects
Africa Asia Developed countries/groups
NorthAfrica
Sub-SaharanAfrica
West Asia
South, East and South-East Asia
Latin America and the
Caribbean
UnitedStates and
CanadaEU-15
NewEU-12
OtherEurope
Otherdevelopedcountries
South-EastEurope and
CIS
Companies with FDI stocks in the relevant regions in 2009(per cent of respondents)
19.5 16.9 37.0 64.9 44.2 74.7 77.9 35.1 31.8 36.4 38.3
Expected change in FDI by region, 2009–2011 (1=decrease of more than 50%; 5=unchanged; 9=increase of more than 50%)
5.0 5.1 5.6 6.4 5.8 5.4 5.4 5.7 5.2 5.3 5.6
Level of priority for each region as an FDI location 2009–2011 (1=marginal; 5=very important)
1.9 1.7 2.8 3.9 3.1 3.9 3.9 3.0 2.3 2.6 2.9

8 World Investment Prospects Survey 2009-2011
WIPS 2009-2011
Notes1
Financial companies are not included in the survey. 2

CHAPTER I. SHARP SHORT-TERM DECLINE, FOLLOWED BY A PROGRESSIVE RECOVERY
IN TNCs’ FDI PLANS 3
The results of this year’s World Investment Prospects Survey (WIPS)S
show that the global economic and financial crisis has already had amajor negative impact on TNCs’ FDI plans in the short term. Recovery is expected to begin slowly in 2010, gathering momentum in 2011.Following an analysis of the causes and patterns of the present setback,this chapter focuses on the conditions and mechanisms of the rebound.
Investment plans for 2009 indicate a sharp fall
Most of respondent companies intend to reduce their
FDI in 2009
The year 2008 marked the end of a growth cycle in internationalinvestment that started in 2004, with world FDI inflows reaching a historichigh of $1.9 trillion in 2007 (figure 1). TNCs were faced simultaneously with the consequences of the global economic slowdown (and recessionin a number of major economies), leading to falling market expectations,tighter credit conditions, reduced asset values following the stock marketcrash, and a slump in corporate profits. As a result, many TNCs announcedplans to curtail output, lay off workers and cut capital expenditure, all of which affected FDI: FDI flows are estimated to have declined by 15% in2008 (UNCTAD, 2009).
While global FDI flows have already declined by about 15% in 2008,While global FDI flows have already declined by about 15% in 2008,responses by the largest TNCs to the survey indicate a further fallresponses by the largest TNCs to the survey indicate a further fallin their planned FDI expenditures for 2009. Confronted by thein their planned FDI expenditures for 2009. Confronted by theconsequences of the ongoing crisis, companies appeared very consequences of the ongoing crisis, companies appeared very pessimistic about their overall business and investment outlook in pessimistic about their overall business and investment outlook in the short term. They expressed concerns about the risks of additionalthe short term. They expressed concerns about the risks of additionalfinancial shocks, a further deterioration of the global economic financial shocks, a further deterioration of the global economic situation and a rise in protectionism. They thus intend to implement situation and a rise in protectionism. They thus intend to implement very cautious strategies regarding their FDI expenditures, eithervery cautious strategies regarding their FDI expenditures, eitherM&As and greenfields, and express a slightly rising interest in M&As and greenfields, and express a slightly rising interest in non-equity international expansion modes such as partnerships, non-equity international expansion modes such as partnerships, outsourcing or licensing.outsourcing or licensing.g gg g

10 World Investment Prospects Survey 2009-2011
WIPS 2009-2011
Figure 1. FDI inflows, global and by group of economies, 1980-2008(Billions of dollars)
Source: UNCTAD, based on FDI/TNC database (www.unctad.org/fdi statistics) and UNCTAD own estimates.
The setback in FDI has affected cross-border M&As in particular: their value fell sharply in 2008 following a record high the previous year. In addition, there has been a rising wave of divestments and restructurings (UNCTAD, 2009). Results from WIPS point to a significant worsening of the situation in 2009: 57% of respondent companies reported that they expected their FDI expenditures to decline this year compared with 2008. Only 22% of respondents reported their intention to increase such expenditures in 2009 (figure 2), compared with more than 60% in mid-2008 (UNCTAD, 2008a).
Figure 2. Respondent companies’ FDI expenditures plans, 2009–2011, as compared to 2008
(Per cent of responses)
Source: UNCTAD survey.

11
WIPS 2009-2011
UNCTAD data for the first quarter of 2009 confirm the magnitude of the expected downturn in FDI. For the 26 countries for which these data were available by late May 2009, FDI outflows in the first three months of 2009 were down by 47% from the same period in 2008. Only 5 countries (among which no major investor abroad) recorded a rise in their FDI outflows, while 21 (including major investors abroad such as France, Germany and Japan) recorded a decline.
Survey results help to identify some of the major reasons why companies plan to reduce their FDI. First, the financial crisis and economic downturn have both reduced the capability and propensity of firms to invest, especially abroad. Second, the crisis has created a climate of widespread concern about global risks and uncertainty, which acts as a strong deterrent to the implementation of ambitious FDI programmes. Third, companies willing to expand abroad might rely slightly more on non-equity modes such as partnerships and licensing in order to reduce their investment expenditures.
A strong negative impact of the crisis on investment
plans
It is possible to track the growing impact of the crisis on large TNCs’ investment plans by comparing the results of this year’s and last year’s WIPS. In the 2008 WIPS survey, which was conducted at spring 2008, only 40% of companies reported being affected by the crisis, and a large majority of them (68%) still stated their intention to increase their investments abroad over the next three years, a percentage only slightly lower than in the 2007 WIPS. In other words, as seen from mid-2008, the dominant perception among investors was that the overall impact of the sub-prime crisis on economic growth and on their own business would be rather limited for the years to come, even though they expressed a growing concern about the potentially negative impact of financial instability and exchange rate fluctuations (UNCTAD, 2008a).
This year’s picture, in the context of the worst global recession since the end of the Second Word War, is dramatically different. A large majority of TNCs (85% and 79% respectively) now believe the global economic downturn and the financial crisis have had a negative impact on their investment plans (figures 3 and 4). On the one hand, a negative perception of the evolution of markets,4 as well as declining margins and profits due to faltering sales, reduces the propensity to invest: this is

12 World Investment Prospects Survey 2009-2011
WIPS 2009-2011
the “economic crisis” effect. On the other hand, the reduced access and growing cost of credit has diminished companies’ ability to get external financing for new projects (including M&As and greenfield projects): this is the “financial crisis and credit crunch” effect 5 (for more details on these transmission channels, see UNCTAD, 2009).
Various other studies also point to a climate of widespread pessimism among business executives. PricewaterhouseCoopers’ 12th
Annual Global CEO Survey, released in January 2009 (PCW, 2009), showed a dramatic fall in respondents’ confidence level as compared to last year, with only 34% of the CEOs expressing optimism about their growth prospects for the three years ahead – the lowest level since the survey began in 2003. According to the latest CESIfo World Economic
Survey, released in May 2009 (IFO Institute, 2009), the assessment of the current world economic situation by respondents fell to another record low in the 2nd quarter of 2009, although expectations for the second half of 2009 showed some signs of improvement.
Figure 3. Impact of various aspects of the crisis on companies’ investment plans for 2009–2011
(Per cent of responses)
Source: UNCTAD survey.
13
WIPS 2009-2011
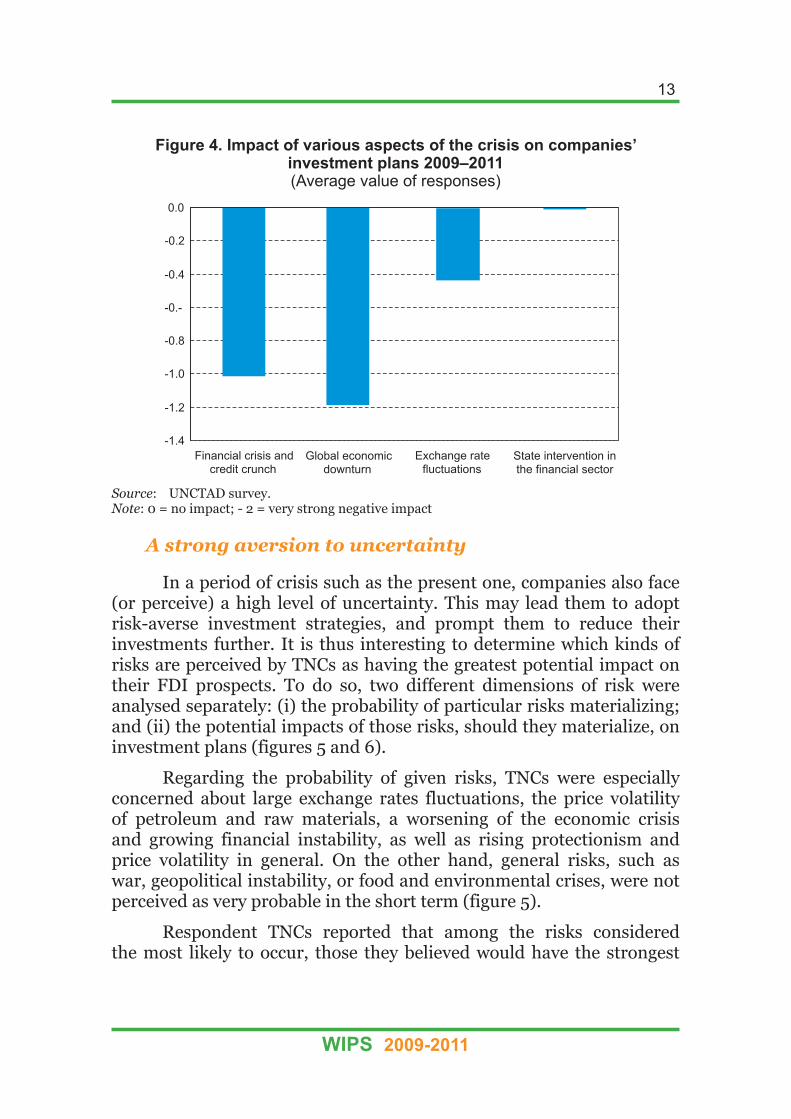
Figure 4. Impact of various aspects of the crisis on companies’ investment plans 2009–2011(Average value of responses)
Source: UNCTAD survey.Note: 0 = no impact; - 2 = very strong negative impact
A strong aversion to uncertainty
In a period of crisis such as the present one, companies also face (or perceive) a high level of uncertainty. This may lead them to adopt risk-averse investment strategies, and prompt them to reduce their investments further. It is thus interesting to determine which kinds of risks are perceived by TNCs as having the greatest potential impact on their FDI prospects. To do so, two different dimensions of risk were analysed separately: (i) the probability of particular risks materializing; and (ii) the potential impacts of those risks, should they materialize, on investment plans (figures 5 and 6).
Regarding the probability of given risks, TNCs were especially concerned about large exchange rates fluctuations, the price volatility of petroleum and raw materials, a worsening of the economic crisis and growing financial instability, as well as rising protectionism and price volatility in general. On the other hand, general risks, such as war, geopolitical instability, or food and environmental crises, were not perceived as very probable in the short term (figure 5).
Respondent TNCs reported that among the risks considered the most likely to occur, those they believed would have the strongest

14 World Investment Prospects Survey 2009-2011
WIPS 2009-2011
potential impacts were: a worsening of the economic crisis and increased financial instability. Consequently, they viewed these, overall, as the greatest threats to FDI plans (figure 6). 6
Figure 5. Most likely risks and their potential impact on companies’ decisions
(Average value of responses)
Source: UNCTAD survey.Note: Probability on a scale of 0 (not probable) to 4 (very probable); impact on a scale of +2
(very positive impact) to -2 (very large negative impact).
Figure 6. Importance of risk factors for FDI decisions, 2009–2011(Average value of responses)
Source: UNCTAD survey.Note: -4 = large negative impact very probable; 0 = negligible impact very probable.

15
WIPS 2009-2011
The expected strong impact of a potential rise in FDI protectionism is also worth noting. Some political tensions have been observed in recent years over such matters as the acquisition of domestic companies by foreign interests (especially hedge funds and State-owned enterprises including sovereign wealth funds) and the protection of natural resources from foreign ownership. This has led to a rising, although still limited, wave of measures restricting FDI, especially in some Latin American countries as well as in the Russian Federation. Some companies are clearly concerned that the ongoing crisis could trigger additional restrictions on FDI. However, no significant protectionist backlash against FDI has been observed so far (UNCTAD, 2009).
Volatility of prices (especially raw materials), geopolitical instability and threats to personal safety were also perceived by TNCs as having a significant potential impact on FDI. On the other hand, the risks of food or environmental crises were not perceived as posing a potentially strong threat to FDI over the next three years.
Greater recourse to non-equity entry modes?
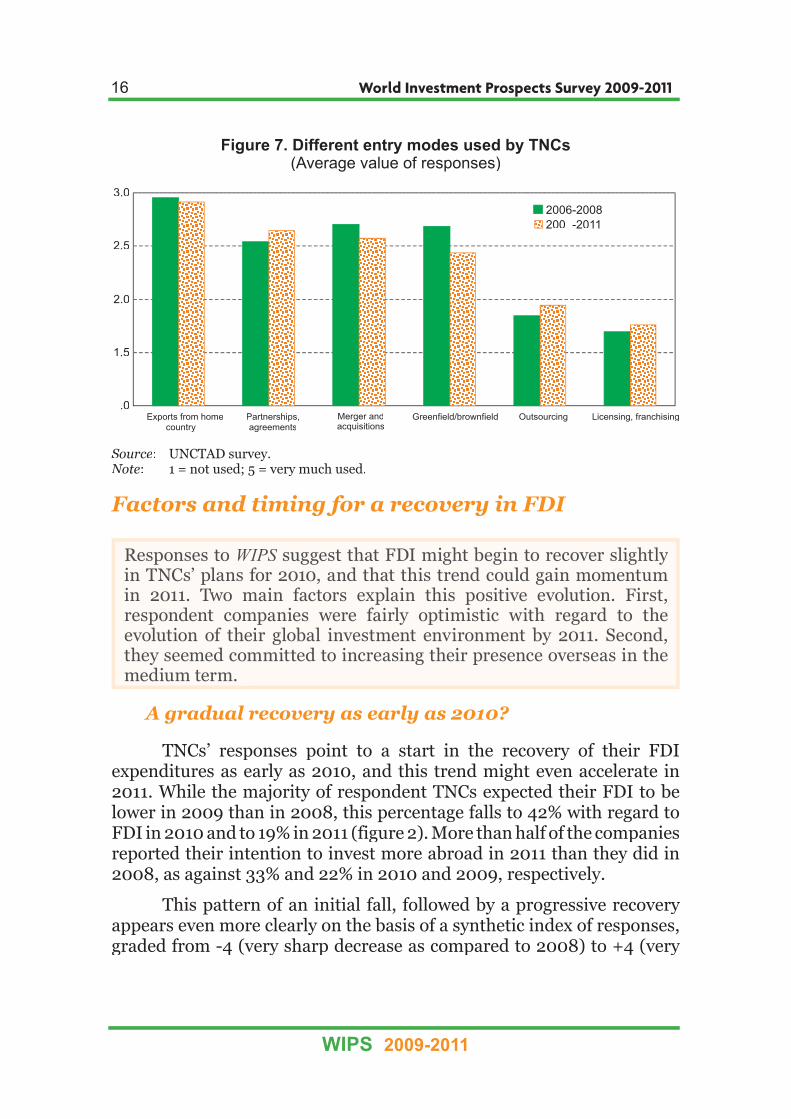
The current crisis is compelling companies to undertake cost-cutting measures as much as possible, including investments. This may explain why respondents to this year’s WIPS reported that they intended to reduce slightly their use of equity investments (i.e. M&As and greenfield projects) as an internationalization mode, preferring instead non-equity modes, such as licensing, outsourcing or other types of partnerships and agreements (figure 7).
While these changes generally were not statistically significant, due to the relatively small size of the sample, the trends are in keeping with those reported by other sources. Recent data confirm that cross-border M&As, which fell by 29% in value in 2008, were still in decline in the first quarter of 2009 (UNCTAD, 2009). As for the number of international greenfield investment projects, which had markedly increased in the first three quarters of 2008 (compared to the same period in 2007), they have been on the decline since the fourth quarter of 2008. A recent survey by PricewaterhouseCoopers also points to greater caution among CEOs with regard to undertaking M&As, while their interest in joint ventures is rising (PWC, 2009).
16 World Investment Prospects Survey 2009-2011
WIPS 2009-2011
Figure 7. Different entry modes used by TNCs (Average value of responses)
Source: UNCTAD survey. Note: 1 = not used; 5 = very much used.
Factors and timing for a recovery in FDI
A gradual recovery as early as 2010?
TNCs’ responses point to a start in the recovery of their FDIexpenditures as early as 2010, and this trend might even accelerate in2011. While the majority of respondent TNCs expected their FDI to belower in 2009 than in 2008, this percentage falls to 42% with regard toFDI in 2010 and to 19% in 2011 (figure 2). More than half of the companiesreported their intention to invest more abroad in 2011 than they did in2008, as against 33% and 22% in 2010 and 2009, respectively.
This pattern of an initial fall, followed by a progressive recovery appears even more clearly on the basis of a synthetic index of responses,graded from -4 (very sharp decrease as compared to 2008) to +4 (very
Responses to Responses to WIPSWIPS suggest that FDI might begin to recover slightly suggest that FDI might begin to recover slightly SSin TNCs’ plans for 2010, and that this trend could gain momentumin TNCs’ plans for 2010, and that this trend could gain momentumin 2011. Two main factors explain this positive evolution. First,in 2011. Two main factors explain this positive evolution. First,respondent companies were fairly optimistic with regard to the respondent companies were fairly optimistic with regard to the evolution of their global investment environment by 2011. Second,evolution of their global investment environment by 2011. Second,they seemed committed to increasing their presence overseas in thethey seemed committed to increasing their presence overseas in themedium term. medium term.

17
WIPS 2009-2011
sharp increase). While in 2009, this index falls to about -1 on average (showing only a slight decrease as compared to 2008), it begins to recover in 2010, coming back closer to the 2008 level, to slightly overtake it in 2011 (figure 8).
Figure 8. Respondent companies’ FDI expenditure plans as compared to 2008
(Average value of responses)
Source: UNCTAD survey.Note: - 4 = very large decrease (more than 50%); + 4 = very large increase (more than
50%).
TNCs’optimism grows over time
The first reason for this recovery is TNCs’ view that the global FDI environment will improve over time. For instance, more than 40% of respondent companies expressed overall optimism for the global FDI environment in the year 2011, against less than 10% for 2010 and 0% in 2009. In other words, a majority of companies seemed to believe that, after a very difficult year in 2009, the environment would begin to improve slightly in 2010, and even more in 2011 (figures 9 and 10).
In addition, in general, companies appeared to be less pessimistic about their own future than they were about their overall environment. 57% of them had a negative view about their own company’s investment prospects for 2009, to be compared to 90% expressing pessimism about the global FDI environment (figures 9 and 10).7 This difference could mean that individual TNCs are quite confident in their own capabilities both to resist the crisis and to take advantage of the economic upturn better than the average TNC.

18 World Investment Prospects Survey 2009-2011
WIPS 2009-2011
Figure 9. Distribution of the degree of optimism/pessimism regarding the medium-term FDI outlook, globally and for the respondent company
(Per cent of responses)
Source: UNCTAD survey.
Figure 10. Distribution of the degree of optimism/pessimism regarding the medium-term FDI outlook, globally and for the respondent company
(Average value of responses)
Source: UNCTAD survey.Note: - 2 = very pessimistic; + 2 = very optimistic.

19
WIPS 2009-2011
The process of internationalization is set to continue
One of the major reasons for an expected recovery in FDI in 2010-2011, after its decline in 2009, is that respondent companies intend to pursue their strategy of internationalization, albeit at a slower pace. This is true for all of the four indicators used in the survey: sales, employment, investments and assets (figure 11). In addition, other responses to WIPS
suggested that this internationalization trend would affect all business functions, from production to research and development (R&D) (box 2).
Other surveys confirm these findings. A recent survey by Japan Bank for International Cooperation (JBIC), for instance, showed that, although downside pressure in overseas operations is growing, a majority of Japanese manufacturing companies intend to increase the share of overseas production and sales in their total activities in the coming years (JBIC, 2008).8
Figure 11. Companies’ level of internationalization by various indicators, 2008 and 2011
(Per cent of responses)
Source: UNCTAD survey.

20 World Investment Prospects Survey 2009-2011
WIPS 2009-2011
Box 2. All business functions are set to internationalize
Responses to the survey confirm the usual patterns of internationalization: sales offices are the most internationalized, followed by production activities and logistics. On the other hand, the least internationalized functions are headquarters, finance and R&D (Box figure 2.1). Internationalization of all functions should continue, albeit at a relatively slow pace, over the three next years.
Box figure 2.1. Proportion of various corporate functions undertaken abroad, 2008 and 2011
(Average value of responses)
Source: UNCTAD survey.
Note: 1 = not internationalized; 5 = very internationalized.
Notes3
This is especially important, as the survey asked TNCs to consider their activities through 2011 in reference to 2008. As TNCs had already reduced their FDI expenditures in 2008 compared with 2007, as indicated by initial data available (UNCTAD, 2009), the prospect of a further decline is especially worrying.
4IMF forecasts released in April 2009 point to a decline in world GDP by 1.3% in 2009, followed by a timid rebound of 1.9% in 2010 (IMF, 2009).
5In addition, about half of the respondents reported that the recent exchange rates
due to the subsequent unpredictability of foreign revenues and costs), while less than 15% reported experiencing a positive direct impact of the recent government rescue packages and other stimulus programmes.
6The average expected impact of a risk is calculated as the product of the potential impact of the risk on FDI plans by the probability that the risk will occur.
7More than 10% were even optimistic about their own company’s investment prospects, as against 0% regarding FDI overall.
8It should be noted, however, that this survey was conducted in mid-2008, before the crisis

CHAPTER II. THE CRISIS HAS AFFECTED FDI PLANS IN ALL REGIONS
Does the impact of the ongoing crisis on FDI prospects differ by home region? Results of the survey suggest a nuanced response. On theone hand, there appears to be a very similar pattern of FDI plans in allhome regions, with a strong negative short-term impact, followed by a recovery. Responses also show that companies are eager to continueinternationalizing, whatever their home region. On the other hand,some specific differences can be observed: TNCs from Asian developingcountries, as well as from North America, were more positive about theirmedium-term FDI prospects than European and Japanese TNCs.
This chapter first shows the existence of a common underlyingpattern for all home regions, and then outlines some regional differencesin respondents’ views of global FDI prospects as well as the geographicalspread of respondent TNCs and its evolution over time.
TNCs’ FDI plans reveal a common pattern: a decrease followed by a rebound
A widespread negative impact in the short term
Buffeted by the growing global financial and economic crisis,TNCs around the world reduced their FDI in 2008, compared to 2007,thus ending nearly a five-year period of uninterrupted growth. Thisdecline, most pronounced in developed economies, was also apparentin developing economies where the rate of growth of FDI slowed downmarkedly to a flat 2% (table 2; and UNCTAD, 2009).
Responses to the survey clearly confirm the global nature of theeconomic and financial crisis, as FDI prospects are affected in similarways, regardless of the home region of the company.
Responses to the survey show that, worldwide, TNCs’ investmentResponses to the survey show that, worldwide, TNCs’ investmentplans have been affected by the crisis. However, TNCs in all majorplans have been affected by the crisis. However, TNCs in all majorhome regions also expect a recovery in the medium term, due, amonghome regions also expect a recovery in the medium term, due, amongothers factors, to resilient internationalization strategies and a others factors, to resilient internationalization strategies and a progressive but widespread return to optimism about the businessprogressive but widespread return to optimism about the businessenvironment.environment.

22 World Investment Prospects Survey 2009-2011
WIPS 2009-2011
Respondent companies from all home regions expressed very negative views concerning their business environment and global FDI prospects in the short term, (figure 12). In all regions, a large majority of TNCs also reported that the ongoing economic downturn had already exerted a negative impact on their FDI plans.
Consequently, respondent TNCs worldwide expected a decline in their FDI expenditures in 2009, with no regional exception (figure 13). Preliminary FDI data for the first quarter of 2009 confirm a sharp decline in FDI outflows, compared to the same period in 2008, in most of the 26 countries for which figures were available, regardless of the region to which they belong.
Table 2. FDI outflows and cross-border M&A purchases, by region and major economy, 2007–2008
a
(Billions of dollars)
FDI outflows Cross-border M&A purchases
2007 2008 a
Growth rate 2007 2008 a
Growth rate
Region/economy (%) (%)
World 2 063.4 1 868.9 - 9.4 1 699.8 1 205.4 -29.1
Developed economies 1 743.4 1 536.4 - 11.9 1 447.6 986.0 -31.9Europe 1 270.7 990.3 - 22.1 856.0 647.5 -24.4
United States 313.8 298.6 - 4.8 402.6 166.5 -58.7
Japan 73.5 127.4 73.2 38.8 64.3 65.6
Developing economies 268.8 274.1 2.0 199.4 181.1 -9.1Africa 5.3 .. .. 9.4 14.3 51.2
Latin America and the Caribbean 52.1 36.1 - 30.7 48.7 20.3 -58.3
Asia and Oceania 211.4 239.6 13.4 141.2 146.6 3.8
West Asia 44.8 .. .. 47.9 37.4 -21.9
South, East and South-East Asia 166.5 185.2 11.2 93.3 108.3 16.1
Transition economies 51.2 58.3 13.9 25.2 25.0 -0.5
Source: UNCTAD.a
Preliminary estimates. See UNCTAD’s World Investment Report 2009 (forthcoming for final figures).
Note: World FDI inflows in 2008 are estimates based on 79 economies for which data were available for either all or part of 2008 as of 6 April 2009. Where information for only part of 2008 was available, estimations were made by annualizing the data. The proportion of inflows to these economies in total inflows to their respective region or subregion in 2007 was used to extrapolate the 2008 data. For cross-border M&As, estimates were based on data available as of 5 January 2009.

23
WIPS 2009-2011
Figure 12. TNCs’ views on global FDI prospects, by home region, 2009–2011(Average value of responses)
Source: UNCTAD survey.Note: -2 = very pessimistic; + 2 = very optimistic
Figure 13. Change in respondent TNCs’ FDI relative to 2008, by home region, 2009–2011(Average value of responses)
Source: UNCTAD survey.Note: - 4 = very large decrease (more than 50%) ; + 4 = very large increase (more than
50%).

24 World Investment Prospects Survey 2009-2011
WIPS 2009-2011
Recovery expected in all home regions in 2011
As noted in chapter I, the views of TNCs on their global FDI environment and on their own FDI prospects improve markedly over time. This progressive return to optimism can be observed for all home regions. Only a minority of companies from developing Asia, Europe, Japan and the United States reported that they intended to invest less abroad in 2011 than in 2008 (figure 13).
In addition to the expected improvement in the general business environment, the expected rebound is due to the structural and widespread tendency of TNCs to internationalize. Thus, respondent companies from all home regions stated their intentions to increase by 2011 the share of foreign countries in their sales and employment as well as in their FDI expenditures and assets (figure 14). The survey results suggest that, despite fewer financial resources, the crisis could even give some additional impetus to this trend, as TNCs become more eager to access new markets in order to sustain sales and to relocate their production to the most competitive regions in order to cut costs and/or gain access to additional resources.
Figure 14. Internationalization index of respondent companies, by home region/country, 2008 and 2011
(Average value of responses)
Source: UNCTAD survey. Note: The internationalization index is calculated as the average of four indicators:
internationalization of sales, employment, investments and assets. 1 = not internationalized at all; 5 = very internationalized (more than 50 % of activities abroad).

25
WIPS 2009-2011
This is especially true for TNCs in Japan and the United States,which appear to be intent on increasing their internationalization in termsof the four major variables analysed in this survey: sales, employment,investments and assets.
FDI plans by home region
Beyond these common features, FDI plans for the three years ahead present some differences by home region.
Prospects for FDI in 2011 by European TNCs seem fairly moderate. Following the marked decline already observed in 2008(-22%), FDI outflows continued to decrease in the first quarter of 2009(for the countries for which data are available). From responses to the survey, European companies appear to hold a relatively pessimistic view on the medium-term evolution of their FDI environment (figure 13). This finding is in line with those of other sources, such as the IFO Global
Business Index (IFO, 2009) and PWC’s 12thurur
Annual CEO Survey (PWC, 2009), which point to deep pessimism among European companies.The deep recession in Europe, decreasing profits and tougher externalfinancing conditions explain why European TNCs anticipate only a slow recovery in their FDI expenditures after the low point reached in 2009.9
However, the situation may differ widely by country and industry.Even in distressed activities, some TNCs, such as Volkswagen AG, continue to have ambitious investment plans. It should also be noted thatsome recent surveys point to an improvement in European companies’ assessments of their business environment. In Germany, for instance,the ZEW-Financial Market Survey, conducted in May 2009, indicated stronger economic expectations for the country, pushing the index above its long-term average.10
TNCs from developing Asia11 plan a steady recovery intheir FDI in 2011. After rapidly increasing over the past few years, FDIoutflows from developing countries rose from less than 8% of the worldtotal in 1998 to about 13% in 2007. In 2008, they showed resilience to the overall decline of FDI, with a 2% increase compared with 2007.12
The situation seems to have changed in the first quarter of 2009, as data available for 10 developing countries suggest a strong decline in outflows
TNCs from developing Asia and North America seem more optimisticTNCs from developing Asia and North America seem more optimisticabout the rebound in their FDI than Japanese and European TNCs.about the rebound in their FDI than Japanese and European TNCs.

26 World Investment Prospects Survey 2009-2011
WIPS 2009-2011
for this period. This marked drop in 2009 is mainly due to decreasing sales and exports to developed markets,13 14 faltering cash flows and limited access to credit.
However, TNCs from developing Asia intend to rapidly resume their ambitious internationalization strategies: 57% of them intend to invest more abroad in 2011 than they did in 2008 – one of the highest percentage for all regions in the survey (figure 13). This result is confirmed by PWC’s 12
th Annual CEO Survey, which shows that CEOs from emerging
Asian countries are at present the most optimistic about their growth prospects over the next three years (PWC, 2009).
TNCs from the United States and Canada seem to be quite confident that their international investments will rebound.Outward FDI flows from the United States fell by about 5% in 2008 as a result of repatriations of reinvested earnings and debt by foreign affiliates of United States TNCs, while new investments abroad were halted. Responses by United States TNCs point to probable further cuts in investment programmes in 2009. However, their FDI plans remain quite ambitious, as 71 % of respondents reported that they expected the level of their outward FDI to be higher in 2011 than in 2008 (figure 13).
At first glance, these expectations may seem quite optimistic in view of the present recession affecting the United States.15 However, they are consistent with other sources that point to a possibly strong and even rapid recovery of the United States economy, which may boost revenues and facilitate further FDI. The latest IMF forecasts anticipate a recovery to take place in the United States in mid-2010, sooner than in other developed regions (IMF, 2009). The recent consensus forecast by the National Association of Business Economists (NABE, 2009) is even more optimistic: it points to a rebound as early as the last quarter of 2009. The latest results from the IFO’s World Economic Survey suggest that the expectations of North American CEOs have somewhat improved (IFO, 2009). PWC’s 12th Annual Global CEO Survey suggests that large companies in the United States are more optimistic than European companies, about their growth prospects for the three years ahead (PWC, 2009). The Conference Board’s Leading Economic Index for the United States
posted a sharp increase in April 2009, suggesting that the turning point may be near at hand.16 Finally, interviews with some companies suggest that the crisis may also be accelerating the internationalization plans of some United States TNCs as they seek to cut costs and gain efficiencies by moving selected operations abroad.

27
WIPS 2009-2011
Japanese TNCs expect only a moderate recovery in their FDI in 2011. However, the significance of this apparently bleak outlook must be viewed in the context of recent trends. There was a dramaticincrease in FDI outflows from Japan in 2008, due largely to a recordlevel of cross-border M&A purchases by cash-abundant Japanesecompanies ($64 billion). But responses by Japanese TNCs indicate amarked pullback from these high levels in 2009, followed by a very timidrecovery (figure 13). Data for the first quarter of 2009 confirm a 42%drop in Japanese FDI outflows compared to the same period in 2008.
Problems in the domestic economy, decreasing sales prospects inother developed-country markets17 and reduced access to credit18 largely explain this cautious attitude, which is confirmed by other sources. Forinstance, the Bank of Japan’s Tankan Survey in April 2009 posted the lowest confidence level recorded among large manufacturers since thesurvey began in 1974.19 Preliminary results of the Jetro survey report on overseas operations of Japanese companies show that 73% of respondenthad their overseas business performances negatively affected by the United States financial crisis (Jetro, 2009).
Geographical patterns of FDI: a regional perspective
There is an ongoing debate about the geographical scope of the largest TNCs. Are they only regional giants? For instance Rugman andVerbeke (2004) assert that very few TNCs can be considered global,or even bi-regional. Are they becoming progressively more global?Dunning, Fujita, and Yakova (2007), for example found that while TNCs from some home regions may exhibit a strong regional character in their investments, the trend of outward FDI is towards a more dispersed, global pattern. The results of this year’s WIPS seem to support their S
analysis. Respondent TNCs, while still according greater emphasis to their home regions, expressed a growing interest in other regions of the world as well.
European TNCs are the most internationalized of the top 5,000 non-financial companies, in terms of assets (annex table 6).Respondent European companies are also more internationalized than
While most of the respondent TNCs have been focusing more onWhile most of the respondent TNCs have been focusing more onregional than on global expansion strategies in the past few years,regional than on global expansion strategies in the past few years,they might progressively expand their geographical scope in thethey might progressively expand their geographical scope in thefuture.future.

28 World Investment Prospects Survey 2009-2011
WIPS 2009-2011
others, both globally (figure 14) and for most business functions (figure 15). They display a greater geographical spread, as they are present on average in 4.7 regions in the world, a level slightly higher than other TNCs (table 3).
Respondent European companies are relatively more concentrated than average, in terms of their present assets, in their home region (especially in the new EU-12, other Europe and CIS/SEE) as well as in Africa (table 3). They also have a very strong presence in North America.Regarding their future FDI plans, they also showed a greater preference than average for EU-15 and new EU-12 countries, and to a lesser extent for the Commonwhealth of Independent States and South-East Europe (CIS/SEE) and Africa (figure 16).However, they intend to increase significantly the level of priority given to developing regions where they have less presence, notably Asia and Latin America.
Table 3. Percentage of companies with investments in different regions, by home region
(Per cent of responses)
Host region
Home region Allrespondents
EuropeNorth
AmericaJapan
DevelopingAsia
Developed countriesEU-15 78 81 70 91 59
New EU-12 35 54 30 21 6
Other European countries 32 41 41 18 18
North America 75 67 93 88 53
Other developed countries 36 27 44 61 18
Developing countriesNorth Africa 19 33 11 12 ..
Sub-Saharan Africa 17 21 15 15 ..
Latin America and the Caribbean 44 44 63 48 18
West Asia 37 39 37 39 35
South, East and South-East Asia 65 53 74 82 71
South-East Europe and CIS 38 53 26 30 12
Average number of regions where the companies is present
4.3 4.7 4.6 4.6 2.6
Source: UNCTAD survey.
29
WIPS 2009-2011
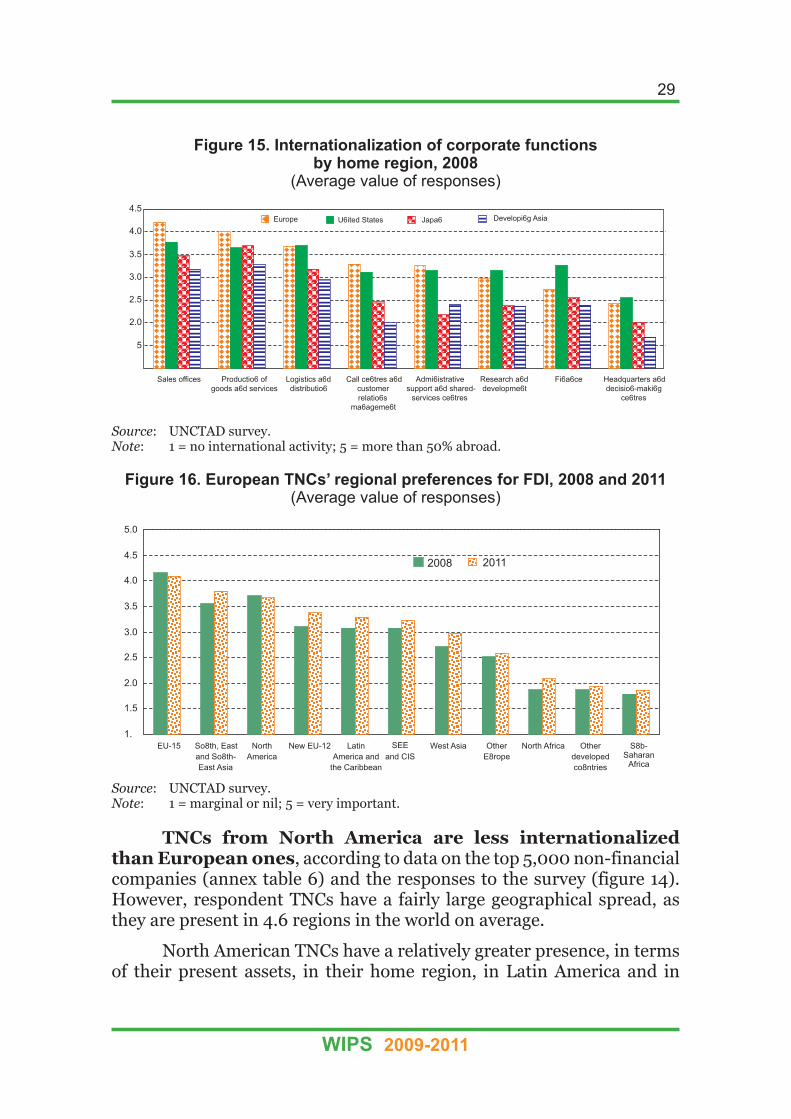
Figure 15. Internationalization of corporate functions by home region, 2008
(Average value of responses)
Source: UNCTAD survey.Note: 1 = no international activity; 5 = more than 50% abroad.
Figure 16. European TNCs’ regional preferences for FDI, 2008 and 2011(Average value of responses)
Source: UNCTAD survey.Note: 1 = marginal or nil; 5 = very important.
TNCs from North America are less internationalized than European ones, according to data on the top 5,000 non-financial companies (annex table 6) and the responses to the survey (figure 14). However, respondent TNCs have a fairly large geographical spread, as they are present in 4.6 regions in the world on average.
North American TNCs have a relatively greater presence, in terms of their present assets, in their home region, in Latin America and in
30 World Investment Prospects Survey 2009-2011
WIPS 2009-2011
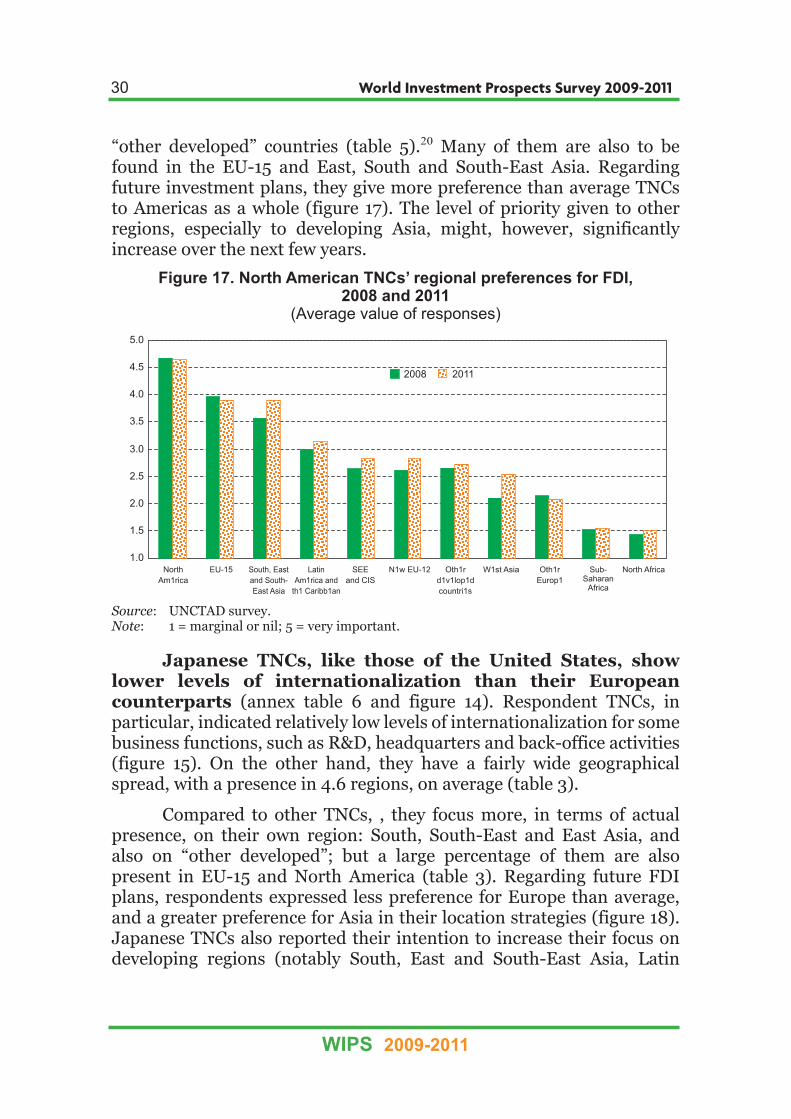
“other developed” countries (table 5).20 Many of them are also to be found in the EU-15 and East, South and South-East Asia. Regarding future investment plans, they give more preference than average TNCs to Americas as a whole (figure 17). The level of priority given to other regions, especially to developing Asia, might, however, significantly increase over the next few years.
Figure 17. North American TNCs’ regional preferences for FDI, 2008 and 2011
(Average value of responses)
Source: UNCTAD survey.Note: 1 = marginal or nil; 5 = very important.
Japanese TNCs, like those of the United States, show lower levels of internationalization than their European counterparts (annex table 6 and figure 14). Respondent TNCs, in particular, indicated relatively low levels of internationalization for some business functions, such as R&D, headquarters and back-office activities (figure 15). On the other hand, they have a fairly wide geographical spread, with a presence in 4.6 regions, on average (table 3).
Compared to other TNCs, , they focus more, in terms of actual presence, on their own region: South, South-East and East Asia, and also on “other developed”; but a large percentage of them are also present in EU-15 and North America (table 3). Regarding future FDI plans, respondents expressed less preference for Europe than average, and a greater preference for Asia in their location strategies (figure 18). Japanese TNCs also reported their intention to increase their focus on developing regions (notably South, East and South-East Asia, Latin

31
WIPS 2009-2011
America, and, to a lesser extent, Africa) and on transition economies over the next few years. These results are largely consistent with those of a survey of Japanese TNCs conducted by the JBIC (JBIC, 2008).21
Figure 18. Japanese TNCs’ regional preferences for FDI, 2008 and 2011(Average value of responses)
Source: UNCTAD survey.Note: 1 = marginal or nil; 5 = very important.
Responses to the survey by TNCs from developing Asia point to a relatively limited internationalization index (figure 14). These companies indicated a lower geographical spread than the TNCs from developed countries, with a presence, on average, in only 2.6 regions (table 3). These findings are consistent with the analysis of the top 100 TNCs from developing countries in the World Investment Report,
2008 (UNCTAD, 2008b).22 Asian TNCs are also less internationalized for practically all business functions (figure 15).
Their actual presence abroad is very much focused on East, South and South-East Asia, and to a lesser extent on West Asia, though they also have a significant presence in the EU-15 and North America (table 3). Compared to TNCs from other regions, they give much higher priority to Asia in their future FDI plans (figure 19). Survey respondents also appear to have ambitious international investment strategies, as they stated their intention to substantially increase their presence in practically all regions of the world, including developed economies.

32 World Investment Prospects Survey 2009-2011
WIPS 2009-2011
Figure 19. Asian developing countries TNCs’ regional preferences for FDI, 2008 and 2011
(Average value of responses)
Source: UNCTAD survey.Note: 1 = marginal or nil; 5 = very important.
Notes9 This is especially the case for some small and open countries very vulnerable to external
shocks, such a Switzerland, where large TNCs anticipate a stabilization of their FDI expenditures at a low level in 2010 after a sharp decrease in 2009.
10 Available at: http://www.zew.de/en/presse/presse.php?action=article_show&LFDNR =1196.
11Due to limited survey responses from other developing regions, the analysis of FDI plans of developing-country TNCs focuses only on the Asian region.
12
developing world.13
World exports are reported to have declined by 20% in the fourth quarter of 2008.14 See http://www.wto.org/english/res_e/statis_e/quarterly_world_exp_e.htm . 15 A recent consensus forecast by NABE (2009) indicates a 20% decrease in domestic business
investment expenditures in the United States in 2009. According to the same forecast,
16 See: http://www.conference-board.org/pdf_free/economics/bci/slowbus.pdf17 Especially in export-dependent industries such as automotives and electronics.18
institutions’ attitudes to lending were becoming increasingly severe (see http://www.boj.or.jp/en/type/stat/boj_stat/tk/yoshi/tk0903.htm).
19 See: http://www.boj.or.jp/en/type/stat/boj_stat/tk/yoshi/tk0903.htm.20 Dunning, Fujita and Yakova (2007) also found that, when adjusted for host-country GDP,
both the United States and Canada focus a large share of their outward FDI within the Americas.
21 JBIC found that the countries that Japanese TNCs consider the most promising over the next three years are, in that order: China, India, Viet Nam, the Russian Federation, Thailand, Brazil, the United States and Indonesia.
22 It should be mentioned however, that the analysis, based on the Thomson Financial database, suggests that some of these companies have already reached a very high level of internationalization, in terms of assets, due mainly to their large presence in China (annex table 6).

CHAPTER III. BUSINESS-CYCLE-SENSITIVE INDUSTRIES THE WORST HIT BY THE CRISIS
The impact of the crisis on FDI prospects differs widely, dependingon activities. Business-cycle-sensitive industries, such as chemicals andother intermediate goods, professional equipment and the automobileindustry have been severely affected, while agri-food, pharmaceuticalsand services in general seem to have been more resilient. This chapterpresents a broad description of overall trends by sector, followed by amore detailed analysis by industry.
The primary sector and services face better FDI prospects than manufacturing
Key findings
Although all industries have been affected by the economicdownturn, the impact of the crisis on investment and TNCs’ plans differsconsiderably by industry (figure 20).
On the one hand, many business-cycle-sensitive industries suchas motor vehicles, chemicals, metallic and non-metallic products,machinery and equipment, and more generally the manufacturingsector as a whole, have been among the worst affected by the crisis.24
On the other hand, the industries which exhibit less cyclical, more stable demand patterns, or whose markets are in a phase of rapid growth, have been less affected. These are mainly telecommunications, business services, pharmaceuticals, food and beverages, and theservices sector in general.25
Finally the primary sector displays a unique pattern, characterized by severe immediate cuts in investments plans for some activities dueto falling prices and demand in the short term; but there are also
TNCs active in the services sector have slightly more upbeat FDI TNCs active in the services sector have slightly more upbeat FDI plans until 2011 than those in manufacturing. The latter, on average,plans until 2011 than those in manufacturing. The latter, on average,have been more badly affected by the crisis.have been more badly affected by the crisis.2323 In the primary sector In the primary sectorTNCs expect a strong rebound in their investments by 2011 after a TNCs expect a strong rebound in their investments by 2011 after a marked fall in 2009.marked fall in 2009.

34 World Investment Prospects Survey 2009-2011
WIPS 2009-2011
very promising medium-term prospects, paving the way for a quick recovery of investments.
Figure 20. Impact of the economic downturn on TNCs’ investment plans, 2009–2011, by sector/industry
(Average value of responses)
Source: UNCTAD survey.Note: 0 = no effect; - 2 = very negative effect. a
Excludes pharmaceuticals.
Analysis by sector
Regarding FDI growth prospects until 2011, from the majority of responses to the survey, it would appear that all three sectors (primary, manufacturing and services) share a common pattern, characterized by a steep decline in 2009, followed by a rebound in 2010, gaining momentum in 2011, and finally leading to FDI reaching higher levels in 2011 than in 2008.
35
WIPS 2009-2011
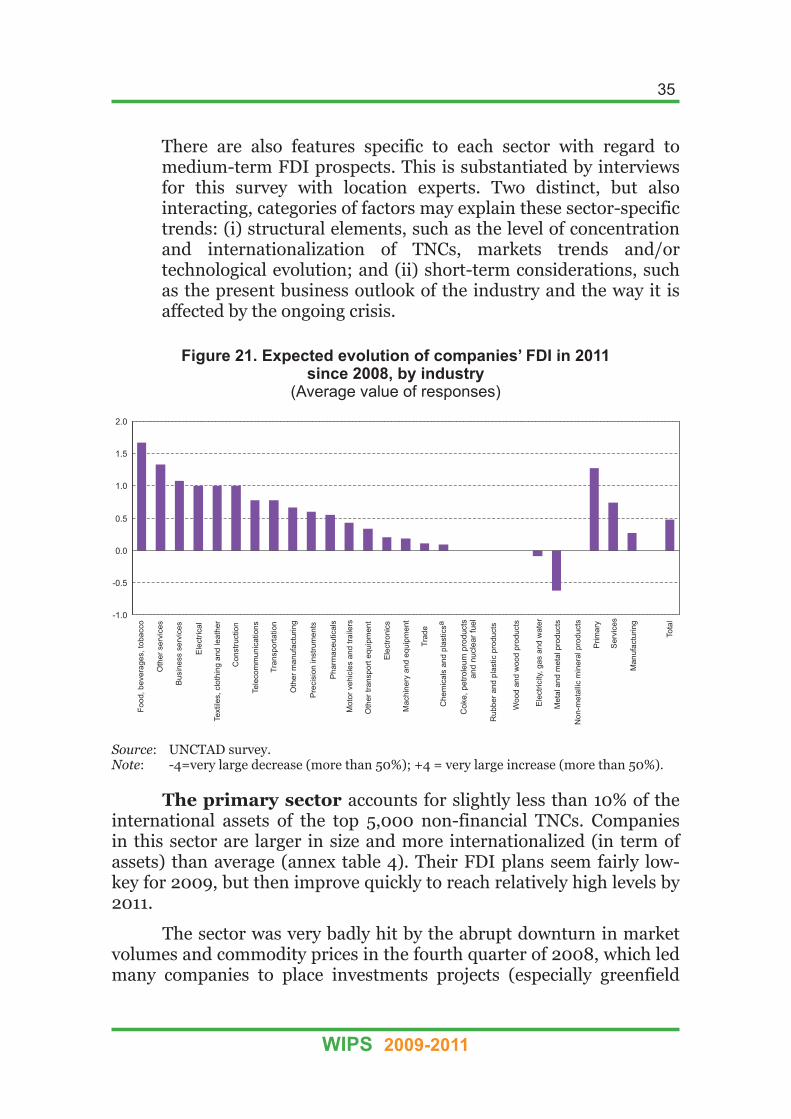
There are also features specific to each sector with regard to medium-term FDI prospects. This is substantiated by interviews for this survey with location experts. Two distinct, but also interacting, categories of factors may explain these sector-specific trends: (i) structural elements, such as the level of concentration and internationalization of TNCs, markets trends and/or technological evolution; and (ii) short-term considerations, such as the present business outlook of the industry and the way it is affected by the ongoing crisis.
Figure 21. Expected evolution of companies’ FDI in 2011 since 2008, by industry
(Average value of responses)
Source: UNCTAD survey.Note: -4=very large decrease (more than 50%); +4 = very large increase (more than 50%).
The primary sector accounts for slightly less than 10% of the international assets of the top 5,000 non-financial TNCs. Companies in this sector are larger in size and more internationalized (in term of assets) than average (annex table 4). Their FDI plans seem fairly low-key for 2009, but then improve quickly to reach relatively high levels by 2011.
The sector was very badly hit by the abrupt downturn in market volumes and commodity prices in the fourth quarter of 2008, which led many companies to place investments projects (especially greenfield

36 World Investment Prospects Survey 2009-2011
WIPS 2009-2011
projects in mining) on hold. As a result, there is likely to be a marked decline in FDI in 2009, following a peak in 2007 and in the first semester of 2008. On the other hand, there are many positive factors at work in this sector, such as promising market prospects in the medium term, new potential for restructuring triggered by the consequences of the crisis itself,26 and the existence of very cash-rich companies27 willing to continue investing in order to maintain or extend their control over natural resources. These reasons explain the apparent optimism of TNCs in the primary sector concerning their medium-term investment prospects.28
The manufacturing sector accounts for more than half of the total number and value of foreign assets of the top 5,000 non-financial TNCs (annex table 4). Size and internationalization of companies in this sector are close to the average. Prospects for FDI growth are slightly less promising than average, both in the short and medium term. This is due to two factors. First, many of the industries most affected by the current crisis (in terms of sales, profits etc.) belong to the manufacturing sector, such as automobiles, chemicals, electronics, and metallic and non-metallic products. As a result, these industries have resorted to investment cuts due to large overcapacity and the desire to save cash and restore their financial strength. Second, some factors might be instrumental in limiting the rebound in FDI, such as generally more limited market growth prospects than in services. However, in some manufacturing industries there are more positive patterns. For instance, in the food and beverages industry, which has suffered less from the crisis, FDI prospects, both in the short and medium term, seem relatively good. Last but not least, the crisis might also trigger major scale restructuring in some industries, such as automobiles, and could involve a wave of cross-border M&As (as discussed below).
The services sector accounts for about one third of the total international assets of the top 5,000 non-financial TNCs (annex table 4). Companies in this sector are slightly less internationalized than those in the manufacturing and primary sectors. Respondent TNCs in services expressed more optimism than average, both for the short and medium term. This may be due to the fact that many of them are less sensitive to short-term business cycles and face promising market growth prospects in the medium term. In addition, the fact that these industries remain slightly less internationalized than manufacturing industries may indicate that there is room for a further increase in their outward FDI as part of a catch-up process (figure 22). This applies particularly to such

37
WIPS 2009-2011
industries as telecommunications services, the markets for which are continuing to grow, and also to some business and consumers servicessuch as healthcare. However, FDI by some other service industries seemsless promising, either because they have been badly affected by the crisis(trade), or because market growth prospects are not especially bright and/or future international investment opportunities appear more limited than in the past (utilities).
Figure 22. Internationalization index of respondent companies, by industry, 2008
(Average value of responses)
Source: UNCTAD survey.Note: see note to figure 14 for an explanation of the internationalization index.a
Excludes pharmaceuticals.b
Includes metals and metal products, non-metallic mineral products, and wood and woodproducts.
cIncludes textiles and clothes.
aIncludes construction.
Varying FDI plans of different industries
The broad sectoral analysis in the previous section does not takeinto account the diversity of outlooks and dynamics by industry. This
TNCs in food and beverages and business services are among the TNCs in food and beverages and business services are among the industries whose FDI plans over the next three years are the mostindustries whose FDI plans over the next three years are the mostoptimistic, while prospects in chemicals and other heavy industriesoptimistic, while prospects in chemicals and other heavy industriesare among the gloomiest. are among the gloomiest.

38 World Investment Prospects Survey 2009-2011
WIPS 2009-2011
section, therefore, presents a more in-depth analysis of some selected industries from the manufacturing and services sectors, presented by decreasing order of FDI growth prospects until 2011. Results of the survey are discussed based on other sources, including interviews with location experts.29
Manufacturing sector
Food, beverages and tobacco. These industries so far have been among the least affected by the crisis. This is due to the fact that they mainly address basic human needs and are thus less sensitive to business cycles. For many large TNCs in these industries, sales continued to grow in 2008, and profits fell only slightly. The impact of the crisis on their FDI plans has been more limited than average (figure 20). Many respondents, such as Nestlé, expected only a very limited decline in their FDI in 2009, followed by a steady rebound in 2010, and a relatively high level in 2011 (figure 21). Even more than for other industries, market access seems to be the key location determinant in the agri-food business (table 4), and labour costs seem to play a more limited role.
Other manufactured goods (mainly consumer goods such as textiles and clothing) have been quite heavily impacted by the decline in demand in developed-country markets, and consequently by a fall in international trade. However, prospects could begin to improve when the growth in consumer spending resumes. Some companies such as l’Oréal and Liz Claiborne expect the situation to improve over the next quarters, as sales have started to stabilize in spring. In addition, some industries, such as garments, that are fairly cost-sensitiveness in their location decisions, might relocate their activities to countries that offer cheap labour (table 4). In its costs saving restructuring process, Liz Claiborne struck a deal with Hong Kong based Li & Fung Ltd. for the latter to take care of all its sourcing.
Pharmaceuticals. Globally, the pharmaceutical industry seems to have been less affected by the crisis, so far, than other manufacturing industries. Sales by the largest pharmaceutical companies, such as Roche, are continuing to grow – albeit at a slower pace – and their profits fell only slightly in 2008. Globally, respondents from this industry, such as Novartis, were less pessimistic than average about their investment outlook. According to the survey, the pharmaceutical industry ranked among the manufacturing industries with the best

39
WIPS 2009-2011
outlook for FDI growth until 2011, with no setback in 2009 (figure 21). Among the major driving forces behind its growth are the dynamism of its final markets – especially in emerging economies – the necessity of setting up production capabilities for new health products, and an ongoing restructuring trend that is prevalent throughout the industry (including M&As between existing pharmaceutical companies as well as takeovers of biotech start-ups). Regarding location criteria, four major features can be observed on the basis of the responses to the survey (see table 4): (i) as a very technology-intensive activity, pharmaceuticals are attracted to locations that offer skills and talent; (ii) access to the regional market is an especially important determinant, as companies often concentrate on only one factory for the production of a given drug aimed at an entire continental market (e.g. Europe, North America, Asia); (iii) on the other hand, labor costs remain a marginal location determinant (table 4) ; (iv) as they operate in fairly well-regulated markets, pharmaceutical companies are very sensitive to issues related to the pricing and licensing of health products, and government effectiveness.
Automotive industry. The automotive industry, together with construction, is probably one of the most severely affected by the ongoing crisis. Demand for cars has fallen considerably, especially in developed-country markets, due to both a decline in household purchasing power and a tightening of consumer loans. Under these adverse conditions, households are tending to postpone the purchase of a new car, causing an unprecedented depression in the market for vehicles. Confronted by a sharp drop in sales and profits, as well large overcapacities, car manufacturers as well as parts suppliers (some of them threatened with bankruptcy or even bankrupt) are making large cuts in their spending, assets and investment plans (UNCTAD, 2009). Responses to the survey confirm that FDI plans by the automotive industry have been among the most affected by the crisis (figure 20). A sharp decline is expected to occur in 2009, with only a slow recovery in 2010, leading to a level of FDI in 2011 only slightly higher than that of 2008 (figure 21). Large-scale international restructuring is also under way, particularly for United States car manufacturers. As the automotive industry is very sensitive to labour costs in determining its locational decisions (table 4), relocation of some manufacturing activities (both equipment and assembly) from developed countries to low-cost countries is an important trend in this industry.
Other professional equipment good.30 These activities are very sensitive to the business cycle, as their market depends mainly on capital

40 World Investment Prospects Survey 2009-2011
WIPS 2009-2011
spending by businesses. Therefore they have been heavily affected by the overall decline in gross fixed capital formation expenditures in developed countries. As a result, they have extensively cut back their own FDI plans (figure 20). Companies such as Caterpillar had to cut its workforce and shut down plants in order to adjust to reduced activity levels. The return to 2008 FDI levels is expected to be slow, with a continuing downturn in 2010.
Electronic and electrical equipment. This industry covers a vast array of activities, including semi-conductors, microprocessors, electronic components, telecommunications equipment, computers and business machines, and of course electrical equipement. Due to large cuts in investment expenditures, by companies as well households, these industries, overall, have been deeply affected by the crisis, resulting in large overcapacity (for instance in electronic components) and declining profits. This has led TNCs to implement cost-cutting measures, including on FDI (figure 20), which could fall markedly in 2009, with no significant upturn before 2011 (figure 21). However, prospects differ widely by activity. For instance, the demand for telecommunications equipment takes advantage of the resilient growth prospect in their main customer industry, the telecommunication services. This lead TNCs operating on these markets, such as ADVA Optical Networking, to be quite upbeat about their FDI plans. On the other hand, the growth in demand for personal computers seems to be heading towards a structural slowdown (Dedrick and Kraemer, 2008). In addition to access to markets, two other location determinants seem to be especially important for these industries (table 4): cheap labour (for the manufacture of mature products) and skilled labour (for the conception and development of new, innovative products).
Chemicals. The chemical industry covers a very diverse range of activities, from intermediate goods (petrochemicals, fertilizers) to specialized and application chemicals (e.g. paintings, coatings, soaps). As these activities target different markets, the crisis has affected them with various magnitude. For instance, markets for chemical products used in construction and automotives have been dramatically shrinking, while those for para-pharmaceuticals and other consumer products have been less affected. However, overall, the crisis has affected the chemical industry rather badly. Companies, such as Akzo Nobel, have large overcapacity and lower profits. Many of them, such as Bayer or Dow Chemicals, are engaged in cost-cutting programmes, including postponing or cancelling new investments
41
WIPS 2009-2011
abroad (UNCTAD, 2009). This is why respondents to the WIPS expressed a fairly pessimistic view about their FDI outlook, which might decline sharply in 2009, and, on average, fall short of its 2008 level in 2011 (figure 21). There are, however, some positive factors, such as the potential for restructuring, leading to cross-borders M&As, resilient demand in emerging markets, and good market prospects for some specialty products.
Other intermediate goods. As with chemicals, other intermediate industries have been badly affected by the fall in demand in their major markets, such as construction and automotives. Confronted by lower sales and profits, as well as large overcapacity, TNCs in these industries are implementing large-scale cost-cutting programmes. This is especially the case in building materials, where the crisis has strongly affected such companies as Holcim (Switzerland), Lafarge (France) and Cemex (Mexico). Respondents to the survey stated that their investments abroad have already been badly affected by the crisis (figure 20), and could drop significantly in 2009, with only a limited recovery by 2011 (figure 21).
Services
Business services are among the industries where investment programmes have been less affected by the crisis (figure 20) and show the best growth prospects in the medium term (figure 21). This may be explained by different factors: (i) many business services (such as legal advice, accounting and economic intelligence) are not very sensitive to the short-term evolution of their customer companies’ activities, as they aim at fulfilling some basic and recurrent needs;31 (ii) there is an overall trend towards a growing share of business services as a whole in total inputs, at the expense of raw materials, components and semi-finished products; (iii) a major reason for this trend is that companies tend to outsource a growing share of their business support functions (such as accounting, computer maintenance and contact with customers) to external providers of services; the ongoing crisis might accelerate this trend as companies seek to cut internal costs by externalizing non-core business activities; and (iv) TNCs active in these industries remain slightly less internationalized than other industries, which means that there is scope for a further increase in their FDI flows and stocks as part of a catch-up process.
Other services (mainly consumer services, but also construction) also show above average prospects due largely to two major reasons. i) In construction, market prospects for the

42 World Investment Prospects Survey 2009-2011
WIPS 2009-2011
public works business32 appear to be quite bright due to the fact that stimulus programmes adopted by many developed countries (such as Spain and the United States) have a large infrastructure component. This could have a positive impact on FDI for this industry, which, at present, has remained rather modest. ii) in households services, there is an overall trend towards a growing share of the services in total household spending, thereby enlarging the market for these activities. However, while some consumer services, such as health services, show a reasonably steady demand pattern, others, such as tourism or restaurants, are much more affected by the crisis, with a potentially negative impact on their FDI expenditures. According to the World Tourism Organization, international tourist arrival declined at a rate of 8% between January and February 2009. Companies such as the Club Mediterranée posted a net loss in the first half of its fiscal year due to restructuring costs and the economic crisis. Other companies in the restaurant industry, such as Starbucks, announced job cuts and store closures for 2009.
Transportation and telecommunication services show relatively good FDI prospects. Telecommunication services have been quite resilient during the crisis, many of the largest TNCs in this industry, such as Deutsche Telecom, Vodafone and France Telecom-Orange still have sufficient financial means to finance their international development plans. Transportation services, which have been more hard hit by the crisis in the short term, are likely to experience sustained growth in the medium term, especially international transport, and this could have a beneficial effect on their FDI. This is why TNCs such as the road operator Cintra (Spain) still plan to increase their outward FDI significantly over the next few years
In trade activities, the crisis has triggered a wave of restructuring and cost-cutting programmes. The audit and advisory service firm, KPMG, forecasts a 100,000 job loss for 2009 in the United Kingdom retailing sector alone.
33 Many investment projects have
been suspended, including outward FDI. Consequently, respondent companies are expecting their FDI expenditures to decline markedly in 2009, returning to their 2008 level only in 2011. For instance, Metro posted a capital expenditure of € 245 million during the first quarter 2009 – a large decrease compared to the € 340 million spent in Q1 2008. The Carrefour Group also plans to limit capital expenditure to €2.5 billion, down from €2.9 billion in 2008. Companies engaged in wholesale trade activities have been suffering from the drop in
43
WIPS 2009-2011
commodities prices since 2008 and from the challenging current economic environment. However, some companies such as Wall Wart, Mitsui & Co Ltd. or the Noble Group follow their investment plans even if they had to go through cost reduction and restructuring initiatives in order to face the financial crisis.
Utilities (electricity, gas and water) have been relatively less affected by the crisis than average, as they provide services aimed at fulfilling basic needs. Sales and profits of some major TNCs, such as French companies EDF and Suez-GDF, have evolved better than in other industries. As a result, cuts in costs and in investment plans, including FDI, have been more limited (figure 20). Utilities also rank among the few industries where respondent TNCs did not expect to see a decrease in their FDI expenditures in 2009. However, neither is a large increase expected in 2011 (figure 21).
Notes23
These results are consistent with those of other recent surveys. For instance, according to PricewaterhouseCoopers’ 12th Annual Global CEO Survey, the industries in which CEOs worldwide were the most optimistic about their short- and medium-term business outlook are pharmaceuticals and business services, while the more pessimistic are CEOs in automotives and metal works (PWC, 2009).
24
25A recent study by Jetro points points out to similar results. 81.5% of respondent Japanese TNCs in manufacturing declare that their overseas operations have been negatively affected
other services (Jetro, 2009).26
As illustrated by the acquisition at spring 2009 of iron ore and potash assets by Vale (Brazil) from Rio Tinto (United Kingdom/Australia), for a value of $1.6 billion.
27
some Chinese mining companies.28
Regarding location criteria, it is not surprising that TNCs in the primary sector are especially drawn to locations offering abundant natural resources (table 4). Also, since they prefer to operate in a stable regulatory and institutional environment, they consider government
location.29
See annex table 4 for basic information on industry size by number of companies and international assets..
30i.e. machines and precision equipments, excluding electronic and electrical equipment.
31The respondent company, Thomson Reuters, is a typical example.
32In which most of the large existing construction TNCs operate, while housing, a presently very depressed industry, remains more dominated by domestic companies.
33Source: http://www.synovate.com/news/article/2009/02/recession-will-not-spell-the-end-of-the-uk-high-street-as-we-know-it-says-kpmg-synovate-retail-think-tank.html

44 World Investment Prospects Survey 2009-2011
WIPS 2009-2011
Ta
ble
4.
Im
po
rta
nc
e o
f lo
ca
tio
na
l fa
cto
rs
, b
y i
nd
us
try
, 2
00
9–
20
11
(P
er
ce
nt
of
all
re
sp
on
se
s f
or
ea
ch
in
du
str
y)
Sec
tor/
indu
stry
Pre
senc
e
of s
uppl
iers
and
part
ners
Fol
low
you
r
com
petit
ors
Ava
ilabi
lity
of s
kille
d
labo
ur a
nd
tale
nts
Che
ap
labo
ur
Siz
e of
loca
l
mar
ket
Acc
ess
to
inte
rnat
iona
l/
regi
onal
mar
kets
Gro
wth
of
mar
ket
Acc
ess
to n
atur
al
reso
urce
s
Acc
ess
to c
apita
l
mar
ket
(fin
ance
)
Gov
ernm
ent
effe
c-
tiven
ess
Ince
ntiv
es
Qua
lity
of in
fras
-
truc
ture
Sta
ble
and
busi
ness
-
frie
ndly
envi
ronm
ent
Tota
l
Pri
mar
y 8
.8 2
.9 9
.4 4
.1 1
0.5
7.6
9.9
19.
3 1
.8 7
.0 0
.6 7
.0 1
1.1
100
Man
ufa
ctu
rin
g 1
0.1
5.0
8.1
6.5
17.
5 1
0.0
15.
8 3
.4 2
.4 4
.0 2
.9 6
.1 8
.110
0
Che
mic
als
and
chem
ical
pro
duct
sa 9
.5 2
.9 5
.1 5
.5 1
8.2
12.
4 1
8.6
6.2
0.7
4.4
1.5
5.1
9.9
100
Ele
ctric
al a
nd e
lect
roni
c eq
uipm
ent
10.
9 6
.3 8
.9 7
.6 1
7.1
10.
9 1
9.1
1.0
2.0
2.6
2.6
5.3
5.9
100
Foo
d, b
ever
ages
and
toba
cco
12.
6 7
.3 6
.6 4
.6 1
8.5
9.9
16.
6 0
.7 6
.6 2
.6 2
.6 4
.6 6
.610
0
Mot
or v
ehic
les
and
tran
spor
t equ
ipm
ent
9.8
7.0
6.0
7.4
17.
7 8
.8 1
2.6
2.8
2.8
3.7
6.5
7.4
7.4
100
Oth
er h
eavy
indu
stry
b 9
.5 2
.5 6
.9 7
.9 1
6.7
8.8
13.
9 8
.8 2
.5 5
.4 0
.9 6
.3 9
.810
0
Oth
er m
anuf
actu
ring
8.8
8.8
8.8
7.7
17.
6 6
.6 6
.6-
4.4
8.8
3.3
7.7
11.
010
0
Pha
rmac
eutic
als
9.6
9.6
9.6
2.7
17.
8 1
5.1
16.
4-
2.7
6.8
1.4
4.1
4.1
100
Pro
fess
iona
l equ
ipm
ent
10.
2 3
.3 1
3.5
5.8
17.
5 8
.8 1
6.8
1.1
0.7
2.2
4.4
7.7
8.0
100
Ser
vice
s 9
.5 3
.7 8
.6 3
.7 1
7.5
9.2
17.
5 1
.5 5
.1 5
.8 1
.8 6
.8 9
.210
0
Bus
ines
s se
rvic
es 1
0.3
2.6
12.
1 1
0.3
15.
5 1
2.9
16.
4-
2.6
4.3
3.4
4.3
5.2
100
Ele
ctric
ity, g
as a
nd w
ater
11.
9-
5.2
2.2
13.
3 5
.2 1
1.1
5.9
8.9
8.1
- 1
3.3
14.
810
0
Oth
er s
ervi
ces
11.
6 1
.4 1
0.9
2.2
19.
6 6
.5 1
9.6
0.7
4.3
8.7
4.3
2.2
8.0
100
Tra
de 1
1.7
8.1
9.0
2.7
17.
1 9
.9 1
9.8
0.9
3.6
3.6
1.8
5.4
6.3
100
Tele
com
mun
icat
ions
5.4
2.7
6.8
2.7
25.
7 1
0.8
27.
0-
6.8
4.1
- 2
.7 5
.410
0
Tra
nspo
rtat
ion
1.3
10.
4 6
.5 1
.3 1
6.9
13.
0 1
4.3
- 3
.9 3
.9-
13.
0 1
5.6
100
Tota
l 9
.9 4
.5 8
.3 5
.6 1
7.1
9.6
15.
9 4
.0 3
.0 4
.7 2
.5 6
.3 8
.610
0
Sou
rce:
UN
CTA
D s
urve
y.a
Ex
clu
des
ph
arm
ace
uti
cals
.b
In
clu
des
met
als
an
d m
eta
l p
rod
uct
s, n
on
-met
all
ic m
iner
al
pro
du
cts,
an
d w
oo
d a
nd
wo
od
pro
du
cts.

CHAPTER IV. DEVELOPING COUNTRIES SEEM LESS AFFECTED BY THE SLOWDOWN IN FDI
Responses to this year’s survey, supported by the most recently available data on FDI flows, suggest that the setback in TNCs’ FDIplans is affecting developed countries more than developing countries.In addition, there is a continuing trend towards a rising preference foremerging economies in TNCs’ internationalization strategies, and someevidences suggests that the crisis may even have given added impetusto this trend. However, the most advanced economies can still rely onmajor location advantages such as the overall quality of their businessenvironment and the size of their market. Thus they still rank high inTNCs’ overall investment priorities.
This chapter first assesses the varying impact of the financial andeconomic crisis on FDI by host region. This is followed by an examinationof the continued rise in importance of developing economies in theinvestment programmes of the world’s largest TNCs. Finally, the chapterconcludes with an examination of the most favoured countries for FDIand of their major location advantages.
The slowdown in FDI hits developed regions the most
In 2008, there was a 25% decline in developed countries’ FDI inflows whereas in developing countries inward FDI continued to grow, albeit at a slower rate (7.2%) than in previous years (table 5)).
These contrasting trends are due to a combination of factors. First,the economic crisis has hit developed markets more severely, triggering a recession of unprecedented proportions, which has discouraged new investments. In contrast, markets in many developing economies are continuing to grow moderately (table 6). Second, the decline in FDI flowsis largely related to a major setback in cross-border M&As, an FDI mode that is more prevalent in developed countries. In contrast, greenfield
Developed countries have felt the greatest impact of the recent fall Developed countries have felt the greatest impact of the recent fall in FDI inflows, although the rest of the world is also increasingly in FDI inflows, although the rest of the world is also increasingly affected. Responses to WIPS confirm that, while TNCs are cutting affected. Responses to WIPS confirm that, while TNCs are cutting down on investments in practically all regions of the world, the largestdown on investments in practically all regions of the world, the largestcuts are in the developed countries.cuts are in the developed countries.

46 World Investment Prospects Survey 2009-2011
WIPS 2009-2011
investments – a mode more commonly used by TNCs for entry into developing countries – have been more resilient so far (OCO, 2009).
Initial data available for 2009 confirm these differences, though they also show that the downturn in FDI flows is now also affecting developing countries to a greater extent than before. Among the 26 countries for which data were available for the first quarter of 2009, FDI inflows were down by 57% (compared to the first quarter of 2008) for the 15 developed countries, and by only 45% for the 11 developing and transition economies.
Responses by companies to the survey confirm that the economic and financial downturn has affected their investment plans more in developed countries than in the other countries (figure 23). Roughly 47% and 44% of respondents, respectively, mentioned North America and the EU-15 as the regions where the negative impact of the crisis on their FDI
Table 5. FDI inflows and cross-border M&A sales, by region and major economy, 2007–2008
a
(Billions of dollars)
Region/economyFDI inflows Cross-border M&A sales
2007 2008 a
Growth rate 2007 2008 a
Growth rate
(%) (%)
World 1 940.9 1 658.5 - 14.5 1 699.8 1 205.4 - 29.1
Developed economies 1 341.8 1 001.8 - 25.3 1 504.1 998.3 - 33.6Europe 920.9 559.0 - 39.3 859.4 561.4 - 34.7
United States 232.8 320.9 37.8 389.2 318.2 -18.2
Japan 22.5 19.0 - 15.6 24.6 19.5 -20.6
Developing economies 512.2 549.1 7.2 161.6 182.1 12.7Africa 53.5 72.0 34.7 12.5 27.0 116.5
Latin America and the Caribbean 127.3 139.3 9.4 31.1 32.8 5.5
Asia and Oceania 331.4 337.8 1.9 118.1 122.3 3.6
West Asia 71.5 61.4 - 14.2 33.8 31.6 -6.6
South, East and South-East Asia 258.7 275.2 6.4 84.0 90.4 7.6
Transition economies 86.9 107.6 23.8 34.1 24.9 -27.0
Source: UNCTAD.a Preliminary estimates. See UNCTAD’s World Investment Report 2009 (forthcoming for final figures).
Note: World FDI inflows in 2008 are estimates based on 103 economies for which data were available for either all or part of 2008 as of 6 April 2009. Where information for only part of 2008 was available, estimations were made by annualizing the data. The proportion of inflows to these economies in total inflows to their respective region or subregion in 2007 was used to extrapolate the 2008 data. For cross-border M&As, estimates were based on data available as of 5 January 2009. .

47
WIPS 2009-2011
plans has been the most pronounced. These are followed by East and South-East Asia (35% of responses).
Figure 23. Regions/groups most affected by the reduction in TNCs’ investment plans for 2009–2011
(Per cent of responses)
Source: UNCTAD survey.Note: Figures may add up to more than 100% due to possible multiple responses.
It is true that these responses might simply reflect, at least partially, the comparative size of TNCs’ foreign activities and investments in various parts of the world: the regions most affected by the downturn are also those that host investments by the largest number of TNCs (figure 24).
Figure 24. Percentage of respondent companies with investments in various regions/groups
(Per cent of responses)
Source: UNCTAD survey.
%
%

48 World Investment Prospects Survey 2009-2011
WIPS 2009-2011
However, a large set of other indicators confirm that TNCs intendto give greater priority to developing regions, such as Asia and LatinAmerica, in their medium-term investment strategies, as discussed inthe next section.
TNCs continue to give developing countries high priority for FDI
No region in the world has been left unharmed by the present setback in TNCs’ FDI plans (figure 23). However, all regions are not similarly affected. TNCs’ responses confirm and even amplify the trendobserved in last years’ WIPS towards a growing interest in developing countries (UNCTAD, 2008a). This trend will be especially marked for East, South and South-East Asia (a region set to become the top priority region over the next three years), Latin America and West Asia. Despite a slight increase, North Africa and sub-Saharan Africa are likely to remainat the bottom of the list (figure 26).
Figure 25. Investment preferences, by host region/group, 2008 and 2011(Average value of responses)
Source: UNCTAD survey.Note: 1 = marginal or nil; 5 = very important.
While TNCs continue to give the region of East, South and South-East While TNCs continue to give the region of East, South and South-East Asia top priority for FDI, the rankings for Latin America and WestAsia top priority for FDI, the rankings for Latin America and WestAsia have improved. Western Europe and North America remainAsia have improved. Western Europe and North America remainmajor investment targets, while the attractiveness of Eastern Europemajor investment targets, while the attractiveness of Eastern Europeand CIS/SEE has weakened slightly and Africa remains marginal.and CIS/SEE has weakened slightly and Africa remains marginal./ g y g/ g y g
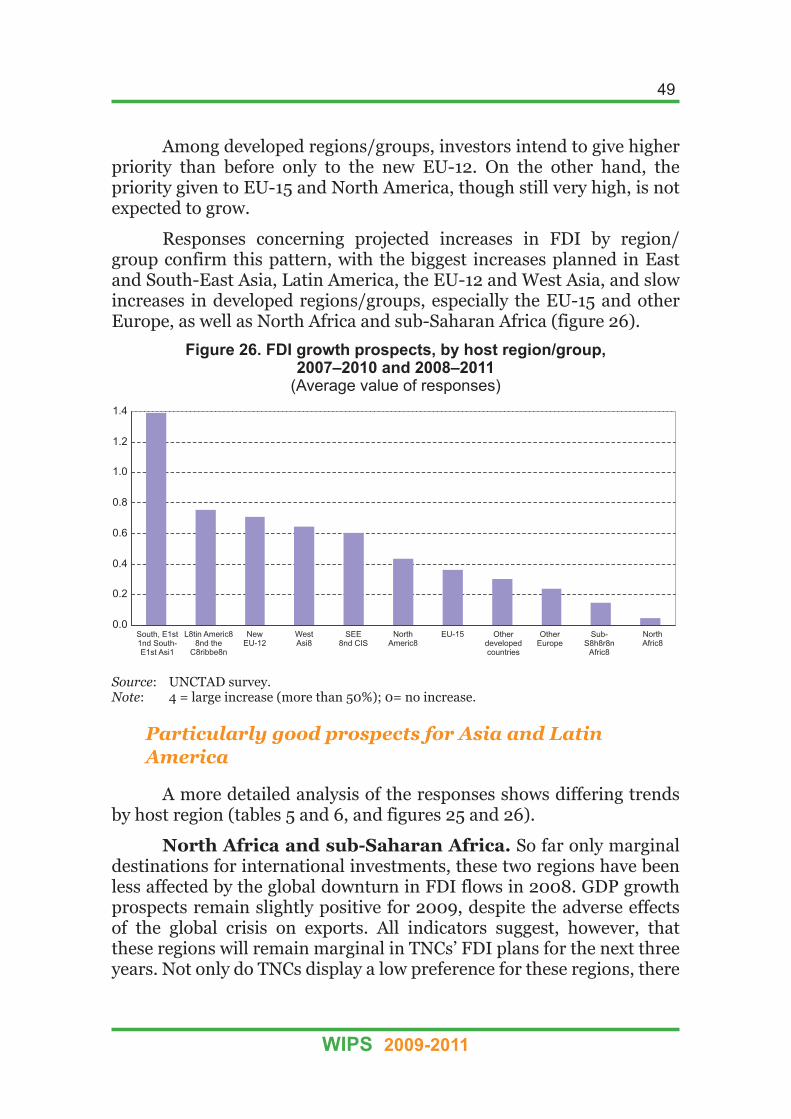
49
WIPS 2009-2011
Among developed regions/groups, investors intend to give higher priority than before only to the new EU-12. On the other hand, the priority given to EU-15 and North America, though still very high, is not expected to grow.
Responses concerning projected increases in FDI by region/group confirm this pattern, with the biggest increases planned in East and South-East Asia, Latin America, the EU-12 and West Asia, and slow increases in developed regions/groups, especially the EU-15 and other Europe, as well as North Africa and sub-Saharan Africa (figure 26).
Figure 26. FDI growth prospects, by host region/group, 2007–2010 and 2008–2011
(Average value of responses)
Source: UNCTAD survey.Note: 4 = large increase (more than 50%); 0= no increase.
Particularly good prospects for Asia and Latin
America
A more detailed analysis of the responses shows differing trends by host region (tables 5 and 6, and figures 25 and 26).
North Africa and sub-Saharan Africa. So far only marginal destinations for international investments, these two regions have been less affected by the global downturn in FDI flows in 2008. GDP growth prospects remain slightly positive for 2009, despite the adverse effects of the global crisis on exports. All indicators suggest, however, that these regions will remain marginal in TNCs’ FDI plans for the next three years. Not only do TNCs display a low preference for these regions, there

50 World Investment Prospects Survey 2009-2011
WIPS 2009-2011
are also only a small percentage of companies willing to increase their investments there. Only one country (South Africa) is in the top 30 list of favoured FDI destinations.
West Asia is also quite marginal in terms of FDI stocks. In 2008, it experienced a decline in FDI flows following six years of sustained FDI growth. Nevertheless, TNCs expressed fairly positive views about this region, largely because of its strong GDP growth, owing to sustained internal demand as well as its rich endowment of natural resources. Compared to last year’s survey, the region has gained one rank in the investors’ priority list, to seventh position, and the projected FDI growth by respondent companies remains relatively high. Three countries (the United Arab Emirates, Turkey and Saudi Arabia, in that order) were mentioned in the TNCs’ top 30 list of FDI destinations.
Table 6. Main investment indicators by region
Region/group
Share in world FDI
stocks, 2007
(%)
Preferenceranking
FDI increase as projected by
respondent TNCsa
IMF’s projected annual GDP growth
rate (April 2009)
No. of countries in the top 30 FDI destinations
WIPS WIPS WIPS WIPS2009 2010 WIPS 2009
2008 2009 2008 2009
Developing
South, East and S.E. Asia 15.5 1 1 1.9 1.4 3.3 5.3b
9
West Asia 2.3 8 7 0.8 0.6 2.5 3.5c
3
Sub-Saharan Africa 1.7 11 11 0.3 0.1 1.7 3.8 1
North Africa 0.9 10 10 0.4 0 3 4.0d
0
Latin America 7.5 5 4 0.9 0.8 -1.5 1.6 4
Developed
EU-15 41.5 2 3 0.9 0.4 -4.2 -0.4e
7
Other Europe 2.6 9 9 0.5 0.2 -3.0 -0.3f
1
New EU-12 3.7 4 5 1.2 0.7 -2.9 0.3g
2
North America 17.2 3 2 0.9 0.4 -2:8 0.0h
2
Other developed 3.8 7 8 0.4 0.3 -6.2 0.5i
2
Transition Economies 3.3 6 6 1.1 0.6 -5.1 1.2j
2
Source: UNCTAD survey.a
On a scale of -4 to +4.-4 = Decrease of more than 50%, 0 = Unchanged, 4 = increase of more than 50%.
b Emerging Asia; c
Middle East; d Maghreb; e Euro area; f Switzerland;g
Emerging Europe; h United States; i Japan; j CIS (IMF categories).

51
WIPS 2009-2011
Latin America ranks second among the developing regions in terms of inward FDI stocks. It has been quite resilient to the 2008 FDI downturn. In spite of its limited GDP growth prospects, respondent TNCs expressed fairly positive views about the region, which has gained one rank in the priority list, to fourth position. A relatively large percentage of companies reported their intention to increase their investments there over the next three years, and FDI growth prospects are quite high. Four countries were mentioned among the 30 most favoured locations: Brazil, Mexico, Chile and Peru in that order, with Brazil occupying fourthposition – one place higher than last year.
East, South and South-East Asia already receives the largest FDI among the developing regions, and the region’s FDI inflows continued to increase in 2008. TNCs are very bullish about this region, which seems set to become the most preferred location worldwide for FDI in the next three years. Moreover, the largest percentage of respondent companies reported that they planned to increase their FDI in this region. Strong prospects for market growth and, to a lesser extent, the availability of cheap labour, appear to be among its major attractions. No less than nine countries34 feature in the list of top 30 investment locations, among which two (China and India) are in the top five.
The CIS and SEE region accounts for a limited share in world inward FDI stocks, despite sustained increase in the recent years. It benefited from a new boost in FDI flows in 2008. However, its prospects for the three next years are mixed. The region’s ranking in the regional list of priority remains at seventh place – the same as in last year’s survey. The respondent TNCs’ projected FDI growth to this region is in marked decline compared to last year, although still relatively high. This might be mainly due to negative GDP growth prospects, as a result of falling exports and a severe crisis in the local financial system. Two countries (the Russian Federation and Ukraine) rank among the top 30 locations for FDI, with the Russian Federation in fifth position, one rank down from last year.
EU-12 countries have experienced a steady increase in FDI flows and stocks over the past few years, but now seem to be facing somewhat tougher times. This group of countries still ranks quite high in the regional preference list. But it has lost one rank since last year’s survey, and respondent TNCs’ projected FDI growth, albeit still higher than the world average, is in marked decline as compared to last year. This is mainly due to these countries’ sluggish economic growth prospects, as a

52 World Investment Prospects Survey 2009-2011
WIPS 2009-2011
result of a decline in export opportunities to the most advanced European markets and the precarious condition of many national financial systems. Two countries (Poland and the Czech Republic) rank among the 30 most favoured locations, with Poland in eleventh position.
EU-15 and other Western Europe is the largest home region/group worldwide in terms of FDI stocks, but FDI inflows experienced a sharp decline in 2008. Prospects for the three years ahead are rather mixed. On the one hand, the EU-15 is likely to remain one of the priority regions for TNCs, mainly because of the size of its market and the quality of the business environment. Eight countries35 feature in the investors’ list of top 30 FDI locations. One the other hand, both the EU-15 and other Europe have gone down one rank from last year in the TNCs’ preference ranking. Moreover, the projected increase of FDI expenditure there is quite low and in marked decline compared to last year. The negative GDP growth prospects in the region for the next two years largely explain TNCs’ cautious attitude.
North America, although quite badly affected by the cutbacks in FDI plans, also shows some signs of resilience, especially if compared with some other developed regions. Already one of the largest recipients of FDI, it benefited from a considerable increase in inflows in 2008, mostly due to a rise in internal lending to local affiliates from parent companies abroad. In TNCs’ list of most favoured regions for FDI, North America has regained its ranking in second place, which it had two years ago, overtaking the EU-15. In the list of priority countries, the United States has gained one rank this year, overtaking India to occupy second place, while Canada has maintained its position in tenth place. Despite the severity of the recession in the United States and the fact that this country has been the epicentre of the economic and financial crisis which has since spread to the rest of the world, North America has thus not too much lost of its attractiveness as an FDI location. There are a number of reasons for this. First, the recession, which erupted in the United States sooner and initially with more dramatic consequences than in the rest of the world, might also end somewhat sooner than in some other developed regions.36 Second, the major restructurings presently occurring in many activities (from automotives to financial services) open up new FDI opportunities (through M&As) for foreign companies. Third, the current size of the domestic market, as well as the quality of skills and technical resources available there, make North America an important target in many TNCs’ international expansion strategies.

53
WIPS 2009-2011
Other developed countries remain a marginal destinationfor international investments, with a very limited share in inward FDIstocks and a marked decline in inflows in 2008. They have lost one rank as compared to last year’s regional priority list, falling to eighth place,and the projected increase of FDI expenditure to this region is modest.The magnitude of the recession, especially in Japan, is one of the majorexplanations for these dim prospects for FDI. Only two countries (Japanand Australia) rank in TNCs’ list of top 30 FDI destinations, with Australiain eighth position.
Top 15 countries: what makes them attractive to FDI?
No major changes to the list of most favoured
countries
The survey revealed few changes in TNCs’ perceptions of the top15 locations for FDI since last year (figure 27). The only new country to be added to the list is Thailand, replacing Turkey and South Africa(who tied in 15th position last year). The members of the top five remainunchanged, with only some change in rankings: the United Statestakes second place, overtaking India, and Brazil moves to fourth place,overtaking the Russian Federation.37
Among other countries, the United Kingdom, and to a lesser extent Australia, have improved their rankings at the expense of Viet Nam andIndonesia.38
These rankings show only a few differences depending on thehome region of the companies: Asian TNCs seem more prone to favourAsian countries over European ones, with the opposite being true forEuropean TNCs (table 7).
Comparing this year’s country rankings with last year’s, few changesComparing this year’s country rankings with last year’s, few changeshave been observed. Brazil the Russian Federation, India and China have been observed. Brazil the Russian Federation, India and China (BRIC countries) are in the list of top five countries for FDI. TNCs(BRIC countries) are in the list of top five countries for FDI. TNCsconsidered market growth, followed by the availability of cheap considered market growth, followed by the availability of cheap labour, and, in some cases, access to natural resources, to be somelabour, and, in some cases, access to natural resources, to be someof the major location assets of developing countries. They mentionedof the major location assets of developing countries. They mentionedthe quality of the business environment and market size as the mainthe quality of the business environment and market size as the mainstrengths of the most developed economies. strengths of the most developed economies.
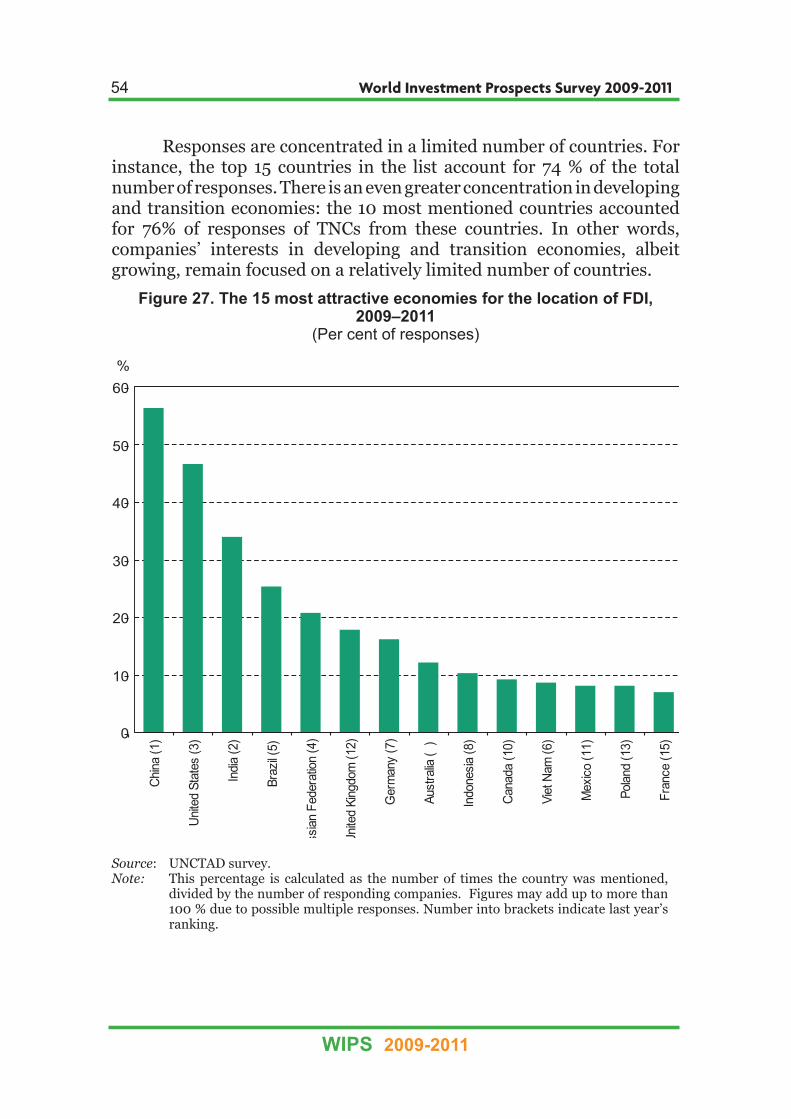
54 World Investment Prospects Survey 2009-2011
WIPS 2009-2011
Responses are concentrated in a limited number of countries. For instance, the top 15 countries in the list account for 74 % of the total number of responses. There is an even greater concentration in developing and transition economies: the 10 most mentioned countries accounted for 76% of responses of TNCs from these countries. In other words, companies’ interests in developing and transition economies, albeit growing, remain focused on a relatively limited number of countries.
Figure 27. The 15 most attractive economies for the location of FDI, 2009–2011
(Per cent of responses)
Source: UNCTAD survey.Note: This percentage is calculated as the number of times the country was mentioned,
divided by the number of responding companies. Figures may add up to more than 100 % due to possible multiple responses. Number into brackets indicate last year’s ranking.

55
WIPS 2009-2011
Major location assets by country
Despite some common assets, such as market growth and size (see box 3 and figure 28), other location determinants differ quite significantly by country. Responses to WIPS indicate the most favourable location assets for the 15 most attractive countries for FDI as follows (table 8):
For market growth, developing and transition economies are generally favoured, such as China, India, Brazil, the Russian Federation, Indonesia, Viet Nam, Poland and Thailand.
For market size, the largest economies are favoured, either developed ones such as the United States, Germany and Canada, or emerging ones such as China, the Russian Federation and Brazil.
For access to regional markets, countries that are integrated into large markets, or which are close to large and growing economies, are favoured, such as Mexico, Germany, Viet Nam and Poland.
For presence of suppliers, mostly developed countries are favoured, such as the United Kingdom, Germany and France, and, to a slightly lesser extent, some developing countries such as India.
For their business environment (including government effectiveness, stability and quality of infrastructures), developed countries such as the United States, Germany and Australia are favoured. France is frequently mentioned for the quality of its infrastructure.
For skills and talent, developed countries such as the United States, Germany, the United Kingdom and France are favoured, but also some developing countries, such as India and Thailand.
Table 7. Top 6 FDI destinations, by home region
Home region Most favoured destinations
North America (Canada and United States)China, United Kingdom, The Russian Federation, Germany, Brazil, United States
EuropeUnited States, China, India, Brazil, The Russian Federation, United Kingdom
Japan China, India, United States, Brazil, Viet Nam, Germany
Developing Asia China, United States, Indonesia, Australia, India, Viet Nam
Source:UNCTAD survey.
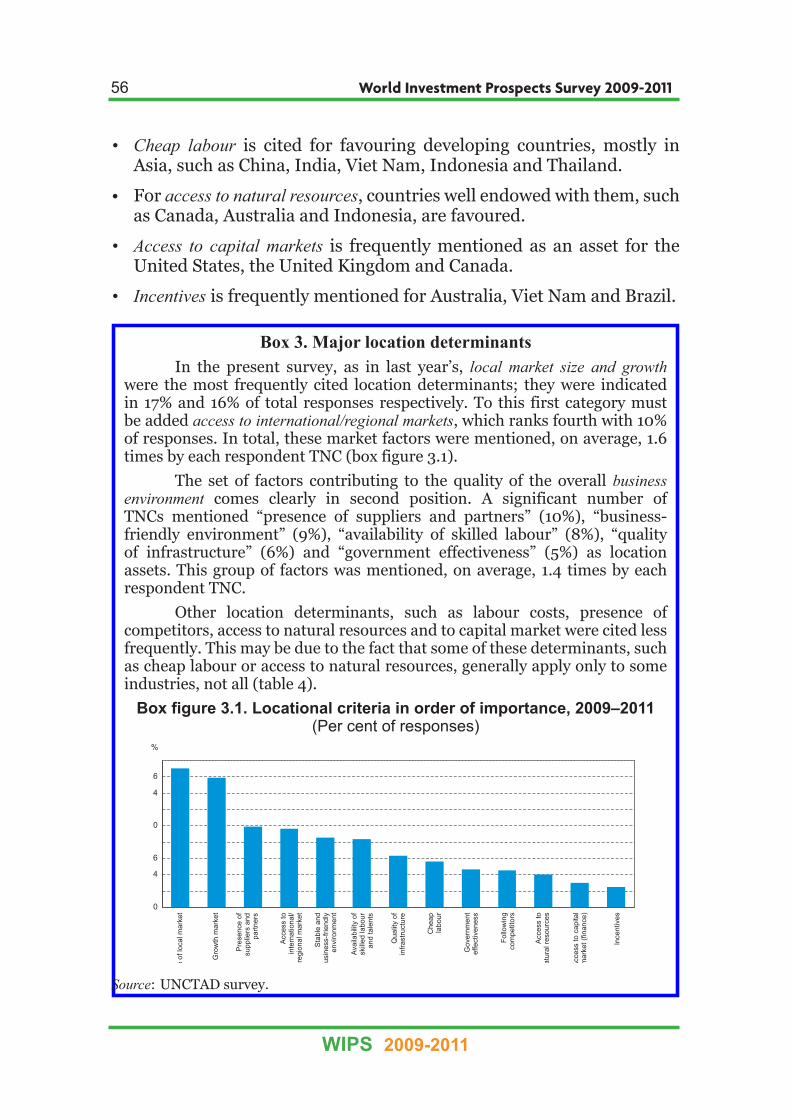
56 World Investment Prospects Survey 2009-2011
WIPS 2009-2011
Cheap labour is cited for favouring developing countries, mostly in Asia, such as China, India, Viet Nam, Indonesia and Thailand.
For access to natural resources, countries well endowed with them, such as Canada, Australia and Indonesia, are favoured.
Access to capital markets is frequently mentioned as an asset for the United States, the United Kingdom and Canada.
Incentives is frequently mentioned for Australia, Viet Nam and Brazil.
Box 3. Major location determinants
In the present survey, as in last year’s, local market size and growthwere the most frequently cited location determinants; they were indicated in 17% and 16% of total responses respectively. To this first category must be added access to international/regional markets, which ranks fourth with 10% of responses. In total, these market factors were mentioned, on average, 1.6 times by each respondent TNC (box figure 3.1).
The set of factors contributing to the quality of the overall businessenvironment comes clearly in second position. A significant number of TNCs mentioned “presence of suppliers and partners” (10%), “business-friendly environment” (9%), “availability of skilled labour” (8%), “quality of infrastructure” (6%) and “government effectiveness” (5%) as location assets. This group of factors was mentioned, on average, 1.4 times by each respondent TNC.
Other location determinants, such as labour costs, presence of competitors, access to natural resources and to capital market were cited less frequently. This may be due to the fact that some of these determinants, such as cheap labour or access to natural resources, generally apply only to some industries, not all (table 4).
Box figure 3.1. Locational criteria in order of importance, 2009–2011(Per cent of responses)
Source: UNCTAD survey.

57
WIPS 2009-2011
Ta
ble
8.
To
p 1
5 c
ou
ntr
ies
fo
r F
DI,
by
fa
cto
rs
fa
vo
ur
ing
in
ve
stm
en
t, 2
00
9-2
011
(Pe
r c
en
t o
f a
ll r
es
po
ns
es
fo
r a
giv
en
co
un
try
)
Pre
senc
e of
supp
liers
and
part
ners
Fol
low
your
com
petit
ors
Ava
ilabi
lity
of
skill
ed la
bour
and
tale
nts
Che
ap
labo
ur
Siz
e of
loca
l
mar
ket
Acc
ess
to
inte
rnat
iona
l/
regi
onal
mar
kets
Gro
wth
of
mar
ket
Acc
ess
to n
atur
al
reso
urce
s
Acc
ess
to
capi
tal m
arke
t
(fin
ance
)
Gov
ernm
ent
effe
ctiv
enes
sIn
cent
ives
Qua
lity
of
infr
astr
uctu
re
Sta
ble
and
busi
ness
-frie
ndly
envi
ronm
ent
Tota
l
Chi
na 1
0 6
7 1
1 1
9 9
21
2 2
3 3
3 4
100
Uni
ted
Sta
tes
11
5 1
0 1
17
8 9
3 7
7 1
9 1
310
0
Indi
a 1
1 5
11
13
19
9 2
4 1
1 1
1 1
310
0
Bra
zil
10
3 6
9 2
0 1
0 1
9 3
2 2
4 3
810
0
Rus
sian
Fed
erat
ion
11
7 1
2 3
1 9
31
3-
- 3
1 1
100
Uni
ted
Kin
gdom
9 4
12
- 1
7 1
0 9
2 7
6-
11
14
100
Ger
man
y 1
2 5
13
- 2
1 1
1 7
1 3
5 1
12
11
100
Aus
tral
ia 9
3 4
1 1
4 8
9 1
2 4
9 3
11
12
100
Indo
nesi
a 1
0 5
7 1
3 1
6 1
0 2
0 1
5-
2-
- 3
100
Can
ada
10
3 9
- 1
9 6
12
4 6
7 1
9 1
410
0
Vie
t Nam
10
6 6
16
14
6 2
2 2
2 4
4 2
810
0
Mex
ico
9 2
12
9 1
9 1
6 1
6 5
--
2 2
710
0
Pol
and
8 5
5 5
24
11
26
5-
3 3
3 3
100
Fra
nce
13
4 1
1-
18
9 1
1 2
- 4
2 1
3 1
110
0
Tha
iland
10
- 1
0 1
0 8
12
20
2 4
- 6
10
810
0
Wo
rld
ave
rag
e 1
0 5
8 6
17
10
16
4 3
5 2
6 9
100
Sou
rce:
UN
CTA
D s
urve
y.

58 World Investment Prospects Survey 2009-2011
WIPS 2009-2011
Notes34
China, India, Indonesia, Viet Nam, Thailand, Singapore, Malaysia, the Philippines, and the Republic of Korea (in that order).
35The United Kingdom, Germany, France, Italy, Spain, the Netherlands, Sweden and Switzerland (in that order).
36By the end of 2009, according to the latest NABE forecast (NABE, 2009), and by mid-2010, according to the IMF (2009).
37
a year-on-year increase of 85.1%, amounting to $46.5 billion. Brazil also posted a strong year-on-year increase of 30.3%, attracting some $45.1 billion of inward FDI in 2008. The Russian Federation added some $70.3 billion of inward FDI in the year – a year-on-year increase of 34%. FDI to the United States rose by 37.8% to reach $320.8 billion.
38It should be pointed out that opinion surveys such as WIPS aim to shed light on TNCs’ perceptions and do not measure their actual investment expenditures. Therefore, their results can differ widely from other sources such as FDI statistics, where developed countries usually rank much higher (for a comparison between various rankings on FDI

CONCLUSIONS
As this year’s survey results confirm, the global economic and financial crisis has had a strongly negative impact on TNCs’ international investment plans. Respondent TNCs expect a significant decline in their FDI in 2009, regardless of the home region, and for virtually all industries.
However, the survey also shows that TNCs expect a progressive recovery of FDI, starting slowly in 2010 and gaining momentum in 2011. This is explained by continuing favourable trends, such as the growing internationalization of TNCs, which is expected to trigger a new wave of international investment projects when the effects of the present crisis begin to ease.
The impact of the short-term fall in FDI flows is of particular concern for developed countries, as its negative effects on them are compounded by a continuing trend in favour of emerging markets in TNCs’ location strategies.
For the developing countries for which FDI is an important source of external financing, the major challenge is to improve their local business environment in order to enhance their attractiveness for TNCs. At the same time, however, for the handful of developing countries that have the financial and industrial capabilities to invest abroad, the crisis may also be a major opportunity to strengthen their influence in the global economy through an increased presence of their companies abroad.


REFERENCES
Dunning J, Fujita M and Yakova N (2007). Some macro-data on the regionalisation/globalisation debate: a comment on the Rugman/Verbeke analysis. Journal of International Business Studies, 38(1): 177–199, January.
IFO (2009). CESifo World Economic Survey, 2nd
quarter 2009, 2(8), May, Munich.
IMF (2009). World Economic Outlook: Crisis and Recovery, 22 April, Washington, DC.
JBIC (2008). Survey Report on Overseas Business Operations by Japanese
Manufacturing Companies. Results of JBIC FY2008 Survey, November, Tokyo.
JETRO (2009). Advance Survey Report on Overseas Operations of Jqpanese
Companies, 19 February, Tokyo:
Dedrick J and Kramer KL (2008). Personal computing. In: Macher JT and Mowery DC, eds., Innovation in Global Industries. Washington, DC, The National Academic Press: 19–53.
NABE (2009). NABE Outlook, May. Washington, DC.
OCO (2009). 2008-2009 Review of Foreign Direct Investment (forthcoming).
OECD (2009). OECD Economic Outlook. An interim report. Paris, 31 March.
PricewaterhouseCoopers (2009). 12th
Annual CEO Survey, Redefining Success,January.
Rugman AM and Verbeke A (2004). A perspective on regional and global strategies of multinational enterprises. Journal of International Business
Studies, 35(1): 3–19.
United Nations (2009). Word Economic Situation and Prospects 2009. New York and Geneva, United Nations, January.
UNCTAD (1997). International Investment: Towards the Year 2001. United Nations publication, sales no. GVE.97.0.5, New York and Geneva.
UNCTAD (1998). International Investment: Towards the Year 2002. United Nations publication, sales no. GVE.98.0.15, New York and Geneva.
UNCTAD (2004). Prospects for Foreign Direct Investment and the Strategies of
Transnational Corporations, 2004–2007. New York and Geneva, United Nations.
UNCTAD (2005). Prospects for Foreign Direct Investment and the Strategies of
Transnational Corporations, 2005–2008. New York and Geneva, United Nations.
62 World Investment Prospects Survey 2009-2011
WIPS 2009-2011
UNCTAD (2007). World Investment Prospects Survey, 2007–2009. New York and Geneva, United Nations.
UNCTAD (2008a). World Investment Prospects Survey, 2008–2010. New York and Geneva, United Nations.
UNCTAD (2008b). World Investment Report 2008: Transnational Corporations and
the Infrastructure Challenge. New York and Geneva, United Nations.
UNCTAD (2009). Assessing the impact of the current financial and economic crisis on global FDI flows. New York and Geneva, United Nations.
UNCTAD (forthcoming). World Investment Report 2009. New York and Geneva, United Nations.

ANNEXES
Annex 1. Methodology of the World Investment Prospects Survey
Objective. The aim of this year’s World Investment Prospects
Survey (WIPS) is to provide an insight into prospects for investment by the largest TNCs in the world, in the light of the present economic and financial crisis. Questions were designed to capture, among other topics, expected changes in FDI expenditures between 2009 and 2011 as compared to 2008, expected changes in the internationalization of TNCs based on various measures, major risk factors, geographical spread of investments, the most attractive countries for future investments and their location assets.
About the sample. The frame for this year’s survey was constructed by identifying the 5,000 largest TNCs in the world, ranked by total assets. From this frame a sample was drawn using a stratified probability proportional to size (PPS) design, with a high selection probability for the largest firms. The final sample comprised 2,272 TNCs.
Development of the questionnaire. The questionnaire was prepared by UNCTAD, building on the experiences of previous year’s surveys. A draft questionnaire was tested among a number of experts from around the world to ascertain its suitability. Based on their comments, and further internal review, the questionnaire was finalized. The final survey was mailed to companies in February 2009 and also placed online to take advantage of opportunities offered by the Internet.
Data collection. A mixed-mode approach for data collection was adopted using direct-mail, e-mail and telephone interviews. Between February and May 2009, 241 responses were collected, representing a response rate of about 11%.
Reliability of the survey. The survey responses are well representative of the structure of the sample by industries. Regarding the structure of responses by home countries, statistical tests showed that the overrepresentation of European and Japanese TNCs did not introduce a statistical bias in the findings of the survey.

64 World Investment Prospects Survey 2009-2011
WIPS 2009-2011
Annex table 1. Comparing the representation of the frame, sample and survey responses, by region
(Per cent of respondent companies)
Region Frame Sample Survey responses
All developed regions 77 80 87
Europe 33 30 48
North America 28 34 18
Canada 4 4 4
United States 24 30 14
Japan 12 12 19
Other developed countries 4 3 2
All developing regions 22 20 12
Developing Asia 20 18 10
South-East Europe and CIS 0.2 0.2 0.4
Total 100 100 100
Source: UNCTAD survey.
Annex table 2. Comparing the representation of the frame, sample and survey responses, by sector
(Per cent of respondent companies)
Sector Frame Sample Survey responses
Primary 5 6 5
Manufacturing 60 57 64
Services 35 37 31
Total 100 100 100

65
WIPS 2009-2011
Annex table 3. List of WIPS regional experts
Country Name Title
Canada Mr Jean-François Outreville Professor, Université de HEC, Montréal
China and Hong Kong, China
Mrs Fang FangProfessor, Shanghaï University ofFinance and Economics
France Mr Hugues ChevalierPrésident, Association française des économistes d’entreprise (AFEDE)
Germany Mr Thomas JostProfessor of Economics, Aschaffenburg University
Japan Mr Susumu UshidaSenior economist, Japan Bank for International Cooperation (JBIC)
Spain Mr Oscar AlvarezEconomic Intelligence Director, Invest in Spain Agency
Sweden Mr Runbeck MagnusSenior Economist, Invest in Sweden Agency
Switzerland Mr Jan AtteslanderDirector, International Affairs, EconomieSuisse
United Kingdom Mr Nicolas Forsans Professor, Universty of Leeds
United States Mrs Parul JainMember of the Board, National Assocation for Business Economics (NABE)

66 World Investment Prospects Survey 2009-2011
WIPS 2009-2011
Annex 2. Characteristics of the top 5,000 non-financial TNCs
Annex table 4. Top 5,000 companies, by sector and industry
(Per cent)
Sector/IndustryNumber of companies(% of total)
Foreignassets
(% of total)
Internationalizationratio
a
Primary 5.0 8.9 43.4
Manufacturing 59.6 57.4 35.9
Food, beverages and tobacco 4.4 7.1 46.1
Textiles, clothing and leather 3.1 0.4 29.0
Wood and wood products 2.8 1.3 32.7
Coke, petroleum products and nuclear fuel 0.8 7.9 40.1
Chemicals and plastics (excl. pharmaceuticals) 5.3 4.7 38.6
Pharmaceuticals 2.3 3.8 30.4
Rubber and plastic products 1.6 1.0 42.7
Non-metallic mineral products 2.1 3.4 63.9
Metals and metal products 3.2 1.9 35.4
Machinery and equipment 8.3 2.6 25.2
Electrical and electronic equipment 14.4 7.4 27.5
Electrical equipment 2.8 0.9 26.2
Electronics 11.5 6.6 27.7
Motor vehicles and other transport equipment 4.3 13.3 38.4
Motor vehicles and trailers 2.8 7.3 33.0
Other transport equipment 1.5 6.0 47.7
Precision instruments 4.5 1.3 21.2
Other manufacturing 2.6 1.0 34.5
Services 35.4 33.8 33.9
Electricity, gas and water 1.7 6.6 36.5
Construction 2.5 2.5 35.7
Trade 10.2 7.7 33.0
Transport, storage and communications 6.2 10.6 34.0
Transportation 3.9 3.2 27.5
Telecommunications 2.4 7.4 37.9
Business services 11.0 3.7 27.8
Other services 3.8 2.7 40.3
Total 100 100 35.7
Source: UNCTAD survey.a
Ratio of foreign assets to total assets.

67
WIPS 2009-2011
Annex table 5. Top 5,000 companies by size of total assets
Size of total assets
Number of companies (% of total)
Foreign assets (% of total)
Internationalizationratio
a
0–500 34.7 1.5 36.3
500–4 000 43.6 10.8 33.4
4 000 and over 21.7 87.7 36.0
Total 100 100 35.7
Source: UNCTAD survey.a
Ratio of foreign assets to total assets.
Annex table 6. Top 5,000 companies by total assets, by home country of the parent company
Region
Number of companies(% of total)
Foreign assets (% of total)
Internationalizationratio
a
All developed regions 77.3 91.2 35.7
Europe 32.8 52.9 48.5
North America 28.3 26.5 26.0
Canada 4.4 2.3 32.0
United States 24.0 24.2 25.5
Japan 12.3 9.0 24.0
Other developed countries 3.9 2.9 40.0
All developing regions 22.4 8.5 36.3
Developing Asia 20.2 7.0 34.9
South-East Europe and CIS
0.2 0.3 32.8
Total 100 100 35.7
Source: UNCTAD survey.a
Ratio of foreign assets to total assets.
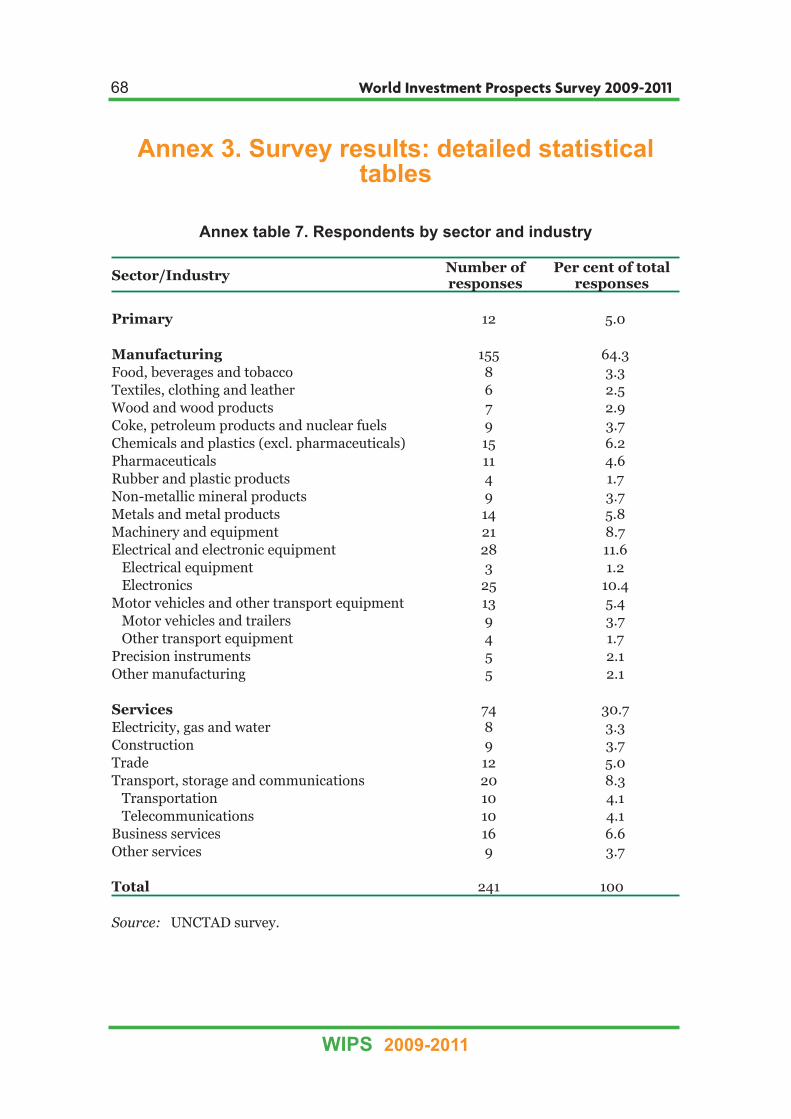
68 World Investment Prospects Survey 2009-2011
WIPS 2009-2011
Annex 3. Survey results: detailed statistical tables
Annex table 7. Respondents by sector and industry
Sector/IndustryNumber of responses
Per cent of total responses
Primary 12 5.0
Manufacturing 155 64.3
Food, beverages and tobacco 8 3.3
Textiles, clothing and leather 6 2.5
Wood and wood products 7 2.9
Coke, petroleum products and nuclear fuels 9 3.7
Chemicals and plastics (excl. pharmaceuticals) 15 6.2
Pharmaceuticals 11 4.6
Rubber and plastic products 4 1.7
Non-metallic mineral products 9 3.7
Metals and metal products 14 5.8
Machinery and equipment 21 8.7
Electrical and electronic equipment 28 11.6
Electrical equipment 3 1.2
Electronics 25 10.4
Motor vehicles and other transport equipment 13 5.4
Motor vehicles and trailers 9 3.7
Other transport equipment 4 1.7
Precision instruments 5 2.1
Other manufacturing 5 2.1
Services 74 30.7
Electricity, gas and water 8 3.3
Construction 9 3.7
Trade 12 5.0
Transport, storage and communications 20 8.3
Transportation 10 4.1
Telecommunications 10 4.1
Business services 16 6.6
Other services 9 3.7
Total 241 100
Source: UNCTAD survey.

69
WIPS 2009-2011
Annex table 8. Respondents by size of total assetsa
Size NumberPer cent of total
responses
0–500 16 6.6
500–4 000 95 39.4
4 000 and over 130 53.9
Total 241 100
Source: UNCTAD survey.a
Classified by the magnitude (in million of dollars) of the assets of the parent company.
Annex table 9. Respondents by home region
Region NumberPer cent of
total responses
All developed regions 210 87.1
Europe 116 48.1
North America 43 17.8
Canada 9 3.7
United States 34 14.1
Japan 45 18.7
Other developed countries 6 2.5
All developing regions 30 12.4
Developing Asia 25 10.4
South-East Europe and CIS
1 0.4
Total 241 100
Source: UNCTAD survey.

70 World Investment Prospects Survey 2009-2011
WIPS 2009-2011
Annex 4. Classifications used in the survey
The classifications used in this survey are generally the same as those used in UNCTAD’s World Investment Reports, but with slight differences (Annex tables 10 to 12).
Annex table 10. Classification by home region
UNCTAD survey
Europe EU-15, new EU-12, other Europe
North America Canada and United States
Other developed Australia, Israel, Japan, New Zealand
Developing and transition countries
All other countries
Annex table 11. Classification by host region
Selected regions referred to in the analysis of the UNCTAD Countries
North America Canada and United States
EU-15
Austria, Belgium, Denmark, Finland, France, Germany, Greece, Ireland, Italy, Luxembourg, Netherlands, Portugal, Spain, Sweden and United Kingdom.
New EU-12Bulgaria, Cyprus, Czech Republic, Estonia, Hungary, Latvia, Lithuania, Malta, Poland, Romania, Slovakia and Slovenia
Other Europe Norway and Switzerland
Western Europe EU-15, Other Europe, Cyprus and Malta.
Other developed countries Australia, Israel, Japan and New Zealand
Note: For the other regions not listed above, the standard United Nations classification is used.

71
WIPS 2009-2011
Annex table 12. Classification by sector and industry
UNCTAD World Investment Prospects Survey
World Investment Report
PrimaryAgriculture, hunting, forestry and fisheries; mining, quarrying, and petroleum
ManufacturingChemicals and chemical products (excl. Pharmaceuticals)
Chemicals and plasticsChemicals and chemical products (excl. Pharmaceuticals)
Coke, petroleum products and nuclear fuel Coke, petroleum products and nuclear fuel
Rubber and plastic products Rubber and plastic products
Pharmaceuticals Pharmaceuticals
Electrical and electronic equipment Electrical and electronic equipment
Electrical
Electronics
Food, beverages and tobacco Food, beverages and tobacco
Motor vehicles and transportation equipt. Motor vehicles and transportation equipt.
Motor vehicles and trailers
Other transport equipment
Other heavy industry
Metal and metal products Metal and metal products
Non-metallic mineral products Non-metallic mineral products
Wood and wood products Wood and wood products
Other manufacturing and textile
Other manufacturingPublishing, printing and reproduction of recorded media; other manufacturing
Textiles, clothing and leather Textiles, clothing and leather
Professional equipment goods
Machinery and equipment Machinery and equipment
Precision instruments Precision instruments
Services
Business services Business activities
Electricity, gas and water Electricity, gas and water
Other services
Construction and construction Construction
Other services
Hotels and restaurants; public administration and defence; education; health and social services; community, social and personal service activities; other services
Trade Trade
Transport, storage and communications Transport, storage and communications
Telecommunications
Transportation

72 World Investment Prospects Survey 2009-2011
WIPS 2009-2011

73
WIPS 2009-2011
QUESTIONNAIRE
World Investment Prospects Survey 2009-2011
In order to improve the quality and relevance of the work of theUNCTAD Division on Investment and Enterprise, it would be useful toreceive the views of readers on this and other similar publications. Itwould therefore be greatly appreciated if you could complete the followingquestionnaire and return it to:
Readership SurveyUNCTAD, Division on Investment and Enterprise
Palais des NationsRoom E-10054
CH-1211 Geneva 10Switzerland
Or by Fax to: (+41 22) 907.04.98
1. Name and professional address of respondent (optional):
_________________________________________________
_________________________________________________
2. Which of the following best describes your area of work?
Government Public enterprise
Private enterprise Academic or research institution
International organization Media
Not-for-profit organization Other (specify)
3. In which country do you work?
4. What is your assessment of the contents of this publication?
Excellent Adequate
Good Poor
5. How useful is this publication to your work?
Very useful Of some use Irrelevant

74 World Investment Prospects Survey 2009-2011
WIPS 2009-2011
6. Please indicate the three things you liked best about this publicationand how are they useful for your work:______________________________________________________________________________________________
7. Please indicate the three things you liked least about this publication:______________________________________________________________________________________________
8. On the average, how useful are these publications to you in yourwork?
Very useful Of some use Irrelevant
9. Are you a regular recipient of Transnational Corporations (formerly The CTC Reporter), the Division’s tri-annual refereed journal?
Yes No
If not, please check here if you would like to receive a sample copy sent to the name and address you have given above. Other title youwould like to receive instead (see list of publications):______________________________________________________________________________________________
10.How or where did you obtain this publication:
I bought it In a seminar/workshop
I requested a courtesy copy Direct mailing
Other
11. Would you like to receive information on UNCTAD’s work in the area of Investment and Enterprise Development through e-mail? If yes, please provide us with your e-mail address:______________________________________________________________________________________________