Embed Size (px)
Citation preview
1
United Overseas BankInvestor Roadshow
November 2006
Disclaimer : This material that follows is a presentation of general background information about the Bank’s activities current at the date of the presentation. It is information given in summary form and does not purport to be complete. It is not to be relied upon as advice to investors or potential investors and does not take into account the investment objectives, financial situation or needs of any particular investor. This material should be considered with professional advice when deciding if an investment is appropriate. UOB Bank accepts no liability whatsoever with respect to the use of this document or its content.
Singapore Company Reg No. 193500026Z
Agenda
11 Overview of UOB GroupOverview of UOB Group
22 Growth and Regional StrategyGrowth and Regional Strategy
33 Infrastructure, Systems & OperationsInfrastructure, Systems & Operations
44 Review of Financial PerformanceReview of Financial Performance
55 Capital ManagementCapital Management
2
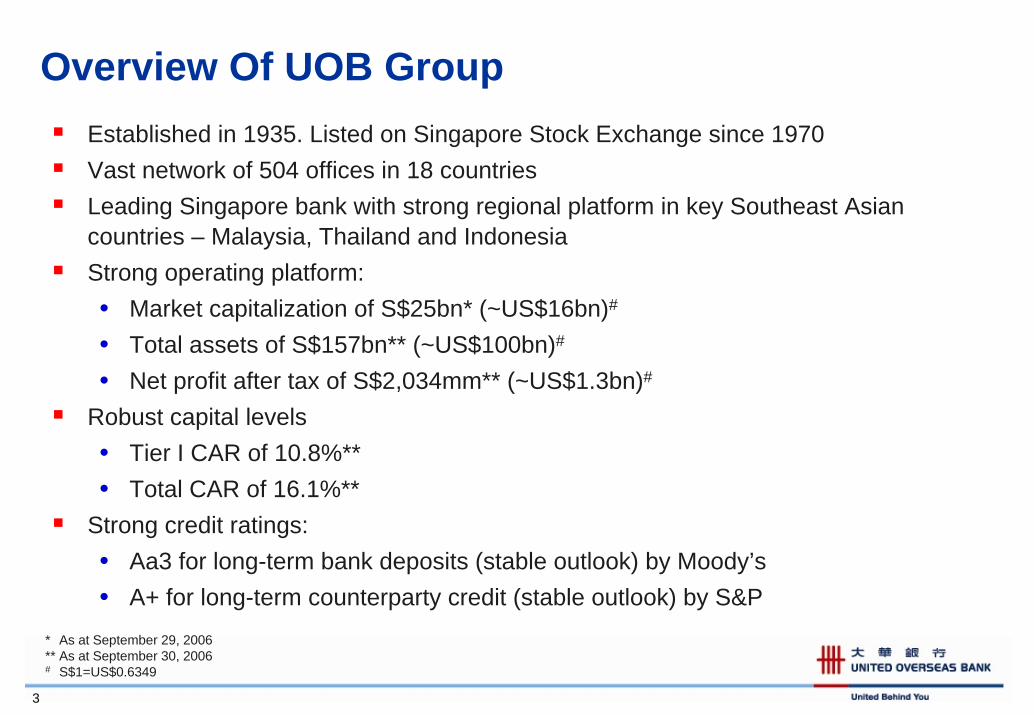
Overview Of UOB GroupEstablished in 1935. Listed on Singapore Stock Exchange since 1970Vast network of 504 offices in 18 countriesLeading Singapore bank with strong regional platform in key Southeast Asian countries – Malaysia, Thailand and IndonesiaStrong operating platform:• Market capitalization of S$25bn* (~US$16bn)#
• Total assets of S$157bn** (~US$100bn)#
• Net profit after tax of S$2,034mm** (~US$1.3bn)#
Robust capital levels• Tier I CAR of 10.8%**• Total CAR of 16.1%**
Strong credit ratings:• Aa3 for long-term bank deposits (stable outlook) by Moody’s• A+ for long-term counterparty credit (stable outlook) by S&P
3
* As at September 29, 2006** As at September 30, 2006# S$1=US$0.6349
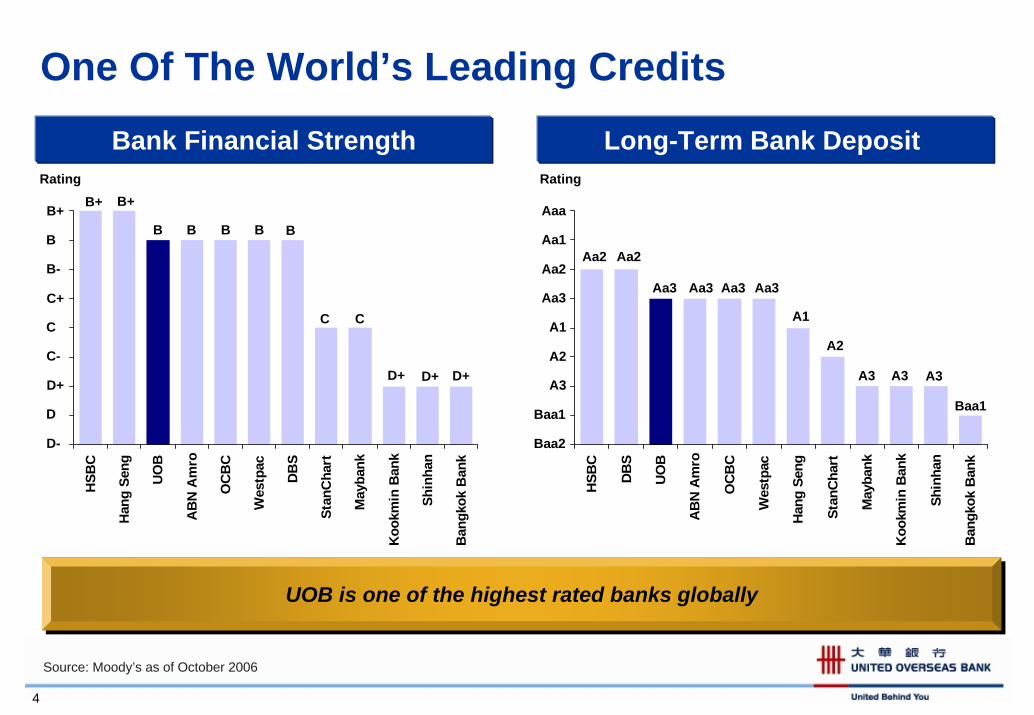
One Of The World’s Leading Credits
Bank Financial Strength Long-Term Bank Deposit
UOB is one of the highest rated banks globally UOB is one of the highest rated banks globally
Rating
HSB
C
Han
g Se
ng
UO
B
AB
N A
mro
OC
BC
Wes
tpac
DB
S
Stan
Cha
rt
May
bank
Koo
kmin
Ban
k
Shin
han
Ban
gkok
Ban
k
B+
BB B
C
D+
BB
B+
C
B+
D-
D
D+
C-
C+
B
B-
C
Rating
HSB
C
DB
S
UO
B
AB
N A
mro
OC
BC
Wes
tpac
Han
g Se
ng
Stan
Cha
rt
May
bank
Koo
kmin
Ban
k
Shin
han
Ban
gkok
Ban
k
Aaa
Baa2
Baa1
A3
A2
Aa3
Aa1
Aa2
A1
Aa2
Aa3
A1
A2
A3 A3
Baa1
Aa2
Aa3 Aa3Aa3
A3D+ D+
4
Source: Moody’s as of October 2006
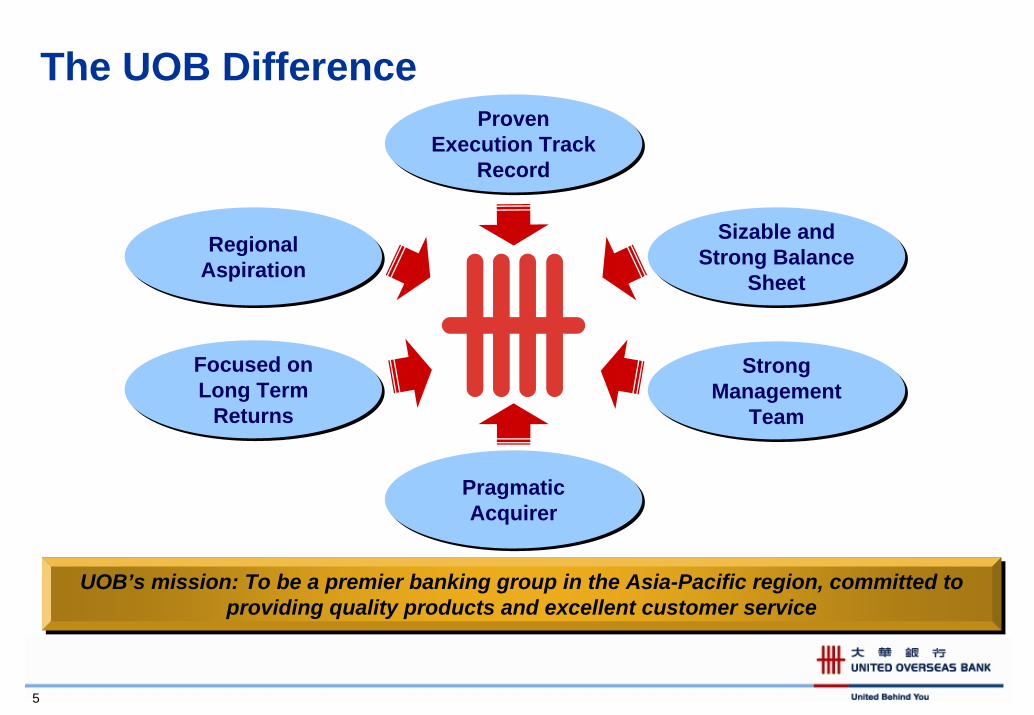
The UOB DifferenceProven
Execution Track Record
Proven Execution Track
Record
Sizable and Strong Balance
Sheet
Sizable and Strong Balance
Sheet
Strong Management
Team
Strong Management
Team
Focused on Long Term
Returns
Focused on Long Term
Returns
Pragmatic Acquirer
Pragmatic Acquirer
Regional AspirationRegional
Aspiration
UOB’s mission: To be a premier banking group in the Asia-Pacific region, committed to providing quality products and excellent customer service
UOB’s mission: To be a premier banking group in the Asia-Pacific region, committed to providing quality products and excellent customer service
5
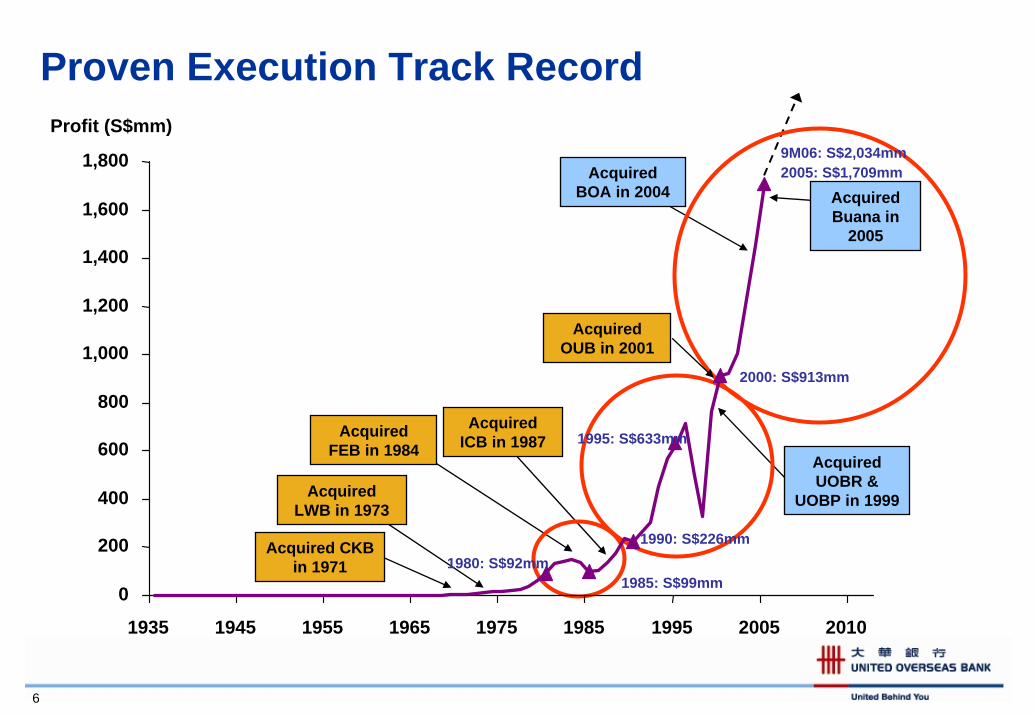
Proven Execution Track Record
6
Profit (S$mm)
Acquired BOA in 2004
Acquired CKB in 1971
Acquired LWB in 1973
Acquired FEB in 1984
Acquired UOBR &
UOBP in 1999
Acquired Buana in
2005
Acquired ICB in 1987
Acquired OUB in 2001
9M06: S$2,034mm2005: S$1,709mm
2000: S$913mm
1995: S$633mm
1990: S$226mm
1985: S$99mm1980: S$92mm
0
200
400
600
800
1,000
1,200
1,400
1,600
1,800
1935 1945 1955 1965 1975 1985 1995 2005 2010
7
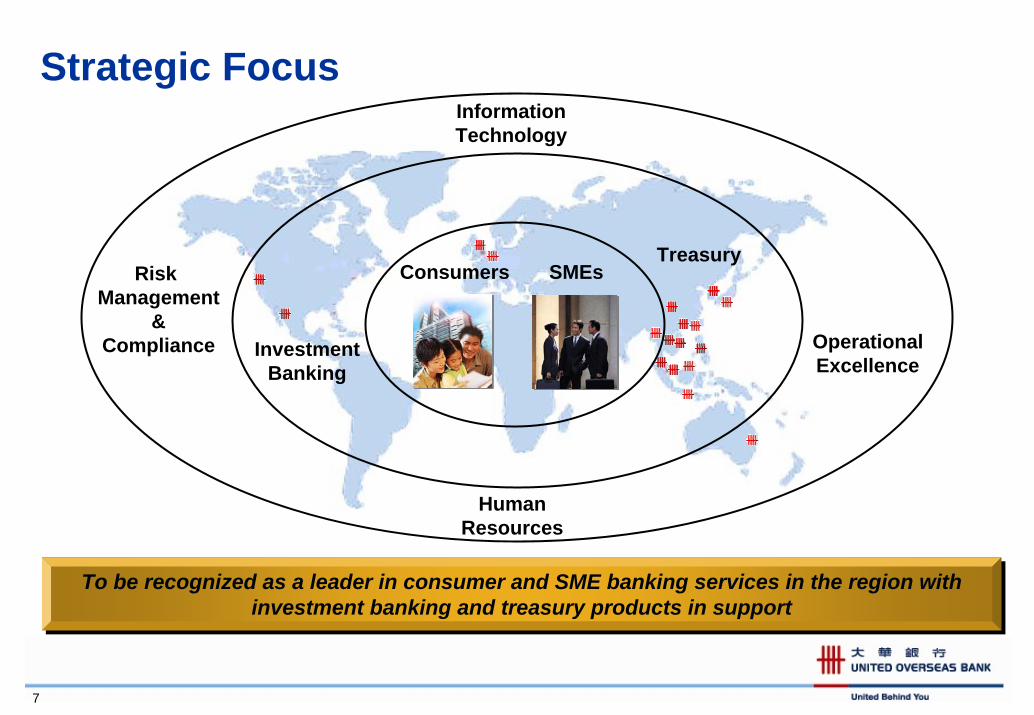
Strategic Focus
Consumers SMEsTreasury
InvestmentBanking
OperationalExcellence
Risk Management
&Compliance
InformationTechnology
HumanResources
To be recognized as a leader in consumer and SME banking services in the region with investment banking and treasury products in support
To be recognized as a leader in consumer and SME banking services in the region with investment banking and treasury products in support
Agenda
11 Overview of UOB GroupOverview of UOB Group
22 Growth and Regional StrategyGrowth and Regional Strategy
33 Infrastructure, Systems & OperationsInfrastructure, Systems & Operations
44 Review of Financial PerformanceReview of Financial Performance
55 Capital ManagementCapital Management
8
9
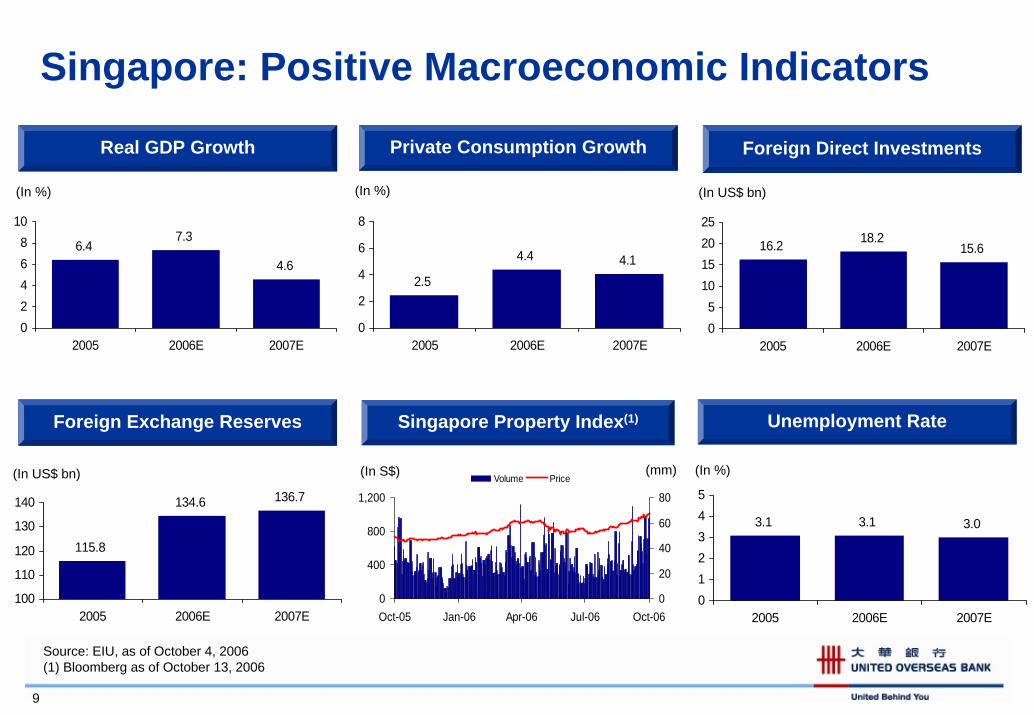
Singapore: Positive Macroeconomic Indicators
Real GDP Growth Private Consumption Growth Foreign Direct Investments
(In %)(In %) (In US$ bn)
2.5
4.4 4.1
0
2
4
6
8
2005 2006E 2007E
6.47.3
4.6
02468
10
2005 2006E 2007E
16.2 18.215.6
05
10152025
2005 2006E 2007E
Foreign Exchange Reserves Unemployment RateSingapore Property Index(1)
0
400
800
1,200
Oct-05 Jan-06 Apr-06 Jul-06 Oct-060
20
40
60
80Volume Price(In S$) (mm) (In %)(In US$ bn)
3.1 3.1 3.0
012345
2005 2006E 2007E
115.8
134.6 136.7
100
110
120
130
140
2005 2006E 2007E
Source: EIU, as of October 4, 2006(1) Bloomberg as of October 13, 2006
10
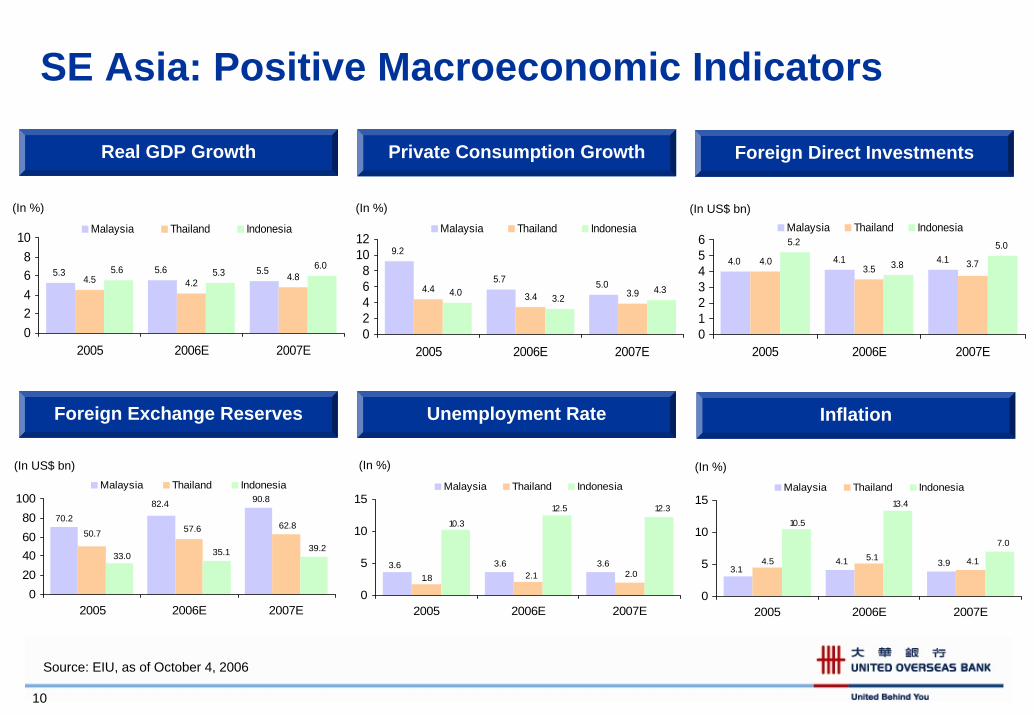
SE Asia: Positive Macroeconomic Indicators
Real GDP Growth Private Consumption Growth Foreign Direct Investments
(In %) (In %) (In US$ bn)
4.0 4.1 4.13.5
5.2 5.04.0 3.73.8
0123456
2005 2006E 2007E
Malaysia Thailand Indonesia
5.3 5.6 5.54.2
5.6 5.36.0
4.5 4.8
02468
10
2005 2006E 2007E
Malaysia Thailand Indonesia
5.0
9.2
5.7
3.44.4 3.94.0 4.3
3.2
02468
1012
2005 2006E 2007E
Malaysia Thailand Indonesia
Foreign Exchange Reserves Unemployment Rate Inflation
(In %)
70.282.4 90.8
57.650.762.8
33.039.235.1
020406080
100
2005 2006E 2007E
Malaysia Thailand Indonesia
(In US$ bn)
3.6 3.6 3.62.11.8 2.0
10.3
12.312.5
0
5
10
15
2005 2006E 2007E
Malaysia Thailand Indonesia
3.14.1 3.95.14.5 4.1
10.5
7.0
13.4
0
5
10
15
2005 2006E 2007E
Malaysia Thailand Indonesia
(In %)
Source: EIU, as of October 4, 2006
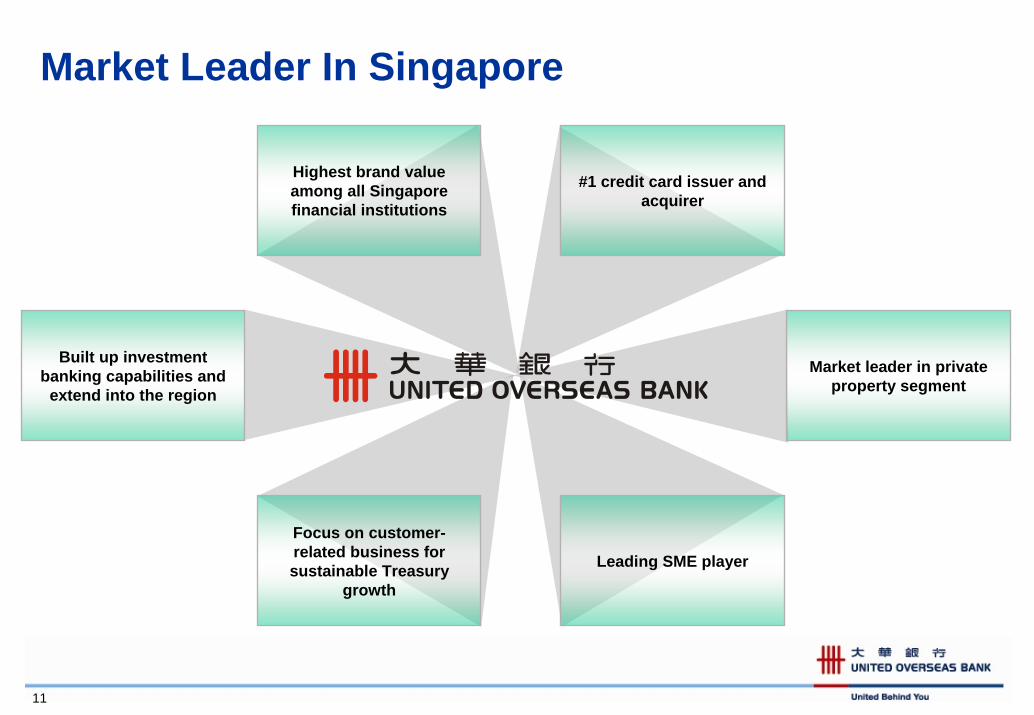
Market Leader In Singapore
Highest brand value among all Singapore financial institutions
Built up investment banking capabilities and
extend into the region
Focus on customer-related business for sustainable Treasury
growth
Leading SME player
Market leader in private property segment
#1 credit card issuer and acquirer
11
Venturing Beyond SingaporeSee the region as key to our long-term growth given strategic location of Singapore
UOB has unique competitive advantages venturing into the region
• Familiar with the markets to seize opportunities
• Natural flow of customers’ regional expansions
• Existing infrastructure that can be scaled up
Also recognize huge upside potential of Southeast Asia
• Southeast Asia’s resilient economies
• GDP growth projected to surpass world’s growth
• Strengthening intra-regional trade
12
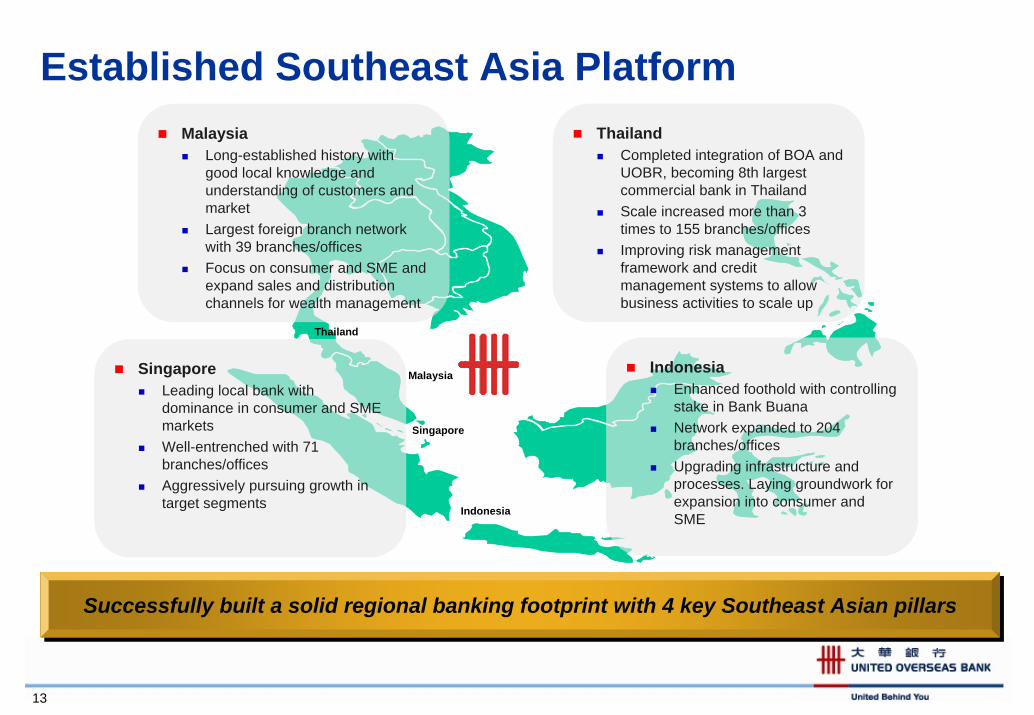
Established Southeast Asia PlatformMalaysia
Long-established history with good local knowledge and understanding of customers and marketLargest foreign branch network with 39 branches/officesFocus on consumer and SME and expand sales and distribution channels for wealth management
IndonesiaEnhanced foothold with controlling stake in Bank BuanaNetwork expanded to 204 branches/officesUpgrading infrastructure and processes. Laying groundwork for expansion into consumer and SME
SingaporeLeading local bank with dominance in consumer and SME marketsWell-entrenched with 71 branches/officesAggressively pursuing growth in target segments
ThailandCompleted integration of BOA and UOBR, becoming 8th largest commercial bank in ThailandScale increased more than 3 times to 155 branches/officesImproving risk management framework and credit management systems to allow business activities to scale up
Thailand
Malaysia
Singapore
Indonesia
13
Successfully built a solid regional banking footprint with 4 key Southeast Asian pillarsSuccessfully built a solid regional banking footprint with 4 key Southeast Asian pillars
Beyond The Four PillarsChina• Deepen market understanding through existing network and possible future tie-ups. Continue
with organic growth and branch expansion but keep eye for strategic alliances and M&As• Expanding capability in Renminbi banking services and capturing opportunities that come with
them• Expanded structured trade and commodity finance team in Hong Kong to provide financing for
growing commodity trade in Greater China region Vietnam• First Singapore bank to establish presence in country (Full-service branch in Ho Chi Minh City)• Fast growing market. Opportunities in consumer banking. UOB is leading credit card acquirer.
India• Intend to be disciplined and prudent by focusing on selective segments as we build
understanding of the market• Applying to set up first branch in Mumbai
OECD• Will continue to be a meaningful overseas contributor
14
Overseas Expansion On Track
Regionalisation efforts seeing results. Established strong SEA platform. ASEAN’s 9M06 pre-tax profit grew 84% yoy.
Operations outside ASEAN key to achieving well-balanced global portfolio.
Promote synergies across countries, products and customers in expanded regional footprint.
Pre-tax offshore profit contribution in 9M06 accounts for 31.5%**.
15
* Before intangible assets amortised / impaired ** Excluding the one-time gain
Agenda
11 Overview of UOB GroupOverview of UOB Group
22 Growth and Regional StrategyGrowth and Regional Strategy
33 Infrastructure, Systems & OperationsInfrastructure, Systems & Operations
44 Review of Financial PerformanceReview of Financial Performance
55 Capital ManagementCapital Management
16
IT Management Philosophy
Differentiation through customer segmentation and service
Leveraging volume to create infrastructure scale
Fast and measurable benefits
17
Operating Infrastructure –Track Record Of Execution
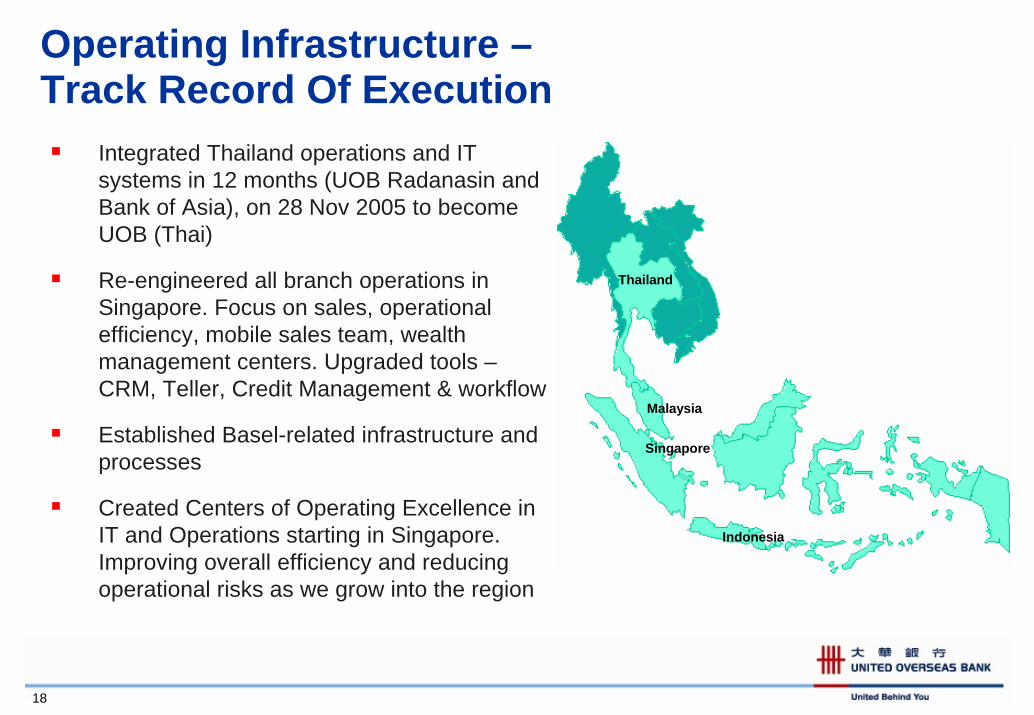
Integrated Thailand operations and IT systems in 12 months (UOB Radanasin and Bank of Asia), on 28 Nov 2005 to become UOB (Thai)
Re-engineered all branch operations in Singapore. Focus on sales, operational efficiency, mobile sales team, wealth management centers. Upgraded tools –CRM, Teller, Credit Management & workflow
Established Basel-related infrastructure and processes
Created Centers of Operating Excellence in IT and Operations starting in Singapore. Improving overall efficiency and reducing operational risks as we grow into the region
Thailand
Malaysia
Singapore
Indonesia
18
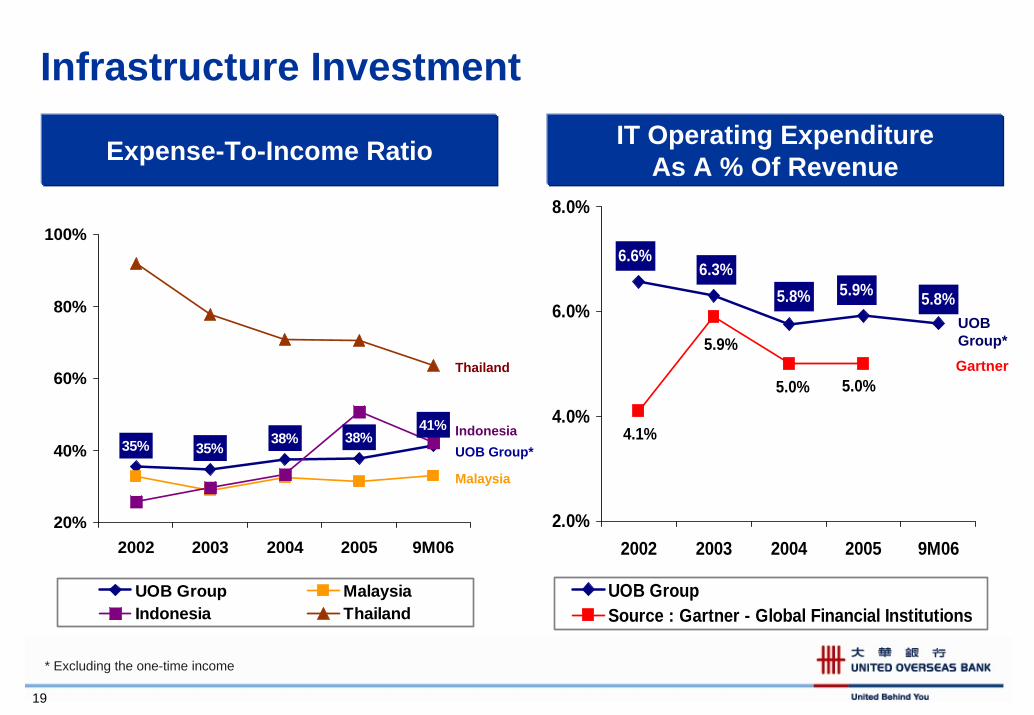
Infrastructure Investment
5.8%5.9%5.8%6.3%
6.6%
5.0%5.0%
4.1%
5.9%
2.0%
4.0%
6.0%
8.0%
2002 2003 2004 2005 9M06
UOB GroupSource : Gartner - Global Financial Institutions
41%38%38%
35%35%
20%
40%
60%
80%
100%
2002 2003 2004 2005 9M06
UOB Group MalaysiaIndonesia Thailand
Expense-To-Income Ratio IT Operating ExpenditureAs A % Of Revenue
Gartner
UOBGroup*
Thailand
Malaysia
IndonesiaUOB Group*
19
* Excluding the one-time income
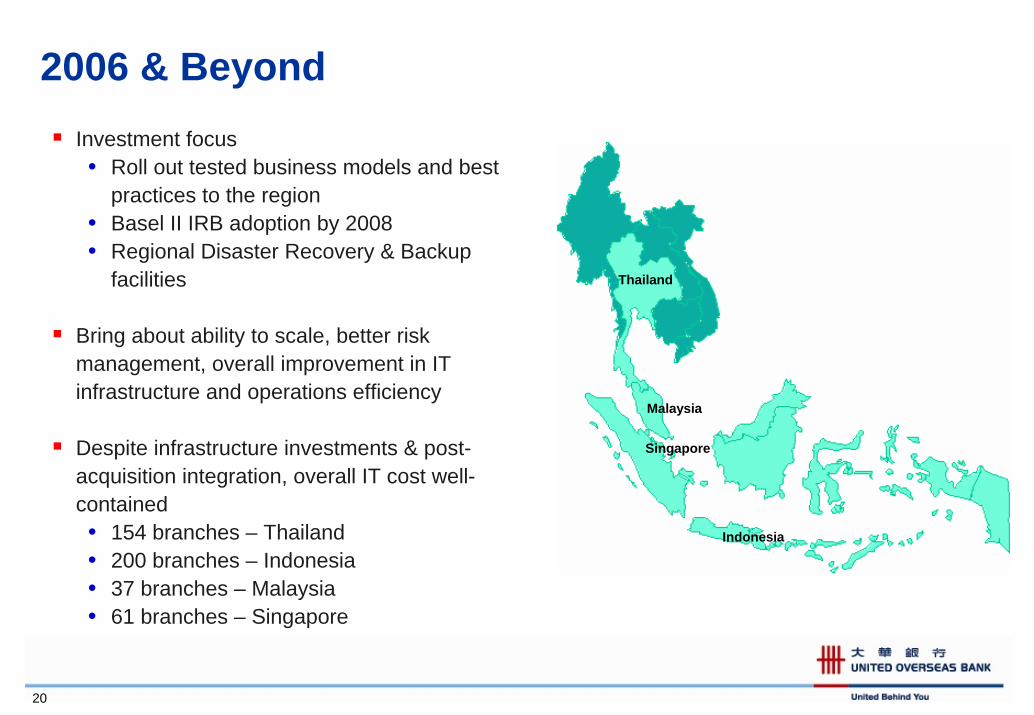
2006 & BeyondInvestment focus• Roll out tested business models and best
practices to the region• Basel II IRB adoption by 2008• Regional Disaster Recovery & Backup
facilities
Bring about ability to scale, better risk management, overall improvement in IT infrastructure and operations efficiency
Despite infrastructure investments & post-acquisition integration, overall IT cost well-contained• 154 branches – Thailand• 200 branches – Indonesia• 37 branches – Malaysia• 61 branches – Singapore
Thailand
Malaysia
Singapore
Indonesia
20
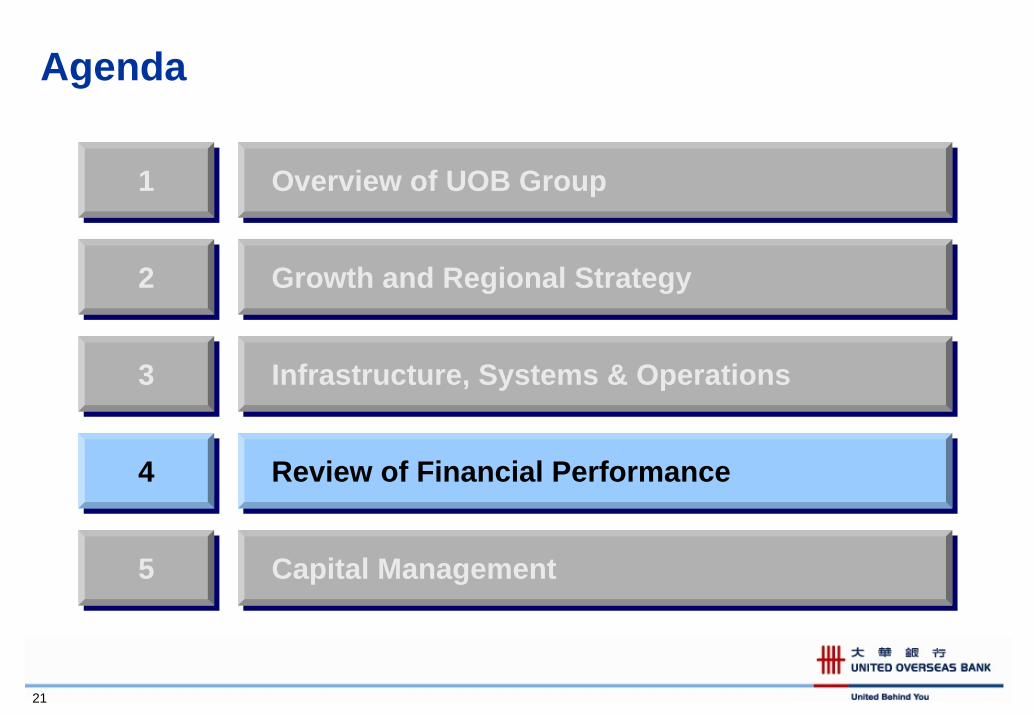
Agenda
11 Overview of UOB GroupOverview of UOB Group
22 Growth and Regional StrategyGrowth and Regional Strategy
33 Infrastructure, Systems & OperationsInfrastructure, Systems & Operations
44 Review of Financial PerformanceReview of Financial Performance
55 Capital ManagementCapital Management
21
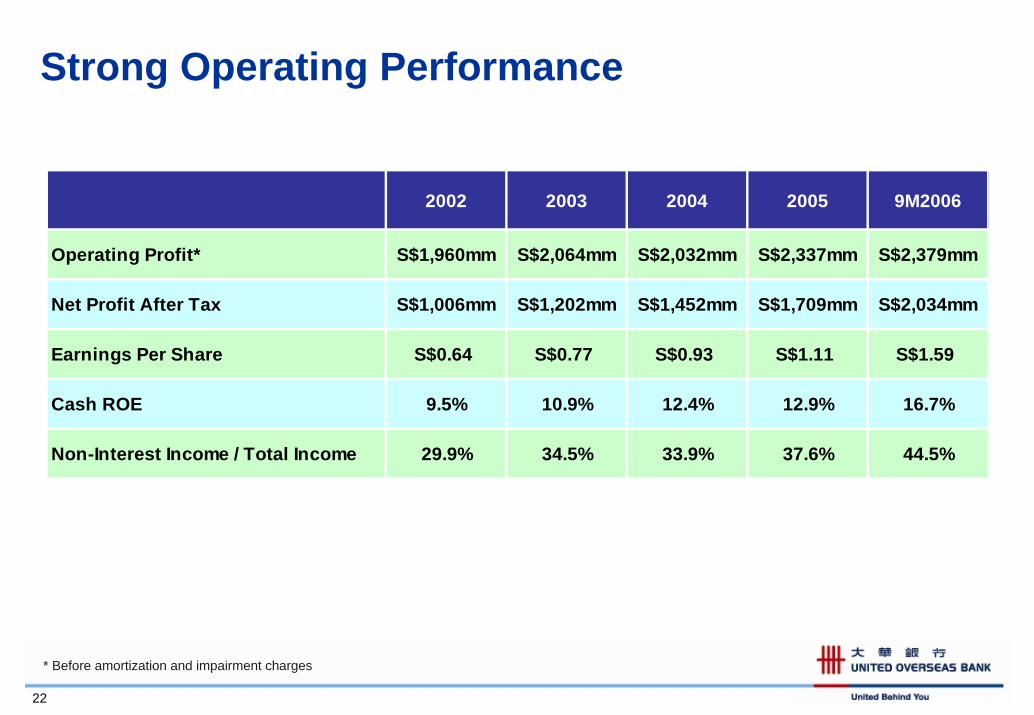
Strong Operating Performance
2002 2003 2004 2005 9M2006
Operating Profit* S$1,960mm S$2,064mm S$2,032mm S$2,337mm S$2,379mm
Net Profit After Tax S$1,006mm S$1,202mm S$1,452mm S$1,709mm S$2,034mm
Earnings Per Share S$0.64 S$0.77 S$0.93 S$1.11 S$1.59
Cash ROE 9.5% 10.9% 12.4% 12.9% 16.7%
Non-Interest Income / Total Income 29.9% 34.5% 33.9% 37.6% 44.5%
22
* Before amortization and impairment charges
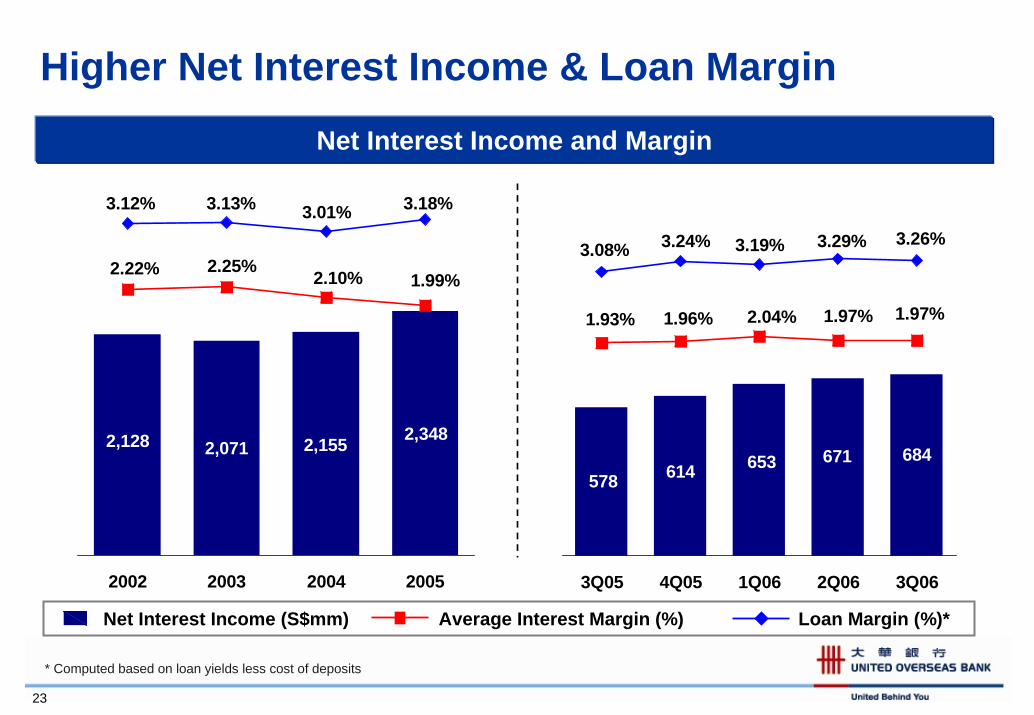
Higher Net Interest Income & Loan Margin
Net Interest Income and Margin
684671653578 614
1.93% 1.96% 2.04% 1.97% 1.97%
3.26%3.29%3.19%3.24%3.08%
3Q05 4Q05 1Q06 2Q06 3Q06
2,1552,0712,128 2,348
2.22% 2.25% 2.10% 1.99%
3.18%3.01%3.13%3.12%
2002 2003 2004 2005
Net Interest Income (S$mm) Average Interest Margin (%) Loan Margin (%)*
23
* Computed based on loan yields less cost of deposits
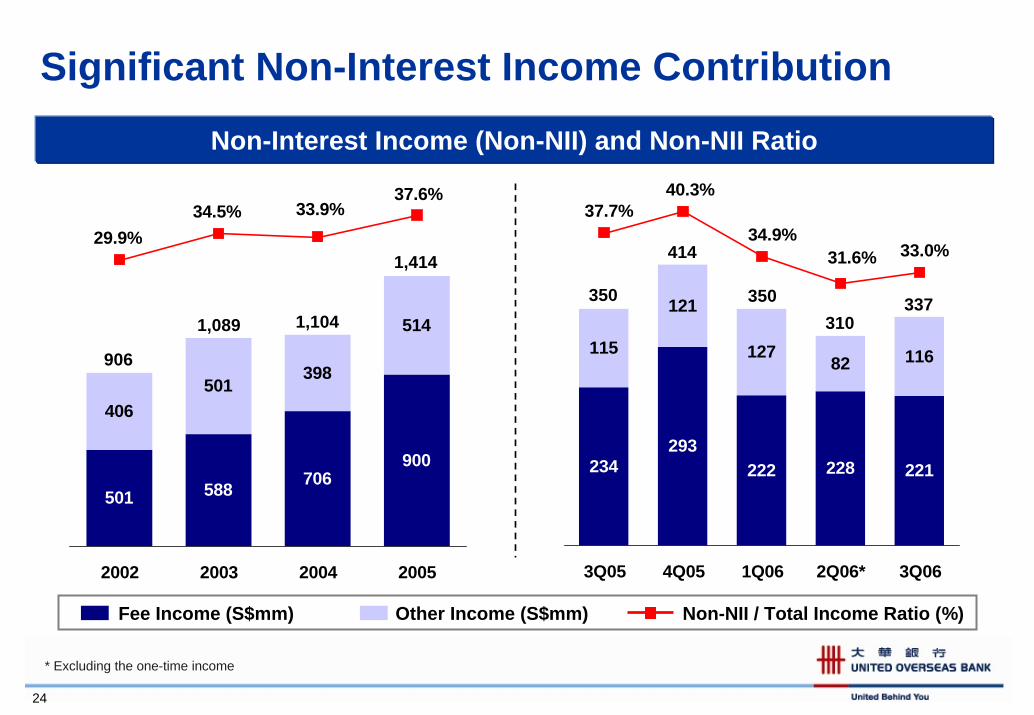
Significant Non-Interest Income Contribution
Fee Income (S$mm) Other Income (S$mm) Non-NII / Total Income Ratio (%)
234293
222 228 221
115
121
127 82 116
33.0%31.6%34.9%
37.7%40.3%
3Q05 4Q05 1Q06 2Q06* 3Q06
501 588 706900
406501
398
514
37.6%33.9%34.5%
29.9%
2002 2003 2004 2005
350
414
1,089 1,104
906
1,414
Non-Interest Income (Non-NII) and Non-NII Ratio
350310
337
24
* Excluding the one-time income
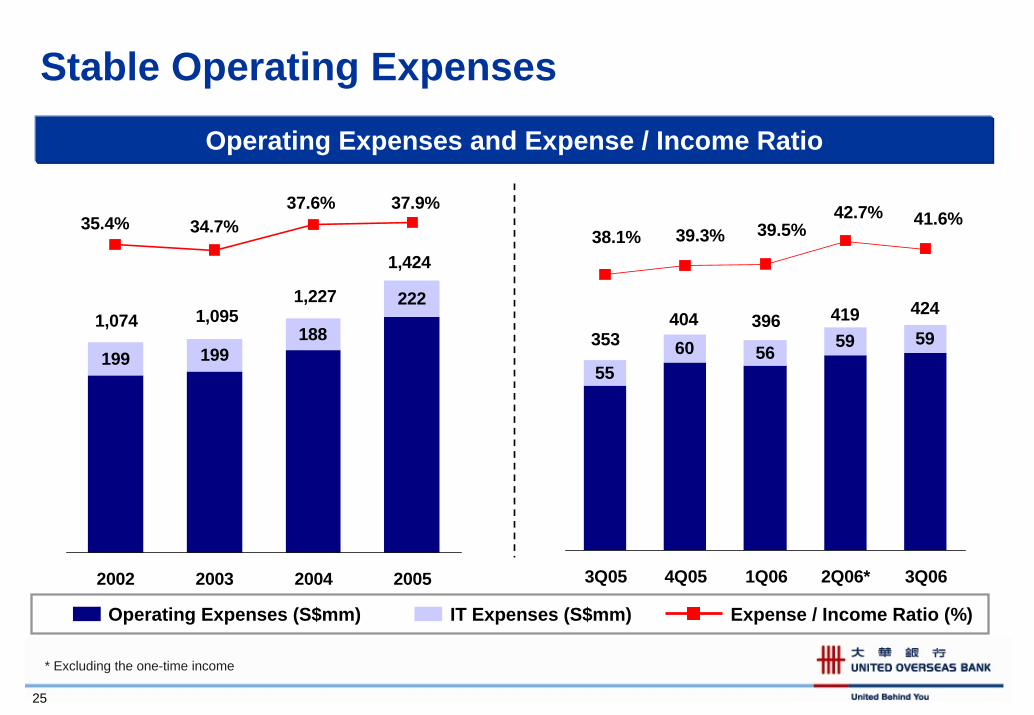
Stable Operating Expenses
Operating Expenses and Expense / Income Ratio
199 199188
222
1,424
1,2271,0951,074
35.4% 34.7%37.6% 37.9%
2002 2003 2004 2005
5560 56
59424419396
353404
59
41.6%38.1% 39.3%
42.7%39.5%
3Q05 4Q05 1Q06 2Q06* 3Q06
Operating Expenses (S$mm) IT Expenses (S$mm) Expense / Income Ratio (%)
25
* Excluding the one-time income
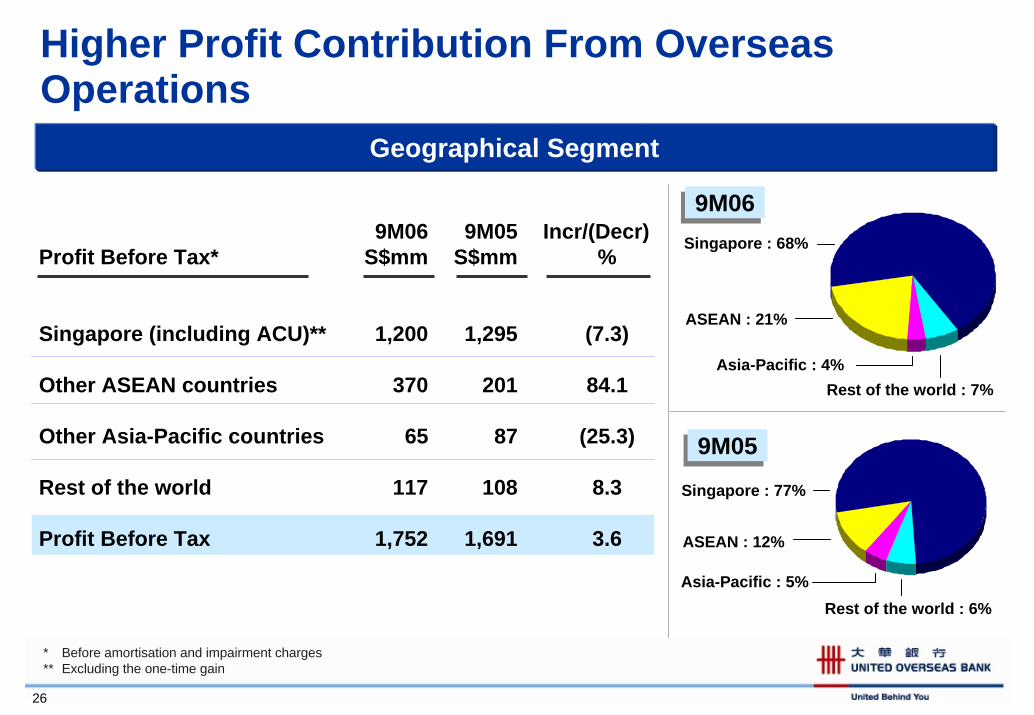
Higher Profit Contribution From Overseas Operations
Geographical SegmentGeographical Segment
Rest of the world : 7%
26
Singapore : 77%
ASEAN : 12%
Asia-Pacific : 5%
Singapore : 68%
ASEAN : 21%
Asia-Pacific : 4%
Rest of the world : 6%
9M06 9M05 Incr/(Decr)Profit Before Tax* S$mm S$mm %
Singapore (including ACU)** 1,200 1,295 (7.3)
Other ASEAN countries 370 201 84.1
Other Asia-Pacific countries 65 87 (25.3)
Rest of the world 117 108 8.3
Profit Before Tax 1,752 1,691 3.6
9M059M05
9M069M06
* Before amortisation and impairment charges** Excluding the one-time gain
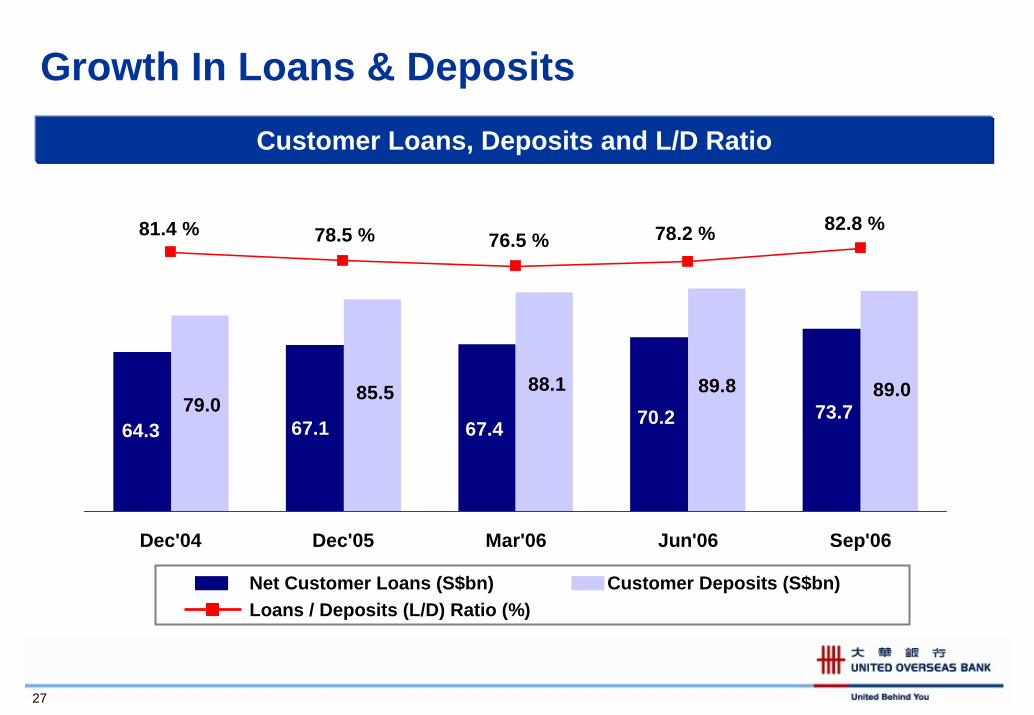
Growth In Loans & Deposits
Customer Loans, Deposits and L/D Ratio
73.770.267.467.164.3
89.089.888.185.579.0
82.8 %78.2 %76.5 %78.5 %81.4 %
Dec'04 Dec'05 Mar'06 Jun'06 Sep'06
Net Customer Loans (S$bn) Customer Deposits (S$bn)Loans / Deposits (L/D) Ratio (%)
27
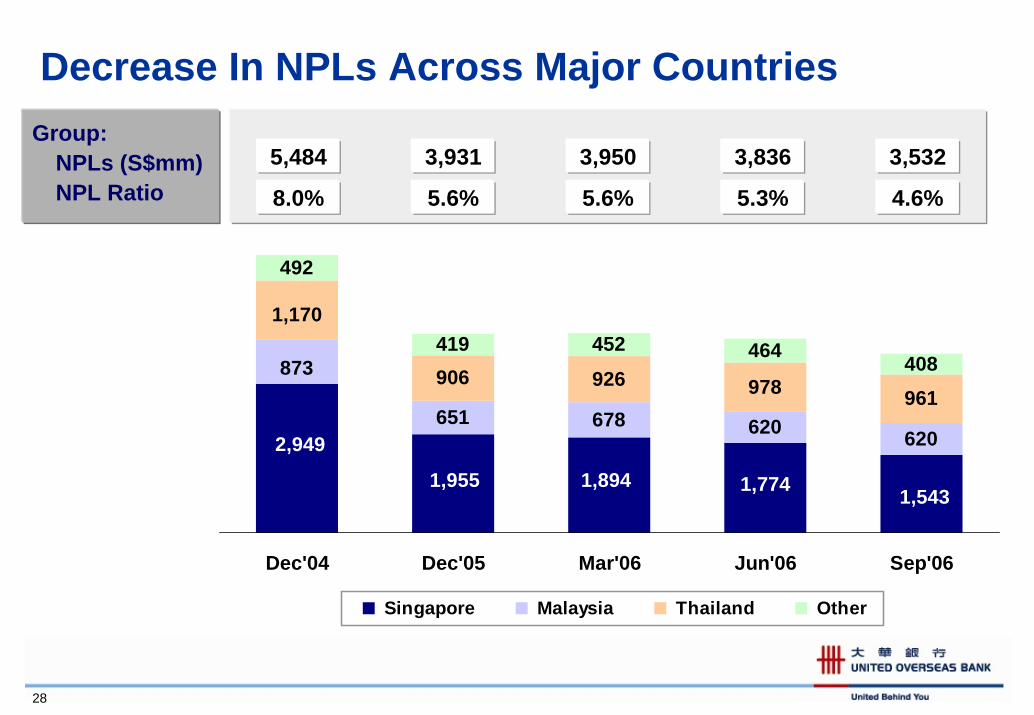
Decrease In NPLs Across Major Countries
651 678 620 620
906 926 978 961
419 452 464 408
1,5431,7741,8941,955
2,949
873
1,170
492
Dec'04 Dec'05 Mar'06 Jun'06 Sep'06
Singapore Malaysia Thailand Other
3,9503,9315,484 3,836 3,532
5.6%5.6%8.0% 5.3% 4.6%
Group:NPLs (S$mm)NPL Ratio
28
Agenda
11 Overview of UOB GroupOverview of UOB Group
22 Growth and Regional StrategyGrowth and Regional Strategy
33 Infrastructure, Systems & OperationsInfrastructure, Systems & Operations
44 Review of Financial PerformanceReview of Financial Performance
55 Capital ManagementCapital Management
29
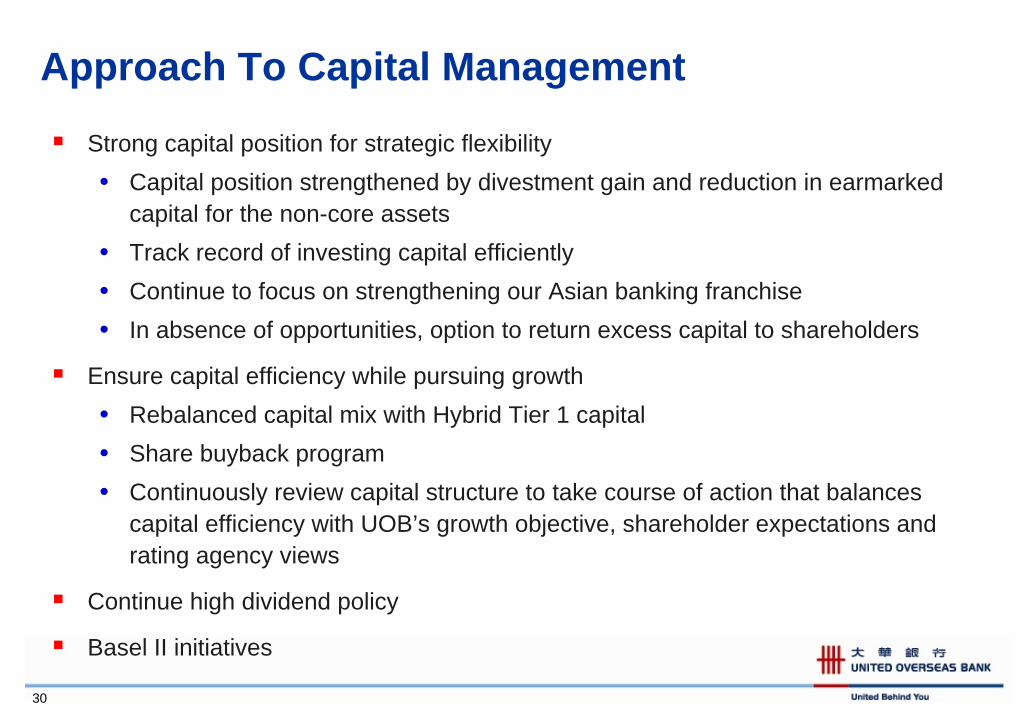
Approach To Capital Management
30
Strong capital position for strategic flexibility• Capital position strengthened by divestment gain and reduction in earmarked
capital for the non-core assets • Track record of investing capital efficiently• Continue to focus on strengthening our Asian banking franchise• In absence of opportunities, option to return excess capital to shareholders
Ensure capital efficiency while pursuing growth• Rebalanced capital mix with Hybrid Tier 1 capital• Share buyback program• Continuously review capital structure to take course of action that balances
capital efficiency with UOB’s growth objective, shareholder expectations and rating agency views
Continue high dividend policy
Basel II initiatives
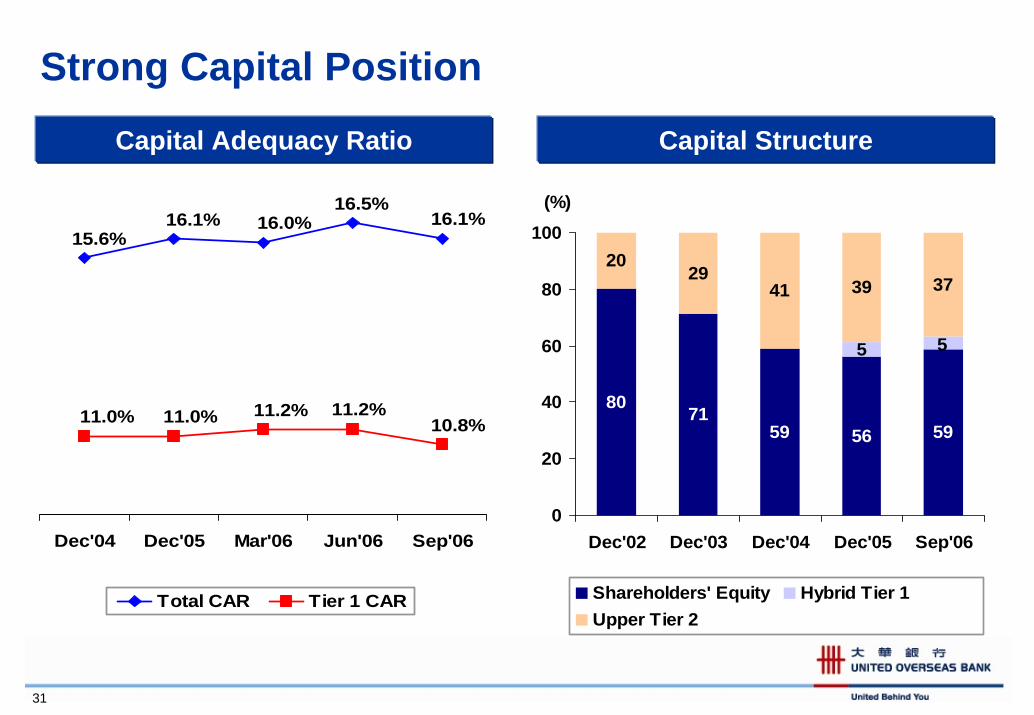
Strong Capital Position
Capital Adequacy Ratio Capital Structure
5
56
80 7159 59
5
394129
2037
0
20
40
60
80
100
Dec'02 Dec'03 Dec'04 Dec'05 Sep'06
(%)
Shareholders' Equity Hybrid Tier 1Upper Tier 2
16.1%16.5%
16.0%16.1%15.6%
11.0% 11.0% 11.2%10.8%
11.2%
Dec'04 Dec'05 Mar'06 Jun'06 Sep'06
Total CAR Tier 1 CAR
31
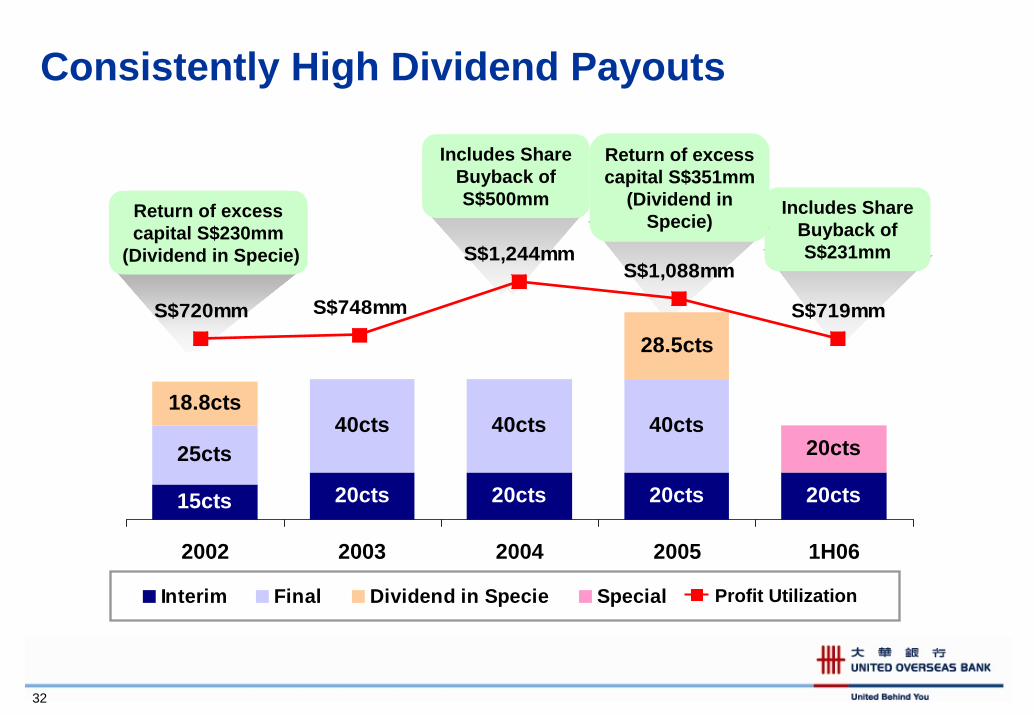
Consistently High Dividend Payouts
Includes Share Buyback of S$231mm
Includes Share Buyback of S$500mmReturn of excess
capital S$230mm(Dividend in Specie)
Return of excess capital S$351mm
(Dividend in Specie)
15cts 20cts 20cts 20cts 20cts
25cts40cts 40cts 40cts
18.8cts
28.5cts
20cts
2002 2003 2004 2005 1H06
Interim Final Dividend in Specie Special
S$720mm S$748mm
S$1,244mmS$1,088mm
S$719mm
Profit Utilization
32
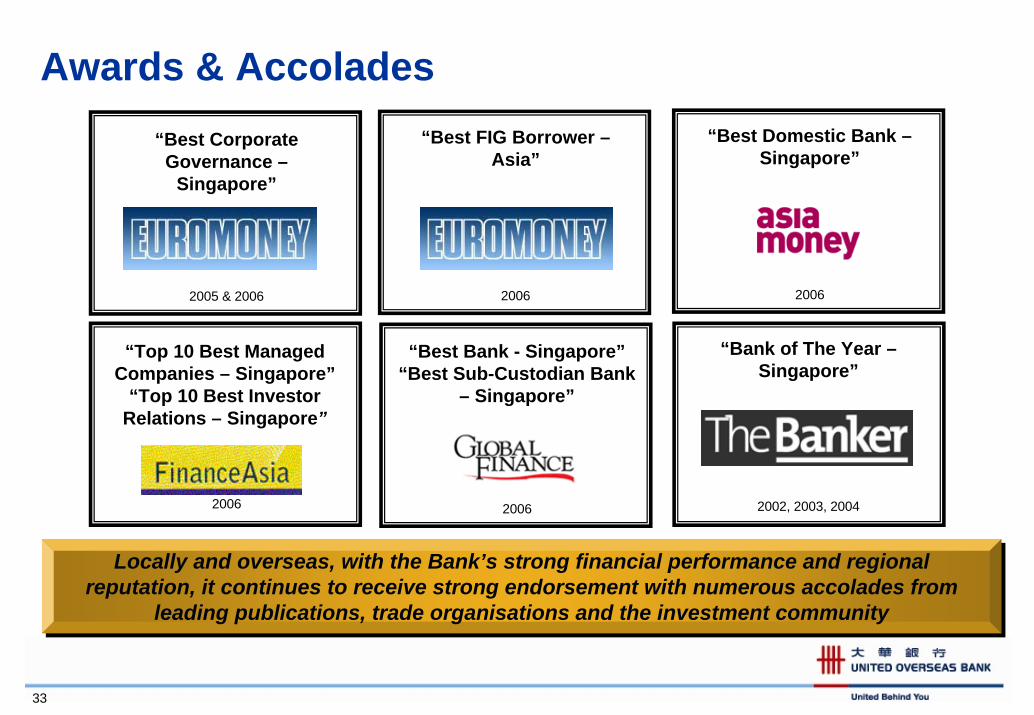
Awards & Accolades
33
Locally and overseas, with the Bank’s strong financial performance and regional reputation, it continues to receive strong endorsement with numerous accolades from
leading publications, trade organisations and the investment community
Locally and overseas, with the Bank’s strong financial performance and regional reputation, it continues to receive strong endorsement with numerous accolades from
leading publications, trade organisations and the investment community
“Best Corporate Governance –
Singapore”
2005 & 2006
“Bank of The Year –Singapore”
2002, 2003, 2004
“Best Domestic Bank –Singapore”
2006
“Best FIG Borrower –Asia”
2006
“Top 10 Best Managed Companies – Singapore”
“Top 10 Best Investor Relations – Singapore”
2006
“Best Bank - Singapore”“Best Sub-Custodian Bank
– Singapore”
2006