Embed Size (px)
Citation preview
July 2007July 2007
United Overseas Bank LimitedUnited Overseas Bank Limited
This material that follows is a presentation of general background information about United Overseas Bank Limited’s (“UOB” or the “Bank”) activities current at the date of the presentation. It is information given in summary form and does not purport to be complete. It is not to be relied upon as advice to investors or potential investors and does not take into account the investment objectives, financial situation or needs of any particular investor. This material should be considered with professional advice when deciding if an investment is appropriate. The Bank accepts
no liability whatsoever with respect to the use of this document or its content.

1
Agenda
1. Introduction to UOB
2. Investment Highlights
3. Conclusion
2
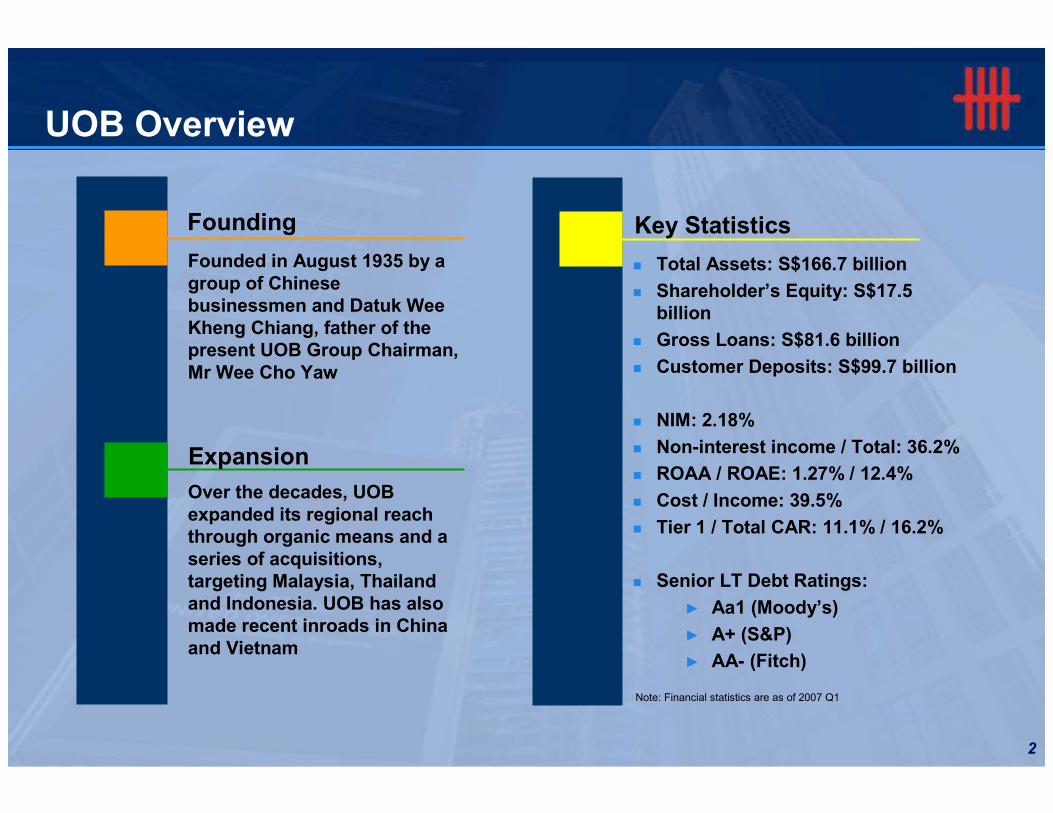
UOB Overview
Note: Financial statistics are as of 2007 Q1
Founded in August 1935 by a group of Chinese businessmen and Datuk Wee Kheng Chiang, father of the present UOB Group Chairman, Mr Wee Cho Yaw
Over the decades, UOB expanded its regional reach through organic means and a series of acquisitions, targeting Malaysia, Thailand and Indonesia. UOB has also made recent inroads in China and Vietnam
� Total Assets: S$166.7 billion
� Shareholder’s Equity: S$17.5 billion
� Gross Loans: S$81.6 billion
� Customer Deposits: S$99.7 billion
� NIM: 2.18%
� Non-interest income / Total: 36.2%
� ROAA / ROAE: 1.27% / 12.4%
� Cost / Income: 39.5%
� Tier 1 / Total CAR: 11.1% / 16.2%
� Senior LT Debt Ratings:
► Aa1 (Moody’s)
► A+ (S&P)
► AA- (Fitch)
Founding
Expansion
Key Statistics
3
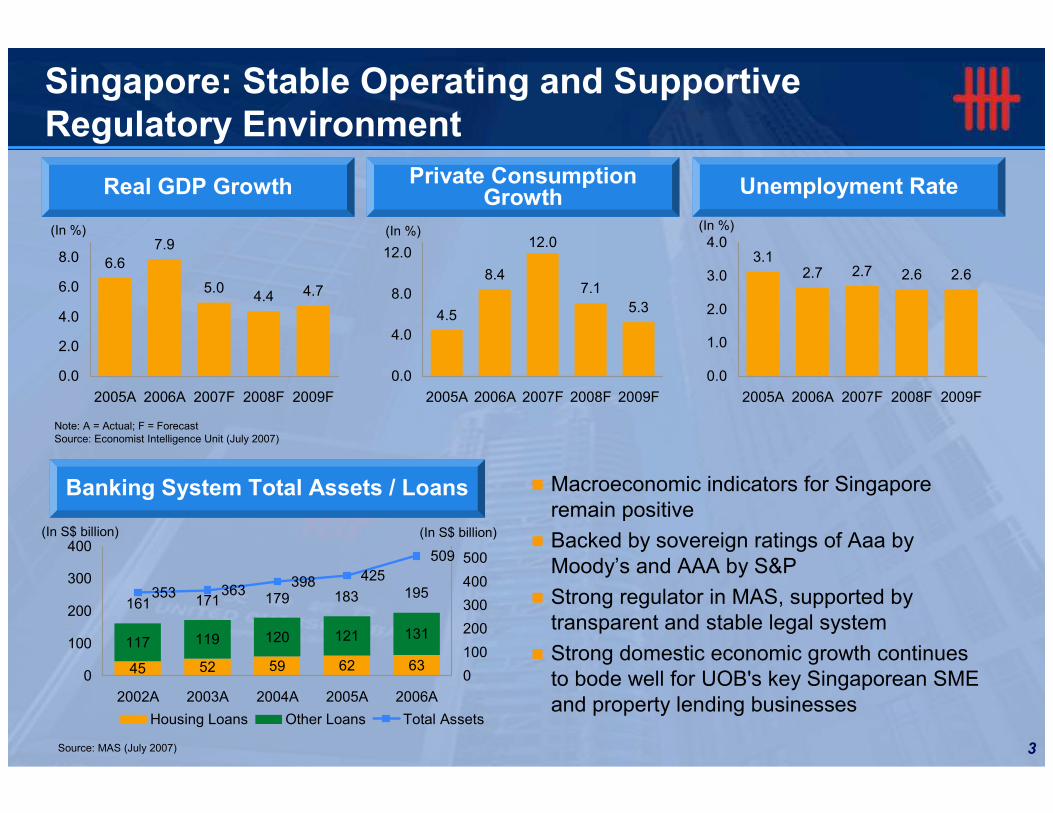
6.6
7.9
5.04.4 4.7
0.0
2.0
4.0
6.0
8.0
2005A 2006A 2007F 2008F 2009F
4.5
8.4
12.0
7.1
5.3
0.0
4.0
8.0
12.0
2005A 2006A 2007F 2008F 2009F
3.12.7 2.7 2.6 2.6
0.0
1.0
2.0
3.0
4.0
2005A 2006A 2007F 2008F 2009F
Singapore: Stable Operating and Supportive Regulatory Environment
Note: A = Actual; F = Forecast Source: Economist Intelligence Unit (July 2007)
(In %) (In %)
Real GDP Growth Private Consumption Growth
Unemployment Rate
(In %)
Banking System Total Assets / Loans
(In S$ billion) (In S$ billion)
Source: MAS (July 2007)
45 52 59 62 63
117 119 120 121 131
353 363398 425
509
0
100
200
300
400
2002A 2003A 2004A 2005A 2006A
0
100
200
300
400
500
Housing Loans Other Loans Total Assets
161 171 179 183 195
� Macroeconomic indicators for Singapore remain positive
� Backed by sovereign ratings of Aaa by Moody’s and AAA by S&P
� Strong regulator in MAS, supported by transparent and stable legal system
� Strong domestic economic growth continues to bode well for UOB's key Singaporean SME and property lending businesses
4
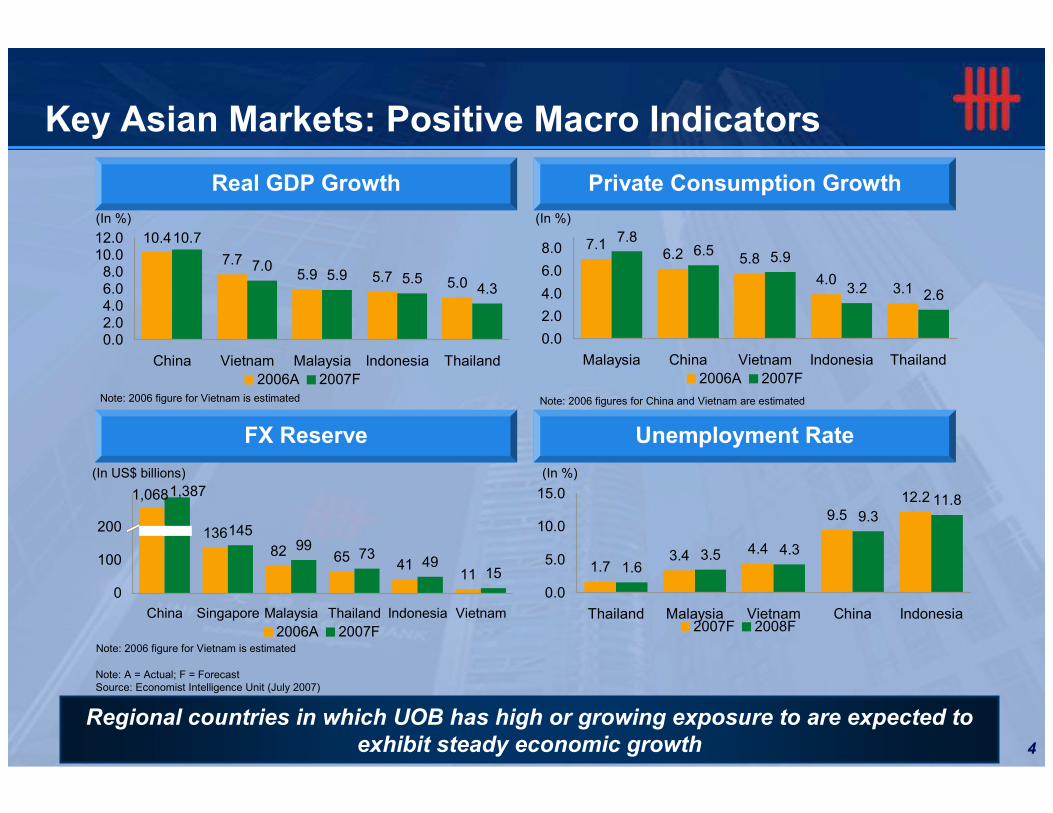
13682 65
4111
14599
7349
15
1,0681,387
0
100
200
China Singapore Malaysia Thailand Indonesia Vietnam
2006A 2007F
7.16.2 5.8
4.03.1
7.86.5 5.9
3.2 2.6
0.0
2.0
4.0
6.0
8.0
Malaysia China Vietnam Indonesia Thailand
2006A 2007F
1.73.4 4.4
9.512.2
1.63.5 4.3
9.311.8
0.0
5.0
10.0
15.0
Thailand Malaysia Vietnam China Indonesia2007F 2008F
10.4
7.75.9 5.7 5.0
10.7
7.05.9 5.5
4.3
0.02.04.06.08.0
10.012.0
China Vietnam Malaysia Indonesia Thailand
2006A 2007F
Key Asian Markets: Positive Macro Indicators
Regional countries in which UOB has high or growing exposure to are expected to
exhibit steady economic growth
Real GDP Growth Private Consumption Growth
FX Reserve Unemployment Rate
(In %) (In %)
(In %)(In US$ billions)
Note: A = Actual; F = ForecastSource: Economist Intelligence Unit (July 2007)
Note: 2006 figure for Vietnam is estimated Note: 2006 figures for China and Vietnam are estimated
Note: 2006 figure for Vietnam is estimated
5
Agenda
1. Introduction to UOB
2. Investment Highlights
3. Conclusion
6
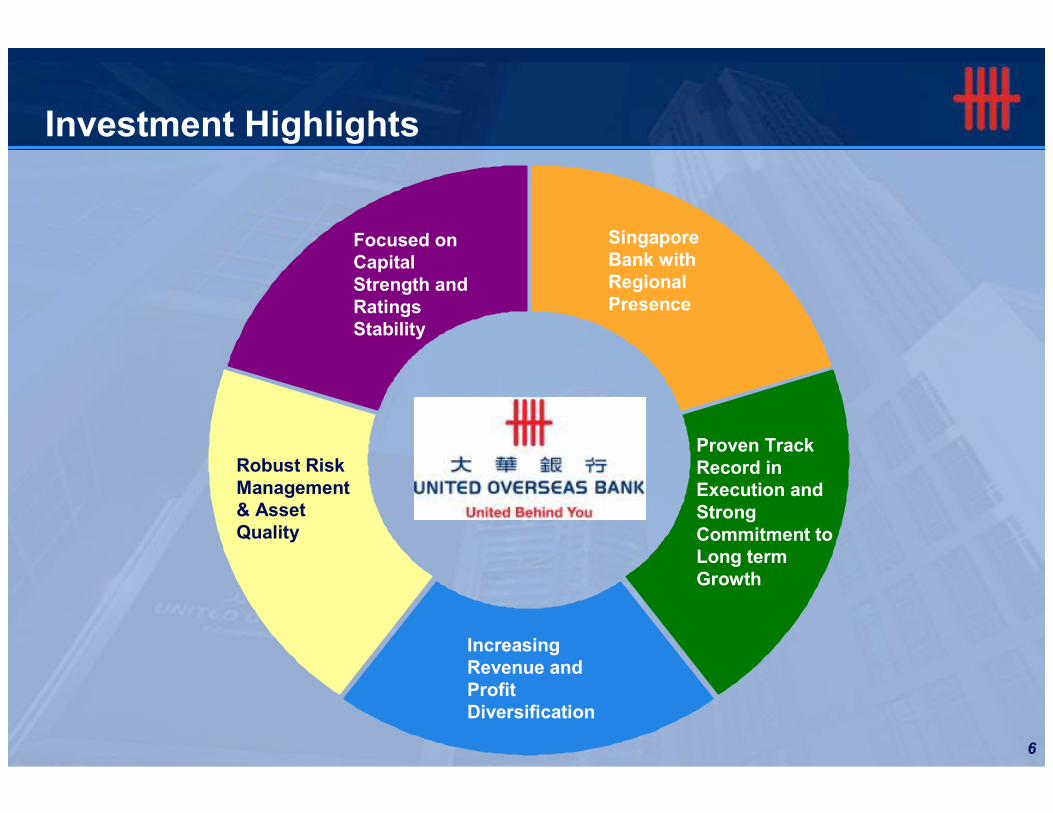
Investment Highlights
Singapore Bank with Regional Presence
Proven Track Record in Execution and Strong Commitment to Long term Growth
Increasing Revenue and Profit Diversification
Focused on Capital Strength and Ratings Stability
Robust Risk Management & Asset Quality
7
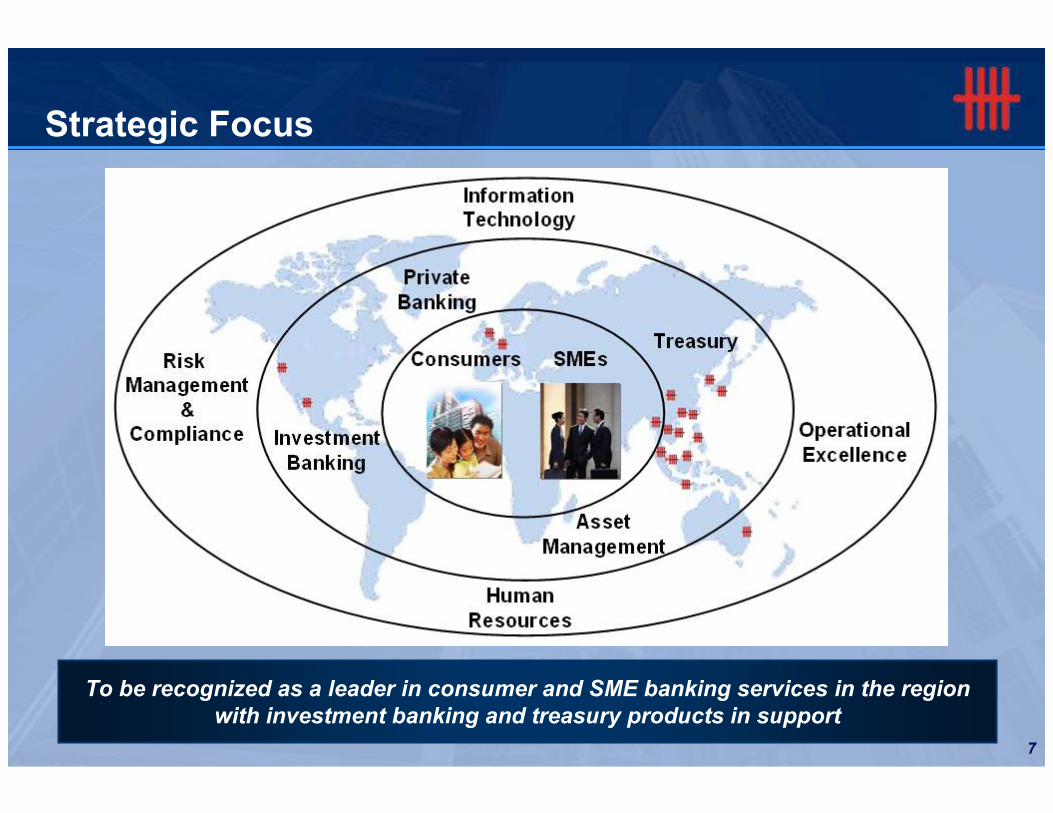
Strategic Focus
To be recognized as a leader in consumer and SME banking services in the region
with investment banking and treasury products in support
8
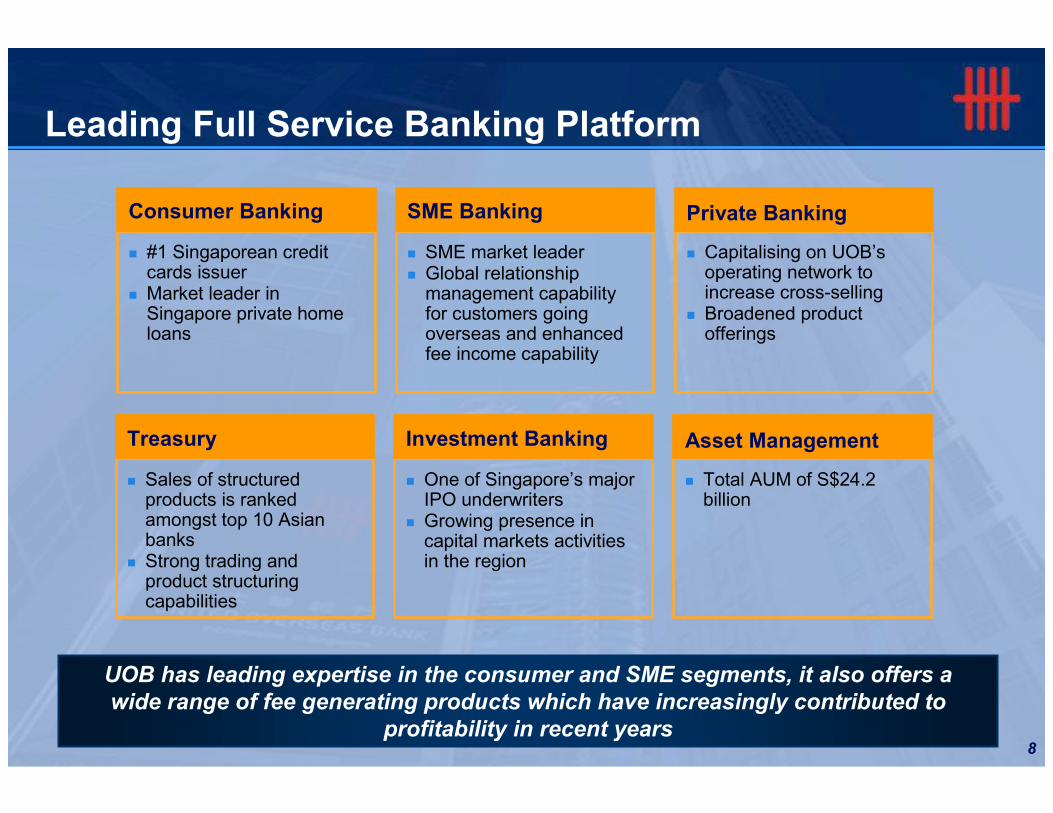
Leading Full Service Banking Platform
� #1 Singaporean credit cards issuer
� Market leader in Singapore private home loans
UOB has leading expertise in the consumer and SME segments, it also offers a
wide range of fee generating products which have increasingly contributed to
profitability in recent years
Consumer Banking
� SME market leader� Global relationship
management capability for customers going overseas and enhanced fee income capability
SME Banking
� Capitalising on UOB’s operating network to increase cross-selling
� Broadened product offerings
Private Banking
� Sales of structured products is ranked amongst top 10 Asian banks
� Strong trading and product structuring capabilities
Treasury
� One of Singapore’s major IPO underwriters
� Growing presence in capital markets activities in the region
Investment Banking
� Total AUM of S$24.2 billion
Asset Management
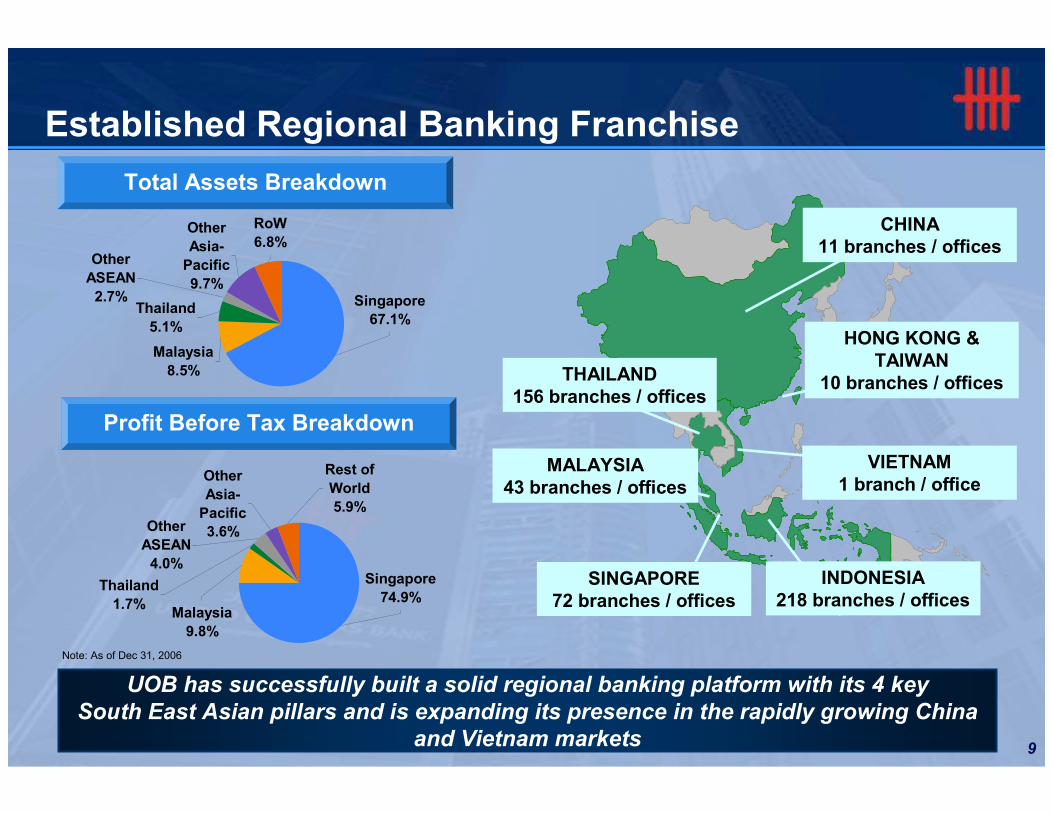
9
Singapore
74.9%Malaysia
9.8%
Thailand
1.7%
Other
ASEAN
4.0%
Other
Asia-
Pacific
3.6%
Rest of
World
5.9%
Note: As of Dec 31, 2006
UOB has successfully built a solid regional banking platform with its 4 key
South East Asian pillars and is expanding its presence in the rapidly growing China
and Vietnam markets
Established Regional Banking Franchise
THAILAND 156 branches / offices
SINGAPORE 72 branches / offices
MALAYSIA 43 branches / offices
INDONESIA218 branches / offices
VIETNAM1 branch / office
CHINA 11 branches / offices
HONG KONG & TAIWAN
10 branches / offices
Total Assets Breakdown
Profit Before Tax Breakdown
Singapore
67.1%
Malaysia
8.5%
Thailand
5.1%
Other
ASEAN
2.7%
Other
Asia-
Pacific
9.7%
RoW
6.8%
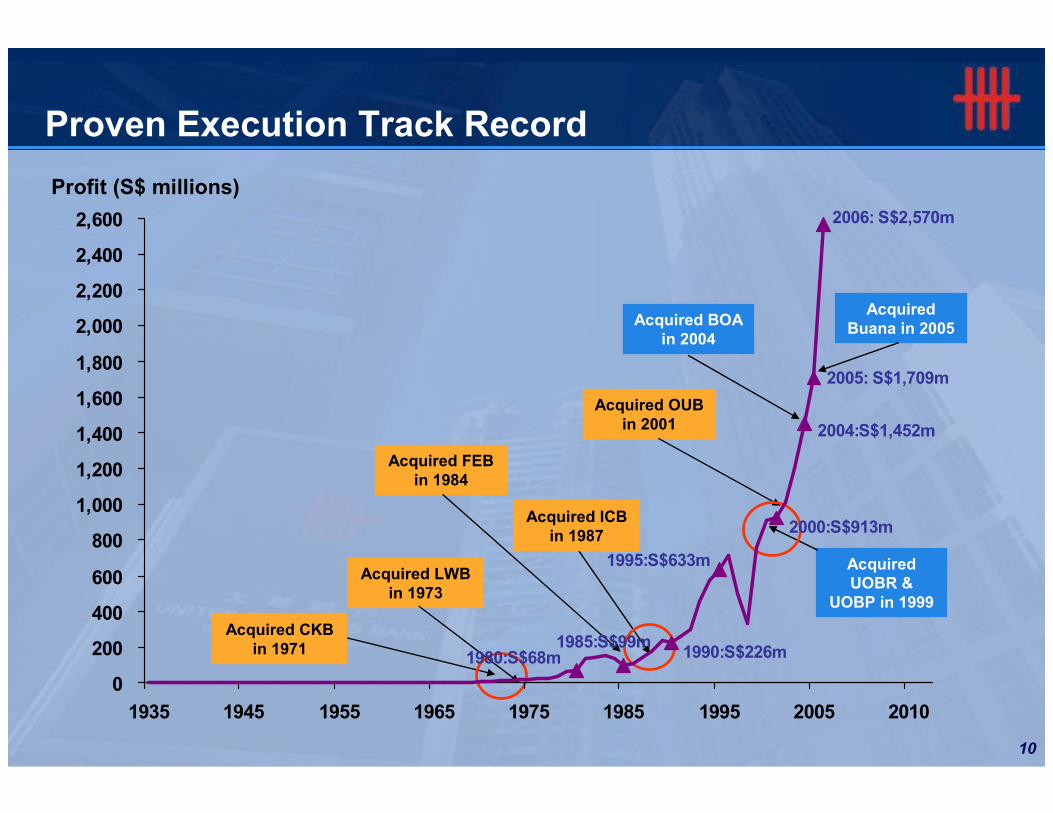
10
Proven Execution Track Record
Profit (S$ millions)
Acquired BOA in 2004
Acquired OUB in 2001
Acquired CKB in 1971
Acquired LWB in 1973
Acquired FEB in 1984
Acquired UOBR &
UOBP in 1999
Acquired Buana in 2005
Acquired ICB in 1987
2004:S$1,452m
2000:S$913m
1995:S$633m
1990:S$226m 1985:S$99m
1980:S$68m
2005: S$1,709m
2006: S$2,570m
0
200
400
600
800
1,000
1,200
1,400
1,600
1,800
2,000
2,200
2,400
2,600
1935 1945 1955 1965 1975 1985 1995 2005 2010
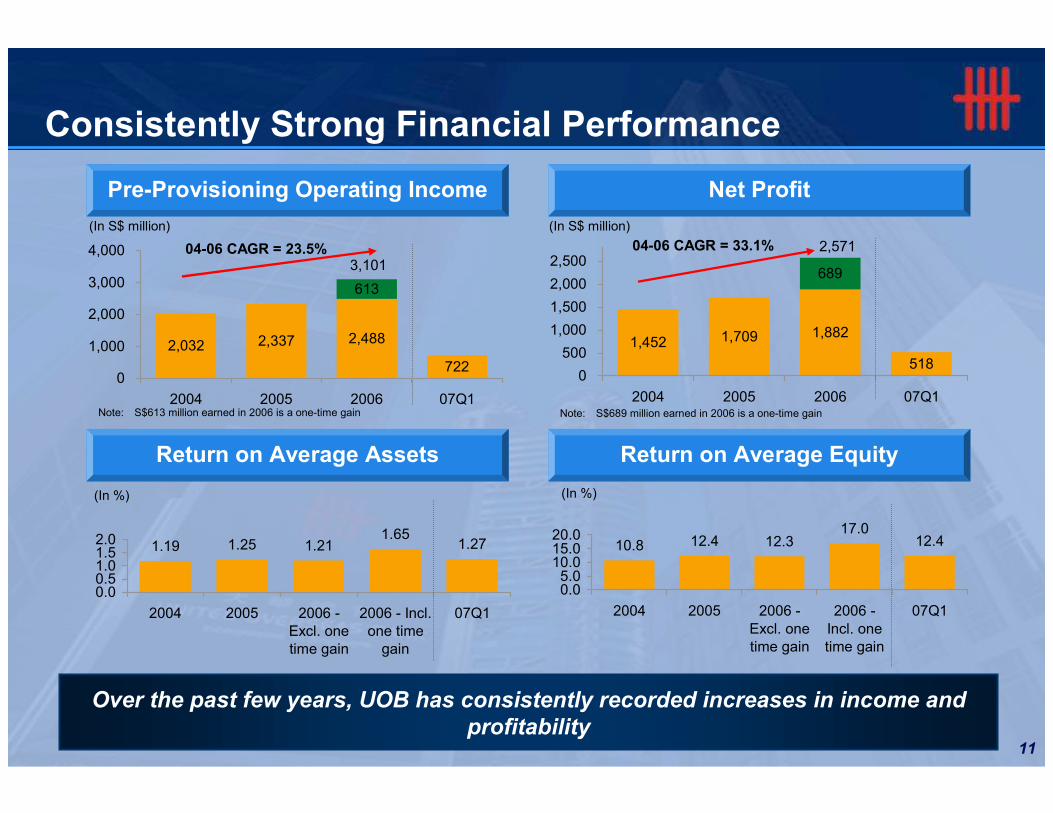
11
1,452 1,709 1,882
518
689
0
500
1,000
1,500
2,000
2,500
2004 2005 2006 07Q1
04-06 CAGR = 33.1% 2,571
(In S$ million)
Pre-Provisioning Operating Income Net Profit
Return on Average Assets Return on Average Equity
Over the past few years, UOB has consistently recorded increases in income and
profitability
(In %)
(In S$ million)
(In %)
Consistently Strong Financial Performance
1.19 1.25 1.211.65
1.27
0.00.51.01.52.0
2004 2005 2006 -Excl. onetime gain
2006 - Incl.one time
gain
07Q1
10.8 12.4 12.317.0
12.4
0.05.0
10.015.020.0
2004 2005 2006 -Excl. onetime gain
2006 -Incl. onetime gain
07Q1
Note: S$613 million earned in 2006 is a one-time gain Note: S$689 million earned in 2006 is a one-time gain
2,032 2,337 2,488
722
613
0
1,000
2,000
3,000
4,000
2004 2005 2006 07Q1
04-06 CAGR = 23.5%3,101
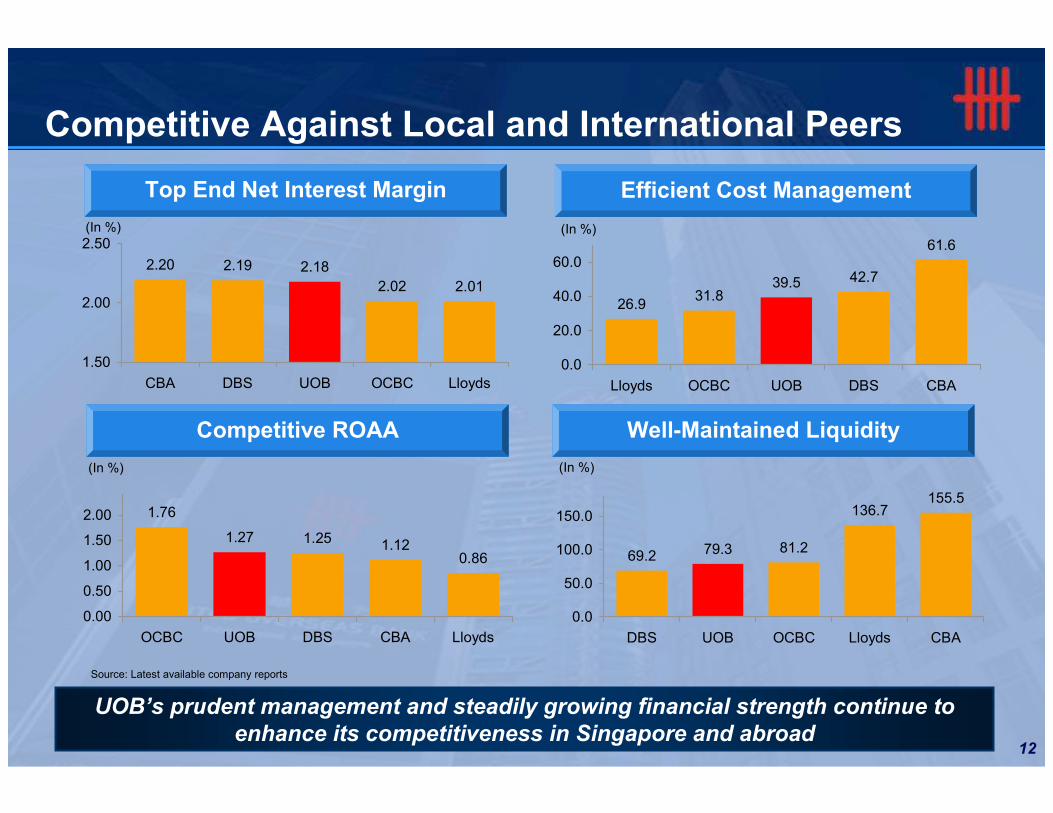
12
Competitive Against Local and International Peers
Top End Net Interest Margin Efficient Cost Management
Competitive ROAA Well-Maintained Liquidity
Source: Latest available company reports
UOB’s prudent management and steadily growing financial strength continue to
enhance its competitiveness in Singapore and abroad
(In %)
(In %)(In %)
(In %)
69.2 79.3 81.2
136.7155.5
0.0
50.0
100.0
150.0
DBS UOB OCBC Lloyds CBA
26.931.8
39.5 42.7
61.6
0.0
20.0
40.0
60.0
Lloyds OCBC UOB DBS CBA
2.20 2.19 2.18
2.02 2.01
1.50
2.00
2.50
CBA DBS UOB OCBC Lloyds
1.76
1.27 1.25 1.120.86
0.00
0.50
1.00
1.50
2.00
OCBC UOB DBS CBA Lloyds
13
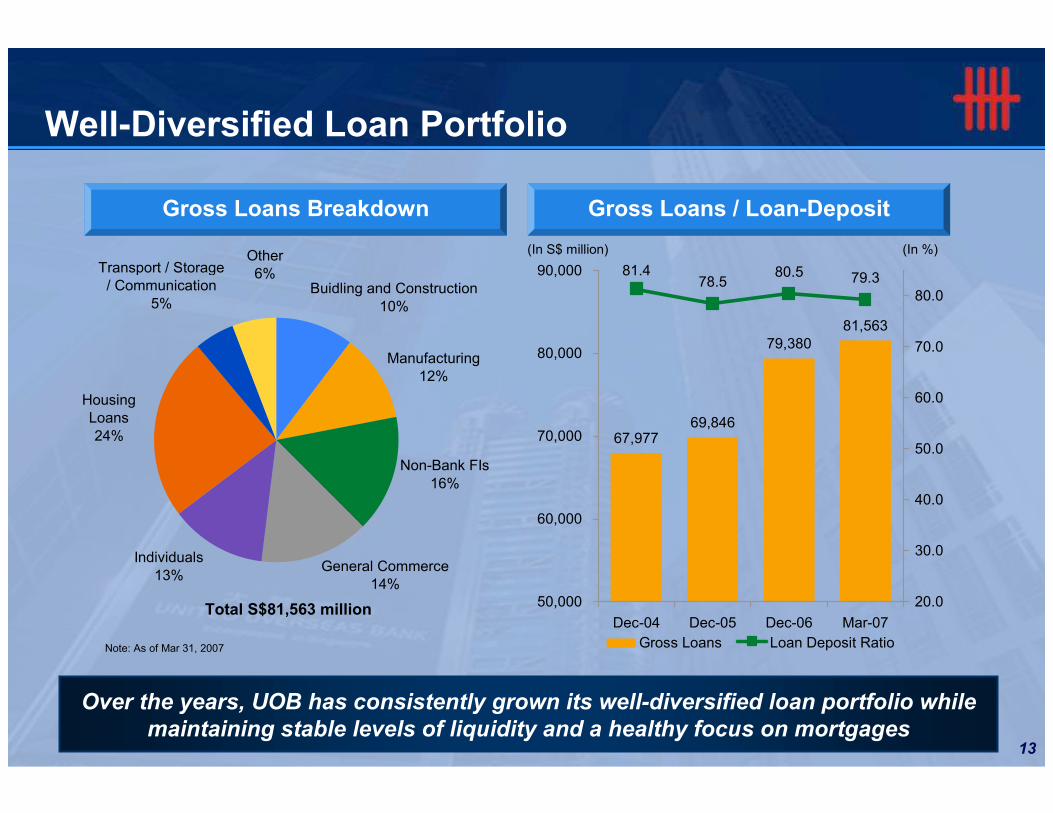
Buidling and Construction10%
Manufacturing12%
Non-Bank FIs16%
General Commerce14%
Individuals13%
Housing Loans24%
Transport / Storage / Communication
5%
Other6%
Well-Diversified Loan Portfolio
Note: As of Mar 31, 2007
(S$ in billion)
Total S$81,563 million
Over the years, UOB has consistently grown its well-diversified loan portfolio while
maintaining stable levels of liquidity and a healthy focus on mortgages
Gross Loans Breakdown Gross Loans / Loan-Deposit
(In S$ million) (In %)
67,97769,846
79,38081,563
81.478.5
80.5 79.3
50,000
60,000
70,000
80,000
90,000
Dec-04 Dec-05 Dec-06 Mar-07
20.0
30.0
40.0
50.0
60.0
70.0
80.0
Gross Loans Loan Deposit Ratio
14
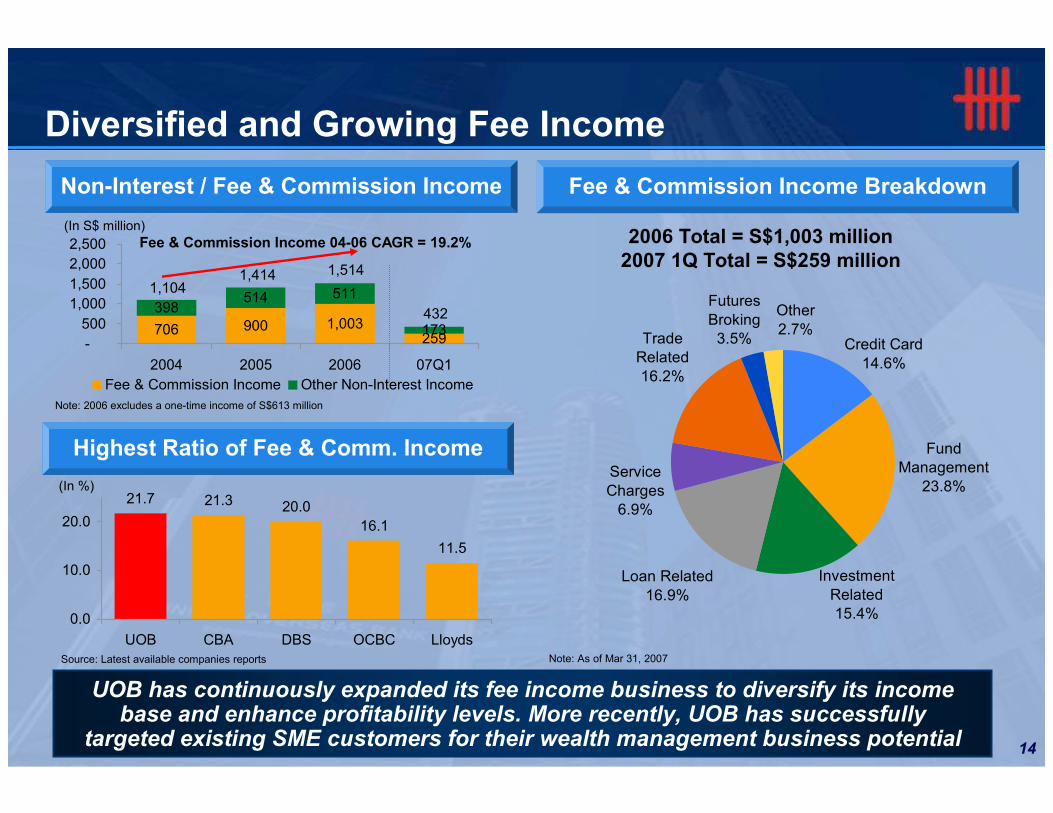
Service
Charges6.9%
Loan Related
16.9%
Fund Management
23.8%
Investment
Related15.4%
Futures
Broking3.5%
Other
2.7%Trade
Related
16.2%
Credit Card
14.6%
21.7 21.3 20.0
16.1
11.5
0.0
10.0
20.0
UOB CBA DBS OCBC Lloyds
Diversified and Growing Fee Income
(In S$ million)2006 Total = S$1,003 million2007 1Q Total = S$259 million
UOB has continuously expanded its fee income business to diversify its income base and enhance profitability levels. More recently, UOB has successfully
targeted existing SME customers for their wealth management business potential
Non-Interest / Fee & Commission Income
Highest Ratio of Fee & Comm. Income
Fee & Commission Income Breakdown
(In %)
Note: As of Mar 31, 2007
706 900 1,003259
398514 511
173-
500
1,000
1,500
2,000
2,500
2004 2005 2006 07Q1
Fee & Commission Income Other Non-Interest Income
Fee & Commission Income 04-06 CAGR = 19.2%
1,1041,414 1,514
432
Source: Latest available companies reports
Note: 2006 excludes a one-time income of S$613 million
15
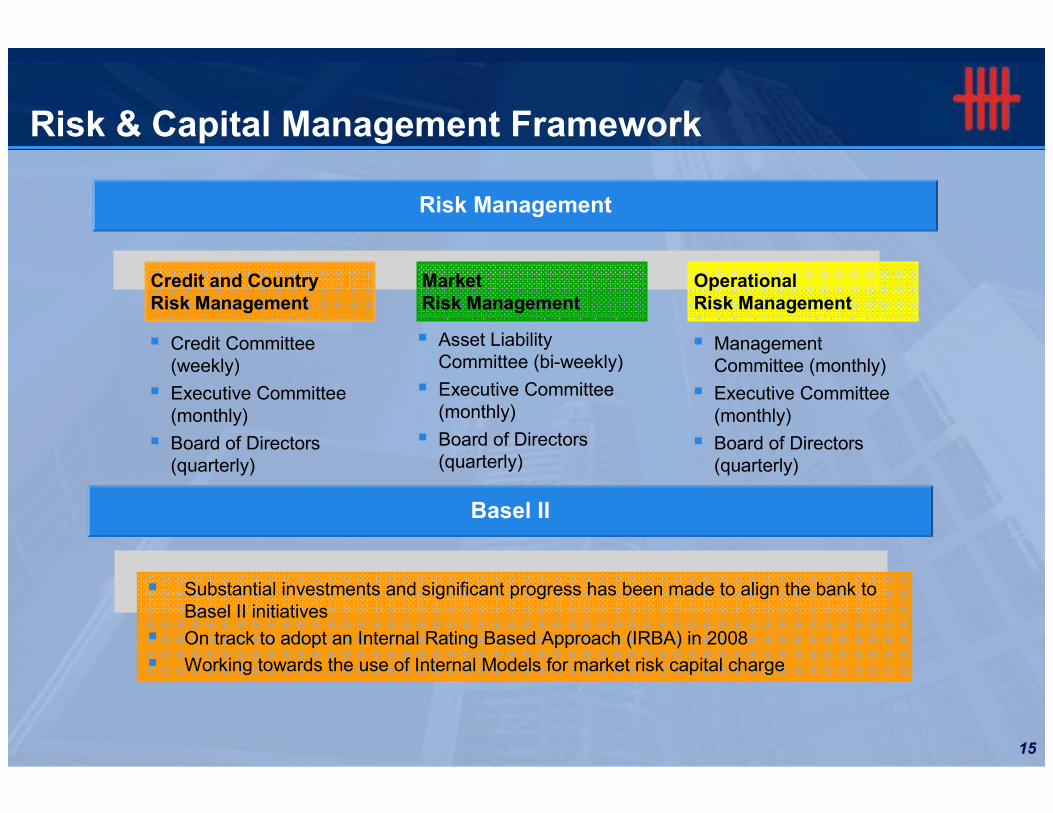
Risk & Capital Management Framework
� Credit Committee (weekly)
� Executive Committee (monthly)
� Board of Directors (quarterly)
� Asset Liability Committee (bi-weekly)
� Executive Committee (monthly)
� Board of Directors (quarterly)
� Management Committee (monthly)
� Executive Committee (monthly)
� Board of Directors (quarterly)
Credit and Country Risk Management
Market Risk Management
Operational Risk Management
Risk Management
Basel II
� Substantial investments and significant progress has been made to align the bank to Basel II initiatives
� On track to adopt an Internal Rating Based Approach (IRBA) in 2008
� Working towards the use of Internal Models for market risk capital charge
16
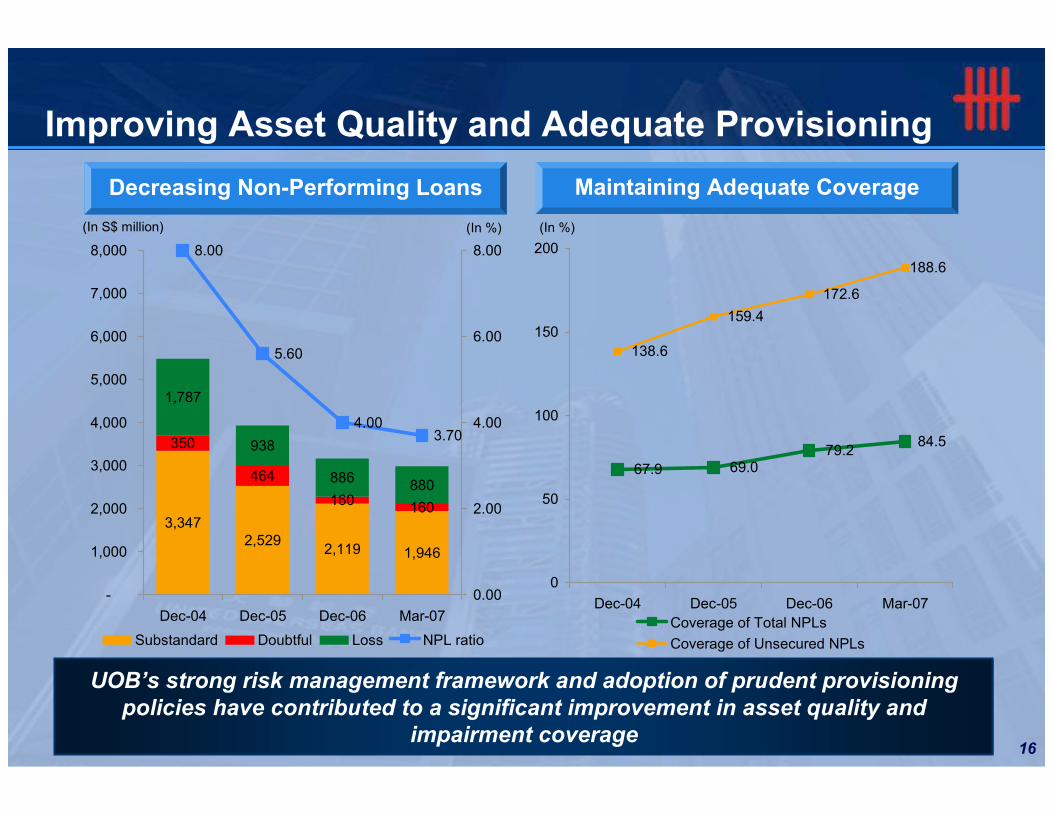
Improving Asset Quality and Adequate Provisioning
(In S$ million)
UOB’s strong risk management framework and adoption of prudent provisioning
policies have contributed to a significant improvement in asset quality and
impairment coverage
Decreasing Non-Performing Loans Maintaining Adequate Coverage
(In %)(In %)
3,3472,529
2,119 1,946
350
464
160160
1,787
938
886880
8.00
5.60
4.003.70
-
1,000
2,000
3,000
4,000
5,000
6,000
7,000
8,000
Dec-04 Dec-05 Dec-06 Mar-07
0.00
2.00
4.00
6.00
8.00
Substandard Doubtful Loss NPL ratio
67.9 69.079.2
84.5
138.6
159.4
172.6
188.6
0
50
100
150
200
Dec-04 Dec-05 Dec-06 Mar-07
Coverage of Total NPLs
Coverage of Unsecured NPLs
17
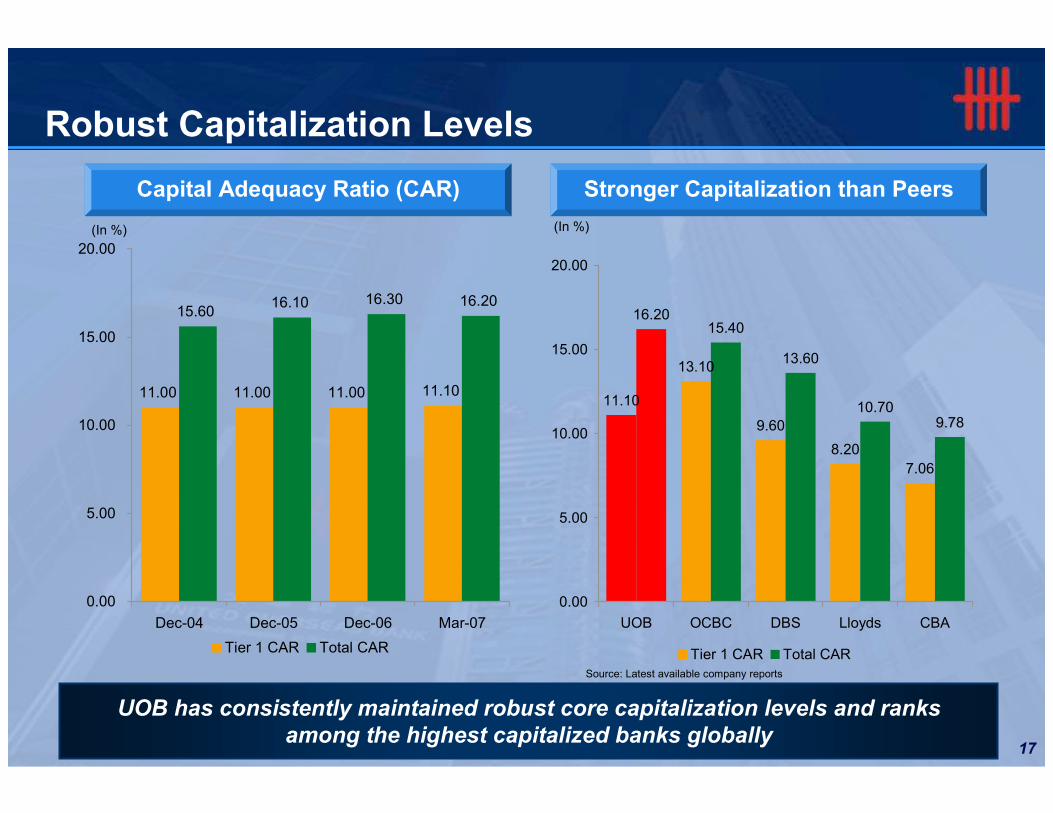
Robust Capitalization Levels
Capital Adequacy Ratio (CAR) Stronger Capitalization than Peers
(In %)
UOB has consistently maintained robust core capitalization levels and ranks
among the highest capitalized banks globally
(In %)
Source: Latest available company reports
11.00 11.00 11.00 11.10
15.6016.10 16.30 16.20
0.00
5.00
10.00
15.00
20.00
Dec-04 Dec-05 Dec-06 Mar-07
Tier 1 CAR Total CAR
11.10
13.10
9.60
8.20
7.06
16.2015.40
13.60
10.709.78
0.00
5.00
10.00
15.00
20.00
UOB OCBC DBS Lloyds CBA
Tier 1 CAR Total CAR
18
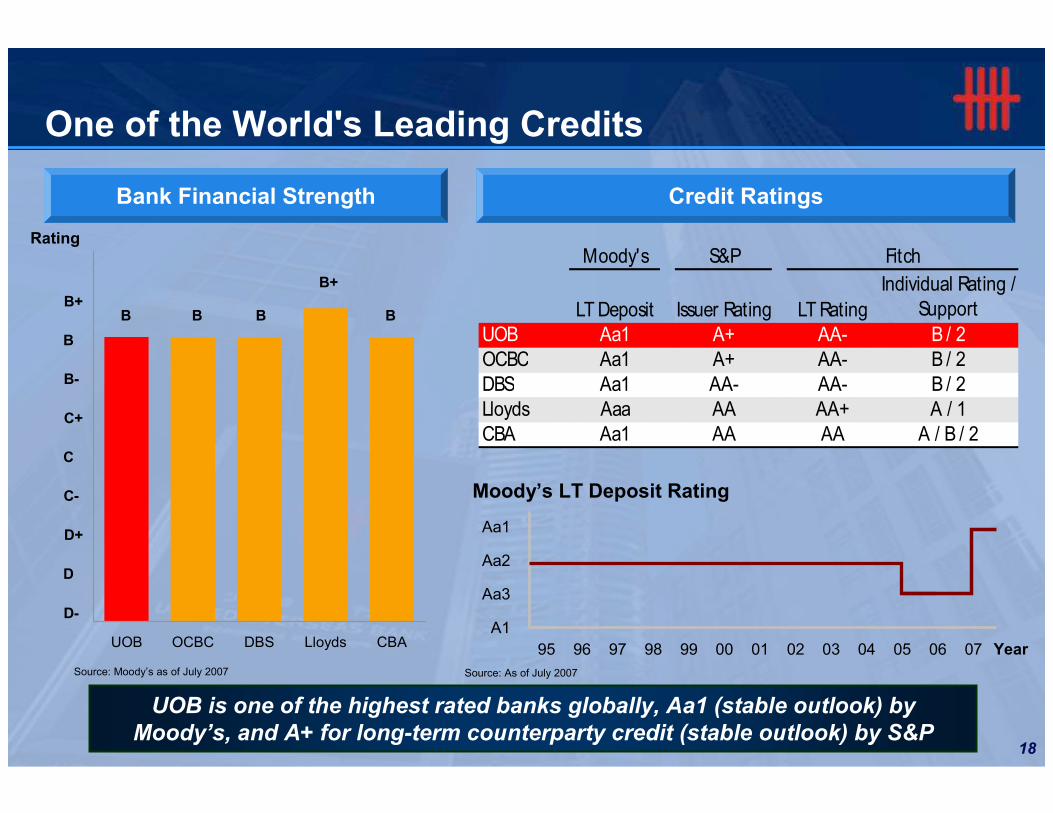
UOB OCBC DBS Lloyds CBA
One of the World's Leading Credits
Source: Moody’s as of July 2007
Bank Financial Strength Credit Ratings
B+
D-
D
D+
C-
C+
B
B-
C
Rating
UOB is one of the highest rated banks globally, Aa1 (stable outlook) by
Moody’s, and A+ for long-term counterparty credit (stable outlook) by S&P
B
B+
BBB
Source: As of July 2007
Aa1
Aa2
Aa3
A1
95 96 97 98 99 00 01 02 03 04 05 06 07 Year
Moody’s LT Deposit Rating
Moody's S&P
LT Deposit Issuer Rating LT Rating
Individual Rating / Support
UOB Aa1 A+ AA- B / 2OCBC Aa1 A+ AA- B / 2DBS Aa1 AA- AA- B / 2Lloyds Aaa AA AA+ A / 1CBA Aa1 AA AA A / B / 2
Fitch
19
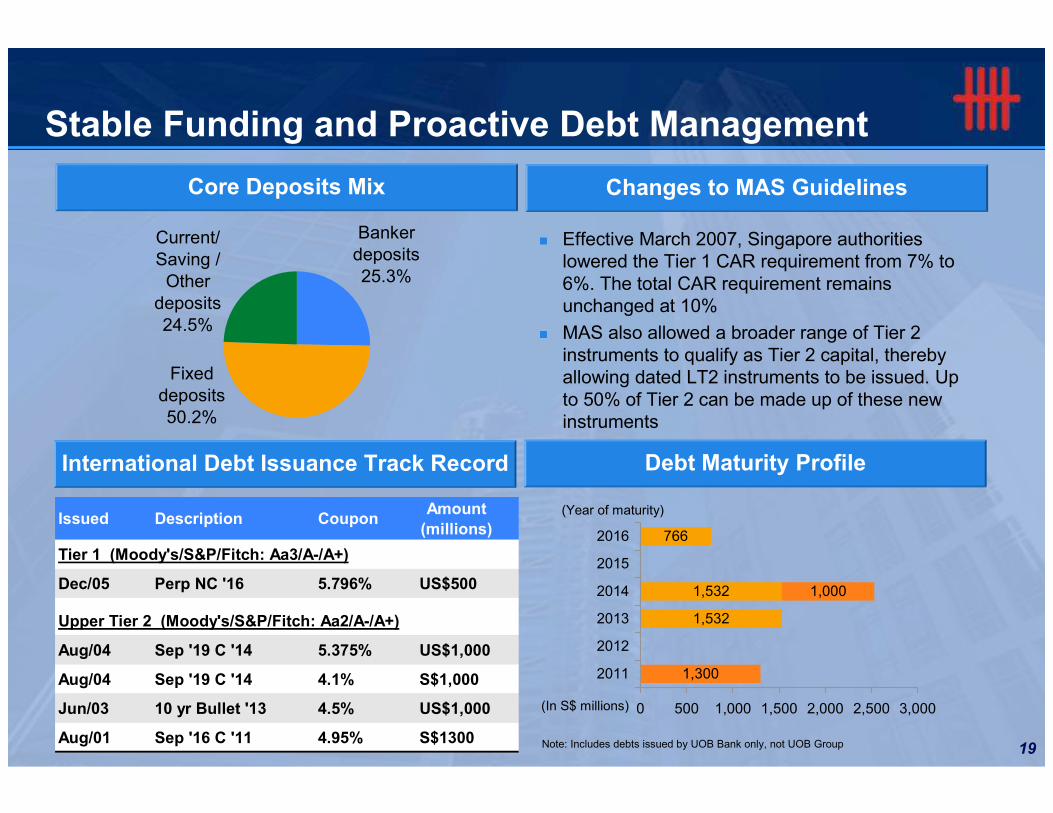
Stable Funding and Proactive Debt Management
(Year of maturity)
(In S$ millions)
International Debt Issuance Track Record Debt Maturity Profile
Note: Includes debts issued by UOB Bank only, not UOB Group
Core Deposits Mix
Banker deposits25.3%
Current/ Saving / Other
deposits24.5%
Fixed deposits50.2%
Issued Description CouponAmount
(millions)
Tier 1 (Moody's/S&P/Fitch: Aa3/A-/A+)
Dec/05 Perp NC '16 5.796% US$500
Upper Tier 2 (Moody's/S&P/Fitch: Aa2/A-/A+)
Aug/04 Sep '19 C '14 5.375% US$1,000
Aug/04 Sep '19 C '14 4.1% S$1,000
Jun/03 10 yr Bullet '13 4.5% US$1,000
Aug/01 Sep '16 C '11 4.95% S$1300
Changes to MAS Guidelines
� Effective March 2007, Singapore authorities lowered the Tier 1 CAR requirement from 7% to 6%. The total CAR requirement remains unchanged at 10%
� MAS also allowed a broader range of Tier 2 instruments to qualify as Tier 2 capital, thereby allowing dated LT2 instruments to be issued. Up to 50% of Tier 2 can be made up of these new instruments
1,300
1,532
1,532
766
1,000
0 500 1,000 1,500 2,000 2,500 3,000
2011
2012
2013
2014
2015
2016

20
Agenda
1. Introduction to UOB
2. Investment Highlights
3. Conclusion
21
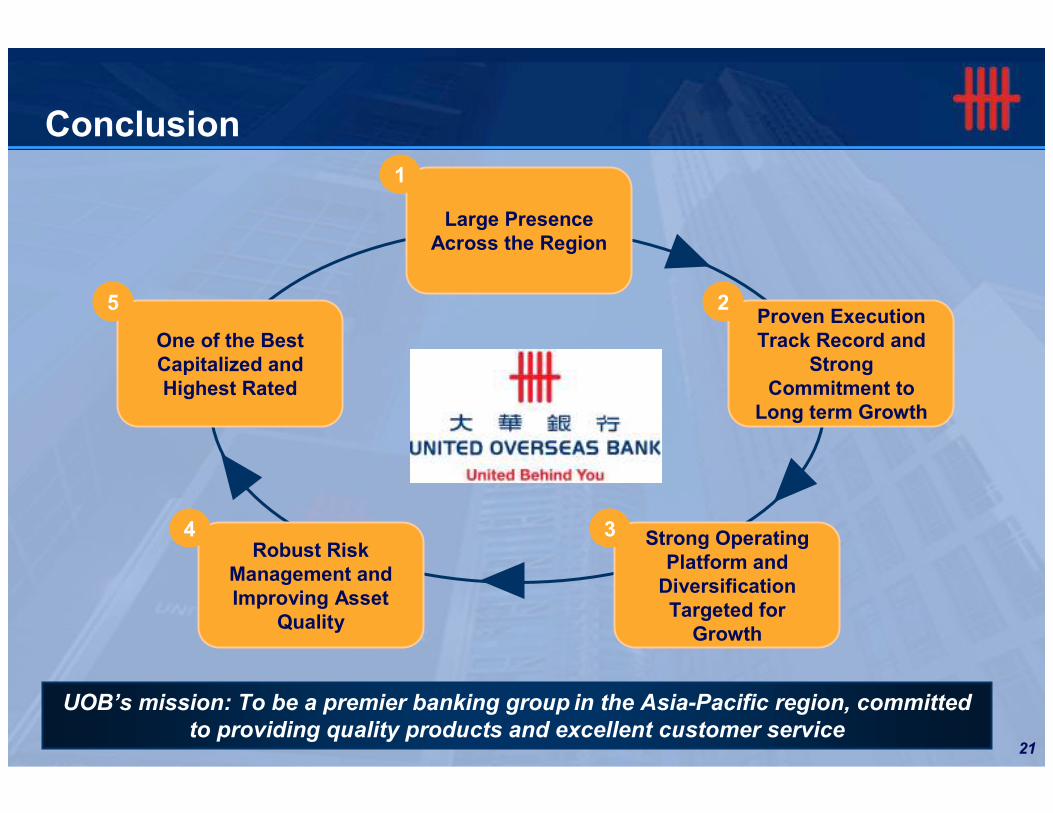
Conclusion
UOB’s mission: To be a premier banking group in the Asia-Pacific region, committed
to providing quality products and excellent customer service
One of the Best Capitalized and Highest Rated
Large Presence Across the Region
Robust Risk Management and Improving Asset
Quality
Proven Execution Track Record and
Strong Commitment to
Long term Growth
Strong Operating Platform and Diversification Targeted for Growth
1
2
34
5
22
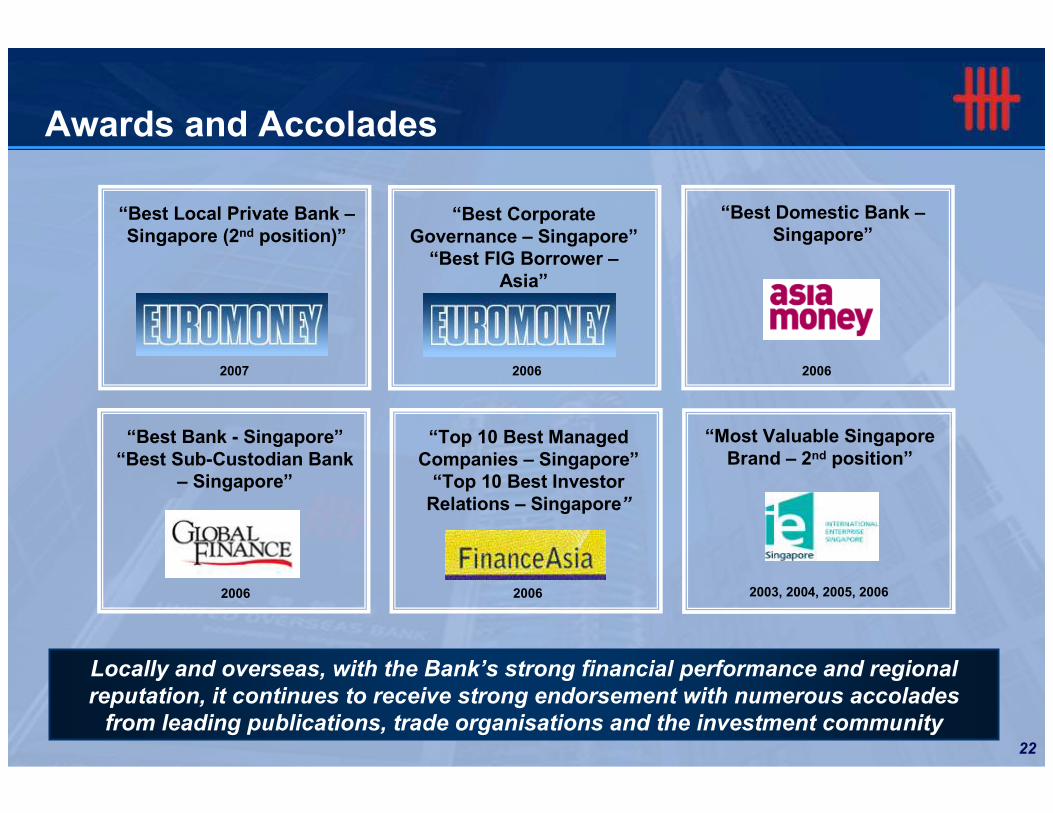
Awards and Accolades
“Best Corporate Governance – Singapore”“Best FIG Borrower –
Asia”
“Best Domestic Bank –Singapore”
2006
“Best Bank - Singapore”“Best Sub-Custodian Bank
– Singapore”
“Most Valuable Singapore Brand – 2nd position”
2003, 2004, 2005, 2006
20062007
2006
“Top 10 Best Managed Companies – Singapore”“Top 10 Best Investor Relations – Singapore”
2006
“Best Local Private Bank –Singapore (2nd position)”
Locally and overseas, with the Bank’s strong financial performance and regional
reputation, it continues to receive strong endorsement with numerous accolades
from leading publications, trade organisations and the investment community