Embed Size (px)
Citation preview

UNITED STATES AIR FORCE
WORKING CAPITAL FUND (Appropriation: 4930)
Fiscal Year (FY) 2021
Budget Estimates
February 2020

THIS PAGE INTENTIONALLY LEFT BLANK

AIR FORCE WORKING CAPITAL FUNDFISCAL YEAR (FY) 2021 BUDGET ESTIMATESTABLE OF CONTENTS
AFWCF SUMMARY..........................................................................................................................................................1OPERATING BUDGET...................................................................................................................................................13CONSOLIDATED SUSTAINMENT ACTIVITY GROUP...............................................................................................15SUPPLY MANAGEMENT ACTIVITY GROUP - RETAIL.............................................................................................41TRANSPORTATION WORKING CAPITAL FUND .....................................................................................................61
CAPITAL BUDGET........................................................................................................................................................77

THIS PAGE INTENTIONALLY LEFT BLANK
AFWCF SUMMARY
AIR FORCEWORKING CAPITAL FUND
SUMMARY
AFWCF SUMMARY
1

THIS PAGE INTENTIONALLY LEFT BLANK
AFWCF SUMMARY
2

AFWCF Overview - FY 2021 President’s Budget
Air Force Working Capital Fund Budget Overview
Fiscal Year (FY) 2021 President’s Budget (PB)
The Air Force Working Capital Fund (AFWCF) contributes to Air Force readiness through the depots’ skills to sustain the Air
Force’s organically maintained weapon systems and logistically managing the critical assets within the supply chain. As a
world class organization, the AFWCF provides rapid response to customer needs on par with private sector defense firms with
tremendous flexibility to meet surge requirements.
Activity Group Overview
The AFWCF conducts business in two primary areas: the Consolidated Sustainment Activity Group and the Supply
Management Activity Group-Retail. The Transportation Working Capital Fund (TWCF), for which the Air Force assumed
responsibility of cash oversight in FY 1998, is part of this submission. However, United States Transportation Command
(USTRANSCOM), rather than the Air Force, has management responsibility for TWCF day-to-day operations.
Air Force Core Strategic Capabilities
In support of Air Force core functions, the AFWCF activities provide maintenance services, weapon system parts, base and
medical supplies, and transportation services. The working capital funds are integral to readiness and sustainability of our air,
space, and cyber assets and our ability to deploy forces around the globe and across any theater in support of Overseas
Contingency Operations (OCO) and National Defense Strategy interests. Maintenance depots provide equipment, skills and
repair services that keep forces operating worldwide. Supply Management activities procure and manage inventories of
consumable and reparable spare parts that contribute to keeping all elements of the force structure mission ready.
USTRANSCOM is the single DoD manager for the Defense Transportation System (DTS) in peace and war. Directly or
indirectly, working capital fund activities provide warfighters the key services needed to meet global mission capability
requirements.
AFWCF SUMMARY
3

AFWCF Overview - FY 2021 President’s Budget
Consolidated Sustainment Activity Group
The mission of the Consolidated Sustainment Activity Group (CSAG) is supply management of reparable and consumable
items, as well as maintenance services. CSAG is managed under a Chief Executive Officer structure. The Air Force Material
Command (AFMC) Commander (AFMC/CC) is the Chief Executive Officer (CEO). The AFMC Director of Logistics (HQ
AFMC/A4) serves as the Chief Operating Officer (COO) and the AFMC Director of Financial Management (HQ AFMC/FM) is
the Chief Financial Officer (CFO). The Air Force Sustainment Center (AFSC), one of the six centers within AFMC, directs the
day-to-day operations of both CSAG divisions.
The activity operates with two divisions: Supply and Maintenance.
The CSAG Supply Division is responsible primarily for Air Force-managed, depot-level reparable spares and consumable
spares unique to Air Force. The CSAG Supply Division provides a wide range of logistics support services including
requirements forecasting, item introduction, cataloging, provisioning, procurement, repair, technical support, data
management, item disposal, distribution management, and transportation. The CSAG Supply Division is committed to
implementing improvements that meet customer demands and decrease cost by examining new ways of doing business and
leveraging new technologies to support war fighter needs.
The CSAG Maintenance Division repairs weapon systems and spare parts to ensure readiness in peacetime and to provide
sustainment for current Overseas Contingency Operations. The Air Force enhances readiness by efficiently and economically
repairing, overhauling and modifying aircraft, engines, missiles, components, and software to meet customer demands. The
CSAG Maintenance Division’s depots have unique skills and equipment required to support and overhaul both new, complex
components and aging weapon systems. In support of Contingency Operations, the depots can surge repairs and realign
capacity to support the war fighter’s immediate needs.
AFWCF SUMMARY
4

AFWCF Overview - FY 2021 President’s Budget
Supply Management Activity Group–Retail
The Supply Management Activity Group-Retail (SMAG-R) manages over 2.0 million inventory items including weapon system
spare parts, medical-dental supplies and equipment, and other supply items used in non-weapon system applications. The
Air Force SMAG-R is a critical component in the support of combat readiness by procuring materiel and selling spares to
authorized retail customers. The activity operates with three divisions: General Support, Medical Dental, and the Air Force
Academy. The Medical Dental Division inventory includes a War Reserve Materiel (WRM) Stockpile. WRM provides initial
war fighting capability until re-supply lines can sustain wartime demands for medical and dental supplies and equipment.
The SMAG-R provides a wide range of logistics support services including requirements forecasting, item introduction,
cataloging, provisioning, procurement, repair, technical support, data management, item disposal, distribution management,
and transportation. Inventories are an integral part of SMAG-R and are maintained by each of the divisions in support of
customer requirements. The SMAG-R objective is to replenish inventories and provide supplies to customers in a timely
manner within customer funding constraints, while maintaining fund solvency.
Transportation Working Capital Funds
USTRANSCOM’s mission includes providing air, land, and sea transportation for the DoD with a primary focus on wartime
readiness. USTRANSCOM’s $8.8 billion budget provides synchronized transportation and sustainment, making it possible to
project and maintain national power where needed, with the greatest speed and agility, the highest efficiency, and the most
reliable level of trust and accuracy. USTRANSCOM accomplishes the joint transportation mission through three Transportation
Component Commands - Air Mobility Command (AMC), Military Sealift Command (MSC), and Military Surface Deployment
and Distribution Command (SDDC). This joint team of transportation components provides mobility forces and assets for a
seamless transition from peace to war. USTRANSCOM is always ready to meet the strategic mobility needs of our nation. A
brief description of the role of each Transportation Component Command follows:
Air Mobility Command is the single manager for air mobility by providing airlift, air refueling, special air mission, and
aeromedical evacuation for U.S. forces. AMC also supplies forces to theater commands to support wartime tasking.
AFWCF SUMMARY
5
AFWCF Overview - FY 2021 President’s Budget
Military Sealift Command supports our nation by providing marine transportation to satisfy DoD sealift requirements, including,
delivering supplies and conducting specialized missions across the world’s oceans.
Surface Deployment and Distribution Command provides global surface deployment and distribution services to meet the
nation’s objectives.
USTRANSCOM’s Component Commands provide the critical link to the Services’ core competencies in organizing, training,
and equipping forces. They provide lines of communication to the Services, ensuring assets are available when needed for
the transition from peace to war. The surge from peacetime sustainment to a massive deployment of people and material in
support of OCO is an example of USTRANSCOM’s ability to execute their mission. USTRANSCOM’s successes result from
the synergy of military and commercial lift (air, land, and sea), air refueling, port operations, and afloat prepositioning - all
requiring the team efforts of the Commander’s Staff and components. Together with its components and national partners,
USTRANSCOM is building a truly seamless, end-to-end defense transportation enterprise.
Air Force Initiatives
Art of the Possible (AoP) is the fundamental basis of how the entire Air Force Sustainment Center (AFSC) operates. It is both
a philosophy and a methodology that enables AFSC to achieve significant results while being good stewards of taxpayer
dollars. It is also the “playbook” that allows AFSC to operate as one team across each of the 26 operating locations. AFSC
directly benefit our customers and our suppliers with a consistent voice and use one set of operating principles. AoP enables
AFSC to have a better understanding of processes and identify the constraints that prevents them from operating better, faster,
and cheaper. AFSC focuses on resources and energy to eliminate, or reduce them. This is what makes AFSC a world-class
organization.
Additionally, the Air Force is working to achieve Department of Defense Financial Improvement and Audit Readiness (FIAR)
goals relative to the AFWCF. To effectively comply with FIAR, the Air Force must have comprehensive, accurate, reliable,
timely, and auditable financial data to provide dynamic decision support that improves warfighter readiness. Legacy AFWCF
financial systems are unable to provide robust financial data, which increases systemic risk through deficiencies in internal
AFWCF SUMMARY
6
AFWCF Overview - FY 2021 President’s Budget
control over financial reporting, non-standard/manual processes, and antiquated information technology. Currently the
AFWCF is working towards a CSAG-M financial system to meet FIAR compliance. A CSAG-S system solution is in the early
stages of defining the capabilities and requirements needed. The long term goal is a financial system(s)/processes to provide
seamless financial information and successful financial management across the AFWCF Enterprise.
Direct Appropriations
In FY 2019, AFWCF received $77.6 million in direct appropriation for Medical Dental WRM requirements. In FY 2020 Congress
approved $92.5 million in direct appropriation for Medical Dental WRM. In FY 2021 Air Force requests a total of $95.7 million
in direct appropriations in support of Medical Dental WRM and emerging Expeditionary Medical Support requirements.
AFWCF SUMMARY
7

AFWCF Financial Summary
(Dollars in Millions) FY 2019 FY 2020 FY 2021
Total Revenue Total Revenue 23,735.9 25,585.5 27,310.5
Cost of Goods Sold Cost of Goods Sold 25,159.4 25,764.0 26,432.5
Net Operating Result Adjustments WRM (70.7) (44.0) (46.3)
Net Operating Result (NOR) Net Operating Result (NOR) (1,494.3) (222.5) 831.6
Accumulated Operating Result (AOR) Accumulated Operating Result (AOR)1(423.1) (645.6) 186.0
Civilian End Strength Civilian End Strength 32,515 32,635 33,003
Military End Strength Military End Strength 12,544 12,527 12,624
Civilian Workyears Civilian Workyears 33,158 31,023 32,786
Military Workyears Military Workyears 12,693 12,262 12,373
Capital Budget Capital Budget 259.5 205.3 255.2
Direct Appropriation Direct Appropriation 77.6 92.5 95.7
3) Includes WRM
1) Includes Non-recoverable AOR adjustments
2) Positive AOR in FY 2021 associated with USTRANSCOM postponing zero AOR to FY 2023 to preserve cash
AFWCF Overview - FY 2021 Budget Estimates
AFWCF SUMMARY
8
AFWCF Overview - FY 2021 President’s Budget
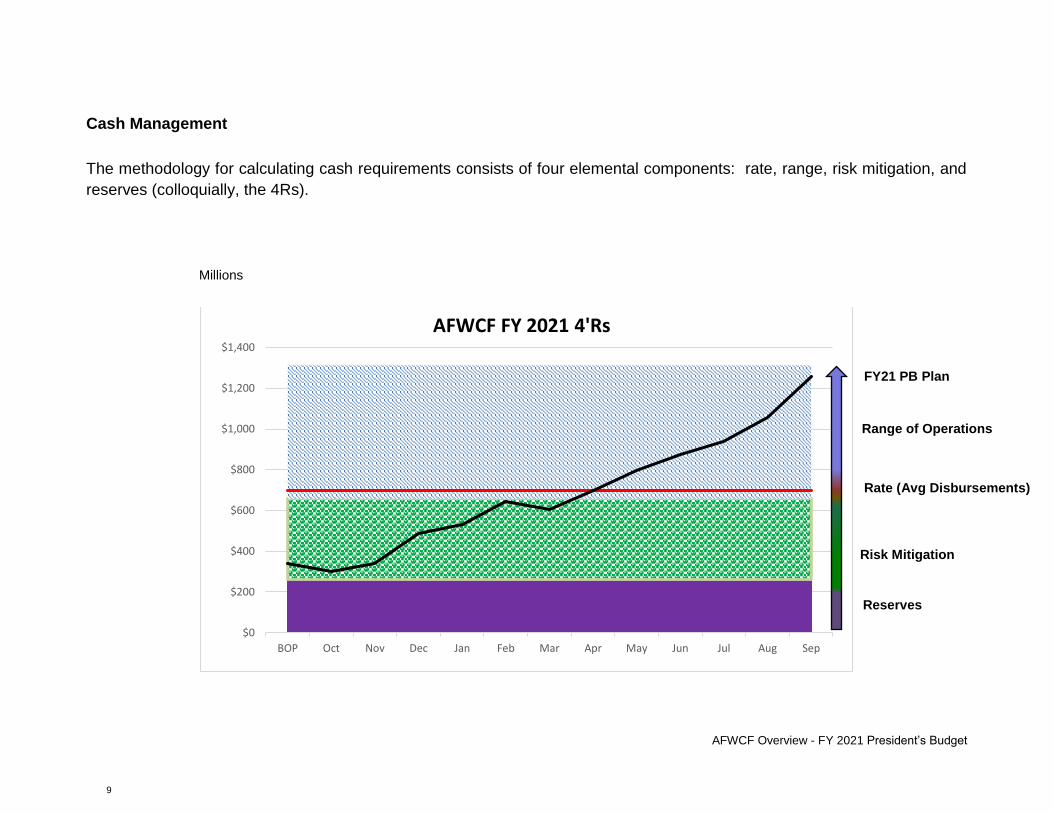
Cash Management
The methodology for calculating cash requirements consists of four elemental components: rate, range, risk mitigation, and
reserves (colloquially, the 4Rs).
$0
$200
$400
$600
$800
$1,000
$1,200
$1,400
BOP Oct Nov Dec Jan Feb Mar Apr May Jun Jul Aug Sep
AFWCF FY 2021 4'Rs
Range of Operations
Rate (Avg Disbursements)
Risk Mitigation
Reserves
FY21 PB Plan
Millions
AFWCF SUMMARY
9

AFWCF Overview - FY 2021 President’s Budget
The Rate of Disbursements for the AFWCF FY 2021 PB is based on projected annual disbursements divided by the total
number of weighted annual disbursements, yielding the average amount disbursed between collection cycles. The Range of
Operation is the difference between the highest and lowest expected cash level based on budget assumptions and past
experience. The AFWCF Range of Operations is based on 4 years of historical disbursements (FY 2016 – FY 2019). For
example, in FY 2021 the projected Rate of Disbursement is $696.8 million and the lower Range is $657.5 million and the upper
Range is $1,313.8 million the difference between the two amount results in $656.3 million, as the basic operating range.
Cash Reserves are funds held for known future cash outlay requirements. This element identifies cash on hand that must be
kept for specific requirements that are not expected to disburse until subsequent fiscal years. For AFWCF, the first Reserve
category is Accumulated Operating Results (gains) that are returned to customers through annual reduced rates in future fiscal
years. Increased FY 2021 Reserves by $150 million to mitigate low cash BOP FY 2021. The second Reserve supports
unliquidated obligations of the Medical Dental Division’s Direct Appropriation for War Readiness Material. The FY 2020
Unliquidated Appropriation for Medical-Dental War Reserve Material Program is $50.1 million and for FY 2021 is $62.0 million.
AFWCF Risk Mitigation addresses cash variability associated with unknown external variables and seasonal volatility (see
Cash Volatility graph above). To accommodate for seasonal volatility we calculated one standard deviation from the mean of
monthly cash ranges over four years (FY 2016 – FY2019). The standard deviation for this data is $131.8 million. For FY 2021
Risk Mitigation, we applied three standard deviations from the mean, $395.4 million, to minimize the risk associated with
volatility and as indicated in graph on the previous page.
AF Blue & TWCF Cash Plans AFWCF Blue Cash (without Transportation Working Capital Fund) began FY 2020 at $479.6 million which included a
congressionally approved reprogramming of $233.8 million. This balance is well below our lower operating limit of $657.5
million. The primary drivers for this loss of cash include reduced revenue due to the Air Force flying hour program executing
below plan, reduced revenue driven by delayed/deferred Air Force depot maintenance orders, and production/parts issues in
depot maintenance. FY 2020 and FY 2021 projections include cost austerity measures and conservative revenue estimates
to minimize the risk to AFWCF cash. Continued focus on cost-conscious spending and revenue generation will be required
throughout FY 2020 for the account to remain solvent.
AFWCF SUMMARY
10

AFWCF Overview - FY 2021 President’s Budget
AF Blue ($ Millions) FY 2019 FY2020 FY 2021
BOP Cash Balance $1,446.0 $479.6 $341.0
Disbursements 1 $17,273.5 $17,101.9 $18,117.5
Collections 1 $15,995.6 $16,870.8 $18,937.4
Transfers In/Out $0.0 $0.0 $0.0
WRM $77.6 $92.5 $95.7
EOP Cash Balance $479.6 $341.0 $1,030.8
Lower Limit Cash Goal $631.3 $507.2 $657.5
Upper Limit Cash Goal $1,270.0 $1,163.5 $1,313.8 1Does not include Transfers In/Out 2Numbers may not add due to rounding In FY 2019, AF Blue cash decreased from $1,446.0 million to $479.6 million, this included a congressionally approved $233.8
million reprogramming. The lower and upper limits for this period were $631.3 million and $1,270.1 million, respectively. The
cash decreases primarily due to revenue not generating as planned from Air Force flying hour customers and depot
maintenance production.
In FY 2020, AF Blue cash decreases $138.6 million throughout the fiscal year, projecting to end with a $341.0 million balance.
The operating range for this period is $507.2 million to $1,163.5 million. The cash decreases primarily due to continued losses
in the supply activities. AF Blue will not be within the operating range the entire fiscal year.
In FY 2021, AF Blue cash increases from $341.0 million to $1,313.8 million. The operating range is $657.5 million to $1,313.8
million. The cash recovery is achieved by increasing prices charged to customers for the three largest activities (CSAG-M,
CSAG-S, and SMAG-R).
AFWCF SUMMARY
11

AFWCF Overview - FY 2021 President’s Budget
TWCF Cash
($ Millions) FY 2019 FY2020 FY 2021
BOP Cash Balance $526.6 $469.0 $603.6
Disbursements $7,782.0 $8,720.1 $8,393.9
Collections $7,724.4 $8,854.7 $8,369.5
Net Transfers $0.0 $0.0 $0.0
Direct Appropriations $0.0 $0.0 $0.0
EOP Cash Balance $469.0 $603.6 $579.2
Lower Limit Cash Goal $538.0 $618.4 $582.3
Upper Limit Cash Goal $1,030.0 $1,289.2 $1,228.0
In FY 2019, TWCF cash ended with $469.0 million due to higher fuel rates, a decrease of $57.6 million. USTRANSCOM cash balance was not within the Operating Range primarily due to non-collection bills from customers.
In FY 2020, TWCF cash is projected to increase $134.6 million from the end of year FY 2019 to $603.6 million. The expected operating range is $618.4 million to $1,289.2 billion. In FY 2021, TWCF cash is projected to decrease $24.4 million from the end of year FY 2020 to $579.2 million. The expected operating range is $582.3 million to $1,228.0 billion.
AFWCF SUMMARY
12

AIR FORCEWORKING CAPITAL FUND
OPERATING BUDGET
OPERATING BUDGET
13

THIS PAGE INTENTIONALLY LEFT BLANK
OPERATING BUDGET
14

AIR FORCE
WORKING CAPITAL FUND
CONSOLIDATED SUSTAINMENT
ACTIVITY GROUP
CONSOLIDATED SUSTAINMENT ACTIVITY GROUP
15
THIS PAGE INTENTIONALLY LEFT BLANK
CONSOLIDATED SUSTAINMENT ACTIVITY GROUP
16
CSAG Overview – FY 2021 Budget Estimates Submission
Consolidated Sustainment Activity Group Budget Overview
Fiscal Year (FY) 2021 President’s Budget (PB)
The mission of the Consolidated Sustainment Activity Group (CSAG) is supply management of reparable and consumable
items, and maintenance services. Reparable supply items are economically maintained through overhaul or repair.
Consumable supply items are consumed in use or discarded when worn out or broken because they cannot be repaired
economically. CSAG Maintenance Division and Supply Division services are executed under the Air Force Sustainment
Center (AFSC) within the Air Force Material Command (AFMC) structure described in the AFWCF Overview. With supply
chain management and depot maintenance functions in one center, AFSC analyzes and develops sustainment-wide
procedures, processes, and metrics with the ultimate goal of increasing availability, capability, and affordability. This
construct supports one of the Air Force’s distinctive capabilities, Agile Combat Support, providing greater ability to posture
for additional workload. It also preserves the viability of depot maintenance and the supply chain capabilities.
Maintenance Division
The CSAG Maintenance Division repairs weapon systems and spare parts to ensure readiness in peacetime and to provide
sustainment for current Overseas Contingency Operations (OCO). In peacetime, the Air Force enhances readiness by
efficiently and economically repairing, overhauling and modifying weapons systems and their components to meet customer
demands. The Maintenance Division’s depots have unique skills and equipment required to support and overhaul both
new, complex components and aging weapon systems. During Contingency Operations, the Air Force depots can surge
repairs and realign capacity to support the war fighter’s immediate needs.
The CSAG Maintenance Division ensures support of mission essential workloads and support of workloads that commercial
sources cannot or will not perform. The division’s services include repair, overhaul, and modification of aircraft, missiles,
engines, engine modules and associated component items, exchangeable spare parts, and other major end-items. Other
services include local manufacture, software maintenance, aircraft storage and reclamation, and support to base tenants.
CONSOLIDATED SUSTAINMENT ACTIVITY GROUP
17

CSAG Overview – FY 2021 Budget Estimates Submission
Organic maintenance sites include:
Ogden Air Logistics Complex (OO-ALC), Ogden, Utah
Oklahoma City Air Logistics Complex (OC-ALC), Oklahoma City, Oklahoma
Warner Robins Air Logistics Complex (WR-ALC), Warner Robins, Georgia
Supply Division
The CSAG Supply Division is responsible primarily for Air Force-managed, depot-level reparable spares and consumable
spares unique to the Air Force. Reparable supply items are economically maintained through overhaul or repair.
Consumable supply items are consumed in use or discarded when worn out or broken because they cannot be repaired
economically. In addition to management of these inventories, the CSAG Supply Division provides a wide range of logistics
support services including requirements forecasting, item introduction, cataloging, provisioning, procurement, repair,
technical support, data management, item disposal, distribution management, and transportation.
The CSAG Supply Division works to reduce the impact of Diminishing Manufacturing Sources and Material Shortages
(DMSMS) and other obsolescence issues associated with aging aircraft fleets. Due to fleet age and antiquated technology
they utilize, the number of parts without qualified manufacturing or repair source is expected to continue to be an issue. To
address these DMSMS and other obsolescence issues, the CSAG Supply Division re-engineers parts which can no longer
be produced or repaired. The CSAG Supply Division also proactively identifies parts for which availability is at risk due to
DMSMS issues, taking appropriate action to minimize adverse impact to weapon system readiness.
CSAG Customer Base
Maintenance and Supply customers include Air Force Major Commands, Air National Guard, Air Force Reserve Command,
the Army, the Navy, other WCF activities (i.e., Transportation Working Capital Fund), other government agencies, public-
private partnerships, and foreign countries. The CSAG divisions also are customers of each other; Maintenance Division
repairs parts for Supply Division while the Supply Division provides parts that the Maintenance Division uses in depot
maintenance services. Continued focus on readiness drives customer orders to both CSAG-Maintenance and CSAG-
Supply. More details are located within each division's narrative.
CONSOLIDATED SUSTAINMENT ACTIVITY GROUP
18

CSAG Overview – FY 2021 Budget Estimates Submission
CSAG Initiatives
Initiatives are ongoing to modernize processes. AFSC continues to evaluate supply chain processes to improve weapon
system and equipment availability and to deliver customer support with increased velocity. Sustained emphasis is on cost
control in order to provide the best value to the customer. Efforts continue to identify and resolve pricing and billing
discrepancies, thus improving asset visibility to reduce requisition redundancies and expediting asset movement via the
distribution pipeline.
The Air Force aggressively initiated actions to achieve 80% mission capability rates in FY 2019 for critical aviation
platforms. CSAG-Supply is an integral enabler to achieve this aggressive goal for the F-16. Consistent with SecDef goals,
CSAG-Supply drove more parts to warehouse shelves at fielded units and increased parts inventories to fill mission
impacting backorders. CSAG-Supply achieved this goal by spending an estimated $100 million in FY 2019, $170 million
less than originally estimated.
AFSC continues to more precisely define material requirements; “Accurate Supply Requirements” is a key component of
cost-effective readiness. Fundamentally, variability in spares requirements can cause both under- and over-planning of
resources, both of which eventually result in increased costs. Over-planning will result in unused capacity with higher than
necessary fixed costs. Under-planning results in the need for expensive workarounds to ensure readiness goals are
achieved. More accurate forecasts ensure that limited manpower, equipment and consumable resources are more
efficiently allocated in advance of execution, and therefore are more effectively utilized during execution year.
AFSC is also pursuing cost initiatives within the Maintenance Division to reduce cost, improve performance, and increase
availability of weapon systems. AFSC’s efforts contribute to Air Force readiness and sustainability by providing a cost-
effective, rapid repair capability. CSAG Maintenance Division seeks to provide continuous core Air Force depot capability
to retain in-house sources of technical competence; to continue to refine methods which enable the more efficient use of
resources such as partnering with private industry, employing government owned/contractor operated facilities and
augmenting in-house operations; and to find innovative ways to decrease flow days for systems and components, increase
parts availability to the repair line, and control material costs through process reviews and adoption of commercial practices
and engineering standards.
CONSOLIDATED SUSTAINMENT ACTIVITY GROUP
19

CSAG Overview – FY 2021 Budget Estimates Submission
CSAG Financial and Performance Summary
Financial Performance ($ Millions) FY 2019 FY 2020 FY 2021
Total Revenue $11,857.9 $12,498.6 $13,672.3
Total Expenses (with Work In Progress) $12,943.8 $12,616.3 $12,895.2
Other Adjustments Affecting NOR and Other Changes1 $31.3 $27.2 $27.2
Net Operating Results ($1,056.6) ($91.7) $804.4
Non Recoverable Adjustments Impacting AOR $0.0 $0.0 $0.0
Accumulated Operating Results ($712.6) ($804.4) $0.0 1In FY 2019, the $31.3 million Other Adjustments Affecting NOR and Other Changes is the result of CSAG Maintenance non-recoverable facility
depreciation of $31.3. CSAG Maintenance projects $27.2 million and $27.2 million non-recoverable depreciation in FY 2020 and FY 2021, respectively.
Overall, CSAG projects a $0.0 AOR for FY 2021.
Cash ($ Millions) FY 2019 FY 2020 FY 2021
BOP Cash Balance $1,219.5 $330.5 $267.6
Disbursements 2 $12,804.6 $12,538.2 $13,215.2
Collections $11,778.7 $12,475.3 $13,907.5
Transfers In/Out $136.9 $0.0 $0.0
EOP Cash Balance $330.5 $267.6 $959.9
Lower Range $448.2 $295.4 $483.4
Upper Range $921.9 $776.6 $962.1 2Does not include Transfers In/Out
Stabilized Sales Rates and Prices FY 2019 FY 2020 FY 2021
Maintenance Composite Sales Rate per hour $291.41 $302.28 $323.79
Maintenance Rate Change1 2.9% 3.7% 7.1%
Supply Unit Cost Ratio 1.289 0.971 0.941
CONSOLIDATED SUSTAINMENT ACTIVITY GROUP
20
CSAG Overview – FY 2021 Budget Estimates Submission
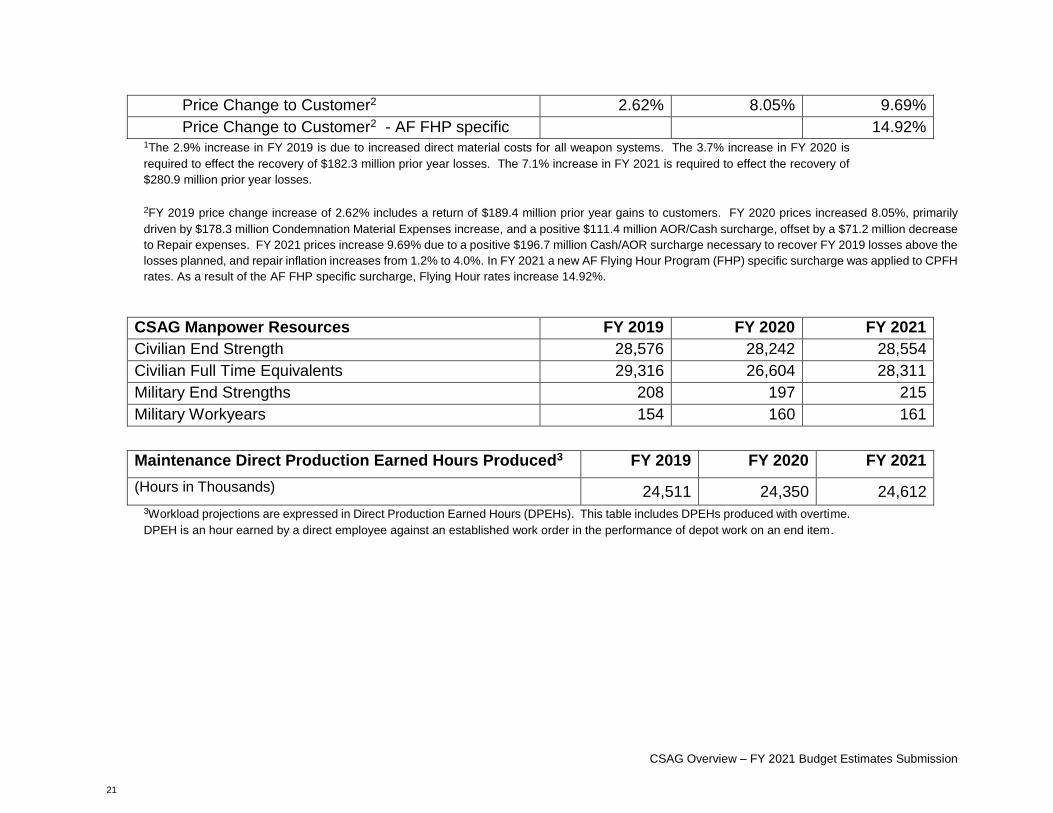
Price Change to Customer2 2.62% 8.05% 9.69%
Price Change to Customer2 - AF FHP specific 14.92% 1The 2.9% increase in FY 2019 is due to increased direct material costs for all weapon systems. The 3.7% increase in FY 2020 is
required to effect the recovery of $182.3 million prior year losses. The 7.1% increase in FY 2021 is required to effect the recovery of
$280.9 million prior year losses.
2FY 2019 price change increase of 2.62% includes a return of $189.4 million prior year gains to customers. FY 2020 prices increased 8.05%, primarily
driven by $178.3 million Condemnation Material Expenses increase, and a positive $111.4 million AOR/Cash surcharge, offset by a $71.2 million decrease
to Repair expenses. FY 2021 prices increase 9.69% due to a positive $196.7 million Cash/AOR surcharge necessary to recover FY 2019 losses above the
losses planned, and repair inflation increases from 1.2% to 4.0%. In FY 2021 a new AF Flying Hour Program (FHP) specific surcharge was applied to CPFH
rates. As a result of the AF FHP specific surcharge, Flying Hour rates increase 14.92%.
CSAG Manpower Resources FY 2019 FY 2020 FY 2021
Civilian End Strength 28,576 28,242 28,554
Civilian Full Time Equivalents 29,316 26,604 28,311
Military End Strengths 208 197 215
Military Workyears 154 160 161
Maintenance Direct Production Earned Hours Produced3 FY 2019 FY 2020 FY 2021
(Hours in Thousands) 24,511 24,350 24,612 3Workload projections are expressed in Direct Production Earned Hours (DPEHs). This table includes DPEHs produced with overtime.
DPEH is an hour earned by a direct employee against an established work order in the performance of depot work on an end item.
CONSOLIDATED SUSTAINMENT ACTIVITY GROUP
21

CSAG Overview – FY 2021 Budget Estimates Submission
Maintenance Due Date Performance and Quality Defect Rate
Goal FY 2019 FY 2020 FY 2021
Due Date Performance1 95% 91% 95% 95%
Quality Defect Rate2 0.22 0.28 0.22 0.22 1The Due Date Performance (DDP) metric measures percentage of aircraft returned to customers on or before the agreed delivery
date. The FY 2019 actual DDP of 91% reflects a variety of rates at the Air Logistics Complexes. Hiring delays and parts supportability issues contributed to DDP impacts across the weapon systems identified below:
a. Tinker AFB, OK: E-3 - 67%, KC-135 - 100%, B-1 - 100%, B-52 - 100%
b. Hill AFB, UT: A-10 - 76%, T-38 - 76%, F-22 - 83%, F-35 - 97%
c. Robins AFB, GA: C-130 - 33%, C-5 - 50%, F-15 – 67%, C-17 - 84%
2The Quality Defect Rate measures the number of quality defects identified by the customer after the end-item is returned to the
customer, expressed in defects per aircraft.
Maintenance 6% Capital Investment Plan ($ Millions) FY 2019 FY 2020 FY 2021
Required Investment $397.4 $404.1 $417.3
Total Investment Budgeted $493.6 $568.9 $637.2
Percent Invested 10.1%
8.4% 9.2%
%
Capital Investment Program Authority ($ Millions) FY 2019 FY 2020 FY 2021
Equipment – Weapon System Support/Test $160.5 $128.6 $150.4
ADPE & Telecom $10.8 $8.2 $0.8
Software Development $1.7 $15.4 $24.4
Minor Construction $0.9 $2.9 $11.2
Total $173.9 $155.1 $186.8
CONSOLIDATED SUSTAINMENT ACTIVITY GROUP
22
CSAG Overview – FY 2021 Budget Estimates Submission
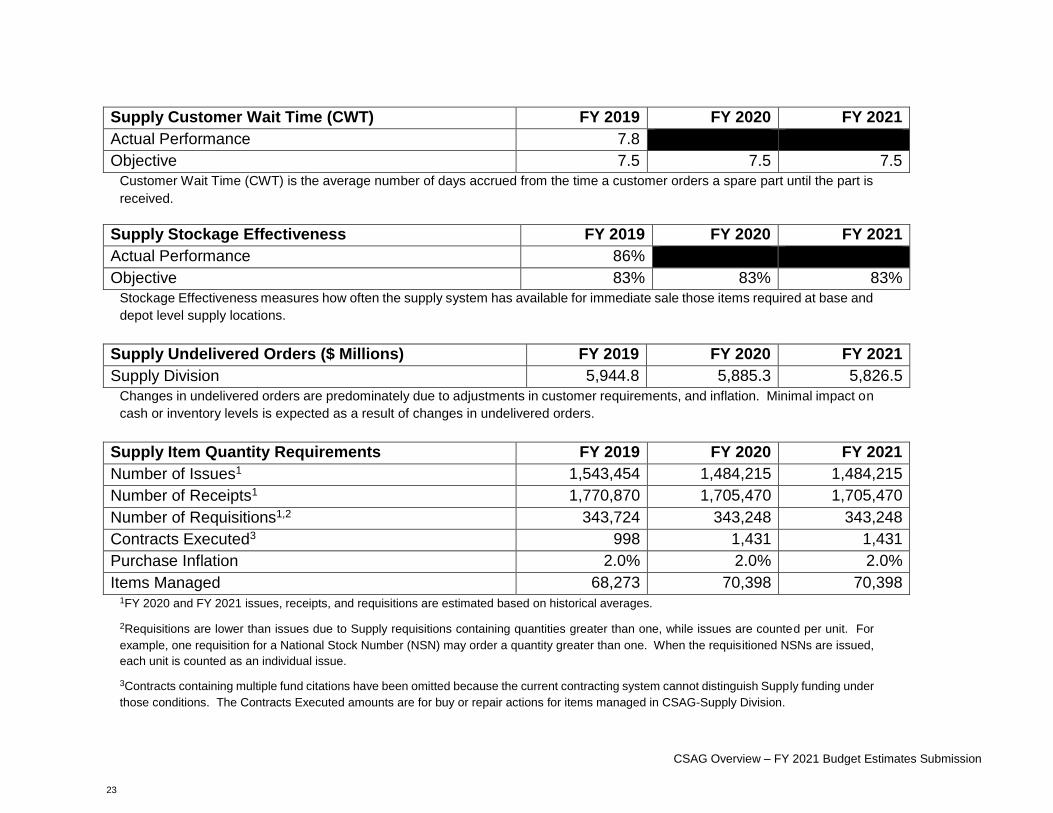
Supply Customer Wait Time (CWT) FY 2019 FY 2020 FY 2021
Actual Performance 7.8
Objective 7.5 7.5 7.5
Customer Wait Time (CWT) is the average number of days accrued from the time a customer orders a spare part until the part is
received.
Supply Stockage Effectiveness FY 2019 FY 2020 FY 2021
Actual Performance 86%
Objective 83% 83% 83%
Stockage Effectiveness measures how often the supply system has available for immediate sale those items required at base and
depot level supply locations.
Supply Undelivered Orders ($ Millions) FY 2019 FY 2020 FY 2021
Supply Division 5,944.8 5,885.3 5,826.5
Changes in undelivered orders are predominately due to adjustments in customer requirements, and inflation. Minimal impact on
cash or inventory levels is expected as a result of changes in undelivered orders.
Supply Item Quantity Requirements FY 2019 FY 2020 FY 2021
Number of Issues1 1,543,454 1,484,215 1,484,215
Number of Receipts1 1,770,870 1,705,470 1,705,470
Number of Requisitions1,2 343,724 343,248 343,248
Contracts Executed3 998 1,431 1,431
Purchase Inflation 2.0% 2.0% 2.0%
Items Managed 68,273 70,398 70,398 1FY 2020 and FY 2021 issues, receipts, and requisitions are estimated based on historical averages.
2Requisitions are lower than issues due to Supply requisitions containing quantities greater than one, while issues are counted per unit. For
example, one requisition for a National Stock Number (NSN) may order a quantity greater than one. When the requisitioned NSNs are issued,
each unit is counted as an individual issue.
3Contracts containing multiple fund citations have been omitted because the current contracting system cannot distinguish Supply funding under
those conditions. The Contracts Executed amounts are for buy or repair actions for items managed in CSAG-Supply Division.
CONSOLIDATED SUSTAINMENT ACTIVITY GROUP
23
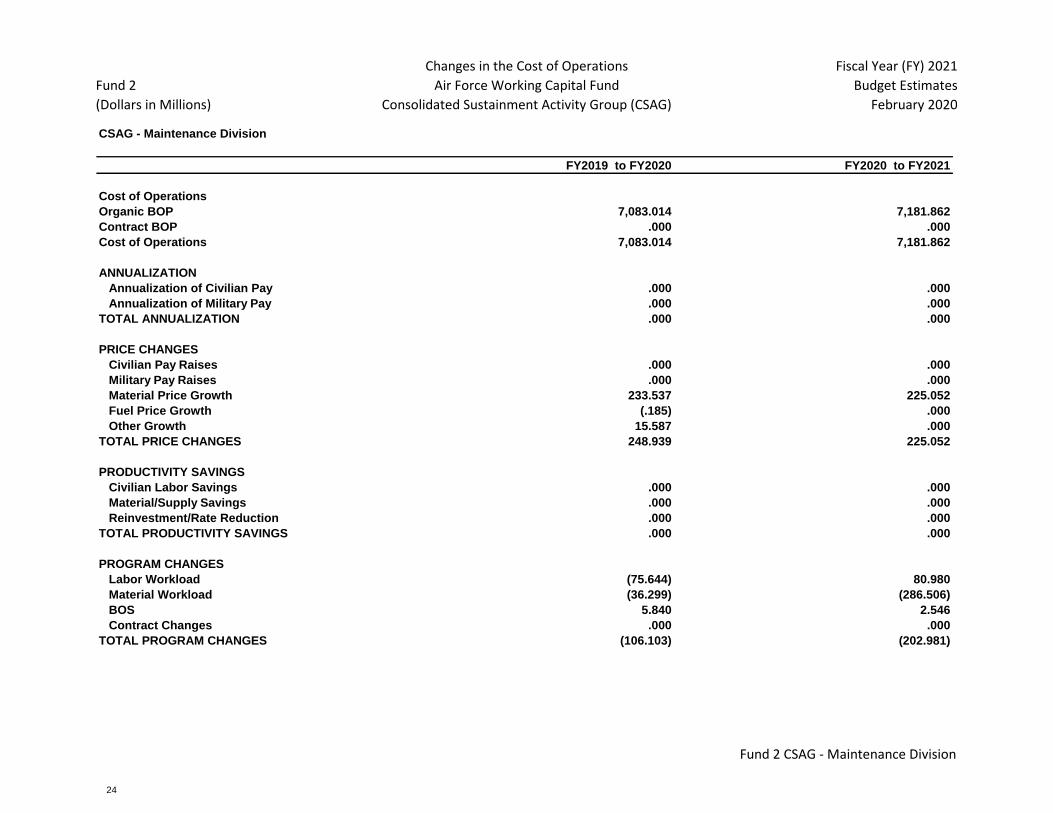
Fund 2
(Dollars in Millions)
Changes in the Cost of Operations
Air Force Working Capital Fund
Consolidated Sustainment Activity Group (CSAG)
Fiscal Year (FY) 2021
Budget Estimates
February 2020
CSAG - Maintenance Division
FY2019 to FY2020 FY2020 to FY2021
Cost of Operations
Organic BOP 7,083.014 7,181.862
Contract BOP .000 .000
Cost of Operations 7,083.014 7,181.862
ANNUALIZATION
Annualization of Civilian Pay .000 .000
Annualization of Military Pay .000 .000
TOTAL ANNUALIZATION .000 .000
PRICE CHANGES
Civilian Pay Raises .000 .000
Military Pay Raises .000 .000
Material Price Growth 233.537 225.052
Fuel Price Growth (.185) .000
Other Growth 15.587 .000
TOTAL PRICE CHANGES 248.939 225.052
PRODUCTIVITY SAVINGS
Civilian Labor Savings .000 .000
Material/Supply Savings .000 .000
Reinvestment/Rate Reduction .000 .000
TOTAL PRODUCTIVITY SAVINGS .000 .000
PROGRAM CHANGES
Labor Workload (75.644) 80.980
Material Workload (36.299) (286.506)
BOS 5.840 2.546
Contract Changes .000 .000
TOTAL PROGRAM CHANGES (106.103) (202.981)
Fund 2 CSAG - Maintenance Division
CONSOLIDATED SUSTAINMENT ACTIVITY GROUP
24

Fund 2
(Dollars in Millions)
Changes in the Cost of Operations
Air Force Working Capital Fund
Consolidated Sustainment Activity Group (CSAG)
Fiscal Year (FY) 2021
Budget Estimates
February 2020
CSAG - Maintenance Division
FY2019 to FY2020 FY2020 to FY2021
OTHER CHANGES
Data Systems Support .544 .310
Data Systems Development (.032) .015
Equipment Depreciation 6.297 (3.473)
Minor Construction Depreciation .403 (.092)
Data System Depreciation (.090) (.397)
Travel & Transportation (.875) (2.881)
Communications .203 .027
Utilities (2.345) .922
Equipment Rental (.572) .073
Printing & Equipment .047 .003
Equip/Vehicle Rep & Maintenance (2.906) 2.744
Custodial (.434) .302
Facility Maintenance (25.000) 16.246
Training (.583) .308
Environmental 1.853 .000
Miscellaneous (5.329) (3.670)
TOTAL OTHER CHANGES (28.818) 10.437
TOTAL CHANGES 114.018 32.508
Cost of Operations
Organic EOP 7,197.032 7,214.369
Total Cost of Operations 7,181.862 7,241.782
Fund 2 CSAG - Maintenance Division
CONSOLIDATED SUSTAINMENT ACTIVITY GROUP
25

Fund 6
(Dollars in Millions)
Depot Maintenance Six Percent Capital Investment Plan
Air Force Working Capital Fund
Consolidated Sustainment Activity Group (CSAG)
Fiscal Year (FY) 2021
Budget Estimates
February 2020
CSAG - Maintenance Division
3 Year Average (Modernization, Efficiency)
2016-2018 2017-2019 2018-2020 FY2019 FY2020 FY2021
Total RevenueRevenue
Working Capital Fund Working Capital Fund 6,623.201 6,734.958 6,954.905
Appropriations Appropriations .000 .000 .000
Total RevenueTotal Revenue 6,623.201 6,734.958 6,954.905
WCF Depot Maintenance Capital InvestmentWCF Depot Maintenance Capital Investment
Facility, Sustainment, Restoration & Modernization Facility Restoration & Modernization 63.070 67.285 72.913
WCF Capital Investment Program Capital Investment Program 172.670 155.112 176.916
Equipment Expense Other Equipment .000 .000 .000
Productivity Enhancements Processes/Productivity Enhancements 1
.495 .055 4.400
AF Depot InvestmentAppropriated Funding
AF MILCON (3300) MILCON (3300) 2
158.380 .000 168.000
Aircraft Procurement (3010) Procurement Equipment (3010) 3
275.120 346.420 214.990
Operation & Maintenance Operation & Maintenance .000 .000 .000
Component Total InvestmentInvestment Total 669.735 568.872 637.219
Required InvestmentMinimum 6% Investment Amount 397.392 404.097 417.294
Investment Over/Under RequirementInvestment Over/(Under) Requirement 272.343 164.775 219.925
4. The CSAG Maintenance Division information above reflects the following Air Logistics Complex (ALC) investments:
($ millions) FY2019 FY2020 FY2021
Oklahoma City ALC 387.2 (11.9%) 207.2 (6.3%) 287.6 (8.6%)
Ogden ALC 107.5 (6.1%) 216.0 (11.5%) 252.2 (12.4%)
Warner Robins ALC 185.2 (11.5%) 95.16 (6.1%) 97.0 (6.2%)
3. Efforts funded with Aircraft Procurement (3010) include: support equipment development, procurement, installation and validation, tooling manufacturing and modification, software licensing
and testing, engineering support, test equipment and repair manuals.
Primary supported airframes include:
FY19: F-35 ($193 million with $142 million at OO-ALC for propulsion DA); F-15 ($37.5 million at WR-ALC); B-1 ($16.5 million); and several other airframes at less than $15 million each
FY20: KC-46A ($130.6 million at OC-ALC); F-35 ($67 million at OO-ALC); F-16 ($44.6M at OO-ALC); plus several other airframes at less than $20 million each
FY21: F-35 ($129.6 million with $81.8M at OO-ALC); F-16 ($59.5 million at OO-ALC); several other airframes at less than $20 million each
REVENUE
(Maintenance, Repair, Overhaul) BUDGETED CAPITAL
2. MILCON Requirements include: FY19: KC-46A Depot 2 Bay Depot Fuel Maintenance Hangar ($72.3M) and 2 Bay Depot Maintenance Hangar ($81M) at OC-ALC. FY20: no MILCON projects
funded. FY21: 3-Bay Mx Hangar ($156M) at OC-ALC.
1. The Processes/Productivity Enhancements category addresses transitioning equipment/technology through prototyping, testing, demonstration, and production qualification to utilization in the
depot production environment.
Fund 6 CSAG - Maintenance Division
CONSOLIDATED SUSTAINMENT ACTIVITY GROUP
26

Fund 11
(Dollars in Millions)
Source of New Orders and Revenue
Air Force Working Capital Fund
Consolidated Sustainment Activity Group (CSAG)
Fiscal Year (FY) 2021
Budget Estimates
February 2020
CSAG
FY2019 FY2020 FY2021
1. New Orders1. New Orders
a. Orders From DOD Components: a. Orders From DOD Components:
(1) Air Force (1) Air Force
(a) Aircraft Procurement (a) Aircraft Procurement 260.029 294.325 379.335
(b) Missile Procurement (b) Missile Procurement 1.690 1.554 3.320
(c) Other Procurement (c) Other Procurement .126 (.030) (.002)
(d) Military Construction (d) Military Construction .000 .000 .000
(e) Operations & Maintenance - AF (w/OCO) (e) Operations & Maintenance - AF (w/OCO) 4,217.536 4,519.211 5,120.556
(f) Operations & Maintenance - AFRC (w/OCO) (f) Operations & Maintenance - AFRC (w/OCO) 529.026 713.733 652.083
(g) Operations & Maintenance - ANG (w/OCO) (g) Operations & Maintenance - ANG (w/OCO) 1,227.054 1,295.101 1,538.162
(h) Research & Development - AF (h) Research & Development - AF 225.037 213.728 197.059
(i) Military Personnel - AF (i) Military Personnel - AF .000 .000 .000
(j) Reserve Personnel - AF (j) Reserve Personnel - AF .000 .000 .000
(k) Guard Personnel - ANG (k) Guard Personnel - ANG .000 .000 .000
(l) Family Housing (l) Family Housing .000 .000 .000
(m) Special Trust Funds (m) Special Trust Funds .000 .000 .000
(n) Other Air Force (n) Other Air Force 2.044 5.096 4.434
(o) Other (o) Other .000 .000 .000
Total Air ForceTotal Air Force 6,462.541 7,042.718 7,894.947
(2) Army (2) Army 41.898 44.470 45.175
(3) Navy (3) Navy 309.485 333.795 323.051
(4) Marine Corps (4) Marine Corps 7.309 1.056 .308
(5) MAP/Grant Aid (5) MAP/Grant Aid .000 .000 (.000)
(6) Other DOD (6) Other DOD 313.252 277.134 283.191
Total DOD excluding WCFTotal DOD excluding WCF 7,134.486 7,699.174 8,546.672
b. Orders From Other Fund Activity Groups b. Orders From Other Fund Activity Groups
(1) Other AF Supply Management Activity Groups (1) AF Supply Mgmt Activity Group - Retail 88.420 95.542 96.224
(2) Transportation Activity Group - TRANSCOM (2) Transportation Activity Group - TRANSCOM 308.729 308.480 351.957
(3) Other WCF Activity Groups (3) Other WCF Activity Groups (.809) .695 .725
(4) Commissary, Sur. Coll. (4) Commissary, Sur. Coll. .000 .000 .000
(i) AF Supply Mgmt Activity Group (5) AF CSAG - Supply (Supply Orders to Maintenance) 2,438.833 1,968.225 2,199.122
AF CSAG Maintenance (6) AF CSAG - Maintenance (Maintenance Orders to Supply) 1,700.400 1,832.435 1,969.574
Total Other Fund Activity GroupsTotal Other Fund Activity Groups 4,535.573 4,205.378 4,617.603
c. Other Internal to AF Consolidated Sustainment Activity Group c. Other Internal to AF Consolidated Sustainment Activity Group
(1) Internal Material Transfer Orders (Maintenance Orders to Supply) (1) Internal Material Transfer Orders (Maintenance Orders to Supply) .000 .000 .000
(2) Internal Material Repair Orders (Supply Orders to Maintenance) (2) Internal Material Repair Orders (Supply Orders to Maintenance) .000 .000 .000
Total Internal AF Consolidated Sustainment Activity Group Total Internal AF Consolidated Sustainment Activity Group .000 .000 .000
Fund 11 CSAG
CONSOLIDATED SUSTAINMENT ACTIVITY GROUP
27

Fund 11
(Dollars in Millions)
Source of New Orders and Revenue
Air Force Working Capital Fund
Consolidated Sustainment Activity Group (CSAG)
Fiscal Year (FY) 2021
Budget Estimates
February 2020
CSAG
FY2019 FY2020 FY2021
d. Grand Total DOD d. Grand Total DOD 11,670.059 11,904.551 13,164.274
e. Other Orders e. Other Orders
(1) Other Federal Agencies (1) Other Federal Agencies 8.918 15.774 11.998
(2) Non Federal Agencies (2) Non Federal Agencies 423.532 463.347 535.963
(3) FMS (3) FMS 291.983 23.440 161.318
Total Other OrdersTotal Other Orders 724.434 502.561 709.279
Total New Gross OrdersTotal New Gross Orders 12,394.493 12,407.112 13,873.553
Total External OrdersTotal New External Orders (Total New Gross Orders minus 1c. Total Internal AF CSAG) 12,394.493 12,407.112 13,873.553
2. Carry-In Orders2. Carry-In Orders 2,857.566 3,087.876 2,581.202
a. Carry-over Execution Adjustment a. Carry-over Execution Adjustment (30.092) (60.049) (60.049)
3. Total Gross Orders3. Total Gross Orders 15,252.059 15,494.988 16,454.755
a. Less Internal Material Transfer Orders (Maintenance Orders to Supply) a. Less Internal Material Transfer Orders (Maintenance Orders to Supply) .000 .000 .000
b. Less Internal Material Repair Orders (Supply Orders to Maintenance) b. Less Internal Material Repair Orders (Supply Orders to Maintenance) .000 .000 .000
Total External Gross OrdersTotal External Gross Orders 15,252.059 15,494.988 16,454.755
4. Revenue4. Gross Revenue 12,134.090 12,853.737 13,800.589
5. End of Year W-I-P5. End of Year W-I-P 2.822 1.601 1.601
6. Exclusion (Non-DoD, BRAC, and FMS)6. Total Exclusion
Exclusion (FMS_BRAC_OtherFederal_NonFederal) Exclusion (FMS, BRAC, Other Federal & Agency, Non-Federal) 396.334 245.190 297.263
Exclusion(Late_Inducted_Orders) Exclusion (Late Inducted Orders) .000 .000 .000
6. Exclusion (Non-DoD, BRAC, and FMS)Total Exclusion (sum of above exclusions) 396.334 245.190 297.263
7. Funded Carryover7. Funded Carryover 2,688.720 2,334.410 2,295.253
Fund 11 CSAG
CONSOLIDATED SUSTAINMENT ACTIVITY GROUP
28

Fund 11A
(Dollars in Millions)
Carryover Reconciliation
Air Force Working Capital Fund
Consolidated Sustainment Activity Group (CSAG)
Fiscal Year (FY) 2021
Budget Estimates
February 2020
CSAG - Maintenance Division
External Orders FY2019 FY2020 FY2021
Gross Carry-in 2,417.208 2,544.095 2,264.261
Adjustments to Carry-In During Execution (30.092) (60.049) (60.049)
WIP 4.859 2.489 1.601
1 Net Carry-in 2,382.257 2,481.557 2,202.610
2 Revenue (Billings) 6,768.137 7,020.593 7,605.955
3 New Orders 6,925.116 6,800.808 7,687.605
4 Exclusion (FMS, BRAC, Other Federal Agencies, Non-Federal Agencies) 463.782 501.074 568.607
Exclusion (Unplanned Orders, Inducted Late) 0.000 0.000 0.000
Exclusion Adjustment 0.000 0.000 0.000
Total Exclusion (FMS, BRAC, Other Federal Agencies, Non-Federal Agencies) 463.782 501.074 568.607
5 Orders for Carry-over Calculation 6,461.335 6,299.734 7,118.998
6 Weighted Composite Outlay Rate (New Orders) 68.10% 65.32% 64.74%
7 Carry-over Rate (New Orders) 31.90% 34.68% 35.26%
Carry-over Rate (Prior Year Multi-Year Funds) 45.32% 40.25% 49.23%
Carry-over Rate (Prior Year Software) 16.13% 14.05% 12.45%
8 Allowable Carry-over (New Orders) 2,061.429 2,184.433 2,510.074
Allowable Carry-over (Prior Year Multi-Year Funds) 184.686 152.459 192.728
Allowable Carry-over (Prior Year Software) 64.561 55.102 49.004
Total Allowable Carry-over 2,310.677 2,391.994 2,751.805
9 Unbilled Balance 2,544.095 2,264.261 2,285.862
Exclusion Adjustment 0.000 0.000 0.000
Total Unbilled Balance 2,544.095 2,264.261 2,285.862
10 Work-in-Process Carry-over 2.489 1.601 1.601
11 Actual Carry-over 2,541.606 2,262.659 2,284.260
Exclusion (FMS, BRAC, Other Federal & Agency, Non-Federal) 396.334 245.190 297.263
Exclusion (Late Inducted Orders) 0.000 0.000 0.000
12 Calculated Actual Carry-over 2,145.272 2,017.469 1,986.998
Excess Carryover (165.405) (374.525) (764.808)
(Negative number best)
Fund 11A CSAG - Maintenance Division
CONSOLIDATED SUSTAINMENT ACTIVITY GROUP
29

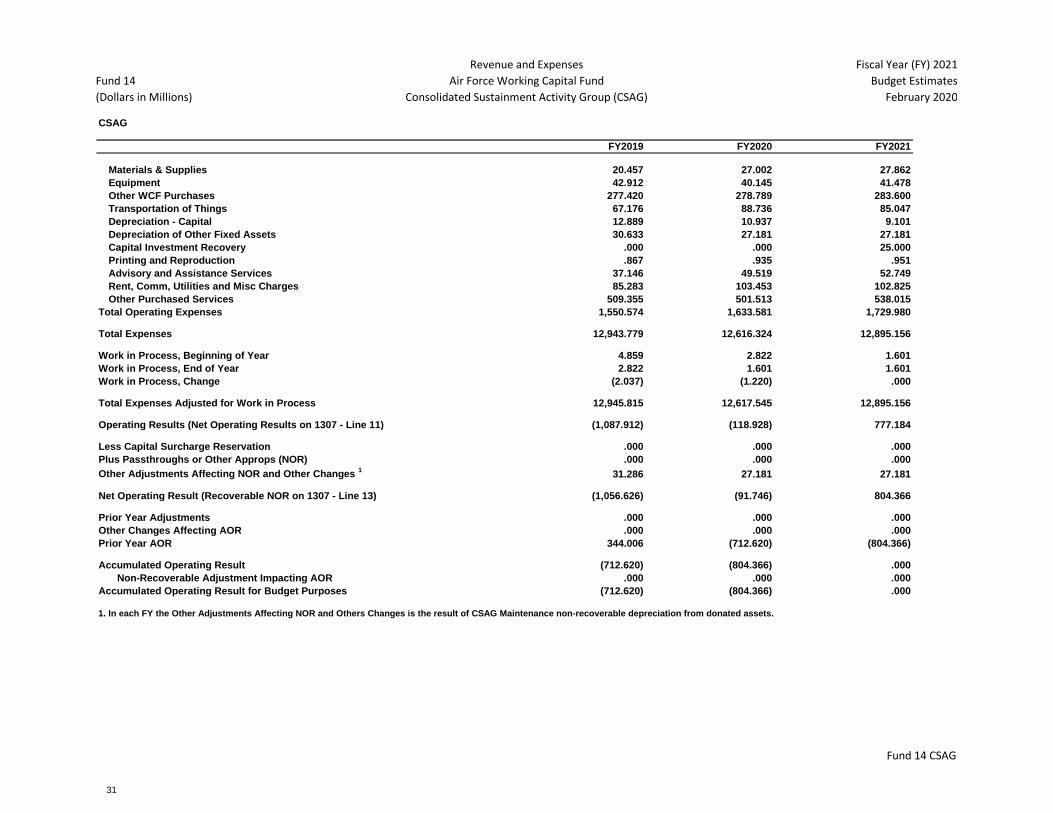
Fund 14
(Dollars in Millions)
Revenue and Expenses
Air Force Working Capital Fund
Consolidated Sustainment Activity Group (CSAG)
Fiscal Year (FY) 2021
Budget Estimates
February 2020
CSAG
FY2019 FY2020 FY2021
Revenue: Revenue:
Income:
Maintenance Division Maintenance Division6,768.137 7,020.593 7,605.955
Supply Division (Material Gross Sales) Supply Division (Material Gross Sales)5,365.953 5,833.144 6,194.635
Less Credit Returns Less Credit Returns297.708 386.101 383.167
Capital Investment Recovery Capital Investment Recovery.000 .000 25.000
Total Income Total Income11,836.382 12,467.636 13,442.422
Depreciation Offset (Major Construction) Depreciation Offset (Major Construction).000 .000 .000
Other Revenue Other Revenue 21.522 30.981 229.918
Total Other Revenue Total Other Revenue21.522 30.981 229.918
Total Revenue Total Net Revenue11,857.904 12,498.617 13,672.340
Expenses: Expenses:
Maintenance Division Maintenance Division
Cost of Repair (Direct and POH Costs) Cost of Repair (Direct and POH Costs)
Labor Labor 2,407.850 2,325.241 2,394.865
Material Material 3,520.633 3,712.577 3,650.255
Depreciation Depreciation .000 .000 .000
Depreciation of Equipment, ADPE & Telecom, Minor Construction, and Software DepreciationOfEquip_ADPE_MC_Software137.843 144.535 143.508
Depreciation of Other Fixed Assets DepreciationofOtherAssets.000 .000 .000
Capital Investment Recovery Capital Investment Recovery,.000 .000 .000
Subtotal Depreciation Subtotal Depreciation137.843 144.535 143.508
Subtotal Labor, Material, and Depreciation Subtotal Labor_Material_Depreciation6,066.327 6,182.352 6,188.628
Remaining Direct and POH Costs Remaining Direct_POH Costs506.639 474.300 472.059
Total Cost of Repair (Direct and POH Costs) Total Cost of Repair (Direct and POH Costs)6,572.966 6,656.652 6,660.687
Supply Division Supply Division
Cost of Material Sold Cost of Material Sold290.597 411.660 433.000
Cost of Material Repair Cost of Material Repair4,079.067 3,265.960 3,389.400
Condemnation Material Expense Recovery (CMER) Condemnation Material Expense Recovery (CMER)435.896 617.491 649.501
Other Expenses Other Expenses 14.678 30.981 32.588
Subtotal Material & Other Expenses Subtotal Material & Other Expenses4,820.239 4,326.091 4,504.489
Operating Expenses Business Operations
Military Personnel Military Personnel6.467 9.062 9.726
Civilian Personnel Civilian Personnel455.516 491.115 521.140
Travel &Transportation of People Travel &Transportation of People4.452 5.194 5.304
Fund 14 CSAG
CONSOLIDATED SUSTAINMENT ACTIVITY GROUP
30
Fund 14
(Dollars in Millions)
Revenue and Expenses
Air Force Working Capital Fund
Consolidated Sustainment Activity Group (CSAG)
Fiscal Year (FY) 2021
Budget Estimates
February 2020
CSAG
FY2019 FY2020 FY2021
Materials & Supplies Materials & Supplies20.457 27.002 27.862
Equipment Equipment 42.912 40.145 41.478
Other WCF Purchases Other WCF Purchases277.420 278.789 283.600
Transportation of Things Transportation of Things67.176 88.736 85.047
Depreciation - Capital Capital Investment Depreciation12.889 10.937 9.101
Depreciation of Other Fixed Assets F14-Depreciation of Other Fixed Assets30.633 27.181 27.181
Capital Investment Recovery Capital Investment Recovery..000 .000 25.000
Printing and Reproduction Printing and Reproduction.867 .935 .951
Advisory and Assistance Services Advisory and Assistance Services37.146 49.519 52.749
Rent, Comm, Utilities and Misc Charges Rent, Comm, Utilities and Misc Charges85.283 103.453 102.825
Other Purchased Services Other Purchased Services509.355 501.513 538.015
Total Operating Expenses Total Operating Expenses (Supply only)1,550.574 1,633.581 1,729.980
Total Expenses Total Expenses12,943.779 12,616.324 12,895.156
Work in Process, Beginning of Year Work in Process, Beginning of Year4.859 2.822 1.601
Work in Process, End of Year Work in Process, End of Year2.822 1.601 1.601
Work in Process, Change Work in Process , Change(2.037) (1.220) .000
Total Expenses Adjusted for Work in Process Total Expenses Adjusted for Work in Process12,945.815 12,617.545 12,895.156
Operating Results (Net Operating Results on 1307 - Line 11) Operating Result(1,087.912) (118.928) 777.184
Less Capital Surcharge Reservation Less Capital Surcharge Reservation.000 .000 .000
Plus Passthroughs or Other Approps (NOR) Plus Passthroughs or Other Approps (NOR).000 .000 .000
Other Adjustments Affecting NOR and Other Changes 1
Other Adjustments Affecting NOR and Other Changes31.286 27.181 27.181
Net Operating Result (Recoverable NOR on 1307 - Line 13) Net Operating Result(1,056.626) (91.746) 804.366
Prior Year Adjustments Prior Year Adjustments.000 .000 .000
Other Changes Affecting AOR Other Changes Affecting AOR.000 .000 .000
Prior Year AOR Plus Prior Year AOR344.006 (712.620) (804.366)
Accumulated Operating Result Accumulated Operating Result(712.620) (804.366) .000
Non-Recoverable Adjustment Impacting AOR Non-Recoverable Adjustment Impacting AOR.000 .000 .000
Accumulated Operating Result for Budget Purposes Accumulated Operating Result for Budget Purposes(712.620) (804.366) .000
1. In each FY the Other Adjustments Affecting NOR and Others Changes is the result of CSAG Maintenance non-recoverable depreciation from donated assets.
Fund 14 CSAG
CONSOLIDATED SUSTAINMENT ACTIVITY GROUP
31

Fund 16
(Dollars in Millions)
Material Inventory Data
Air Force Working Capital Fund
Consolidated Sustainment Activity Group (CSAG)
Fiscal Year (FY) 2021
Budget Estimates
February 2020
CSAG - Maintenance Division
FY2019 FY2020 FY2021
1. Material Inventory BOP 128.254 129.605 130.000
2. Purchases 3,250.643 3,493.958 3,420.947
A. Purchases to Support Customer Orders (+) 3,250.643 3,493.958 3,420.947
B. Purchase of long lead items in advance of customer orders (+) .000 .000 .000
C. Other Purchases (+) .000 .000 .000
3. Material Inventory Adjustments (3,249.292) (3,493.563) (3,420.947)
A. Material Used in Maintenance (-) (3,249.292) (3,493.563) (3,420.947)
B. Disposals, theft, losses due to damages (-) .000 .000 .000
C. Other Reductions (-) .000 .000 .000
4. Material Inventory EOP 129.605 130.000 130.000
Fund 16 CSAG - Maintenance Division
CONSOLIDATED SUSTAINMENT ACTIVITY GROUP
32

SM-1
(Dollars in Millions)
Supply Management Summary
Air Force Working Capital Fund
Consolidated Sustainment Activity Group (CSAG)
Fiscal Year (FY) 2021
Budget Estimates
February 2020
CSAG - Supply Division
Direct Total
Net Customer WRM Direct Reimbursables Operating Total Capital Variability Target
Orders Net Sales Operating Appn (Initial Spares) Obligations Obligations Target Total
FY2019 CSAG - Supply Division5,171.668 5,068.245 6,530.641 .000 23.867 6,554.507 1.189 800.000 7,355.696
FY2020 CSAG - Supply Division5,220.203 5,447.043 5,289.395 .000 33.313 5,322.708 .000 800.000 6,122.708
FY2021 CSAG - Supply Division5,802.781 5,811.468 5,470.284 .000 26.637 5,496.921 9.900 800.000 6,306.821
Obligation Targets
SM-1 CSAG - Supply Division
CONSOLIDATED SUSTAINMENT ACTIVITY GROUP
33

SM-3B
(Dollars in Millions)
Weapons System Funding
Air Force Working Capital Fund
Consolidated Sustainment Activity Group (CSAG)
Fiscal Year (FY) 2021
Budget Estimates
February 2020
CSAG - Supply Division
FY2019
Reparable
Buy
Consumable
Buy Total Buy Initial Spares
Internal/Organic
Repair
Cost Authority
Contract Repair Total Repair Total
NMCRS
Percent
A-10 37.387 38.503 75.890 0.000 230.008 16.595 246.603 322.493 5.8%
B-1B 66.793 1.318 68.111 0.000 175.427 84.425 259.852 327.963 8.0%
B-2 60.086 .233 60.320 0.000 18.608 69.232 87.841 148.161 2.5%
B-52 80.376 .476 80.852 .265 143.971 19.094 163.065 244.182 6.2%
C-5 32.445 .484 32.930 0.000 51.327 9.744 61.070 94.000 4.9%
C-17 1.243 0.000 1.243 0.000 .685 .430 1.115 2.357 2.3%
C-130 28.809 1.167 29.976 0.000 64.694 79.717 144.412 174.388 3.4%
C-135 246.280 4.321 250.601 0.000 213.966 87.669 301.635 552.236 3.8%
C-141 0.000 0.000 0.000 0.000 0.000 0.000 0.000 0.000 0.0%
C-46 .235 0.000 .235 0.000 0.000 0.000 0.000 .235 0.0%
E-3 18.234 .055 18.289 0.000 102.522 13.023 115.545 133.834 7.1%
E-4 0.000 0.000 0.000 0.000 .693 .078 .771 .771 2.7%
E-8 9.781 0.000 9.781 0.000 18.366 .895 19.262 29.043 3.1%
F-4 .036 0.000 .036 0.000 .156 .004 .160 .196 0.0%
F-15 507.468 17.930 525.398 23.602 198.355 24.521 222.876 771.875 5.3%
F-16 47.822 31.815 79.637 0.000 295.597 38.915 334.512 414.149 6.0%
F100 Engines 42.369 10.789 53.158 0.000 191.835 27.412 219.247 272.405 0.0%
F110 Engines 1.982 0.000 1.982 0.000 17.251 139.878 157.129 159.111 0.0%
F-22 0.000 0.000 0.000 0.000 0.000 0.000 0.000 0.000 3.2%
F-35 0.000 0.000 0.000 0.000 0.000 0.000 0.000 0.000 0.0%
F-111 0.000 0.000 0.000 0.000 0.000 0.000 0.000 0.000 0.0%
F-117 0.000 0.000 0.000 0.000 0.000 0.000 0.000 0.000 0.0%
H-1 10.783 .788 11.571 0.000 .743 20.101 20.844 32.415 5.1%
H-3 0.000 0.000 0.000 0.000 0.000 0.000 0.000 0.000 0.0%
H-53 0.000 0.000 0.000 0.000 0.000 0.000 0.000 0.000 0.0%
H-60 1.977 .305 2.282 0.000 .235 9.131 9.366 11.648 13.6%
Trainers 14.585 .000 14.585 0.000 16.697 20.908 37.605 52.190 5.0%
Other Aircraft .403 0.000 .403 0.000 1.429 2.827 4.256 4.660 3.6%
SOF 1.503 0.000 1.503 0.000 2.569 78.870 81.438 82.942 6.1%
Common 184.400 3.759 188.159 0.000 158.604 78.401 237.004 425.163 0.0%
Common EW 2.387 3.909 6.296 0.000 36.668 30.268 66.936 73.232 0.0%
FMS/FDT .593 1.279 1.872 0.000 0.000 0.000 0.000 1.872 0.0%
Missiles 10.168 4.634 14.802 0.000 24.373 3.450 27.822 42.624 0.0%
Other 15.475 .218 15.693 0.000 9.122 43.647 52.769 68.462 0.0%
NIMSC5 0.000 0.000 0.000 0.000 0.000 121.354 121.354 121.354 0.0%
NIMSC5-CV-22 0.000 0.000 0.000 0.000 0.000 421.494 421.494 421.494 6.1%
New WS Fund 1 0.000 0.000 0.000 0.000 0.000 0.000 0.000 0.000 0.0%
RSP 0.000 0.000 0.000 0.000 0.000 0.000 0.000 0.000 0.0%
JEIM 0.000 0.000 0.000 0.000 202.647 0.000 202.647 202.647 0.0%
Local Manufacture Buy 0.000 0.000 0.000 0.000 21.146 0.000 21.146 21.146 0.0%
AMARG 0.000 0.000 0.000 0.000 0.000 0.000 0.000 0.000 0.0%
Org Sustaining Engrg 0.000 0.000 0.000 0.000 0.000 0.000 0.000 0.000 0.0%
PBL 0.000 0.000 0.000 0.000 0.000 217.381 217.381 217.381 0.0%
Total 1,423.620 121.985 1,545.605 23.867 2,197.695 1,659.463 3,857.158 5,426.630 10.7%
SM-3B CSAG - Supply Division
CONSOLIDATED SUSTAINMENT ACTIVITY GROUP
34
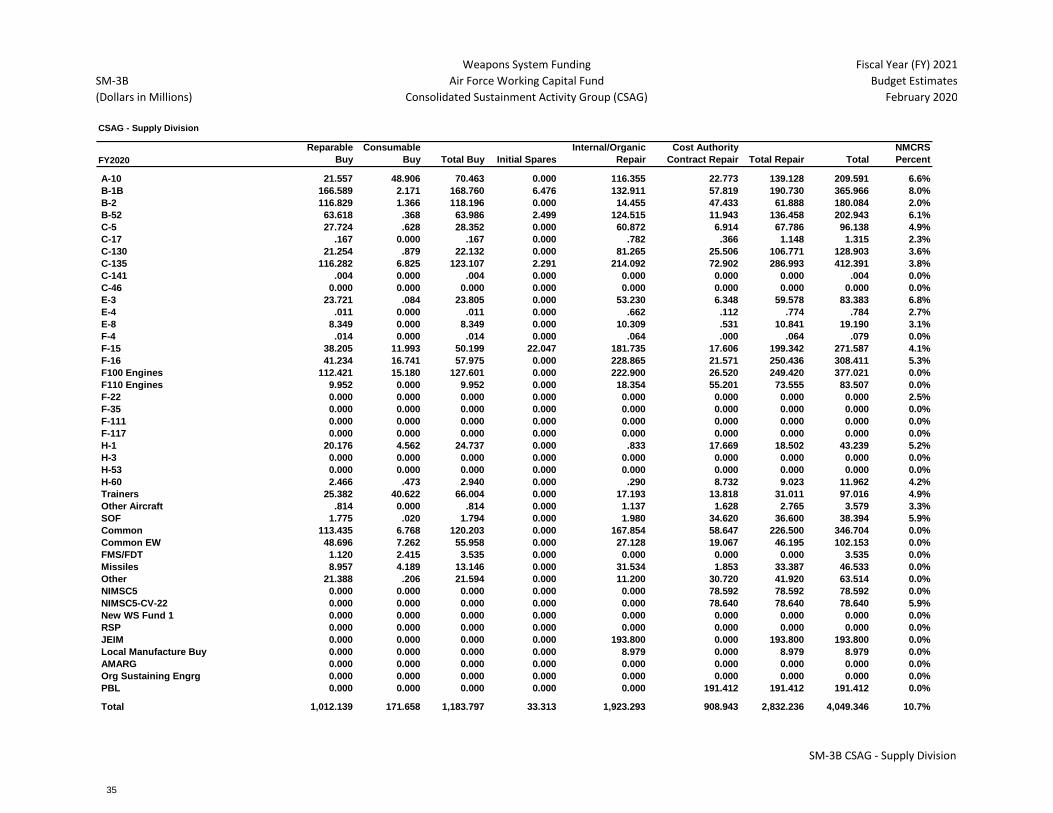
SM-3B
(Dollars in Millions)
Weapons System Funding
Air Force Working Capital Fund
Consolidated Sustainment Activity Group (CSAG)
Fiscal Year (FY) 2021
Budget Estimates
February 2020
CSAG - Supply Division
FY2020
Reparable
Buy
Consumable
Buy Total Buy Initial Spares
Internal/Organic
Repair
Cost Authority
Contract Repair Total Repair Total
NMCRS
Percent
A-10 21.557 48.906 70.463 0.000 116.355 22.773 139.128 209.591 6.6%
B-1B 166.589 2.171 168.760 6.476 132.911 57.819 190.730 365.966 8.0%
B-2 116.829 1.366 118.196 0.000 14.455 47.433 61.888 180.084 2.0%
B-52 63.618 .368 63.986 2.499 124.515 11.943 136.458 202.943 6.1%
C-5 27.724 .628 28.352 0.000 60.872 6.914 67.786 96.138 4.9%
C-17 .167 0.000 .167 0.000 .782 .366 1.148 1.315 2.3%
C-130 21.254 .879 22.132 0.000 81.265 25.506 106.771 128.903 3.6%
C-135 116.282 6.825 123.107 2.291 214.092 72.902 286.993 412.391 3.8%
C-141 .004 0.000 .004 0.000 0.000 0.000 0.000 .004 0.0%
C-46 0.000 0.000 0.000 0.000 0.000 0.000 0.000 0.000 0.0%
E-3 23.721 .084 23.805 0.000 53.230 6.348 59.578 83.383 6.8%
E-4 .011 0.000 .011 0.000 .662 .112 .774 .784 2.7%
E-8 8.349 0.000 8.349 0.000 10.309 .531 10.841 19.190 3.1%
F-4 .014 0.000 .014 0.000 .064 .000 .064 .079 0.0%
F-15 38.205 11.993 50.199 22.047 181.735 17.606 199.342 271.587 4.1%
F-16 41.234 16.741 57.975 0.000 228.865 21.571 250.436 308.411 5.3%
F100 Engines 112.421 15.180 127.601 0.000 222.900 26.520 249.420 377.021 0.0%
F110 Engines 9.952 0.000 9.952 0.000 18.354 55.201 73.555 83.507 0.0%
F-22 0.000 0.000 0.000 0.000 0.000 0.000 0.000 0.000 2.5%
F-35 0.000 0.000 0.000 0.000 0.000 0.000 0.000 0.000 0.0%
F-111 0.000 0.000 0.000 0.000 0.000 0.000 0.000 0.000 0.0%
F-117 0.000 0.000 0.000 0.000 0.000 0.000 0.000 0.000 0.0%
H-1 20.176 4.562 24.737 0.000 .833 17.669 18.502 43.239 5.2%
H-3 0.000 0.000 0.000 0.000 0.000 0.000 0.000 0.000 0.0%
H-53 0.000 0.000 0.000 0.000 0.000 0.000 0.000 0.000 0.0%
H-60 2.466 .473 2.940 0.000 .290 8.732 9.023 11.962 4.2%
Trainers 25.382 40.622 66.004 0.000 17.193 13.818 31.011 97.016 4.9%
Other Aircraft .814 0.000 .814 0.000 1.137 1.628 2.765 3.579 3.3%
SOF 1.775 .020 1.794 0.000 1.980 34.620 36.600 38.394 5.9%
Common 113.435 6.768 120.203 0.000 167.854 58.647 226.500 346.704 0.0%
Common EW 48.696 7.262 55.958 0.000 27.128 19.067 46.195 102.153 0.0%
FMS/FDT 1.120 2.415 3.535 0.000 0.000 0.000 0.000 3.535 0.0%
Missiles 8.957 4.189 13.146 0.000 31.534 1.853 33.387 46.533 0.0%
Other 21.388 .206 21.594 0.000 11.200 30.720 41.920 63.514 0.0%
NIMSC5 0.000 0.000 0.000 0.000 0.000 78.592 78.592 78.592 0.0%
NIMSC5-CV-22 0.000 0.000 0.000 0.000 0.000 78.640 78.640 78.640 5.9%
New WS Fund 1 0.000 0.000 0.000 0.000 0.000 0.000 0.000 0.000 0.0%
RSP 0.000 0.000 0.000 0.000 0.000 0.000 0.000 0.000 0.0%
JEIM 0.000 0.000 0.000 0.000 193.800 0.000 193.800 193.800 0.0%
Local Manufacture Buy 0.000 0.000 0.000 0.000 8.979 0.000 8.979 8.979 0.0%
AMARG 0.000 0.000 0.000 0.000 0.000 0.000 0.000 0.000 0.0%
Org Sustaining Engrg 0.000 0.000 0.000 0.000 0.000 0.000 0.000 0.000 0.0%
PBL 0.000 0.000 0.000 0.000 0.000 191.412 191.412 191.412 0.0%
Total 1,012.139 171.658 1,183.797 33.313 1,923.293 908.943 2,832.236 4,049.346 10.7%
SM-3B CSAG - Supply Division
CONSOLIDATED SUSTAINMENT ACTIVITY GROUP
35

SM-3B
(Dollars in Millions)
Weapons System Funding
Air Force Working Capital Fund
Consolidated Sustainment Activity Group (CSAG)
Fiscal Year (FY) 2021
Budget Estimates
February 2020
CSAG - Supply Division
FY2021
Reparable
Buy
Consumable
Buy Total Buy Initial Spares
Internal/Organic
Repair
Cost Authority
Contract Repair Total Repair Total
NMCRS
Percent
A-10 23.056 28.502 51.558 0.000 99.523 27.716 127.239 178.797 7.6%
B-1B 44.570 4.610 49.180 3.906 137.305 75.458 212.764 265.850 8.0%
B-2 55.395 .788 56.183 0.000 18.387 69.612 87.999 144.182 2.5%
B-52 44.924 .563 45.487 2.696 140.082 17.199 157.281 205.463 5.8%
C-5 24.696 .799 25.495 0.000 55.181 10.246 65.428 90.923 4.9%
C-17 .119 0.000 .119 0.000 .822 .457 1.280 1.398 2.2%
C-130 27.995 1.044 29.039 0.000 100.357 54.257 154.614 183.653 3.5%
C-135 146.665 7.217 153.882 2.335 233.888 90.270 324.158 480.375 3.9%
C-141 .003 0.000 .003 0.000 0.000 0.000 0.000 .003 0.0%
C-46 0.000 0.000 0.000 0.000 0.000 0.000 0.000 0.000 0.0%
E-3 17.466 .445 17.910 0.000 64.290 8.653 72.943 90.853 5.2%
E-4 .001 0.000 .001 0.000 .672 .146 .818 .819 3.7%
E-8 5.957 0.000 5.957 0.000 12.605 .664 13.269 19.226 3.1%
F-4 0.000 0.000 0.000 0.000 0.000 .001 .001 .001 0.0%
F-15 76.642 14.185 90.827 17.700 195.475 27.731 223.206 331.733 4.1%
F-16 49.056 21.297 70.353 0.000 256.611 31.425 288.036 358.390 5.3%
F100 Engines 141.166 18.678 159.844 0.000 284.450 33.573 318.022 477.867 0.0%
F110 Engines 16.681 0.000 16.681 0.000 24.584 109.161 133.744 150.426 0.0%
F-22 0.000 0.000 0.000 0.000 0.000 0.000 0.000 0.000 2.3%
F-35 0.000 0.000 0.000 0.000 0.000 0.000 0.000 0.000 0.0%
F-111 0.000 0.000 0.000 0.000 0.000 0.000 0.000 0.000 0.0%
F-117 0.000 0.000 0.000 0.000 0.000 0.000 0.000 0.000 0.0%
H-1 9.674 1.343 11.017 0.000 .720 21.652 22.372 33.389 5.2%
H-3 0.000 0.000 0.000 0.000 0.000 0.000 0.000 0.000 0.0%
H-53 0.000 0.000 0.000 0.000 0.000 0.000 0.000 0.000 0.0%
H-60 3.086 .173 3.259 0.000 .223 11.535 11.759 15.018 3.5%
Trainers 27.911 31.517 59.428 0.000 20.486 15.945 36.431 95.859 4.9%
Other Aircraft 2.098 0.000 2.098 0.000 1.206 2.144 3.350 5.448 3.3%
SOF 6.225 .045 6.270 0.000 5.962 62.000 67.962 74.231 5.7%
Common 106.689 6.165 112.854 0.000 183.826 64.732 248.558 361.412 0.0%
Common EW 57.380 20.629 78.010 0.000 28.175 24.597 52.771 130.781 0.0%
FMS/FDT 1.126 2.429 3.555 0.000 0.000 0.000 0.000 3.555 0.0%
Missiles 4.918 4.278 9.196 0.000 37.621 2.699 40.320 49.516 0.0%
Other 11.650 .180 11.830 0.000 11.781 39.010 50.791 62.621 0.0%
NIMSC5 0.000 0.000 0.000 0.000 0.000 145.159 145.159 145.159 0.0%
NIMSC5-CV-22 0.000 0.000 0.000 0.000 0.000 36.970 36.970 36.970 5.7%
New WS Fund 1 0.000 0.000 0.000 0.000 0.000 0.000 0.000 0.000 0.0%
RSP 0.000 0.000 0.000 0.000 0.000 0.000 0.000 0.000 0.0%
JEIM 0.000 0.000 0.000 0.000 73.472 0.000 73.472 73.472 0.0%
Local Manufacture Buy 0.000 0.000 0.000 0.000 9.376 0.000 9.376 9.376 0.0%
AMARG 0.000 0.000 0.000 0.000 0.000 0.000 0.000 0.000 0.0%
Org Sustaining Engrg 0.000 0.000 0.000 0.000 0.000 0.000 0.000 0.000 0.0%
PBL 0.000 0.000 0.000 0.000 0.000 199.813 199.813 199.813 0.0%
Total 905.149 164.887 1,070.036 26.637 1,997.080 1,182.824 3,179.904 4,276.577 0.0%
SM-3B CSAG - Supply Division
CONSOLIDATED SUSTAINMENT ACTIVITY GROUP
36
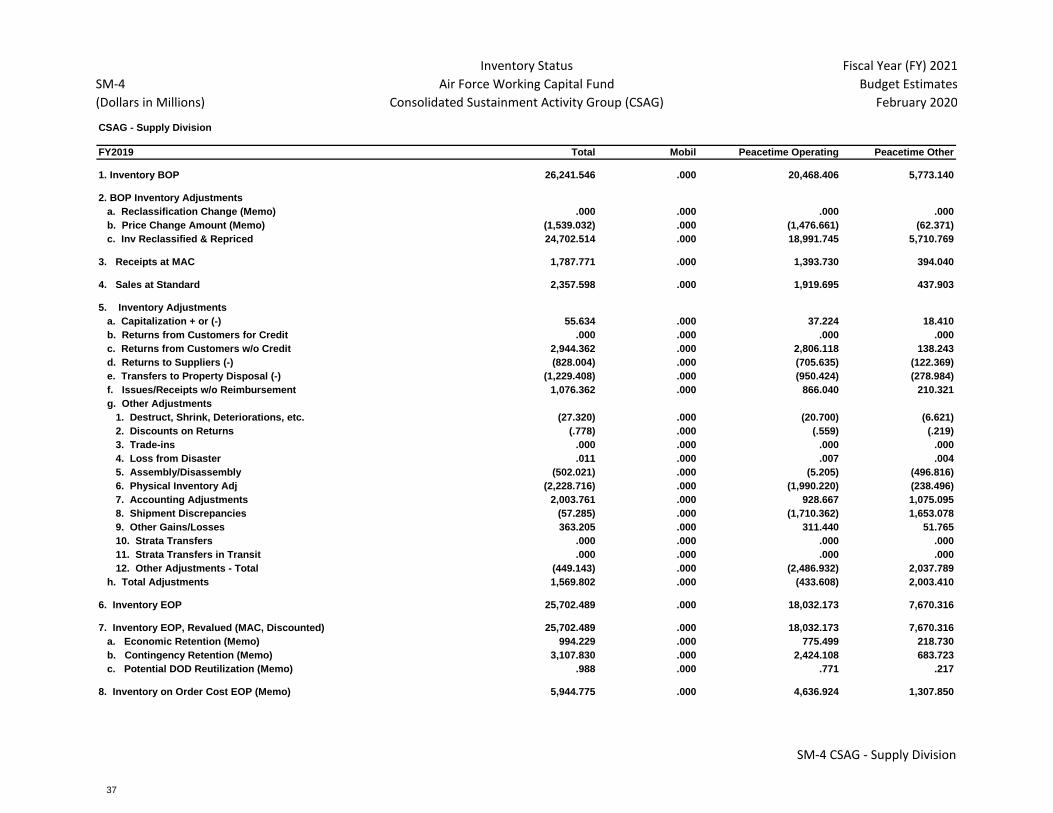
SM-4
(Dollars in Millions)
Inventory Status
Air Force Working Capital Fund
Consolidated Sustainment Activity Group (CSAG)
Fiscal Year (FY) 2021
Budget Estimates
February 2020
CSAG - Supply Division
FY2019 Total Mobil Peacetime Operating Peacetime Other
1. Inventory BOP 26,241.546 .000 20,468.406 5,773.140
2. BOP Inventory Adjustments
a. Reclassification Change (Memo) .000 .000 .000 .000
b. Price Change Amount (Memo) (1,539.032) .000 (1,476.661) (62.371)
c. Inv Reclassified & Repriced 24,702.514 .000 18,991.745 5,710.769
3. Receipts at MAC 1,787.771 .000 1,393.730 394.040
4. Sales at Standard 2,357.598 .000 1,919.695 437.903
5. Inventory Adjustments
a. Capitalization + or (-) 55.634 .000 37.224 18.410
b. Returns from Customers for Credit .000 .000 .000 .000
c. Returns from Customers w/o Credit 2,944.362 .000 2,806.118 138.243
d. Returns to Suppliers (-) (828.004) .000 (705.635) (122.369)
e. Transfers to Property Disposal (-) (1,229.408) .000 (950.424) (278.984)
f. Issues/Receipts w/o Reimbursement 1,076.362 .000 866.040 210.321
g. Other Adjustments
1. Destruct, Shrink, Deteriorations, etc. (27.320) .000 (20.700) (6.621)
2. Discounts on Returns (.778) .000 (.559) (.219)
3. Trade-ins .000 .000 .000 .000
4. Loss from Disaster .011 .000 .007 .004
5. Assembly/Disassembly (502.021) .000 (5.205) (496.816)
6. Physical Inventory Adj (2,228.716) .000 (1,990.220) (238.496)
7. Accounting Adjustments 2,003.761 .000 928.667 1,075.095
8. Shipment Discrepancies (57.285) .000 (1,710.362) 1,653.078
9. Other Gains/Losses 363.205 .000 311.440 51.765
10. Strata Transfers .000 .000 .000 .000
11. Strata Transfers in Transit .000 .000 .000 .000
12. Other Adjustments - Total (449.143) .000 (2,486.932) 2,037.789
h. Total Adjustments 1,569.802 .000 (433.608) 2,003.410
6. Inventory EOP 25,702.489 .000 18,032.173 7,670.316
7. Inventory EOP, Revalued (MAC, Discounted) 25,702.489 .000 18,032.173 7,670.316
a. Economic Retention (Memo) 994.229 .000 775.499 218.730
b. Contingency Retention (Memo) 3,107.830 .000 2,424.108 683.723
c. Potential DOD Reutilization (Memo) .988 .000 .771 .217
8. Inventory on Order Cost EOP (Memo) 5,944.775 .000 4,636.924 1,307.850
SM-4 CSAG - Supply Division
CONSOLIDATED SUSTAINMENT ACTIVITY GROUP
37

SM-4
(Dollars in Millions)
Inventory Status
Air Force Working Capital Fund
Consolidated Sustainment Activity Group (CSAG)
Fiscal Year (FY) 2021
Budget Estimates
February 2020
CSAG - Supply Division
FY2020 Total Mobil Peacetime Operating Peacetime Other
1. Inventory BOP 25,702.489 .000 18,032.173 7,670.316
2. BOP Inventory Adjustments
a. Reclassification Change (Memo) .000 .000 .000 .000
b. Price Change Amount (Memo) (178.301) .000 (139.075) (39.226)
c. Inv Reclassified & Repriced 25,524.188 .000 17,893.098 7,631.090
3. Receipts at MAC 1,826.914 .000 1,424.993 401.921
4. Sales at Standard 2,030.277 .000 1,583.616 446.661
5. Inventory Adjustments
a. Capitalization + or (-) 68.465 .000 53.402 15.062
b. Returns from Customers for Credit 317.186 .000 247.405 69.781
c. Returns from Customers w/o Credit 640.946 .000 499.938 141.008
d. Returns to Suppliers (-) (272.741) .000 (212.738) (60.003)
e. Transfers to Property Disposal (-) (1,293.471) .000 (1,008.907) (284.564)
f. Issues/Receipts w/o Reimbursement (320.200) .000 (249.756) (70.444)
g. Other Adjustments
1. Destruct, Shrink, Deteriorations, etc. (26.885) .000 (20.970) (5.915)
2. Discounts on Returns (260.897) .000 (203.499) (57.397)
3. Trade-ins .000 .000 .000 .000
4. Loss from Disaster .017 .000 .014 .004
5. Assembly/Disassembly 91.164 .000 71.108 20.056
6. Physical Inventory Adj (1,084.074) .000 (845.578) (238.496)
7. Accounting Adjustments 1,761.852 .000 1,374.244 387.607
8. Shipment Discrepancies (702.882) .000 (548.248) (154.634)
9. Other Gains/Losses 235.294 .000 183.529 51.765
10. Strata Transfers .000 .000 .000 .000
11. Strata Transfers in Transit .000 .000 .000 .000
12. Other Adjustments - Total 13.589 .000 10.599 2.990
h. Total Adjustments (846.227) .000 (660.057) (186.170)
6. Inventory EOP 24,474.597 .000 17,074.417 7,400.180
7. Inventory EOP, Revalued (MAC, Discounted) 24,474.597 .000 17,074.417 7,400.180
a. Economic Retention (Memo) 1,014.114 .000 791.009 223.105
b. Contingency Retention (Memo) 3,169.987 .000 2,472.590 697.397
c. Potential DOD Reutilization (Memo) 1.008 .000 .786 .222
8. Inventory on Order Cost EOP (Memo) 5,885.327 .000 4,590.555 1,294.772
SM-4 CSAG - Supply Division
CONSOLIDATED SUSTAINMENT ACTIVITY GROUP
38
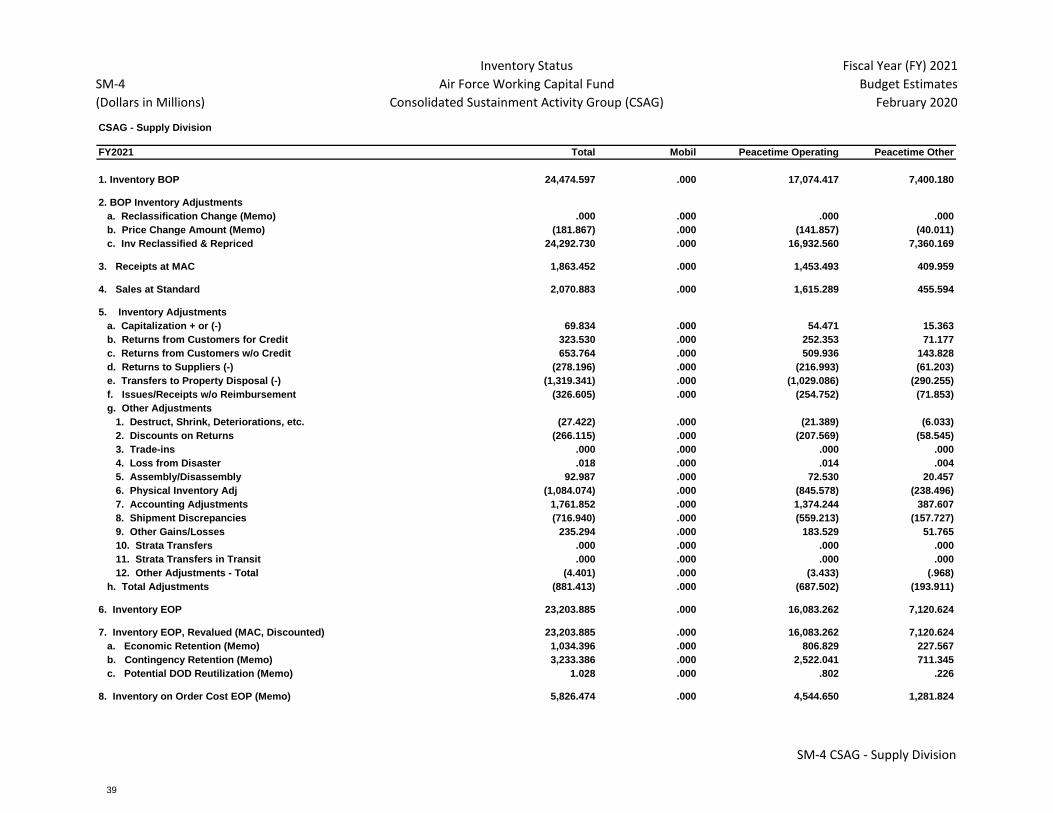
SM-4
(Dollars in Millions)
Inventory Status
Air Force Working Capital Fund
Consolidated Sustainment Activity Group (CSAG)
Fiscal Year (FY) 2021
Budget Estimates
February 2020
CSAG - Supply Division
FY2021 Total Mobil Peacetime Operating Peacetime Other
1. Inventory BOP 24,474.597 .000 17,074.417 7,400.180
2. BOP Inventory Adjustments
a. Reclassification Change (Memo) .000 .000 .000 .000
b. Price Change Amount (Memo) (181.867) .000 (141.857) (40.011)
c. Inv Reclassified & Repriced 24,292.730 .000 16,932.560 7,360.169
3. Receipts at MAC 1,863.452 .000 1,453.493 409.959
4. Sales at Standard 2,070.883 .000 1,615.289 455.594
5. Inventory Adjustments
a. Capitalization + or (-) 69.834 .000 54.471 15.363
b. Returns from Customers for Credit 323.530 .000 252.353 71.177
c. Returns from Customers w/o Credit 653.764 .000 509.936 143.828
d. Returns to Suppliers (-) (278.196) .000 (216.993) (61.203)
e. Transfers to Property Disposal (-) (1,319.341) .000 (1,029.086) (290.255)
f. Issues/Receipts w/o Reimbursement (326.605) .000 (254.752) (71.853)
g. Other Adjustments
1. Destruct, Shrink, Deteriorations, etc. (27.422) .000 (21.389) (6.033)
2. Discounts on Returns (266.115) .000 (207.569) (58.545)
3. Trade-ins .000 .000 .000 .000
4. Loss from Disaster .018 .000 .014 .004
5. Assembly/Disassembly 92.987 .000 72.530 20.457
6. Physical Inventory Adj (1,084.074) .000 (845.578) (238.496)
7. Accounting Adjustments 1,761.852 .000 1,374.244 387.607
8. Shipment Discrepancies (716.940) .000 (559.213) (157.727)
9. Other Gains/Losses 235.294 .000 183.529 51.765
10. Strata Transfers .000 .000 .000 .000
11. Strata Transfers in Transit .000 .000 .000 .000
12. Other Adjustments - Total (4.401) .000 (3.433) (.968)
h. Total Adjustments (881.413) .000 (687.502) (193.911)
6. Inventory EOP 23,203.885 .000 16,083.262 7,120.624
7. Inventory EOP, Revalued (MAC, Discounted) 23,203.885 .000 16,083.262 7,120.624
a. Economic Retention (Memo) 1,034.396 .000 806.829 227.567
b. Contingency Retention (Memo) 3,233.386 .000 2,522.041 711.345
c. Potential DOD Reutilization (Memo) 1.028 .000 .802 .226
8. Inventory on Order Cost EOP (Memo) 5,826.474 .000 4,544.650 1,281.824
SM-4 CSAG - Supply Division
CONSOLIDATED SUSTAINMENT ACTIVITY GROUP
39

THIS PAGE INTENTIONALLY LEFT BLANK
CONSOLIDATED SUSTAINMENT ACTIVITY GROUP
40

AIR FORCE
WORKING CAPITAL FUND
SUPPLY MANAGEMENT ACTIVITY
GROUP – RETAIL
SUPPLY MANAGEMENT ACTIVITY GROUP - RETAIL
41

THIS PAGE INTENTIONALLY LEFT BLANK
SUPPLY MANAGEMENT ACTIVITY GROUP - RETAIL
42

SMAG–Retail Budget Overview
Supply Management Activity Group–Retail Budget Overview
Fiscal Year (FY) 2021 President’s Budget (PB)
The Air Force Supply Management Activity Group–Retail (SMAG-R) is comprised of three divisions: General Support,
Medical-Dental and the United States Air Force Academy. SMAG-R manages 2.0 million inventory items including weapon
system spare parts, medical-dental supplies and equipment, and other items used in non-weapon system applications.
SMAG-R is a critical component in the support of combat readiness. It procures materiel and makes spares available to
authorized customers. Within SMAG-R, the Medical-Dental Division inventory includes a War Reserve Material (WRM)
Stockpile.
SMAG-R provides a wide range of logistics support services including requirements forecasting, item introduction,
cataloging, provisioning, procurement, repair, technical support, data management, item disposal, distribution management
and transportation. Inventories are an integral part of SMAG-R and are maintained by each of the divisions in support of
customer requirements. The SMAG-R objective is to replenish inventories and provide supplies to customers in a timely
manner within customer funding constraints, while maintaining fund solvency.
Division Overviews The General Support Division (GSD) finances the Air Force retail inventory and issues requirements for all non-Air Force
managed economic order quantity (EOQ) items other than those pertaining to peculiar medical, commissary, and fuels
requirements. GSD items support installation, maintenance, administrative functions, field and depot maintenance of
aircraft, ground and airborne communication and electronic systems, and other sophisticated systems and equipment. Also
included is initial outfitting of individual clothing items issued to new recruits, organizational clothing items such as firemen’s
protective over garments, ‘clean room’ coveralls, air crew helmets, and chemical biological warfare protective over
garments. This retail activity is accomplished at nearly 300 Air Force installations throughout the world.
SUPPLY MANAGEMENT ACTIVITY GROUP - RETAIL
43
SMAG–Retail Budget Overview
The Air Force Academy Division finances the purchase of uniforms, uniform accessories, and miscellaneous commodities
required by USAF Academy cadets during their four-year stay at the Academy. The customer base consists of
approximately 4,000 cadets. The Air Academy Division procures both distinctive uniforms and accessories from various
manufacturing contractors and regular Air Force uniforms purchased through the Defense Logistics Agency.
The Surgeon General of the Air Force is responsible for the overall management of the Medical-Dental Division (MDD) and
manages items for 73 Medical Treatment Facilities (MTF) worldwide. The Surgeon General assigned central financial and
material management functions to the Medical Logistics Division of the Air Force Medical Operations Agency (AFMOA),
located at Fort Detrick, Maryland. Nearly 99% of all peacetime customer orders come from MTFs funded by the Defense
Health Program appropriation. Peacetime inventory stock remains at 3-4 days with annual turn-over rates of over 200
times.
In addition to the peacetime program, MDD is responsible for purchasing and maintaining inventory/assets funded by the
War Reserve Material (WRM) appropriation. The medical WRM inventory is owned by MDD until it is needed for war fighter
deployment or contingency operations and it is then sold and revenue is collected for WRM replenishment. WRM inventory
accounts for approximately 99% of total MDD inventory at any given time.
War Reserve Materiel (WRM) / Direct Appropriation The medical WRM provides supplies and equipment vital to support forces in the full range of military operations for the first
30 days of a contingency operation, and provides force health protection materiel to all deploying Air Force Active, Reserve,
and Guard personnel. Availability of this materiel ensures Air Force personnel can deploy as scheduled and contingency
operations can be conducted until re-supply lines are established and materiel is routinely received from the contiguous
United States. A direct appropriation funds establishment and sustainment of 3,498 assemblages and Force Health
Protection assets for 447 locations that are maintained in the MDD inventory until required for direct support of war fighters.
Medical wartime assemblies/capabilities are classified into six support categories: Expeditionary Medical Support (EMEDS)
assemblages, Aero-Medical Evacuation (AE) sets, Patient Staging, Specialty Care sets, AF Special Operations, Medical
Support, and Medical Personal Protection Prophylaxis/Antidotes.
SUPPLY MANAGEMENT ACTIVITY GROUP - RETAIL
44

SMAG–Retail Budget Overview
Approximately one third of WRM pharmaceuticals must be replaced annually because of shelf life or emergence of newer,
more effective treatments. Medical equipment requires constant upgrade to maintain the medical standard of care for
required deployable capability. New technology allows for replacement of equipment with smaller, more proficient models
which often drives a change in other supply requirements. The Air Force ensures airmen and joint war fighters have the
best possible care even in harm’s way by keeping pace with medical device technological advances; however, staying
abreast of these rapid innovations places significant financial burden on medical WRM resources.
SMAG-Retail Customer Base SMAG-R generates revenue from sales of various supplies to a diverse customer base. Primary SMAG-R customers are
Air Force Major Commands (including Air Force Reserve and Air National Guard), Foreign Military Sales, Army, Navy,
Defense Health Program, non-DoD activities, and other working capital activities, such as Air Force Consolidated
Sustainment Activity Group – Maintenance Division.
SMAG–Retail Financial and Performance Summary The table on the next page provides revenue and expense data for the total SMAG-R. Revenue and expenses in FY 2019
reflect an AOR of negative $57.9 million as a result of $137.2 million losses (mostly in GSD). Revenue and expenses rise
consistent with projected workload in FY 2020. The AOR decreases to negative $213.4 million as a result of $155.5 million
NOR loss projected primarily in GSD. Planned NOR of $213.4 million, primarily in GSD, result in an AOR of zero at the end
of FY 2021.
The WRM direct appropriation received is included in the Total Revenue and Expenses balances in all fiscal years. Other
Adjustments (WRM) are completed so Net Operating Results (NOR) reflects only results associated with the Operating
Program, keeping War Reserve Material Program activity NOR neutral.
SUPPLY MANAGEMENT ACTIVITY GROUP - RETAIL
45

SMAG–Retail Budget Overview
Revenue, Expenses and Net Operating Results ($ Millions) FY 2019 FY 2020 FY 2021
Total Revenue $4,303.3 $4,480.4 $5,016.2
Total Expenses $4,338.5 $4,564.8 $4,729.2
Operating Results ($35.2) ($84.4) 287.0
Other Adjustments (WRM) ($102.0) ($71.1) ($73.5)
Net Operating Results ($137.2) ($155.5) 213.4
Non-Recoverable AOR Adjustment $0.0 $0.0 $0.0
Accumulated Operating Results ($57.9) ($213.4) $0.0
Cash Management ($ Millions) FY 2019 FY 2020 FY 2021
BOP Cash Balance $224.0 $146.7 $71.0
Disbursements $4,468.8 $4,563.8 $4,902.2
Collections $4,216.9 $4,395.6 $5,029.8
Net Transfers $97.0 $0.0 $0.0
WRM $77.6 $92.5 $95.7
EOP Cash Balance $146.7 $71.0 $294.2
Lower Range Target $211.8 $211.8 $174.1
Upper Range Target $387.0 $387.0 $351.6
The SMAG-Retail end of year cash balance reflect a downward trend primarily in GSD in FY 2020. Collection cycles are
projected to be 12 per year. The Cash balance for FY 2020 is outside of the lower and upper operating ranges but is within
these ranges in FY 2021.
SUPPLY MANAGEMENT ACTIVITY GROUP - RETAIL
46
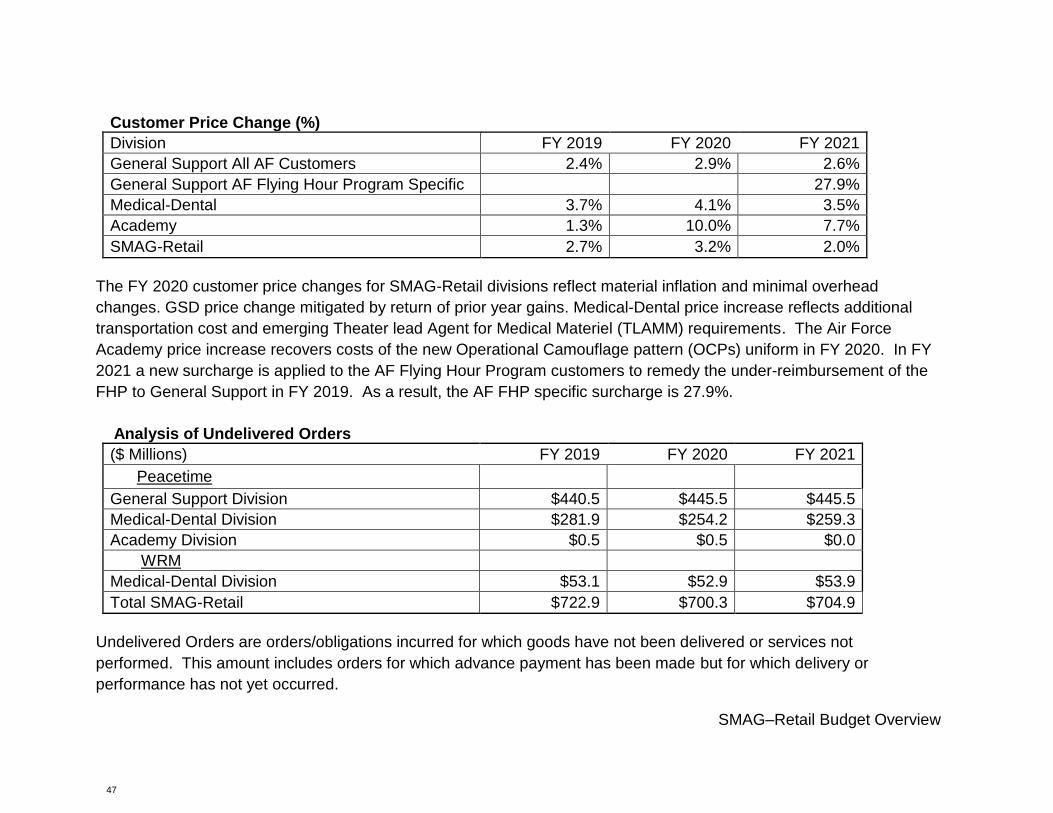
SMAG–Retail Budget Overview
Customer Price Change (%) Division FY 2019 FY 2020 FY 2021
General Support All AF Customers 2.4% 2.9% 2.6%
General Support AF Flying Hour Program Specific 27.9%
Medical-Dental 3.7% 4.1% 3.5%
Academy 1.3% 10.0% 7.7%
SMAG-Retail 2.7% 3.2% 2.0%
The FY 2020 customer price changes for SMAG-Retail divisions reflect material inflation and minimal overhead
changes. GSD price change mitigated by return of prior year gains. Medical-Dental price increase reflects additional
transportation cost and emerging Theater lead Agent for Medical Materiel (TLAMM) requirements. The Air Force
Academy price increase recovers costs of the new Operational Camouflage pattern (OCPs) uniform in FY 2020. In FY
2021 a new surcharge is applied to the AF Flying Hour Program customers to remedy the under-reimbursement of the
FHP to General Support in FY 2019. As a result, the AF FHP specific surcharge is 27.9%.
Analysis of Undelivered Orders
($ Millions) FY 2019 FY 2020 FY 2021
Peacetime
General Support Division $440.5 $445.5 $445.5
Medical-Dental Division $281.9 $254.2 $259.3
Academy Division $0.5 $0.5 $0.0
WRM
Medical-Dental Division $53.1 $52.9 $53.9
Total SMAG-Retail $722.9 $700.3 $704.9
Undelivered Orders are orders/obligations incurred for which goods have not been delivered or services not
performed. This amount includes orders for which advance payment has been made but for which delivery or
performance has not yet occurred.
SUPPLY MANAGEMENT ACTIVITY GROUP - RETAIL
47

SMAG–Retail Budget Overview
GSD aims to limit undelivered orders to 25% of total obligations for inventory replenishment and that target is the basis for
the budget estimates. In FY 2019 GSD met this goal with 14.8%. FY 2020 shows further improvement to 13.6% and FY
2021 is targeted to achieve 13.2%.
The Medical-Dental Division maintains only three - four days’ worth of inventory on hand. It experiences an annual inventory
turnover rate of more than 200 times with most items having a short delivery schedule. Year-to-year increases in
Undelivered Orders are primarily due to inflation of medical materials’ prices for both the operational and WRM programs.
The Air Force Academy Division undelivered orders are fairly stable from one year to the next. Every item issued to cadets
for reimbursement is seasonally scheduled and does not change significantly from one year to the next.
Customer Wait Time
GSD Customer Wait Time (CWT) FY 2019 FY 2020 FY 2021
Actual Performance 10.2
Objective 7.0 7.0 7.0
Customer Wait Time (CWT) is the average number of days accrued from the time a customer orders a spare part until the
part is received. Wait time has increased approximately 5 days from FY 2018. AF and DLA will continue to work together
to find ways to improve supply performance and reduce constraints.
SUPPLY MANAGEMENT ACTIVITY GROUP - RETAIL
48

SMAG–Retail Budget Overview
Supply Management Activity Group Retail
Item Quantity Requirements FY 2019 FY 2020 FY 2021
Number of Issues 9,662,847 9,758,773 9,806,346
Number of Receipts 16,184,381 16,522,344 16,564,783
Number of Requisitions 18,207,949 18,506,637 18,537,973
Contracts Executed 17,001 17,390 17,435
Purchase Inflation 2.92% 2.93% 2.97%
Items Managed 3,633,453 3,634,922 3,634,922
SUPPLY MANAGEMENT ACTIVITY GROUP - RETAIL
49

Fund 11
(Dollars in Millions)
Source of New Orders and Revenue
Air Force Working Capital Fund
Supply Management Activity Group - Retail
Fiscal Year (FY) 2021
Budget Estimates
February 2020
Supply Management Activity Group - Retail
FY2019 FY2020 FY2021
1. New Orders 1. New Orders
a. Orders From DOD Components: a. Orders From DOD Components:
(1) Air Force (1) Air Force
(a) Aircraft Procurement (a) Aircraft Procurement3.091 1.500 1.654
(b) Missile Procurement (b) Missile Procurement.000 .003 (.003)
(c) Other Procurement (c) Other Procurement.310 .682 .000
(d) Military Construction (d) Military Construction.000 .000 .000
(e) Operations & Maintenance - AF (e) Operations & Maintenance - AF1,079.921 1,145.815 1,272.984
(f) Operations & Maintenance - AFRC (f) Operations & Maintenance - AFRC98.895 59.993 67.559
(g) Operations & Maintenance - ANG (g) Operations & Maintenance - ANG195.867 197.925 193.023
(h) Research & Development - AF (h) Research & Development - AF22.056 22.472 23.030
(i) Military Personnel - AF (i) Military Personnel - AF.000 .000 .000
(j) Reserve Personnel - AF (j) Reserve Personnel - AF.750 1.953 2.090
(k) Guard Personnel - ANG (k) Guard Personnel - ANG.109 .700 .366
(l) Family Housing (l) Family Housing .038 .072 .061
(m) Special Trust Funds (m) Special Trust Funds5.948 6.753 7.225
(n) Other Air Force (n) Other Air Force .029 .050 .018
Total Air Force Total Air Force1,407.014 1,437.918 1,568.005
(2) Army (2) Army 6.429 6.227 7.477
(3) Navy (3) Navy 1.740 9.856 8.872
(4) MAP Grant Aid (4) MAP Grant Aid(.002) .002 .003
(5) Other DOD (5) Other DOD1,216.655 1,304.747 1,346.369
Total DOD excluding WCF Total DOD excluding WCF2,631.836 2,758.750 2,930.727
b. Orders From Other Fund Activity Groups b. Orders From Other Fund Activity Groups
(1) Other AF Supply Management Activity Groups (1) Other AF Supply Management Activity Groups(.077) .077 .658
(2) Transportation Activity Group - TRANSCOM (2) Transportation Activity Group - TRANSCOM86.497 107.749 106.774
(3) Consolidated Sustainment Activity Group (Maintenance Div) (3) Consolidated Sustainment Activity Group1,453.208 1,500.457 1,493.851
(4) Other WCF Activity Groups (4) Other WCF Activity Groups.004 (.010) .008
(5) Commissary, Sur. Coll. (5) Commissary, Sur. Coll..000 .001 .001
Total Other Fund Activity Groups Total Other Fund Activity Groups1,539.632 1,608.275 1,601.292
c. Grand Total DOD c. Grand Total DOD4,171.468 4,367.026 4,532.014
Fund 11 Supply Management Activity Group - Retail
SUPPLY MANAGEMENT ACTIVITY GROUP - RETAIL
50

Fund 11
(Dollars in Millions)
Source of New Orders and Revenue
Air Force Working Capital Fund
Supply Management Activity Group - Retail
Fiscal Year (FY) 2021
Budget Estimates
February 2020
Supply Management Activity Group - Retail
FY2019 FY2020 FY2021
d. Other Orders d. Other Orders
(1) Other Federal Agencies (1) Other Federal Agencies2.615 2.159 2.584
(2) Non Federal Agencies (2) Non Federal Agencies(.108) .353 .338
(3) FMS (3) FMS 3.776 4.041 3.997
Total Other Orders Total Other Orders 6.283 6.552 6.919
Total New Gross Orders Total New Gross Orders4,177.751 4,373.578 4,538.938
2. Carry-In Orders (BOP) 2. Carry-In Orders1,218.442 1,124.714 1,065.406
3. Total Gross Orders 3. Total Gross Orders5,396.193 5,498.292 5,604.344
4. Carry-Out Orders (-) (EOP) 4. Carry-Out Orders (EOP)1,124.714 1,065.406 1,024.130
5. Gross Sales (-) 5. Gross Sales (-)4,271.479 4,432.886 4,580.214
6. Credit Returns (-) 6. Credit Returns (-)65.501 59.951 67.249
7. Net Sales 7. Net Sales 4,205.978 4,372.935 4,512.965
Fund 11 Supply Management Activity Group - Retail
SUPPLY MANAGEMENT ACTIVITY GROUP - RETAIL
51
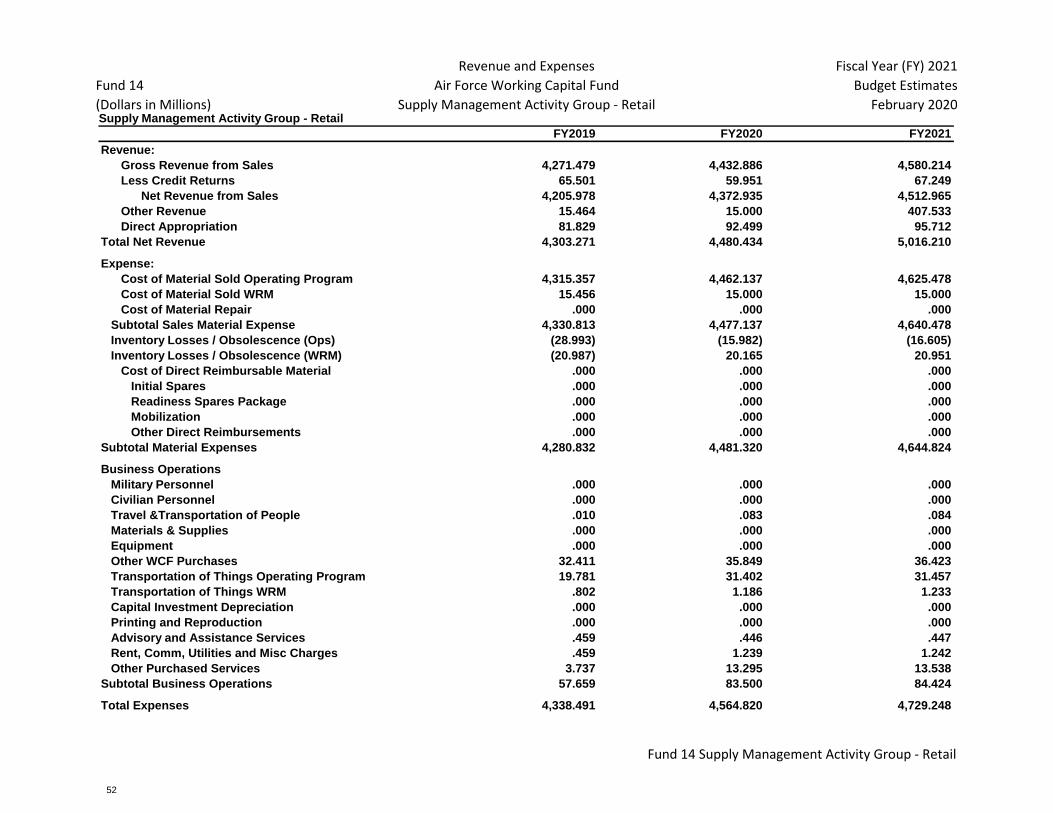
Fund 14
(Dollars in Millions)
Revenue and Expenses
Air Force Working Capital Fund
Supply Management Activity Group - Retail
Fiscal Year (FY) 2021
Budget Estimates
February 2020Supply Management Activity Group - Retail
FY2019 FY2020 FY2021
Revenue:Revenue: Revenue:
Gross Revenue from Sales Gross Revenue from Sales Gross Revenue from Sales4,271.479 4,432.886 4,580.214
Less Credit Returns Less Credit Returns Less Credit Returns65.501 59.951 67.249
Net Revenue from SalesNet Revenue from Sales Net Revenue from Sales4,205.978 4,372.935 4,512.965
Other Revenue Other Revenue Other Revenue15.464 15.000 407.533
Direct Appropriation Direct Appropriation Direct Reimbursables81.829 92.499 95.712
Total Net RevenueTotal Net Revenue Total Net Revenue4,303.271 4,480.434 5,016.210
Expense:Expense: Expense:
Cost of Material Sold Operating Program Cost of Material Sold Operating Program Cost of Material Sold Operating Program4,315.357 4,462.137 4,625.478
Cost of Material Sold WRM Cost of Material Sold WRM Cost of Material Sold WRM15.456 15.000 15.000
Cost of Material Repair Cost of Material Repair Cost of Material Repair.000 .000 .000
Subtotal Sales Material ExpenseSubtotal Sales Material Expense Subtotal Sales Material Expense4,330.813 4,477.137 4,640.478
Inventory Losses / Obsolescence Inventory Losses / Obsolescence (Ops) Inventory Losses / Obsolescence(28.993) (15.982) (16.605)
Inventory Losses / Obsolescence (WRM) Inventory Losses / Obsolescence (WRM) Inventory Losses / Obsolescence (WRM)(20.987) 20.165 20.951
Cost of Direct Reimbursable Material Cost of Direct Reimbursable Material Cost of Direct Reimbursable Material.000 .000 .000
Initial Spares Initial Spares Initial Spares .000 .000 .000
Readiness Spares Package Readiness Spares Package Readiness Spares Package.000 .000 .000
Mobilization Mobilization Mobilization .000 .000 .000
Other Direct Reimbursements Other Direct Reimbursements Other Direct Reimbursements.000 .000 .000
Subtotal Material ExpensesSubtotal Material Expenses Subtotal Material Expenses4,280.832 4,481.320 4,644.824
Business OperationsBusiness Operations Business Operations
Military Personnel Military Personnel Military Personnel.000 .000 .000
Civilian Personnel Civilian Personnel Civilian Personnel.000 .000 .000
Travel &Transportation of People Travel &Transportation of People Travel &Transportation of People.010 .083 .084
Materials & Supplies Materials & Supplies Materials & Supplies.000 .000 .000
Equipment Equipment Equipment .000 .000 .000
Other WCF Purchases Other WCF Purchases Other WCF Purchases32.411 35.849 36.423
Transportation of Things Operating Program Transportation of Things Operating Program Transportation of Things Operating Program19.781 31.402 31.457
Transportation of Things WRM Transportation of Things WRM Transportation of Things WRM.802 1.186 1.233
Capital Investment Depreciation Capital Investment Depreciation Capital Investment Depreciation.000 .000 .000
Printing and Reproduction Printing and Reproduction Printing and Reproduction.000 .000 .000
Advisory and Assistance Services Advisory and Assistance Services Advisory and Assistance Services.459 .446 .447
Rent, Comm, Utilities and Misc Charges Rent, Comm, Utilities and Misc Charges Rent, Comm, Utilities and Misc Charges.459 1.239 1.242
Other Purchased Services Other Purchased Services Other Purchased Services3.737 13.295 13.538
Subtotal Business OperationsSubtotal Business Operations Subtotal Business Operations57.659 83.500 84.424
Total ExpensesTotal Expenses Total Expenses4,338.491 4,564.820 4,729.248
Fund 14 Supply Management Activity Group - Retail
SUPPLY MANAGEMENT ACTIVITY GROUP - RETAIL
52
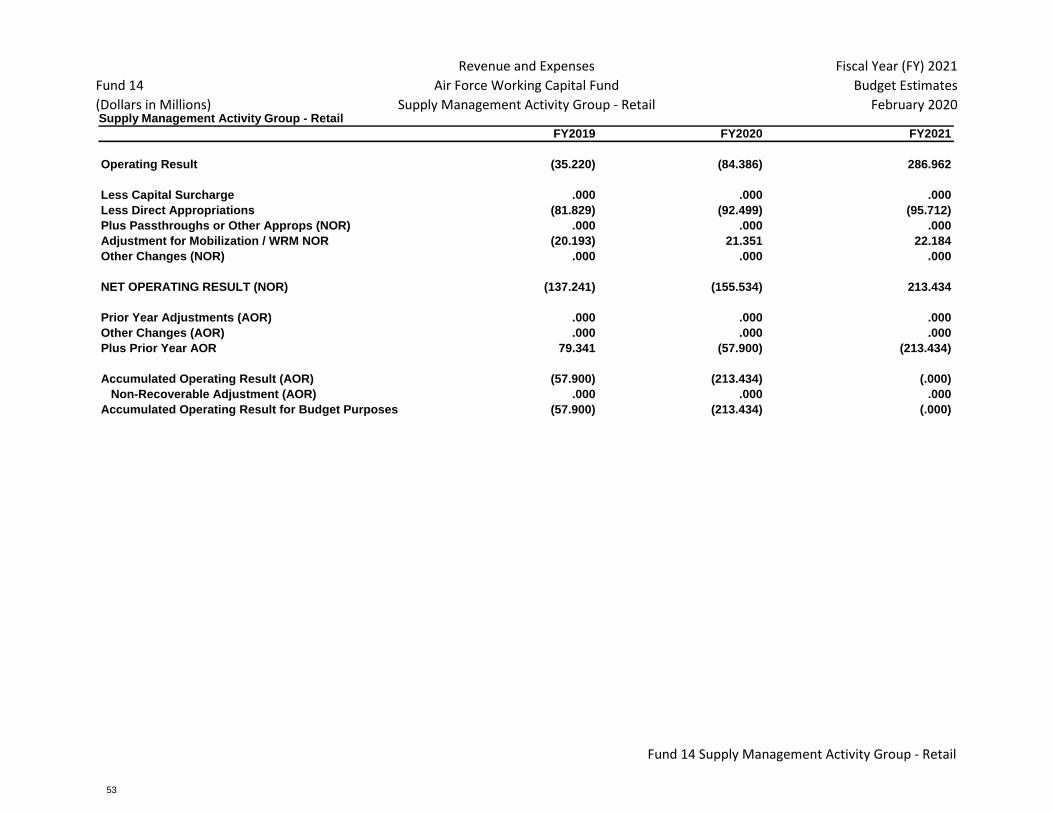
Fund 14
(Dollars in Millions)
Revenue and Expenses
Air Force Working Capital Fund
Supply Management Activity Group - Retail
Fiscal Year (FY) 2021
Budget Estimates
February 2020Supply Management Activity Group - Retail
FY2019 FY2020 FY2021
Operating ResultOperating Result Operating Result(35.220) (84.386) 286.962
Less Capital SurchargeLess Capital Surcharge Less Capital Surcharge.000 .000 .000
Less Direct AppropriationsLess Direct Appropriations Less Direct Appropriations(81.829) (92.499) (95.712)
Plus Passthroughs or Other Approps (NOR)Plus Passthroughs or Other Approps (NOR) Plus Passthroughs or Other Approps (NOR).000 .000 .000
Less Mobilization / WRM (NOR)Adjustment for Mobilization / WRM NOR Mobilization (NOR)(20.193) 21.351 22.184
Other Changes (NOR)Other Changes (NOR) Other Changes (NOR).000 .000 .000
NET OPERATING RESULT (NOR)NET OPERATING RESULT (NOR) NET OPERATING RESULT (NOR)(137.241) (155.534) 213.434
Prior Year Adjustments (AOR)Prior Year Adjustments (AOR) Prior Year Adjustments (AOR).000 .000 .000
Other Changes (AOR)Other Changes (AOR) Other Changes (AOR).000 .000 .000
Plus Prior Year AORPlus Prior Year AOR Plus Prior Year AOR79.341 (57.900) (213.434)
Accumulated Operating Result (AOR)Accumulated Operating Result (AOR) Accumulated Operating Result (AOR)(57.900) (213.434) (.000)
Non-Recoverable Adjustment (AOR) Non-Recoverable Adjustment (AOR) Non-Recoverable Adjustment (AOR).000 .000 .000
Accumulated Operating Result for Budget PurposesAccumulated Operating Result for Budget Purposes Accumulated Operating Result for Budget Purposes(57.900) (213.434) (.000)
Fund 14 Supply Management Activity Group - Retail
SUPPLY MANAGEMENT ACTIVITY GROUP - RETAIL
53

SM-1
(Dollars in Millions)
Supply Management Summary
Air Force Working Capital Fund
Supply Management Activity Group - Retail
Fiscal Year (FY) 2021
Budget Estimates
February 2020
Supply Management Activity Group - Retail
Direct Total
Net Customer WRM Direct Reimbursables Operating Total Capital Variability Target
Orders Net Sales Operating Appn 1
(Initial Spares) Obligations Obligations Target Total
FY2019
GSD GSD Cons 2,962.695 2,975.835 3,082.656 .000 .000 3,082.656 .000 400.000 3,482.656
Med/Dent MDD 1,143.566 1,224.155 1,136.405 92.558 .000 1,228.963 .000 .000 1,228.963
Academy AFA 5.989 5.989 5.839 .000 .000 5.839 .000 .000 5.839
Total SMAG-Retail SMAG-R Master4,112.250 4,205.978 4,224.899 92.558 .000 4,317.457 .000 400.000 4,717.457
FY2020
GSD GSD Cons 3,074.728 3,125.216 3,278.083 .000 .000 3,278.083 .000 400.000 3,678.083
Med/Dent MDD 1,232.136 1,241.406 1,259.671 107.499 .000 1,367.170 .000 .000 1,367.170
Academy AFA 6.763 6.313 6.697 .000 .000 6.697 .000 .000 6.697
Total SMAG-Retail SMAG-R Master4,313.627 4,372.935 4,544.451 107.499 .000 4,651.950 .000 400.000 5,051.950
FY2021
GSD GSD Cons 3,182.998 3,228.155 3,371.775 .000 .000 3,371.775 .000 400.000 3,771.775
Med/Dent MDD 1,281.466 1,277.586 1,329.766 110.712 .000 1,440.478 .000 .000 1,440.478
Academy AFA 7.224 7.224 7.129 .000 .000 7.129 .000 .000 7.129
Total SMAG-Retail SMAG-R Master4,471.689 4,512.965 4,708.670 110.712 .000 4,819.382 .000 400.000 5,219.382
Obligation Targets
1. The WRM Direct Appropriation column above includes obligation targets for the direct appropriation, prior year direct appropriation carryover and replenish/repair WRM
reinvestment (from WRM Sales). The SM-6 exhibit presents detail level data.
SM-1 Supply Management Activity Group - Retail
SUPPLY MANAGEMENT ACTIVITY GROUP - RETAIL
54

SM-4
(Dollars in Millions)
Inventory Status
Air Force Working Capital Fund
Supply Management Activity Group - Retail
Fiscal Year (FY) 2021
Budget Estimates
February 2020
Supply Management Activity Group - Retail
FY2019 Total Mobil Peacetime Operating Peacetime Other
1. Inventory BOP 2,574.497 744.241 1,303.428 526.828
2. BOP Inventory Adjustments
a. Reclassification Change (Memo) .000 .000 .000 .000
b. Price Change Amount (Memo) (26.495) .000 (26.492) (.003)
c. Inv Reclassified & Repriced 2,548.003 744.241 1,276.936 526.825
3. Receipts at MAC 4,492.211 91.800 4,400.411 .000
4. Sales at Standard 4,174.629 15.456 4,159.173 .000
5. Inventory Adjustments
a. Capitalization + or (-) 3.711 5.936 (2.211) (.014)
b. Returns from Customers for Credit .871 .000 .812 .059
c. Returns from Customers w/o Credit 448.669 .668 435.271 12.730
d. Returns to Suppliers (-) (167.430) (.101) (167.300) (.029)
e. Transfers to Property Disposal (-) (1,044.473) (8.534) (1,035.786) (.154)
f. Issues/Receipts w/o Reimbursement 644.765 17.996 626.769 .000
g. Other Adjustments
1. Destruct, Shrink, Deteriorations, etc. (50.720) (36.244) (.917) (13.559)
2. Discounts on Returns (12.446) .000 (12.446) .000
3. Trade-ins .000 .000 .000 .000
4. Loss from Disaster (.096) .000 (.096) .000
5. Assembly/Disassembly (10.478) (1.484) (8.947) (.046)
6. Physical Inventory Adj 9.812 (5.787) 15.610 (.011)
7. Accounting Adjustments 69.931 53.987 8.442 7.501
8. Shipment Discrepancies (289.564) .909 (290.474) .000
9. Other Gains/Losses (.010) (.011) (.317) .317
10. Strata Transfers .000 5.484 (5.776) .292
11. Strata Transfers in Transit 1.633 (20.913) 22.546 .000
12. Other Adjustments - Total (281.938) (4.059) (272.375) (5.505)
h. Total Adjustments (395.825) 11.905 (414.819) 7.089
6. Inventory EOP 2,469.760 832.490 1,103.356 533.914
7. Inventory EOP, Revalued (MAC, Discounted) 2,469.760 832.490 1,103.356 533.914
a. Economic Retention (Memo) 18.800 .000 .000 18.800
b. Contingency Retention (Memo) 395.527 .000 .000 395.527
c. Potential DOD Reutilization (Memo) 116.821 .000 .000 116.821
8. Inventory on Order Cost EOP (Memo) 722.882 53.147 669.735 .000
SM-4 Supply Management Activity Group - Retail
SUPPLY MANAGEMENT ACTIVITY GROUP - RETAIL
55

SM-4
(Dollars in Millions)
Inventory Status
Air Force Working Capital Fund
Supply Management Activity Group - Retail
Fiscal Year (FY) 2021
Budget Estimates
February 2020
Supply Management Activity Group - Retail
FY2020 Total Mobil Peacetime Operating Peacetime Other
1. Inventory BOP 2,469.760 832.490 1,103.356 533.914
2. BOP Inventory Adjustments
a. Reclassification Change (Memo) .000 .000 .000 .000
b. Price Change Amount (Memo) (21.403) 5.102 (26.502) (.002)
c. Inv Reclassified & Repriced 2,448.357 837.592 1,076.853 533.912
3. Receipts at MAC 4,538.317 92.499 4,445.818 .000
4. Sales at Standard 4,552.064 15.000 4,537.064 .000
5. Inventory Adjustments
a. Capitalization + or (-) 13.773 4.127 9.660 (.014)
b. Returns from Customers for Credit .524 .000 .479 .046
c. Returns from Customers w/o Credit 554.138 .580 544.465 9.093
d. Returns to Suppliers (-) (213.472) (.069) (213.391) (.012)
e. Transfers to Property Disposal (-) (425.312) (6.658) (418.522) (.132)
f. Issues/Receipts w/o Reimbursement 353.133 10.192 342.941 .000
g. Other Adjustments
1. Destruct, Shrink, Deteriorations, etc. (36.311) (25.673) (.812) (9.825)
2. Discounts on Returns (65.223) .000 (65.223) .000
3. Trade-ins .000 .000 .000 .000
4. Loss from Disaster .000 .000 .000 .000
5. Assembly/Disassembly (34.930) (.843) (34.074) (.013)
6. Physical Inventory Adj (1.718) (5.294) 3.587 (.012)
7. Accounting Adjustments (65.992) .000 (73.492) 7.500
8. Shipment Discrepancies 23.865 (.000) 23.866 .000
9. Other Gains/Losses (.031) (.010) (.282) .261
10. Strata Transfers 4.714 4.949 (.216) (.019)
11. Strata Transfers in Transit (24.357) (25.979) 1.622 .000
12. Other Adjustments - Total (199.982) (52.850) (145.024) (2.108)
h. Total Adjustments 82.803 (44.677) 120.607 6.872
6. Inventory EOP 2,517.413 870.414 1,106.214 540.784
7. Inventory EOP, Revalued (MAC, Discounted) 2,517.413 870.414 1,106.214 540.784
a. Economic Retention (Memo) 18.800 .000 .000 18.800
b. Contingency Retention (Memo) 395.527 .000 .000 395.527
c. Potential DOD Reutilization (Memo) 116.821 .000 .000 116.821
8. Inventory on Order Cost EOP (Memo) 700.273 52.881 647.392 .000
SM-4 Supply Management Activity Group - Retail
SUPPLY MANAGEMENT ACTIVITY GROUP - RETAIL
56

SM-4
(Dollars in Millions)
Inventory Status
Air Force Working Capital Fund
Supply Management Activity Group - Retail
Fiscal Year (FY) 2021
Budget Estimates
February 2020
Supply Management Activity Group - Retail
FY2021 Total Mobil Peacetime Operating Peacetime Other
1. Inventory BOP 2,517.413 870.414 1,106.214 540.784
2. BOP Inventory Adjustments
a. Reclassification Change (Memo) .000 .000 .000 .000
b. Price Change Amount (Memo) (21.386) 5.153 (26.537) (.002)
c. Inv Reclassified & Repriced 2,496.026 875.567 1,079.677 540.782
3. Receipts at MAC 4,696.906 95.712 4,601.194 .000
4. Sales at Standard 4,622.806 15.000 4,607.806 .000
5. Inventory Adjustments
a. Capitalization + or (-) 13.814 4.169 9.659 (.014)
b. Returns from Customers for Credit .530 .000 .483 .046
c. Returns from Customers w/o Credit 554.349 .586 544.579 9.184
d. Returns to Suppliers (-) (213.475) (.070) (213.393) (.012)
e. Transfers to Property Disposal (-) (425.581) (6.924) (418.523) (.134)
f. Issues/Receipts w/o Reimbursement 353.314 10.294 343.020 .000
g. Other Adjustments
1. Destruct, Shrink, Deteriorations, etc. (37.108) (26.700) (.845) (9.564)
2. Discounts on Returns (65.223) .000 (65.223) .000
3. Trade-ins .000 .000 .000 .000
4. Loss from Disaster .000 .000 .000 .000
5. Assembly/Disassembly (34.939) (.852) (34.074) (.013)
6. Physical Inventory Adj (1.771) (5.347) 3.587 (.012)
7. Accounting Adjustments (65.992) .000 (73.492) 7.500
8. Shipment Discrepancies 23.865 (.000) 23.865 .000
9. Other Gains/Losses (.031) (.010) (.285) .263
10. Strata Transfers 4.761 4.998 (.218) (.019)
11. Strata Transfers in Transit (24.600) (26.239) 1.638 .000
12. Other Adjustments - Total (201.039) (54.149) (145.046) (1.844)
h. Total Adjustments 81.913 (46.093) 120.780 7.226
6. Inventory EOP 2,652.039 910.186 1,193.846 548.008
7. Inventory EOP, Revalued (MAC, Discounted) 2,652.039 910.186 1,193.846 548.008
a. Economic Retention (Memo) 18.800 .000 .000 18.800
b. Contingency Retention (Memo) 395.527 .000 .000 395.527
c. Potential DOD Reutilization (Memo) 116.821 .000 .000 116.821
8. Inventory on Order Cost EOP (Memo) 704.858 53.938 650.919 .000
SM-4 Supply Management Activity Group - Retail
SUPPLY MANAGEMENT ACTIVITY GROUP - RETAIL
57

SM-6
(Dollars in Millions)
War Reserve Material
Air Force Working Capital Fund
Supply Management Activity Group - Retail
Fiscal Year (FY) 2021
Budget Estimates
February 2020
Supply Management Activity Group - Retail
FY2019
STOCKPILE STATUS Total WRM Protected WRM Other
1. Inventory BOP @ std 1. Inventory BOP @ std 744.241 744.241 .000
2. Price Change 2. Price Change .000 .000 .000
3. Reclassification 3. Reclassification .000 .000 .000
4. Inventory Changes 4. Inventory Changes 88.249 88.249 .000
a. Receipts @ std a. Receipts @ std 92.467 92.467 .000
(1). Purchases (1). Purchases 91.800 91.800 .000
(2). Returns from customers (2). Returns from customers.668 .668 .000
b. Issues @ std b. Issues @ std (24.092) (24.092) .000
(1). Sales (1). Sales (15.456) (15.456) .000
(2). Returns to suppliers (2). Returns to suppliers(.101) (.101) .000
(3). Disposals (3). Disposals (8.534) (8.534) .000
c. Adjustments @ std c. Adjustments @ std 19.873 19.873 .000
(1). Capitalizations (1). Capitalizations 5.936 5.936 .000
(2). Gains and losses (2). Gains and losses 17.996 17.996 .000
(3). Other (3). Other (4.059) (4.059) .000
Inventory EOP Inventory EOP 832.490 832.490 .000
STOCKPILE COSTS
1. Storage 1. Storage .000
2. Management 2. Management .000
3. Maintenance/Other 3. Maintenance/Other .000
Total Cost Total Cost .000
WRM BUDGET REQUEST
1. Obligations @ cost 1. Obligations @ cost
a. Additional WRM Investment a. Additional WRM Investment
i. Current Year (Direct Appropriation) i. Current Year (Direct Appropriation)77.644
ii. Prior Year ii. Prior Year .000
b. Replen/Repair WRM -Reinvest (from Prior Year WRM Sales) b. Replen/Repair WRM -Reinvest (from Prior Year WRM Sales)14.914
c. Stock Rotation/Obsolescence c. Stock Rotation/Obsolescence.000
d. Assemble/Disassemble d. Assemble/Disassemble.000
e. Other e. Other .000
Total Request Total Request 92.558
SM-6 Supply Management Activity Group - Retail
SUPPLY MANAGEMENT ACTIVITY GROUP - RETAIL
58

SM-6
(Dollars in Millions)
War Reserve Material
Air Force Working Capital Fund
Supply Management Activity Group - Retail
Fiscal Year (FY) 2021
Budget Estimates
February 2020
Supply Management Activity Group - Retail
FY2020
STOCKPILE STATUS Total WRM Protected WRM Other
1. Inventory BOP @ std 1. Inventory BOP @ std 832.490 832.490 .000
2. Price Change 2. Price Change 5.102 5.102 .000
3. Reclassification 3. Reclassification .000 .000 .000
4. Inventory Changes 4. Inventory Changes 32.822 32.822 .000
a. Receipts @ std a. Receipts @ std 93.079 93.079 .000
(1). Purchases (1). Purchases 92.499 92.499 .000
(2). Returns from customers (2). Returns from customers.580 .580 .000
b. Issues @ std b. Issues @ std (21.727) (21.727) .000
(1). Sales (1). Sales (15.000) (15.000) .000
(2). Returns to suppliers (2). Returns to suppliers(.069) (.069) .000
(3). Disposals (3). Disposals (6.658) (6.658) .000
c. Adjustments @ std c. Adjustments @ std (38.530) (38.530) .000
(1). Capitalizations (1). Capitalizations 4.127 4.127 .000
(2). Gains and losses (2). Gains and losses 10.192 10.192 .000
(3). Other (3). Other (52.850) (52.850) .000
Inventory EOP Inventory EOP 870.414 870.414 .000
STOCKPILE COSTS
1. Storage 1. Storage .000
2. Management 2. Management .000
3. Maintenance/Other 3. Maintenance/Other .000
Total Cost Total Cost .000
WRM BUDGET REQUEST
1. Obligations @ cost 1. Obligations @ cost
a. Additional WRM Investment a. Additional WRM Investment
i. Current Year (Direct Appropriation) i. Current Year (Direct Appropriation)92.499
ii. Prior Year ii. Prior Year .000
b. Replen/Repair WRM -Reinvest (from Prior Year WRM Sales) b. Replen/Repair WRM -Reinvest (from Prior Year WRM Sales)15.000
c. Stock Rotation/Obsolescence c. Stock Rotation/Obsolescence.000
d. Assemble/Disassemble d. Assemble/Disassemble.000
e. Other e. Other .000
Total Request Total Request 107.499
SM-6 Supply Management Activity Group - Retail
SUPPLY MANAGEMENT ACTIVITY GROUP - RETAIL
59

SM-6
(Dollars in Millions)
War Reserve Material
Air Force Working Capital Fund
Supply Management Activity Group - Retail
Fiscal Year (FY) 2021
Budget Estimates
February 2020
Supply Management Activity Group - Retail
FY2021
STOCKPILE STATUS Total WRM Protected WRM Other
1. Inventory BOP @ std 1. Inventory BOP @ std 870.414 870.414 .000
2. Price Change 2. Price Change 5.153 5.153 .000
3. Reclassification 3. Reclassification .000 .000 .000
4. Inventory Changes 4. Inventory Changes 34.619 34.619 .000
a. Receipts @ std a. Receipts @ std 96.298 96.298 .000
(1). Purchases (1). Purchases 95.712 95.712 .000
(2). Returns from customers (2). Returns from customers.586 .586 .000
b. Issues @ std b. Issues @ std (21.994) (21.994) .000
(1). Sales (1). Sales (15.000) (15.000) .000
(2). Returns to suppliers (2). Returns to suppliers(.070) (.070) .000
(3). Disposals (3). Disposals (6.924) (6.924) .000
c. Adjustments @ std c. Adjustments @ std (39.685) (39.685) .000
(1). Capitalizations (1). Capitalizations 4.169 4.169 .000
(2). Gains and losses (2). Gains and losses 10.294 10.294 .000
(3). Other (3). Other (54.149) (54.149) .000
Inventory EOP Inventory EOP 910.186 910.186 .000
STOCKPILE COSTS
1. Storage 1. Storage .000
2. Management 2. Management .000
3. Maintenance/Other 3. Maintenance/Other .000
Total Cost Total Cost .000
WRM BUDGET REQUEST
1. Obligations @ cost 1. Obligations @ cost
a. Additional WRM Investment a. Additional WRM Investment
i. Current Year (Direct Appropriation) i. Current Year (Direct Appropriation)95.712
ii. Prior Year ii. Prior Year .000
b. Replen/Repair WRM -Reinvest (from Prior Year WRM Sales) b. Replen/Repair WRM -Reinvest (from Prior Year WRM Sales)15.000
c. Stock Rotation/Obsolescence c. Stock Rotation/Obsolescence.000
d. Assemble/Disassemble d. Assemble/Disassemble.000
e. Other e. Other .000
Total Request Total Request 110.712
SM-6 Supply Management Activity Group - Retail
SUPPLY MANAGEMENT ACTIVITY GROUP - RETAIL
60

AIR FORCE
WORKING CAPITAL FUND
UNITED STATES
TRANSPORTATION COMMAND
TRANSPORTATION WORKING CAPITAL FUND
61

THIS PAGE INTENTIONALLY LEFT BLANK
TRANSPORTATION WORKING CAPITAL FUND
62

TWCF Budget Analysis Overview
United States Transportation Command Transportation Working Capital Fund Fiscal Year (FY) 2021 Budget Analysis
Background
This submission provides justification for the United States Transportation Command (USTRANSCOM) Transportation Working Capital Fund (TWCF) budget. USTRANSCOM submits the TWCF budget as a distinct subset of the Air Force Working Capital Fund (AFWCF) budget submission. It reflects the cost authority needed to meet USTRANSCOM’s Unified Command Plan (UCP) mission. With global responsibilities and capabilities that transcend air, land, and sea, USTRANSCOM is uniquely postured to fulfill five specific responsibilities within the 2017 UCP that include: 1) the DOD’s Single Manager for Transportation, 2) the Mobility Joint Force Provider, 3) the DOD Single Manager for Global Patient Movement (GPM), 4) the Joint Deployment and Distribution Coordinator (JDDC) for the Joint Deployment and Distribution Enterprise (JDDE), and 5) the provider for Joint Enabling Capabilities via the Joint Enabling Capabilities Command (JECC) (JECC is not part of the Working Capital Fund). USTRANSCOM and the broader JDDE are designed to project and sustain military forces around the world. We conduct globally integrated mobility operations through dynamic synchronization of: (1) global deployment networks; (2) a global command and control and integration construct to dynamically allocate resources for our Nation’s strategic priorities; and (3) transportation and mobility capacity operating across air, land, and sea. From day-to-day operations through wartime mobilization, commercial nodes, rail infrastructure, trucks, aviation, and sealift capabilities are integral to USTRANSCOM’s ability to respond and scale to need. To maintain a strategic comparative advantage, we have three top mobility concerns to fulfill National Defense Strategy (NDS) mission requirements: 1) readiness of the U.S. Navy’s aging sealift fleet, 2) readiness and capacity of the U.S. Air Force’s air refueling platforms, and 3) cyber domain mission assurance. Capital funding continues to support system enhancements and upgrades to embrace USTRANSCOM’s role as a global Combatant Command delivering national objectives in tomorrow’s dynamic security environment. USTRANSCOM challenges its assumptions, accurately forecasts trends that will define the future operating environment, and develops the technologies and ideas that maintain our Nation’s competitive advantage in transportation and logistics.
TRANSPORTATION WORKING CAPITAL FUND
63

TWCF Budget Analysis Overview
USTRANSCOM is working with military services and is committed to improving the relocation process for military members and families. In support of the DOD reform initiative, USTRANSCOM is exploring a centralized acquisition approach that would transition the Defense Personal Property Program (DP3) to a single move manager. This concept will improve capacity and curbside service by incentivizing long-term investment by industry, reduce barriers to entry into DOD markets, and establish clear accountability and transparency. The Nation relies on USTRANSCOM to project an immediate and decisive force when needed and continues to adapt to the most complex security environment in recent history. USTRANSCOM provides our Nation’s leaders with various options while presenting multiple dilemmas for potential adversaries. Composition of Component Business Areas
USTRANSCOM’s mission includes providing air, land, and sea transportation for the DoD with a primary focus on wartime readiness. Our $8.8 billion budget provides synchronized transportation and sustainment, making it possible to project and maintain national power where needed, with the greatest speed and agility, the highest efficiency, and the most reliable level of trust and accuracy. We accomplish our joint transportation mission through three Transportation Component Commands - Air Mobility Command (AMC), Military Sealift Command (MSC), and Military Surface Deployment and Distribution Command (SDDC). This joint team of transportation components provides mobility forces and assets for a seamless transition from peace to war. USTRANSCOM is always ready to meet the strategic mobility needs of our nation. A brief description of the role of each Transportation Component Command follows:
Air Mobility Command is the single manager for air mobility by providing airlift, air refueling, special air mission, and aeromedical evacuation for U.S. forces. AMC also supplies forces to theater commands to support wartime tasking.
Military Sealift Command supports our nation by providing marine transportation to satisfy DoD sealift requirements, including, delivering supplies and conducting specialized missions across the world’s oceans.
Surface Deployment and Distribution Command provides global surface deployment and distribution services to meet the nation’s objectives.
TRANSPORTATION WORKING CAPITAL FUND
64

TWCF Budget Analysis Overview
Our Component Commands provide the critical link to the Services’ core competencies in organizing, training, and equipping forces. They provide lines of communication to the Services, ensuring assets are available when needed for the transition from peace to war. The surge from peacetime sustainment to a massive deployment of people and material in support of OCO is an example of our ability to execute our mission. Our successes result from the synergy of military and commercial lift (air, land, and sea), air refueling, port operations, and afloat prepositioning - all requiring the team efforts of the Commander’s Staff and our components. Together with its components and national partners, USTRANSCOM is building a truly seamless, end-to-end defense transportation enterprise.
Costs
COST ($ IN MILLIONS) FY 2019 FY 2020 FY 2021
AMC 5,247 5,584 5,723
SDDC 1,353 1,629 1,646
MSC 898 881 966
Defense Courier Division (DCD) 6 8 8
USTRANSCOM Command Staff 371 480 465
Total $7,875 $8,582 $8,808
FY 2020 in the FY 2020 PB to FY 2020 Current Estimate in the FY 2021 PB:
Total USTRANSCOM: Cost increased in FY 2020 by $585 million, major changes are listed below: $742 million – Customer workload changes $38 million – Pricing changes (commercial transportation and general purchase inflation offset by fuel) $34 million – Facility maintenance (AMC ramps and passenger/\cargo terminals, Military Ocean Terminal,
Concord (MOTCO)) $21 million – Other (includes migration to cloud) ($250) million – Aircraft maintenance
TRANSPORTATION WORKING CAPITAL FUND
65

TWCF Budget Analysis Overview
FY 2020 in the FY 2021 PB to FY 2021 in the FY 2021 PB: Total USTRANSCOM: Cost increased in FY 2021 by $226 million, major changes are listed below: $94 million – Command initiatives (Transportation Mgmt. System, Cloud, Enterprise Data Analytic Environment) $64 million – Aircraft maintenance $63 million – Pricing changes (Commercial transportation, aircraft maintenance, depot level repairables,
general purchase inflation offset by fuel) $46 million – Customer workload changes $12 million – Facility maintenance (AMC Ramps and Passenger/Cargo Terminals) ($46) million – Ship maintenance ($7) million – Other
Revenue
REVENUE ($ IN MILLIONS)
FY 2019
FY 2020
FY 2021
AMC 5,044 5,375 5,546
SDDC 1,351 1,822 1,492
MSC 798 975 1,037
DCD 6 4 5
USTRANSCOM Command Staff 376 430 542
Total $7,575 $8,606 $8,622
Revenue: Revenue estimates are derived by using approved rates multiplied by various workload measures (i.e., flying hours, ton miles, passenger miles, ship days, measurement tons, and vehicles). Because USTRANSCOM’s channel airlift rates are set to compete with private sector rates, rates do not cover the cost of the unique readiness requirements of military airlift operations. The FY 2021 revenue is based on known and anticipated orders, primarily from DoD, and where mutually advantageous, from non-DoD customers.
TRANSPORTATION WORKING CAPITAL FUND
66

TWCF Budget Analysis Overview
Disbursements, Collections, and Net Outlays
($ IN MILLIONS)
FY 2019
FY 2020
FY 2021
Disbursements 7,782 8,720 8,394
Collections 7,724 8,855 8,370
Net Outlays 58 -135 24
Ending Cash Balance 469 604 579
Cash Lower Boundary 538 618 582
Cash Upper Boundary 1,030 1,289 1,228
FY 2020 USTRANSCOM CASH: The FY 2020 cash is projected to increase from $469 million to $604 million due to increased rates, and increased workload. USTRANSCOM cash balance is projected to be within operating range. FY 2021 USTRANSCOM CASH: The FY 2021 cash is projected to decrease from $604 million to $579 million due to decreased workload. USTRANSCOM cash balance is projected to be within operating range.
TRANSPORTATION WORKING CAPITAL FUND
67

TWCF Budget Analysis Overview
Customer Rate Changes
AMC RATE CHANGES
FY 2020
FY 2021
Channel Passenger 2.0% 2.0%
Channel Cargo 2.0% 2.0%
SAAM/JETP 17.0% -5.2%
Training 19.4% -6.6%
MSC RATE CHANGES
FY 2020
FY 2021
Petroleum Tankerships 8.0% -34.0%
Surge ROS 82.8% 19.0%
Army Afloat Prepositioning 28.0% -5.0%
Air Force Afloat Prepositioning 18.0% 8.0%
Chartered Cargo -10.6% -73.0%
SDDC RATE CHANGES
FY 2020
FY 2021
Port Operations 38.0% -27.0%
Defense Personal Property Program (DP3) 29.8% -2.9%
Liner Ocean Transportation 17.3% -20.6%
DCD RATE CHANGES
FY 2020
FY 2021
Pounds Delivered -19.4% 13.3%
TRANSPORTATION WORKING CAPITAL FUND
68

TWCF Budget Analysis Overview
Capital Investment Program (CIP) This budget enables USTRANSCOM to continue system enhancements and upgrades to embrace its role as a global Combatant Command delivering national objectives in tomorrow’s dynamic security environment. USTRANSCOM continues to challenge its assumptions, accurately forecast trends that will define the future operating environment, and develop the technologies and ideas that maintain our Nation’s competitive advantage in transportation and logistics. CIP includes investment in Equipment, Automated Data Processing Equipment (ADPE) and Telecommunications Equipment, Software Development, and Minor Construction. The CIP enables the JDDC to rapidly produce or modify software/ADPE applications to meet emerging distribution portfolio requirements, with efforts such as Consolidate Air Mobility Planning System (CAMPS), Defense Personal Property System (DPS), and Integrated Booking System (IBS).
CAMPS continues the agile acquisition approach to ongoing development and modernization of Airlift Requirements, Airlift Planning, Barrel Master, Iterative Planning, Enterprise Service Integration, and Mission Scheduling Service.
DPS continues to define, develop, test, and deploy capabilities using agile software methodology for the MilMove prototype. The program plans to demonstrate the effectiveness and efficiency of a significant number of CONUS household moves starting in FY21.
IBS continues to transform into an agile suite of business services replacing the legacy system. The development includes migrating to the cloud with a process-model driven application. This will significantly reduce time to deliver system change requests and expedite solutions to meet user requirements, while also implementing new rates to support the Universal Service Contract 9 (USC9) and Guantanamo Bay, Cuba Contracts.
Multiple programs are transitioning to commercial cloud and include the cost of shifting applications and big data to a cloud environment.
CIP ($ IN MILLIONS) FY 2019 FY 2020 FY 2021
Equipment 2.3 0.9 1.0
ADPE and Telecom Equip 20.0 8.4 6.8
Software Development 57.0 33.6 49.3
Minor Construction 6.3 7.3 11.2
Total 85.6 50.2 68.3
TRANSPORTATION WORKING CAPITAL FUND
69

TWCF Budget Analysis Overview
Manpower Trends
USTRANSCOM’s staffing is comprised of approximately 75 percent military and 25 percent civilian. The efficient use of manpower for our components is integral to the success of USTRANSCOM’s mission.
Military End Strength and Workyears*
FY 2019
FY 2020
FY 2021
Army 221 213 216
Navy 154 155 153
Marine Corps 12 12 13
Air Force 11,949 11,950 12,027
Total Military End Strength 12,336 12,330 12,409
Total Military Work-years 12,539 12,102 12,212
*Includes AMC and DCD military end strengths/work-years which are funded by Military Personnel appropriation and not recovered in rates per FMR Volume 11B, Chapter 14
Civilian End Strength
FY 2019
FY 2020
FY 2021
U.S. Direct Hire 3,419 3,865 3,921
Foreign National Direct Hire 256 287 287
Foreign National Indirect Hire 271 304 304
Total Civilian End Strength 3,946 4,456 4,512
TRANSPORTATION WORKING CAPITAL FUND
70
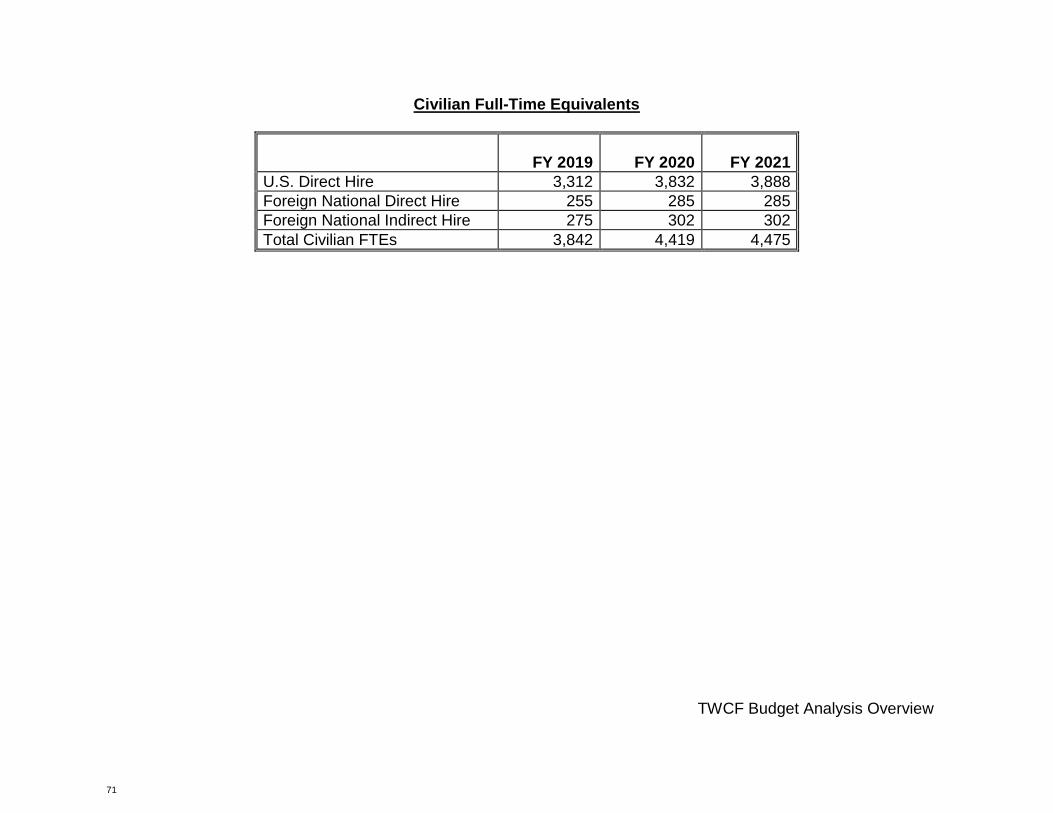
TWCF Budget Analysis Overview
Civilian Full-Time Equivalents
FY 2019
FY 2020
FY 2021
U.S. Direct Hire 3,312 3,832 3,888
Foreign National Direct Hire 255 285 285
Foreign National Indirect Hire 275 302 302
Total Civilian FTEs 3,842 4,419 4,475
TRANSPORTATION WORKING CAPITAL FUND
71

Fund 2
(Dollars in Millions)
Changes in the Cost of Operations
Air Force Working Capital Fund
Transportation Working Capital Fund (TWCF)
Fiscal Year (FY) 2021
Budget Estimates
February 2020
United States Transportation Command
Expenses
FY2019 Estimated Actuals $7,875.1
FY2020 Estimate in President's Budget $7,996.4
Estimated Impact in FY2020 Actual FY2019 Experience $0.0
Pricing Adjustments: $38.3
a. FY2020 Pay Raises $12.6
(1) Civilian Personnel $12.6
(2) Military Personnel $0.0
b. Annualization of Prior Year Pay Raises $1.2
(1) Civilian Personnel $1.2
(2) Military Personnel $0.0
c. Fuel Pricing ($11.4)
d. General Purchase Inflation $8.1
e. Depot Level Repairables Changes $0.0
f. Commercial Transportation Pricing Changes $27.8
g. Aircraft Maintenance Price changes $0.0
Productivity Initiatives & Other Efficiencies: $0.0
a. Headquarters Reductions $0.0
Program Changes: $546.9
a. Aircraft Maintenance Changes ($249.4)
b. Other $20.7
c. Workload Changes $741.6
d. Ship Maintenance Changes $0.0
e. Container Detention changes $0.0
f. Facility Maintenance $34.0
g. Command Initiatives $0.0
FY2020 Current Estimate $8,581.6
Fund 2 United States Transportation Command
TRANSPORTATION WORKING CAPITAL FUND
72

Fund 2
(Dollars in Millions)
Changes in the Cost of Operations
Air Force Working Capital Fund
Transportation Working Capital Fund (TWCF)
Fiscal Year (FY) 2021
Budget Estimates
February 2020
United States Transportation Command
Expenses
FY2020 Current Estimate $8,581.6
Pricing Adjustments: $63.3
a. FY2021 Pay Raises $3.0
(1) Civilian Personnel $2.6
(2) Military Personnel $0.4
b. Annualization of Prior Year Pay Raises $5.0
(1) Civilian Personnel $5.0
(2) Military Personnel $0.0
c. General Purchase Inflation $26.0
d. Aircraft Maintenance Changes $17.6
e. Commercial Transportation Pricing Changes $46.8
f. Depot Level Repairables Changes $13.4
g. Fuel Pricing ($48.5)
Productivity Initiatives & Other Efficiencies: $0.0
a. Fuel Efficiencies due to Information Technology Initiatives $0.0
b. Fuel Effieciencies due to Policy $0.0
c. Cost Efficiencies $0.0
d. Headquarters Reductions $0.0
Program Changes: $163.2
a. Other ($6.7)
b. Aircraft Maintenance Changes $63.9
c. Workload Changes $45.8
d. Ship Maintenance Changes ($46.1)
e. Facility Maintenance $12.4
f. Command Initiatives $93.9
FY2021 Estimate $8,808.1
Fund 2 United States Transportation Command
TRANSPORTATION WORKING CAPITAL FUND
73
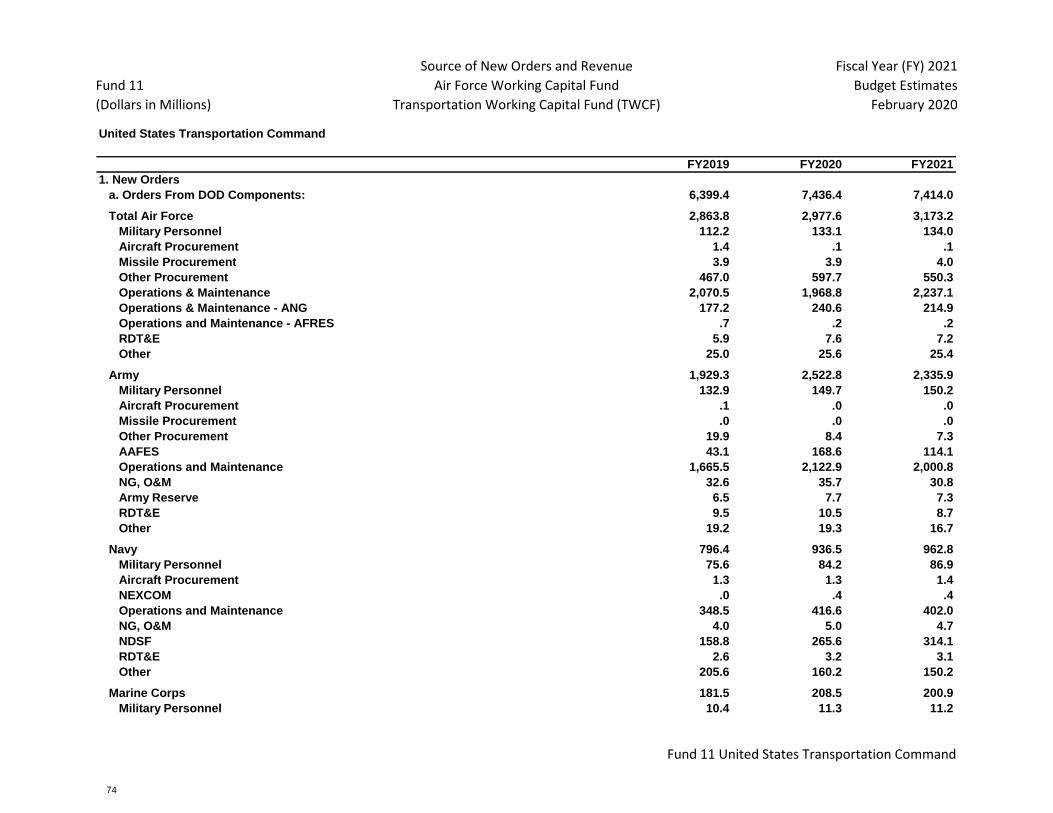
Fund 11
(Dollars in Millions)
Source of New Orders and Revenue
Air Force Working Capital Fund
Transportation Working Capital Fund (TWCF)
Fiscal Year (FY) 2021
Budget Estimates
February 2020
United States Transportation Command
FY2019 FY2020 FY2021
1. New Orders 1. New Orders
a. Orders From DOD Components: a. Orders From DOD Components: 6,399.4 7,436.4 7,414.0
Total Air Force Total Air Force 2,863.8 2,977.6 3,173.2
Military Personnel Military Personnel - AF 112.2 133.1 134.0
Aircraft Procurement Aircraft Procurement 1.4 .1 .1
Missile Procurement Missile Procurement 3.9 3.9 4.0
Other Procurement Other Procurement 467.0 597.7 550.3
Operations & Maintenance Operations & Maintenance - AF 2,070.5 1,968.8 2,237.1
Operations & Maintenance - ANG Operations & Maintenance - ANG 177.2 240.6 214.9
Operations and Maintenance - AFRES AFRES .7 .2 .2
RDT&E RDT&E - Air Force 5.9 7.6 7.2
Other Other - Air Force 25.0 25.6 25.4
Army Army 1,929.3 2,522.8 2,335.9
Military Personnel Military Personnel - Army 132.9 149.7 150.2
Aircraft Procurement Aircraft Procurement - Army .1 .0 .0
Missile Procurement Missile Procurement - Army .0 .0 .0
Other Procurement Other Procurement - Army 19.9 8.4 7.3
AAFES AAFES 43.1 168.6 114.1
Operations and Maintenance Operations and Maintenance - Army 1,665.5 2,122.9 2,000.8
NG, O&M NG, O&M - Army 32.6 35.7 30.8
Army Reserve Army Reserve 6.5 7.7 7.3
RDT&E RDT&E - Army 9.5 10.5 8.7
Other Other - Army 19.2 19.3 16.7
Navy Navy 796.4 936.5 962.8
Military Personnel Military Personnel - Navy 75.6 84.2 86.9
Aircraft Procurement Aircraft Procurement - Navy 1.3 1.3 1.4
NEXCOM NEXCOM .0 .4 .4
Operations and Maintenance Operations and Maintenance - Navy 348.5 416.6 402.0
NG, O&M NG, O&M - Navy 4.0 5.0 4.7
NDSF NDSF 158.8 265.6 314.1
RDT&E RDT&E - Navy 2.6 3.2 3.1
Other Other - Navy 205.6 160.2 150.2
Marine Corps Marine Corps 181.5 208.5 200.9
Military Personnel Military Personnel - Marines 10.4 11.3 11.2
Fund 11 United States Transportation Command
TRANSPORTATION WORKING CAPITAL FUND
74

Fund 11
(Dollars in Millions)
Source of New Orders and Revenue
Air Force Working Capital Fund
Transportation Working Capital Fund (TWCF)
Fiscal Year (FY) 2021
Budget Estimates
February 2020
United States Transportation Command
FY2019 FY2020 FY2021
MCEX MCEX .0 .0 .0
Operations and Maintenance Operations and Maintenance - Marines 166.2 191.3 184.1
Other Other - Marines 4.9 5.9 5.6
OSD OSD 628.4 791.0 741.2
Operations and Maintenance Operations and Maintenance - OSD 568.6 713.6 670.8
JCS Operations and Maintenance - JCS 59.7 101.8 99.7
SOCOM Operations and Maintenance - SOCOM 443.0 540.7 516.5
Health Affairs Operations and Maintenance - Health Affairs 32.0 36.2 35.0
NSA Operations and Maintenance - NSA 2.2 2.2 2.3
DIA Operations and Maintenance - DIA .0 .0 .0
DMA Operations and Maintenance - DMA .0 .0 .0
Other Operations and Maintenance - Other 31.7 31.7 16.2
DLA (Non-WCF) Operations and Maintenance - DLA (Non-WCF) .0 1.0 1.1
DTS-PMO Operations and Maintenance - DTS-PMO .0 .0 .0
DSCA Operations and Maintenance - DSCA .0 .0 .0
Procurement Procurement - OSD .3 1.1 1.1
Other Other - OSD 59.5 76.3 69.3
b. Orders From Other Fund Activity Groups b. Orders From Other Fund Activity Groups 901.7 899.8 979.6
DECA DECA 8.0 10.5 8.9
DLA DLA 253.2 153.9 89.0
Other Orders Other Orders 640.5 735.4 881.7
c. Total DOD c. Grand Total DOD 7,301.1 8,336.2 8,393.6
d. Other Orders d. Other Orders 273.6 270.2 228.3
Other Federal Agencies Other Federal Agencies 19.5 22.7 21.6
Trust Fund Trust Fund .0 .0 .0
Non Federal Agencies Non Federal Agencies 33.6 46.5 39.0
Foreign Military Sales FMS 220.5 201.0 167.7
Total New Orders Total New Orders 7,574.7 8,606.4 8,621.9
2. Carry-In Orders 2. Carry-In Orders .0 .0 .0
3. Total Gross Orders 3. Total Gross Orders 7,574.7 8,606.4 8,621.9
4. Funded Carryover 4. Funded Carryover .0 .0 .0
5. Total Gross Sales 5. Total Gross Sales 7,574.7 8,606.4 8,621.9
Fund 11 United States Transportation Command
TRANSPORTATION WORKING CAPITAL FUND
75
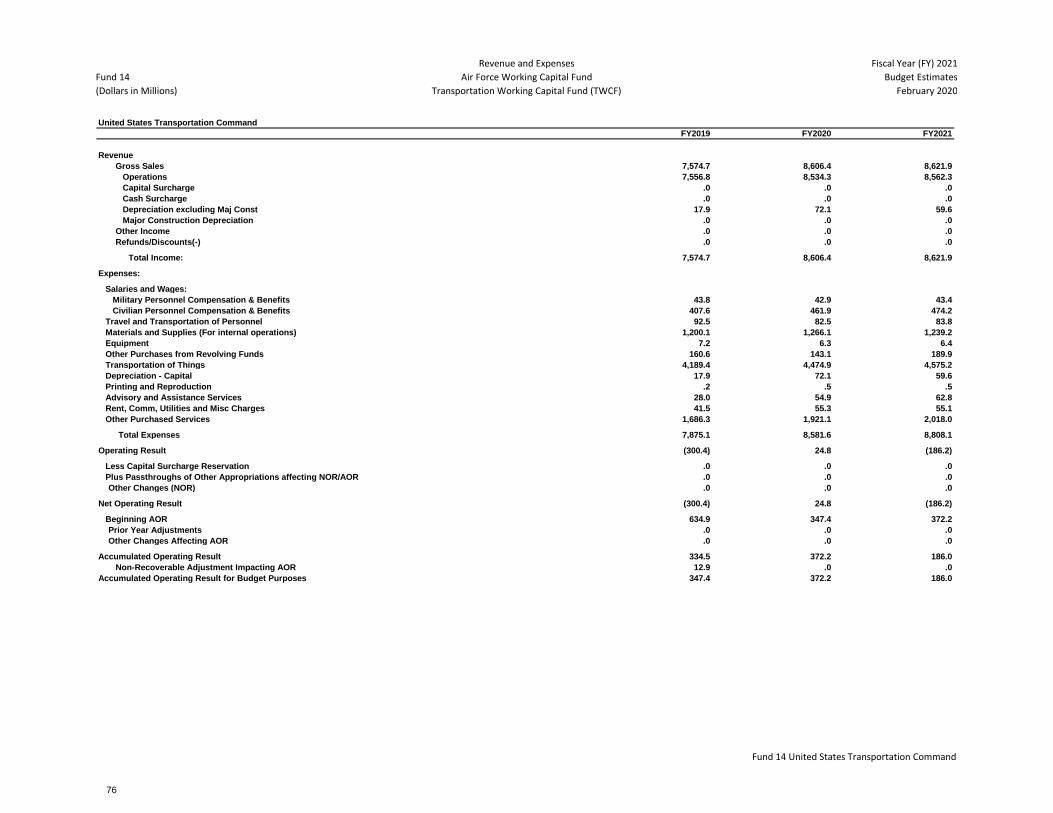
Fund 14
(Dollars in Millions)
Revenue and Expenses
Air Force Working Capital Fund
Transportation Working Capital Fund (TWCF)
Fiscal Year (FY) 2021
Budget Estimates
February 2020
United States Transportation Command
FY2019 FY2020 FY2021
Revenue
Gross Sales 7,574.7 8,606.4 8,621.9
Operations 7,556.8 8,534.3 8,562.3
Capital Surcharge .0 .0 .0
Cash Surcharge .0 .0 .0
Depreciation excluding Maj Const 17.9 72.1 59.6
Major Construction Depreciation .0 .0 .0
Other Income .0 .0 .0
Refunds/Discounts(-) .0 .0 .0
Total Income: 7,574.7 8,606.4 8,621.9
Expenses:
Salaries and Wages:
Military Personnel Compensation & Benefits 43.8 42.9 43.4
Civilian Personnel Compensation & Benefits 407.6 461.9 474.2
Travel and Transportation of Personnel 92.5 82.5 83.8
Materials and Supplies (For internal operations) 1,200.1 1,266.1 1,239.2
Equipment 7.2 6.3 6.4
Other Purchases from Revolving Funds 160.6 143.1 189.9
Transportation of Things 4,189.4 4,474.9 4,575.2
Depreciation - Capital 17.9 72.1 59.6
Printing and Reproduction .2 .5 .5
Advisory and Assistance Services Other Purchases from Revolving Funds 28.0 54.9 62.8
Rent, Comm, Utilities and Misc Charges 41.5 55.3 55.1
Other Purchased Services 1,686.3 1,921.1 2,018.0
Total Expenses 7,875.1 8,581.6 8,808.1
Operating Result (300.4) 24.8 (186.2)
Less Capital Surcharge Reservation .0 .0 .0
Plus Passthroughs of Other Appropriations affecting NOR/AOR .0 .0 .0
Other Changes (NOR) .0 .0 .0
Net Operating Result (300.4) 24.8 (186.2)
Beginning AOR 634.9 347.4 372.2
Prior Year Adjustments .0 .0 .0
Other Changes Affecting AOR .0 .0 .0
Accumulated Operating Result 334.5 372.2 186.0
Non-Recoverable Adjustment Impacting AOR Non-Recoverable Adjustment (AOR) 12.9 .0 .0
Accumulated Operating Result for Budget Purposes 347.4 372.2 186.0
Fund 14 United States Transportation Command
TRANSPORTATION WORKING CAPITAL FUND
76

AIR FORCE
WORKING CAPITAL FUND
CAPITAL BUDGET
CAPITAL BUDGET
77

THIS PAGE INTENTIONALLY LEFT BLANK
CAPITAL BUDGET
78

Fund 9A
(Dollars in Millions)
Activity Group Capital Investment Justification
Air Force Working Capital Fund
Consolidated Sustainment Activity Group (CSAG)
Fiscal Year (FY) 2021
Budget Estimates
February 2020
CSAG
Quantity 2 Quantity 2 Quantity 2
Line Number Item Description Quantity Total Cost Quantity Total Cost Quantity Total Cost
EQUIPMENT 61 160.465 37 128.630 79 150.405
Maintenance Division 61 160.465 37 128.630 79 150.405
Supply Division 0 0.000 0 0.000 0 0.000
ADPE & TELECOM 9 10.864 1 8.166 1 0.780
Maintenance Division 9 10.864 1 8.166 1 0.780
Supply Division 0 0.000 0 0.000 0 0.000
SOFTWARE DEVELOPMENT 2 1.671 1 15.430 1 24.400
Maintenance Division 1 0.482 1 15.430 0 14.500
Supply Division 1 1.189 0 0.000 1 9.900
MINOR CONSTRUCTION 2 0.859 4 2.886 8 11.231
Maintenance Division 2 0.859 4 2.886 8 11.231
Supply Division 0 0.000 0 0.000 0 0.000
TOTAL 74 173.858 43 155.112 89 186.816
Capital Outlays (above threshold) 166.090 174.912 229.547
Capital Outlays (below threshold) 0.000 0.000 0.000
Total Capital Outlays 166.090 174.912 229.547
Total Depreciation Expense 150.732 155.472 177.610
FY2019 FY2020 FY2021
Fund 9A CSAG
CAPITAL BUDGET
79

Fund 9B
(Dollars in Thousands)
Activity Group Capital Investment Justification
Air Force Working Capital Fund
Consolidated Sustainment Activity Group (CSAG)
Fiscal Year (FY) 2021
Budget Estimates
February 2020
Department of the Air Force Line No. & Item Description Activity Identification
Depot Maintenance EQUIPMENT WSS HQ AFMC
Element of Cost Quantity Unit Cost Total Cost Quantity Unit Cost Total Cost Quantity Unit Cost Total Cost
A. Equipment 1 113,523.6 113,523.6 1 57,156.6 57,156.6 1 103,653.9 103,653.9
Total 1 113,523.6 113,523.6 1 57,156.6 57,156.6 1 103,653.9 103,653.9
An Economic Analysis was completed and is on file.
Without the required equipment, AFMC would be unable to provide reliable, cost-effective and timely depot support services and products to operational forces around the
world. Depots would be unable to accommodate new workload requirements and produce acceptable end state products. Depot infrastructure would deteriorate and become
unproductive. The ability to execute capital budgets in support of mission objectives would be severely hampered. The aformentioned investments are critical to remaining
competitive and provide combat mission support commersurate with changing combat environments.
FY2021FY2020FY2019
This capability represents an array of capital equipment investment requirements that aligns with the overall Air Force strategic objectives for sustaining depot facilities and
equipment. Projects are in direct support of Aircraft, Missiles, Engines, Exchangeable, or Other Depot mission. WSS investments are designed, scheduled, and installed in
accordance with established Air Logistics Complex or Aerospace Maintenance and Regeneration Group processes and priorities. WSS projects support the maintenance
mission requirements to sustain the existing organic industrial base, save dollars through increased productivity, and support customer requirements. The equipment, when
replaced, upgraded, integrated, or combined into depot industrial operations, leads to efficiency and personnel safety; supports hazardous waste minimization and pollution
prevention efforts; enhances product quality; and increases customer satisfaction in performing the Air Force mission. Time sensitivity of projects to accommodate new or
emerging workload capability and produce an acceptable end state is a critical factor in depot operations. As such, programming and execution in this capability is essential as
equipment requirements may change. Documentation and project justification support are certified and maintained on file in accordance with the established guidance.
Narrative Justification:
Description
Economic Analysis
Impact
Fund 9B CSAG - Maintenance Division
CAPITAL BUDGET
80
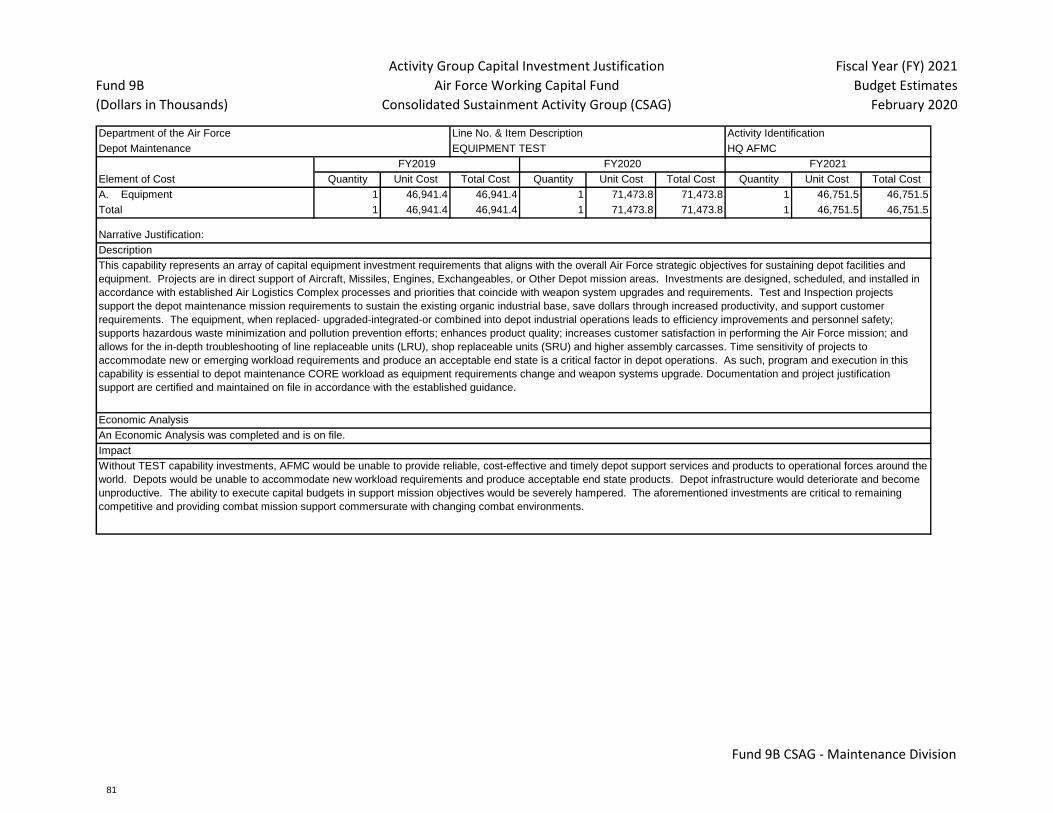
Fund 9B
(Dollars in Thousands)
Activity Group Capital Investment Justification
Air Force Working Capital Fund
Consolidated Sustainment Activity Group (CSAG)
Fiscal Year (FY) 2021
Budget Estimates
February 2020
Department of the Air Force Line No. & Item Description Activity Identification
Depot Maintenance EQUIPMENT TEST HQ AFMC
Element of Cost Quantity Unit Cost Total Cost Quantity Unit Cost Total Cost Quantity Unit Cost Total Cost
A. Equipment 1 46,941.4 46,941.4 1 71,473.8 71,473.8 1 46,751.5 46,751.5
Total 1 46,941.4 46,941.4 1 71,473.8 71,473.8 1 46,751.5 46,751.5
An Economic Analysis was completed and is on file.
Without TEST capability investments, AFMC would be unable to provide reliable, cost-effective and timely depot support services and products to operational forces around the
world. Depots would be unable to accommodate new workload requirements and produce acceptable end state products. Depot infrastructure would deteriorate and become
unproductive. The ability to execute capital budgets in support mission objectives would be severely hampered. The aforementioned investments are critical to remaining
competitive and providing combat mission support commersurate with changing combat environments.
FY2021FY2020FY2019
This capability represents an array of capital equipment investment requirements that aligns with the overall Air Force strategic objectives for sustaining depot facilities and
equipment. Projects are in direct support of Aircraft, Missiles, Engines, Exchangeables, or Other Depot mission areas. Investments are designed, scheduled, and installed in
accordance with established Air Logistics Complex processes and priorities that coincide with weapon system upgrades and requirements. Test and Inspection projects
support the depot maintenance mission requirements to sustain the existing organic industrial base, save dollars through increased productivity, and support customer
requirements. The equipment, when replaced- upgraded-integrated-or combined into depot industrial operations leads to efficiency improvements and personnel safety;
supports hazardous waste minimization and pollution prevention efforts; enhances product quality; increases customer satisfaction in performing the Air Force mission; and
allows for the in-depth troubleshooting of line replaceable units (LRU), shop replaceable units (SRU) and higher assembly carcasses. Time sensitivity of projects to
accommodate new or emerging workload requirements and produce an acceptable end state is a critical factor in depot operations. As such, program and execution in this
capability is essential to depot maintenance CORE workload as equipment requirements change and weapon systems upgrade. Documentation and project justification
support are certified and maintained on file in accordance with the established guidance.
Narrative Justification:
Description
Economic Analysis
Impact
Fund 9B CSAG - Maintenance Division
CAPITAL BUDGET
81

Fund 9B
(Dollars in Thousands)
Activity Group Capital Investment Justification
Air Force Working Capital Fund
Consolidated Sustainment Activity Group (CSAG)
Fiscal Year (FY) 2021
Budget Estimates
February 2020
Department of the Air Force Line No. & Item Description Activity Identification
Depot Maintenance ADPE & TELECOM HQ AFMC
Element of Cost Quantity Unit Cost Total Cost Quantity Unit Cost Total Cost Quantity Unit Cost Total Cost
B. ADPE/Telecomm 1 10,863.7 10,863.7 1 8,165.8 8,165.8 1 780.2 780.2
Total 1 10,863.7 10,863.7 1 8,165.8 8,165.8 1 780.2 780.2
An Economic Analysis was completed and is on file.
Upgrades are critical to maintaining system reliability and improving operating performance and ensuring the supportability of depot maintenance systems and equipment.
New operating system will improve CSAG Maintenance Division's capability to actively monitor and make corrective actions in financial and operational performance. Support
network infrastructure upgrades must be placed into service prior to upgrading operating systems. The Air Force will be unable to track financial, operational and equipment
performance without planned infrastructure replacement and improvement. Lack of investments in this capability will impact the depot’s ability to effectively monitor
performance which results in cost increases, negative inpacts to production, and reduction in aircraft availability for the warfighter.
FY2021FY2020FY2019
This capability represents an array of capital ADPE and Telecommunications investments that aligns with the overall Air Force strategic objectives for sustaining depot
facilities and equipment. Projects will upgrade the infrastructure required to maintain the depot maintenance systems and equipment. All upgrades are implemented within
the Air Force's common infrastructure. Investments include upgrading fiber optics, routers, servers and other infrastructure items required to support the implementation of an
efficient depot maintenance support structure. The aforementioned investments ensure commonality and replacement of equipment before failure, incompatibility or
obsolenscence due to age. Equipment replacements are in accordance with the logistics strategic plan approved by the Deputy Under Secretary of Defense (Logistics).
Narrative Justification:
Description
Economic Analysis
Impact
Fund 9B CSAG - Maintenance Division
CAPITAL BUDGET
82

Fund 9B
(Dollars in Thousands)
Activity Group Capital Investment Justification
Air Force Working Capital Fund
Consolidated Sustainment Activity Group (CSAG)
Fiscal Year (FY) 2021
Budget Estimates
February 2020
Department of the Air Force Line No. & Item Description Activity Identification
Depot Maintenance SOFTWARE DEVELOPMENT HQ AFMC
Element of Cost Quantity Unit Cost Total Cost Quantity Unit Cost Total Cost Quantity Unit Cost Total Cost
C. Software Development 1 482.0 482.0 1 15,430.0 15,430.0 0 14,500.0 14,500.0
Total 1 482.0 482.0 1 15,430.0 15,430.0 0 14,500.0 14,500.0
Economic Analysis for MRO Financials completed and certified on 11 May 18.
Planned software upgrades are critical to maintaining continuous visibility for asset management as well as real-time decisions regarding efficient and effective maintenance
due to changing conditions not only from the field but from within the maintenance wings themselves. The changes made to existing systems will allow successful
implementation of more efficient maintenance concepts in order to effectively utilize the Air Logistics Complexes' resources. Efficiencies critical for long-term success will not
be realized if projects remain unfunded.
FY2021FY2020FY2019
This capability provides for development and acquisition of both operating and application software that support depot maintenance operations. Software requirements include
systems programs, application programs, commercial-off-the-shelf (COTS) software, independent subroutines, databases, equipment upgrades, Test Program Sets (TPS) and
software documentation. System application software may be acquired through (1) the purchase of a COTS system; (2) the development of new applications through either
internal development (in-house) or contractual effort; or (3) the modernization of existing software that significantly expands and/or enhances its existing capabilities.
Narrative Justification:
Description
Economic Analysis
Impact
Fund 9B CSAG - Maintenance Division
CAPITAL BUDGET
83

Fund 9B
(Dollars in Thousands)
Activity Group Capital Investment Justification
Air Force Working Capital Fund
Consolidated Sustainment Activity Group (CSAG)
Fiscal Year (FY) 2021
Budget Estimates
February 2020
Department of the Air Force Line No. & Item Description Activity Identification
Depot Maintenance MINOR CONSTRUCTION HQ AFMC
Element of Cost Quantity Unit Cost Total Cost Quantity Unit Cost Total Cost Quantity Unit Cost Total Cost
D. Minor Construction 1 859.4 859.4 1 2,885.9 2,885.9 1 11,230.6 11,230.6
Total 1 859.4 859.4 1 2,885.9 2,885.9 1 11,230.6 11,230.6
An Economic Analysis was completed and is on file.
If facilities are not properly maintained or modernized based upon required depot workload, there will be work stoppages along with safety and security issues which affects
weapon system availability. The minor construction that is required for new equipment setup will not be in place, thus severely impacting the depots’ ability to efficiently provide
repair services and meet warfighter requirements.
FY2021FY2020FY2019
This category includes an array of minor construction projects that allows flexibility in adapting to new and changing workloads. Projects are small scale (costing between
$250,000 and $1,000,000) and are designed, scheduled, and constructed in accordance with Air Logistic Complexes' established priorities. These projects support the depot
maintenance, mission requirements, correct safety and health problems; improve productivity through quality of life improvement projects, improve depot flow days and support
office and work space reorganizations. In addition, MC projects provide construction required to install needed mission essential equipment and capital investment equipment.
Narrative Justification:
Description
Economic Analysis
Impact
Fund 9B CSAG - Maintenance Division
CAPITAL BUDGET
84

Fund 9B
(Dollars in Thousands)
Activity Group Capital Investment Justification
Air Force Working Capital Fund
Consolidated Sustainment Activity Group (CSAG)
Fiscal Year (FY) 2021
Budget Estimates
February 2020
Department of the Air Force Line No. & Item Description Activity Identification
Supply Management ESCAPE HQ AFMC
Element of Cost Quantity Unit Cost Total Cost Quantity Unit Cost Total Cost Quantity Unit Cost Total Cost
C. Software Development 1 1,188.5 1,188.5 0 0.0 0.0 0 0.0 0.0
Total 1 1,188.5 1,188.5 0 0.0 0.0 0 0.0 0.0
An Economic Analysis was completed and is on file. The savings to investment ratio stands at 6.24 over the lifecycle. This is accomplished through reduced sustainment
costs and various inventory efficiencies such as improved forecasting, tighter collaboration between the AF supply community with depot maintenance and suppliers; improved
bill of materials accuracy, more responsive planning; and near real time performance management.
If not funded, the AF will accept the current antiquated supply chain planning environment and fail to realize a robust ROI, lose a competitive advantage to onboard new
workloads as well as prevent enabling future manpower efficiencies. ESCAPE provides a critical capability to enable other workstreams such as the Maintenance, Repair and
Overhaul (MRO) capability initiative by providing it a near real time source of prioritized repair requirements, and is a crucial step towards simplifying the AF supply chain's
information system portfolio.
FY2021FY2020FY2019
The Enterprise Supply Chain Analysis, Planning and Execution (ESCAPE) initiative furthers the definition, design, acquisition, implementation and delivery of warfighter
enterprise supply chain planning capabilities. The initiative supports DoD transformational goals by seeking to modernize legacy supply chain planning processes and systems
under a single enterprise materiel solution. The primary (and near-exclusive) users of USAF planning capabilities are the Item Managers, Equipment Specialists and
Production Specialists. Current Air Force supply chain planning systems lack the ability to efficiently support depot maintenance operations, effectively position assets across
the enterprise, collaborate with suppliers, and optimize inventory efficiently due to the use of substandard legacy processes and do not integrate the core supply chain
capabilities: Demand Planning, Inventory Planning (or optimization), Supply Planning, Exception Management and Analytics. The requested funds will support
Development/Modernization expenditures related to Solution Support (COTS Vendor Support), System Integrator, Hosting/Data Services/Analytics (Dev), Infrastructure
Services, Infrastructure Services Non-Recurring Equipment (NRE), and Development License (via Service Contract).
Narrative Justification:
Description
Economic Analysis
Impact
Fund 9B CSAG - Supply Division
CAPITAL BUDGET
85

Fund 9B
(Dollars in Thousands)
Activity Group Capital Investment Justification
Air Force Working Capital Fund
Consolidated Sustainment Activity Group (CSAG)
Fiscal Year (FY) 2021
Budget Estimates
February 2020
Department of the Air Force Line No. & Item Description Activity Identification
Supply Management WCF Financials (Supply Financials) HQ AFMC
Element of Cost Quantity Unit Cost Total Cost Quantity Unit Cost Total Cost Quantity Unit Cost Total Cost
C. Software Development 0 0.0 0.0 0 0.0 0.0 1 9,900.0 9,900.0
Total 0 0.0 0.0 0 0.0 0.0 1 9,900.0 9,900.0
FY2021FY2020FY2019
Narrative Justification:
Description
Economic Analysis
Impact
Fund 9B CSAG - Supply Division
CAPITAL BUDGET
86

Fund 9C
(Dollars in Millions)
Activity Group Capital Investment Justification
Air Force Working Capital Fund
Consolidated Sustainment Activity Group (CSAG)
Fiscal Year (FY) 2021
Budget Estimates
February 2020
CSAG - Maintenance Division
Initial Current Approved
Major Category Request Proj Cost Change Explanation
Non-ADPE 154.411 160.465 6.054
ADPE and Telcom 11.799 10.864 -0.936
Software Development 0.000 0.482 0.482
Minor Construction 1.319 0.859 -0.459
Total FY2019 167.529 172.670 5.141
Non-ADPE 128.630 128.630 0.000
ADPE and Telcom 8.166 8.166 0.000
Software Development 15.430 15.430 0.000
Minor Construction 2.886 2.886 0.000
Total FY2020 155.112 155.112 0.000
Non-ADPE 150.405 150.405 0.000
ADPE and Telcom 0.780 0.780 0.000
Software Development 14.500 14.500 0.000
Minor Construction 11.231 11.231 0.000
Total FY2021 176.916 176.916 0.000
Fund 9C CSAG - Maintenance Division
CAPITAL BUDGET
87

Fund 9C
(Dollars in Millions)
Activity Group Capital Investment Justification
Air Force Working Capital Fund
Consolidated Sustainment Activity Group (CSAG)
Fiscal Year (FY) 2021
Budget Estimates
February 2020
CSAG - Supply Division
Initial Current Approved
Major Category Request Proj Cost Change Explanation
Non-ADPE 0.000 0.000 0.000
ADPE and Telcom 0.000 0.000 0.000
Software Development 1.189 1.189 0.000
Minor Construction 0.000 0.000 0.000
Total FY2019 1.189 1.189 0.000
Non-ADPE 0.000 0.000 0.000
ADPE and Telcom 0.000 0.000 0.000
Software Development 0.000 0.000 0.000
Minor Construction 0.000 0.000 0.000
Total FY2020 0.000 0.000 0.000
Non-ADPE 0.000 0.000 0.000
ADPE and Telcom 0.000 0.000 0.000
Software Development 0.000 9.900 9.900
Minor Construction 0.000 0.000 0.000
Total FY2021 0.000 9.900 9.900
Fund 9C CSAG - Supply Division
CAPITAL BUDGET
88

Fund 9A
(Dollars in Millions)
Activity Group Capital Investment Justification
Air Force Working Capital Fund
Transportation Working Capital Fund (TWCF)
Fiscal Year (FY) 2021
Budget Estimates
February 2020
United States Transportation Command
Line
Number Item Description Quantity Total Cost Quantity Total Cost Quantity Total Cost
A. Equipment
Equipment-AMC 0.5 0.5 0.5
Equipment-SDDC 1.8 0.4 0.5
Subtotal 2.3 0.9 1.0
B. ADPE/Telecomm
Distribution Process Owner (DPO) Secure Enclave (DSE)/Common Computing
Environment (CCE) 0.0 0.0 1.0
Local Area Network (USTRANSCOM LAN) 6.1 5.9 5.9
USTRANSCOM Distributive Enclave (USTC DE) 13.3 0.0 0.0
Global Surface Distribution Management (GSDM) 0.7 0.0 0.0
618 Air Operations Center (618AOC) 0.0 2.4 0.0
Subtotal 20.0 8.4 6.8
C. Software Development
Analysis of Mobility Platform (AMP) 3.0 3.1 3.2
Distribution Process Owner (DPO) Secure Enclave (DSE)/Common Computing
Environment (CCE) 2.0 1.4 3.5
Defense Personal Property System (DPS) 16.0 11.7 12.0
Joint Flow & Analysis Sys for Trans (JFAST) 4.8 0.0 0.0
Local Area Network (USTRANSCOM LAN) 1.0 0.0 0.0
Single Mobility System (SMS) 1.9 1.6 1.7
Joint Mobility Control Group (JMCG-C4S) 3.5 0.0 0.0
Consolidated Air Mobility Planning System (CAMPS) 3.1 5.2 9.4
FY2019 FY2020 FY2021
Fund 9A United States Transportation Command
CAPITAL BUDGET
89

Fund 9A
(Dollars in Millions)
Activity Group Capital Investment Justification
Air Force Working Capital Fund
Transportation Working Capital Fund (TWCF)
Fiscal Year (FY) 2021
Budget Estimates
February 2020
United States Transportation Command
Line
Number Item Description Quantity Total Cost Quantity Total Cost Quantity Total Cost
FY2019 FY2020 FY2021
Global Air Transportation Execution System (GATES) 2.8 0.0 0.0
Mobility Air Forces Flight Planning Service 6.2 0.0 0.0
Mobility Enterprise Information Services (MEIS) 3.7 4.8 3.9
Dynamic Mission Replanning (DMR) 0.0 0.0 10.8
Global Freight Management (GFM) 1.0 1.0 0.0
Integrated Booking System (IBS) 4.7 4.8 4.8
Transportation Financial Management System (TFMS) 3.4 0.0 0.0
Subtotal 57.0 33.6 49.3
D. Minor Construction
Minor Construction-AMC 3.4 3.8 3.8
Minor Construction-SDDC 2.9 3.5 7.4
Subtotal 6.3 7.3 11.2
GRAND TOTAL 85.6 50.2 68.3
Capital Outlays (above threshold) 134.5 98.0 89.4
Capital Outlays (below threshold) 0.0 0.0 0.0
Total Capital Outlays 134.5 98.0 89.4
Total Depreciation Expense 17.9 72.1 59.6
Fund 9A United States Transportation Command
CAPITAL BUDGET
90

Fund 9B
(Dollars in Thousands)
Activity Group Capital Investment Justification
Air Force Working Capital Fund
Transportation Working Capital Fund (TWCF)
Fiscal Year (FY) 2021
Budget Estimates
February 2020
Department of the Air Force Line No. & Item Description Activity Identification
Air Mobility Command Equipment-AMC HQ AMC, Scott AFB IL
Element of Cost Quantity Unit Cost Total Cost Quantity Unit Cost Total Cost Quantity Unit Cost Total Cost
A. Equipment 0 500.0 500.0 0 500.0 500.0 0 500.0 500.0
Total 0 500.0 500.0 0 500.0 500.0 0 500.0 500.0
Will be based on requirements approved for replacement or procurement of new equipment.
Economic Analysis (EA) or Cost Analysis (CA) are completed for individual projects that qualify.
Without these funds, wings would not be able to procure needed replacement items. These funds are required to support one-time requirements for equipment that is becoming
obsolete and logistically unsupportable. With a certified EA, it is verified that these capital items meet requirements as a replacement item and result in improved efficiency and
capability.
Not Applicable.
FY2021FY2020FY2019
Funds are used to support Base Procured Investment Equipment for flight line maintenance. No funds were executed in FY19; USTC pulled back funds of $400K; $100K not
executed.
Funds allow for the procurement of one time purchases to replace/procure new equipment.
Narrative Justification:
Description
Mission Benefits
Deliverables
Economic Analysis
Impact
Software
Fund 9B United States Transportation Command
CAPITAL BUDGET
91
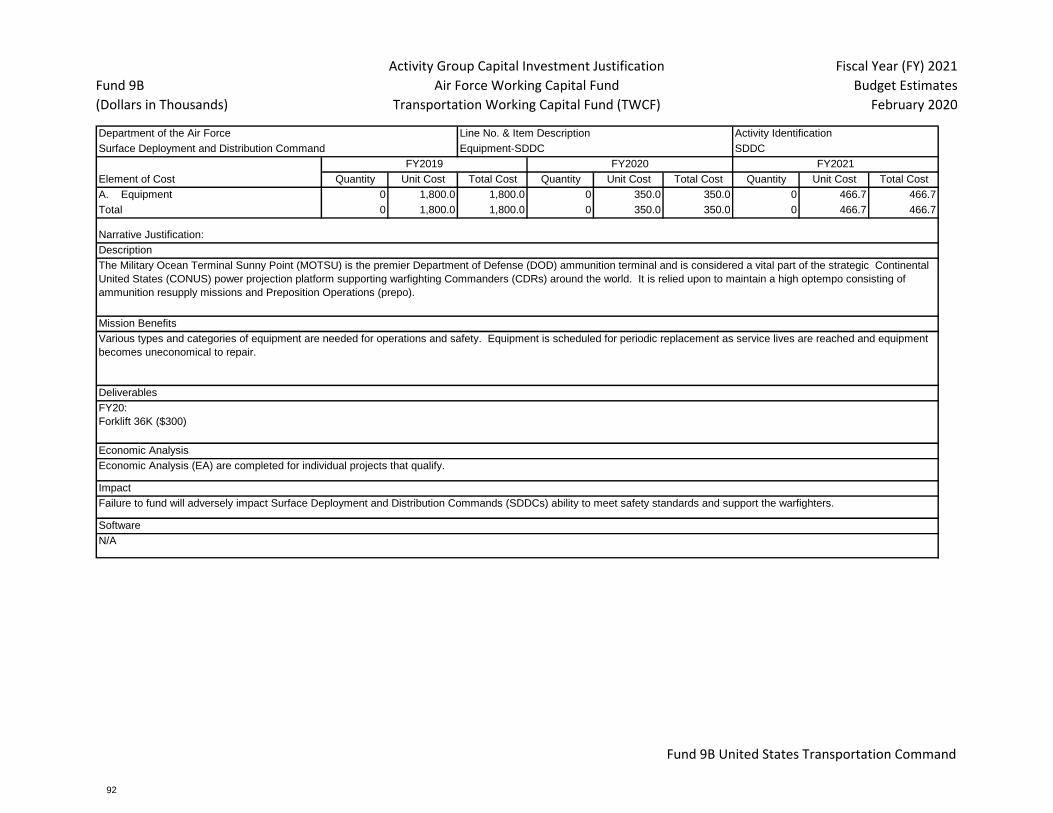
Fund 9B
(Dollars in Thousands)
Activity Group Capital Investment Justification
Air Force Working Capital Fund
Transportation Working Capital Fund (TWCF)
Fiscal Year (FY) 2021
Budget Estimates
February 2020
Department of the Air Force Line No. & Item Description Activity Identification
Surface Deployment and Distribution Command Equipment-SDDC SDDC
Element of Cost Quantity Unit Cost Total Cost Quantity Unit Cost Total Cost Quantity Unit Cost Total Cost
A. Equipment 0 1,800.0 1,800.0 0 350.0 350.0 0 466.7 466.7
Total 0 1,800.0 1,800.0 0 350.0 350.0 0 466.7 466.7
FY20:
Forklift 36K ($300)
FY21:
Economic Analysis (EA) are completed for individual projects that qualify.
Failure to fund will adversely impact Surface Deployment and Distribution Commands (SDDCs) ability to meet safety standards and support the warfighters.
N/A
FY2021FY2020FY2019
The Military Ocean Terminal Sunny Point (MOTSU) is the premier Department of Defense (DOD) ammunition terminal and is considered a vital part of the strategic Continental
United States (CONUS) power projection platform supporting warfighting Commanders (CDRs) around the world. It is relied upon to maintain a high optempo consisting of
ammunition resupply missions and Preposition Operations (prepo).
Various types and categories of equipment are needed for operations and safety. Equipment is scheduled for periodic replacement as service lives are reached and equipment
becomes uneconomical to repair.
Narrative Justification:
Description
Mission Benefits
Deliverables
Economic Analysis
Impact
Software
Fund 9B United States Transportation Command
CAPITAL BUDGET
92
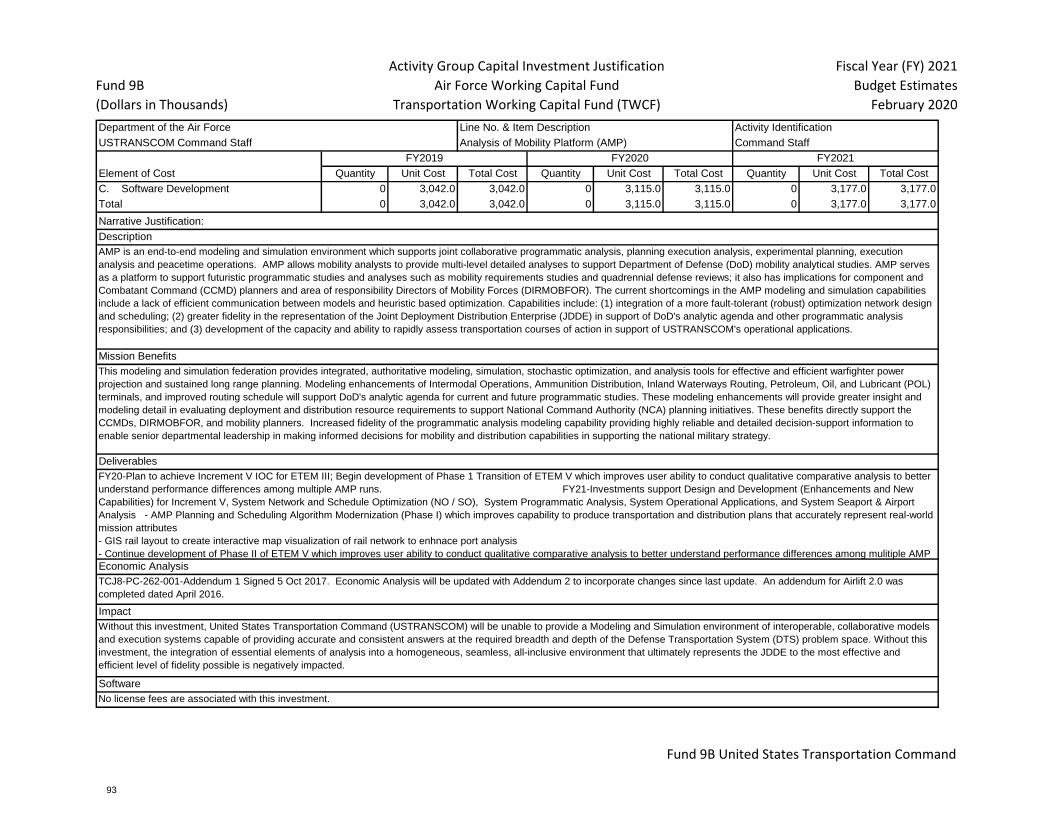
Fund 9B
(Dollars in Thousands)
Activity Group Capital Investment Justification
Air Force Working Capital Fund
Transportation Working Capital Fund (TWCF)
Fiscal Year (FY) 2021
Budget Estimates
February 2020
Department of the Air Force Line No. & Item Description Activity Identification
USTRANSCOM Command Staff Analysis of Mobility Platform (AMP) Command Staff
Element of Cost Quantity Unit Cost Total Cost Quantity Unit Cost Total Cost Quantity Unit Cost Total Cost
C. Software Development 0 3,042.0 3,042.0 0 3,115.0 3,115.0 0 3,177.0 3,177.0
Total 0 3,042.0 3,042.0 0 3,115.0 3,115.0 0 3,177.0 3,177.0
FY20-Plan to achieve Increment V IOC for ETEM III; Begin development of Phase 1 Transition of ETEM V which improves user ability to conduct qualitative comparative analysis to better
understand performance differences among multiple AMP runs. FY21-Investments support Design and Development (Enhancements and New
Capabilities) for Increment V, System Network and Schedule Optimization (NO / SO), System Programmatic Analysis, System Operational Applications, and System Seaport & Airport
Analysis - AMP Planning and Scheduling Algorithm Modernization (Phase I) which improves capability to produce transportation and distribution plans that accurately represent real-world
mission attributes
- GIS rail layout to create interactive map visualization of rail network to enhnace port analysis
- Continue development of Phase II of ETEM V which improves user ability to conduct qualitative comparative analysis to better understand performance differences among mulitiple AMP
TCJ8-PC-262-001-Addendum 1 Signed 5 Oct 2017. Economic Analysis will be updated with Addendum 2 to incorporate changes since last update. An addendum for Airlift 2.0 was
completed dated April 2016.
Without this investment, United States Transportation Command (USTRANSCOM) will be unable to provide a Modeling and Simulation environment of interoperable, collaborative models
and execution systems capable of providing accurate and consistent answers at the required breadth and depth of the Defense Transportation System (DTS) problem space. Without this
investment, the integration of essential elements of analysis into a homogeneous, seamless, all-inclusive environment that ultimately represents the JDDE to the most effective and
efficient level of fidelity possible is negatively impacted.
No license fees are associated with this investment.
FY2021FY2020FY2019
AMP is an end-to-end modeling and simulation environment which supports joint collaborative programmatic analysis, planning execution analysis, experimental planning, execution
analysis and peacetime operations. AMP allows mobility analysts to provide multi-level detailed analyses to support Department of Defense (DoD) mobility analytical studies. AMP serves
as a platform to support futuristic programmatic studies and analyses such as mobility requirements studies and quadrennial defense reviews; it also has implications for component and
Combatant Command (CCMD) planners and area of responsibility Directors of Mobility Forces (DIRMOBFOR). The current shortcomings in the AMP modeling and simulation capabilities
include a lack of efficient communication between models and heuristic based optimization. Capabilities include: (1) integration of a more fault-tolerant (robust) optimization network design
and scheduling; (2) greater fidelity in the representation of the Joint Deployment Distribution Enterprise (JDDE) in support of DoD's analytic agenda and other programmatic analysis
responsibilities; and (3) development of the capacity and ability to rapidly assess transportation courses of action in support of USTRANSCOM's operational applications.
This modeling and simulation federation provides integrated, authoritative modeling, simulation, stochastic optimization, and analysis tools for effective and efficient warfighter power
projection and sustained long range planning. Modeling enhancements of Intermodal Operations, Ammunition Distribution, Inland Waterways Routing, Petroleum, Oil, and Lubricant (POL)
terminals, and improved routing schedule will support DoD's analytic agenda for current and future programmatic studies. These modeling enhancements will provide greater insight and
modeling detail in evaluating deployment and distribution resource requirements to support National Command Authority (NCA) planning initiatives. These benefits directly support the
CCMDs, DIRMOBFOR, and mobility planners. Increased fidelity of the programmatic analysis modeling capability providing highly reliable and detailed decision-support information to
enable senior departmental leadership in making informed decisions for mobility and distribution capabilities in supporting the national military strategy.
Narrative Justification:
Description
Mission Benefits
Deliverables
Economic Analysis
Impact
Software
Fund 9B United States Transportation Command
CAPITAL BUDGET
93
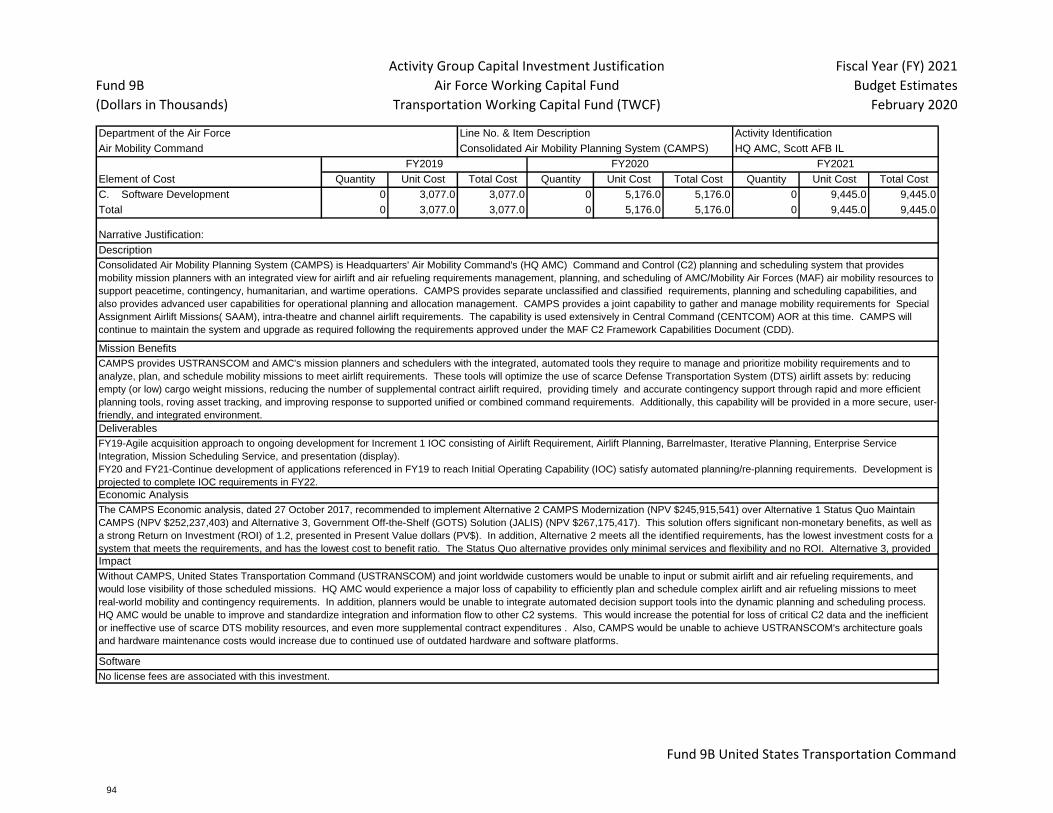
Fund 9B
(Dollars in Thousands)
Activity Group Capital Investment Justification
Air Force Working Capital Fund
Transportation Working Capital Fund (TWCF)
Fiscal Year (FY) 2021
Budget Estimates
February 2020
Department of the Air Force Line No. & Item Description Activity Identification
Air Mobility Command Consolidated Air Mobility Planning System (CAMPS) HQ AMC, Scott AFB IL
Element of Cost Quantity Unit Cost Total Cost Quantity Unit Cost Total Cost Quantity Unit Cost Total Cost
C. Software Development 0 3,077.0 3,077.0 0 5,176.0 5,176.0 0 9,445.0 9,445.0
Total 0 3,077.0 3,077.0 0 5,176.0 5,176.0 0 9,445.0 9,445.0
FY19-Agile acquisition approach to ongoing development for Increment 1 IOC consisting of Airlift Requirement, Airlift Planning, Barrelmaster, Iterative Planning, Enterprise Service
Integration, Mission Scheduling Service, and presentation (display).
FY20 and FY21-Continue development of applications referenced in FY19 to reach Initial Operating Capability (IOC) satisfy automated planning/re-planning requirements. Development is
projected to complete IOC requirements in FY22.
The CAMPS Economic analysis, dated 27 October 2017, recommended to implement Alternative 2 CAMPS Modernization (NPV $245,915,541) over Alternative 1 Status Quo Maintain
CAMPS (NPV $252,237,403) and Alternative 3, Government Off-the-Shelf (GOTS) Solution (JALIS) (NPV $267,175,417). This solution offers significant non-monetary benefits, as well as
a strong Return on Investment (ROI) of 1.2, presented in Present Value dollars (PV$). In addition, Alternative 2 meets all the identified requirements, has the lowest investment costs for a
system that meets the requirements, and has the lowest cost to benefit ratio. The Status Quo alternative provides only minimal services and flexibility and no ROI. Alternative 3, provided
Without CAMPS, United States Transportation Command (USTRANSCOM) and joint worldwide customers would be unable to input or submit airlift and air refueling requirements, and
would lose visibility of those scheduled missions. HQ AMC would experience a major loss of capability to efficiently plan and schedule complex airlift and air refueling missions to meet
real-world mobility and contingency requirements. In addition, planners would be unable to integrate automated decision support tools into the dynamic planning and scheduling process.
HQ AMC would be unable to improve and standardize integration and information flow to other C2 systems. This would increase the potential for loss of critical C2 data and the inefficient
or ineffective use of scarce DTS mobility resources, and even more supplemental contract expenditures . Also, CAMPS would be unable to achieve USTRANSCOM's architecture goals
and hardware maintenance costs would increase due to continued use of outdated hardware and software platforms.
No license fees are associated with this investment.
FY2021FY2020FY2019
Consolidated Air Mobility Planning System (CAMPS) is Headquarters' Air Mobility Command's (HQ AMC) Command and Control (C2) planning and scheduling system that provides
mobility mission planners with an integrated view for airlift and air refueling requirements management, planning, and scheduling of AMC/Mobility Air Forces (MAF) air mobility resources to
support peacetime, contingency, humanitarian, and wartime operations. CAMPS provides separate unclassified and classified requirements, planning and scheduling capabilities, and
also provides advanced user capabilities for operational planning and allocation management. CAMPS provides a joint capability to gather and manage mobility requirements for Special
Assignment Airlift Missions( SAAM), intra-theatre and channel airlift requirements. The capability is used extensively in Central Command (CENTCOM) AOR at this time. CAMPS will
continue to maintain the system and upgrade as required following the requirements approved under the MAF C2 Framework Capabilities Document (CDD).
CAMPS provides USTRANSCOM and AMC's mission planners and schedulers with the integrated, automated tools they require to manage and prioritize mobility requirements and to
analyze, plan, and schedule mobility missions to meet airlift requirements. These tools will optimize the use of scarce Defense Transportation System (DTS) airlift assets by: reducing
empty (or low) cargo weight missions, reducing the number of supplemental contract airlift required, providing timely and accurate contingency support through rapid and more efficient
planning tools, roving asset tracking, and improving response to supported unified or combined command requirements. Additionally, this capability will be provided in a more secure, user-
friendly, and integrated environment.
Narrative Justification:
Description
Mission Benefits
Deliverables
Economic Analysis
Impact
Software
Fund 9B United States Transportation Command
CAPITAL BUDGET
94
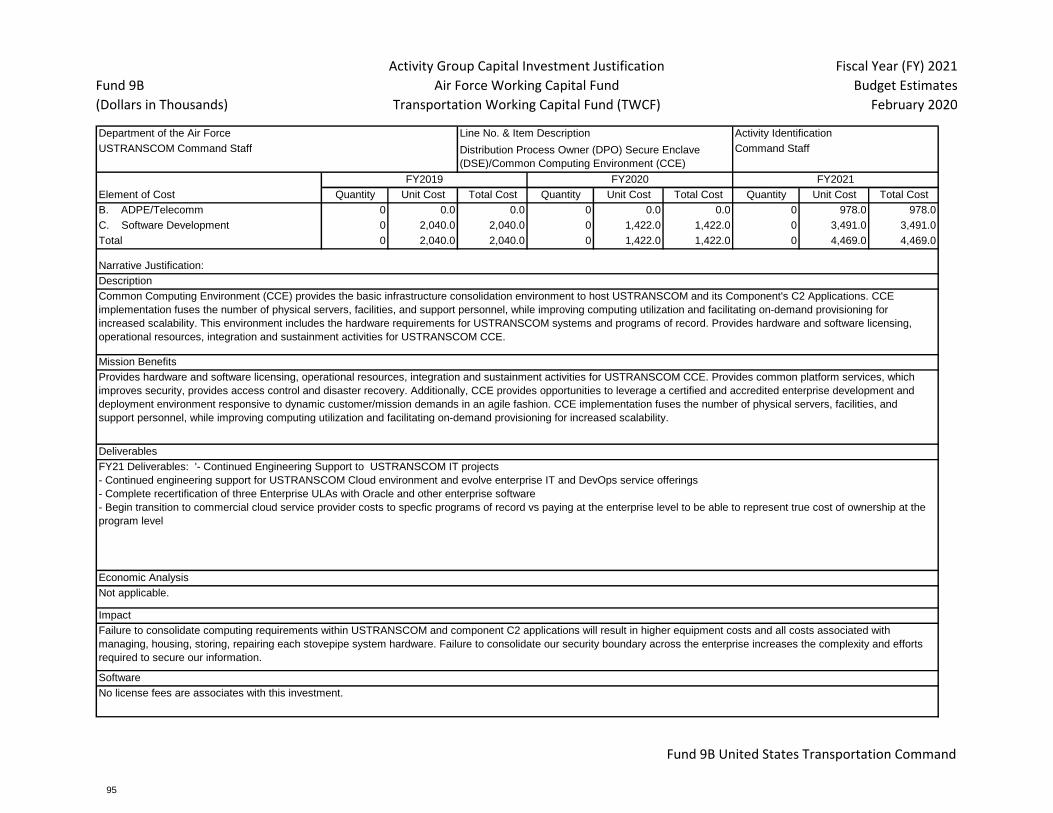
Fund 9B
(Dollars in Thousands)
Activity Group Capital Investment Justification
Air Force Working Capital Fund
Transportation Working Capital Fund (TWCF)
Fiscal Year (FY) 2021
Budget Estimates
February 2020
Department of the Air Force Line No. & Item Description Activity Identification
USTRANSCOM Command Staff Command Staff
Element of Cost Quantity Unit Cost Total Cost Quantity Unit Cost Total Cost Quantity Unit Cost Total Cost
B. ADPE/Telecomm 0 0.0 0.0 0 0.0 0.0 0 978.0 978.0
C. Software Development 0 2,040.0 2,040.0 0 1,422.0 1,422.0 0 3,491.0 3,491.0
Total 0 2,040.0 2,040.0 0 1,422.0 1,422.0 0 4,469.0 4,469.0
No license fees are associates with this investment.
FY2021FY2020FY2019
Common Computing Environment (CCE) provides the basic infrastructure consolidation environment to host USTRANSCOM and its Component's C2 Applications. CCE
implementation fuses the number of physical servers, facilities, and support personnel, while improving computing utilization and facilitating on-demand provisioning for
increased scalability. This environment includes the hardware requirements for USTRANSCOM systems and programs of record. Provides hardware and software licensing,
operational resources, integration and sustainment activities for USTRANSCOM CCE.
Provides hardware and software licensing, operational resources, integration and sustainment activities for USTRANSCOM CCE. Provides common platform services, which
improves security, provides access control and disaster recovery. Additionally, CCE provides opportunities to leverage a certified and accredited enterprise development and
deployment environment responsive to dynamic customer/mission demands in an agile fashion. CCE implementation fuses the number of physical servers, facilities, and
support personnel, while improving computing utilization and facilitating on-demand provisioning for increased scalability.
Narrative Justification:
Description
Mission Benefits
Deliverables
Economic Analysis
Impact
Software
Distribution Process Owner (DPO) Secure Enclave
(DSE)/Common Computing Environment (CCE)
FY21 Deliverables: '- Continued Engineering Support to USTRANSCOM IT projects
- Continued engineering support for USTRANSCOM Cloud environment and evolve enterprise IT and DevOps service offerings
- Complete recertification of three Enterprise ULAs with Oracle and other enterprise software
- Begin transition to commercial cloud service provider costs to specfic programs of record vs paying at the enterprise level to be able to represent true cost of ownership at the
program level
Not applicable.
Failure to consolidate computing requirements within USTRANSCOM and component C2 applications will result in higher equipment costs and all costs associated with
managing, housing, storing, repairing each stovepipe system hardware. Failure to consolidate our security boundary across the enterprise increases the complexity and efforts
required to secure our information.
Fund 9B United States Transportation Command
CAPITAL BUDGET
95
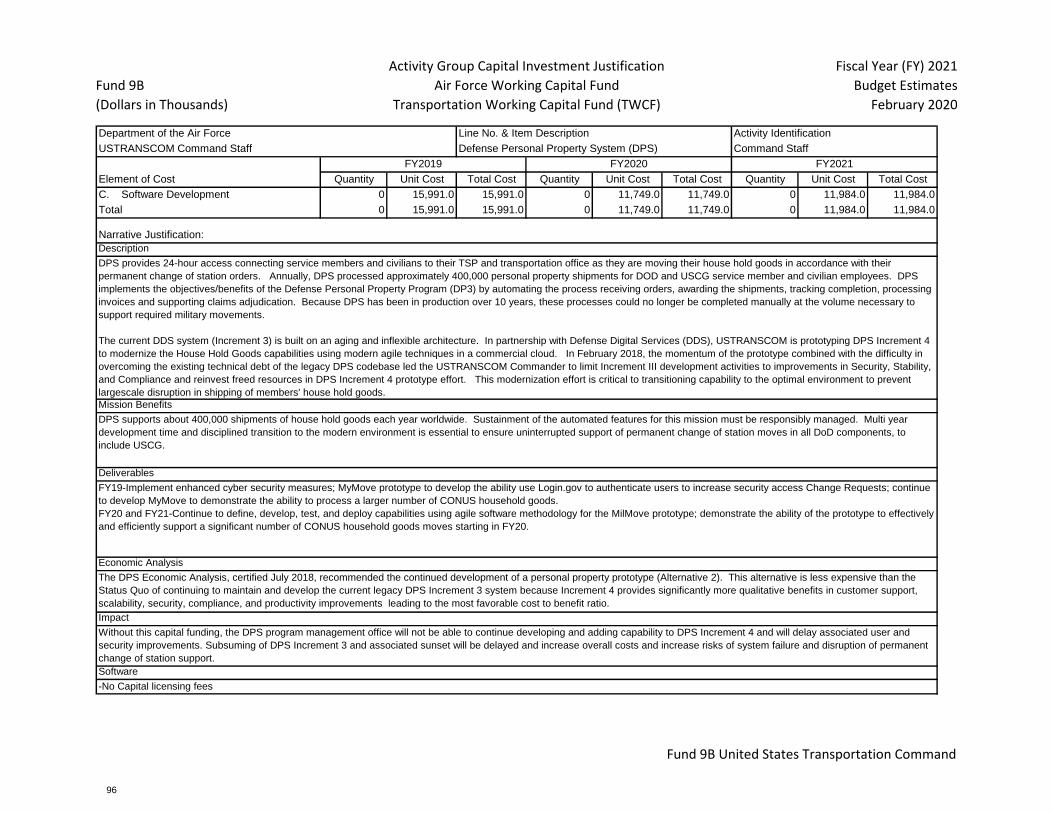
Fund 9B
(Dollars in Thousands)
Activity Group Capital Investment Justification
Air Force Working Capital Fund
Transportation Working Capital Fund (TWCF)
Fiscal Year (FY) 2021
Budget Estimates
February 2020
Department of the Air Force Line No. & Item Description Activity Identification
USTRANSCOM Command Staff Defense Personal Property System (DPS) Command Staff
Element of Cost Quantity Unit Cost Total Cost Quantity Unit Cost Total Cost Quantity Unit Cost Total Cost
C. Software Development 0 15,991.0 15,991.0 0 11,749.0 11,749.0 0 11,984.0 11,984.0
Total 0 15,991.0 15,991.0 0 11,749.0 11,749.0 0 11,984.0 11,984.0
FY19-Implement enhanced cyber security measures; MyMove prototype to develop the ability use Login.gov to authenticate users to increase security access Change Requests; continue
to develop MyMove to demonstrate the ability to process a larger number of CONUS household goods.
FY20 and FY21-Continue to define, develop, test, and deploy capabilities using agile software methodology for the MilMove prototype; demonstrate the ability of the prototype to effectively
and efficiently support a significant number of CONUS household goods moves starting in FY20.
The DPS Economic Analysis, certified July 2018, recommended the continued development of a personal property prototype (Alternative 2). This alternative is less expensive than the
Status Quo of continuing to maintain and develop the current legacy DPS Increment 3 system because Increment 4 provides significantly more qualitative benefits in customer support,
scalability, security, compliance, and productivity improvements leading to the most favorable cost to benefit ratio.
Without this capital funding, the DPS program management office will not be able to continue developing and adding capability to DPS Increment 4 and will delay associated user and
security improvements. Subsuming of DPS Increment 3 and associated sunset will be delayed and increase overall costs and increase risks of system failure and disruption of permanent
change of station support.
-No Capital licensing fees
FY2021FY2020FY2019
DPS provides 24-hour access connecting service members and civilians to their TSP and transportation office as they are moving their house hold goods in accordance with their
permanent change of station orders. Annually, DPS processed approximately 400,000 personal property shipments for DOD and USCG service member and civilian employees. DPS
implements the objectives/benefits of the Defense Personal Property Program (DP3) by automating the process receiving orders, awarding the shipments, tracking completion, processing
invoices and supporting claims adjudication. Because DPS has been in production over 10 years, these processes could no longer be completed manually at the volume necessary to
support required military movements.
The current DDS system (Increment 3) is built on an aging and inflexible architecture. In partnership with Defense Digital Services (DDS), USTRANSCOM is prototyping DPS Increment 4
to modernize the House Hold Goods capabilities using modern agile techniques in a commercial cloud. In February 2018, the momentum of the prototype combined with the difficulty in
overcoming the existing technical debt of the legacy DPS codebase led the USTRANSCOM Commander to limit Increment III development activities to improvements in Security, Stability,
and Compliance and reinvest freed resources in DPS Increment 4 prototype effort. This modernization effort is critical to transitioning capability to the optimal environment to prevent
largescale disruption in shipping of members' house hold goods.
DPS supports about 400,000 shipments of house hold goods each year worldwide. Sustainment of the automated features for this mission must be responsibly managed. Multi year
development time and disciplined transition to the modern environment is essential to ensure uninterrupted support of permanent change of station moves in all DoD components, to
include USCG.
Narrative Justification:
Description
Mission Benefits
Deliverables
Economic Analysis
Impact
Software
Fund 9B United States Transportation Command
CAPITAL BUDGET
96
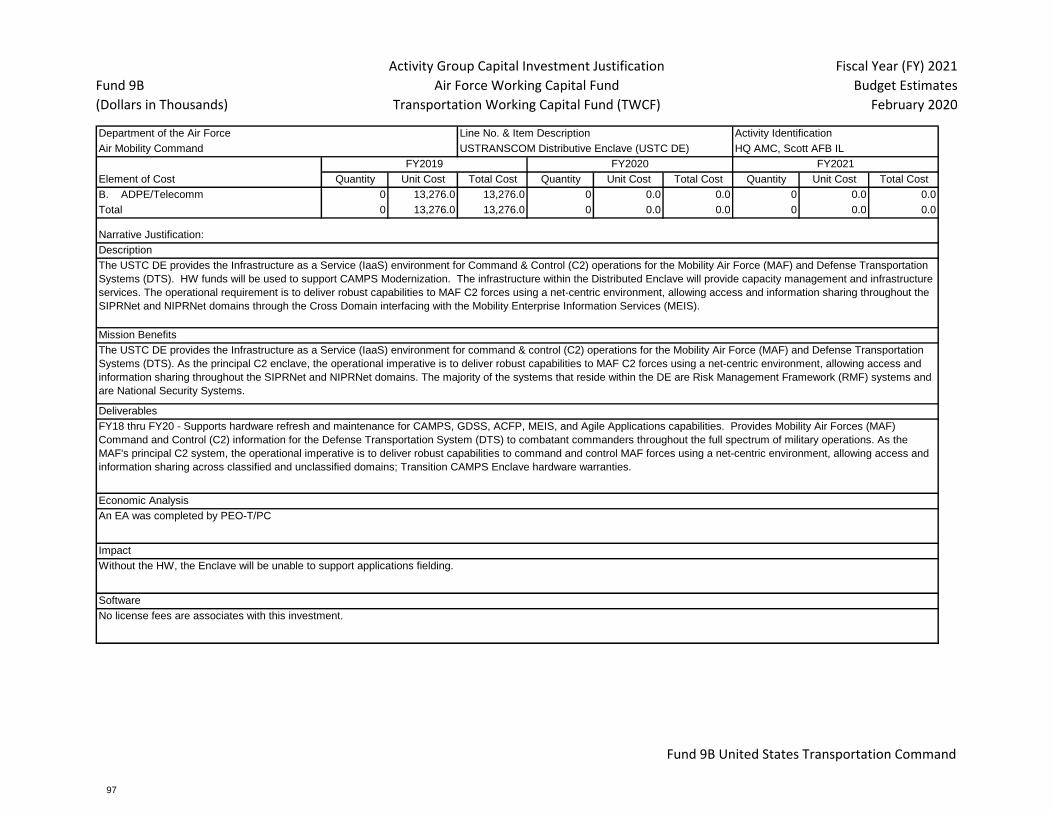
Fund 9B
(Dollars in Thousands)
Activity Group Capital Investment Justification
Air Force Working Capital Fund
Transportation Working Capital Fund (TWCF)
Fiscal Year (FY) 2021
Budget Estimates
February 2020
Department of the Air Force Line No. & Item Description Activity Identification
Air Mobility Command USTRANSCOM Distributive Enclave (USTC DE) HQ AMC, Scott AFB IL
Element of Cost Quantity Unit Cost Total Cost Quantity Unit Cost Total Cost Quantity Unit Cost Total Cost
B. ADPE/Telecomm 0 13,276.0 13,276.0 0 0.0 0.0 0 0.0 0.0
Total 0 13,276.0 13,276.0 0 0.0 0.0 0 0.0 0.0
FY18 thru FY20 - Supports hardware refresh and maintenance for CAMPS, GDSS, ACFP, MEIS, and Agile Applications capabilities. Provides Mobility Air Forces (MAF)
Command and Control (C2) information for the Defense Transportation System (DTS) to combatant commanders throughout the full spectrum of military operations. As the
MAF's principal C2 system, the operational imperative is to deliver robust capabilities to command and control MAF forces using a net-centric environment, allowing access and
information sharing across classified and unclassified domains; Transition CAMPS Enclave hardware warranties.
An EA was completed by PEO-T/PC
Without the HW, the Enclave will be unable to support applications fielding.
No license fees are associates with this investment.
FY2021FY2020FY2019
The USTC DE provides the Infrastructure as a Service (IaaS) environment for Command & Control (C2) operations for the Mobility Air Force (MAF) and Defense Transportation
Systems (DTS). HW funds will be used to support CAMPS Modernization. The infrastructure within the Distributed Enclave will provide capacity management and infrastructure
services. The operational requirement is to deliver robust capabilities to MAF C2 forces using a net-centric environment, allowing access and information sharing throughout the
SIPRNet and NIPRNet domains through the Cross Domain interfacing with the Mobility Enterprise Information Services (MEIS).
The USTC DE provides the Infrastructure as a Service (IaaS) environment for command & control (C2) operations for the Mobility Air Force (MAF) and Defense Transportation
Systems (DTS). As the principal C2 enclave, the operational imperative is to deliver robust capabilities to MAF C2 forces using a net-centric environment, allowing access and
information sharing throughout the SIPRNet and NIPRNet domains. The majority of the systems that reside within the DE are Risk Management Framework (RMF) systems and
are National Security Systems.
Narrative Justification:
Description
Mission Benefits
Deliverables
Economic Analysis
Impact
Software
Fund 9B United States Transportation Command
CAPITAL BUDGET
97

Fund 9B
(Dollars in Thousands)
Activity Group Capital Investment Justification
Air Force Working Capital Fund
Transportation Working Capital Fund (TWCF)
Fiscal Year (FY) 2021
Budget Estimates
February 2020Department of the Air Force Line No. & Item Description Activity Identification
Air Mobility Command Dynamic Mission Replanning (DMR) HQ AMC, Scott AFB IL
Element of Cost Quantity Unit Cost Total Cost Quantity Unit Cost Total Cost Quantity Unit Cost Total Cost
C. Software Development 0 0.0 0.0 0 0.0 0.0 0 10,823.0 10,823.0
Total 0 0.0 0.0 0 0.0 0.0 0 10,823.0 10,823.0
Development:
- Development in FY21 will support Mission Scheduling Service (MSS) Development Effort
- Phase 2 Multi-Aircraft Timeline
DMR Economic Analysis dated 23 February 2018 recommends Alternative 2, Implement DMR (NPV $197,474K) over Alternative 1, Status Quo (NPV $108,692K) and
Alternative 3, Taleris (NPV $205,499K). This solution provides significant benefits: Improved use of crew and organic resources, improved In-Transit Visibility, reduced mission
conflicts and reduced delay for passengers/cargo. Alternative 2, Implement DMR will significantly reduce mission replanning time from an average of 2 hours to minutes.
Alternative 2 provides the most favorable cost position (which indicates that it provides more benefit for each dollar spent, despite being more expensive than Status Quo),
$1,575K per benefit for Alternative 1 Status Quo and $3,162K per benefit for Alternative 3 Taleris compared to $1,128K for Alternative 2 Implement DMR.
If DMR funds are not received, degrades AMC ability to effectively replan aircraft missions. Current Re-Planning COA Development takes up to 2 hours and has no effective way
of visualizing all mission execution factors with concern for potential waste of fuel, aircrew, and aircraft resources.
No license fees are associated with this investment.
FY2021FY2020FY2019
Dynamic Mission Re-planning (DMR) is a transportation initiative designed to enhance the 618th Air Operations Center, Tanker Airlift Control Center's (618 AOC TACC) ability to
re-plan strategic airlift missions. DMR enhances the effectiveness and efficiency of missions in the execution phase (24 hours prior to the mission’s initial departure from home
station through mission completion) by providing a capability to recognize and react to a potential problem or event, to automatically assess the significance of the event,
recognize down time or associated mission impacts, and present the decision maker with weighted options based on a variety of relevant operational factors. DMR is
envisioned to consist of a family of work-centered focused applications that provide 618 AOC TACC users an effective way of visualizing the myriad of factors that could result in
a delay or deviation of a planned mission. A net-centric information sharing environment (envisioned as the future structure of the Mobility Enterprise Information Services
(MEIS) will be used to support both DMR operational and what-if data sharing requirements.
DMR enhances re-planning process during execution, automatically identify and visualize multi-mission conflicts, identify Courses of Actions (COAs) and communicate updates
to the field. Recognize and react to potential problems or events and improve on-time performance of airlift missions. The main benefit provided by DMR implementation is an
increase in operational flexibility. This project is estimated to produce an initial 0.32 cost avoidance to investment ratio for the 10 year analysis presented. Fuel savings and
transportation efficiencies are expected to provide a significant ROI, however analysis was not undertaken at initial concept and will not be completed until DMR operational
metrics are available for comparison. - DoD
Strategic Objective is 007SO18269 (Enhance information technology and cybersecurity capabilities).
Narrative Justification:
Description
Mission Benefits
Deliverables
Economic Analysis
Impact
Software
Fund 9B United States Transportation Command
CAPITAL BUDGET
98
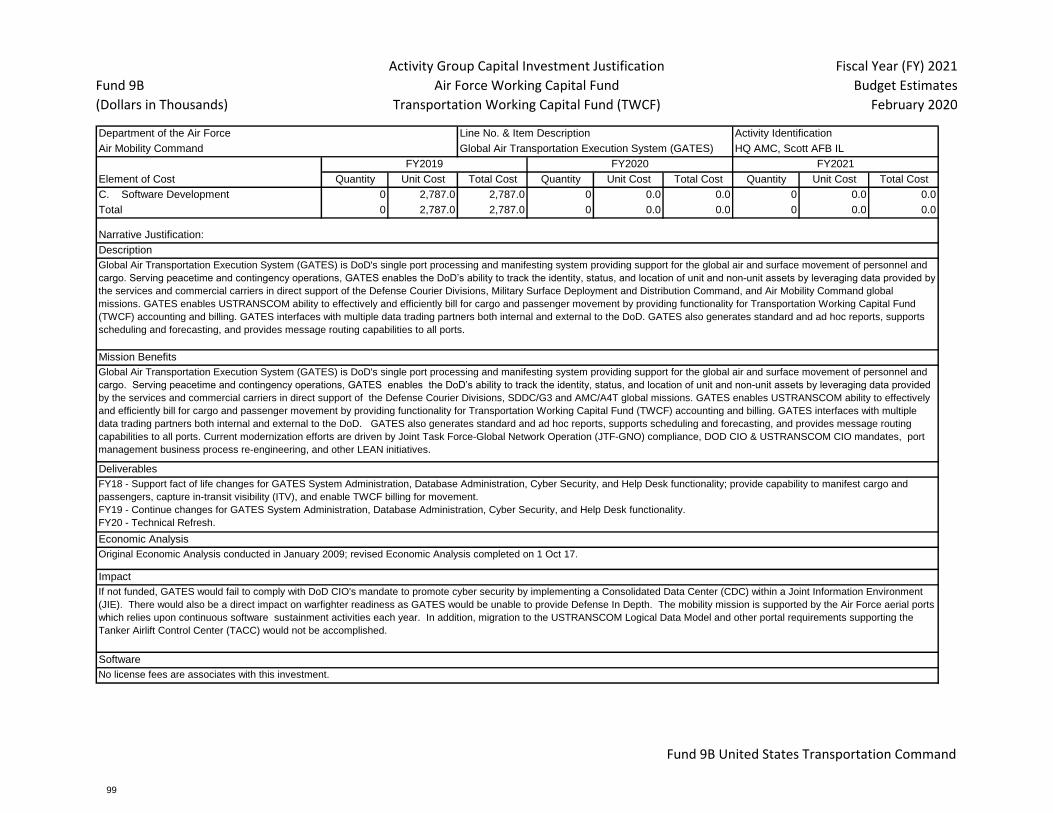
Fund 9B
(Dollars in Thousands)
Activity Group Capital Investment Justification
Air Force Working Capital Fund
Transportation Working Capital Fund (TWCF)
Fiscal Year (FY) 2021
Budget Estimates
February 2020
Department of the Air Force Line No. & Item Description Activity Identification
Air Mobility Command Global Air Transportation Execution System (GATES) HQ AMC, Scott AFB IL
Element of Cost Quantity Unit Cost Total Cost Quantity Unit Cost Total Cost Quantity Unit Cost Total Cost
C. Software Development 0 2,787.0 2,787.0 0 0.0 0.0 0 0.0 0.0
Total 0 2,787.0 2,787.0 0 0.0 0.0 0 0.0 0.0
FY18 - Support fact of life changes for GATES System Administration, Database Administration, Cyber Security, and Help Desk functionality; provide capability to manifest cargo and
passengers, capture in-transit visibility (ITV), and enable TWCF billing for movement.
FY19 - Continue changes for GATES System Administration, Database Administration, Cyber Security, and Help Desk functionality.
FY20 - Technical Refresh.
Original Economic Analysis conducted in January 2009; revised Economic Analysis completed on 1 Oct 17.
If not funded, GATES would fail to comply with DoD CIO's mandate to promote cyber security by implementing a Consolidated Data Center (CDC) within a Joint Information Environment
(JIE). There would also be a direct impact on warfighter readiness as GATES would be unable to provide Defense In Depth. The mobility mission is supported by the Air Force aerial ports
which relies upon continuous software sustainment activities each year. In addition, migration to the USTRANSCOM Logical Data Model and other portal requirements supporting the
Tanker Airlift Control Center (TACC) would not be accomplished.
No license fees are associates with this investment.
FY2021FY2020FY2019
Global Air Transportation Execution System (GATES) is DoD's single port processing and manifesting system providing support for the global air and surface movement of personnel and
cargo. Serving peacetime and contingency operations, GATES enables the DoD’s ability to track the identity, status, and location of unit and non-unit assets by leveraging data provided by
the services and commercial carriers in direct support of the Defense Courier Divisions, Military Surface Deployment and Distribution Command, and Air Mobility Command global
missions. GATES enables USTRANSCOM ability to effectively and efficiently bill for cargo and passenger movement by providing functionality for Transportation Working Capital Fund
(TWCF) accounting and billing. GATES interfaces with multiple data trading partners both internal and external to the DoD. GATES also generates standard and ad hoc reports, supports
scheduling and forecasting, and provides message routing capabilities to all ports.
Global Air Transportation Execution System (GATES) is DoD's single port processing and manifesting system providing support for the global air and surface movement of personnel and
cargo. Serving peacetime and contingency operations, GATES enables the DoD’s ability to track the identity, status, and location of unit and non-unit assets by leveraging data provided
by the services and commercial carriers in direct support of the Defense Courier Divisions, SDDC/G3 and AMC/A4T global missions. GATES enables USTRANSCOM ability to effectively
and efficiently bill for cargo and passenger movement by providing functionality for Transportation Working Capital Fund (TWCF) accounting and billing. GATES interfaces with multiple
data trading partners both internal and external to the DoD. GATES also generates standard and ad hoc reports, supports scheduling and forecasting, and provides message routing
capabilities to all ports. Current modernization efforts are driven by Joint Task Force-Global Network Operation (JTF-GNO) compliance, DOD CIO & USTRANSCOM CIO mandates, port
management business process re-engineering, and other LEAN initiatives.
Narrative Justification:
Description
Mission Benefits
Deliverables
Economic Analysis
Impact
Software
Fund 9B United States Transportation Command
CAPITAL BUDGET
99
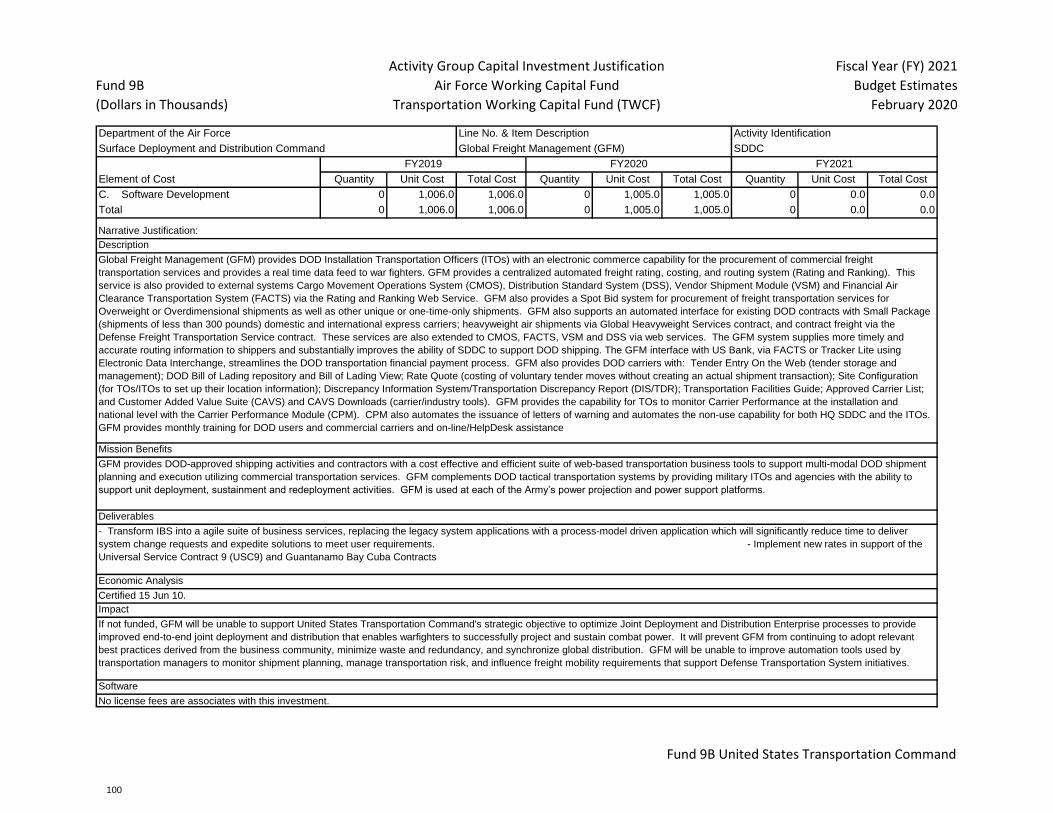
Fund 9B
(Dollars in Thousands)
Activity Group Capital Investment Justification
Air Force Working Capital Fund
Transportation Working Capital Fund (TWCF)
Fiscal Year (FY) 2021
Budget Estimates
February 2020
Department of the Air Force Line No. & Item Description Activity Identification
Surface Deployment and Distribution Command Global Freight Management (GFM) SDDC
Element of Cost Quantity Unit Cost Total Cost Quantity Unit Cost Total Cost Quantity Unit Cost Total Cost
C. Software Development 0 1,006.0 1,006.0 0 1,005.0 1,005.0 0 0.0 0.0
Total 0 1,006.0 1,006.0 0 1,005.0 1,005.0 0 0.0 0.0
- Transform IBS into a agile suite of business services, replacing the legacy system applications with a process-model driven application which will significantly reduce time to deliver
system change requests and expedite solutions to meet user requirements. - Implement new rates in support of the
Universal Service Contract 9 (USC9) and Guantanamo Bay Cuba Contracts
Certified 15 Jun 10.
If not funded, GFM will be unable to support United States Transportation Command's strategic objective to optimize Joint Deployment and Distribution Enterprise processes to provide
improved end-to-end joint deployment and distribution that enables warfighters to successfully project and sustain combat power. It will prevent GFM from continuing to adopt relevant
best practices derived from the business community, minimize waste and redundancy, and synchronize global distribution. GFM will be unable to improve automation tools used by
transportation managers to monitor shipment planning, manage transportation risk, and influence freight mobility requirements that support Defense Transportation System initiatives.
No license fees are associates with this investment.
FY2021FY2020FY2019
Global Freight Management (GFM) provides DOD Installation Transportation Officers (ITOs) with an electronic commerce capability for the procurement of commercial freight
transportation services and provides a real time data feed to war fighters. GFM provides a centralized automated freight rating, costing, and routing system (Rating and Ranking). This
service is also provided to external systems Cargo Movement Operations System (CMOS), Distribution Standard System (DSS), Vendor Shipment Module (VSM) and Financial Air
Clearance Transportation System (FACTS) via the Rating and Ranking Web Service. GFM also provides a Spot Bid system for procurement of freight transportation services for
Overweight or Overdimensional shipments as well as other unique or one-time-only shipments. GFM also supports an automated interface for existing DOD contracts with Small Package
(shipments of less than 300 pounds) domestic and international express carriers; heavyweight air shipments via Global Heavyweight Services contract, and contract freight via the
Defense Freight Transportation Service contract. These services are also extended to CMOS, FACTS, VSM and DSS via web services. The GFM system supplies more timely and
accurate routing information to shippers and substantially improves the ability of SDDC to support DOD shipping. The GFM interface with US Bank, via FACTS or Tracker Lite using
Electronic Data Interchange, streamlines the DOD transportation financial payment process. GFM also provides DOD carriers with: Tender Entry On the Web (tender storage and
management); DOD Bill of Lading repository and Bill of Lading View; Rate Quote (costing of voluntary tender moves without creating an actual shipment transaction); Site Configuration
(for TOs/ITOs to set up their location information); Discrepancy Information System/Transportation Discrepancy Report (DIS/TDR); Transportation Facilities Guide; Approved Carrier List;
and Customer Added Value Suite (CAVS) and CAVS Downloads (carrier/industry tools). GFM provides the capability for TOs to monitor Carrier Performance at the installation and
national level with the Carrier Performance Module (CPM). CPM also automates the issuance of letters of warning and automates the non-use capability for both HQ SDDC and the ITOs.
GFM provides monthly training for DOD users and commercial carriers and on-line/HelpDesk assistance
GFM provides DOD-approved shipping activities and contractors with a cost effective and efficient suite of web-based transportation business tools to support multi-modal DOD shipment
planning and execution utilizing commercial transportation services. GFM complements DOD tactical transportation systems by providing military ITOs and agencies with the ability to
support unit deployment, sustainment and redeployment activities. GFM is used at each of the Army’s power projection and power support platforms.
Narrative Justification:
Description
Mission Benefits
Deliverables
Economic Analysis
Impact
Software
Fund 9B United States Transportation Command
CAPITAL BUDGET
100

Fund 9B
(Dollars in Thousands)
Activity Group Capital Investment Justification
Air Force Working Capital Fund
Transportation Working Capital Fund (TWCF)
Fiscal Year (FY) 2021
Budget Estimates
February 2020
Department of the Air Force Line No. & Item Description Activity Identification
Surface Deployment and Distribution Command Global Surface Distribution Management (GSDM) SDDC
Element of Cost Quantity Unit Cost Total Cost Quantity Unit Cost Total Cost Quantity Unit Cost Total Cost
B. ADPE/Telecomm 0 650.0 650.0 0 0.0 0.0 0 0.0 0.0
Total 0 650.0 650.0 0 0.0 0.0 0 0.0 0.0
FY19-FY20 - Provide IT Support for HQ and Out Ports (network management, information assurance, help desk support, flag support); provide maintenance support for
deployable communications capability (equipment and bandwidth); refresh end-of-life IT infrastructure equipment including computers, laptops, monitors, printers, routers,
switches, servers, and IT peripherals; renew software and hardware maintenance support contracts that support HQ and Out Ports; provide technical support and maintenance
support for HQ and Out Port Video teleconference capabilities. Develop and field a new Hand Held Terminal (HHT) capability for Out Ports
N/A
Without a new HHT capability, port personnel will be required to manually re-key information into transportation systems, thereby introducing duplication of effort (inefficiency)
and data quality issues due to typographic errors or missing data fields. In turn, data quality issues potentially lead to lost ITV for critical in-transit items and equipment.
No license fees are associated with this investment.
FY2021FY2020FY2019
Hand Held Terminal (HHT) capability provides Out Port personnel the capability to automatically scan bar code and Transportation Management Control Document (TCMD)
information from items in transit, upload that information to transportation information systems, and thereby efficiently manage the movement and in-transit visibility (ITV) for
those items.
The current HHT devices in use by port personnel lack state-of-the-art Information Assurance capabilities and will no longer be allowed to connect to NETCOM-owned networks
beginning in FY19. A new HHT capability is therefore required that enables port personnel to continue to automatically scan and upload in-transit item and equipment
information.
Narrative Justification:
Description
Mission Benefits
Deliverables
Economic Analysis
Impact
Software
Fund 9B United States Transportation Command
CAPITAL BUDGET
101

Fund 9B
(Dollars in Thousands)
Activity Group Capital Investment Justification
Air Force Working Capital Fund
Transportation Working Capital Fund (TWCF)
Fiscal Year (FY) 2021
Budget Estimates
February 2020
Department of the Air Force Line No. & Item Description Activity Identification
Surface Deployment and Distribution Command Integrated Booking System (IBS) SDDC
Element of Cost Quantity Unit Cost Total Cost Quantity Unit Cost Total Cost Quantity Unit Cost Total Cost
C. Software Development 0 4,660.0 4,660.0 0 4,753.0 4,753.0 0 4,848.0 4,848.0
Total 0 4,660.0 4,660.0 0 4,753.0 4,753.0 0 4,848.0 4,848.0
- Transform IBS into a agile suite of business services, replacing the legacy system applications with a process-model driven application which will significantly reduce time to deliver system change
requests and expedite solutions to meet user requirements - Implement new rates in support of the Universal Service Contract 9 (USC9) and Guantanamo Bay Cuba
Contracts
Certified 15 Jun 10.
If not funded, IBS will be unable to support United States Transportation Command's and SDDC's mission to provide efficient and cost effective projection of forces; nor provide improved end-to-end joint
deployment and distribution. Specifically, maintenance, new software development, and independent verification and validation contracts supporting ocean contract management and sealift requirement
processing will terminate. Without commercial contract support, IBS will not be able to function and DOD ocean cargo movement would not be supported by an automated system. In addition, pricing and
processing of electronic carrier feeds will no longer maintain valid information requiring manual payment intervention by SDDC booking offices.
No license fees are associates with this investment.
FY2021FY2020FY2019
The Integrated Booking System (IBS) is the lead execution system of the Defense Transportation System (DTS) for the global shipment of ocean cargo in support of all wars, major contingencies and
humanitarian relief operations where our military forces are deployed as well as sustainment of forces worldwide. The IBS consists of the following applications: Carrier Analysis and Rate Evaluation
Headquaters (CARE HQ); Carrier Analysis and Rate Evaluation Headquarters Service Application (CARE SA), Requirements Forecasting and Rate Analysis Module (RF-RAM); Unit, Sustainment; One
Time Only (OTO) Commercial Sealift Solutions (CSS); Ocean Carrier Interface (OCI); Vessel Schedule; electronic Shipper System (eSS); Reference Data (RD) Fleet Management (FM) and Advanced
Transportation Control and Movement Documentation (ATCMD). These applications provide automated tools to: support carrier contract requirement definition; rate and service solicitations and
evaluation; capture vessel schedules; book unit and sustainment cargo; produce shipment documentation; provide cargo offering and status information; produce payment information.
IBS supports Military Surface Deployment and Distribution Command's (SDDC) global surface deployment command & control and distribution mission by providing automated tools to support rapid,
effective and efficient projections of power CONUS and OCONUS. IBS provides end-to-end distribution and visibility of Department of Defense (DOD) cargo from time of request until payment to the ocean
carrier for services provided. IBS ensures the most cost effective routing of cargo is utilized while ensuring the war fighter receives his cargo on time and cargo preference laws are met. In addition, IBS
provides tools for carrier contract requirement definition; rate and service solicitations and evaluation; capture vessel schedules; book unit and sustainment cargo; produce shipment documentation; provide
cargo offering and event status information; and produce payment information. IBS provides high-level data quality edits with instantaneous in-the-clear error messages and utilizes Electronic Commerce
and Electronic Data Interchange (EDI) standards. SDDC's Electronic Transportation Acquisition (ETA) web portal provides DOD transportation officials with a single sign-on capability to access IBS for their
transportation needs.
Narrative Justification:
Description
Mission Benefits
Deliverables
Economic Analysis
Impact
Software
Fund 9B United States Transportation Command
CAPITAL BUDGET
102

Fund 9B
(Dollars in Thousands)
Activity Group Capital Investment Justification
Air Force Working Capital Fund
Transportation Working Capital Fund (TWCF)
Fiscal Year (FY) 2021
Budget Estimates
February 2020
Department of the Air Force Line No. & Item Description Activity Identification
USTRANSCOM Command Staff Joint Flow & Analysis Sys for Trans (JFAST) Command Staff
Element of Cost Quantity Unit Cost Total Cost Quantity Unit Cost Total Cost Quantity Unit Cost Total Cost
C. Software Development 0 4,798.0 4,798.0 0 0.0 0.0 0 0.0 0.0
Total 0 4,798.0 4,798.0 0 0.0 0.0 0 0.0 0.0
- Provide stand-alone version of Modernized JFAST for use on TS plans in TS environment
- Finish transition to SIPR cloud host
- Provide a separate virtualized training vs test environment
- Provide enhancements to modernized JFAST to include changes to reports, modernized scheduler, and sustainment generator for the multi-nodal/multi-modal modeling algorithms
- Update and upgrade the virtual server environment so that the supporting technology stack (e.g., OS, DB, Web Server, etc.) on production, pre-production/test/training environments are all current
- Support TS Plan Modeling and transportation feasibility certification on JWICS
The JFAST Increment III EA, updated 08 Aug 16 (Revision 3), addressed TWCF Capital funding from FY12 - FY17, and it confirmed the initial recommendation to implementation of JFAST Modernization
with Enhancements (NPV $47,665.3K) over the alternatives: JFAST Modernization without Enhancements (NPV $39,626.9K) and Status Quo (which was deemed a nonviable solution). The decision to
pursue JFAST Modernization with Enhancements was based on the operational benefits that result from investment in enhancements designed to provide JFAST users with increased capability to rapidly
assess transportation plans with greater levels of fidelity. The program is scheduled to proceed into full sustainment in the coming years, but is still working to close out all of the requirments for Inc III, which
will involve another update (revision 4) to the EA. This update is currently scheduled for an 04 Aug 17 completion date and will account for any FY18 TWCF CAP associated with the FY18 JFAST
requirements. Specifically, it will incorporate the latest program enhances and security previsions put under contract. For FY19 and FY20, the program does not currently have defined/approved
requirements for these budget years.
Without JFAST Modernization, continuation of JFAST as a viable system is in jeopardy, due to anticipated cessation of support in FY15 for the current language (Visual FoxPro) by the vendor, Microsoft.
Without modernization the system would have to be shut down because the software vulnerabilities would not be assessed. The war planning process would revert to an iterative, manpower intensive and
time consuming process affecting DoD force agility. Increment III completes the code re-write into a language that can be used, maintained and built upon for the foreseeable future and is approximately 20%
complete. Without JFAST modernization there would be no way to quickly model and certify war plans, deployment plans and retrograde plans for transportation feasibility.
No license fees are associates with this investment.
FY2021FY2020FY2019
The JFAST Modernization effort is being accomplished as two increments. Increment II was completed mid-FY14; Increment III is being accomplished mid-FY14 thru FY18. Using the framework established,
Increment III includes a system redesign to support Corporate Services Vision (CSV) requirements, completion of remaining code conversion, produce a fully web-enabled application, and address additional
new requirements/enhancements. JFAST was written in a computer language which is no longer supported for security thus making it no longer viable to sustain. This investment afforded USTRANSCOM
and those COCOMs that use the JFAST system with improved realism when analyzing Crisis Action Plans (CAPs), Operations Plans (OPLANs), Concept Plans (CONPLANs) with Time Phased Force
Deployment Data (TPFDD), Courses of Action (COAs), what-if scenarios, and exercise plans. FY17 TWCF Capital funding will support the continuation of Increment III. As a result, the EA was revised to
account for these changes in program cost, schedule, and capabilities. Additional capital required to convert to new Modernized JOPES interface and Schema (JFW).
The Joint Operational Planners at the Combatant Commands and Joint Headquarters are the primary users of JFAST and the benefactors of the modernized interface. JFAST is the system used to assess
transportation feasibility of the war plans, deployment plans, and retrograde plans. JFAST assesses in real-time, the transportation feasibility of unmoved deployment assets during execution, based on
available resources. The modernized version will be web-accessible. JFAST also provides the sustainment generator to show what the sustainment flow would be to support the forces. Anticipated benefits
include, but are not limited to: 1) enhance planning support for Agile Transportation for the 21st Century (AT21) requirements; 2) modernized, Multi-Mode Scheduler; 3) better collaboration using the same
version of the program; 4) continued vendor support of the underlying software (.NET) Framework; and 5) improved scenario run times and user experience with the program.
Narrative Justification:
Description
Mission Benefits
Deliverables
Economic Analysis
Impact
Software
Fund 9B United States Transportation Command
CAPITAL BUDGET
103

Fund 9B
(Dollars in Thousands)
Activity Group Capital Investment Justification
Air Force Working Capital Fund
Transportation Working Capital Fund (TWCF)
Fiscal Year (FY) 2021
Budget Estimates
February 2020
Department of the Air Force Line No. & Item Description Activity Identification
USTRANSCOM Command Staff Joint Mobility Control Group (JMCG-C4S) Command Staff
Element of Cost Quantity Unit Cost Total Cost Quantity Unit Cost Total Cost Quantity Unit Cost Total Cost
C. Software Development 0 3,450.0 3,450.0 0 0.0 0.0 0 0.0 0.0
Total 0 3,450.0 3,450.0 0 0.0 0.0 0 0.0 0.0
The FY19 - modernized the interface between JOPES and TransViz.
Certified on 12 Jul 12, provided program results rather than a comparison of alternatives. As reported in the EA, TransViz is expected to provide Life Cycle Cost (LCC) Benefits
of $99.649M (PV$), a Benefit-Cost Ratio of 2.97 (PV$), and a Return on Investment (ROI) of 3.95 (PV$).
Without this investment, United States Transportation Command (USTRANSCOM) will be unable to ensure both transportation feasibility and port life-support capability for the
supported CCMD's.
No license fees are associated with this investment.
FY2021FY2020FY2019
JMCG consists of the Transportation Visualizer (TransViz) which is an analysis tool that provides graphic visualization of Joint Operation Planning and Execution System
(JOPES) data in support of distribution strategic planning, crisis action planning, as well as theater-level planning. The interface between JOPES and TransViz is being updated
in preparation for future JOPES modernization. The Capital funds are being used exclusively to transition from JDNETS to an enterprise web service, Joint Planning Execution
System (JPES) Frame Work (JFW).
It facilitates manipulation of unit line numbers (ULNs) to define and redefine sequencing to ensure both transportation feasibility and port life-support capability; collaboration
among Combatant Commanders (CCMD's), their component commands, supporting commanders, United States Transportation Command (USTRANSCOM), and its
components to quickly agree on proposed changes in support of making movement decisions. It provides an action officer the ability to identify trends, problems and
opportunities to improve movement options for requirements.
Narrative Justification:
Description
Mission Benefits
Deliverables
Economic Analysis
Impact
Software
Fund 9B United States Transportation Command
CAPITAL BUDGET
104

Fund 9B
(Dollars in Thousands)
Activity Group Capital Investment Justification
Air Force Working Capital Fund
Transportation Working Capital Fund (TWCF)
Fiscal Year (FY) 2021
Budget Estimates
February 2020
Department of the Air Force Line No. & Item Description Activity Identification
USTRANSCOM Command Staff Local Area Network (USTRANSCOM LAN) Command Staff
Element of Cost Quantity Unit Cost Total Cost Quantity Unit Cost Total Cost Quantity Unit Cost Total Cost
B. ADPE/Telecomm 0 6,109.0 6,109.0 0 5,917.0 5,917.0 0 5,861.0 5,861.0
C. Software Development 0 1,000.0 1,000.0 0 0.0 0.0 0 0.0 0.0
Total 0 7,109.0 7,109.0 0 5,917.0 5,917.0 0 5,861.0 5,861.0
'Tanium, CA Clarity
- DoD Enterprise Email Service
- COOP Sustainment
- ITSM Sustainment costs for Service Operations, AV/VTC Support, Project Portfolio Management, Tool Management, Web Development and Support, IT Project Management,
Certification & Accreditation Support, Conference Room Support, and Command-wide FACCSM support
- EOL replacement of the following items:
- Switches for infrastructure - 62 SIPRNET
N/A.
The interruption of capabilities would lead to rapid degradation of Command and Control for all aspects of the JDDE. Gaps in reporting data would immediately affect the
Commanders decision cycle, crippling the ability of USTRANSCOM to accomplish its mission of managing Department of Defense transportation assets. We would also lose the
redundancy that we have built into the USTRANSCOM LAN to diminish any mission impact.
No license fees are associates with this investment.
FY2021FY2020FY2019
USTRANSCOM Local Area Network (LAN) a critical system supporting the Command and Control (C2) communications of the USTRANSCOM Commander and his staff. It is
comprised of ~ 6000 distinct personal computers, numerous servers and routers, a multitude of switches, and the hardware and software infrastructure comprising the classified
and unclassified LANs at the USTRANSCOM command site on Scott AFB, IL. This program supports the following activities: Upgrade of network infrastructure to support
increasing bandwidth, service, systems and reliability requirements. Server upgrades, network router and switch upgrades, cable installation, network component upgrades, and
wide area network connectivity with component commands. Upgrade of standard server Commercial-off-the-Shelf (COTS) products. Provides worldwide Joint Deployment and
Distribution Environment (JDDE) theater-centric Command, Control, Communications and Computers (C4) infrastructure baseline assessments, engineering and documentation.
Provides hardware and system installation support. Provides studio and portable Video Teleconferencing (VTC) technical upgrade support. Provides Audio Visual (AV)
presentation system technical upgrade support. Based on the outcome of the review, funding may require future adjustments.
The USTRANSCOM networks are comprised of classified and unclassified Local Area Network (LAN) segments and Wide Area Network (WAN) connectivity with transportation
component commands (TCCs). USTRANSCOM LAN provides the critical backbone for the entire USTRANSCOM C2 capability. This critical infrastructure directly supports the
70+ C2 mission systems that are inherent with USTRANSCOM, providing a global picture for CCMDs on global logistical and patient movements.
Narrative Justification:
Description
Mission Benefits
Deliverables
Economic Analysis
Impact
Software
Fund 9B United States Transportation Command
CAPITAL BUDGET
105

Fund 9B
(Dollars in Thousands)
Activity Group Capital Investment Justification
Air Force Working Capital Fund
Transportation Working Capital Fund (TWCF)
Fiscal Year (FY) 2021
Budget Estimates
February 2020
Department of the Air Force Line No. & Item Description Activity Identification
Air Mobility Command Mobility Air Forces Flight Planning Service HQ AMC, Scott AFB IL
Element of Cost Quantity Unit Cost Total Cost Quantity Unit Cost Total Cost Quantity Unit Cost Total Cost
C. Software Development 0 6,193.0 6,193.0 0 0.0 0.0 0 0.0 0.0
Total 0 6,193.0 6,193.0 0 0.0 0.0 0 0.0 0.0
FY18-Conclude development of Release 1.
FY19-Testing for MAFPS Release 2. Release 2 will provide additional operational capability to include automated standard departure, auto weather avoids, automatic
destination alternate recommendations, economic fuel cost, preferred routings, flight plan validation (Eurocontrol).
Initial Business Case Analysis (BCA) completed August 2011. Economic Analysis updated BCA in March 2013. Last review completed in 2014.
If not funded, the costs to operate MAF missions will increase as airspace routes become unavailable or less advantageous due to declining competitiveness of AMC flight
planning system vice current and emerging commercial flight planning systems. AMC will be unable to access preferred air space routes and continue inefficient and labor
intensive practices.
Windows Server Datacenter (Enclave bill), RHEL for Datacenters (Enclave bill) JBoss EAP (Enclave bill), Oracle DBEE (USTC ULA), Oracle Partitioning (USTC ULA), Oracle
Golden Gate (USTC ULA,) Oracle Veridata, Oracle RAC , RHEL for Physical.
FY2021FY2020FY2019
Mobility Air Force Flight Planning Service (MAFPS) replaces the existing Mobility Air Force (MAF) flight planning system Advanced Computer Flight Plan (ACFP) which has lost
pace with the technical and operational environments. ACFP was directed to stop development in 2003 pending Joint Mission Planning System (JMPS) fielding of a mission
planning system to include Tanker/ Airlift/ Special Mission (TASM) flight planning functionality. Cancellation of TASM module from the greater JMPS program has driven an
immediate need to find the best solution for a maintainable MAF flight planning system to include applicable Doctrine, Organization, Training, Material, Leadership, Personnel,
Facilities (DOTMLPF) attributes. Current MAF flight planning activities are inefficient, ineffective, and labor intensive. This impairs or prohibits the MAF use of modernized
international civilian airspace and air traffic control systems which provide fuel efficiencies and mission velocity.
Incorporates new airspace designs and preferred/required routing referential data automatically. Provides future capability to allow MAF missions to continue flying above Flight
Level (FL) 250 and Performance Based Navigation routes in US, North Atlantic and European airspace beginning as early as FY16. Performs flight planning calculations for all
AMC aircraft and missions as well as provides reporting and interface/displays and imports referential and temporal data required to create flight plans.
Narrative Justification:
Description
Mission Benefits
Deliverables
Economic Analysis
Impact
Software
Fund 9B United States Transportation Command
CAPITAL BUDGET
106
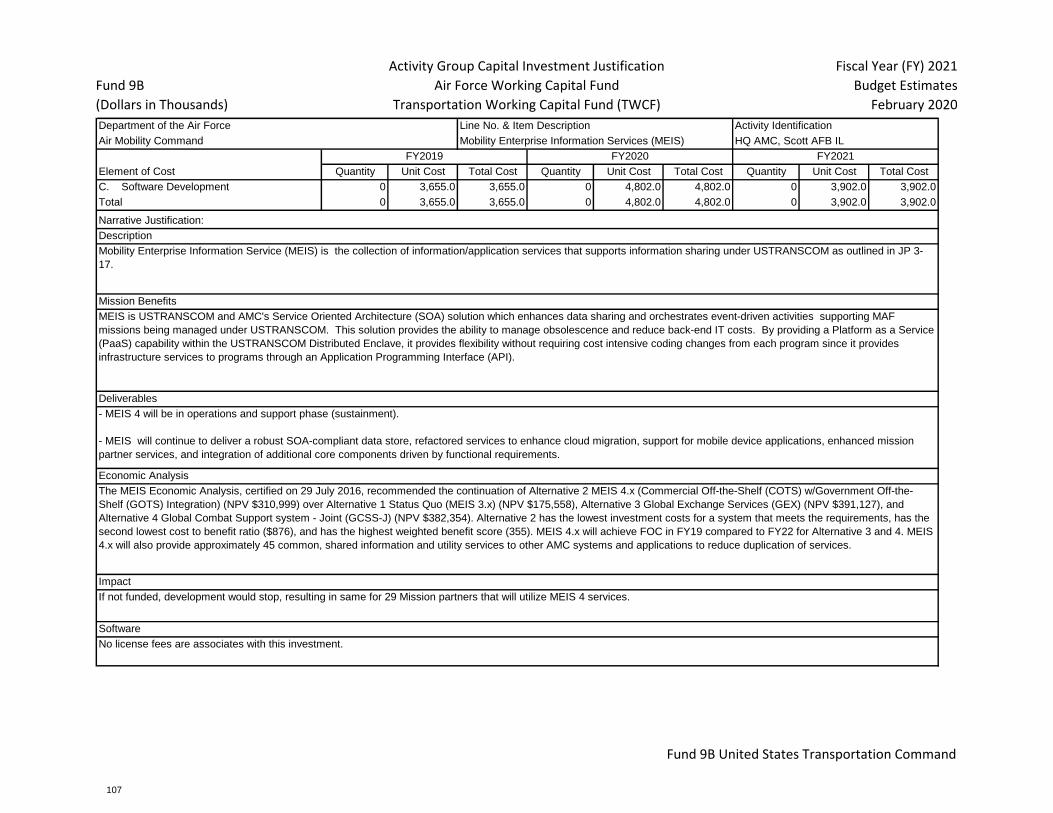
Fund 9B
(Dollars in Thousands)
Activity Group Capital Investment Justification
Air Force Working Capital Fund
Transportation Working Capital Fund (TWCF)
Fiscal Year (FY) 2021
Budget Estimates
February 2020
Department of the Air Force Line No. & Item Description Activity Identification
Air Mobility Command Mobility Enterprise Information Services (MEIS) HQ AMC, Scott AFB IL
Element of Cost Quantity Unit Cost Total Cost Quantity Unit Cost Total Cost Quantity Unit Cost Total Cost
C. Software Development 0 3,655.0 3,655.0 0 4,802.0 4,802.0 0 3,902.0 3,902.0
Total 0 3,655.0 3,655.0 0 4,802.0 4,802.0 0 3,902.0 3,902.0
- MEIS 4 will be in operations and support phase (sustainment).
- MEIS will continue to deliver a robust SOA-compliant data store, refactored services to enhance cloud migration, support for mobile device applications, enhanced mission
partner services, and integration of additional core components driven by functional requirements.
The MEIS Economic Analysis, certified on 29 July 2016, recommended the continuation of Alternative 2 MEIS 4.x (Commercial Off-the-Shelf (COTS) w/Government Off-the-
Shelf (GOTS) Integration) (NPV $310,999) over Alternative 1 Status Quo (MEIS 3.x) (NPV $175,558), Alternative 3 Global Exchange Services (GEX) (NPV $391,127), and
Alternative 4 Global Combat Support system - Joint (GCSS-J) (NPV $382,354). Alternative 2 has the lowest investment costs for a system that meets the requirements, has the
second lowest cost to benefit ratio ($876), and has the highest weighted benefit score (355). MEIS 4.x will achieve FOC in FY19 compared to FY22 for Alternative 3 and 4. MEIS
4.x will also provide approximately 45 common, shared information and utility services to other AMC systems and applications to reduce duplication of services.
If not funded, development would stop, resulting in same for 29 Mission partners that will utilize MEIS 4 services.
No license fees are associates with this investment.
FY2021FY2020FY2019
Mobility Enterprise Information Service (MEIS) is the collection of information/application services that supports information sharing under USTRANSCOM as outlined in JP 3-
17.
MEIS is USTRANSCOM and AMC's Service Oriented Architecture (SOA) solution which enhances data sharing and orchestrates event-driven activities supporting MAF
missions being managed under USTRANSCOM. This solution provides the ability to manage obsolescence and reduce back-end IT costs. By providing a Platform as a Service
(PaaS) capability within the USTRANSCOM Distributed Enclave, it provides flexibility without requiring cost intensive coding changes from each program since it provides
infrastructure services to programs through an Application Programming Interface (API).
Narrative Justification:
Description
Mission Benefits
Deliverables
Economic Analysis
Impact
Software
Fund 9B United States Transportation Command
CAPITAL BUDGET
107
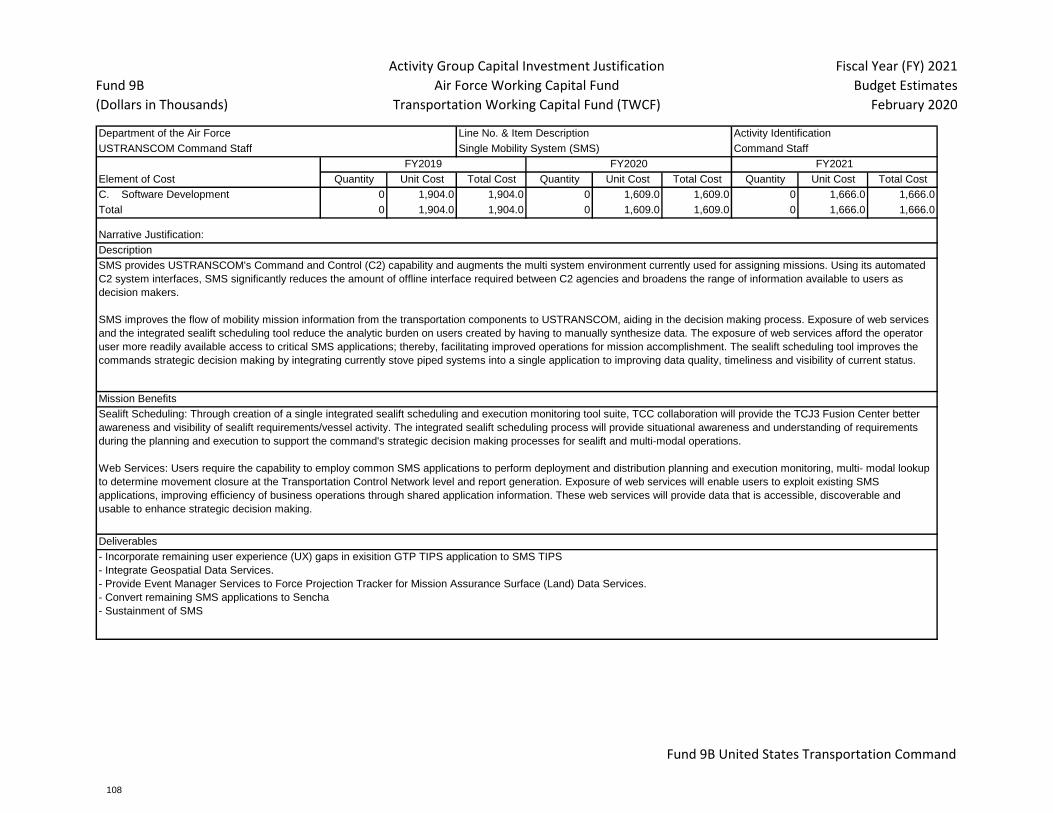
Fund 9B
(Dollars in Thousands)
Activity Group Capital Investment Justification
Air Force Working Capital Fund
Transportation Working Capital Fund (TWCF)
Fiscal Year (FY) 2021
Budget Estimates
February 2020
Department of the Air Force Line No. & Item Description Activity Identification
USTRANSCOM Command Staff Single Mobility System (SMS) Command Staff
Element of Cost Quantity Unit Cost Total Cost Quantity Unit Cost Total Cost Quantity Unit Cost Total Cost
C. Software Development 0 1,904.0 1,904.0 0 1,609.0 1,609.0 0 1,666.0 1,666.0
Total 0 1,904.0 1,904.0 0 1,609.0 1,609.0 0 1,666.0 1,666.0
- Incorporate remaining user experience (UX) gaps in exisition GTP TIPS application to SMS TIPS
- Integrate Geospatial Data Services.
- Provide Event Manager Services to Force Projection Tracker for Mission Assurance Surface (Land) Data Services.
- Convert remaining SMS applications to Sencha
- Sustainment of SMS
FY2021FY2020FY2019
SMS provides USTRANSCOM's Command and Control (C2) capability and augments the multi system environment currently used for assigning missions. Using its automated
C2 system interfaces, SMS significantly reduces the amount of offline interface required between C2 agencies and broadens the range of information available to users as
decision makers.
SMS improves the flow of mobility mission information from the transportation components to USTRANSCOM, aiding in the decision making process. Exposure of web services
and the integrated sealift scheduling tool reduce the analytic burden on users created by having to manually synthesize data. The exposure of web services afford the operator
user more readily available access to critical SMS applications; thereby, facilitating improved operations for mission accomplishment. The sealift scheduling tool improves the
commands strategic decision making by integrating currently stove piped systems into a single application to improving data quality, timeliness and visibility of current status.
Sealift Scheduling: Through creation of a single integrated sealift scheduling and execution monitoring tool suite, TCC collaboration will provide the TCJ3 Fusion Center better
awareness and visibility of sealift requirements/vessel activity. The integrated sealift scheduling process will provide situational awareness and understanding of requirements
during the planning and execution to support the command's strategic decision making processes for sealift and multi-modal operations.
Web Services: Users require the capability to employ common SMS applications to perform deployment and distribution planning and execution monitoring, multi- modal lookup
to determine movement closure at the Transportation Control Network level and report generation. Exposure of web services will enable users to exploit existing SMS
applications, improving efficiency of business operations through shared application information. These web services will provide data that is accessible, discoverable and
usable to enhance strategic decision making.
Narrative Justification:
Description
Mission Benefits
Deliverables
Fund 9B United States Transportation Command
CAPITAL BUDGET
108
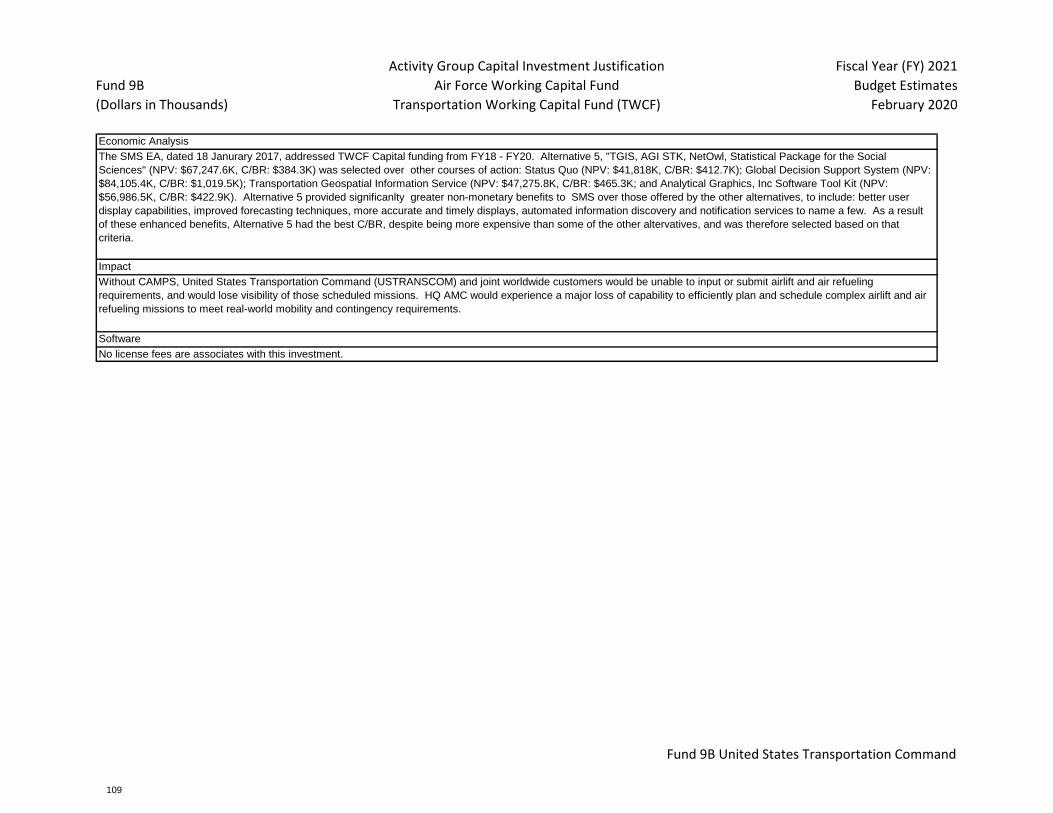
Fund 9B
(Dollars in Thousands)
Activity Group Capital Investment Justification
Air Force Working Capital Fund
Transportation Working Capital Fund (TWCF)
Fiscal Year (FY) 2021
Budget Estimates
February 2020
The SMS EA, dated 18 Janurary 2017, addressed TWCF Capital funding from FY18 - FY20. Alternative 5, "TGIS, AGI STK, NetOwl, Statistical Package for the Social
Sciences" (NPV: $67,247.6K, C/BR: $384.3K) was selected over other courses of action: Status Quo (NPV: $41,818K, C/BR: $412.7K); Global Decision Support System (NPV:
$84,105.4K, C/BR: $1,019.5K); Transportation Geospatial Information Service (NPV: $47,275.8K, C/BR: $465.3K; and Analytical Graphics, Inc Software Tool Kit (NPV:
$56,986.5K, C/BR: $422.9K). Alternative 5 provided significanlty greater non-monetary benefits to SMS over those offered by the other alternatives, to include: better user
display capabilities, improved forecasting techniques, more accurate and timely displays, automated information discovery and notification services to name a few. As a result
of these enhanced benefits, Alternative 5 had the best C/BR, despite being more expensive than some of the other altervatives, and was therefore selected based on that
criteria.
Without CAMPS, United States Transportation Command (USTRANSCOM) and joint worldwide customers would be unable to input or submit airlift and air refueling
requirements, and would lose visibility of those scheduled missions. HQ AMC would experience a major loss of capability to efficiently plan and schedule complex airlift and air
refueling missions to meet real-world mobility and contingency requirements.
No license fees are associates with this investment.
Economic Analysis
Impact
Software
Fund 9B United States Transportation Command
CAPITAL BUDGET
109

Fund 9B
(Dollars in Thousands)
Activity Group Capital Investment Justification
Air Force Working Capital Fund
Transportation Working Capital Fund (TWCF)
Fiscal Year (FY) 2021
Budget Estimates
February 2020
Department of the Air Force Line No. & Item Description Activity Identification
Surface Deployment and Distribution Command Transportation Financial Management System (TFMS) SDDC
Element of Cost Quantity Unit Cost Total Cost Quantity Unit Cost Total Cost Quantity Unit Cost Total Cost
C. Software Development 0 3,417.0 3,417.0 0 0.0 0.0 0 0.0 0.0
Total 0 3,417.0 3,417.0 0 0.0 0.0 0 0.0 0.0
- Provide functional and technical sustainment which includes Financial Business application, TFMS Tier II/III Helpdesk support
- Provide TFMS FIAR Compliance and modernization sustainment support
- Continue implementation of enterprise reporting tool and data warehouse software
- Continue re-development of all existing enterprise financial reports, create new financial reports with FIAR compliance
- Start TFMS "Cloud Native" effort.
N/A
If not funded, SDDC will lose software support for Oracle Discoverer and the EBS from the software vendor and will be non-compliant with Office of the Secretary of Defense
(OSD) Comptroller's Department of Defense (DoD) Financial Management Strategy.
No license fees are associated with this investment.
FY2021FY2020FY2019
The Transportation Financial Management System (TFMS) is the financial management system solution in use by SDDC. TFMS is built on a Commercial-of-the-Self product,
Oracle Enterprise Business Suite. All major lines of business utilize TFMS to conduct their business including the Ocean Liner, Port Operations, Traffic Management and Global
POV Storage/DP3 contract. Increment II of TFMS modernization will acquire a reporting/data warehousing solution to replace Oracle Discoverer, develop interfaces with
emerging and existing systems such as the Audotmated Disbursing System, G-Invoicing, and an Integrated Multi-Modal Transportation Management System; and upgrade the
Oracle Enterprise Business Suite (EBS) software to a newer release. At a high level, this effort will involve acquiring and implementing a series of enhancements to TFMS in the
form of a new or revised Oracle EBS reports, interfaces, configurations, extensions, or worflows (RICE-W).
The information is used for accounting, purchasing,ordering, receipting, invoice payment and financial management/reporting functions. The TFMS system interfaces with other
systems such as payroll, travel, disbursing, and SDDC non-core accounting support systems. Interfaces also exist with information management and decision support systems
at USTRANSCOM. TFMS improves cash management, controls over assets, and reduces time lag in obtaining financial information. TFMS allows SDDC and DFAS to track on
a daily basis cash management and answer vendor payment issues and customer billing questions. TFMS modernization will extend the software's lifecycle, enhance reporting
capabilities, and employ system interfaces that will improve auditiablity.
Narrative Justification:
Description
Mission Benefits
Deliverables
Economic Analysis
Impact
Software
Fund 9B United States Transportation Command
CAPITAL BUDGET
110

Fund 9B
(Dollars in Thousands)
Activity Group Capital Investment Justification
Air Force Working Capital Fund
Transportation Working Capital Fund (TWCF)
Fiscal Year (FY) 2021
Budget Estimates
February 2020
Department of the Air Force Line No. & Item Description Activity Identification
Air Mobility Command 618 Air Operations Center (618AOC) HQ AMC, Scott AFB IL
Element of Cost Quantity Unit Cost Total Cost Quantity Unit Cost Total Cost Quantity Unit Cost Total Cost
B. ADPE/Telecomm 0 0.0 0.0 0 2,439.0 2,439.0 0 0.0 0.0
Total 0 0.0 0.0 0 2,439.0 2,439.0 0 0.0 0.0
FY20: Boundary equipment will include network firewalls, routers, switches, web security appliances, voice systems, servers, and logging systems. These equipment will
enhance network resiliency through layered protection/self-management and provide C2 mission assurance for all missions planned and executed.
N/A
618 AOC would remain on the Scott AFB domain, with no control of network traffic. Defense Threat Reduction Agency (DTRA) and 38th Cyberspace Engineering Installation
Group recommended separate cyber boundary for 618 AOC to reduce vulnerabilities and improve mission assurance. All other geographic/global AOCs have separate,
contracted cyber boundary. Continued reliance on existing networks have jeopardized, and will continue to jeopardize, the execution of missions essential for the projection of
national power.
N/A
FY2021FY2020FY2019
618th Air Operations Center plans, directs, manages and controls the execution of all airlift and air refueling resources assigned to Air Mobility Command, the air component to
United States Transportation Command. 618 AOC Data & Web Services System provides the tools and technology to develop programs in response to the informational needs
of those responsible for the planning and execution of global air mobility operations. The technical support services provided by the 618 AOC Data & Web Services System
increase economy and efficiency, implement changed functional requirements, and fill in the gaps caused by deficiencies in existing capabilities. The 618 AOC Cyber Boundary
supports mission assurance and operations by enhancing the 618 AOC network resiliency through layered protection and self-management, to mitigate the effects of base
network/AFNET outages and locally control disturbances to the AOC network from outside sources.
There are numerous benefits that will be provided by the AOC Boundary to increase operational control for 618 AOC/CC. First, the boundary will provide strengthened
cybersecurity through increased vulnerability management and enhanced network monitoring. Additionally, it will fortify the resiliency of the network by providing redundant
paths for network service. By halting AFNET pushes that can cause system outages, it will also provide much needed self-management capabilities. Finally, since the AOC will
no longer compete for bandwidth amongst all Scott AFB users, it will provide prioritized network throughput to streamline operations.
Narrative Justification:
Description
Mission Benefits
Deliverables
Economic Analysis
Impact
Software
Fund 9B United States Transportation Command
CAPITAL BUDGET
111

Fund 9B
(Dollars in Thousands)
Activity Group Capital Investment Justification
Air Force Working Capital Fund
Transportation Working Capital Fund (TWCF)
Fiscal Year (FY) 2021
Budget Estimates
February 2020
Department of the Air Force Line No. & Item Description Activity Identification
Air Mobility Command Minor Construction-AMC HQ AMC, Scott AFB IL
Element of Cost Quantity Unit Cost Total Cost Quantity Unit Cost Total Cost Quantity Unit Cost Total Cost
D. Minor Construction 0 3,372.0 3,372.0 0 3,800.0 3,800.0 0 3,800.0 3,800.0
Total 0 3,372.0 3,372.0 0 3,800.0 3,800.0 0 3,800.0 3,800.0
MC Attachment provides projects listed by year.
EA or Cost Analysis (CA) to be accomplished by project depended on cost of project.
Funding cuts will impact our ability to support critical HQ AMC, 515 Air Mobility Operations Wing (AMOW), and 521 AMOW requirements to enhance or improve mobility
operations and provide adequate force protection through the construction of new facilities and additions in the Continental United States (CONUS) and en-route infrastructure.
Reductions to this program will have a negative impact on our ability to provide seamless airlift from point of origin to destination, to provide quality customer service, and to
bring our existing facilities up to HQ AMC and Air Force standards. Many TWCF facilities are old, inadequate facilities, far from meeting acceptable standards, especially at our
en-route locations. Pavement requirements continue to grow for both new parking/loading/refueling areas and required improvements on deteriorating pavement resulting from
heavy airlift use. Unfunded pavement requirements will result in limitations on AMC's ability to deliver passengers and cargo anywhere in the world. Passengers, troops, and
valuable cargo and equipment will remain inadequately protected from terrorist threats.
Not Applicable.
FY2021FY2020FY2019
Minor Construction (MC) funds all minor construction work to rebuild new facilities or construct additions to existing facilities that qualify for Transportation Working Capital Funds
(TWCF).
The Headquarters Air Mobility Command (HQ AMC) TWCF investment strategy is in line with the Department of Defense (DoD) Transportation Vision for the Twenty-First
Century. It's intent is to ensure sustainability and quality of life. One of the guiding principles requires us to invest in transportation programs, systems, and enhancements that
support mobility requirements, assets visibility, and efficient transportation operations.
Narrative Justification:
Description
Mission Benefits
Deliverables
Economic Analysis
Impact
Software
Fund 9B United States Transportation Command
CAPITAL BUDGET
112

Fund 9B
(Dollars in Thousands)
Activity Group Capital Investment Justification
Air Force Working Capital Fund
Transportation Working Capital Fund (TWCF)
Fiscal Year (FY) 2021
Budget Estimates
February 2020
Department of the Air Force Line No. & Item Description Activity Identification
Surface Deployment and Distribution Command Minor Construction-SDDC SDDC
Element of Cost Quantity Unit Cost Total Cost Quantity Unit Cost Total Cost Quantity Unit Cost Total Cost
D. Minor Construction 0 2,900.0 2,900.0 0 3,540.0 3,540.0 0 7,400.0 7,400.0
Total 0 2,900.0 2,900.0 0 3,540.0 3,540.0 0 7,400.0 7,400.0
FY20: 1-Upgrade Solar Array (MOTSU) ($990); 2-Relocate Contractors Row ($750) (MOTSU); 3-Convert Bldg 18 to Equipment Preposition (MOTSU) ($500); 4-SEAD Mission
Operations Building (832nd) ($1300)
FY21: Install Second Connection to Brunswick Co Water (MOTSU)($800); Upgrade to 500 Pads (503 and 504) (MOTSU) ($750); Construct Equipment Shelter (North Wharf
Hardstand) (MOTSU) ($750); Rail Crossover near ACP-3 (MOTCO) ($2000); Expand Class Yard1 (MOTCO) ($2000); Construct Rail Inspection Station (MOTCO) ($1000)
N/A
Projects ensure continuous operations and support for the terminals' important warfighting mission
N/A
FY2021FY2020FY2019
Most Surface Deployment and Distribution Command (SDDC) Minor Construction projects are currently scheduled for Military Ocean Terminal Sunny Point (MOTSU). MOTSU
is the premier Department of Defense ammunition terminal and is considered a vital part of the strategic Continental United States (CONUS) power projection platform
supporting warfighting Commanders around the world. It is relied upon to maintain a high OPTEMPO consisting of ammunition resupply missions pre-position operations, and
Foreign Military Sales operations
1. Solar Array: Second Phase to complete project. Provides back up electrical supply to Mission Critical facilities to maintain Mission during power outages. 2. Relocate
Contractors Row: In order to be within the downrange to have easier access to down range. Cannot expand the current area because of the endangered gopher frog. 3.
Narrative Justification:
Description
Mission Benefits
Deliverables
Economic Analysis
Impact
Software
Fund 9B United States Transportation Command
CAPITAL BUDGET
113

Fund 9C
(Dollars in Millions)
Activity Group Capital Investment Justification
Air Force Working Capital Fund
Transportation Working Capital Fund (TWCF)
Fiscal Year (FY) 2021
Budget Estimates
February 2020
United States Transportation Command
Current
Approved Approved Proj Asset/
FY Item Description Project Reprogs Proj Cost Cost (Est) Deficiency Explanation
19 A. Equipment 2.8 (1.0) 1.8 2.3 (0.5)
19 Equipment-AMC 0.5 (0.5) 0.0 0.5 (0.5)USTC reprogrammed $400K for higher priority; funds of
$100K not executed.
19 Equipment-SDDC 1.8 0.0 1.8 1.8 0.0
19 B. ADPE/Telecomm 34.2 1.8 36.0 20.0 16.0
19Distribution Process Owner (DPO) Secure Enclave
(DSE)/Common Computing Environment (CCE)3.1 (3.1) 0.0 0.0 0.0
19 Local Area Network (USTRANSCOM LAN) 4.9 1.2 6.1 6.1 0.0
19 Equipment-AMC 8.0 (4.8) 3.2 0.0 3.2MAM approved additional funds for Hardware requirements
for Enclave. Program Hardware requirements were pulled
from FY19.
19 Minor Construction-AMC 8.0 4.8 12.8 0.0 12.8MAM approved additional funds for Hardware requirements
for Enclave. Program Hardware requirements were pulled
from FY19.
19 Objective Wing Command Post (OWCP) 1.0 (1.0) 0.0 0.0 0.0
19 USTRANSCOM Distributive Enclave (USTC DE) 7.1 6.2 13.3 13.3 0.0 Reprogram from multiple programs to increase HW Storage
19 Global Surface Distribution Management (GSDM) 0.7 0.0 0.7 0.7 0.0
19 USTRANSCOM Centralized Enclave (USTC CE) 1.5 (1.5) 0.0 0.0 0.0
19 C. Software Development 130.6 (22.8) 107.8 57.0 50.7
19 Agile Trans for the 21st Century (AT21) 0.0 0.0 0.0 0.0 0.0
19 Analysis of Mobility Platform (AMP) 3.1 0.0 3.1 3.0 0.1
19Distribution Process Owner (DPO) Secure Enclave
(DSE)/Common Computing Environment (CCE)3.3 (0.7) 2.5 2.0 0.5
Fund 9C United States Transportation Command
CAPITAL BUDGET
114
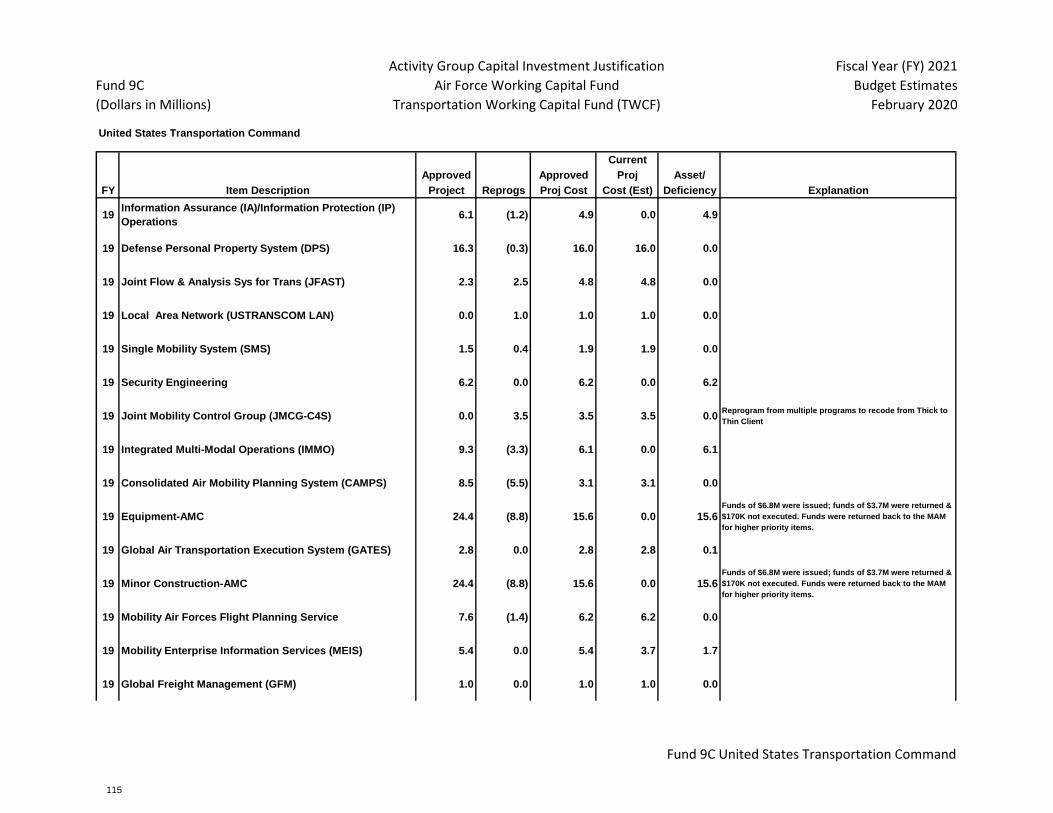
Fund 9C
(Dollars in Millions)
Activity Group Capital Investment Justification
Air Force Working Capital Fund
Transportation Working Capital Fund (TWCF)
Fiscal Year (FY) 2021
Budget Estimates
February 2020
United States Transportation Command
Current
Approved Approved Proj Asset/
FY Item Description Project Reprogs Proj Cost Cost (Est) Deficiency Explanation
19Information Assurance (IA)/Information Protection (IP)
Operations6.1 (1.2) 4.9 0.0 4.9
19 Defense Personal Property System (DPS) 16.3 (0.3) 16.0 16.0 0.0
19 Joint Flow & Analysis Sys for Trans (JFAST) 2.3 2.5 4.8 4.8 0.0
19 Local Area Network (USTRANSCOM LAN) 0.0 1.0 1.0 1.0 0.0
19 Single Mobility System (SMS) 1.5 0.4 1.9 1.9 0.0
19 Security Engineering 6.2 0.0 6.2 0.0 6.2
19 Joint Mobility Control Group (JMCG-C4S) 0.0 3.5 3.5 3.5 0.0Reprogram from multiple programs to recode from Thick to
Thin Client
19 Integrated Multi-Modal Operations (IMMO) 9.3 (3.3) 6.1 0.0 6.1
19 Consolidated Air Mobility Planning System (CAMPS) 8.5 (5.5) 3.1 3.1 0.0
19 Equipment-AMC 24.4 (8.8) 15.6 0.0 15.6Funds of $6.8M were issued; funds of $3.7M were returned &
$170K not executed. Funds were returned back to the MAM
for higher priority items.
19 Global Air Transportation Execution System (GATES) 2.8 0.0 2.8 2.8 0.1
19 Minor Construction-AMC 24.4 (8.8) 15.6 0.0 15.6Funds of $6.8M were issued; funds of $3.7M were returned &
$170K not executed. Funds were returned back to the MAM
for higher priority items.
19 Mobility Air Forces Flight Planning Service 7.6 (1.4) 6.2 6.2 0.0
19 Mobility Enterprise Information Services (MEIS) 5.4 0.0 5.4 3.7 1.7
19 Global Freight Management (GFM) 1.0 0.0 1.0 1.0 0.0
Fund 9C United States Transportation Command
CAPITAL BUDGET
115

Fund 9C
(Dollars in Millions)
Activity Group Capital Investment Justification
Air Force Working Capital Fund
Transportation Working Capital Fund (TWCF)
Fiscal Year (FY) 2021
Budget Estimates
February 2020
United States Transportation Command
Current
Approved Approved Proj Asset/
FY Item Description Project Reprogs Proj Cost Cost (Est) Deficiency Explanation
19 Integrated Booking System (IBS) 4.7 (0.1) 4.7 4.7 0.0
19 Transportation Financial Management System (TFMS) 3.5 0.0 3.5 3.4 0.1
19 D. Minor Construction 10.5 (1.0) 9.5 6.3 3.2
19 Minor Construction-AMC 3.8 (0.5) 3.3 3.4 (0.1)MC used $428K to cover PY MC costs and small amount not
executed.
19 Minor Construction-SDDC 2.9 0.0 2.9 2.9 0.0
19 TOTAL FY 178.1 (23.0) 155.1 85.6 69.5
Fund 9C United States Transportation Command
CAPITAL BUDGET
116

Fund 9C
(Dollars in Millions)
Activity Group Capital Investment Justification
Air Force Working Capital Fund
Transportation Working Capital Fund (TWCF)
Fiscal Year (FY) 2021
Budget Estimates
February 2020
United States Transportation Command
Current
Approved Approved Proj Asset/
FY Item Description Project Reprogs Proj Cost Cost (Est) Deficiency Explanation
20 A. Equipment 1.3 0.0 1.3 0.9 0.5
20 Equipment-AMC 0.5 0.0 0.5 0.5 0.0
20 Equipment-SDDC 0.3 0.0 0.3 0.4 (0.1)
20 B. ADPE/Telecomm 50.8 0.0 50.8 8.4 42.4
20 Local Area Network (USTRANSCOM LAN) 5.9 0.0 5.9 5.9 0.0
20 Equipment-AMC 21.2 18.8 40.0 0.0 40.0AOC Boundary approved in Hardware funds for FY20. No
Enclave HW funds approved by MAM in FY20. No GATES HW
approved by MAM in FY20.
20 Minor Construction-AMC 21.2 (18.8) 2.4 0.0 2.4AOC Boundary approved in Hardware funds for FY20. No
Enclave HW funds approved by MAM in FY20. No GATES HW
approved by MAM in FY20.
20 618 Air Operations Center (618AOC) 2.4 0.0 2.4 2.4 0.0
20 C. Software Development 53.4 0.0 53.4 33.6 19.8
20 Analysis of Mobility Platform (AMP) 3.1 0.0 3.1 3.1 0.0
20Distribution Process Owner (DPO) Secure Enclave
(DSE)/Common Computing Environment (CCE)1.4 0.0 1.4 1.4 0.0
20 Defense Personal Property System (DPS) 11.7 0.0 11.7 11.7 0.0
20 Single Mobility System (SMS) 1.6 0.0 1.6 1.6 0.0
20 Consolidated Air Mobility Planning System (CAMPS) 5.2 0.0 5.2 5.2 (0.0)
20 Equipment-AMC 10.4 0.4 10.8 0.0 10.8Slight increase approved by the MAM. READ program
transferred to Sub-MAM JOP&E.
20 Minor Construction-AMC 10.4 (0.4) 10.0 0.0 10.0Slight increase approved by the MAM. READ program
transferred to Sub-MAM JOP&E.
20 Mobility Enterprise Information Services (MEIS) 4.8 0.0 4.8 4.8 0.0
20 Global Freight Management (GFM) 0.0 0.0 0.0 1.0 (1.0)
Fund 9C United States Transportation Command
CAPITAL BUDGET
117

Fund 9C
(Dollars in Millions)
Activity Group Capital Investment Justification
Air Force Working Capital Fund
Transportation Working Capital Fund (TWCF)
Fiscal Year (FY) 2021
Budget Estimates
February 2020
United States Transportation Command
Current
Approved Approved Proj Asset/
FY Item Description Project Reprogs Proj Cost Cost (Est) Deficiency Explanation
20 Integrated Booking System (IBS) 4.8 0.0 4.8 4.8 0.0
20 D. Minor Construction 11.1 0.0 11.1 7.3 3.8
20 Minor Construction-AMC 3.8 0.0 3.8 3.8 0.0
20 Minor Construction-SDDC 3.5 0.0 3.5 3.5 0.0
20 TOTAL FY 116.6 0.0 116.6 50.2 66.4
Fund 9C United States Transportation Command
CAPITAL BUDGET
118