Embed Size (px)
Citation preview
United States – Canada Northern Oil and Gas Research Forum Nov. 13-15, 2012
D.B. Fissel1, P. D. Osborne2, E. Ross1, M.G. Lowings3. D. Driver4, D. Barber5, M. Fortier6 and K. Lévesque6
1 ASL Environmental Sciences Inc., Victoria, BC Canada; 2 IMG-Golder Corporation (Golder Associates Inc) Burnaby, BC, Canada; 3 IMG-Golder
Corporation (Golder Associates Ltd), Calgary, AB, Canada; 4BP Exploration, Houston, TX USA; 5ArcticNet, U. Manitoba, Winnipeg MB Canada;
6ArcticNet, U. Laval, QC, Canada
A Collaborative Program of Mooring Based Studies In the Ajurak and Pokak
Exploration Licence Areas of the Canadian Beaufort Sea, July 2009 to September
2011:Sea Ice and Ocean Waves
United States – Canada Northern Oil and Gas Research Forum Nov. 13-15, 2012
The Materials Presented are based upon work supported by:- Imperial Oil Resources Ventures Limited- BP Exploration Company and - ExxonMobil Canada
Acknowledgements
- J. Hawkins and N. Darlow, Imperial Oil Resources Ventures Ltd;- James Hall and Dmitri G. Matskevitch, ExxonMobil Upstream
Research;- Cynthia Pyc and David Driver, BP Exploration Company
ArcticNet is funded by:- the Networks of Centres of Excellence (NCE) Program of the
National Sciences and Engineering Research Council
(NSERC) of Canada
Research Program Review and Approval: Inuvialuit Settlement Region Community Consultations via Industry and ArcticNet
United States – Canada Northern Oil and Gas Research Forum Nov. 13-15, 2012
Collaborative Research Program- Introduction
• Early 2000’s: Renewed Interest in Offshore Oil and Gas Exploration of the Canadian Beaufort Sea
• 2007: Exploration licence (EL) 446 (Ajurak) - Imperial Oil Resources Ventures Limited (IORVL) and ExxonMobil Canada Limited
• 2008: Exploration licences EL 449 (Pokak), EL 451 and 453 to BP Exploration Operating Company Limited
• Adopted a risk-based approach to hydrocarbon exploration activities and interaction with the environment.
• 2009-2011: IORVL and BP adopting a multi-disciplinary, multi-year, collaborative data collection strategy.
• 2011: Formation of a new joint venture of BP and IORVL with Imperial Oil designated as the Operator (for EL 446/449)
United States – Canada Northern Oil and Gas Research Forum Nov. 13-15, 2012
Collaborative Research Program- Overview
A Multi-Disciplinary Industry-Academic Collaborative Research Program involving:
- IORVL and BP- ArcticNet (U. Laval, U. Manitoba and other member universities)- Consulting Companies (ASL, IMG-Golder and Kavik-Stantec)
2009-11: Major Program – Inshore to Far Offshore Areas
United States – Canada Northern Oil and Gas Research Forum Nov. 13-15, 2012
Data Collection Overview: 2009-2012- Ongoing
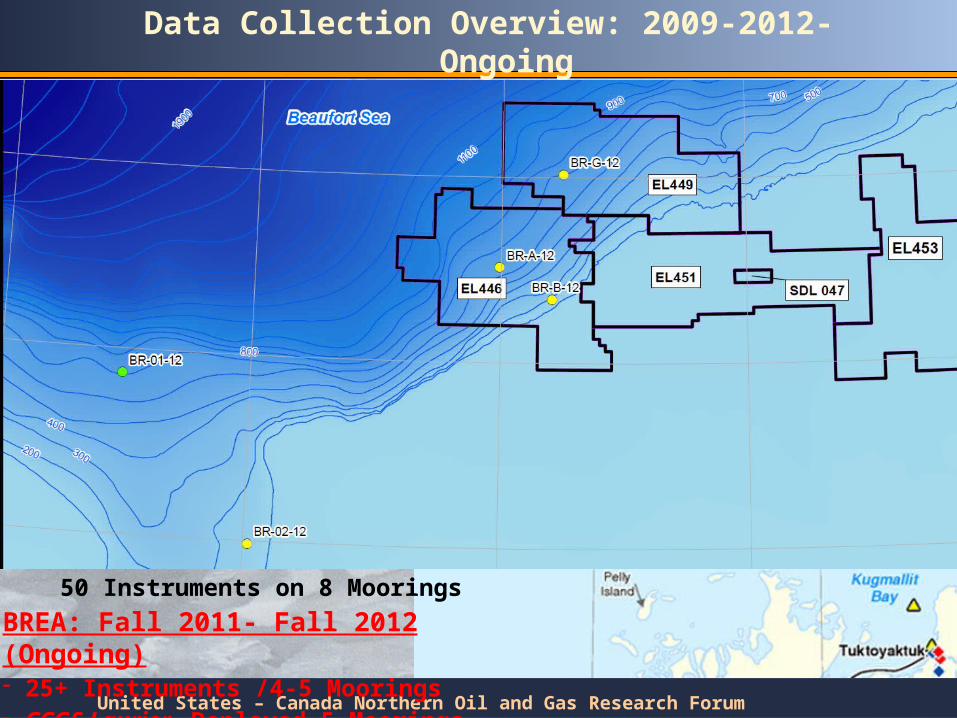
Summer 2009: CCGS Amundsen (late July-Sept.)- Outer Shelf and Slope: 9 Sub-surface
Moorings; 2 surface buoysCCGS Nahidik (mid July-mid Sept.)- Inner Shelf: 2 Moorings; extensive ship-based sampling
Fall 2009-Summer 2010:- Continuous Measurements from 50 Instruments on 8 Moorings
Summer 2010 and 2011:CCGS Amundsen (Aug.-Sept.)
Fall 2010-Summer 2011:- Continuous Measurements from 50 Instruments on 8 Moorings
BREA: Fall 2011- Fall 2012 (Ongoing)- 25+ Instruments /4-5 Moorings - CCGS Laurier - Deployed 5 Moorings
United States – Canada Northern Oil and Gas Research Forum Nov. 13-15, 2012
CCGS Amundsen Moorings Design
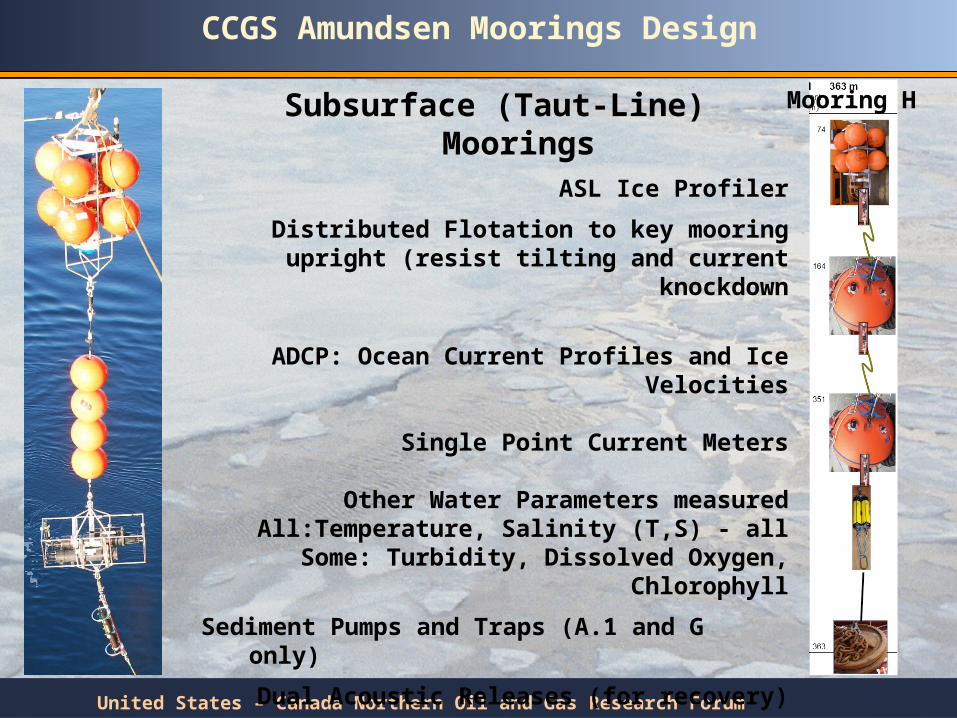
Subsurface (Taut-Line) MooringsASL Ice Profiler
Distributed Flotation to key mooring upright (resist tilting and current knockdown
ADCP: Ocean Current Profiles and Ice Velocities
Single Point Current Meters
Other Water Parameters measuredAll:Temperature, Salinity (T,S) - all
Some: Turbidity, Dissolved Oxygen, Chlorophyll
Sediment Pumps and Traps (A.1 and G only)
Dual Acoustic Releases (for recovery)
Steel Anchor Weights on bottom
Mooring H
United States – Canada Northern Oil and Gas Research Forum Nov. 13-15, 2012
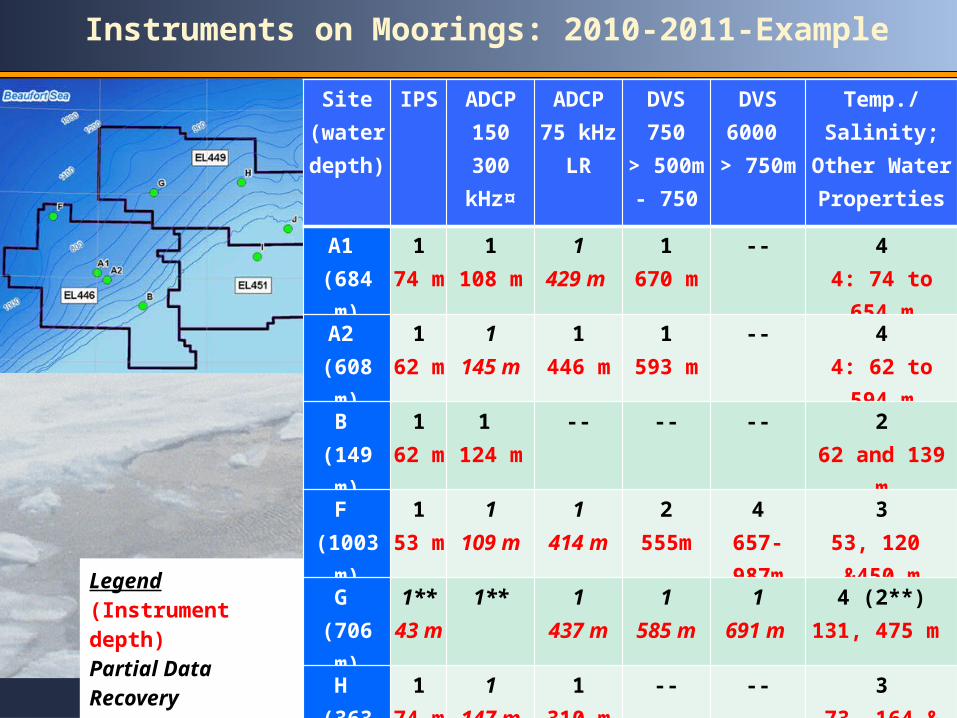
Instruments on Moorings: 2010-2011-Example
Site (water depth)
IPS ADCP 150 300 kHz¤
ADCP 75 kHz LR
DVS 750> 500m -
750 m
DVS 6000 > 750m
Temp./Salinity; Other Water Properties
A1 (684 m)
174 m
1108 m
1429 m
1670 m
-- 44: 74 to 654 m
A2 (608 m)
162 m
1145 m
1446 m
1593 m
-- 44: 62 to 594 m
B (149 m)
162 m
1 124 m
-- -- -- 262 and 139 m
F (1003 m)
153 m
1109 m
1414 m
2555m
4657-987m
353, 120 &450 m
G (706 m)
1**43 m
1** 1437 m
1585 m
1691 m
4 (2**)131, 475 m
H (363 m)
174 m
1147 m
1310 m
-- -- 373, 164 & 351 m
I (73 m)
159 m
1 ¤60 m
-- -- -- 159 m
J (82 m)
150 m
162 m
-- -- -- 150 m
Total 7 7 5 5 5 20
Legend(Instrument depth)Partial Data Recovery** upper mooring lost
United States – Canada Northern Oil and Gas Research Forum Nov. 13-15, 2012
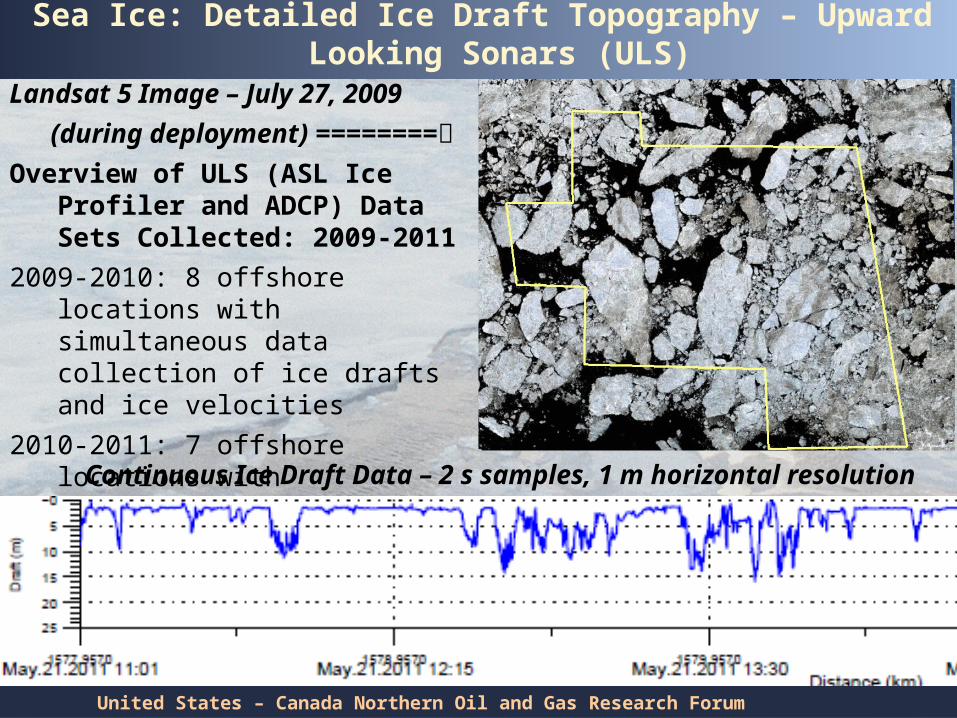
Sea Ice: Detailed Ice Draft Topography – Upward Looking Sonars (ULS)
Landsat 5 Image – July 27, 2009
(during deployment) ========
Overview of ULS (ASL Ice Profiler and ADCP) Data Sets Collected: 2009-2011
2009-2010: 8 offshore locations with simultaneous data collection of ice drafts and ice velocities
2010-2011: 7 offshore locations with simultaneous data collection, as above
Continuous Ice Draft Data – 2 s samples, 1 m horizontal resolution
United States – Canada Northern Oil and Gas Research Forum Nov. 13-15, 2012
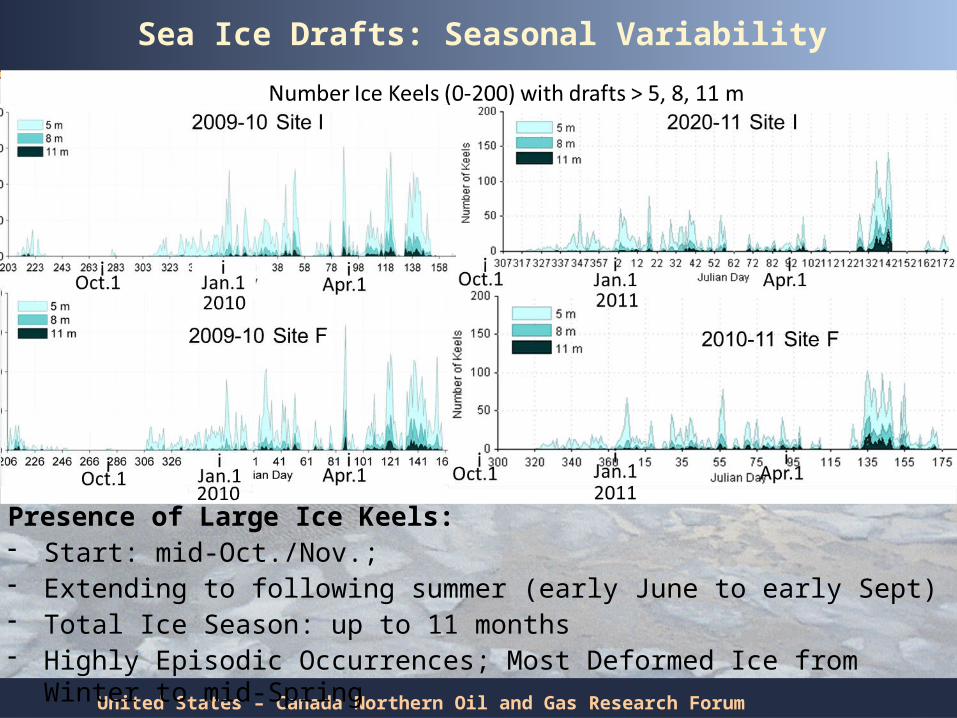
Sea Ice Drafts: Seasonal Variability
Presence of Large Ice Keels:- Start: mid-Oct./Nov.; - Extending to following summer (early June to early Sept)- Total Ice Season: up to 11 months- Highly Episodic Occurrences; Most Deformed Ice from Winter to mid-Spring
United States – Canada Northern Oil and Gas Research Forum Nov. 13-15, 2012
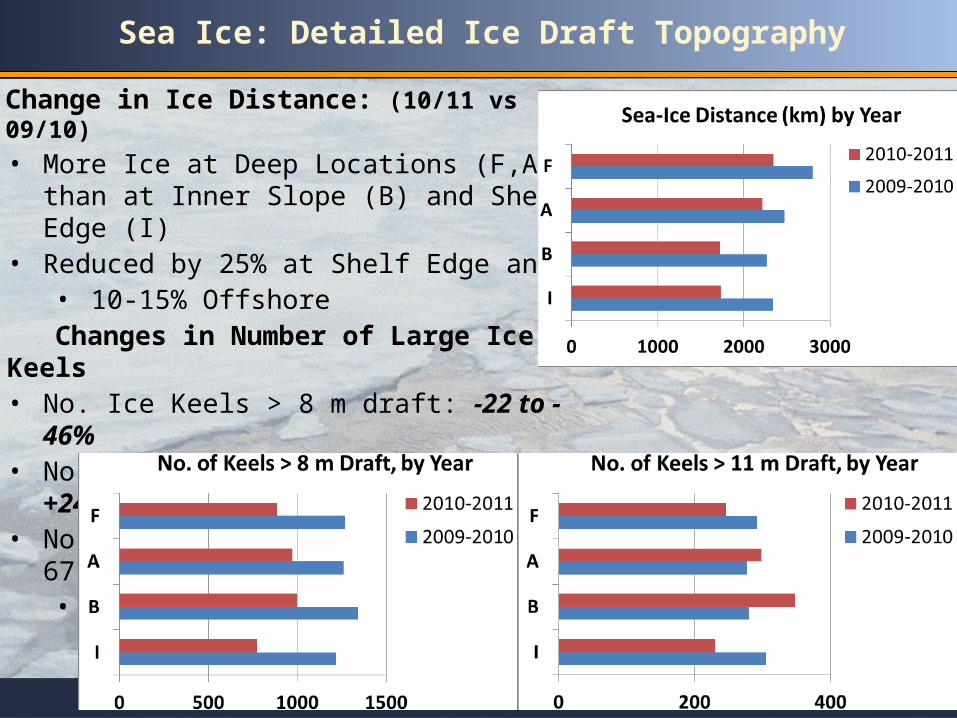
Sea Ice: Detailed Ice Draft Topography
Change in Ice Distance: (10/11 vs 09/10)
• More Ice at Deep Locations (F,A) than at Inner Slope (B) and Shelf Edge (I)
• Reduced by 25% at Shelf Edge and• 10-15% Offshore
Changes in Number of Large Ice Keels• No. Ice Keels > 8 m draft: -22 to - 46%• No. Ice Keels > 11 m draft: -24 to +24• No. Ice Keels > 15 m: I&J: 75 vs 67: +11%
• Site F: 35 vs 55: -36%
United States – Canada Northern Oil and Gas Research Forum Nov. 13-15, 2012
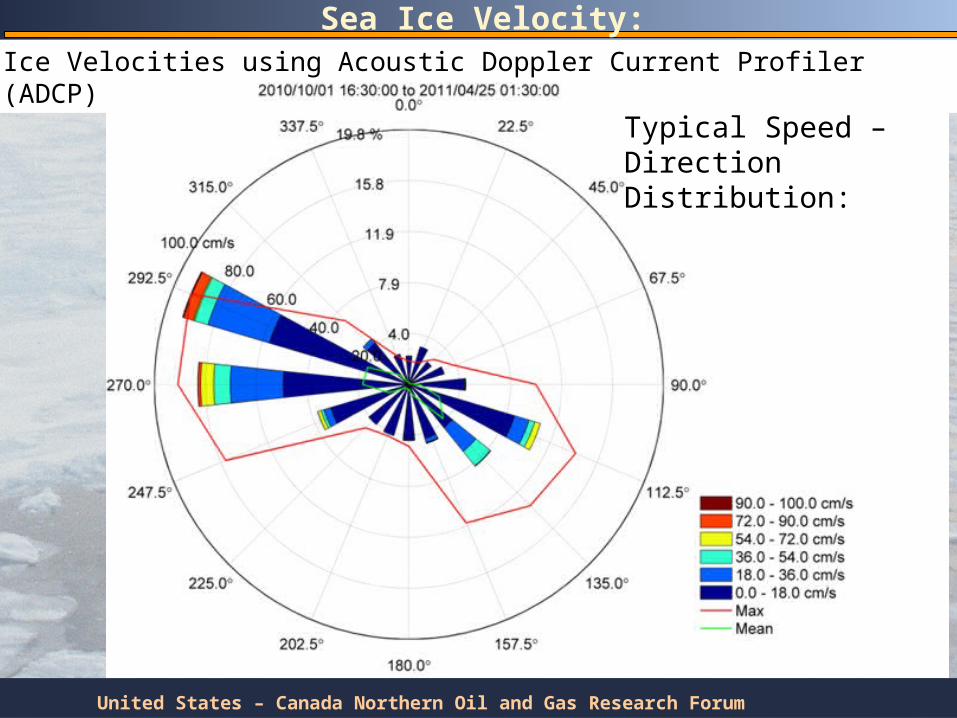
Sea Ice Velocity:Ice Velocities using Acoustic Doppler Current Profiler (ADCP) at 15 min. intervals
Typical Speed –Direction Distribution:
United States – Canada Northern Oil and Gas Research Forum Nov. 13-15, 2012
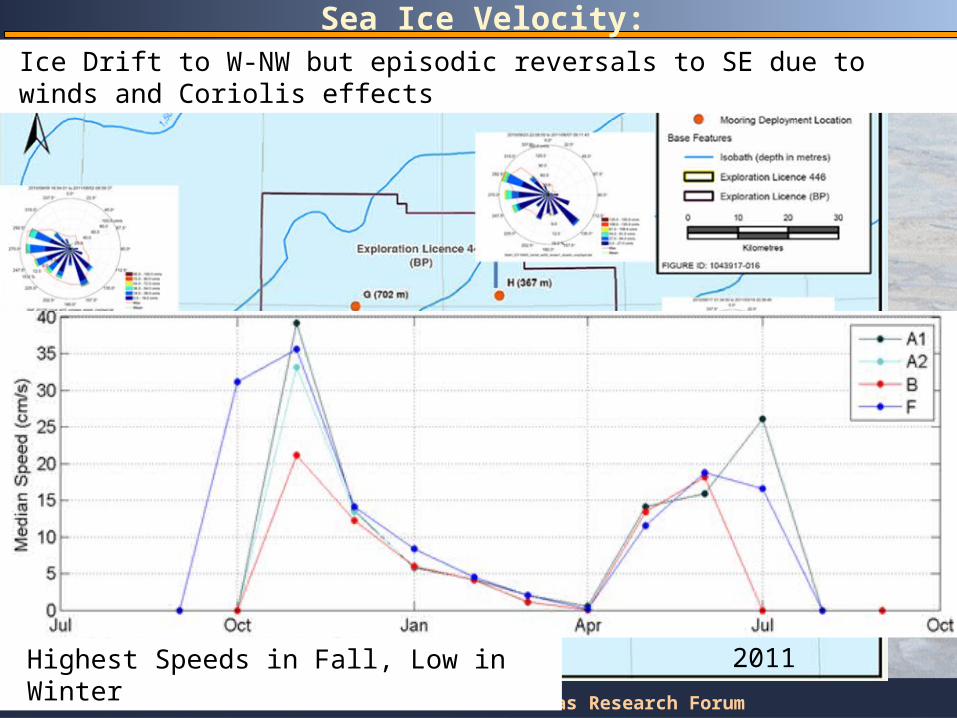
Sea Ice Velocity:
2010-2011
Ice Drift to W-NW but episodic reversals to SE due to winds and Coriolis effects
Highest Speeds in Fall, Low in Winter
United States – Canada Northern Oil and Gas Research Forum Nov. 13-15, 2012
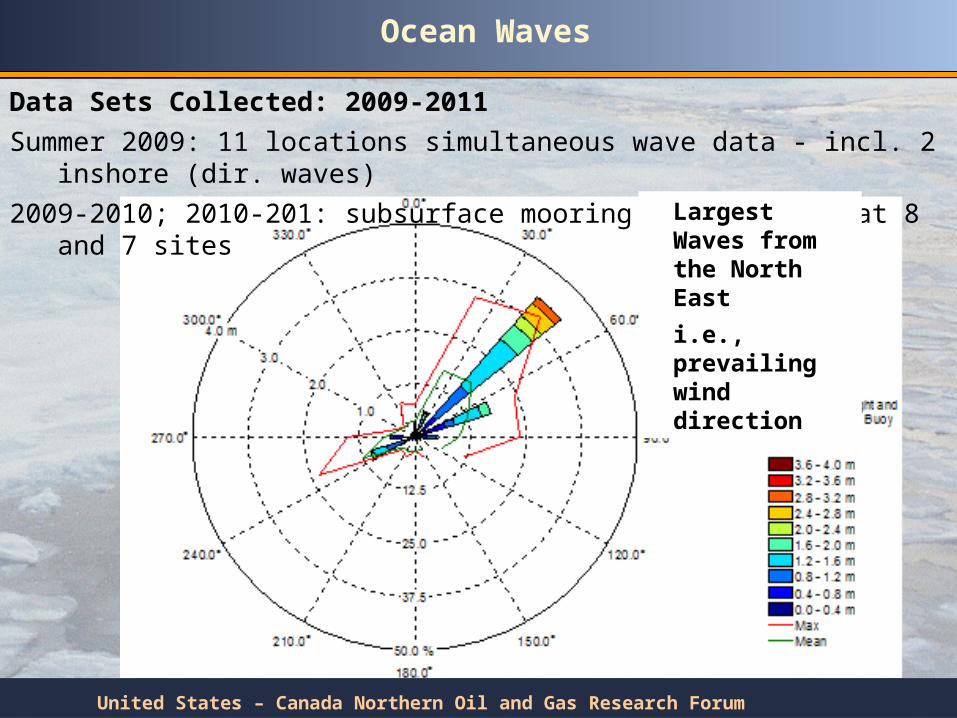
Ocean Waves
Data Sets Collected: 2009-2011
Summer 2009: 11 locations simultaneous wave data - incl. 2 inshore (dir. waves)
2009-2010; 2010-201: subsurface mooring measurements at 8 and 7 sitesLargest Waves from the North East
i.e., prevailing wind direction
United States – Canada Northern Oil and Gas Research Forum Nov. 13-15, 2012
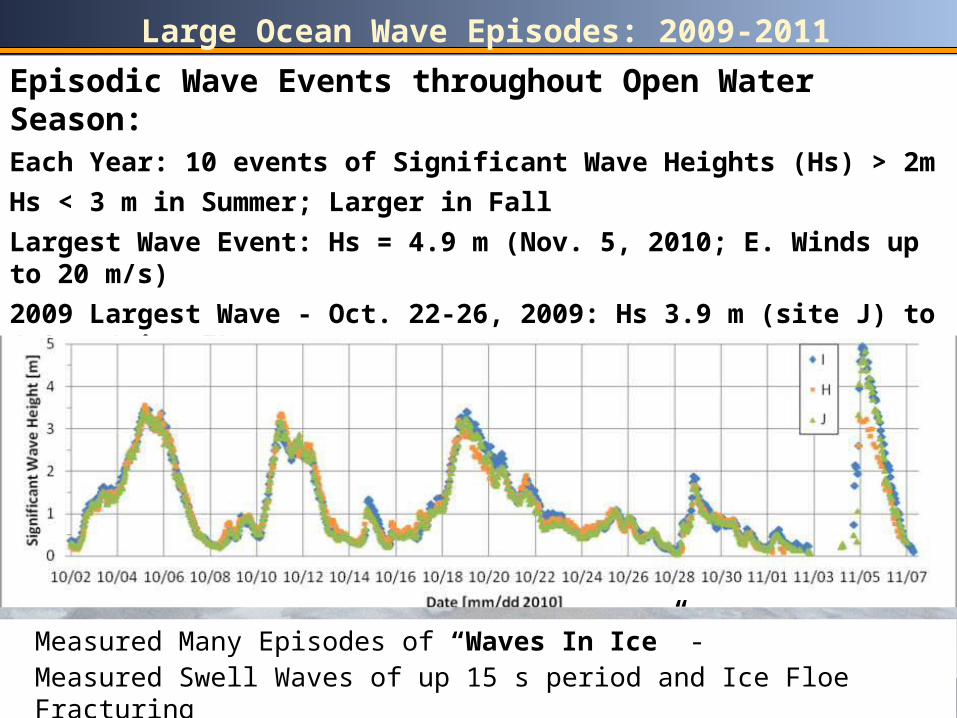
Large Ocean Wave Episodes: 2009-2011
Episodic Wave Events throughout Open Water Season:Each Year: 10 events of Significant Wave Heights (Hs) > 2m
Hs < 3 m in Summer; Larger in Fall
Largest Wave Event: Hs = 4.9 m (Nov. 5, 2010; E. Winds up to 20 m/s)
2009 Largest Wave - Oct. 22-26, 2009: Hs 3.9 m (site J) to 4.2 m (site F)
Hs can vary considerably among mooring sites according to:- Wind Fetch Distance and Local and Regional Sea Ice Conditions
Measured Many Episodes of “Waves In Ice” - Measured Swell Waves of up 15 s period and Ice Floe Fracturing
United States – Canada Northern Oil and Gas Research Forum Nov. 13-15, 2012
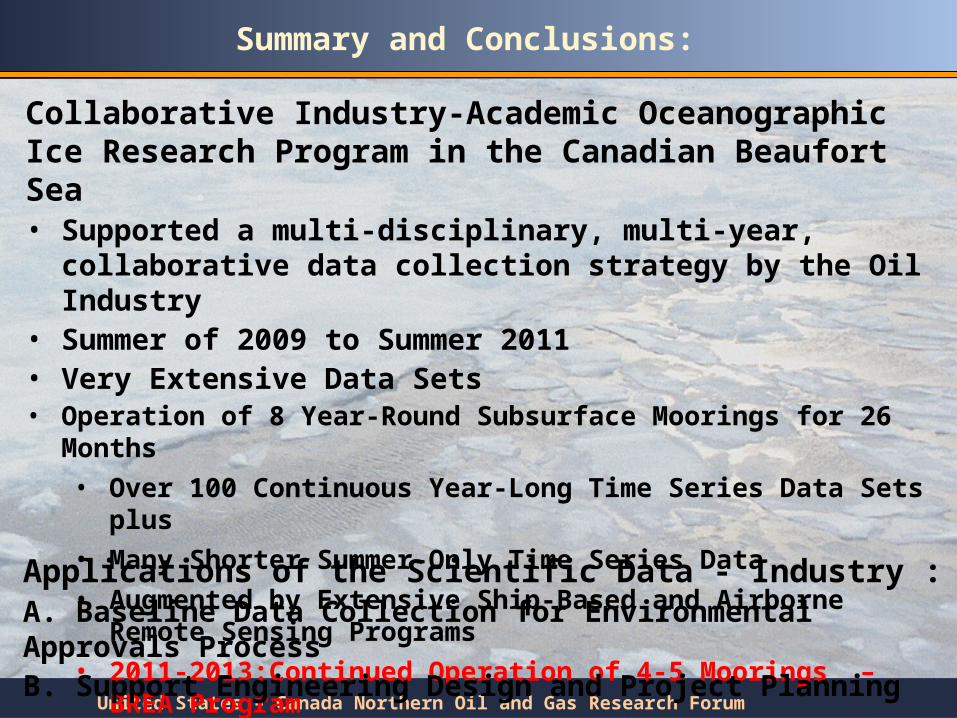
Summary and Conclusions:
Collaborative Industry-Academic Oceanographic Ice Research Program in the Canadian Beaufort Sea • Supported a multi-disciplinary, multi-year, collaborative data
collection strategy by the Oil Industry• Summer of 2009 to Summer 2011• Very Extensive Data Sets • Operation of 8 Year-Round Subsurface Moorings for 26 Months
• Over 100 Continuous Year-Long Time Series Data Sets plus
• Many Shorter Summer-Only Time Series Data
• Augmented by Extensive Ship-Based and Airborne Remote Sensing Programs
• 2011-2013:Continued Operation of 4-5 Moorings – BREA Program
Applications of the Scientific Data - Industry :A. Baseline Data Collection for Environmental Approvals ProcessB. Support Engineering Design and Project Planning
United States – Canada Northern Oil and Gas Research Forum Nov. 13-15, 2012
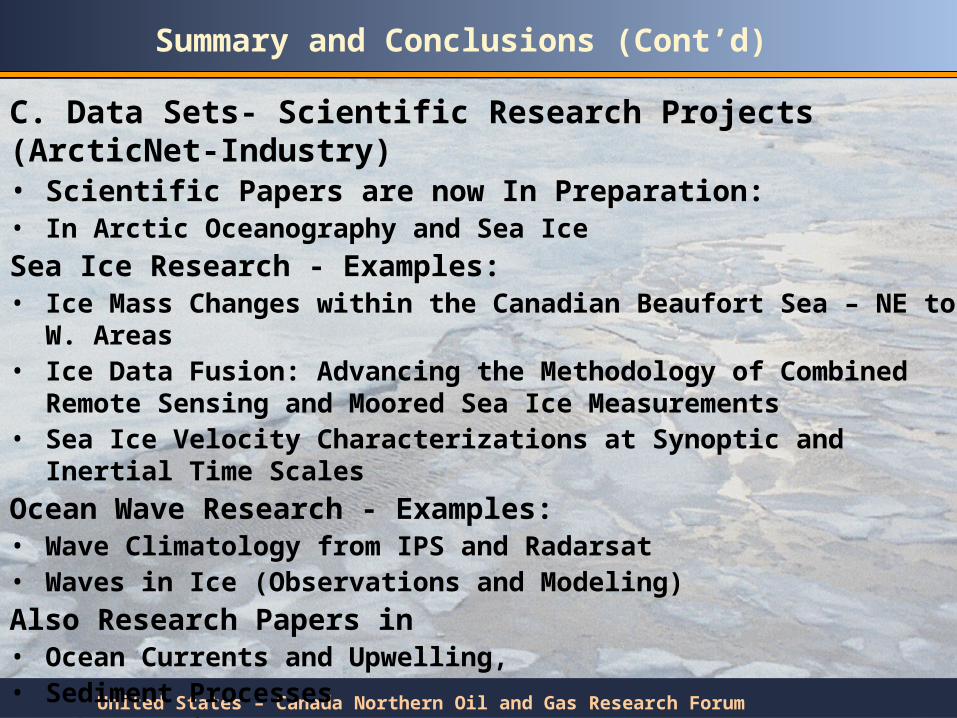
Summary and Conclusions (Cont’d)
C. Data Sets- Scientific Research Projects (ArcticNet-Industry)• Scientific Papers are now In Preparation:• In Arctic Oceanography and Sea Ice
Sea Ice Research - Examples:• Ice Mass Changes within the Canadian Beaufort Sea – NE to W. Areas• Ice Data Fusion: Advancing the Methodology of Combined Remote
Sensing and Moored Sea Ice Measurements• Sea Ice Velocity Characterizations at Synoptic and Inertial Time Scales
Ocean Wave Research - Examples:• Wave Climatology from IPS and Radarsat• Waves in Ice (Observations and Modeling)
Also Research Papers in • Ocean Currents and Upwelling, • Sediment Processes• Other Topics
United States – Canada Northern Oil and Gas Research Forum Nov. 13-15, 2012
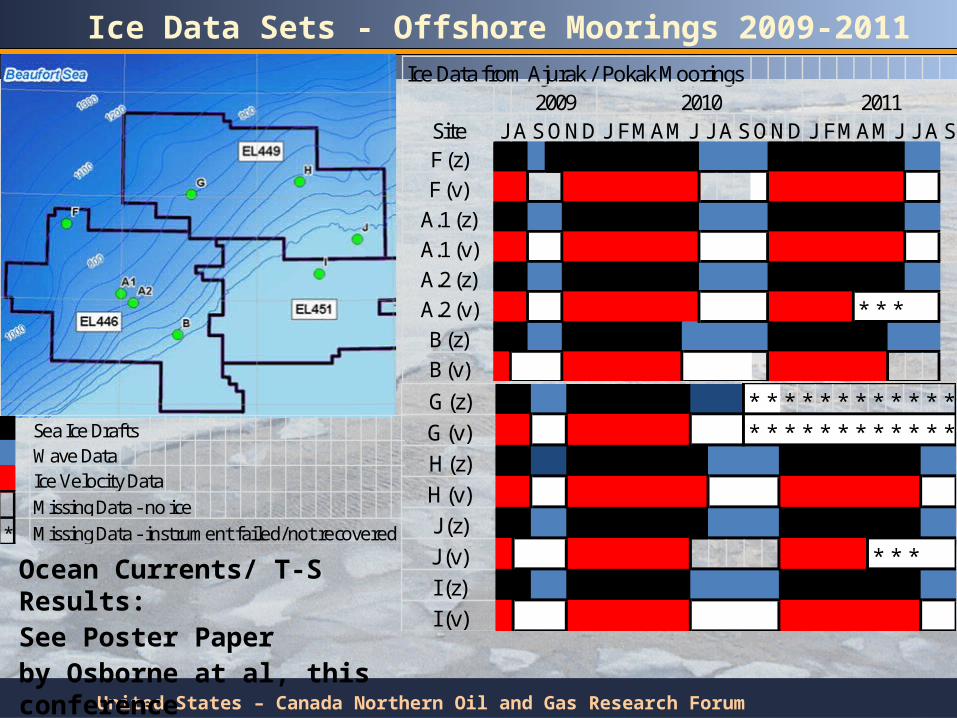
Ice Data Sets - Offshore Moorings 2009-2011Ice Data from Ajurak / Pokak Moorings
Site J A S O N D J F MA M J J A S O N D J F MA M J J A SF (z)F (v)
A.1 (z)A.1 (v)A.2 (z)A.2 (v) * * *B (z)B (v)
2009 2010 2011
G (z) * * * * * * * * * * * *G (v) * * * * * * * * * * * *H (z)H (v)J (z)J (v) * * *I (z)I (v)
Sea Ice DraftsWave DataIce Velocity DataMissing Data - no ice
* Missing Data - instrument failed/not recovered
Ocean Currents/ T-S Results: See Poster Paper by Osborne at al, this conference
United States – Canada Northern Oil and Gas Research Forum Nov. 13-15, 2012
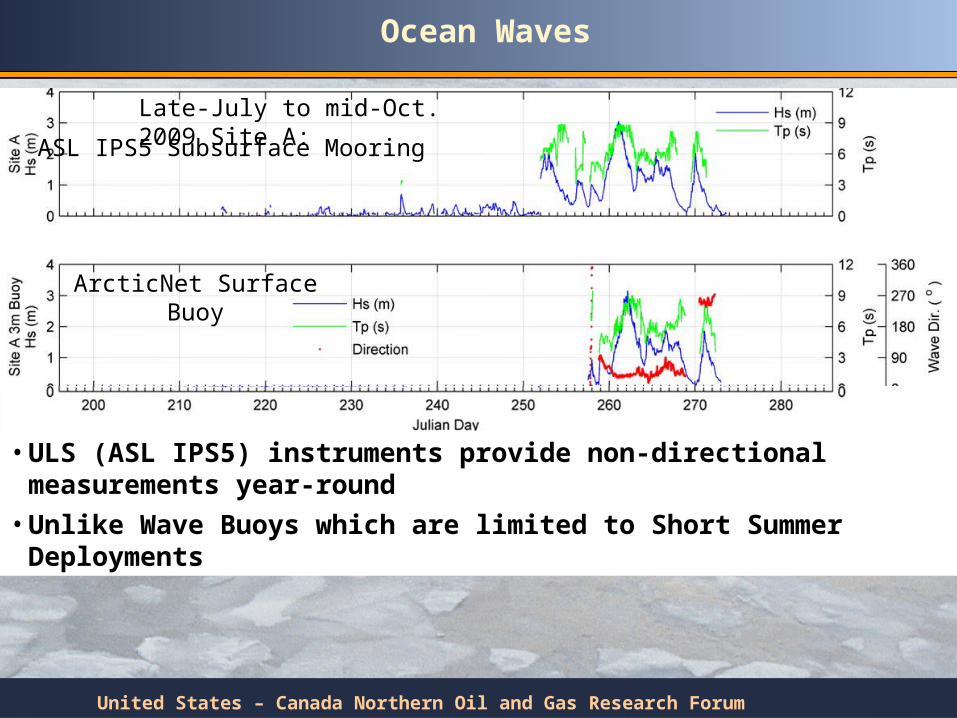
Ocean Waves
Late-July to mid-Oct. 2009 Site A:
• ULS (ASL IPS5) instruments provide non-directional measurements year-round
• Unlike Wave Buoys which are limited to Short Summer Deployments
ASL IPS5 Subsurface Mooring
ArcticNet Surface Buoy