Embed Size (px)
Citation preview
1
United States Central Command
NATO C-IED BRIEF
JUNE 2016
LCDR Matthew Coombs
CIED Branch Chief
Derived from: Multiple Sources
Reason: 1.4(c)
Declassify on: 21 June 2026
UNCLASSIFIED//FOR OFFICIAL USE ONLY/REL TO USA, NATO, RSMA
2
Agenda
• Perspective: CENTCOM IED Trends/ Key Observations
• ISIL Remote Control Model Aircraft (RCMA)
• Examples of VBIED’s
• Offensive/ Defensive IED Belts
• CENTCOM C-IED Concerns
UNCLASSIFIED//FOR OFFICIAL USE ONLY/REL TO USA, NATO, RSMA
3
UNCLASSIFIED//FOR OFFICIAL USE ONLY/REL TO USA, NATO, RSMA
UNCLASSIFIED//FOR OFFICIAL USE ONLY/REL TO USA, NATO, RSMA
Country % Change
IRAQ h 5,537 86%
TURKEY h 616 1,311%
EGYPT h 57 14%
INDIA h 55 13%
Incidents
Incidents Casualties
2 1 IRAQ 12,002 34,936
1 2 AFGHANISTAN 6,934 11,347
4 3 SYRIA 3,530 6,073
3 4 COLOMBIA 1,987 376
20 5 TURKEY 663 2,110
6 6 INDIA 490 319
7 7 EGYPT 454 1,043
5 8 PAKISTAN 453 1,538
8 9 SOMALIA 272 820
10 10 PHILIPPINES 266 323
Previous
Ranking
Current
RankingCountry
Apr 2015-Mar 2016Key Trends
• Iraq, Syria and Afghanistan remain the top IED hotspots;
• Turkey and Iraq have recorded significant increases from
last year where Turkey recorded an increase of 1,311%
Top 10 IED Countries
Increasing Activity
Global IED Trends and Key Observations 1 Apr 2015 – 31 Mar 2016 compared to the previous 12 month period
Most Significant Increases in
Top 10 IED Countries
29,084 incidents
IED Incidents Casualties
23% 21%
67,258 casualties
(U//FOUO)Afghanistan and Iraq account for 79% of IED incidents and
82% of IED casualties within CENTCOM
Overwhelming majority of ISIL’s IED’s are
made from Homemade Explosive (HME).
IED’s remain the weapon of choice for
terrorists, insurgents, and criminals.
Incidents Casualties Incidents Casualties
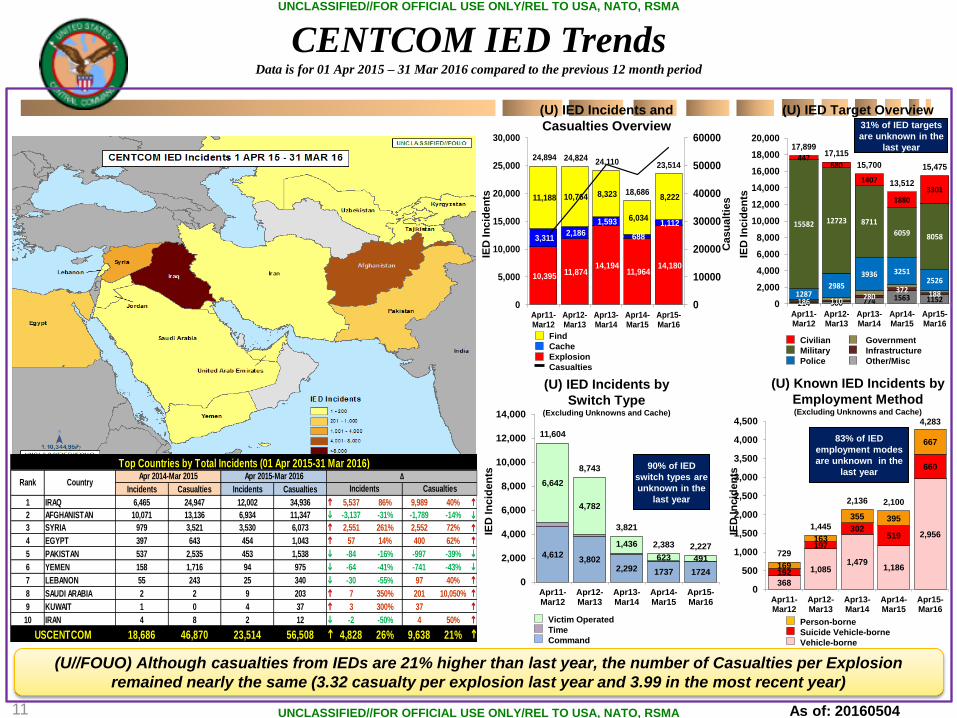
1 IRAQ 6,465 24,947 12,002 34,936 h 5,537 86% 9,989 40% h
2 AFGHANISTAN 10,071 13,136 6,934 11,347 i -3,137 -31% -1,789 -14% i
3 SYRIA 979 3,521 3,530 6,073 h 2,551 261% 2,552 72% h
4 EGYPT 397 643 454 1,043 h 57 14% 400 62% h
5 PAKISTAN 537 2,535 453 1,538 i -84 -16% -997 -39% i
6 YEMEN 158 1,716 94 975 i -64 -41% -741 -43% i
7 LEBANON 55 243 25 340 i -30 -55% 97 40% h
8 SAUDI ARABIA 2 2 9 203 h 7 350% 201 10,050% h
9 KUWAIT 1 0 4 37 h 3 300% 37 h
10 IRAN 4 8 2 12 i -2 -50% 4 50% h
18,686 46,870 23,514 56,508 h 4,828 26% 9,638 21% h
Top Countries by Total Incidents (01 Apr 2015-31 Mar 2016)
USCENTCOM
RankApr 2014-Mar 2015
Incidents
Δ
CasualtiesCountry
Apr 2015-Mar 2016
4
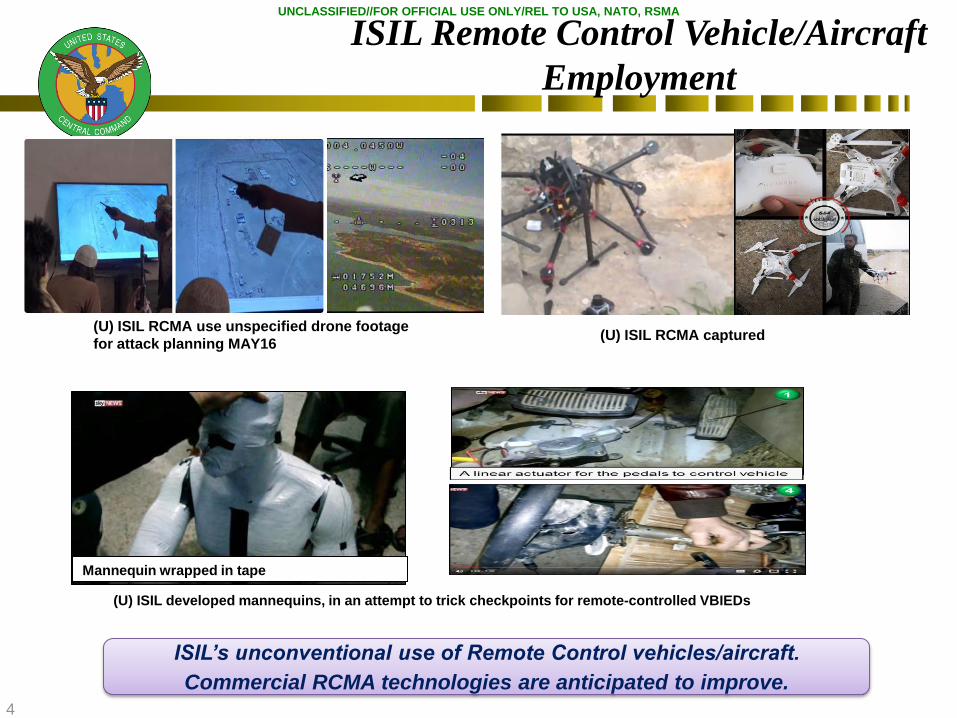
ISIL Remote Control Vehicle/Aircraft
Employment
(U) ISIL RCMA use unspecified drone footage
for attack planning MAY16
UNCLASSIFIED//FOR OFFICIAL USE ONLY/REL TO USA, NATO, RSMA
(U) ISIL developed mannequins, in an attempt to trick checkpoints for remote-controlled VBIEDs
Mannequin wrapped in tape
(U) ISIL RCMA captured
ISIL’s unconventional use of Remote Control vehicles/aircraft.
Commercial RCMA technologies are anticipated to improve.
5
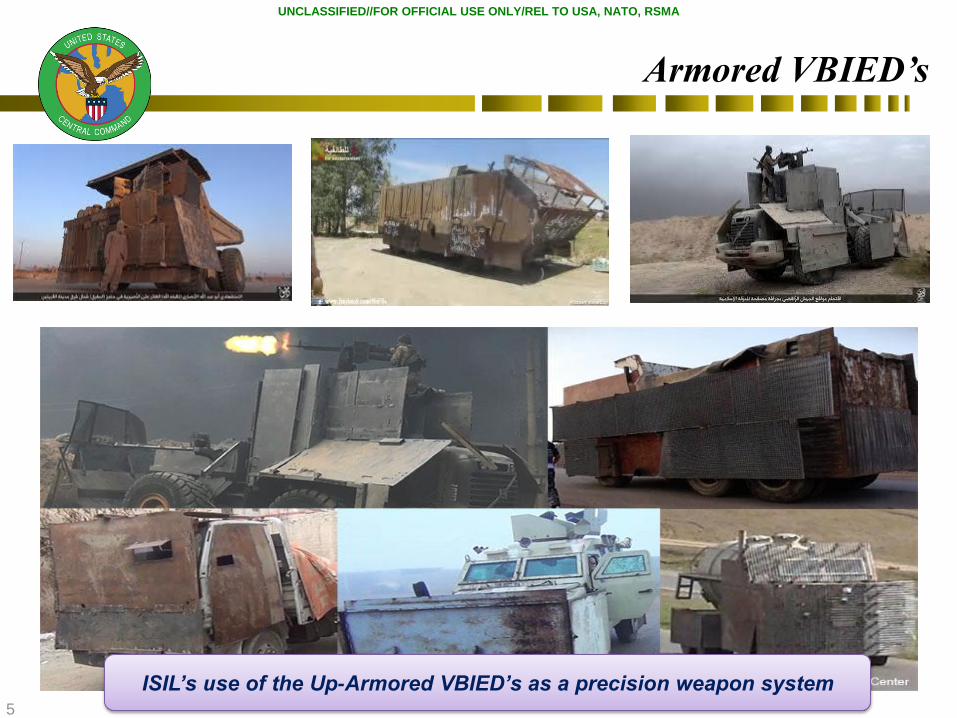
Armored VBIED’s
UNCLASSIFIED//FOR OFFICIAL USE ONLY/REL TO USA, NATO, RSMA
ISIL’s use of the Up-Armored VBIED’s as a precision weapon system
6
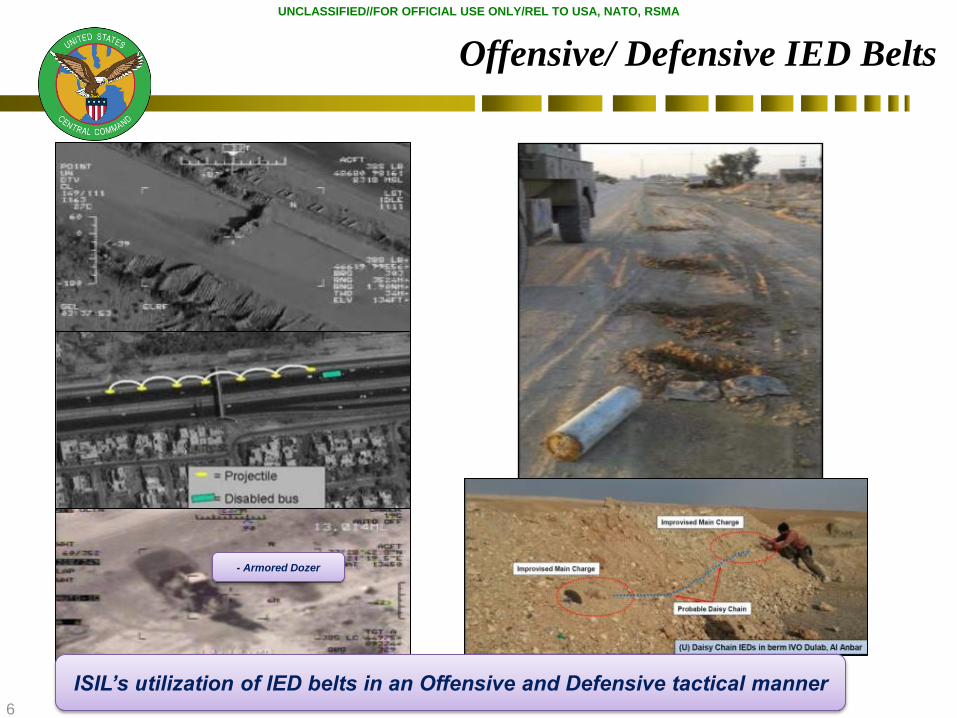
Offensive/ Defensive IED Belts
UNCLASSIFIED//FOR OFFICIAL USE ONLY/REL TO USA, NATO, RSMA
ISIL’s utilization of IED belts in an Offensive and Defensive tactical manner
- Armored Dozer
7
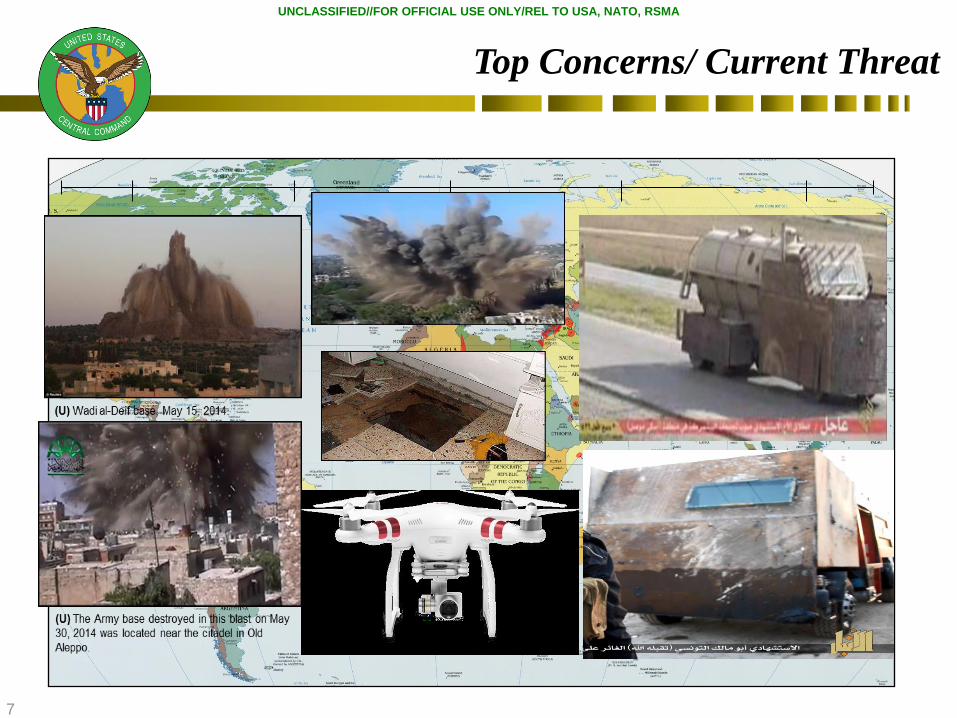
Top Concerns/ Current Threat
(U) Key Takeaways:
• (U//FOUO) Tunneling is prevalent globally and lends
itself to adaptation by various groups.
• (U//FOUO) Observed tunnels range in length from
15m -1.5km and take anywhere from 30 days to nine
months to dig, dependent on length and soil
composition.
• (U//FOUO) Urban terrain, such as Baghdad, presents
existing underground access without the need to
actually dig a tunnel.
N
UNCLASSIFIED//FOR OFFICIAL USE ONLY/REL TO USA, NATO, RSMA
8
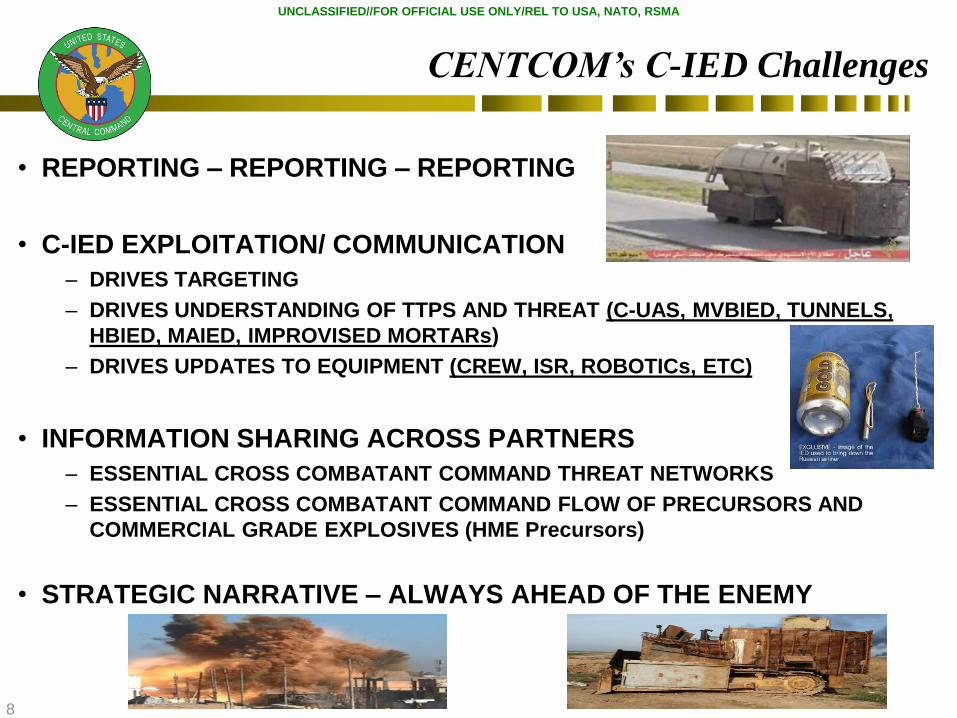
• REPORTING – REPORTING – REPORTING
• C-IED EXPLOITATION/ COMMUNICATION
– DRIVES TARGETING
– DRIVES UNDERSTANDING OF TTPS AND THREAT (C-UAS, MVBIED, TUNNELS,
HBIED, MAIED, IMPROVISED MORTARs)
– DRIVES UPDATES TO EQUIPMENT (CREW, ISR, ROBOTICs, ETC)
• INFORMATION SHARING ACROSS PARTNERS
– ESSENTIAL CROSS COMBATANT COMMAND THREAT NETWORKS
– ESSENTIAL CROSS COMBATANT COMMAND FLOW OF PRECURSORS AND
COMMERCIAL GRADE EXPLOSIVES (HME Precursors)
• STRATEGIC NARRATIVE – ALWAYS AHEAD OF THE ENEMY
CENTCOM’s C-IED Challenges
UNCLASSIFIED//FOR OFFICIAL USE ONLY/REL TO USA, NATO, RSMA
9
Questions?
9
UNCLASSIFIED//FOR OFFICIAL USE ONLY/REL TO USA, NATO, RSMA
10
10
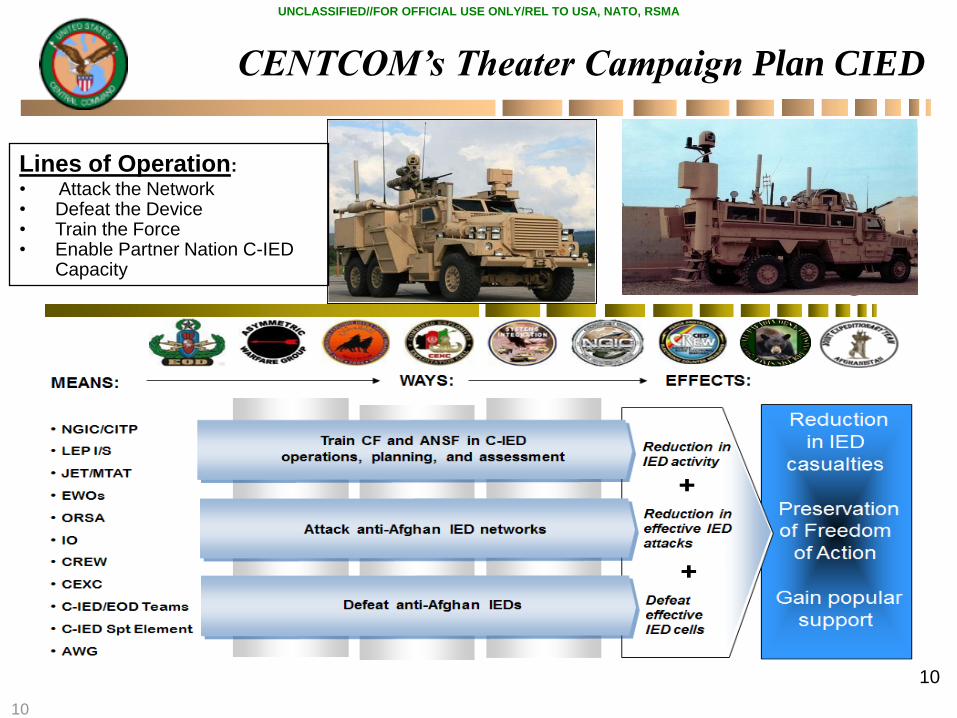
CENTCOM’s Theater Campaign Plan CIED
Lines of Operation:
• Attack the Network • Defeat the Device • Train the Force • Enable Partner Nation C-IED
Capacity
UNCLASSIFIED//FOR OFFICIAL USE ONLY/REL TO USA, NATO, RSMA
11
UNCLASSIFIED//FOR OFFICIAL USE ONLY/REL TO USA, NATO, RSMA
UNCLASSIFIED//FOR OFFICIAL USE ONLY/REL TO USA, NATO, RSMA
Incidents Casualties Incidents Casualties
1 IRAQ 6,465 24,947 12,002 34,936 h 5,537 86% 9,989 40% h
2 AFGHANISTAN 10,071 13,136 6,934 11,347 i -3,137 -31% -1,789 -14% i
3 SYRIA 979 3,521 3,530 6,073 h 2,551 261% 2,552 72% h
4 EGYPT 397 643 454 1,043 h 57 14% 400 62% h
5 PAKISTAN 537 2,535 453 1,538 i -84 -16% -997 -39% i
6 YEMEN 158 1,716 94 975 i -64 -41% -741 -43% i
7 LEBANON 55 243 25 340 i -30 -55% 97 40% h
8 SAUDI ARABIA 2 2 9 203 h 7 350% 201 10,050% h
9 KUWAIT 1 0 4 37 h 3 300% 37 h
10 IRAN 4 8 2 12 i -2 -50% 4 50% h
18,686 46,870 23,514 56,508 h 4,828 26% 9,638 21% h
Top Countries by Total Incidents (01 Apr 2015-31 Mar 2016)
USCENTCOM
RankApr 2014-Mar 2015
Incidents
Δ
CasualtiesCountry
Apr 2015-Mar 2016
368
1,0851,479
1,186
2,956
192
197
302519
660
169
163
355 395
667
729
1,445
2,136 2,100
4,283
0
500
1,000
1,500
2,000
2,500
3,000
3,500
4,000
4,500
Apr11-Mar12
Apr12-Mar13
Apr13-Mar14
Apr14-Mar15
Apr15-Mar16
4,6123,802
2,292 1737 1724
6,642
4,782
1,436
623 491
11,604
8,743
3,821
2,383 2,227
0
2,000
4,000
6,000
8,000
10,000
12,000
14,000
Apr11-Mar12
Apr12-Mar13
Apr13-Mar14
Apr14-Mar15
Apr15-Mar16
214 306 774 1563 1152186 110280
372 18812872985
3936 32512526
15582 12723 8711
6059 8058
447680
1407
18803301
17,89917,115
15,700
13,512
15,475
0
2,000
4,000
6,000
8,000
10,000
12,000
14,000
16,000
18,000
20,000
Apr11-Mar12
Apr12-Mar13
Apr13-Mar14
Apr14-Mar15
Apr15-Mar16
10,395 11,874
14,194 11,964
14,180
3,311 2,186
1,593
688
1,112
11,188 10,764 8,323
6,034
8,222
24,894 24,824 24,110
18,686
23,514
0
10000
20000
30000
40000
50000
60000
0
5,000
10,000
15,000
20,000
25,000
30,000
Apr11-Mar12
Apr12-Mar13
Apr13-Mar14
Apr14-Mar15
Apr15-Mar16
83% of IED
employment modes
are unknown in the
last year 90% of IED
switch types are
unknown in the
last year
CENTCOM IED Trends Data is for 01 Apr 2015 – 31 Mar 2016 compared to the previous 12 month period
(U//FOUO) Although casualties from IEDs are 21% higher than last year, the number of Casualties per Explosion
remained nearly the same (3.32 casualty per explosion last year and 3.99 in the most recent year)
IED
In
cid
en
ts
IED
In
cid
en
ts
IED
In
cid
en
ts
IED
In
cid
en
ts
Casu
alt
ies
31% of IED targets
are unknown in the
last year
As of: 20160504
Find
Cache
Explosion
Casualties
Civilian
Military
Police
Government
Infrastructure
Other/Misc
Victim Operated
Time
Command
Person-borne
Suicide Vehicle-borne
Vehicle-borne
(U) IED Incidents and
Casualties Overview
(U) Known IED Incidents by
Employment Method (Excluding Unknowns and Cache)
(U) IED Incidents by
Switch Type (Excluding Unknowns and Cache)
(U) IED Target Overview