Embed Size (px)
Citation preview
..
UNITED STATES DEPARTMENT OF THE INTERIOR
BUREAU OF RECLAMATION
ATTENUATION OF SURGE WAVES BY
A SIDE WEIR IN A TRAPEZOIDAL CHANNEL
Report No. Hyd-575
Hydraulics Branch DIVISION OF RESEARCH
OFFICE OF CHIEF ENGINEER DENVER, COLORADO
April 25, 1967
The information contained in this report may not be used in any publication, advertising, or other promotion in such a manner as to constitute an endorsement by the United States Government or the Bureau of Reclamation, either explicit or implicit, of any material, product, device, or process that may be referred to in the report.
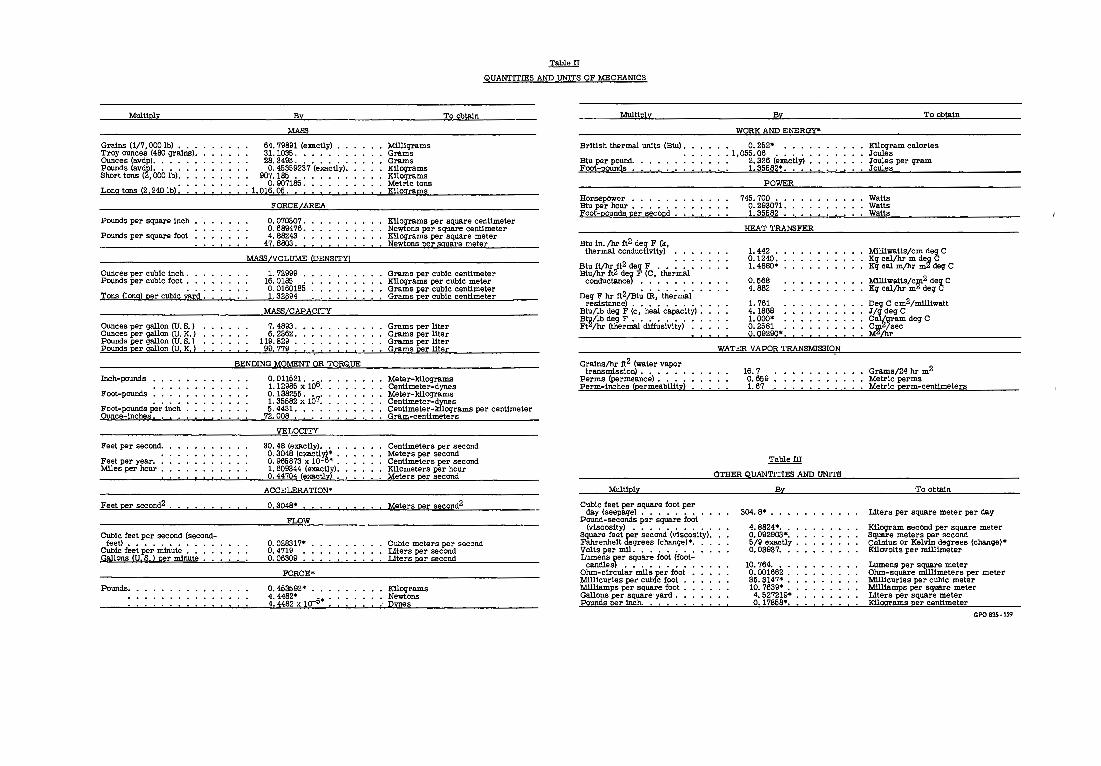
Where approximate or nominal English units are used to express a value or range of values, the converted metric units in parentheses are also approximate or nominal. Where precise English units are used, the converted metric units are expressed as equally -significant values,
CONTENTS
Abstract ............................... _. . . . . . . . . . . . . . . . . . . iii Acknowledgments . . . . . . . . . . . . . . . . . . . . . . . . . . . . . . . . . . . . . . . . . iv Definition of Terms.................. . . . . . . . . . . . . . . . . . . . . . v Purpose . . . . . . . . . . . . . . . . . . . . . . . . . . . . . . . . . . . . . . . . . . . . . . . . . 1 C0.nclusions . . . . . . . . . . . . . . . . . . . . . . . . . . . . . . . . . . . . . . . . . . . . . . 1 Theoretical Considerations . . . . . . . . . . . . . . . . . . . . . . . . . . . . . . . . 2
Development of a Simple Theoretical Relationship . . . . . . . . . 2 Citrini's Equation for Attenuation of Surges in
Rectangular Channels [ 4] . . . . . . . . . . . . . . . . . . . . . . . . . . • . . . 5
Limitations of Citrini's equation . . . . . . . . . . . . . . . . . . . . . . 6
The Experimental. Investigation . . . . . . . . . . . . . . . . . . . . . . . . . . . . 6
Description of the Experimental Apparatus . . . . . . . . . . . . . . . 6 Test Program and Limitations . . . . . . . . . . . . . . . . . . . . . . . . . . 8 Discussion of Experimental Results . . . . . . . . . . . . . . . . . . . . . . 8
Surge propagation in the channel without the side weir... 8 Effect of the weir length on surge velocity. . . . . . . . . . . . . . 8 Effect of initial flow conditions on the surge attenua-
tion efficiency of the side weir . . . . . . . . . . . . . . . . . . . . . . 9 Effects of the Froude number and the weir length
on maximum and average surge heights at up-stream end of the weir . . . . . . . . . . . . . . . . . . . . . . . . . . . . . 9
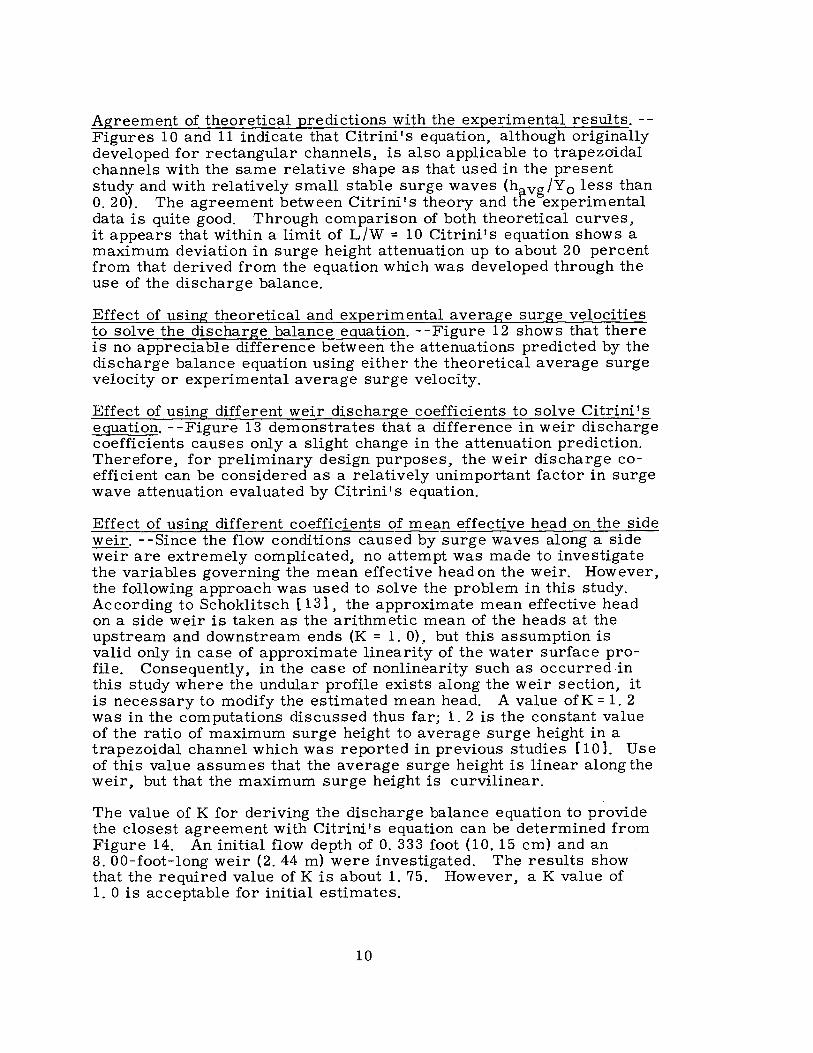
Agreement of theoretical predictions with the experimental results . . . . . . . . . . . . . . . . . . . . . . . . . . . . . . . 10
Effect of using theoretical and experimental average surge velocities to solve the discharge balance equation . . . . . . . . . . . . . . . . . . . . . . . . . . . . . . . . . . . . . . . . . . 10
Effect of using different weir discharge coefficients to solve Citrini' s equation . . . . . . . . . . . . . . . . . . . . . . . . . . 10
Effect of using different coefficients of mean effective head on the side weir . . . . . . . . . . . . . . . . . . . . . . 10
References . . . . . . . . . . . . . . . . . . . . . . . . . . . . . . . . . . . . . . . . . . . . . . 11 Appendix . . . . . . . . . . . . . . . . . . . . . . . . . . . . . . . . . . . . . . . . . . . . . . . . 31
Table
Experimental Data for Initial Flow Depth of 0. 33 3 Ft ( 10 . 15 cm) . . . . . . . . . . . . . . . . . . . . . . . . . . . . . . . . . . . . . . . . . . . . . 1
Experimental Data for Initial Flow Depth of 0. 320 Ft (9. 75 cm) . . . . . . . . . . . . . . . . . . . . . . . . . . . . . . . . . . . . . . . . . . . . . . 2
i
CONTENTS- -Continued
Figure
Definition Sketch for Derivations . . . . . . . . . . . . . . . . . . . . • . . . . . . 1 Typical Undular Form.: of Surge Wave .................. ~ . . . . · 2 Experimental Test Channel . . . . . . . . . . . . . . . . . . . . . . . . . . . . . . . . 3 Control Device at Downstream End of Test Channel . . . . . . . • . . 4 Wave Probe Loe ations . . . . . . . . . . . . . . . . . . . . . . . . . . . . . . . . . . . . 5 Model Instrumentation . . . . . . . . . . . . . . . . . . . . . . . . . . . . . . . . . . . . . 6 Bridge Circuit for Variable Capacitance Wave Probe . . . . . . . . . 7 Variation of Average Surge Velocity with Froude Number
of Initial Flow . . . . . . . . . . . . . . . . . . . . . . . . . . . . . . . . . . . .. . . . . . . 8 Effect of Froude Number of Initial Flow on Attenuating
Ability of Weir .... · . . . . . . . . . . . . . . . . . . . . . . . . . . . . . . . . . . . . . . 9 Variation of Maximum Peaks and Average Surge Heights
with Weir Length and Initial Flow Depth . . . . . . . . . . . . . . . . . . . 10 Variation of the Two Theoretical Equations on Attenuation
of Surge Waves . . . . . . . . . . . . . . . . . . . . . . . . . . . . . . . . . . . . . . . . . . 11 Variation of the Discharge Balance Equation with
Different Average Surge Velocities. . . . . . . . . . . . . . . . . . . . . . . . 12 Variation o~ Citrini 's Theory with the Weir Discharge
Coefficient1 8. 00-ft-long Weir 1 Initial Depth = 0. 333 Ft . . . . . 13 Variation of the Discharge Balance Equation with
Dj.fferent Coefficients of Mean Effective Head on the Side Weir . . . . . . . . . . . . . . . . . . . . . . . . . . . . . . • . . . . . . . . . . . . . . . 14
ii
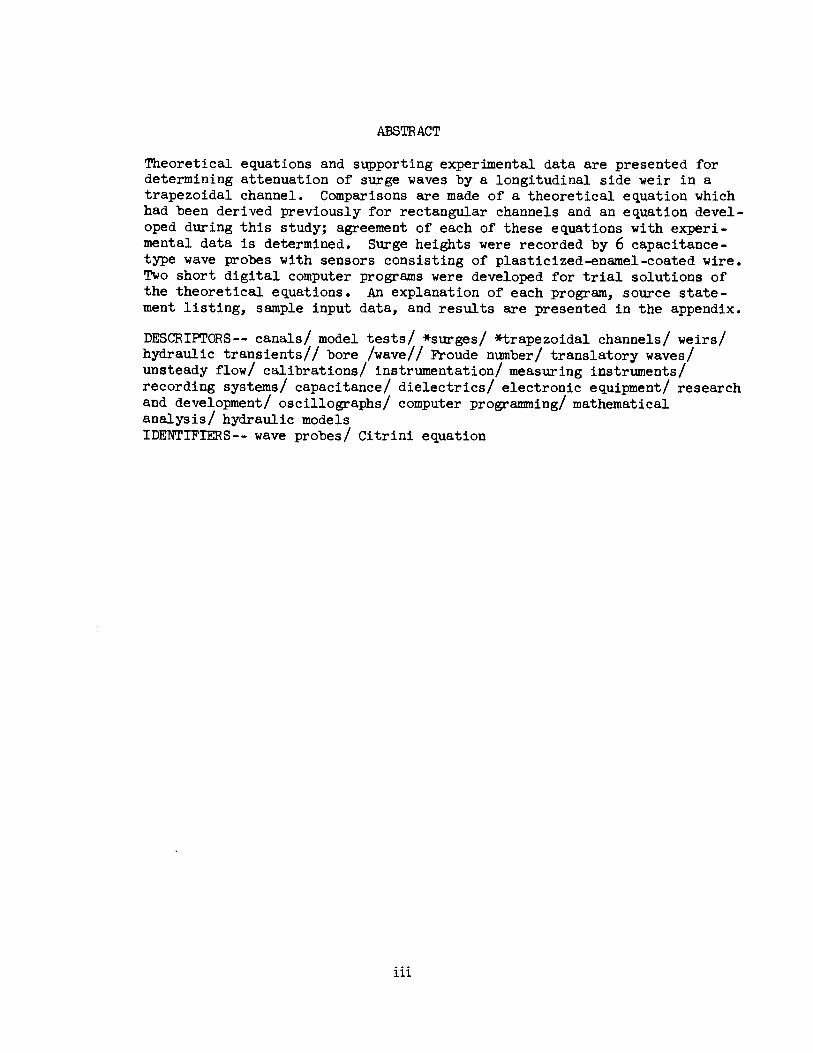
ABSTRACT
Theoretical equations and supporting experimental data are presented for determining attenuation of surge waves by a longitudinal side weir in a trapezoidal channel. Comparisons are made of a theoretical equation which had been derived previously for rectangular channels and an equation developed during this study; agreement of each of these equations with experimental data is determined. Surge heights were recorded by 6 capacitancetype wave probes with sensors consisting of plasticized-enamel-coated wire. Two short digital computer programs were developed for trial solutions of the theoretical equations. An explanation of each program, source statement listing, sample input data, and results are presented in the appendix.
DESCRIPl'ORS-- canals/ model tests/ *surges/ *trapezoidal channels/ weirs/ hydraulic transients// bore /wave// Froude number/ translatory waves/ unsteady flow/ calibrations/ instrumentation/ measuring instruments/ recording systems/ capacitance/ dielectrics/ electronic equipment/ research and development/ oscillographs/ computer programming/ mathematical analysis/ hydraulic models IDENTIFIERS-- wave probes/ Citrini equation
iii

ACKNOWLEDGMENTS
These studies were performed in the Hydraulics Branch, Division of Research of the Bureau of Reclamation. Photography was by W. M. Batts, Office Services Branch.
iv
A
D/S
d£
g
h
havg
hmax
Heff
K
L
DEFINITION OF TERMS
Reciprocal of Froude number of initial flow
Cross sectional area of the channel with initial flow depth
Ratio of height of weir crest above channel floor to initial depth of flow
Weir discharge coefficient
Height of weir crest above channel floor
Hydraulic depth, Ao To
Denotes downstream end of weir
Derivative of the distance from upstream end of weir
Froude number of initial flow
Gravitational acceleration
Surge height above initial flow depth
Average surge height
Maximum surge height
Average surge height at downstream end of weir (before attenuation)
Average surge height at upstream end of weir (after attenuation)
Depth of flow at side of main channel opposite weir (referenced to weir crest)
Effective head on weir crest
Depth of flow along centerline of main channel (referenced to weir crest)
Depth of flow over side weir
Adjustment factor for shape of flow profile along side weir
Length of weir
V
Q or Qin Discharge entering upstream end of section
Discharge over side weir
Qout
Qw
T
U/S
w
y
Yf
Yi
µ
Discharge of wave leaving upstream end of section (Qw) plus discharge over side weir (Q0 )
Discharge of wave after passing weir
Width of surge front at one-half of its height <,½ h2) at upstream end of side weir
Top width of a trapezoidal channel at initial flow depth ·
Denotes upstream end of weir
Average velocity of initial flow
Average wave velocity
Width of channel at elevation of weir crest
Average surge depth above channel flqor (Y0 + havg>
Depth of initial flow
Ratio of surge depth to initial depth at upstream end of weir
Ratio of surge depth to initial depth at downstream end of weir·
Dimensionless weir discharge coefficient = Cd/./2g
vi
UNITED STATES DEPARTMENT OF THE INTERIOR
BUREAU OF RECLAMATION
Office of Chief Engineer Division of Research Hydraulics Branch Denver. Colorado
Report No. Authors:
Hyd-575
Checked by: April 2 5. 19 6 7 Reviewed by:
Submitted by:
ATTENUATION OF SURGE WAVES BY
S. Rungrongtaanin D. L. King T. J. Rhone W. E. Wagner H. M. Martin
A SIDE WEIR IN A TRAPEZOIDAL CHANNEL
PURPOSE
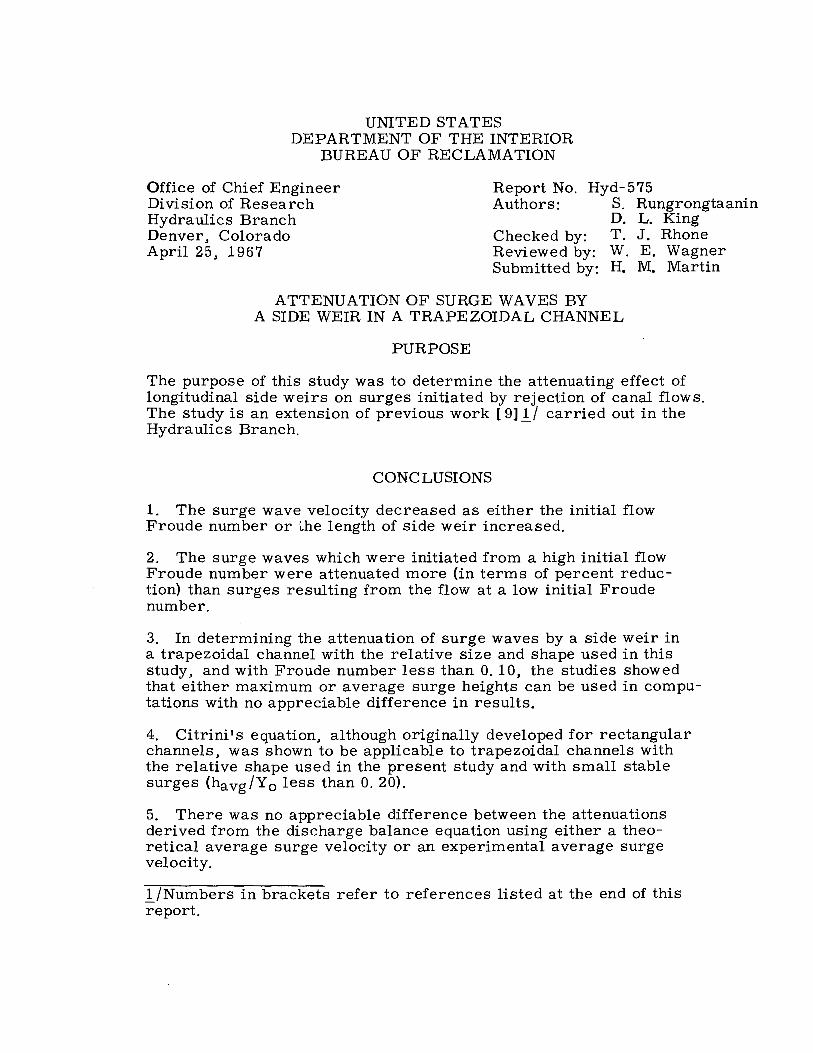
The purpose of this study was to determine the attenuating effect of longitudinal side weirs on surges initiated by rejection of canal flows. The study is an extension of previous work [ 9) l/ carried out in the Hydraulics Branch.
CONCLUSIONS
1. The surge wave velocity decreased as either the initial flow Froude number or the length of side weir increased.
2. The surge waves which were initiated from a high initial flow Froude number were attenuated more (in terms of percent reduction) than surges resulting from the flow at a low initial Froude number.
3. In determining the attenuation of surge waves by a side weir in a trapezoidal channel with the relative size and shape used in this study, and with Froude number less than 0. 10, the studies showed that either maximum or average surge heights can be used in computations with no appreciable difference in results.
4. Citrini's equation. although originally developed for rectangular channels, was shown to be applicable to trapezoidal channels with the relative shape used in the present study and with small stable surges (havg/Y O less than 0. 20).
5. There was no appreciable difference between the attenuations derived from the discharge balance equation using either a theoretical average surge velocity or an experimental average surge velocity .
.!_/Numbers in brackets ref er to references listed at the end of this report.
6. The use of different weir discharge coefficients in Citrini's equation provided only a slight change in the estimation of surge wave attenuation.
7. The theoretical curve derived from the discharge balance equation with a coefficient of mean effective head (K) on the side weir of about 1. 75 showed the best agreement with the curve from Citrini's equation.
8. Citrini's e.quation predicted, within the limit of L/W less than 10, a surge height attenuation up to about 20 percent greater than that predicted by the discharge balance equation. Since considerable time is involved in solving Citrini's equation, the simpler discharge balance equation could be used for preliminary hand calculations.
THEORETICAL CONSIDERATIONS
Development of a Simple Theoretical Relationship
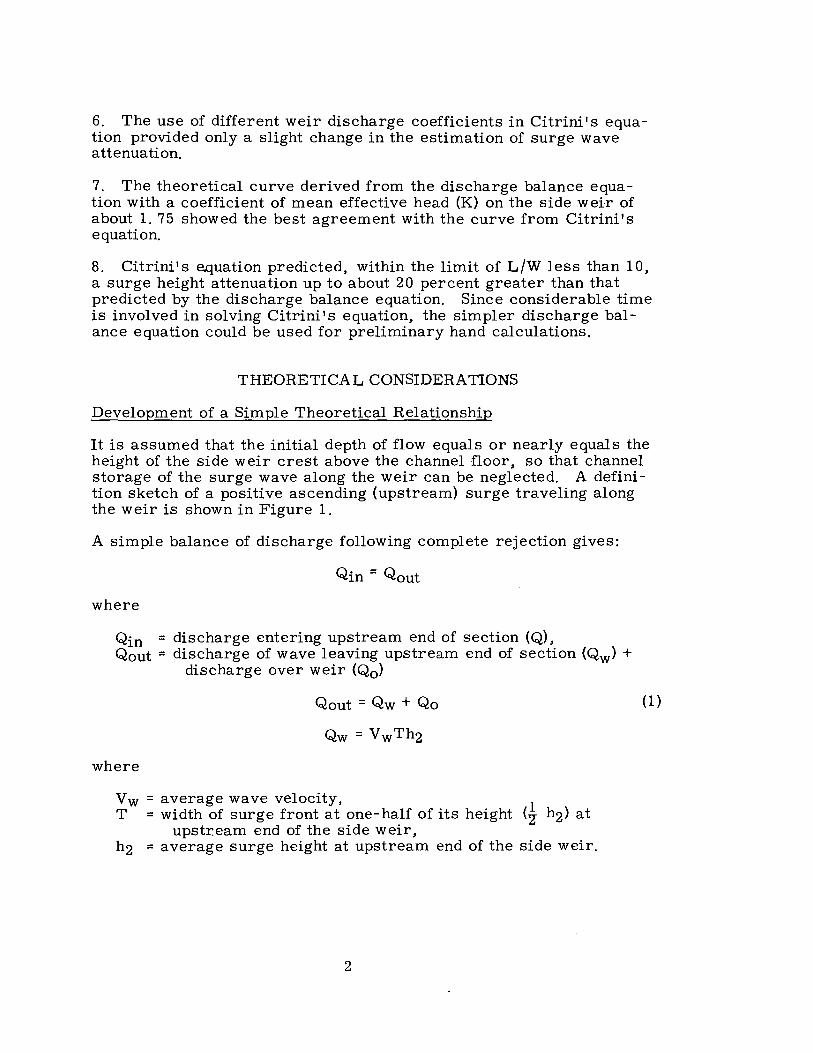
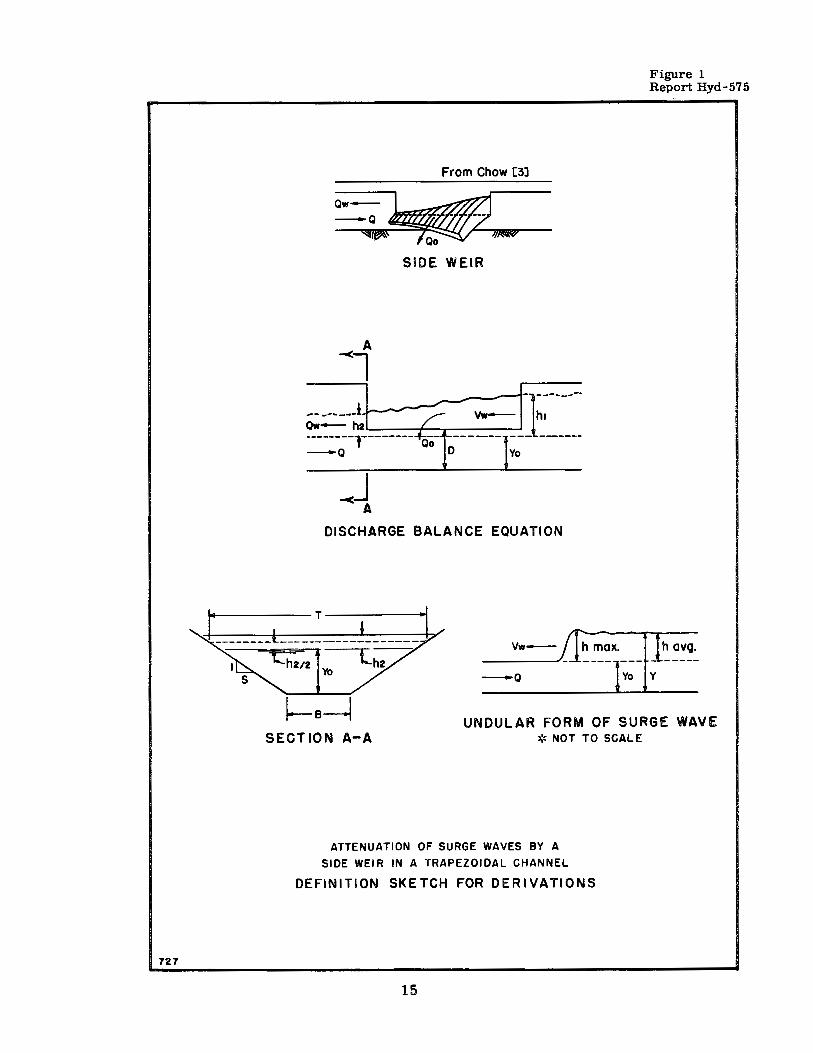
It is assumed that the initial depth of flow equals or nearly equals the height of the side weir crest above the channel floor, so that channel storage of the surge wave along the weir can be neglected. A definition sketch of a positive ascending (upstream) surge traveling along the weir is shown in Figure 1.
A simple balance of discharge following complete rejection gives:
where
Qin = discharge entering upstream end of section (Q). Qout = discharge of wave leaving upstream end of section (Qw) +
discharge over weir (Q0 )
Qout = Qw + Qo
Qw = VwTh2
where
Vw = average wave velocity, T = width of surge front at one-half of its height <½ h2) at
upstr.eam end of the side weir, h2 = average surge height at upstream end of the side weir.
2
(1)
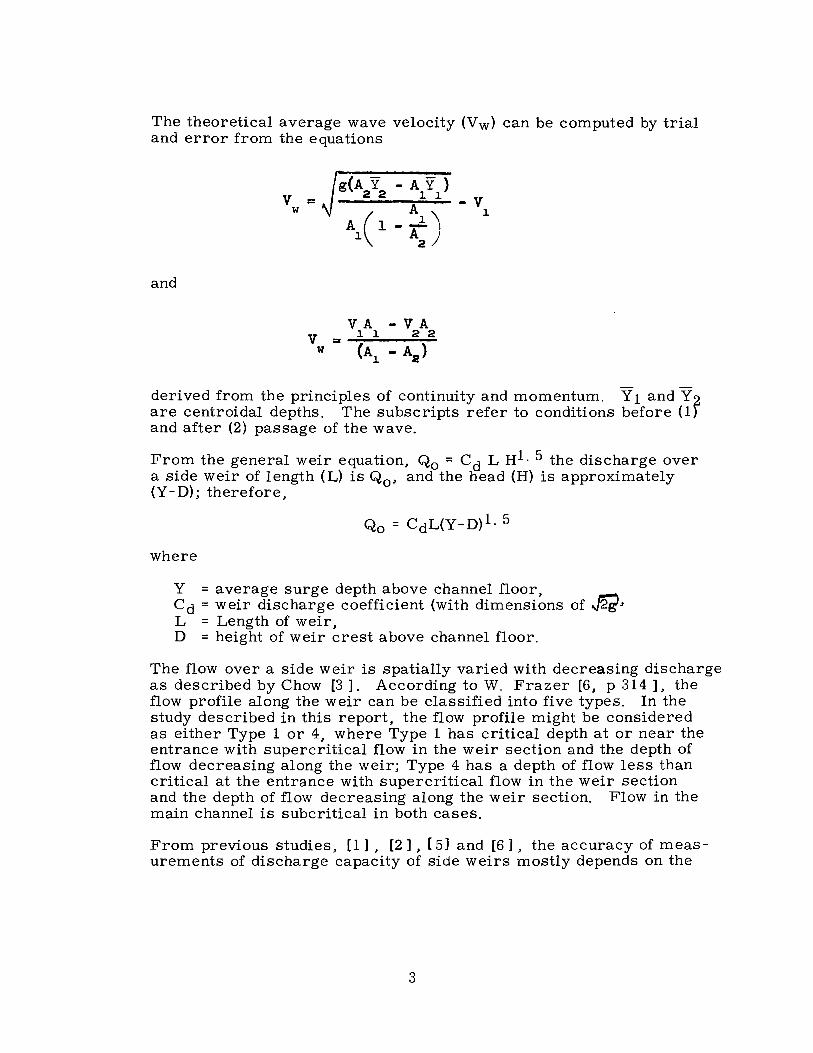
The theoretical average wave velocity (Vw) can be computed by trial and error from the equations
and
V • w
g(A Y - A Y) 2 2 l l ----A~---v
A1 ( 1 - ~) 1
VA - VA V = 1 1 2 2
w (A - A ) l 2
derived from the principles of continuity and momentum. Y 1 and Y 2 are centroidal depths. The subscripts refer to conditions before (1) and after (2) passage of the wave.
From the general weir equation, Q0 = Cd L H1· 5 the discharge over a side weir of length (L) is Q0 , and the liead (H) is approximately (Y - D); therefore.
where
Y = average surge depth above channel floor. Cd = weir discharge coefficient (with dimensions of ~ .. L = Length of weir, D = height of weir crest above channel floor.
The flow over a side weir is spatially varied with decreasing discharge as described by Chow [3 ] . According to W. Frazer [6, p 314 ] • the flow profile along the weir can be classified into five types. In the study described in this report, the flow profile might be considered as either Type 1 or 4, where Type 1 has critical depth at or near the entrance with supercritical flow in the weir section and the depth of flow decreasing along the weir; Type 4 has a depth of flow less than critical at the entrance with supercritical flow in the weir section and the depth of flow decreasing along the weir section. Flow in the main channel is subcritical in both cases.
From previous studies, [1] • [2]. [ 5] and [6]. the accuracy of measurements of discharge capacity of side weirs mostly depends on the
3
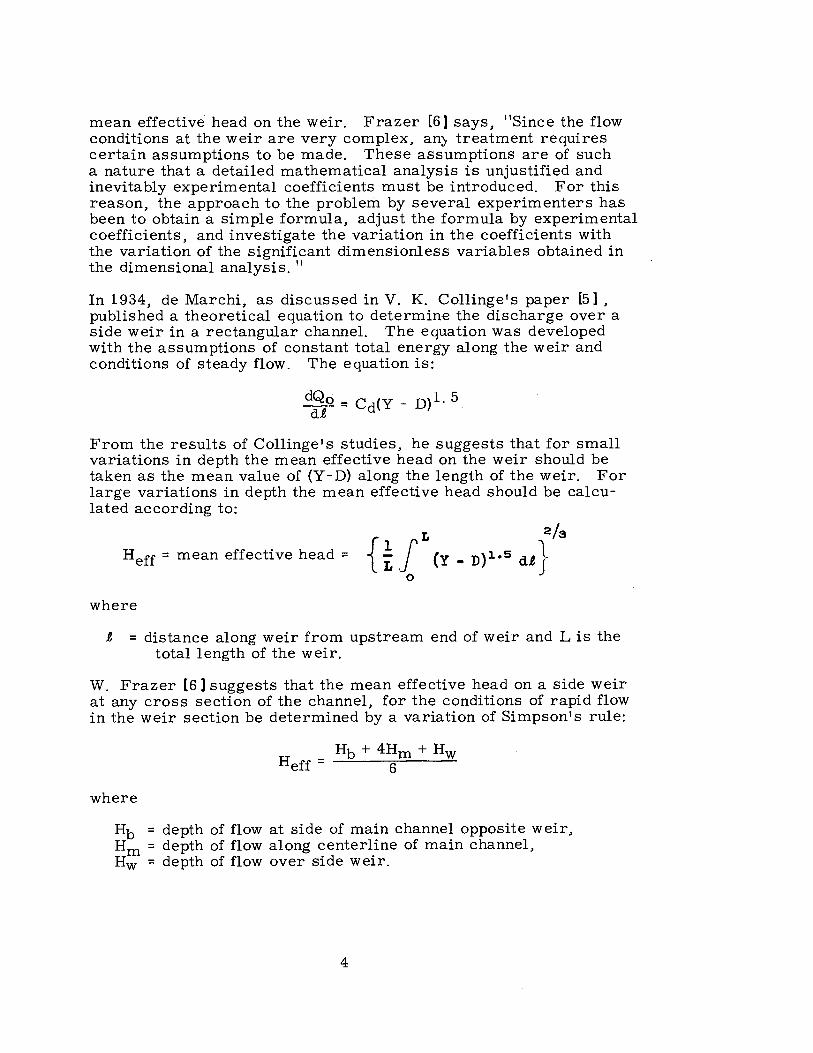
mean effective head on the weir. Frazer [6] says, "Since the flow conditions at the weir are very complex, an:, treatment requires certain assumptions to be made. These assumptions are of such a nature that a detailed mathematical analysis is unjustified and inevitably experimental coefficients must be introduced. For this reason, the approach to the problem by several experimenters has been to obtain a simple formula, adjust the formula by experimental coefficients, and investigate the variation in the coefficients with the variation of the significant dimensionless variables obtained in the dimensional analysis. 11
In 1934, de Marchi, as discussed in V. K. Collinge's paper (5], published a theoretical equation to determine the discharge over a side weir in a rectangular channel. The equation was developed with the assumptions of constant total energy along the weir and conditions of steady flow. The equation is:
dQo = Cd(Y - D)l. 5. d.t
From the results of Collinge's studies, he suggests that for small variations in depth the mean effective head on the weir should be taken as the mean value of (Y-D) along the length of the weir. For large variations in depth the mean effective head should be calculated according to:
L 2 /s Heff = mean effective head = { ½ J (Y _ D}1..s d.t}
0
where
.t = distance along weir from upstream end of weir and L is the total length of the weir.
W. Frazer (6] suggests that the mean effective head on a side weir at any cross section of the channel, for the conditions of rapid flow in the weir section be determined by a variation of Simpson's rule:
where
Hb = depth of flow at side of main channel opposite weir. Hm = depth of flow along centerline of main channel, Hw = depth of flow over side weir.
4
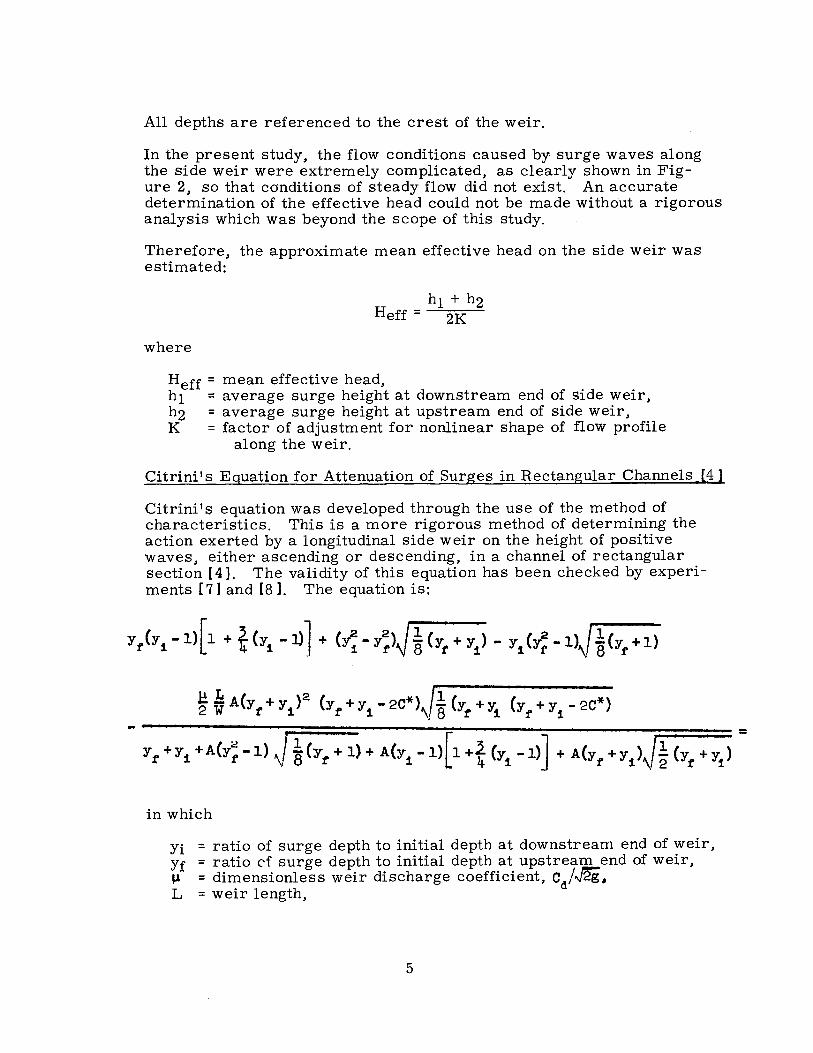
All depths are referenced to the crest of the weir.
In the present study. the flow conditions caused by surge waves along the side weir were extremely complicated, as clearly shown in Figure 2. so that conditions of steady flow did not exist. An accurate determination of the effective head could not be made without a rigorous analysis which was beyond the scope of this study.
Therefore. the approximate mean effective head on the side weir was estimated:
where
Heff = mean effective head, ht = average surge height at downstream end of side weir. h2 = average surge height at upstream end of side weir. K = factor of adjustment for nonlinear shape of flow profile
along the weir.
Citrini's Equation for Attenuation of Surges in Rectangular Channels [41
Citrini' s equation was developed through the use of the method of characteristics. This is a more rigorous method of determining the action exerted by a longitudinal side weir on the height of positive waves. either ascending or descending. in a channel of rectangular section (4). The validity of this equation has been checked by experiments [ 7] and (81. The equation is:
in which
Yi = ratio of surge depth to initial depth at downstream end of weir. Yf = ratio c-f surge depth to initial depth at upstream end of weir. µ = dimensionless weir discharge coefficient, cd/"2i,, L = weir length,
5
W = channel width, · A = reciprocal of Froude number of initial flow. C* = ratio of. height of weir crest above channel floor to initial
depth of flow.
Solution of Citrini's equation is extremely complicated and subject. to errors in calculation .. A computer program. presented in the Appendix to this report. was prepared during an earlier study [9) to facilitate rapid calculation and to obtain a higher degree of reliability in the solution.
Limitations of Citrini's equation. --Citrini states that the accuracy of the equation deteriorates as L/W increases. with a maximum error of about 15 percent for L/W = 10. Also, the relationship was intended for use in determining the attenuation of the average surge height.
THE EXPERIMENTAL INVESTIGATION
Description of the Experimental Apparatus
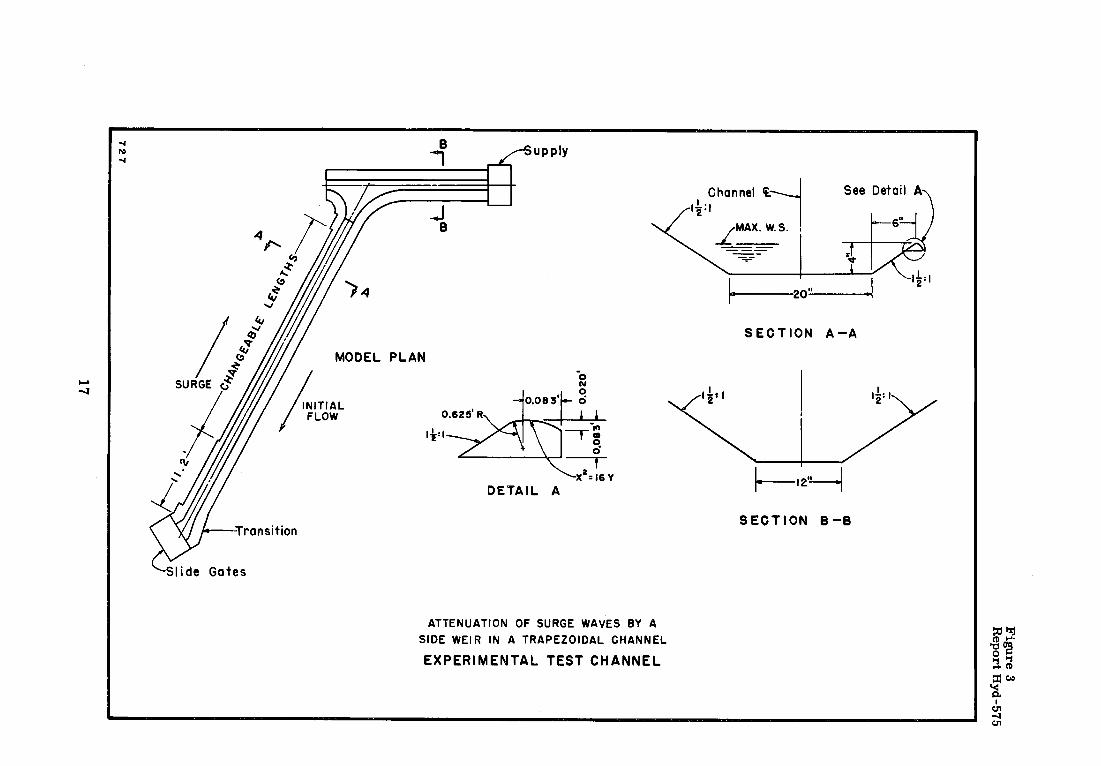
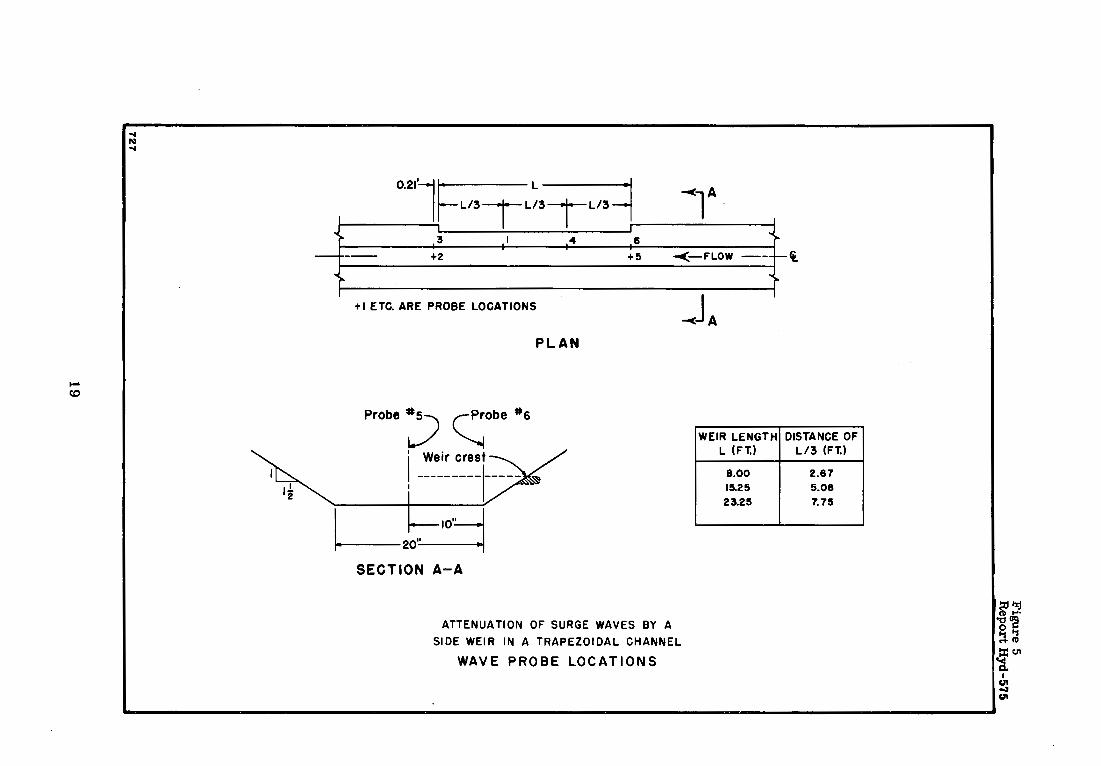
The laboratory model used in these studies consisted of a portion of a model which had been developed for earlier studies [ 91. The test channel had a depth of 1 foot (30. 48 cm (centimeters)) and 1-1 /2: 1 side slopes, Figure 3. Most of the model was fabricated from plywood, with warped transition sections formed in concrete. The channel floor was level and the floor and sides had an enamel paint finish. Water was supplied through a recirculating system by a centrifugal pump. Discharge was measured with a portable orifice meter with interchangeable orifices, each of which was calibrated volumetrically. The test channel allowed weir lengths up to approximately 25 feet (7. 6 m (meters)). Three weir lengths were tested; 8. 00, 15. 25 and 23. 25 feet (2. 44, 4. 65, and 7. 09 m). The weir crest was an ogee shape consisting of sheet metal formed over wood templates with elevation tolerances of plus or minus 0. 002 feet (0. 61 mm (millimeter)). The control at the downstream end of the model consisted of six slide gates which were used to control the depth of flow for each test discharge. Figure 4. The gates could be closed very rapidly for almost instantaneous and complete rejection of the inflow. Water surface elevations during each test run were measured with point gages at the centerline of the channel at the upstream and downstream ends of the weir.
'The wave instrumentation is described in King's thesis [ 10):
"The model instrumentation included six capacitance-type wave probes with sensors of plasticized-enamel-coated wire. Each wire was about 6-1 / 4 inches long (16 cm).
6
mounted in a U-shaped frame made from 1/4-inch-diameter (6. 35 mm) stainless steel rod. The wires were held in the frames by small plastic insulators. The lower end of the wire was carefully sealed in the insulators to prevent electrical shorting by the water. Each frame was attached to a modified point gage staff in a rack and pinion device with a vernier reading to 0. 001 foot (0. 30 mm). Each probe was connected to one channel of a commercial six-channel directwriting oscillograph. "
The locations of the probes are shown on Figure 5. Figure 6 is a photograph of the test channel and model instrumentation.
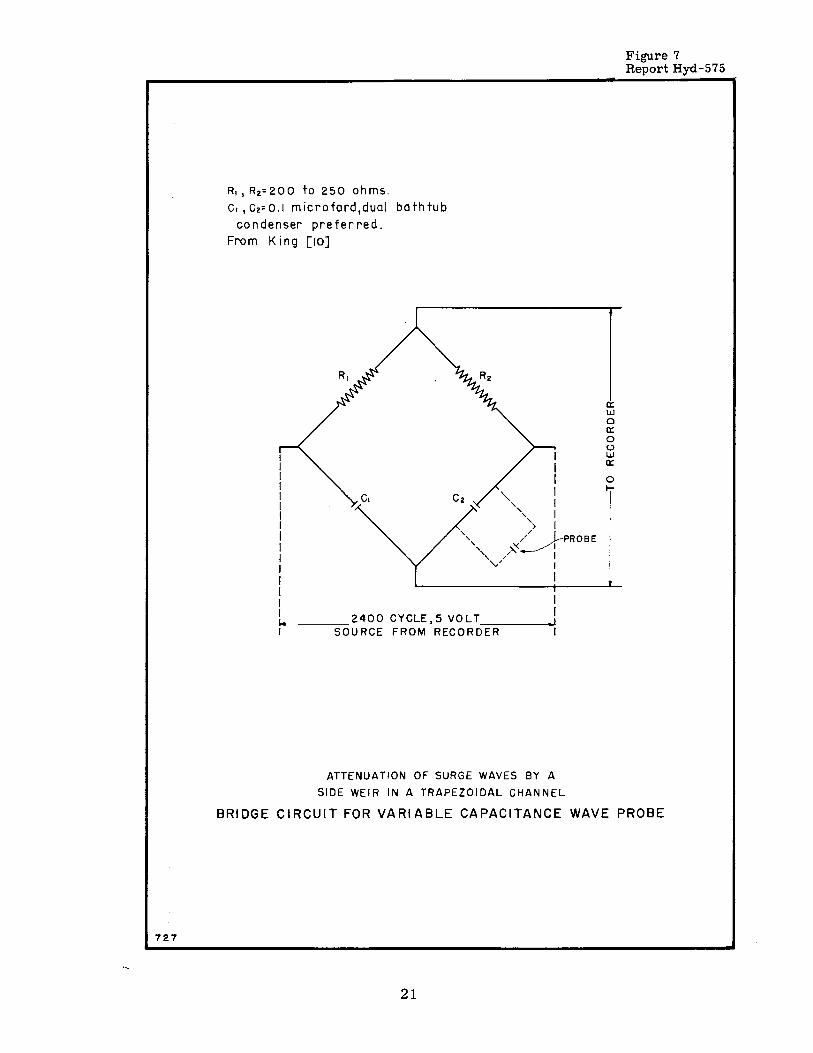
"The wave height is indicated by the change in capacitance as the immersion of the sensor wire is changed. The plasticized enamel coating acts as the dielectric of the capacitor whose legs consist of the wire and the water. The unsealed end of the sensor wire is connected to one leg of a resistance-capacitance bridge, Figure 7. As the water level varies on the sensor, the capacitance across the fixed capacitor c 2 also varies, resulting in imbalance of the bridge and an accompanying signal to the recorder.
"Some difficulty was experienced in calibrating the probes and in maintaining this calibration over a reasonable per-iod of time. Accurate data were assured by making a separate calibration for each test run, except in one or two cases when two runs at the same depth were made in quick succession. Calibration was accomplished by raising and lowering the probes known distances in a stable pool of water. Prewetting the wire by lowering the probe more than the required amount, waiting for several seconds, then raising the probe to the correct position, partially suppressed the nonlinearity caused by wetting. Fifteen to thirty minutes were required for the instrumentation to reach a stable condition. The probe was then raised in increments to the initial zero position to check the linearity. It was also necessary to carefully insulate the impedance-bridge circuit of each probe because of zero datum drift caused by room temperature variations.
"Other experimenters [12 ], by comparing wave probe records with photographic records, have estimated that meniscus (surface tension) effects can result in an error of approximately plus or minus 0. 015 inch (O. 4 mm) (or about 0. 001 foot), with the largest errors occurring at wave troughs (-0. 01 to +0. 02 inch) (-0. 25 mm to +0. 5 mm). No attempt was made to
7

evaluate the surface tension effect in the present studies; however, the cited reference indicates that errors due to this effect are not appreciable. "
Test Program and Limitations
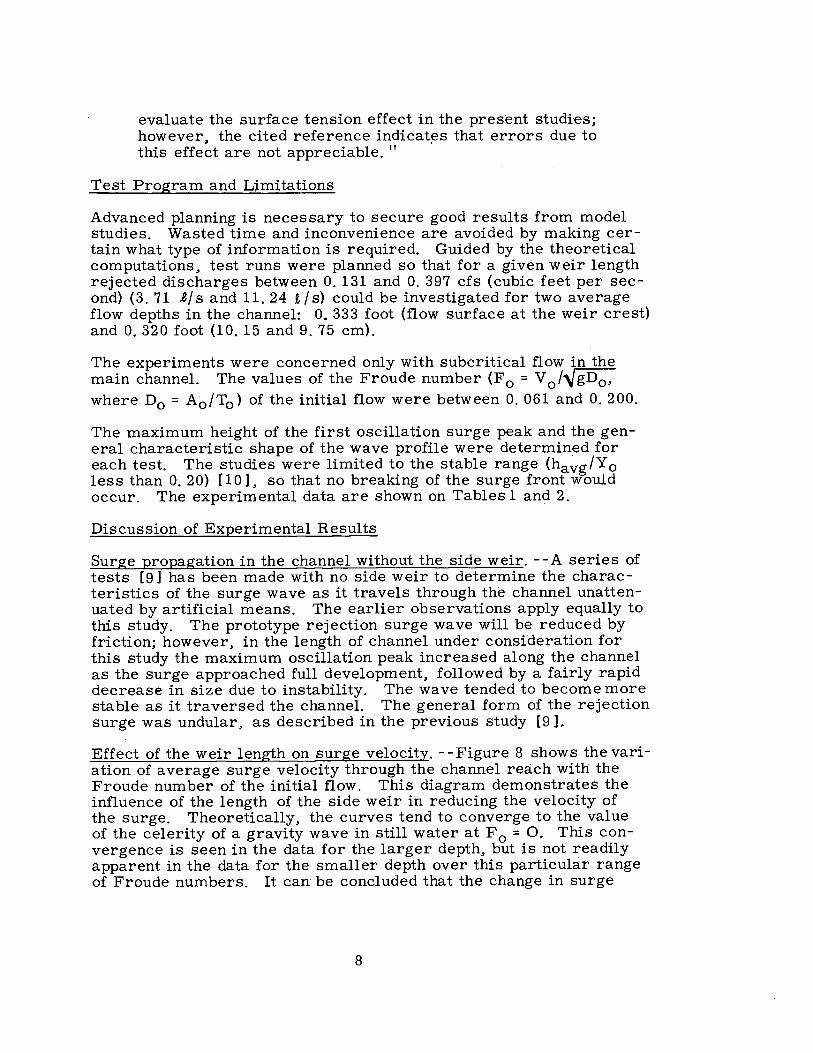
Advanced planning is necessary to secure good results from model studies. Wasted time and inconvenience are avoided by making certain what type of information is required. Guided by the theoretical computations, test runs were planned so that for a given weir length rejected discharges between 0. 131 and 0. 397 cfs (cubic feet per sec.,. ond) (3. 71 t/s and 11. 24 t/s) could be investigated for two average flow depths in the channel: 0. 333 foot (flow surface at the weir crest) and 0. 320 foot (10. 15 and 9. 75 cm).
The experiments were concerned only with subcritical flow in the main channel. The values of the Froude number (F O = V 0 /1.JgD0 ,
where D0 = A0 /T0 ) of the initial flow were between 0. 061 and 0. 200.
The maximum height of the first oscillation surge peak and the general characteristic shape of the wave profile were determined for each test. The studies were limited to the stable range (havg/Y 0
less than 0. 20) [ 10], so that no breaking of the surge front would occur. The experimental data are shown on Tables 1 and 2.
Discussion of Experimental Results
Surge propagation in the channel without the side weir. - -A series of tests [9] has been made with no side weir to determine the characteristics of the surge wave as it travels through the channel unattenuated by artificial means. The earlier observations apply equally to this study. The prototype rejection surge wave will be reduced by friction; however, in the length of channel under consideration for this study the maximum oscillation peak increased along the channel as the surge approached full development, followed by a fairly rapid decrease in size due to instability. The wave tended to become more stable as it traversed the channel. The general form of the rejection surge was undular, as described in the previous study [9 ].
Effect of the weir length on surge velocity. --Figure 8 shows the variation of average surge velocity through the channel reach with the Froude number of the initial flow. This diagram demonstrates the influence of the length of the side weir in reducing the velocity of the surge. Theoretically, the curves tend to converge to the value of the celerity of a gravity wave in stiH water at F O = O. This convergence is seen in the data for the larger depth, but is not readily apparent in the data for the smaller depth over this particular range of Froude numbers. It can be concluded that the change in surge
8
mounted in a U-shaped frame made from 1/4-inch-diameter (6. 35 mm) stainless steel rod. The wires were held in the frames by small plastic insulators. The lower end of the wire was carefully sealed in the insulators to prevent electrical shorting by the water. Each frame was attached to a modified point gage staff in a rack and pinion device with a vernier reading to 0. 001 foot (0. 30 mm). Each probe was connected to one channel of a commercial six-channel directwriting oscillograph. "
The locations of the probes are shown on Figure 5. Figure 6 is a photograph of the test channel and model instrumentation.
"The wave height is indicated by the change in capacitance as the immersion of the sensor wire is changed. The plasticized enamel coating acts as the dielectric of the capacitor whose legs consist of the wire and the water. The unsealed end of the sensor wire is connected to one leg of a resistance-capacitance bridge, Figure 7. As the water level varies on the sensor, the capacitance across the fixed capacitor c 2 also varies, resulting in imbalance of the bridge and an accompanying signal to the recorder.
"Some difficulty was experienced in calibrating the probes and in maintaining this calibration over a reasonable per-iod of time. Accurate data were assured by making a separate calibration for each test run, except in one or two cases when two runs at the same depth were made in quick succession. Calibration was accomplished by raising and lowering the probes known distances in a stable pool of water. Prewetting the wire by lowering the probe more than the required amount, waiting for several seconds, then raising the probe to the correct position, partially suppressed the nonlinearity caused by wetting. Fifteen to thirty minutes were required for the instrumentation to reach a stable condition. The probe was then raised in increments to the initial zero position to check the linearity. It was also necessary to carefully insulate the impedance-bridge circuit of each probe because of zero datum drift caused by room temperature variations.
"Other experimenters (12 ], by comparing wave probe records with photographic records, have estimated that meniscus (surface tension) effects can result in an error of approximately plus or minus 0. 015 inch (0. 4 mm) (or about 0. 001 foot), with the largest errors occurring at wave troughs (-0. 01 to +O. 02 inch) (-0. 25 mm to +O. 5 mm). No attempt was made to
7
evaluate the surface tension effect in the present studies; however, the cited reference indicat~s that errors due to this effect are not appreciable. "
Test Program and Limitations
Advanced planning is necessary to secu,re good results from model studies. Wasted time and inconvenience are avoided by making certain what type of information is required. Guided by the theoretical computations, test runs were planned so that for a given weir length rejected discharges between 0. 131 and 0. 397 cfs (cubic feet per second) (3. 71 J,/ s and 11. 24 9, / s) could be investigated for two average flow depths in the channel: 0. 333 foot (flow surface at the weir crest) and 0. 320 foot (10. 15 and 9. 75 cm).
The experiments were concerned only with subcritical flow in the main channel. The values of the Froude number (F O = V 0 /-tJgD0 ,
where D0 = A0 /T0 ) of the initial flow were between 0. 061 and 0. 200.
The maximum height of the first oscillation surge peak and the general characteristic shape of the wave profile were determined for each test. The studies were limited to the stable range (havg/Y 0
less than 0. 20) [ 10], so that no breaking of the surge front would occur. The experimental data are shown on Tables 1 and 2.
Discussion of Experimental Results
Surge propagation in the channel without the side weir. --A series of tests [9] has been made with no side weir to determine the characteristics of the surge wave as it travels through the channel unattenuated by artificial means. The earlier observations apply equally to this study. The prototype rejection surge wave will be reduced by friction; however, in the length of channel under consideration for this study the maximum oscillation peak increased along the channel as the surge approached full development, followed by a fairly rapid decrease in size due to instability. The wave tended to become more stable as it traversed the channel. The general form of the rejection surge was undular, as described in the previous study [9].
Effect of the weir length on surge velocity. --Figure 8 shows the variation of average surge velocity through the channel reach with the Froude number of the initial flow. This diagram demonstrates the influence of the length of the side weir in reducing the velocity of the surge. Theoretically, the curves tend to converge to the value of the celerity of a gravity wave in still water at F O = 0. This convergence is seen in the data for the larger depth, but is not readily apparent in the data for the smaller depth over this particular range of Froude numbers. It can be concluded that the change in surge
8
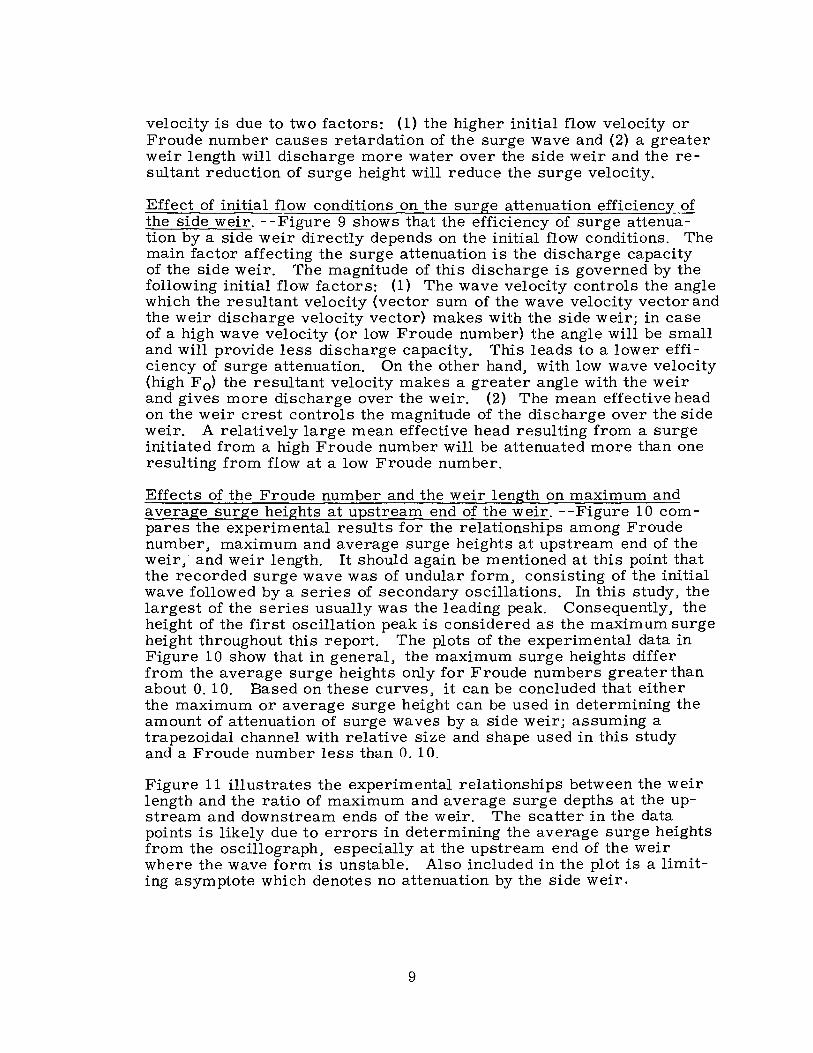
velocity is due to two factors: (1) the higher initial flow velocity or Froude number causes retardation of the surge wave and (2) a greater weir length will discharge more water over the side weir and the resultant reduction of surge height will reduce the surge velocity.
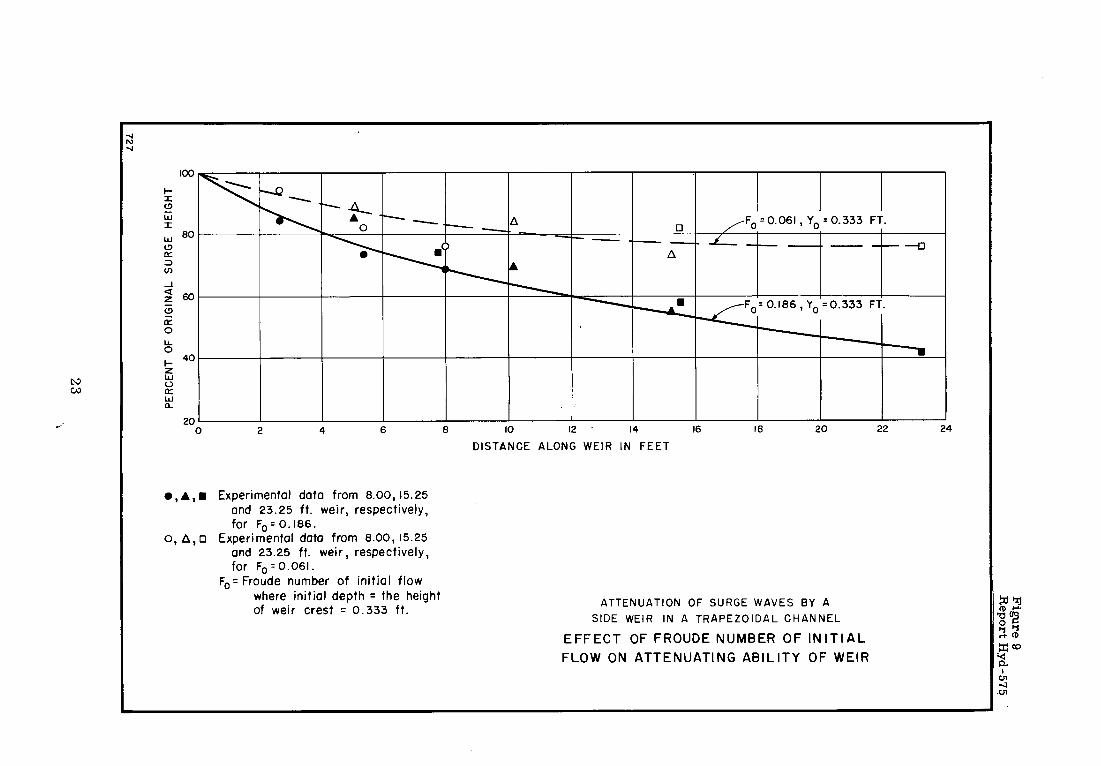
Effect of initial flow conditions on the surge attenuation efficiency of the side weir. --Figure 9 shows that the efficiency of surge attenuation by a side weir directly depends on the initial flow conditions. The main factor affecting the surge attenuation is the discharge capacity of the side weir. The magnitude of this discharge is governed by the following initial flow factors: (1) The wave velocity controls the angle which the resultant velocity (vector sum of the wave velocity vector and the weir discharge velocity vector) makes with the side weir; in case of a high wave velocity (or low Froude number) the angle will be small and will provide less discharge capacity. This leads to a lower efficiency of surge attenuation. On the other hand, with low wave velocity (high F 0 ) the resultant velocity makes a greater angle with the weir and gives more discharge over the weir. (2) The mean effective head on the weir crest controls the magnitude of the discharge over the side weir. A relatively large mean effective head resulting from a surge initiated from a high Froude number will be attenuated more than one resulting from flow at a low Froude number.
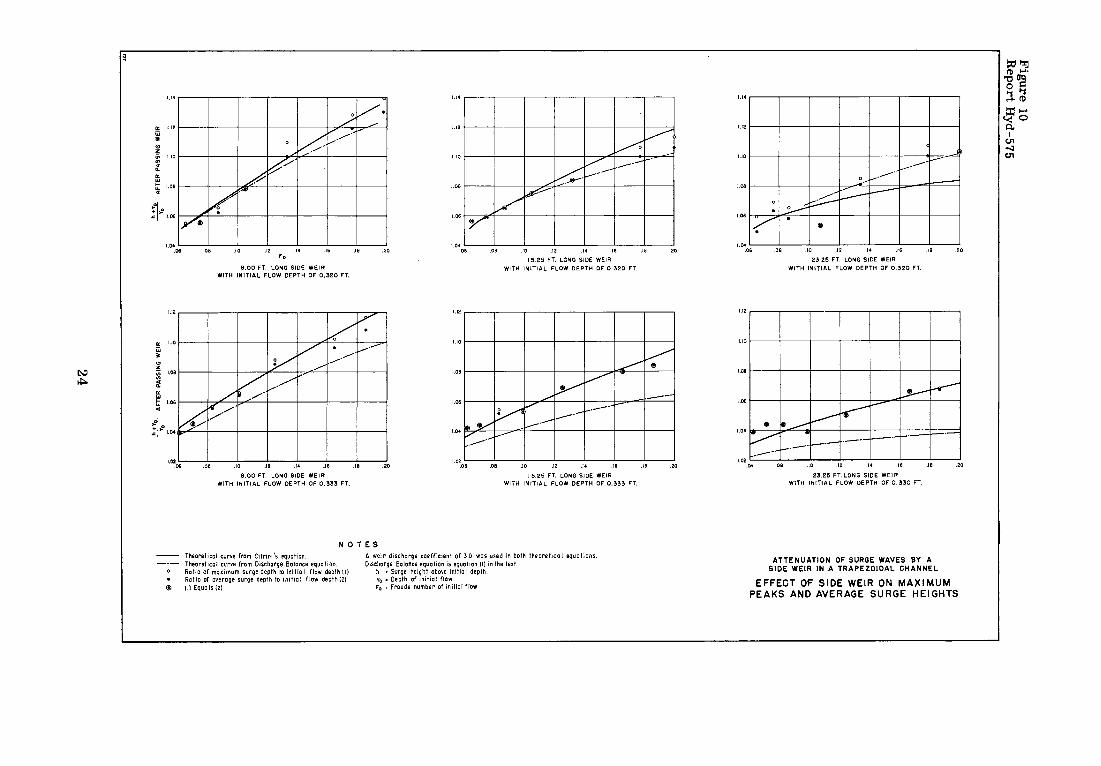
Effects of the Froude number and the weir length on maximum and average surge heights at upstream end of the weir. - -Figure 10 com -pares the experimental results for the relationships among Froude number, maximum and average surge heights at upstream end of the weir, and weir length. It should again be mentioned at this point that the recorded surge wave was of undular form, consisting of the initial wave followed by a series of secondary oscillations. In this study, the largest of the series usually was the leading peak. Consequently, the height of the first oscillation peak is considered as the maximum surge height throughout this report. The plots of the experimental data in Figure 10 show that in general, the maximum surge heights differ from the average surge heights only for Froude numbers greater than about 0. 10. Based on these curves, it can be concluded that either the maximum or average surge height can be used in determining the amount of attenuation of surge waves by a side weir; assuming a trapezoidal channel with relative size and shape used in this study and a Froude number less than 0. 10.
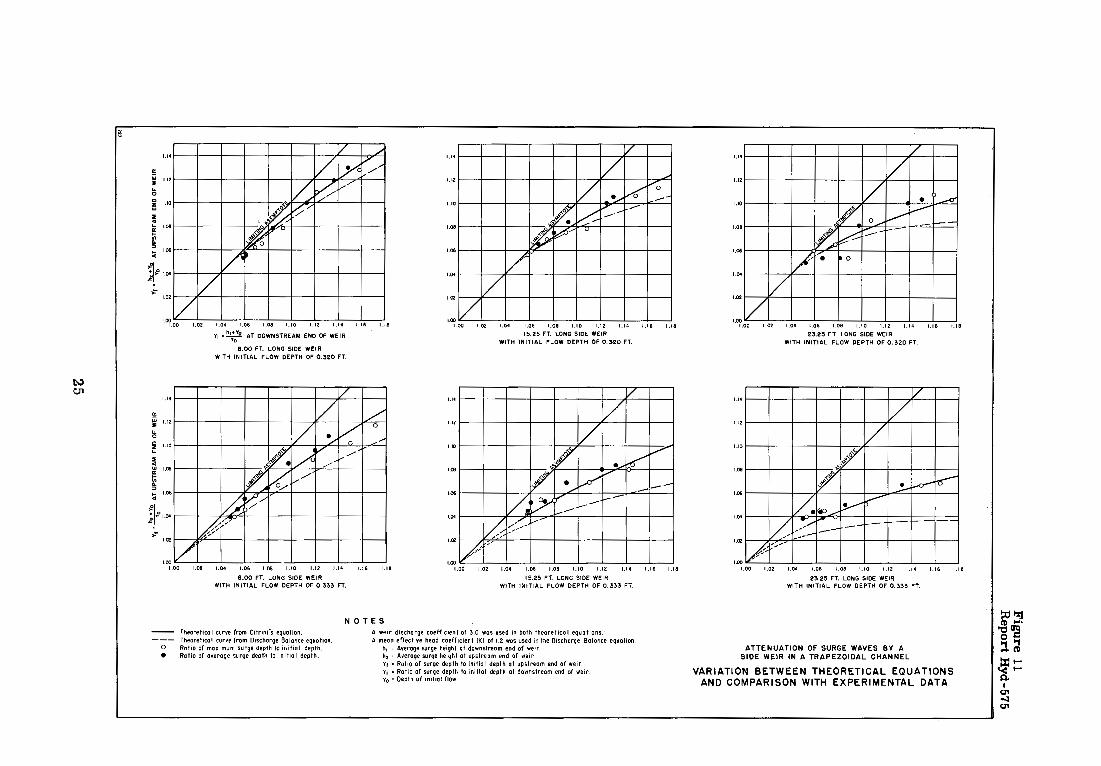
Figure 11 illustrates the experimental relationships between the weir length and the ratio of maximum and average surge depths at the upstream and downstream ends of the weir. The scatter in the data points is likely due to errors in determining the average surge heights from the oscillograph, especially at the upstream end of the weir where the wave form is unstable. Also included in the plot is a limiting asymptote which denotes no attenuation by the side weir.
9
Agreement of theoretical predictions with the experimental results. -Figures 10 and 11 indicate that Citrini's equation, although originally developed for rectangular channels, is also applicable to trapezoidal channels with the same relative shape as that used in the present study and with relatively small stable surge waves (havg/Y O less than 0. 20). The agreement between Citrini' s theory and the experimental data is quite good. Through comparison of both theoretical curves, it appears that within a limit of L/W = 10 Citrini's equation shows a maximum deviation in surge height attenuation up to about 20 percent from that derived from the equation which was developed through the use of the discharge balance.
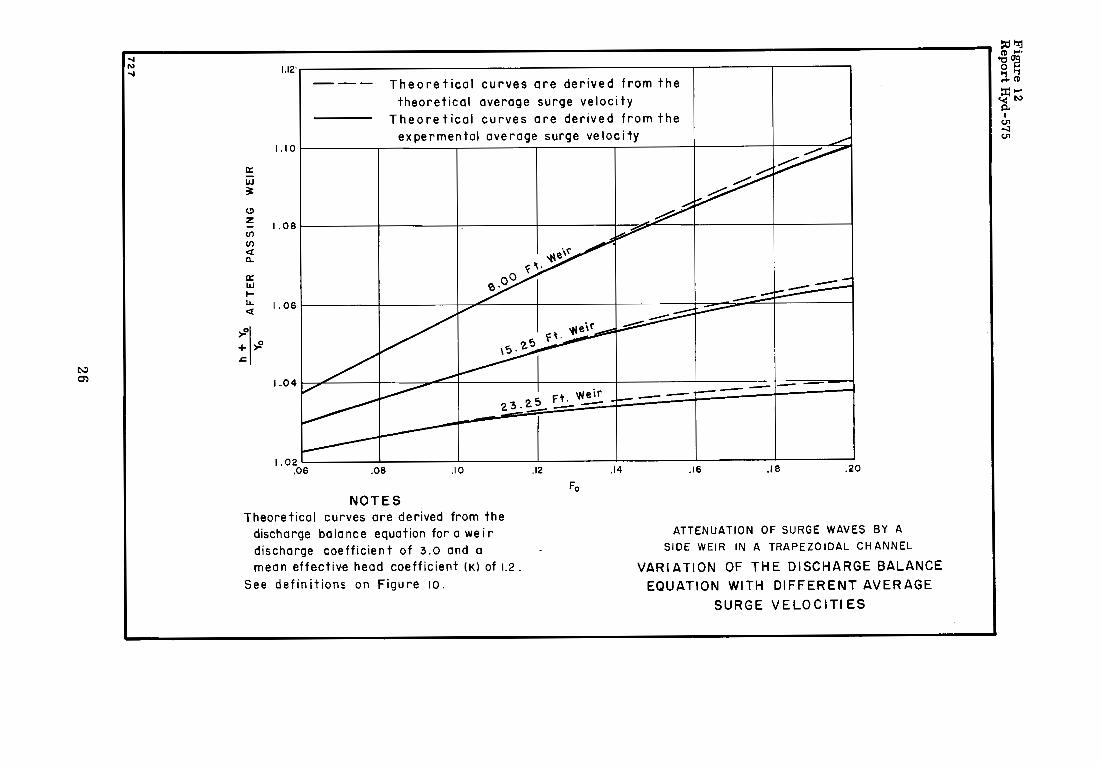
Effect of using theoretical and experimental average surge velocities to solve the discharge balance equation. --Figure 12 shows that there is no appreciable difference between the attenuations predicted by the discharge balance equation using either the theoretical average surge velocity or experimental average surge velocity.
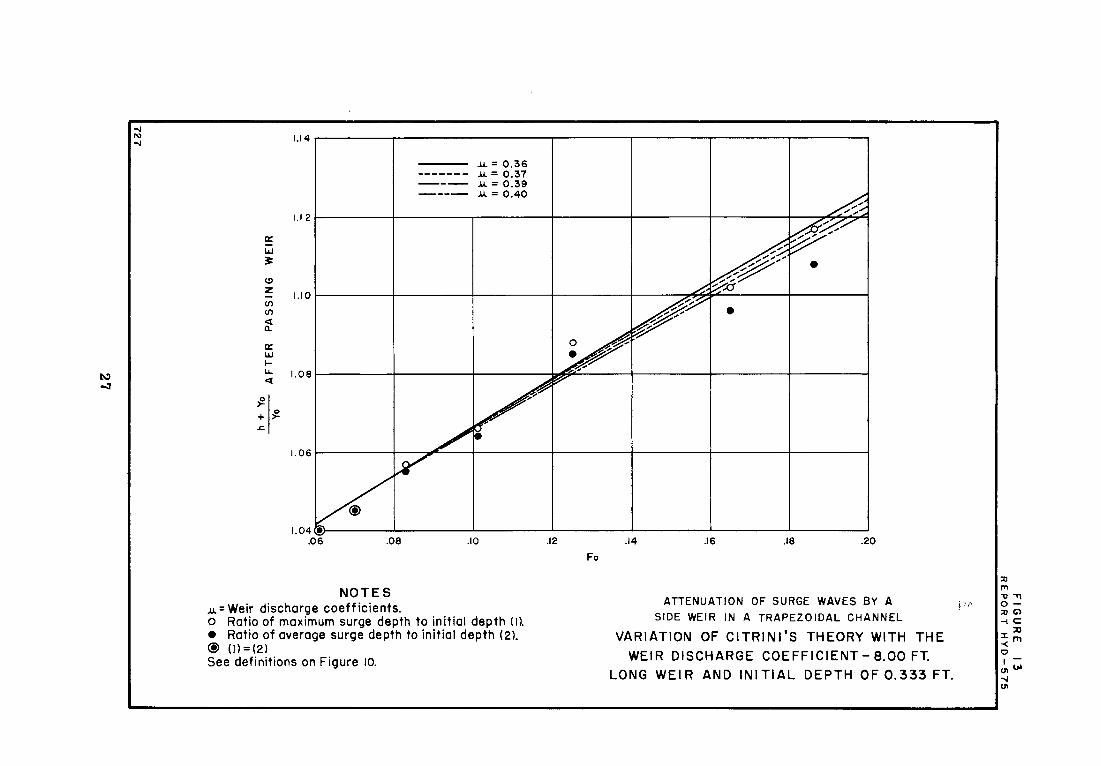
Effect of using different weir discharge coefficients to solve Citrini' s equation. --Figure 13 demonstrates that a difference in weir discharge coefficients causes only a slight change in the attenuation prediction. Therefore, for preliminary design purposes, the weir discharge coefficient can be considered as a relatively unimportant factor in surge wave attenuation evaluated by Citrini' s equation.
Effect of using different coefficients of mean effective head on the side weir. --Since the flow conditions caused by surge waves along a side weir are extremely complicated, no attempt was made to investigate the variables governing the mean effective head on the weir. However. the following approach was used to solve the problem in this study. According to Schoklitsch [ 13}. the approximate mean effective head on a side weir is taken as the arithmetic mean of the heads at the upstream and downstream ends (K = 1. O)~ but this assumption is valid only in case of approximate linearity of the water surface profile. Consequently, in the case of nonlinearity such as occurred in this study where the undular profile exists along the weir section, it is necessary to modify the estimated mean head. A value ofK = 1. 2 was in the computations discussed thus far; 1. 2 is the constant value of the ratio of maximum surge height to average surge height in a trapezoidal channel which was reported in previous studies [101. Use of this value assumes that the average surge height is linear along the weir, but that the maximum surge height is curvilinear.
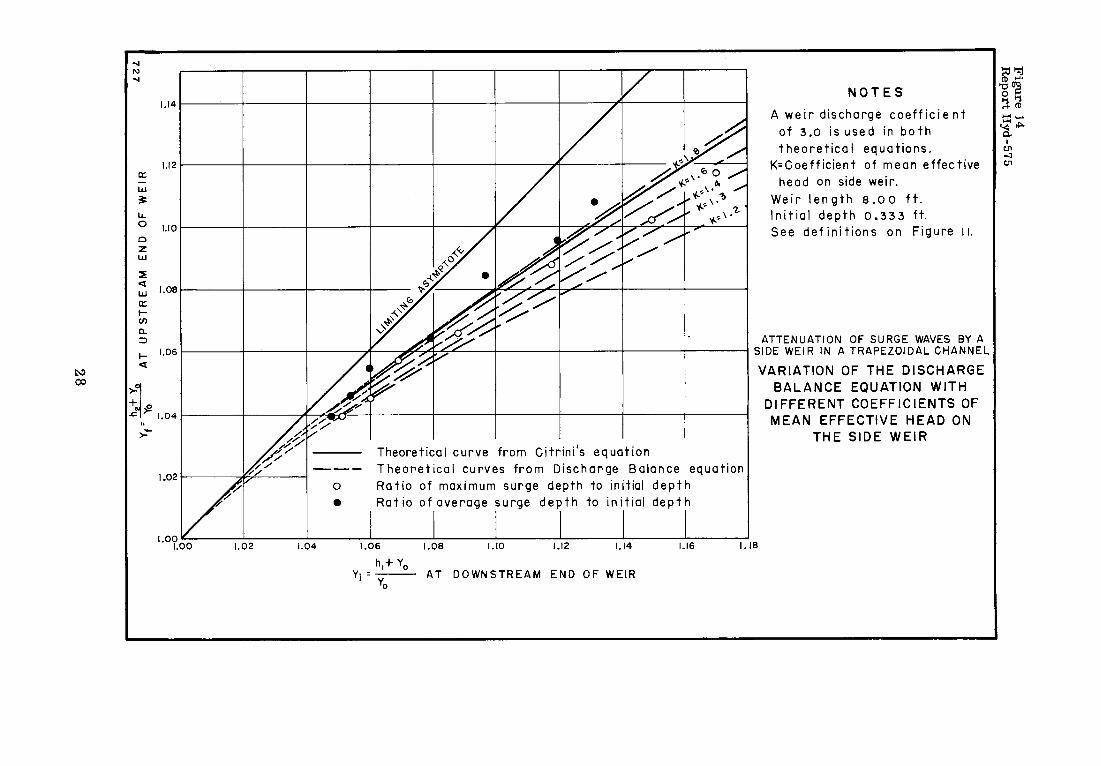
The value of K for deriving the discharge balance equation to provide the closest agreement with Citrini' s equation can be determined from Figure 14. An initial flow depth of 0. 333 foot (10. 15 cm) and an 8. 00-foot-long weir (2. 44 m) were investigated. The results show that the required value of K is about 1. 75. However, a K value of 1. 0 is acceptable for initial estimates.
10

REFERENCES
1. Ackers., Peter., "A Theoretical Consideration of Side Weirs as Stormwater Overflows. 11 Proceedings, Institution of Civil Engineers (England), Vol. 6., February 1957., p 250.
2. Allen., J. W . ., "The Discharge of Water Over Side Weirs in Circular Pipes. " Proceedings, Institution of Civil Engineers (England)., Vol. 6., February 1957., p 270.
3. Chow., V. T . ., "Rapidly Varied Unsteady Flow." Open Channel Hydraulics., Chapter 19., McGraw-Hill., 1959.
4. Citrini., Duilio., "Attenuation of a Positive Wave by Means of a Lateral Spillway., (Sull' attenuazione di un'onda positive ad opera di uno sfioratore). 11 Translated from the Italian by the U.S. Language Service Bureau., Translation No. 482., 1964.
5. Collinge. V. K . ., "The Discharge Capacity of Side Weirs." Proceedings. Institution of Civil Engineers (England). Vol. 6., February 1957., p 288.
6. Frazer., W . ., "The Behavior of Side Weirs in Prismatic Rectangular Channels. "Proceedings., Institution of Civil Engineers (England)., Vol. 6., February 1957., p 305.
7. Gentilini., Bruno., "The Action of a Side Weir on the Positive Wave Moving Upstream in an Open Channel., (L'Azione Di Uno Sfioratore Laterale Sull' onda Positive Ascendente in Un Canale)." Translated from the Italian by the U. S. Language Service Bureau., Translation No. 481., 1964.
8. De Marchi., Giulio., "Action of Side Weir and Tilting Gates on Translation Waves in Canals." Proceedings of the Minnesota International Hydraulics Conference., IAHR and ASCE., August 1953., p 537. •
9. King. D. L . ., "Hydraulic Model Studies of Surges Developed by Rejection of Flow at the Forebay Pumping Plant. San Luis Unit- -Central Valley Project. " Bureau of Reclamation., Hydraulic Laboratory Report No. Hyd-546., 1965.
10. King., D. L . ., "A Theoretical and Experimental Study of Rejection Surges in Trapezoidal Channels." Master's Thesis. University of Colorado., Boulder., Colorado., 1966.
11. Rayleigh., Lord., "On Waves. " The London, Edinburgh, and Dublin Philosophical Magazine and Journal of Science, Ser. 5., Vol. 1., April 1876., pp 257-279.
11
12. Sandover, J. A .• and Zienkiewicz, 0. C .• "Experiments on Surge Waves." Water Power, November 1957.
13. Schoklitsch, A .• Hydraulic Structures, A Text and Handbook, translated from German by Samuel Shulits and reviewed by Lorenz G. Straub, published by the American Society of Mechanical Engineers. Vol. 1 (1937) pp 120-128.
12
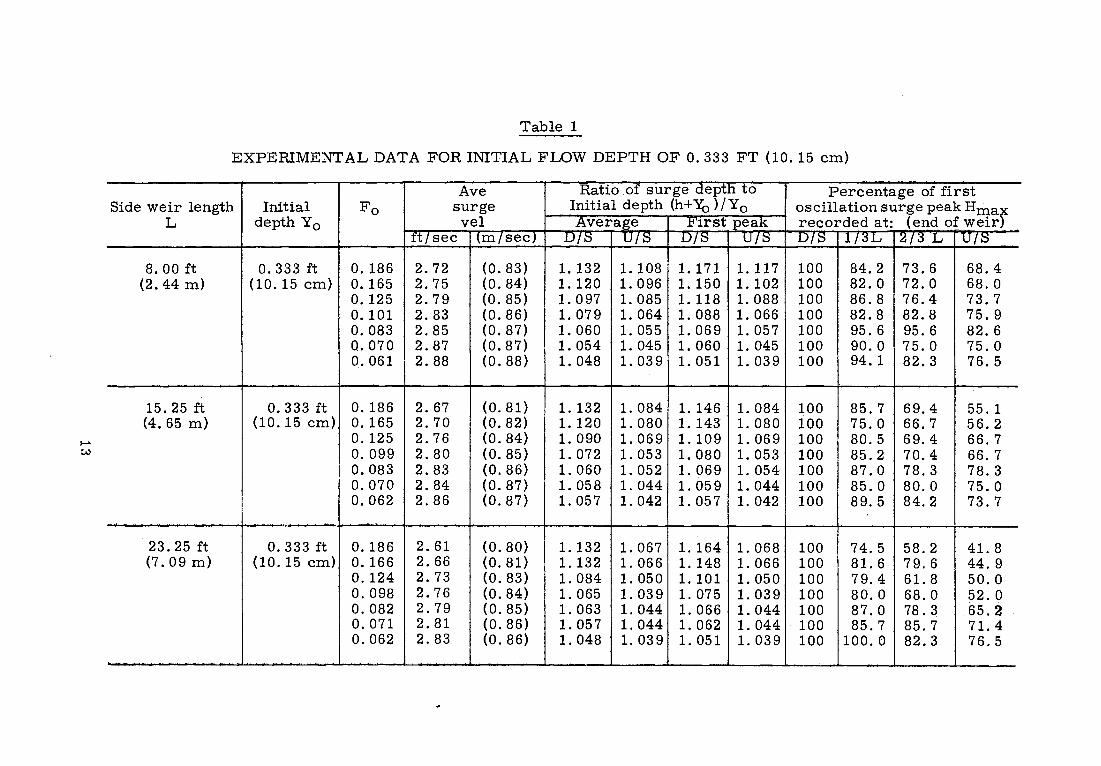
Table 1
EXPERIMENTAL DATA FOR INITIAL FLOW DEPTH OF O. 333 FT (10.15 cm)
Ave Ratio of surge depth to Percentage of first Side weir length Initial Fo surge Initial depth (h+Y0 )/Y0 oscillation surge peak Hrna)
L depth Y0 vel Average First peaK recorded at: (end of weir ft/sec (m/secJ D/S U/S DTS urs ms 1/::SL 2/3 L U/::S
8. 00 ft o. 333 ft 0.186 2.72 (0.83) l. 132 l. 108 1. 171 l. 117 100 84.2 73.6 68.4 (2. 44 m) (10. 15 cm) 0.165 2.75 (0.84) 1.120 l. 096 1. 150 l. 102 100 82.0 72.0 68.0
0.125 2.79 (0. 85) 1. 097 1.085 l. 118 1.088 100 86.8 76.4 73.7 0.101 2.83 (0. 86) l. 079 1.064 1.088 l. 066 100 82.8 82.8 75.9 0.083 2.85 (0. 87) l. 060 l. 055 l. 069 l. 057 100 95. 6 95.6 82.6 0.070 2.87 (0.87) 1.054 1.045 1.060 l. 045 100 90.0 75.0 75.0 0.061 2.88 (0. 88) 1.048 1. 039 l. 051 1.039 100 94. 1 82.3 76.5
15. 25 ft o. 333 ft 0.186 2.67 (0. 81) l. 132 l. 084 1. 146 1. 084 100 85.7 69. 4 55.1 (4. 65 m) (10. 15 cm) 0.165 2.70 (0. 82) 1.120 1.080 l. 143" 1. 080 100 75.0 66.7 56.2
0.125 2.76 (0.84) 1.090 l. 069 l. 109 l. 069 100 . 80. 5 69.4 66.7 0.099 2.80 (0.85) l. 072 l. 053 l. 080 l. 053 100 85.2 70.4 66.7 0.083 2.83 (0. 86) 1.060 l. 052 l. 069 1.054 100 87.0 78.3 78.3 0.070 2.84 (0.87) l. 058 1.044 l. 059 1.044 100 85.0 80.0 75.0 0.062 2.86 (0.87) l. 057 1.042 l. 057 1.042 100 89.5 84.2 73.7
-
23. 25 ft 0. 333 ft 0.186 2.61 (0. 80) l. 132 1. 067 l. 164 1.068 100 74.5 58.2 41. 8 (7.09m) (lo. 15 cm) 0.166 2.66 (0. 81) l. 132 l. 066 l. 148 l. 066 100 81. 6 79.6 44.9
0.124 2.73 (0. 83) 1.084 l. 050 l. 101 l. 050 100 79. 4 61. 8 50.0 0.098 2.76 (0. 84) 1. 065 1. 039 1. 075 l. 039 100 80.0 68.0 52.0 0.082 2.79 (0. 85) 1.063 1.044 1.066 l. 044 100 87.0 78. 3 .65. 2 0.071 2.81 (0. 86) 1.057 1.044 l. 062 1.044 - 100 85.7 85.7 71.4 0.062 2.83 (0. 86) 1.048 1. 039 1.051 l. 039 100 100.0 82.3 76.5
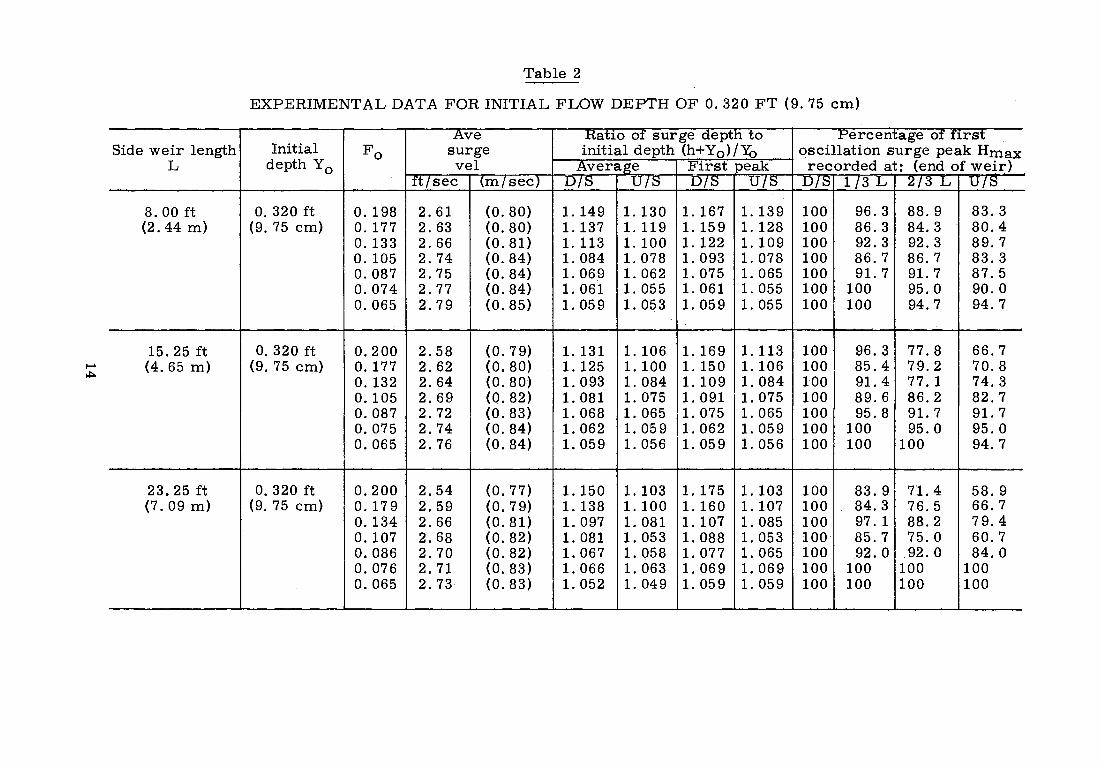
Table 2
EXPERIMENTAL DATA FOR INITIAL FLOW DEPTH OF 0. 320 FT (9. 75 cm)
Ave Haho of surge depth to .Percentage of urst Side weir length Initial Fo surge initial depth (h+Y0 ) /Yo oscillation surge peak Hmax
L depth Y0 vel Average First peak recorded at: (end of weir) ft/ sec (m/sec) D/S U/S D/S U/S D/S 1 /3 L 2/3 L U/S
..
8. 00 ft 0. 320 ft 0.198 2.61 (0. 80) 1.149 1. 130 1. 167 1. 139 100 96.3 88.9 83.3 (2. 44 m) (9. 75 cm) 0.177 2.63 (0. 80) 1. 137 1. 119 1. 159 1. 128 100 86.3 84.3 80.4
0.133 2.66 (0. 81) 1. 113 1. 100 1. 122 1. 109 100 92.3 92.3 89.7 0. 105 2.74 (0. 84) 1.084 .1.078 1. 093 1. 078 100 86.7 86.7 83.3 0.087 2.75 (0. 84) 1. 06_9 1.062 1.075 1. 065 100 91. 7 91. 7 87.5 0.074 2.77 (0. 84) 1. 061 1.055 1. 061 1. 055 100 100 95.0 90.0 0.065 2.79 (0.85) 1. 059 1.053 1. 059 1.055 100 100 94.7 94.7
15. 25 ft o. 320 ft 0.200 2.58 (0.79) 1. 131 1. 106 1. 169 1. 113 100 96.3 77.8 66.7 (4. 65 m) (9. 75 cm) 0.177 2.62 (0. 80) 1. 125 1. 100 1. 150 1. 106 100 85.4 79.2 70.8
0.132 2.64 (0. 80) 1. 093 1.084 1. 109 1.084 100 91. 4 77.1 74.3 0.105 2.69 (0. 82) 1.081 1. 075 1.091 1. 075 100 89.6 86.2 82.7 0.087 2.72 (0. 83) 1. 068 1. 065 1. 075 1. 065 100 95.8 91. 7 91. 7 0.075 2.74 (0. 84) 1. 062 1. 059 1. 062 1. 059 100 100 95. 0 95.0 0.065 2.76 (0. 84) 1. 059 1. 056 1.059 1. 056 100 100 100 94.7
23. 25 ft o. 320 ft 0.200 2.54 (0. 77) 1. 150 1. 103 1. 175 1. 103. 100 83.9 71. 4 58.9 (7. 09 m) (9. 75 cm) 0. 179 2.59 (0.79) 1.138 1. 100 1. 160 1. 107 100 84.3 76.5 66.7
0.134 2.66 (0. 81) 1. 097 1. 081 1. 107 1.085 100 97. 1 88.2 79.4 0.107 2.68 (0. 82) 1.081 1.053 1.088 1. 053 100· 85.7 75.0 60.7 0.086 2.70 (0.82) 1. 067 1. 058 1.077 1. 065 100 92. 0 .92. 0 84.0 0.076 2.71 (0.83) 1. 066 1. 063 1. 069 1. 069 100 100 100 100 0.065 2.73 (0. 83) 1. 052 1.049 1. 059 1. 059 100 100 100 100
727
From Chow [3]
SIDE WEIR
A ~7 l--------Vw- hi
------- --- -------Yo
~J A
DISCHARGE BALANCE EQUATION
-o
Figure 1 Report Hyd-575
h avg.
Yo Y
SECTION A-A UNDULAR FORM OF SURGE WAVE * NOT TO SCALE
ATTENUATION OF SURGE WAVES BY A
SIDE WEIR IN A TRAPEZOIDAL CHANNEL
DEFINITION SKETCH FOR DERIVATIONS
15
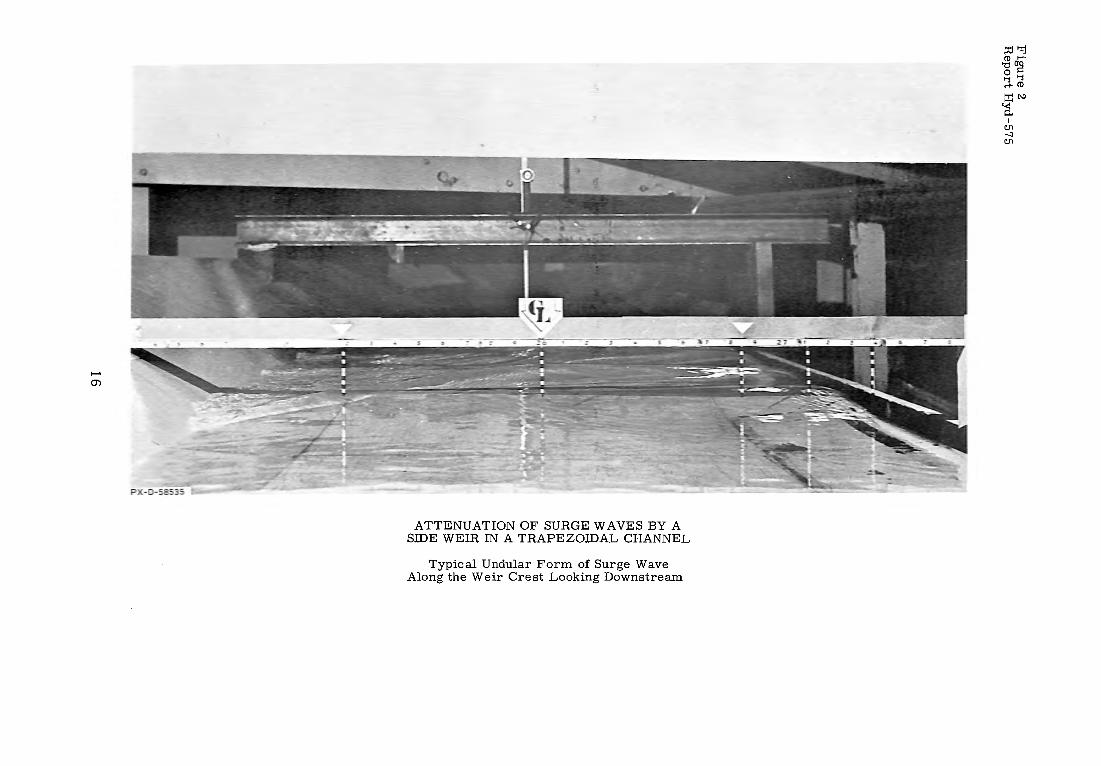
ATTENUATION OF SURGE WAVES BY A SIDE WEIR IN A TRAPEZOIDAL CHANNEL
Typical Undular Form of Surge Wave Along the Weir Crest Looking Downstream
-Transition
Gates
B 7 up ply
-' B
MODEL PLAN
DETAIL A
ATTENUATION OF SURGE WAVES BY A
SIDE WEIR IN A TRAPEZOIDAL CHANNEL
EXPERIMENTAL TEST CHANNEL
Channel 't:j 11 :1 2
..LMAX. w.s. I
SECTION A-A
SECTION B -B
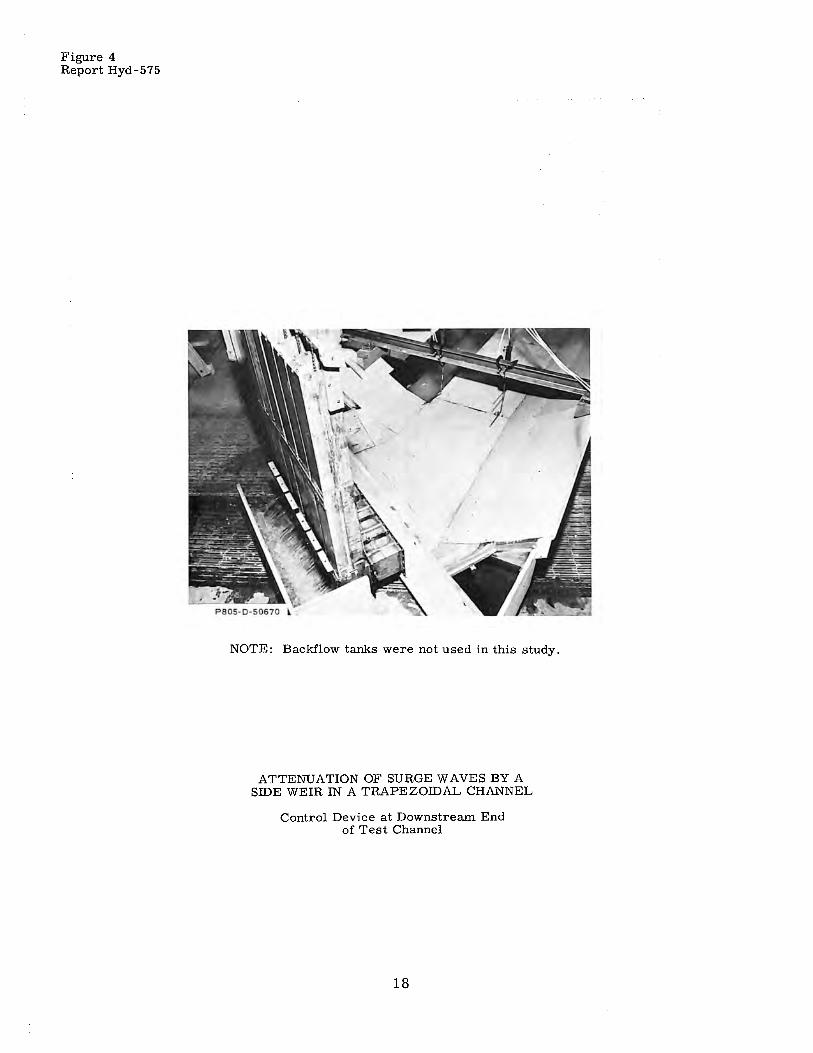
Figure 4 Report Hyd-575
NOTE: Backflow tanks were not used in this study.
ATTENUATION OF SURGE WAVES BY A SIDE WEIR IN A TRAPEZOIDAL CHANNEL
Control Device at Downstream End of Test Channel
18
.... (0
... N ...
0.21'7 i- L -i ~1 A .
-----... rL/3-r-L/3-r-L/3 ',----------i t !: 11 14 ~~ -<-•LOW --ft -<JA +I ETC. ARE PROBE LOCATIONS
PLAN
Probe J c:obe "•
'1 Weir crest
I ---------1-----L -101~
20~
SECTION A-A
ATTENUATION OF SURGE WAVES BY A
SIDE WEIR IN A TRAPEZOIDAL CHANNEL
WAVE PROBE LOCATIONS
WEIR LENGTH DISTANCE OF L (FT.) L/3 (FT.)
8.00 2.67 15.25 5.08 23.25 7.75
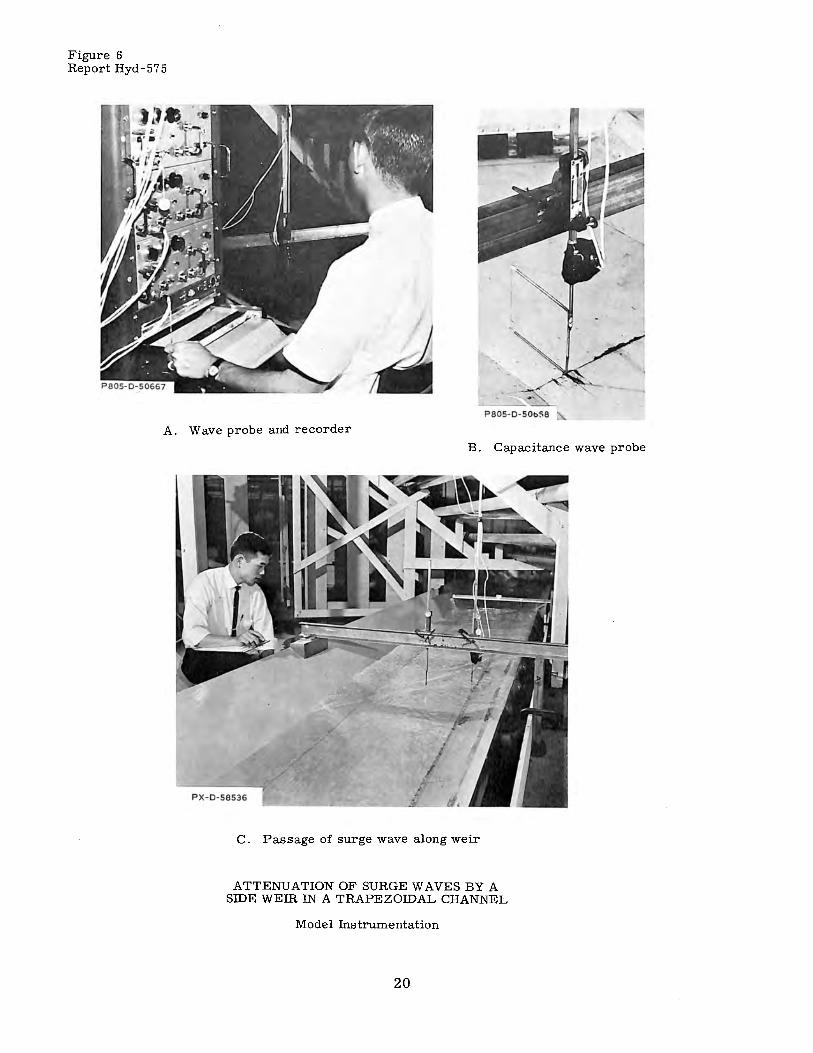
Figure 6 Report Hyd-575
A. Wave probe and recorder
'.
P805-D- 50bS8
B. Capacitance wave probe
C . Passage of surge wave along weir
ATTENUATION OF SURGE WAVES BY A SIDE WEIR IN A TRAPEZOIDAL CHANNEL
Model Instrumentation
20
727
R,, R2= 200 to 250 ohms. C, ,C2=0.1 microfard,duol bathtub
condenser preferred. From King [10]
I I I I I I
> I /' 1--PROBE
x<___....--"! ', / I
'-' I
I
____ 2400 CYCLE,5 VOLT ____ ..,
SOURCE FROM RECORDER
ATTENUATION OF SURGE WAVES BY A
SIDE WEIR IN A TRAPEZOIDAL CHANNEL
a: LLI 0 a: 0 0 LLI a: 0 I-
Figure 7 Report Hyd-575
BRIDGE CIRCUIT FOR VARIABLE CAPACITANCE WAVE PROBE
21
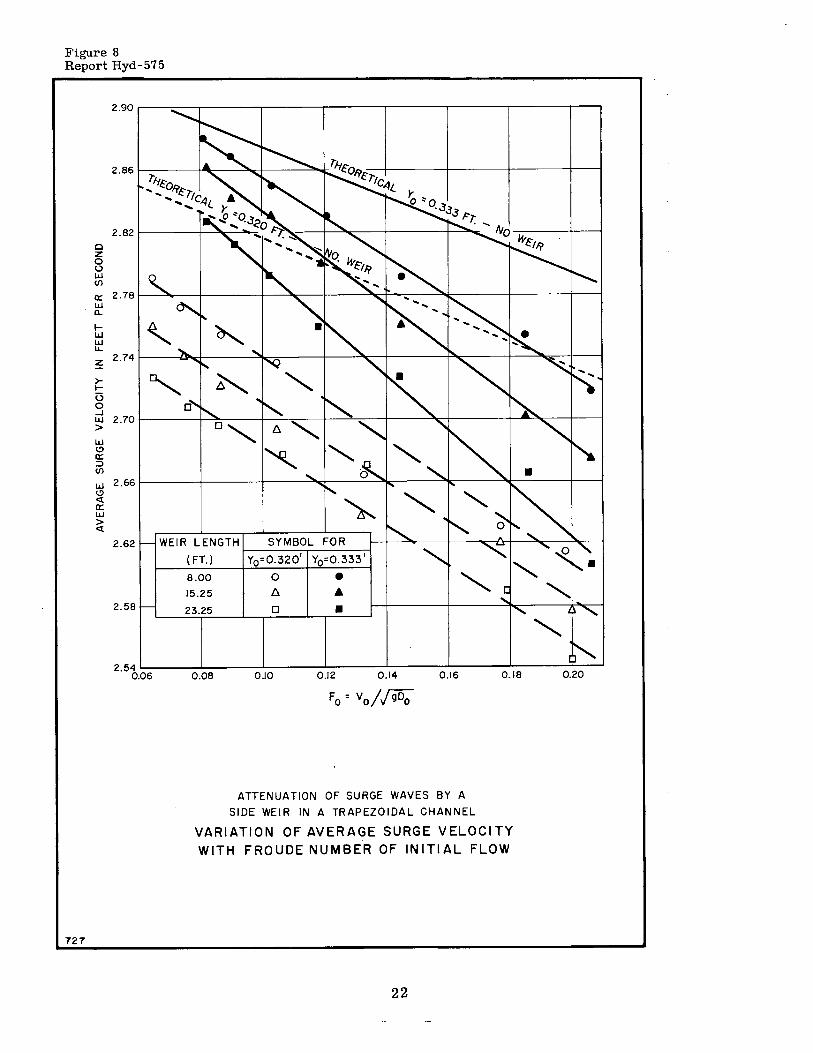
Figure 8 Report Hyd-575
2.86
2.82
0 z 0 0 w (/)
a:: 2.78 w a..
I-w w u.
~ 2.74
~ I-0 0 ...J w 2.70 > w (.!)
a:: => (/)
w 2.66 (.!) <( a:: w > <(
~ ~o -.3.3.3 ,:-,-
. ...._ No
2.62 WEIR LENGTH SYMBOL FOR
2.58
727
(FT.) Yo=0.3201 Yo=0.333 1
8.00 0 • 15.25 l:l. .. 23.25 D •
0.08 0.10 0.12 0.14 0.16 0.18
ATTENUATION OF SURGE WAVES BY A
SIDE WEIR IN A TRAPEZOIDAL CHANNEL
VARIATION OF AVERAGE SURGE VELOCITY
WITH FROUDE NUMBER OF INITIAL FLOW
22
0.20
ts:> c.,.;
,/
I-:r; l!)
w :r;
w 80 l!) a:; =, (/)
...J <(
60 z i:5 a: 0 LL 0
I- 40 z w u a: w Cl..
20 0 2 4 6
•, •, • Experimental data from a.oo, 15.25 and 23.25 ft. weir, respectively, for F0 = 0.186.
o, A, o Experimental data from 8.00, 15.25 and 23.25 ft. weir, respectively, for F0 = 0.061.
F0 = Froude number of initial flow where initial depth = the height of weir crest = 0.333 ft.
8 10
DISTANCE
12 14 16 18 20
ALONG WEIR IN FEET
ATTENUATION OF SURGE WAVES BY A SIDE WEIR IN A TRAPEZOIDAL CHANNEL
EFFECT OF FROUDE NUMBER OF INITIAL
FLOW ON ATTENUATING ABILITY OF WEIR
~
22 24
N) .i:,.
1.14
0: 1.12 ;;; ;o
"' z ~ 1.10
;f_
ffi i I.OS ~ /.-
,./ ,-
/ 0 ~
//. ,,.-·
~/
/. - 1.12
~ L--
1.10
1.08 -? V --~---i-----
/ ~--r• 1.06 y
"" ;;; ;o
1.04 ...
1.12
1.10
.08 .10 .12 .14 .16 ·" Fo
8.00 FT. LONG.SIDE WEIR WITH INITIAL FLOW DEPTH OF 0.320 FT.
/ V .
V . i----·---/'
.,o 1.04 .06
1.12
l.10
.08 .10 .12 .14 .16 ·" .20
15.25 FT. LONG SIDE WEIR WITH INITIAL FLOW DEPTH OF 0.320 FT
"' z V . ...-- . ...-· ~ V • ;;; 1.08
"' .. .. ffi t: 1.06
/ / v_,,,,-~. i ./· ..
~1 . ~ r. 1.04 k<
I< / ,,...-·
1.02 ... .08 ~ n H B B 8.00 FT. LONG SIDE WEIR
WITH INITIAL FLOW DEPTH OF 0.333 FT.
.20
1.08
~ -
,;'
__,,,...,..,,. 1.06
1.04
~ ...... --------@V ----
--:------- i-·-
1.02 .06 .08 .10 ·" .14 .16
I 5.25 FT. LONG SIDE WEIR WITH INITIAL FLOW DEPTH OF 0.333 FT.
NOTES
Theoreticol curve from Citrini's equotion. Theoretical curve from Discharge Balance equation. Ratio of maximum surge depth to initial flow depth (tl Ratio of average surge depth to initial flow depthl2l
® 111 Equo Is 121
A weir discharge coefficient of 3.0 was used in both theoretical equations. Discharge Balance equation is equation rn in the text.
h " Surge height above initia I depth. Yo = Depth of initiol flow F0 • Froude number of initial flow
---
·" .20
1.12
I.IQ
1.08
1.06
1.04 .06
1.12
1.10
1.08
1.06
0 . <
.o,
• ~
~, ---v· ~- i-·-· -
-~ ,.... i---
~ i---o__..:; .
• .10 ,12 .14 .16 ·" .,o
23.25 FT. LONG SIDE WEIR
WITH INITIAL FLOW DEPTH OF 0.320 FT.
_!---~ --v--1.04
:....------ - -----,-.--· -· -·- --·-1.02
.06 ---i-----
.oe .10 ·" ·" ·" ·" 23,25 FT. LONG SIDE WEIR
WITH INITIAL FLOW DEPTH OF 0.330 FT.
ATTENUATION OF SURGE WAVES BY A SIDE WEIR IN A TRAPEZOIDAL CHANNEL
.,o
EFFECT OF SIDE WEIR ON MAXI MUM PEAKS AND AVERAGE SURGE HEIGHTS
l'-' i:.n
/ .,, '/ 1.14
a: iii 1.12
" .. 0 0 1.10 :; '" .. .. 1.08 a: 0-.. .. :,
1.06 ';;
V V ye _,,,,.-
V ~ _,,/
~ ~--~ ,r V
0
1,14
1.12
1.10
I.OB
1.06
V ....
7 Vo Vo ..... ---
~ ~ .,, --' -"' ~ 0
~~/
~~ 1.04 /'
/ 1.04
I/ [7 ;::-
1.02
I/ 1.00
1.00 1.02 1.04 1.06 1.08 1.10 1.12 1.14 1.16 1.18
1.ll!
I/ 1.00
1.00 1,02 1.04 1.06 I.OB 1.10 1.12 1,14 1,16 1.1B
Yi ~ hi;0Yo AT DOWNSTREAM END OF WE IR 15.25 FT. LONG SIDE WEIR WITH lNITIAL FLOW DEPTH OF 0.320 FT.
8.00 FT. LONG SIDE WEIR WITH INITIAL FLOW DEPTH OF 0.320 FT.
/ /
"' iii 1.12
" .. 0
~ 1.10
"' :l I.OB
"' ~ :,
1.06 0-..
I/ / 1.14
1.10
1.08
1.06
/ 7 ,
/ v-
• /' • .... // ---/ ------~1 ;~1.04 104
~ ~ --/4 ,/ -->
~:--/ 102 1.02 ,, /
100 <---'----'-----'---'-- --'---'-----'---'--...J /
1.00
0
•
1.00 i.02 1.04 1.06 I.OB 1.10 1.12 1.16 1.18 1.00 1.02 1.04 1.06 1.08 1,10 1.12 1.14 1.16 1.18
8.00 FT. LONG SIDE WEIR 15.25 FT. LONG S1DE WEIR WITH INITIAL FLOW DEPTH OF 0.333 FT. WITH INITIAL FLOW DEPTH OF 0.333 FT.
NOTES
Theoretical curve from Citrin1's equation. Theoretical curve from Discharge Balance equation. Ratio of maximum surge depth to initial depth. Ratio of overage surge depth to initial depth.
A weir discharge coefficient of 3.0 was used in both theoretica I equations A mean effective head coefficient (Kl of 1.2 was used in the Discharge Balance equation.
h1 • Average surge height at downstream end of weir. h2 = Average surge height at upstream end of weir Yt , Ratio of surge depth to initial depth at upstream end of weir. Yi , Ratio of surge depth to initial depth at downstream end of weir. Yo , Depth of initial flow.
/ 1.14
1.12
1,10
/ I/ • )~
,y ,,,-t..-"" ,# 0 - --I.OB
1.06 ~ ~ --_,.:;
1.04 v- • • 0
/ I.OZ
V 1.00
1,00 1.02 1,04 1,06 1.08 1.10 1.12 1.14 1.16 1.18
23.25 FT. LONG SIDE WEIR WITH INITIAL FLOW DEPTH OF 0. 320 FT.
/ 1.14
1.12 /
/ 1.10
I.OB
, .;: .
1.06 !-
, ~ ~ '
/. ~ < ~ ~
1.04
1,02 /. ·.> - -- -- -- -
<----- --/
,, .... -1.00
1.00 1.02 1,04 1,06 1.08 1.10 1.12 1.14 1.16 LIB
23.25.FT. LONG SIDE WEIR WITH INITIAL FLOW DEPTH OF 0.333 FT.
ATTENUATION OF SURGE WAVES BY A SIDE WEIR IN A TRAPEZOIDAL CHANNEL
VARIATION BETWEEN THEORETICAL EQUATIONS AND COMPARISON WITH EXPERIMENTAL DATA
a: iij ~
(!)
z II)
II)
<t 0...
a: IJJ ~ ..... <t
~1 :~
1.12·,---------------------------,-----"""'T"-----,
--- Theoretical curves ore derived from the
theoretical overage surge velocity Theoretical curves ore derived from the
expermentol overage surge velocity I. IO 1-------,,--------.-------.------.------+-----+---::-..c:;,=-1
1.0$
--1.06
1.04 ---
1.02"------'----__,j,----__,j,--------'---------'------'-------' ,06 .08 ,10 .12 ,14 .16 .18 .20
NOTES Theoretical curves ore derived from the
discharge balance equation for a weir discharge coefficient of 3.0 and a
ATTENUATION OF SURGE WAVES BY A
SIDE WEIR IN A TRAPEZOIDAL CHANNEL
mean effective head coefficient (Kl of 1.2.
See definitions on Figure 10. VARIATION OF THE DISCHARGE BALANCE
EQUATION WITH DIFFERENT AVERAGE
SURGE VELOCITIES
..., N ...,
N ..::i
1.14
I.I 2
!!: w 31:
(!)
z 1.10 (/) (/)
<( Q.
a: w I-LL. <(
~1 :~ 1.06
NOTES J.l = Weir discharge coefficients.
.LL= 0.36 ------- .LL= 0.37 --- .LL = 0.39 ---- J.l = 0.40
o Ratio of maximum surge depth to initial depth (ll. • Ratio of average surge depth to initial depth (2). ® (1)=(2) See definitions on Figure 10.
Fo
•
ATTENUATION OF SURGE WAVES BY A SIDE WEIR IN A TRAPEZOIDAL CHANNEL
VARIATION OF CITRINl'S THEORY WITH THE
WEIR DISCHARGE COEFFICIENT- 8.00 FT. LONG WEIR AND INITIAL DEPTH OF 0.333 FT.
::Ii fT1 "'O .,,
o::IJ c.> -I C:
::c :a -< ITI C ,(JI UI ..., (JI
..... N .....
a:: w 3: LL 0
0 z w
::E ct w a:: I-en 0.. :::,
I-ct
NOTES 1.14 ,__ ___ ,__ __ ____,1---------,1-------+-------+--------+----.......... -----+--------<
1.12
1.10
1.08
1.06
A..~ A..o
~'< ~4..
'?-~Ct,
~' ~
0
A weir discharge coefficient of 3.0 is used in both theoretica I equations.
K=Coefficient of mean effective head on side weir.
Weir length a .o o ft. Initial depth 0.333 ft. Se e d e f i n i t ion s o n Fig u re 1 1.
ATTENUATION OF SURGE WAVES BY A l-------t-1------t------7"1'-------::aU-7"'1:.--S-,c:_--+----+----+----+----I SI DE WE IR IN A TRAPEZOIDAL CH ANN EL
:i 0
.c1>" 1.04 f------f-------..'F-"a-1.-,C.---t----+----+----+----+----+-----l
VARIATION OF THE DISCHARGE BALANCE EQUATION WITH
DIFFERENT COEFFICIENTS OF MEAN EFFECTIVE HEAD ON " ,...-
0
•
Theoretical curve from Citrini's equation Theoretical curves from Discharge Balance equation Ratio of maximum surge depth to initial depth Ratio of average surge depth to initial depth
1.00 ,.__ __ __. ___ ___. ___ ___. ___ ___., ___ ___._ ___ __,_ ___ ___._ ___ __._ ___ _,
1.00 1.02 1.04 1.06 1.08 1.10 1.12 1.14 1.16 1.18
h1+ Y0 Y· = --- AT DOWNSTREAM END OF WEIR
I Yo
THE SIDE WEIR

APPENDIX
PROGRAM NO. 1
PROGRAM DESCRIPTION
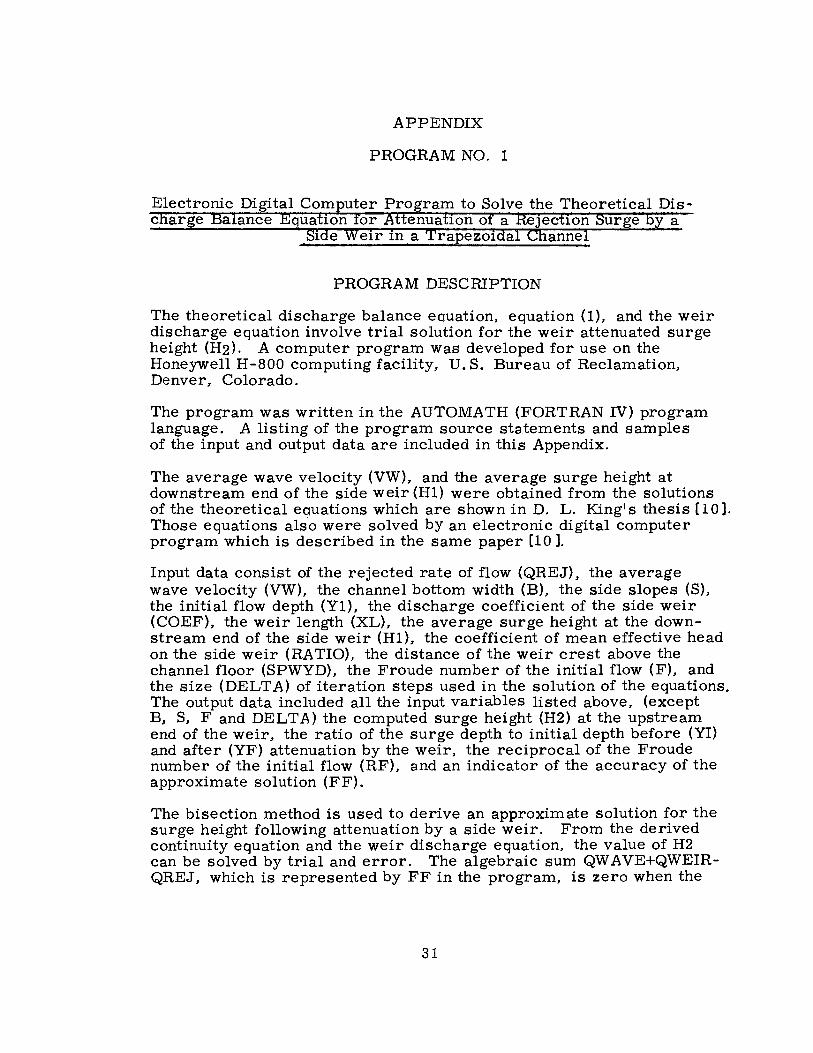
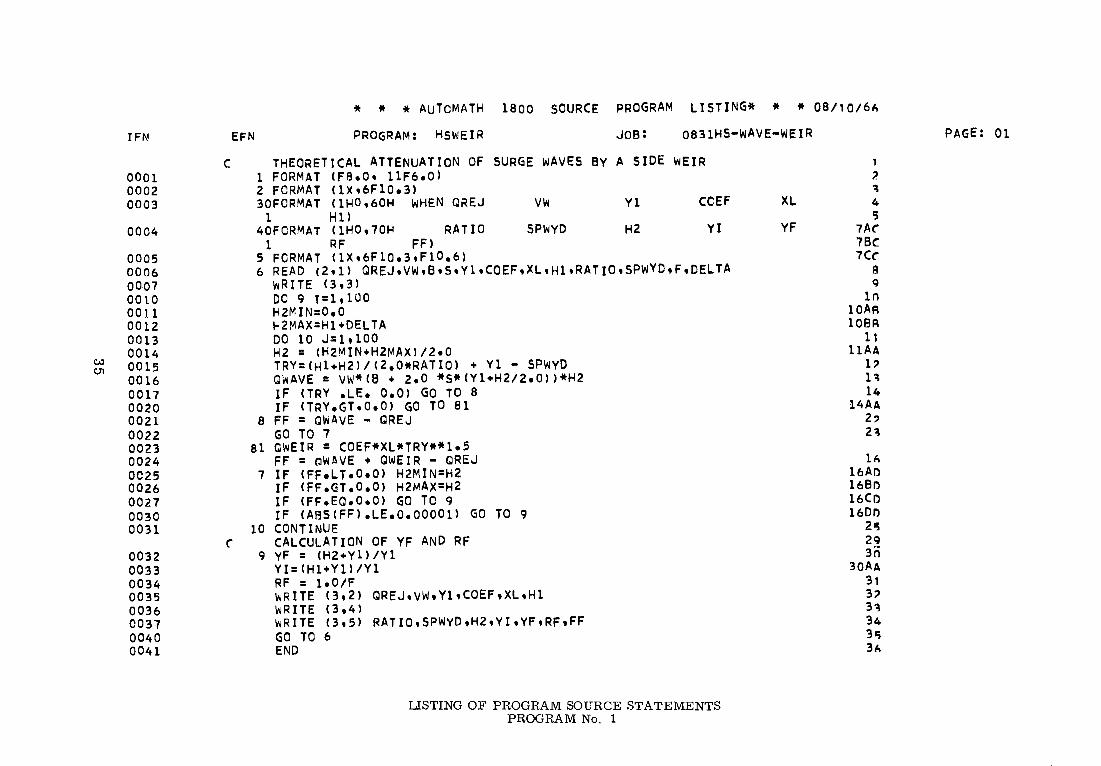
The theoretical discharge balance equation, equation (1), and the weir discharge equation involve trial solution for the weir attenuated surge height (H2). A computer program was developed for use on the Honeywell H-800 computing facility. U.S. Bureau of Reclamation, Denver, Colorado.
The program was written in the AUTOMATH (FORTRAN IV) program language. A listing of the program source statements and samples of the input and output data are included in this Appendix.
The average wave velocity (VW), and the average surge height at downstream end of the side weir (Hl) were obtained from the solutions of the theoretical eouations which are shown in D. L. King's thesis [10]. Those equations als·o were solved by an electronic digital computer program which is described in the same paper [10 ].
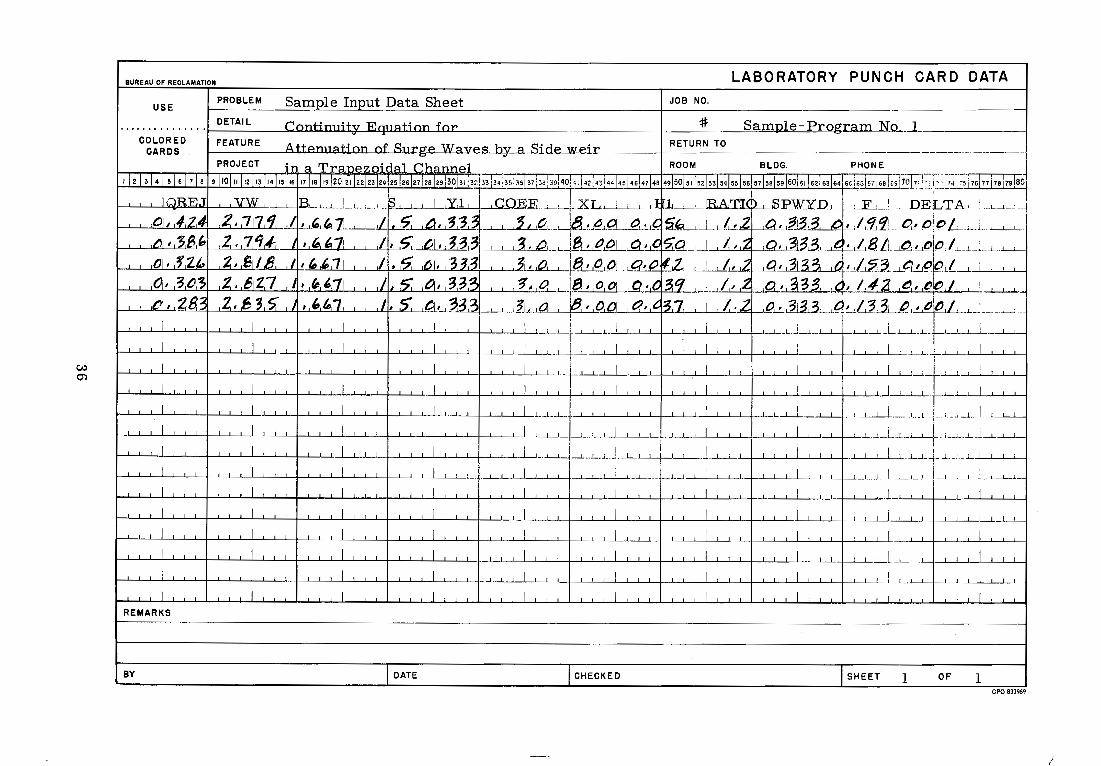
Input data consist of the rejected rate of flow (QREJ). the average wave velocity (VW). the channel bottom width (B), the side slopes (S). the initial flow depth (Yl), the discharge coefficient of the side weir (COEF), the weir length (XL). the average surge height at the downstream end of the side weir (Hl), the coefficient of mean effective head on the side weir (RATIO), the distance of the weir crest above the channel floor (SPWYD), the Froude number of the initial flow (F). and the size (DELTA) of iteration steps used in the solution of the equations. The output data included all the input variables listed above. (except B, S~ F and DELTA) the computed surge height (H2) at the upstream end of the weir, the ratio of the surge depth to initial depth before (YI) and after (YF) attenuation by the weir, the reciprocal of the Froude number of the initial flow (RF). and an indicator of the accuracy of the approximate solution (FF).
The bisection method is used to derive an approximate solution for the surge height following attenuation by a side weir. From the derived continuity equation and the weir discharge equation, the value of H2 can be solved by trial and error. The algebraic sum QW AVE+QWEIRQREJ. which is represented by FF in the program. is zero when the
31
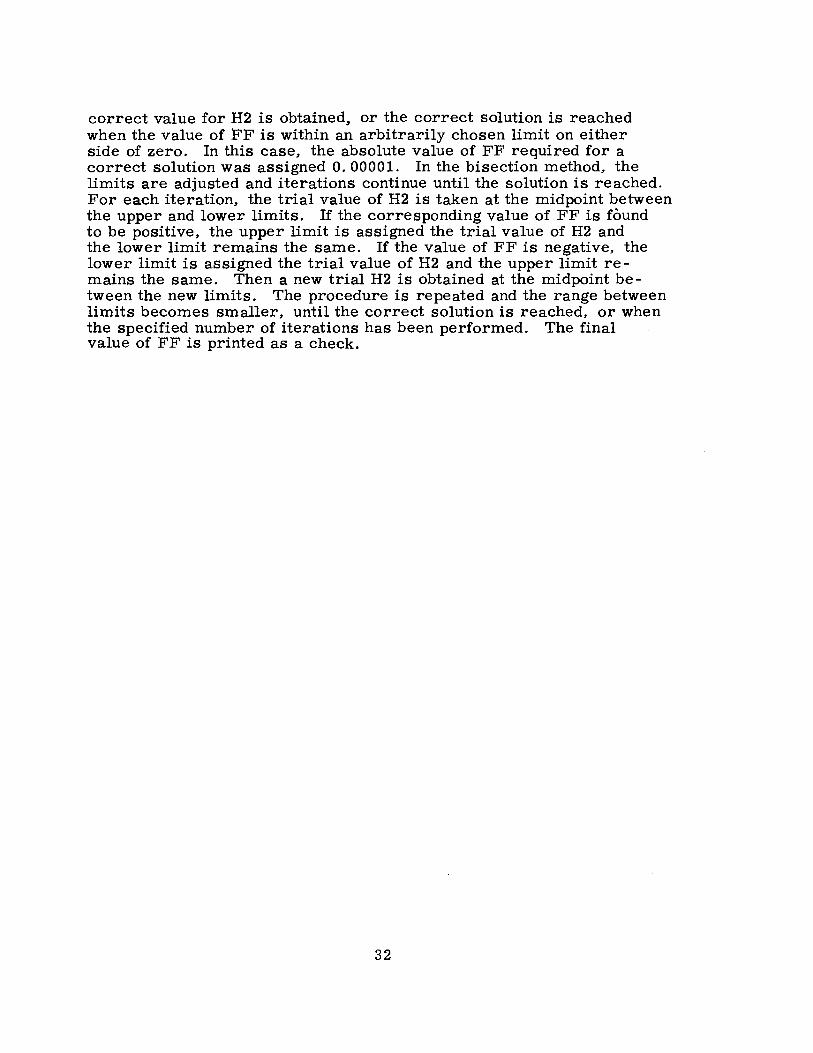
correct value for H2 is obtained, or the correct solution is reached when the value of FF is within an arbitrarily chosen limit on either side of zero. In this case. the absolute value of FF required for a correct solution was assigned 0. 00001. In the bisection method, the limits are adjusted and iterations continue until the solution is reached. For each iteration, the trial value of H2 is taken at the midpoint between the upper and lower limits. If the corresponding value of FF is found to be positive, the upper limit is assigned the trial value of H2 and the lower limit remains the same. If the value of FF is negative, the lower limit is assigned the trial value of H2 and the upper limit remains the same. Then a new trial H2 is obtained at the midpoint between the new limits. The procedure is repeated and the range between limits becomes smaller, until the correct solution is reached, or when the specified number of iterations has been performed. The final value of FF is printed as a check.
32
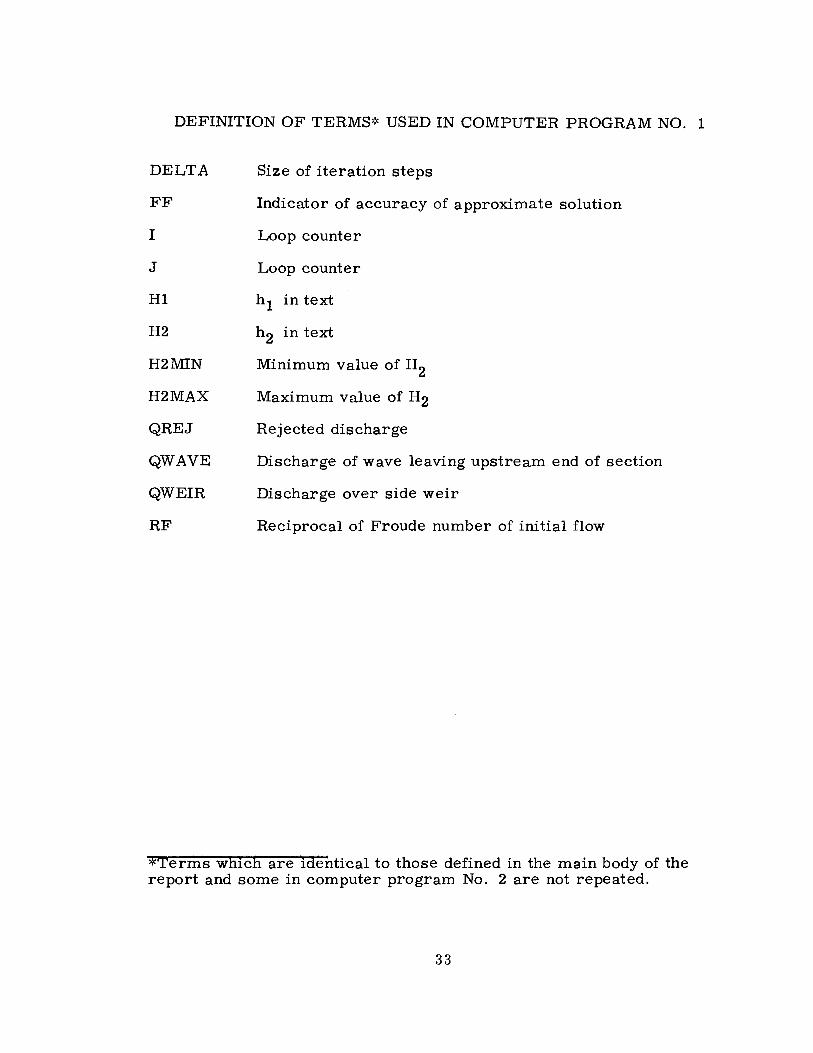
DEFINITION OF TERMS* USED IN COMPUTER PROGRAM NO. 1
DELTA
FF
I
J
Hl
H2
H2MIN
H2MAX
QREJ
QWAVE
QWEIR
RF
Size of iteration steps
Indicator of accuracy of approximate solution
Loop counter
Loop counter
h 1 in text
h 2 in text
Minimum value of H2
Maximum value of H2
Rejected discharge
Discharge of wave leaving upstream end of section
Discharge over side weir
Reciprocal of Froude number of initial flow
*Terms which are identical to those defined in the main body of the report and some in computer program No. 2 are not repeated.
33
727
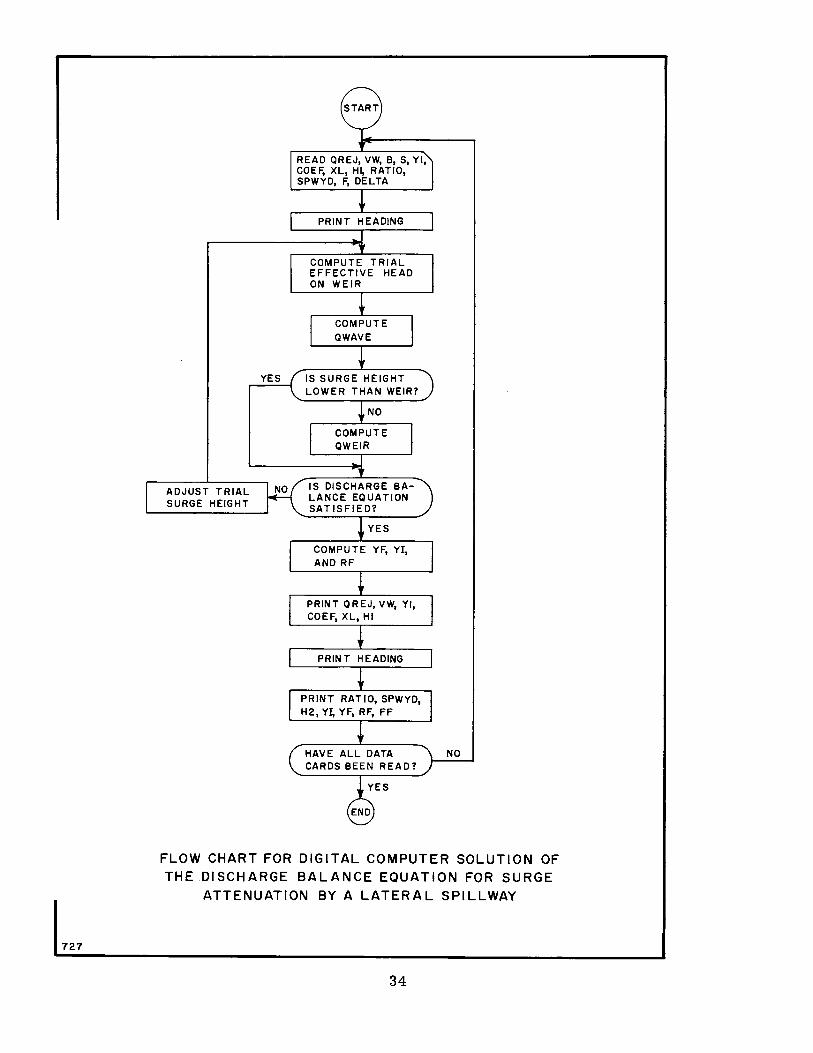
READ QREJ, VW, B, S, YI, COEF, XL, HI, RATIO, SPWYD, F, DELTA
PRINT HEADING
COMPUTE TRIAL EFFECTIVE HEAD ON WEIR
COMPUTE QWAVE
YES IS SURGE HEIGHT LOWER THAN WEIR?
NO
COMPUTE QWEIR
ADJUST TRIAL IS DISCHARGE BA-LANCE EQUATION
SURGE HEIGHT SATISFIED?
YES
COMPUTE YF, YI, AND RF
PRINT QREJ, VW, YI, COEF, XL, HI
PRINT HEADING
PRINT RATIO, SPWYD, H2, YI, YF, RF, FF
HAVE ALL DATA NO CARDS BEEN READ?
FLOW CHART FOR DIGITAL COMPUTER SOLUTION OF THE .DISCHARGE BALANCE EQUATION FOR SURGE
ATTENUATION BY A LATERAL SPILLWAY
34
IFN
C 0001 0002 0003
0004
0005 0006 0007 0010 0011 0012 0013
CA) 0014
c:n 0015 0016 0017 0020 0021 0022 0023 0024 0025 0026 0027 0030 0031
('
0032 0033 0034 0035 0036 0037 0040 0041
* * * AUTCMATH 1800 SOURCE PROGRAM LISTING* * * 08/10/61,
EFN PROGRAM: HSWEIR Joe: 0831HS•WAVE-WEIR
THEORETICAL ATTENUATION OF SURGE WAVES BY A SIDE WEIR 1 FORMAT (F8e0t 11F6e0l 2 FORMAT (1Xt6Fl0e3) 30FORMAT (1H0,60H WHEN QREJ vw Yl CCEF
1 Hl> 40FCRMAT (1H0,70H RATIO SPWYD H2 YI
1 RF FF> 5 FORMAT (1X,6Fl0.3,Fl0.6) 6 READ <2,1> QREJ,VW,B,S,Yl,COEF,XL,HltRATIOtSPWYO,F,DELTA
8
81
7
10
9
WRITE (3,3> 00 9 I=l,100 H2MIN=Oe0 H2MAX=Hl+DELTA DO 10 J=l,100 H2 = <H2MIN+H2MAXl/2eO TRY=<Hl+H2)/(2e0*RATIO) + Yl • SPWYD QWAVE = VW*(B + 2.0 *S*(Yl+H2/2eO))*H2 IF <TRY .LE. O.O> GO TO 8 IF (TRYeGT,OeO) GO TO 81 FF= QWAVE • QREJ GO TO 7 QWEIR = COEF*XL*TRY**le5 FF= oWAVE + QWEIR • QREJ IF CFFeLTeOeO) H2MIN=H2 IF <FF.GT,OeO) H2MAX=H2 IF <FF,EQeOeO) GO TO 9 IF CABS(FF).LE.0.00001> GO TO 9 CONTINUE CALCULATION OF VF AND RF VF= <H2+Yll/Yl YI= (Hl+Yl> /Yl RF= 1,0/F WRITE C3,2) QREJ,VW,Yl,COEF,XL,Hl WRITE C3,4> wRITE C3,5) GO TO 6 END
RATIO,SPWYD,H2,YI,YFtRF,FF
LISTING OF PROGRAM SOURCE STATEMENTS PROGRAM No. 1
1
2 1'
XL 4 lj
VF 7AC 1BC 7CC'
9 Q
ln lOAR lOBR
11 llAA
1, 1-:\ 14
14AA 2, 2\\
l,, 16AD 1681') 16Cn 16Dn
2i; 29 3n
30AA 31 3, 3-:\ 34 3i; 31,
PAGE: 01
~ O')
BUREAU OF RECLAMATION LABORATORY PUNCH CARD DATA
USE PROBLEM Sample Input Data Sheet JOB NO.
.... , .. , , , , , , , 'f--D_E_TA_I_L __ -'-'-!r..n.lJ,nu..u+;·J..nu11.uli_..t·~,y_..rF.LLJ..~µ.111L<:~1.l'+.,_;·l.LUnnL.fLJ'n_,_,Y'L._ _______ , _____ -+---*-----=S'-"'a,_..m:,1~n.l,,,,e_-_,,,P'-'r"-'o"",1t!e>=-r..,a""m..,._,N._._,,oe..__ ... l _______ -j
COLORED CARDS
1l2l3l4lslsl1la
IClRF..T
01, .4Z,4-,~ I 38b 01 I 12/.. .a, 3c3 t'I, 28:.
I I
I
I
I
FEATURE
I
RETURN TO
I I
I I I I
I I I I I I I I I I I I
I I '--'--t--'--'L...L-'l_.,__,_.L-t--'--'-.L....Ll__,__,__'-+--'--'--'--'---'--'--''-+-'--_L_,JL..I_I, L..J. _ _[__ _J_,"--'_.,__, IL...L-L-f-L-'--'--'--'--'--'--1--'-- .,__,~-+-~-'-~( __l_l_L_j.- LJ_LJ_L...L..l_
'--'--'--'--le--L~-'-~- -L-L..J._J_~ _ _J_j_~I -'--'--'--'-·+-·~-'--'--"--'·-'-+-~..L .... 1_L _ _L,_j _ _J_+ , .... .L . .Lj __ ,L_J_j_
I I ! L_l__l_
I I I _J_ I I I I I I
I I I I I I I I I I I I _j_ ... 3_ . .L_l_i_ I I I l_ ~~-~~~~~-+·- , , I LL_L_~·- .L .. !,_.L, 1 , , , I I I I I I I I
I I I I I _[_~·_1-L .... 1-1... _j__J_ I _,__'--L_,_..,_.~_,_~I ~•-1 J_,__,_j__l __ i___L_L_ _J._j__L I
I I I I I I I I I I
I I I I I I I I I I I I I I I I I I I I I I ,.~ I I I I I I I
I I I I I I I I I I I '~ I I I I I I I I I I I I I I I I I I I I I I I I I I L.LLL- I I I I I I
I I I I I I I I I I I -I I I I I I I I I i I I I
REMARKS
BY DATE CHECKED SHEET 1 OF 1 GPO 833969
I
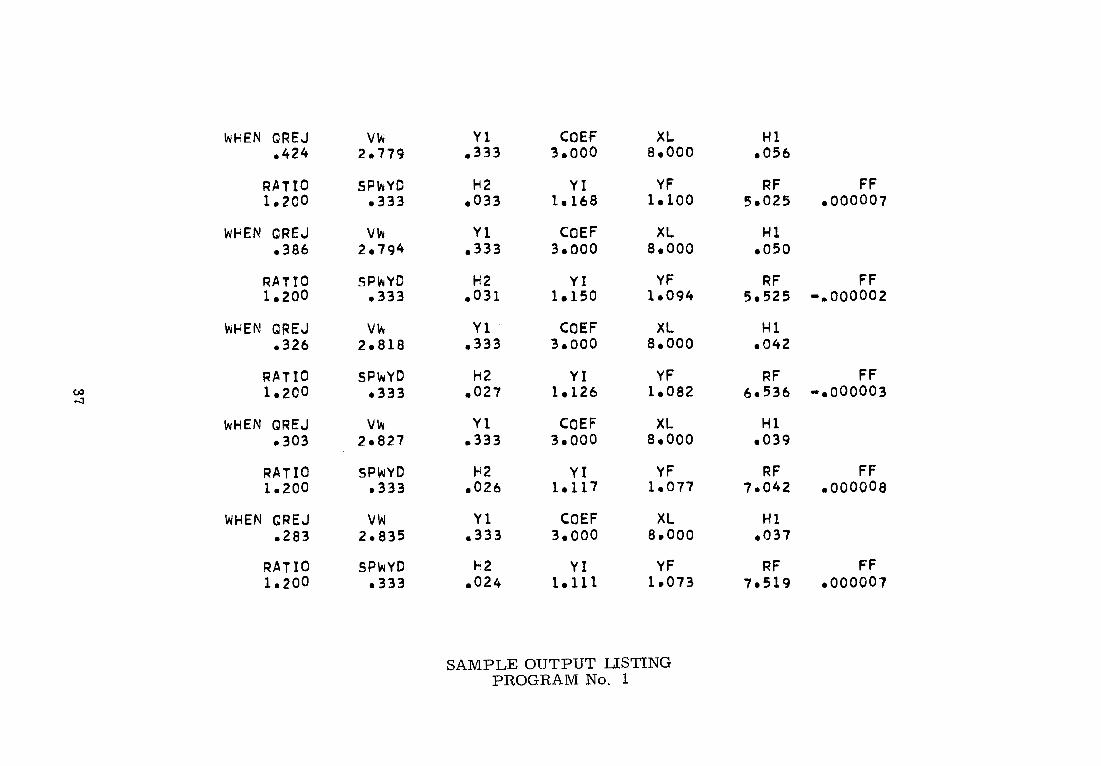
WHEN QREJ vw .424 2.779
RATIO SPWYD 1.200 .333
WHEN GREJ vw .386 2.794
RATIO SPWYD 1.200 .333
WHEN QREJ vw .326 2.818
RATIO SPWYD c,:) 1.200 .333 -J
WHEN GREJ vw .303 2,827
RATIO SPWYD 1.200 .333
WHEN CREJ vw .283 2.935
RATIO SPWYD 1.200 .333
Yl COEF XL .333 3.ooo s.ooo
H2 YI YF .033 lel68 1.100
Yl COEF XL .333 3.ooo a.coo
H2 YI YF .031 1.150 1.094
Yl · COEF XL .333 3.ooo a.coo
H2 YI YF .021 1.126 1,082
Yl COEF XL .333 3,000 a.ooo
H2 YI YF .026 1,117 1.011
Yl COEF XL .333 3.ooo a.coo
H2 YI YF .024 1.111 1,073
SAMPLE OUTPUT USTING PROGRAM No. 1
Hl .056
RF FF 5.025 .000001
Hl .oso
RF FF 5,525 -.000002
Hl e042
RF FF 6,536 -.000003
Hl .039
RF FF 7e042 .oooooa
Hl .037
RF FF 7e519 .000007
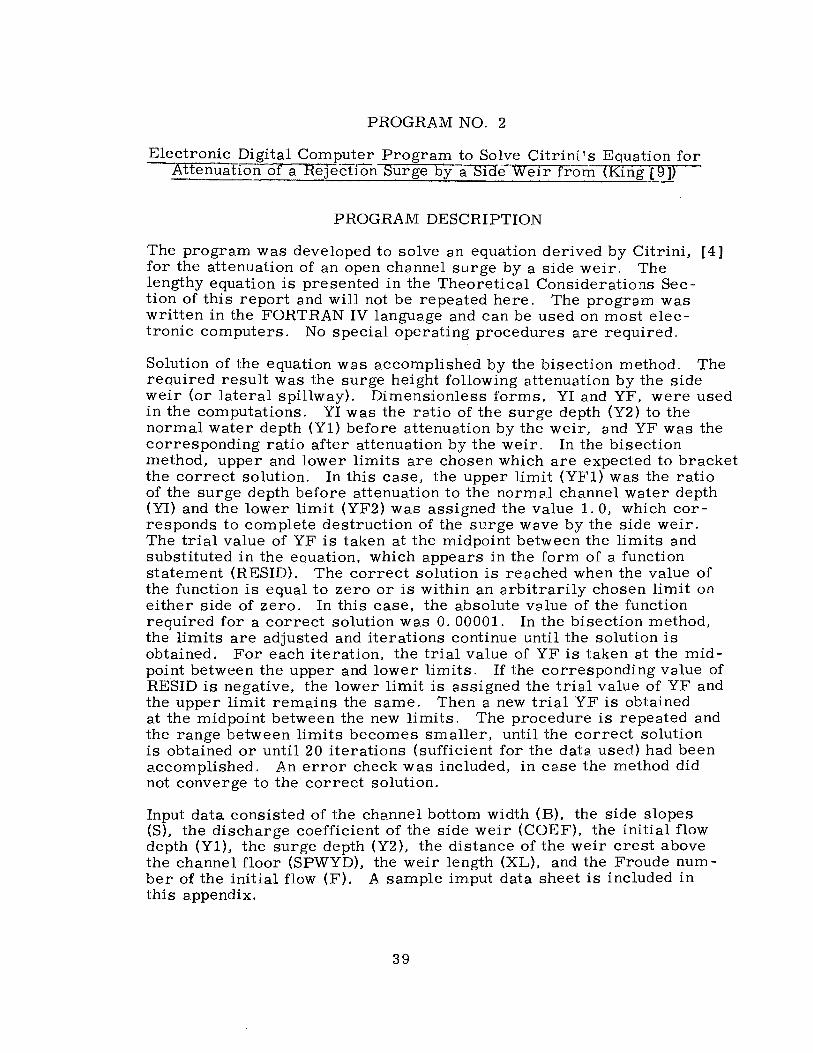
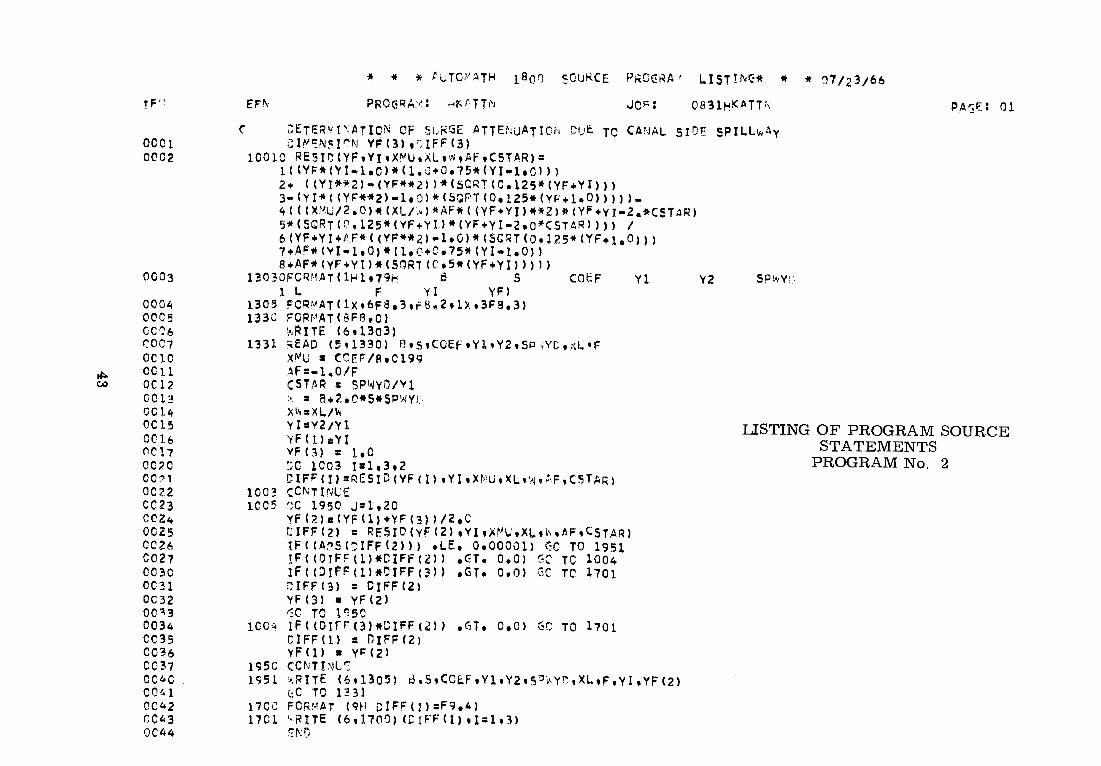
PROGRAM NO. 2
Electronic Digital Computer Program to Solve Citrini 's Equation for Attenuation of a Rejection Surge by a-siae Weir from (King [9])
PROGRAM DESCRIPTION
The program was developed to solve a.n equation derived by Citrini, [4] for the attenuation of an open channel surge by a side weir. The lengthy equation is presented in the Theoretical Considerations Sec-tion of this report and will not be repeated here. The program was written in the FORTRAN IV language and can be used on most electronic computers. No special operating procedures are required.
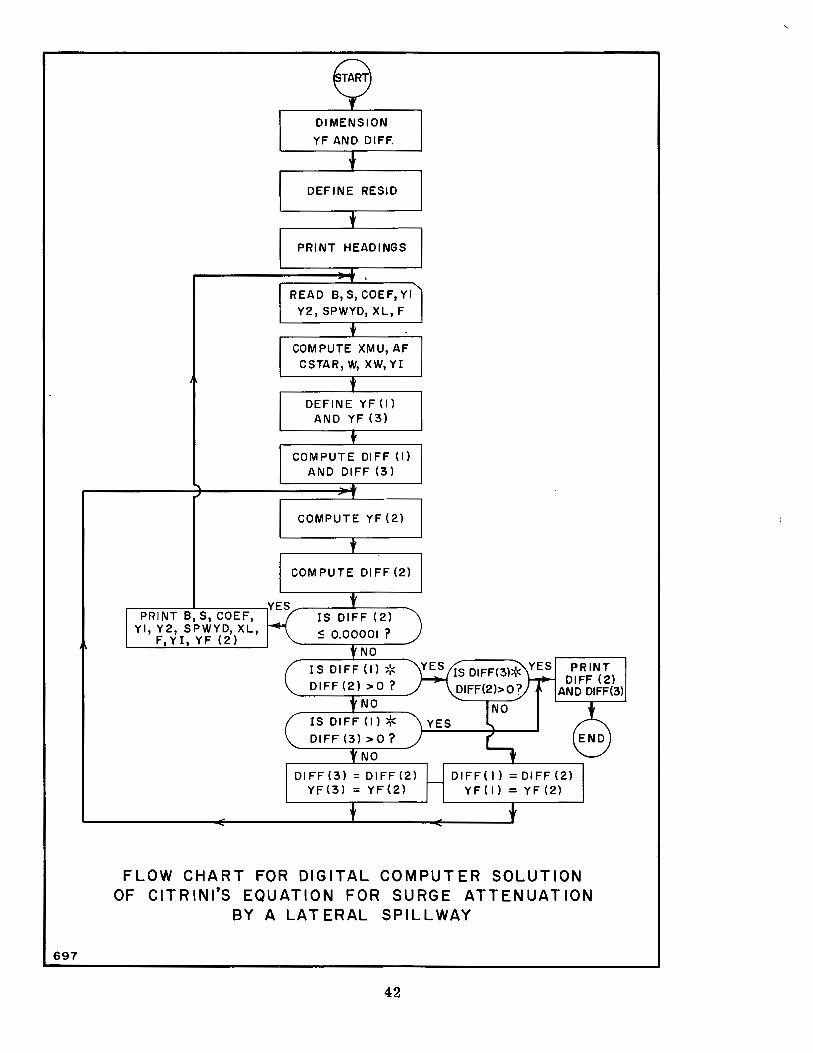
Solution of the equation was accomplished by the bisection method. The required result was the surge height following attenuation by the side weir (or lateral spillway). Dimensionless forms, YI and YF, were used in the computations. YI was the ratio of the surge depth (Y2) to the normal water depth (Yl) before attenuation by the weir, and YF was the corresponding ratio after attenuation by the weir. In the bisection method, upper and lower limits are chosen which are expected to bracket the correct solution. In this case, the upper limit (YFl) was the ratio of the surge depth before attenuation to the normal channel water depth (YI) and the lower limit (YF2) was assigned the value 1. 0, which corresponds to complete destruction of the surge wave by the side weir. The trial value of YF is taken at the midpoint between the limits and substituted in the eoua.tion, which appears in the form of a function statement (RESID). The correct solution is reached when the value of the function is equal to zero or is within an arbitrarily chosen limit on either side of zero. In this case, the absolute va.lue of the function required for a correct solution was 0. 00001. In the bisection method, the limits are adjusted and iterations continue until the solution is obtained. For each iteration, the trial value of YF is taken a.t the midpoint between the upper and lower limits. If the corresponding value of RESID is negative, the lower limit is assigned the tria.l value of YF and the upper limit remains the same. Then a new trial YF is obtained at the midpoint between the new limits. The procedure is repeated and the range between limits becomes smaller, until the correct solution is obtained or until 20 iterations (sufficient for the data used) had been accomplished. An error check was included, in ca.se the method did not converge to the correct solution.
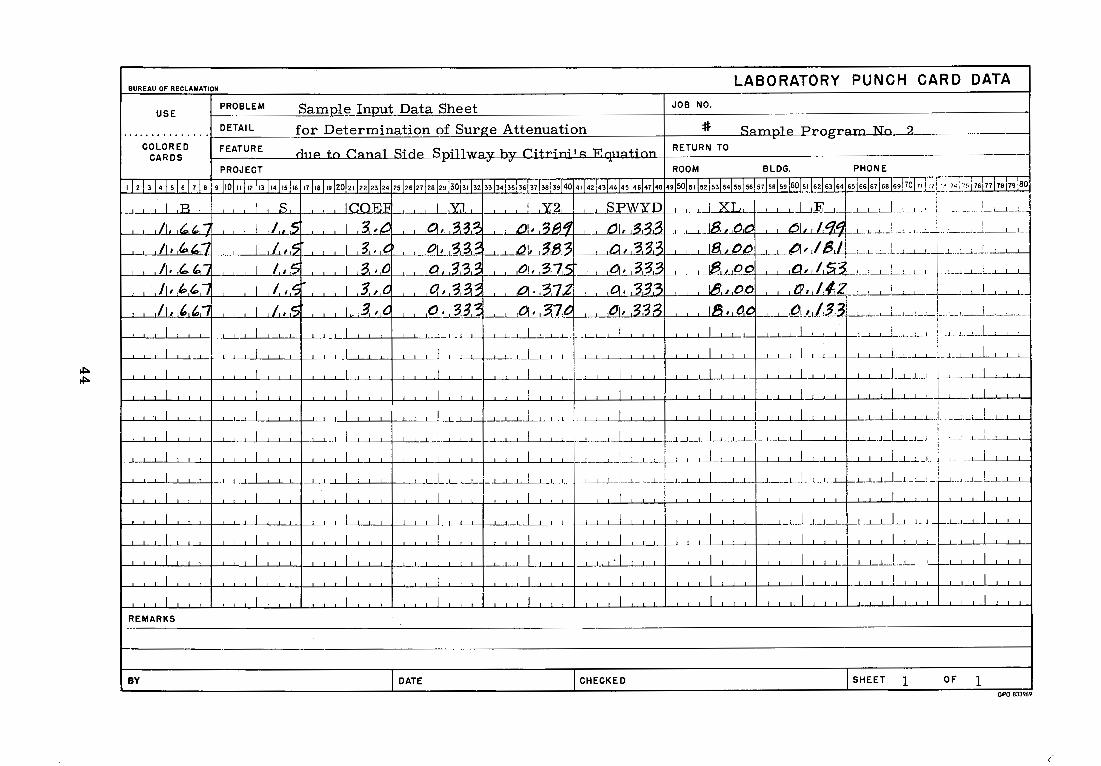
Input data consisted of the channel bottom width (B), the side slopes (S), the discharge coefficient of the side weir (COEF), the initial flow depth (Yl), the surge depth (Y2), the distance of the weir crest above the channel floor (SPWYD), the weir length (XL), and the Froude number of the initial flow (F). A sample imput data sheet is included in this appendix.
39
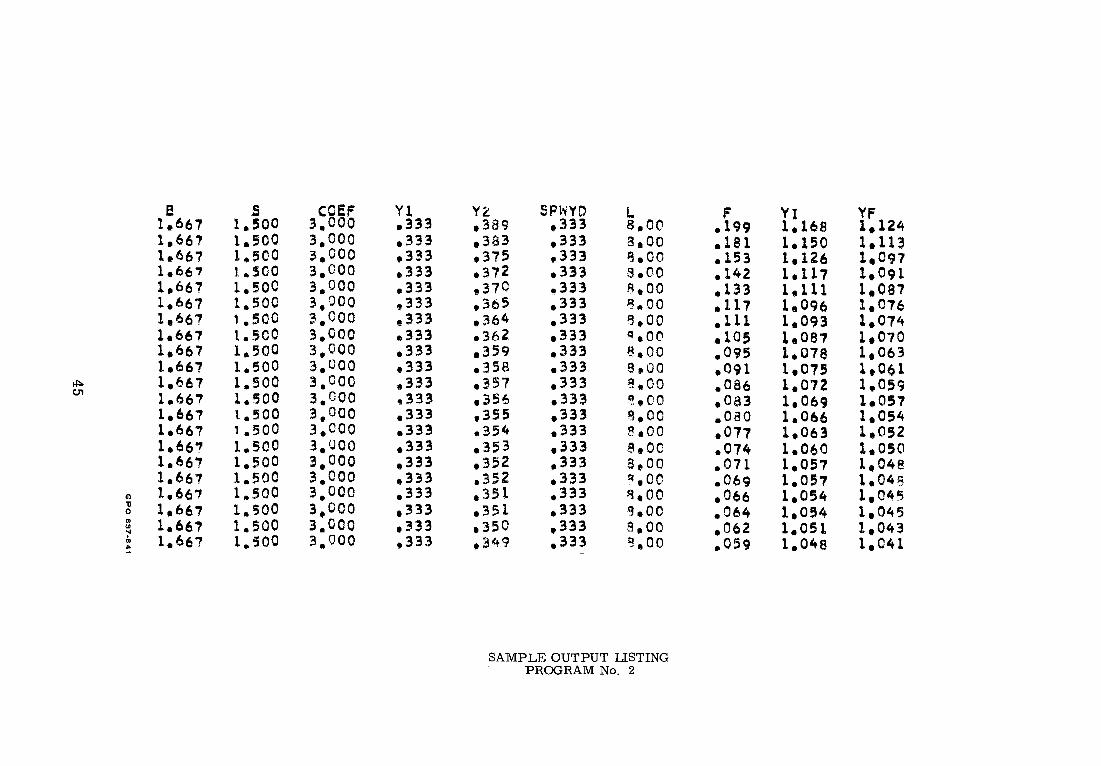
The output data included the input variables listed above and the ratio of the surge depth to the initial depth before (YI) and after (YF) attenuation by the side weir. A representative output listing is also included in this appendix. · ·
40

DEFINITION OF TERMS USED IN COMPUTER PROGRAM NO. 2
YF
DIFF
RESID
YI
XMU
XL
w
AF
CSTAR
B
s COEF
Yl
Y2
SPWYD
F
xw
I
Ratio of surge depth to initial depth following attenuation by the side weir (Yr)
Value of equation for trial value of YF
Statement function name
Ratio of surge depth to initia.l depth before attenuation by the side weir (Yi)
Dimensionless weir discharge coefficient (µ)
Weir length (L)
Width of channel at elevation of weir crest
Reciprocal of Froude number of initial flow (A)
Ratio of SPWYD to YI (C>:')
Channel bottom width
Channel side slopes
Weir discharge coefficient
Initial depth
Surge depth before attenuation by side weir
Height of weir crest above channel floor
Froude number of initial flow
Ratio of weir length to channel top width at weir crest (L/W)
Subscript, fixed-point variable
'~Terms in parenthesis are those which appear in original equation.
41
697
PRINT 8 1 S, COEF, YI, Y2, SPWYD, XL,
F, YI, YF (2)
DIMENSION
YF AND DIFF.
DEFINE RESID
PRINT HEADINGS
READ B, S, COEF, YI Y2, SPWYD, XL, F
COMPUTE XM U, AF CSTAR, W, XW, YI
DEFINE YF (I) AND YF (3)
COMPUTE DIFF (I) AND DIFF (3)
COMPUTE YF (2)
COMPUTE DIFF (2)
IS DIFF (2)
~ 0.00001?
NO
IS DIFF (I)* DIFF (2) >0?
NO
ISDIFF(I)*
DIFF(3) >0?
NO
DI FF (3) = DIFF (2) YF(3) = YF(2)
YES
PRINT DIFF (2)
AND DIFF(3)
DIFF(I) =DIFF(2) YF(l)=YF(2)
FLOW CHART FOR DIGITAL COMPUTER SOLUTION OF CITRINl'S EQUATION FOR SURGE ATTENUATION
BY A LATERAL SPILLWAY
42
0001 0002
0003
0004 0005 QC% ccc-, OClO 0011 oc12 001::! OC14 OC15 OC16 OC17 0020 00,1 0022 0023 OCZ4 0025 CC26 C027 0030 OCH CC32 0033 0034 CC35 C036 0037 0040 0041 OC42 CC43 OC44
C
EFr,., Joe: P~sir.: 01
~ETERWl~ATION OF S~RGE ATTENUATION CUE TC CANAL SIDE SPILL~Ay Cl~EN5I~N v,t3)tSIFF(3)
10010 RESIO(YF,Y1,x~u.xL,w,~F,CSTAR)= 1!(YF*(Vl•laOJ*(l.v+0•75*(YI•leO))J 2+ C(YI**2)•(YF**2>>*<SCRT(0.125*(YF+YI))> 3•<YI*((YF**2>•1aOl*(SQPTCOa125*(YF+l•0>)>)>• 4(((XMU/2.0>*<XL/~)*AF*((YF+YI)**2>*CYF+yr-Z.*CSTAR) 5* (SQRT C0.125* (VF +YU* (YF+Y 1•2,0*CSTl\R)))) / 6CYF+YI+tF*(<YF**2)•1,0)*(SCRTCOal25*CYF+l,O))) 7+A~*(VI•la0)*1l,O+Oa75*(Yl•l,0)) 8+AF*(YF+Yl)*(S~RT(C,5*(YF+YI>>JJ)
13030FC~MATC1Hl179h 6 5 COEF 1 L F YI YF>
1305 FCRµAT<lx,6F8,3,F8,2,1X,3F8,3) 1330 FCR~AT(8F8.0)
\&,RITE (6,l'.303) 1331 READ (511330) BtStCOEFtYl,Y2eSPiYC,xL•F
XMU: CCEF/8a0199 AF=•l.O/F CSTAR = SP 1..JyD/Vl \ = 8+2eC*S*SPWYG Xltv=XL/lfi Yl=Y2/Yl YF<U=VI VF (3) : 1,C !:C 1003 I=l,3,2 CIFF<I>=RESID(YF<l),VI,XMU,XL,W,AF,CSTAR>
1003 CCNTINt.:E 100s ~c 1950 J=l,20
YF(2J:(YF(l)+YF(3))/2,C CIFF(2) = RESID(YFC2>,YI,X~U,XL,w,AFtCSTAR> IF((AeSCDIFF(2))) ,LE, 0,00001) Ge TO 1951 !F((DtFF(l)*CIFF(2)) .~T, 0,0) GO TC 1004 lFCCDJFl=(l)*DIFFc:>> aGT, OeOJ Ge TC 1701 CIFFl3) = CIFFC2l Y F C 3 > = YF ( 2 > '5C TO 1950
1004 1FC(D1rr-c3)*0IFF(2)) ,GT, 0,0) GC TO 1701 CIFFCl> : DIFFC2) Y F < 1J = VF ( 2)
1c;so CCNTI~L!'::
Vl
1951 ¼RITE (6,1305) d,S,CC~F,Yl1Y2,5P~YC,XL1F,YI,YF(2) <:C TO 1~31
1100 FCR~AT C9H CIFFCI>=F9,4) 1701 '•RITE (6,1100) WIFF(lJ •l=l,3>
F.NO
Y2 SP\.'IV!'
LISTING OF PROGRAM SOURCE STATEMENTS
PROGRAM No. 2
~ ~
BUREAU OF REGLAMATION LABORATORY PUNCH CARD DATA
USE PROBLEM Sample Inout Data Sheet JOB NO.
.............. ·1--D_E_TA_I_L __ _____:f~o:'...:r~D=e~t.:::e=.r-=m=in!!·:!:::a:.::t=.:io=n_o~f=---.'.:S:'...:u~r=-g=e:...cA~t:.::t.:::e~n:.:::U:.:::a::.:t:=.i.:::o~n~-----+-----'-f---'-C::::,..i~:wrnL.LLJ'~J.'luP::__iP=-i.:l"'~n-:,..L.c""~:wrnU-L~N1,n...,_~_,,._,_?. _______ 7
COLORED CARDS
FEATURE nnP tn r'l'lnl'll SinP SnillWl'IV hv r'i+rini'i:: li:r111<>+in~ RETURN TO
.&. V V .I.
PROJECT ROOM BLDG. PHONE ----···--------1
11213141 slsl1la 9 I 10 I 11 I 12 I 13 li4 !is I 16 11 I 1a I 19120121122 l23 l24 25 !2sl21 l2a 12, l30l3d 32 33 '34135 h6i 31I3013,140 •il42143 IA414s l4sl41l4a 49150I s I I s2 I s3I 5415sl 56 s1l5als9l60I 51 ls2I s3I 64 65 i s61671 sa ls,l10I 7! I ,2F,· 7<: >s: 1sl 11 i1a l1a :BO - I ~--
f----'--'-
IR ......_--'---1__,_-'-..J'--'-I -'-""'-'--s-1--.,__,, ___ _j_lC.QEJi _ _[~_iYL_ ----'--'---.J_1__Ly;_~J_ --'--,___S_EWY n LLXLL ___[__l__LLE-1 __ + J_[__,_J _. ___ , _. ! _ 1_ j___[__C
I ./. ,S L__[__L_J _ _[_l~tJ .~, 3_2? ' 01, 13/3.1 01, ~.~.~ _J8.i1oOr, l"ll, 1.t:/.1 ' LJ.._I _, I -'--11 __ , ___ ,_J__L_j__l __ /1, ./...t,, -
/1, "'·' /1, ' ' -/1, ~ ' -
/1, ',-I
I
I
I
I
I
I I
I
I
, 1 J,,.s· 1 g,,,t.' ~ '33~ __J_i:21t.~__L_L.L~i.2J3~_!__ 1~Loo , LJ..,,1~.1 __j_ __ :___l_L__j_J __ _LC ... ~1-~~_,
j__J_~, I .5 I 3,, 0 &L.J~ I I 10!' 1317, ~ _j_J_~_.a. _ _J_j_L ~..Lt ,0,C) ' ~~ _, ___ J_j __ '.__L L_L _l__,_[ __ L_~-'---1
I / ',':i'" I 3. I ,C, '~' 3 3-.:: L),. ,3.7.21 ~, 3 3,'3 !A., 00 l'J, /.l.21 _ _),_J I '---1-'---___,_j___,__J-J._
1 , , .s 1 3. ,1J .a. 3,3-2 _ _._~, I 3,7.01 , , ,tJ~3 ~ 1~, tJ.o ~£3 _L_,___,_j_ ____ ,_ -\- _ , . 1-·---'-----
1 I I . _ I , _j__!__ I I _J__L__,_L_f--'-'--'_J __ , _ __j__j_-i- _ _J __ L_LJ~~---,
I I I I T I I I j__L_J _ _,__--'-L.i . .L I '
I I I I ' ' I ' I I ' I _j__L__l_L~ -'--~~l~~-'--t I
I I I I , I I I I , _ _l__i_c_~l~~--1
I I ' ' ' I ' I ' I i _J__j_j_ - i , _ _;__,,._L,LJ_J_ I i L I I I ' I , I I I
I I -~ I
I I I :__ __L_L I I I
I I
_____L_...l..______J_ I I I I
- _J ____ .L......J __ _l __ L_ . .L_L
__ .J._j_L_ I I I ~~~1 ___ __i__L_L~I ~~''-+-~_.L_.J __ L.-1..._J __ .._ j ____ _LJ__...!__.L_.__
__J._j_J__L_ ' ~__,__--t--'--''--'--1'--'-__ '--'-,-+--'--~'LJ___LJ_L~ "-- --- I ' ' ' '
__,___.__+_j_j___J_ __ L __ J ___ _ J__ .• _J __ L_~_i_W-L-1--~ ~--L__; _ .i_l_ . J __ _J ___ L~~_, I I
I I I I I
I I I ---'--"---'~-'--'--'--'-l__,___._1--.J-__,__-'--'--'l--'---'--'--l--'---'---'---'---'--'--L+-J__J..--'---'--.L_l__L-l-_j__J__J..--L--'---'---'-+-'--'---'--'-.....L-'--1--.J---'---'---'---'--'---'--'--I-L- I I I I _j_J _C----L-J_,_l_L....[_J__ I I I I
I ' I I I I I I , , I I I
I ' ' I I ' ' ' _,__-'--'---+---'---'--'--LI -'---'--'--I--'--'--'--'--'-l---'--'--1---'-_j_JL.L-'-L.L-+-L-L-'---'---'--'--'----+---'-...L,__JL.L-'-L.L-+-L.L-'--_L__L-'--'----4---'-_j__[---'-_j_JL.L+-L-j__L_L _L_· I ' ' I - I I I ' ' I I I ---'-~'-+-~-'--~'__,___,_"-t__,__-'--"---'l'--'--'--'--f--L__,__-'-.L.....,'--'----'-+-'--'---'---'---'--'-L-+--'--'--'-__,__-'--'---'-+-'--"---''--'--'--'--"-t__,__-'--"---''-'--'--'--f--L__,__-'--'--j L-'---'--+---''--'----'--'-'__,___,_-'-1 I ' I I
I I , I I I I I I ' I I REMARKS
BY DATE CHECKED SHEET 1 OF 1 GPO 833969
(
e s CCEF Yl 1.667 1.500 3.000 .333 1.667 1.soo 3.000 .333 1.667 l.5CO 3.000 .333 1.667 1.500 3.000 .333 1.667 1.soo 3.000 .333 l.667 1.soo 3,000 ,333 1,667 ,.soo 3.coo .333 le667 1.soo 3.000 ,333 1.667 1.500 3.000 .333 1.667 1.soo 3.000 .333
~ l.667 1.500 3.000 .333 C11 1.667 1.500 3.000 ,333
l.667 1.500 3.000 .333 1.667 ,.soo 3.000 .333 1.667 1.soo 3.000 .333 1.667 1.soo 3.000 ,333 1.667 1.500 3.000 .333
Gl 1.667 1.soo 3,000 ,333 'II 1,667 1.500 3.000 ,333 0 .. 1.667 1.500 3.000 ,333 .. ~ 1,667 1.soo 3.000 .333 .. ~
vz SPWYO l. .389 e333 s.oo .383 .333 a.co e375 .333 a.oo e372 .333 a.oo .370 .333 a.oo ,365 .333 a.oo ,364 .333 8,00 .362 .333 q,OCI .359 .333 6,00 .358 .333 8,00 .357 .333 ~.oo .356 .333 f-!eOO .355 .333 a.oo .354 .333 8a00 a353 .333 a.co a:352 ,333 a,oo .352 ,333 ~.oo .351 .333 r:t, 00 .351 .333 !J.oo .350 .333 a.oo .349 .333 ~.co
SAMPLE OUTPUT USTING PROGRAM No. 2
F YI YF .199 1.168 1.121+ .181 1.1so 1.113 .153 l.126 1.097 .142 1.117 1.091 .133 1.111 1.oa1 .117 1.096 t.076 .111 1.093 1.074 .105 1.oe1 1.010 .095 1.01a le063 .091 1.075 le061 .086 1.012 1,059 .oa3 1.069 1.057 .oao 1.066 1.054 .077 1.063 1,052 .074 1.060 1.050 .011 1,057 1.04e .069 1.057 1.04~ ,066 1.054 1,045 .064 1.054 1,045 ,062 1.os1 1,043 .059 1.048 1.041
7-1750 (2-67) Bureau or Reclamation
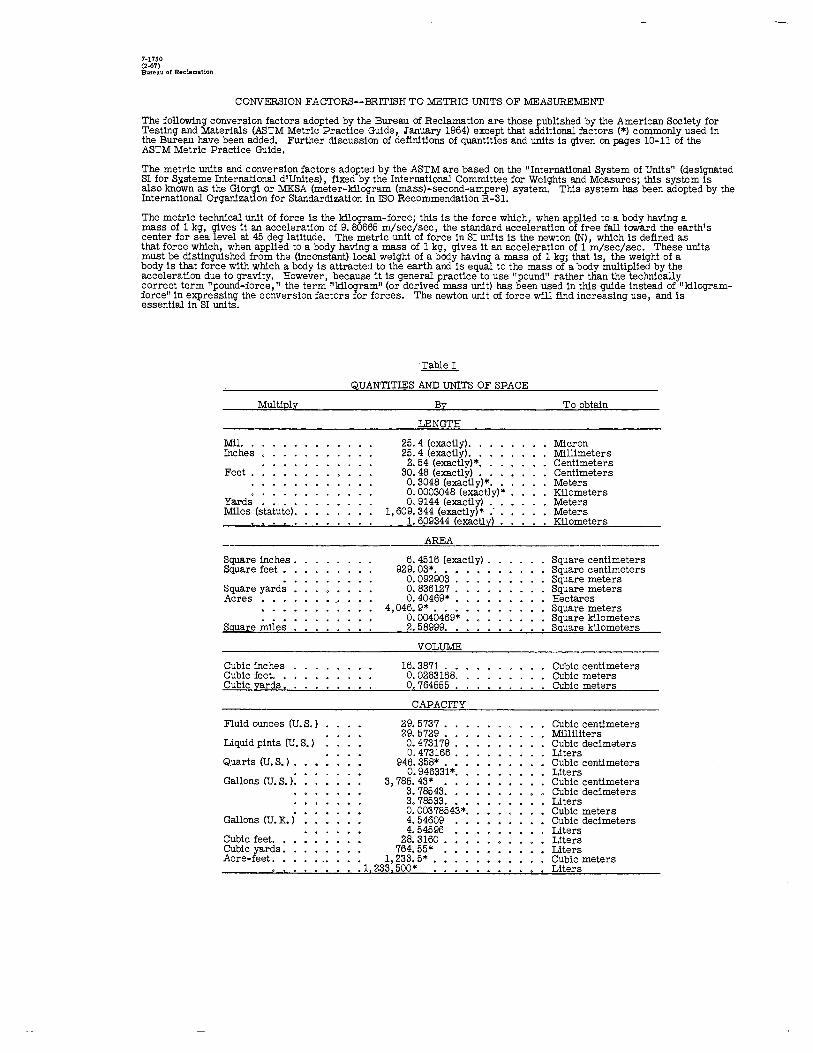
CONVERSION FACTORS--BRITISH TO METRIC UNITS OF MEASUREMENT
The following conversion factors adopted by the Bureau of Reclamation are those published by the American Society for Testing and Materials (ASTM Metric Practice Guide, January 1964) except that additional factors (*) commonly used in the Bureau have been added. Further discussion of definitions of quantities and units is given on pages 10-11 of the ASTM Metric Practice Guide.
The metric units and conversion factors adopted by the ASTM are based on the "International System of Units" (qesignated SI for Siisteme International d'Unites), fixed by the International Committee for Weights a,nd Measures; this system is also known as the Giorgi or MKSA (meter-kilogram (mass)-second-ampere) system. This system has been adopted by the International Organization for Standardization in ISO Recommendation R-31.
The metric technical unit of force is the kilogram-force; this is the force which, when applied to a body having a mass of 1 kg, gives it an acceleration of 9. 80665 m/sec/sec, the standard acceleration of free fall toward the earth's center for sea level at 45 deg latitude. The metric unit of force in SI units is the newton (N), which is defined as that force which, when applied to a body having a mass of 1 kg, gives it an acceleration of 1 m/sec/sec. These units must be distinguished from the (inconstant) local weight of a body having a mass of 1 kg; that is, the weight of a body is that force with which a body is attracted to the earth and is equal to the mass of a body multiplied by the acceleration due to gravity. However, because it is general practice to use "pound" rather than the technically correct term "pound-force," the term "kilogram" (or derived mass unit) has been used in this guide instead of "kilogramforce" in expressing the conversion factors for forces. The newton unit of force will find increasing use, and is essential in SI units.
Table I
QUANTITIES AND UNITS OF SPACE
Multiply By To obtain
LENGTH
Mil. 25. 4 (exactly). Micron Inches 25. 4 (exactly). . Millimeters
2. 54 (exactly)*. Centimeters Feet. 30. 48 (exactly) • . • • Centimeters
0. 3048 (exactly)*. . . Meters 0. 0003048 (exactly)* . Kilometers
Yards 0. 9144 (exactly) .. Meters Miles (s"tatut"e): 1,609.344 (exactly)* : . Meters
1. 609344 (exactly) • Kilometers
AREA
Square inches • 6. 4516 (exactly) • Square centimeters Square feet • 929.03* .•• Square centimeters
0.092903 • Square meters Square yards o. 836127 . Square meters Acres . 0. 40469* • Hectares
4,046. 9* ••• Square meters 0.0040469* Square kilometers
Square miles 2. 58999. Square kilometers
VOLUME
Cubic inches 16.3871 . Cubic centimeters Cubic feet. 0.0283168: Cubic meters Cubic yards • 0.764555. Cubic meters
CAPACITY
Fluid ounces (U.S.) 29. 5737 • Cubic centimeters 29. 5729 • Milliliters
Liquid pints (U.S.) 0.473179 : Cubic decimeters 0. 473166 • Liters
Quarts (U.S.). 946.358* •• Cubic centimeters
Gallons (U.s.i: o. 946331*. Liters
3,785. 43* • Cubic centimeters 3. 78543. Cubic decimeters 3. 78533. Liters
Gallons (U. K. i o. 00378543*. Cubic meters 4.54609 Cubic decimeters 4.54596 Liters
Cubic feet. 28.3160 • Liters Cubic yards • 764.55* Liters Acre-feet. : 1,233.5*. Cubic meters
.1,233.500* • Liters
Multiply
Grains (1/7, 000 lb) • • • Troy ounces (480 grains). Ounces (avdp). • • • Powu:ls (avdp). . . • Short tons (2,000 lb),
Long tons (2,240 lbl;
POWlds per square inch
Pounds per square foot
Ounces per cubic inch . . • POWlds per cubic foot • • •
Tons nonql per cubic yard :
Ounces per gallon (U.S. ) Ounces per gallon (U. K. ) Pounds per gallon (U. S. ) Pounds per gallon CU, K, l
Inch-pounds
Foot-pounds
Foot-pouruis pa,; i~ch Ounce-inches 1 , •
Feet per second.
Feet per year. : Miles per hour •
Feet per second2 •
Cubic feet per second (second-feet) •••••••••••
Cubic feet per minute • • • Gallons (U.S.) per minute.
Pounds.
By
MASS
64. 79891 (emetly) . 31.1035, ••••• 28.3495 ••••••.
O. 46369237 (emetly). 907.186 •••••••
. o. 907186 ..•• • 1,016.05 ••••••
FORCE/AREA
0.070307. 0.689478. 4. 88243 .
47. 8803 ••
MASS/VOLUME (DENSITY)
1. 72999 • 16.0186 • 0.0160186 1.32894
MASS/CAPACITY
7. 4893. 6.2362.
119.829 • 99,779 ,
BENDING MOMENT OR TORQUE
VELOCITY
30. 48 (exactly). • • 0. 3048 (exactly)* • 0. 966873 X 10•6* . 1. 609344 (exactly). 0. 44704 (exactlyl •
ACCELERATION•
0.3048* ••
FLOW
0.028317• 0.4719 • 0.08309 •
FORCE*
.I!:ll!!!.1! QUANTITIES AND UNITS OF MECHANICS
Mllllgrams Grams Grams Kilograms Kilograms Metric tons Kilograms
To obtain
We~r:~::ei::er Kilograms per square meter Newtons per square meter
Grams per cubic cenUmeter Kilograms per cubic meter Grams per cubic cenUmeter Grams per cubic cenUmeter
Grams per liter Grams per liter Grams per liter Grams per liter
Meter-kilograms Centimeter.-dynes Meter-kilograms
g:~m::~=~ams per centimeter Gram-centimeters
Centimeters per second Meters per second CenUmeters per second Kilometers per hour Meters per second
Meters per second2
Cubic meters per second Liters per second Liters per second
Kilograms Newtons Dynes
MulUply
BriUsh thermal units (Btu) •
Btu per pound. • • • • • • Foot-pounds • I • • I • •
Horsepower . . . . . . Btu per hour • • • • • • Foot~pounds per second •
Btu in. /hr ft2 deg F (k, thermal conducUvlty)
2 ••• Btu ft/hr ft dej F • • • • • ~=:..c~ . <7, -~r-~. Deg F hr ft2/Bt~ (R; the;mai·
resistance) • • • • • • • • • Btu/lb deg F (c, heat capacity) •
~,~ ~~~mal-dlffusivliy)
Grains/hr ft2 (water vapor transmission) • • • • • •
Perms (permeance) • • • • Perm-ipches (permeabillty)
MulUply
Cubic feet per square foot per day (seepage) • • • • • • •
Pourui-secorids per square foot (viscosity) • • . • • . • • , •
Square feet per second (viscosity). Fahrenheit degrees (change)•. . . Volts per mil. • • • • . • • • . x.:sr~ s~~~ :~ ~o~t: • • Ohm-circular mils per foot Milllcuries per cubic foot , Mil11amps per square foot • Gallons per square·yard • Pounds per inch. , • • ,
By
WORK AND ENERGY*
• 0.262* •••• • 1,056.06 ••••• • 2. 326 (exactly) •
1.36682* ••
POWER
746. 700 ••• 0.293071. • 1.36682 I •
HEAT TRANSFER
1.442 • 0.1240. 1. 4880*
0.568 4.882
1. 761 4.1868 1.000* 0.2681 • 0.09290*.
WATER VAPOR TRANSMISSION
16.7 0.659 1.67
.T!l!l&..m OTHER QUANTITIES AND UNITS
By
304.8• •••
4.8824* •• 0.092903* •• 6/9 exactly • 0.03937 ••
10. 764 ••• 0.001662 • 36. 3147* . 10. 7639* .• 4.527219* • 0.17858• ••
To obtain
Kilogram calories loules loules per gram loules
Watts Watts Watts
Mllllwatts/cm deg C
~g ~:l~ ~ deg C
Mllllwatts/cu,2 deg C Kg cal/hr mi deg C
Deg C cm2 /mllllwatt l~degC C gramdegC Cw. /sec M~/br
Grams/24 hr m2 Metric perms Metric perm-cenUmeters
To obtain
Liters per square meter per day
Kilogram second per square meter Square meters per second Celsius or Kelvin degrees (change)* Kilovolts per millimeter
Lumens per square meter Ohm-square mlllimeters per meter Mllllcuries per cubic meter Mil11amps per square meter Liters per square meter Kilograms per cenUmeter
GP0835•159

Hyd-575 Rungrongtaanin, Sand King, D L ATTENUATION OF SURGE WAVES BY A SIDE WEIR IN A TRAPEZOIDAL CHANNEL pBBR Lab Rept Hyd-575, IJyd Br, Apr 1967. Bureau of Reclamation, Denver, ~1 P, 14 fig, 4 tab, 13 ref
DESCRIP!'alS-- canals/ model tests/ *surges/ *trapezoidal channels/ weirs/ hydraulic transients// bore /wave// Froude number/ translatory waves/ unsteady flow/ calibrations/ instrumentation/ measuring instruments/ recording systems/ capacitance/ dielectrics/ electronic equipment/ research and development/ oscillographs/ computer progrBlllllling/ mathematical analysis/ hydraulic models IDENTIFIERS-- wave probes/ Citrini equation
Hyd-575 Rungrongtaanin, S and King, D L ATTENUATION OF SURGE WAVES BY A SIDE WEIR IN A TRAPEZOIDAL CHANNEL USBR Lab Rept Hyd-575, IJyd Br, Apr 1967. Bureau of Reclamation, Denver, 47 p, 14 fig, 4 tab, 13 ref
DESCRTI'TCIIS-- canals/ model tests/ *surges/ *trapezoidal channels/ weirs/ hydraulic transients// bore /wave// Froude number/ translatory waves/ unsteady flow/ calibrations/ instrumentation/ measuring instruments/ recording systems/ capacitance/ dielectrics/ electronic equipment/ research and development/ oscillographs/ computer progrBlllllling/ mathematical · analysis/ hydraulic models IDENTIFIERS-- wave probes/ Citrini equation
Hyd-575 Rungrongtaanin, S and King, D L ATTENUATION OF SURGE WAVES BY A SIDE WEIR IN A TRAPEZOIDAL CHANNEL USBR Lab Rept Hyd-575, IJyd Br, Apr 1967. Bureau of Reclamation, Denver, 47 p, 14 fig, 4 tab, 13 ref
DESCR:IPl'C:RS-- canals/ model tests/ *surges/ *trapezoidal channels/ weirs/ hydraulic transients// bore /wave// Froude number/ translatory waves/ unsteady flow/ calibrations/ instrumentation/ measuring instruments/ recording systems/ capacitance/ dielectrics/ electronic equipment/ research and development/ oscillographs/ computer progrBlllllling/ mathematical analysis/ hydraulic models IDENTIFIERS-- wave probes/ Citrini equation
Hyd-575 Rungrongtaanin, Sand King, D L ATTENUATION OF SURGE WAVES BY A SIDE WEIR IN A TRAPEZOIDAL CHANNEL USBR Lab Rept Hyd-575, IJyd Br, Apr 1967. Bureau of Reclamation, Denver, 47 P, 14 fig, 4 tab, 13 ref
DESCRIP.l'CBS-- canals/ model tests/ *surges/ *trapezoidal channels/ weirs/ hydraulic transients// bore /wave// Froude number/ translatory waves/ unsteady flow/ calibrations/ instrumentation/ measuring instruments/ recording systems/ capacitance/ dielectrics/ electronic equipment/ research and development/ oscillographs/ computer progrBlllllling/ mathematical analysis/ hydraulic models IDENTIFIERS-- wave probes/ Citrini equation
ABSTRACT
Theoretical equations and supporting experimental data are presented for determining attenuation of surge waves by a longitudinal side weir in a trapezoidal channel. Comparisons are made of a theoretical equation which had been derived previously for rectangular channels and an equation developed during this study; agreement of each of these equations with experimental data is determined. Surge heights were recorded by 6 capacitancetype wave probes with sensors consisting of plasticized-enamel-coated wire. Two short digital computer programs were developed for trial solutions of the theoretical equations. An explanation of each program, source statement listing, sample input data, and results are presented in the appendix.
ABSTRACT
Theoretical equations and supporting experimental data are presented for determining attenuation of surge waves by a longitudinal side weir in a trapezoidal channel. Comparisons are made of a theoretical equation which had been derived previously for rectangular channels and an equation developed during this study; agreement of each of these equations with experimental data is determined. Surge heights were recorded by 6 capacitancetype wave probes with sensors consisting of plasticized-enamel-coated wire. Two short digital computer programs were developed for trial solutions of the theoretical equations, An explanation of each program, source statement listing, sample input data, and results are presented in the appendix.
ABSTRACT
Theoretical equations and supporting experimental data are presented for determining attenuation of surge waves by a longitudinal side weir in a trapezoidal channel. Comparisons are made of a theoretical equation which had been derived previously for rectangular channels and an equation developed during this study; agreement of each of these equations with experimental data is determined, Surge heights were recorded by 6 capacitancetype wave probes with sensors consisting of plasticized-enamel-coated wire, Two short digital computer programs were developed for trial solutions of the theoretical equations. An explanation of each program, source statement listing, sample input data, and results are presented in the appendix.
ABSTRACT
Theoretical equations and supporting experimental data are presented for determining attenuation of surge waves by a longitudinal side weir in a trapezoidal channel, Comparisons are made of a theoretical equation which had been derived previously for rectangular channels and an equation developed during this study; agreement of each of these equations with experimental data is determined. Surge heights were recorded by 6 capacitancetype wave probes with sensors consisting of plasticized-enamel-coated wire. Two short digital computer programs were developed for trial solutions of the theoretical equations, An explanation of each program, source statement listing, sample input data, and results are presented in the appendix,