Embed Size (px)
Citation preview

United StatesDepartment ofAgriculture
Forest Service
Pacific NorthwestResearch Station
Research PaperPNW-RP-534March 2002
Global Effects of AcceleratedTariff Liberalization in the ForestProducts Sector to 2010Shushuai Zhu, Joseph Buongiorno, and David J. Brooks

Shushuai Zhu is a graduate student and Joseph Buongiorno is John N. McGovernprofessor, Department of Forest Ecology and Management, University of Wisconsin,Madison, 1630 Linden Drive, Madison, WI 53706; David J. Brooks is a researchforester, U.S. Department of Agriculture, Forest Service, Pacific Northwest ResearchStation, Forestry Science Laboratory, 3200 SW Jefferson Way, Corvallis, OR 97331.
Authors

Abstract Zhu, Shushuai; Buongiorno, Joseph; Brooks, David J. 2002. Global effects ofaccelerated tariff liberalization in the forest products sector to 2010. Res. Pap. PNW-RP-534. Portland, OR: U.S. Department of Agriculture, Forest Service, PacificNorthwest Research Station. 51 p.
This study projects the effects of tariff elimination on the world sector. Projections weredone for two scenarios: (1) progressive tariff elimination according to the scheduleagreed to under the current General Agreement on Tariff or Trade (GATT) and (2) completeelimination of tariff on wood products as proposed within the Asia-Pacific EconomicCooperation (APEC) Accelerated Tariff Liberalization (ATL) initiative. Projections weremade by using the global forest products model, which provides equilibrium projectionsof prices and quantities produced, consumed, and traded for 14 commodity groups. Keyassumptions include rates of economic growth, availability of wood, demand (price)elasticities, and tariff scenarios.
Keywords: Accelerated tariff liberalization, ATL, import tariffs, equilibrium projection,market model, forest products, fuelwood, industrial roundwood, pulp, recycled fibers,paper, paperboard.
The objective of this study was to project the effects of elimination of import tariffs onthe world forest sector. The projections are done for two scenarios: (1) progressive tariffreduction according to the current General Agreement on Tariff or Trade schedule and (2)complete elimination of all tariffs within the Asia-Pacific Economic Cooperationcountries.
The projections were obtained with the global forest product model (GFPM). The modelgives market equilibrium projections of quantities produced, consumed, imported, andexported by each country for 14 commodity groups including fuelwood, industrialroundwood, pulp and recycled fibers, and paper and paperboard. The model also projectsworld equilibrium prices, up to 2010. Key assumptions include rates of economic growth,availability of wood, demand elasticities, and scenarios for tariff reduction.
This report introduces the problem and objective of this study; summarizes the structureof the GFPM and its assumptions; presents the trends in consumption and net tradefrom 1997 to 2010, by main world regions, under the Accelerated Tariff Liberalization(ATL) scenario; and shows the effects of ATL agreements on consumption, production,import, and export from 1997 to 2010, for main world regions and the United States.Detailed tables by country and product are in the appendixes(http://www.fs.fed.us/pnw/pubs/rp534).
Summary

Contents 1 Introduction
2 Methods
2 Model Structure
4 Countries and Products
4 Final Demand
6 Raw Material Supply
12 Intermediate Product Supply and Demand
12 Assumptions on Accelerated Tariff Liberalization
20 Other Assumptions
20 Mathematical Formulation of Global Forest Product Model
23 Projections with Accelerated Tariff Liberalization, 1997-2010
24 Roundwood
24 Fuelwood and Charcoal
25 Industrial Roundwood
26 Sawnwood
36 Paper and Paperboard
40 Price Trends with Accelerated Tariff Liberalization
42 Effects of Accelerated Tariff Liberalization Agreement, 1997-2010
49 Consumption
49 Production

49 Imports
49 Exports
50 Acknowledgments
50 English Equivalents
51 Literature Cited
Appendixes are available online (www.fs.fed.us/pnw/pubs/rp534)
Appendix 1: Consumption Effects of Accelerated Tariff LiberalizationAgreement, 1997-2010
Appendix 2: Production Effects of Accelerated Tariff Liberalization Agreement,1997-2010
Appendix 3: Import Effects of Accelerated Tariff Liberalization Agreement,1997-2010
Appendix 4: Export Effects of Accelerated Tariff Liberalization Agreement,1997-2010

The United States sought elimination of all tariffs in the forest products sector during theUruguay Round. The round resulted in a reciprocal “zero-for-zero” tariff elimination agreementbetween the United States, Canada, Finland, Austria, Singapore, Hong-Kong, Japan,European Union (E.U.), Korea, and New Zealand for paper products by 2004. At the sametime, there was agreement to reduce, over 5 years, tariffs on wood products. In theUnited States, such reductions amounted to a cut in average tariffs from about 3.1 to 1.8percent. Under the Uruguay Agreement Act, Congress gave the Administration authority toseek reduction in tariffs on other wood products (Council on Environment Quality 1999).
In 1997, ministers of Asia-Pacific Economic Cooperation (APEC) countries called for thenomination of sectors for early voluntary sectoral liberalization (EVSL) among theircountries. The United States, Canada, Indonesia, and New Zealand proposed the forestsector. In 1998, APEC leaders agreed to move the tariff portion of the EVSL initiative tothe World Trade Organization, to conclude an agreement by the end of 1999.
Tariffs remain a significant barrier to trade for forest products (Bourke and Leitch 1998).Although tariffs in countries that are members of the Organization for EconomicCooperation and Development are generally low, they remain high for some products; forexample, wood-based panels. In other countries, tariffs between 10 and 20 percent arecommon and can reach 40 percent.
The Accelerated Tariff Liberalization (ATL) initiative covers all forest products, such aslogs and wood products (chapter 44), pulp, paper, and paper products (chapters 47, 48,and 49). Parties to the Uruguay Round zero-for-zero agreement would move up theelimination of tariffs on pulp, paper, and paper products from 1 January 2004 to 1January 2000. Others would attempt to remove tariffs by the same date but could delayremoval until 1 January 2002. The proposal calls for the elimination of tariffs on all otherproducts by 1 January 2002.
The objective of this study was to project the effects of the ATL agreement for the globalforest sector in general, and for the APEC countries in particular. For each country and14 forest groups of forest products, we project consumption, production, imports, exports,and prices. The projections are to 2010, for two scenarios: (1) continuation of the currenttariff agreements or (2) elimination of tariffs according to the ATL schedule.
The methods use a dynamic spatial equilibrium model of the world forest sector. Themodel was applied to project forest product consumption, production, trade, and pricesunder specific scenarios of economic growth, timber supply, and technical change. Theseassumptions are held constant in the simulations of the alternative ATL scenarios tojudge the effect of the tariff reductions only.
This report reviews the methodology of the global forest products model (GFPM) anddescribes the countries or regions and the products included in the model, the demandequations, and the timber supply assumptions. Projections from 1997 to 2010 of con-sumption, net trade, and prices in the main regions of the world are summarized; and theATL effects of consumption, production, import, and export for the main regions of theworld and the United States for the main product groups are presented. The appendixes1
contain the detail of trends and ATL effects for individual APEC countries.
Introduction
1
1 The appendixes are available on the web at:http:www.fs.fed.us/pnw/pubs/rp534

Projections of the effects of the ATL agreement were obtained with the GFPM. TheGFPM is based on the price endogenous linear programming system (PELPS III)(Zhang et al. 1993), with recent modifications. The model simulates market equilibriumby mathematical programming. The theory is that of spatial equilibrium in competitivemarkets. The GFPM solves the equilibrium by maximizing the value of the products,minus the cost of production, subject to material balance and capacity constraints ineach country and each year. Because material flows throughout the system mustbalance, the model ensures data consistency within countries and coherence ofprojections between countries.
In each projection year, for each country and commodity, supply (domestic productionplus imports) equals demand (final consumption, plus input in other processes, plusexports). Final demand is price responsive; demand for wood or intermediate productsderives from the demand for final products through input-output coefficients thatdescribe technologies in each country. The supply of raw wood and nonwood fibers ineach country is price responsive. The supply of recycled paper is constrained by thewaste paper supply, which itself depends on the paper consumption and the recyclingrate. Each country exports to the world market and imports from the world market.Projected prices are such that they clear markets: at those prices, demand equalssupply in each country.
From one year to the next, demand changes in each country because of changes inincome. The wood supply shifts according to the chosen scenario. The amount ofrecycled fiber used for making paper and paperboard changes with technology andrecycling policy. Capacity increases or decreases according to new investments thatdepend on past production and the profitability of production in different countries, asrevealed by the shadow price of capacity. Tariff changes affect the cost of imports, advalorem. Then, a new equilibrium is computed subject to the new demand and supplyconditions, new technology, new capacity, and new tariff. Trade changes with inertia tiedto past trade and production.
The general principle of the GFPM, then, is that global markets optimize the allocationof resources in the short run (within 1 year). Longrun resource allocation is partlygoverned by market forces, as in capacity expansion and trade, and also by politicalforces such as the wood supply shifts determined by forest policy, the waste paperrecovery rates by environmental policy, the trade tariffs that change the cost of imports,and the techniques of production determined by exogenous progress.
Earlier versions of PELPS and GFPM have been used by the United States andCanadian Forest Services to develop the North American pulp and paper model and thesolid wood model, and by the International Tropical Timber Organization to develop theAsia-Pacific tropical timber trade model. The Asia-Pacific forest products model (Zhanget al. 1997) also was built with PELPS, and the Food and Agricultural Organization (FAO1999) forest products outlook study included GFPM-based projections (Zhu et al. 1998).
MethodsModel Structure
2

Code in Code in Code in Code inmodel Country model Country model Country model Country
Africa: North and Central Asia: Europe: America:
1 Algeria 1 Bahamas 1 Afghanistan 1 Albania2 Angola 2 Barbados 2 Bahrain 2 Austria3 Benin 3 Belize 3 Bangladesh 3 Belgium-
Luxembourg4 Botswana 4 Canada 4 Bhutan 4 Bosnia-
Herzegovina5 Burkina Faso 5 Cayman Islands 5 Brunei Darussalam 5 Bulgaria6 Burundi 6 Costa Rica 6 Cambodia 6 Croatia7 Cameroon 7 Cuba 7 China 7 Czech Republic8 Cape Verde 8 Dominica 8 Cyprus 8 Denmark9 Central African 9 Dominican 9 Hong Kong 9 Finland
Republic Republic10 Chad 10 El Salvador 10 India 10 France11 Congo 11 Guatemala 11 Indonesia 11 Germany12 Côte d’Ivoire 12 Haiti 12 Iran, Islamic 12 Greece
Republic13 Djibouti 13 Honduras 13 Iraq 13 Hungary14 Egypt 14 Jamaica 14 Israel 14 Iceland15 Equatorial Guinea 15 Martinique 15 Japan 15 Ireland16 Ethiopia 16 Mexico 16 Jordan 16 Italy17 Gabon 17 Netherlands 17 Korea, DPR 17 Macedonia
Antilles18 Gambia 18 Nicaragua 18 Korea, REP 18 Malta19 Ghana 19 Panama 19 Kuwait 19 Netherlands20 Guinea 20 Saint Vincent 20 Laos 20 Norway21 Guinea-Bissau 21 Trinidad and 21 Lebanon 21 Poland
Tobago22 Kenya 22 United States 22 Macau 22 Portugal23 Lesotho 23 Malaysia 23 Romania24 Liberia 23 South America: 24 Mongolia 24 Slovakia25 Libyan Arab 24 Argentina 25 Myanmar 25 Slovenia
Jamahiriya26 Madagascar 25 Bolivia 26 Nepal 26 Spain27 Malawi 26 Brazil 27 Oman 27 Sweden28 Mali 27 Chile 28 Pakistan 28 Switzerland29 Mauritania 28 Colombia 29 Philippines 29 United Kingdom30 Mauritius 29 Ecuador 30 Qatar 30 Yugoslav Fed.
Rep.31 Morocco 30 French Guiana 31 Saudi Arabia32 Mozambique 31 Guyana 32 Singapore 31 Former U.S.S.R:33 Niger 32 Paraguay 33 Sri Lanka 32 Armenia34 Nigeria 33 Peru 34 Syrian Arab 33 Azerbaijan
Republic35 Reunion 34 Suriname 35 Thailand 34 Belarus36 Rwanda 35 Uruguay 36 Turkey 35 Estonia37 Sao Tome and Venezuela 37 United Arab 36 Georgia
Principe Emirates38 Senegal 38 Viet Nam 37 Kazakhstan39 Sierra Leone 39 Yemen 38 Kyrgyzstan40 Somalia 39 Latvia
Table 1—Countries in the global forest products modela
3

Table 1—Countries in the global forest products modela (continued)
Code in Code in Code in Code inmodel Country model Country model Country model Country
Africa continued: Oceania: Former U.S.S.R.continued:
41 South Africa 40 Australia 40 Lithuania42 Sudan 41 Cook Island 41 Moldova, Rep.43 Swaziland 42 Fiji 42 Russian
Federation44 Tanzania, United 43 French Polynesia 43 Tajikistan
Republic45 Togo 44 New Caledonia 44 Turkmenistan46 Tunisia 45 New Zealand 45 Ukraine47 Uganda 46 Papua New Guinea Uzbekistan48 Zaire 47 Samoa49 Zambia 48 Soloman Islands50 Zimbabwe 49 Tonga
50 Vanuatua Region names are for this study only.
The GFPM deals with 180 countries (see table 1). Each country may produce and tradeone or all of the products. This level of resolution was chosen to facilitate data verifica-tion, as most international data are collected at country level. Calculating projections bycountry also facilitates review and criticism of the projections because expert knowledgeis more available at the country level than at more aggregate regional or global levels.The list of countries in table 1 is the same as that used by FAO (1998a), and it uses thesame nomenclature.
The forest products considered in the GFPM are shown in table 2. They correspond toproduct groups used by the FAO (1998a) in its statistical work. In the GFPM, there areeconometric demand equations for fuelwood and charcoal, other industrial roundwood,sawnwood, veneer sheets and plywood, particle board, fiberboard, newsprint, printingand writing paper, and other paper and paperboard. The supply equations for fuelwoodand charcoal, industrial roundwood, and other fiber pulp are price elastic, up to themaximum sustainable production, which is set exogenously. Waste paper supply isconstrained by the quantity of paper recovered, an endogenous function of paperconsumption. Figure 1 shows the wood and nonwood material flows.
The demand equations for the end products (table 3) are based on derived demandtheory for raw material inputs. Dynamic demand models lead then to empirical elasticitiesof demand for each forest product in relation to national income (measured by real grossdomestic product [GDP]) and real product price, in constant U.S. dollars (Baudin andLundberg 1987, Buongiorno 1978).
The elasticities of demand used in analyzing the effects of ATL are shown in table 3.Different elasticities were used for countries with high or low GDP per person. Elasticitiesfor low-income countries were generally larger in absolute value.
The world price for each commodity in the base year (1997) was the weighted averageof unit values of imports and exports, across all countries. In the GFPM, prices are
Countries and Products
Final Demand
4

SITC code Product Unit Demand Supply
245 Fuelwood and charcoal 1000 m3 E E246/247 Sawlogs and pulpwood 1000 m3 I E
Other industrial roundwood 1000 m3 E E248 Sawnwood 1000 m3 E I634.1,634.3/4 Veneer and Plywood 1000 m3 E I634.2 Particle board 1000 m3 E I634.5 Fiberboard 1000 m3 E I251.2 Mechanical wood pulp 1000 M.T. I I251.91,.61,.62,.3,.4,.5 Chem/semichem. wood pulp 1000 M.T. I I251.92 Other fiber pulp 1000 M.T. I E251.1 Waste paper 1000 M.T. I E641.1 Newsprint 1000 M.T. E I641.2/3 Printing and writing paper 1000 M.T. E IEX641 Other paper and paperboard 1000 M.T. E I
a E indicates demand or supply is represented with an econometric equation; I indicates that itis represented with input-output coefficients.M.T. = metric ton.
Table 2—Products in the global forest products modela
endogenous (the equilibrium between demand and supply leads to the prices). So, noassumption has to be made about future prices.
The data on production, imports, and exports in each country and in the base year (1997)were obtained from the FAO statistical database (FAO 1999).
The GDP data are exogenous to the GFPM and nothing else is used to shift demand.The assumptions on the GDP growth rate of each country and the implications for theregions are summarized in table 4. Real GDP was assumed to grow at about 4 percentper year from 1994 to 2010 in Africa, at 2.7 percent per year in America, 4.6 percent peryear in Asia, and 2.4 percent per year in Europe.
Figure 1—Product transformations in the global forest products model.
5

Product Country Price Income
Fuelwood and charcoalHigh incomea -0.62 -2.26Low incomeb -.10 .40
Other industrial roundwoodHigh income -.05 -.58Low income -.37 .19
SawnwoodHigh income -.16 .32Low income -.21 .46
Veneer and plywoodHigh income -.13 .73Low income -.22 .74
Particle boardHigh income -.24 1.15Low income -.05 .65
FiberboardHigh income -.52 .82Low income -.52 .82
NewsprintHigh income -.05 1.14Low income -.18 1.05
Printing and writing paperHigh income -.15 1.66Low income -.37 1.11
Other paper and paperboardHigh income -.06 .94Low income -.14 .92
a Australia, Austria, Belgium, Canada, Denmark, Finland, France, Germany, Ireland,Israel, Italy, Japan, Kuwait, Luxembourg, Netherlands, Norway, New Zealand, South Africa,Spain, Sweden, Switzerland, United Kingdom, and United States.b Rest of the world.
Table 3—Price and income elasticities of demand for end products
In any given year and country, the supply of industrial roundwood is a function of theprice of industrial roundwood. The price elasticity of supply was set at 0.8. This priceelasticity indicates the percentage of change in supply that would result from a 1-percentchange in price, other things being equal.
In addition, the supply equations are assumed to shift over time to simulate changes insupply independent of prices. The rates of shifts were estimates of how much timberproduction would change without a change in price. These rates of shift differ by countryand are based on various information about past production, forest area and stock,growth rates, extent of plantations, and policies of each country. In some countries ofAsia, upper bounds were set on the timber supply, regardless of price, to reflectperceived limits on the potential sustainable timber production of the country. The rate ofshifts relied mostly on the data of the global fiber supply study (GFSS, FAO 1998b); therate of shift is the annual percentage change in the “commercially available wood supply”projected by the GFSS. The resulting aggregate average rates of shift of industrial round-wood supply, by region, were 0.71 percent in North, Central, and South America, 0.63percent in Europe and the former U.S.S.R., 1.14 percent in Africa, and 1.4 percent in Asiaand Oceania. The detailed rates of shift used in the ATL analysis are shown in table 5.
Raw Material Supply
6

Country 1997-2000 2001-2005 2006-2010
Africa: 3.94 4.03 4.03Algeria 3.47 3.61 3.61Angola 2.93 5.00 5.00Benin 4.28 6.30 6.30Botswana 6.23 6.50 6.50Burkina Faso 4.14 4.87 4.87Burundi 4.41 4.76 4.76Cameroon 4.86 3.86 3.86Cape Verde 6.82 7.28 7.28Central African Republic 3.62 3.65 3.65Chad 4.05 4.89 4.89Congo 5.54 3.52 3.52Côte d’Ivoire 5.40 5.10 5.10Djibouti 2.70 3.19 3.19Egypt 3.89 3.60 3.60Equatorial Guinea 2.15 4.26 4.26Ethiopia 5.59 5.82 5.82Gabon 2.12 4.40 4.40Gambia 2.48 4.26 4.26Ghana 5.43 5.56 5.56Guinea 4.48 4.54 4.54Guinea-Bissau 4.99 6.00 6.00Kenya 4.11 5.52 5.52Lesotho 6.53 7.52 7.52Liberia .14 .82 .82Libyan Arab Jamahiriya 2.00 3.00 3.00Madagascar 3.33 4.29 4.29Malawi 2.99 2.74 2.74Mali 4.68 5.52 5.52Mauritania 3.47 3.54 3.54Mauritius 6.89 7.17 7.17Morocco 5.67 4.54 4.54Mozambique 5.00 5.50 5.50Niger 4.96 5.13 5.13Nigeria 3.52 3.63 3.63Reunion 6.00 5.00 5.00Rwanda 5.13 5.77 5.77Sao Tome and Principe 5.92 5.98 5.98Senegal 4.65 5.75 5.75Sierra Leone .63 6.13 6.13Somalia 1.60 1.94 1.94South Africa 3.12 3.04 3.04Sudan 3.48 3.09 3.09Swaziland 4.53 7.87 7.87Tanzania, United Republic 4.85 5.14 5.14Togo 6.31 6.95 6.95Tunisia 5.38 4.83 4.83Uganda 6.53 6.09 6.09Zaire 5.00 5.00 5.00Zambia 3.73 3.02 3.02Zimbabwe 5.21 5.14 5.14
Table 4—Growth rate of real gross domestic product (percent per year-1)
7

Table 4—Growth rate of real gross domestic product (percent per year-1) (continued)
Country 1997-2000 2001-2005 2006-2010
America: 2.65 2.73 2.73 North and Central America—
Bahamas 2.00 3.00 3.00Barbados 3.34 3.50 3.50Belize 4.00 4.50 4.50Canada 2.75 2.97 2.97Cayman Islands 4.00 4.50 4.50Costa Rica 2.02 4.17 4.17Cuba 2.00 3.50 3.50Dominica 2.00 3.00 3.00Dominican Republic 3.28 3.28 3.28El Salvador 4.77 4.52 4.52Guatemala 3.96 3.65 3.65Haiti 3.12 3.37 3.37Honduras 3.96 4.05 4.05Jamaica .93 2.04 2.04Martinique 2.00 2.00 2.00Mexico 4.52 4.88 4.88Netherlands Antilles 1.00 1.00 1.00Nicaragua 3.81 3.21 3.21Panama 3.37 4.19 4.19Saint Vincent 3.00 3.50 3.50Trinidad and Tobago 2.83 3.60 3.60United States 2.45 2.40 2.40
South America—Argentina 4.41 4.88 4.88Bolivia 4.21 3.76 3.76Brazil 3.26 4.01 4.01Chile 6.49 6.04 6.04Colombia 3.86 4.66 4.66Ecuador 3.12 3.49 3.49French Guiana 1.50 1.50 1.50Guyana 3.06 3.34 3.34Paraguay 2.48 3.26 3.26Peru 3.49 4.58 4.58Suriname 1.60 2.00 2.00Uruguay 2.37 2.90 2.90Venezuela 2.47 3.13 3.13
Asia Pacific: 4.56 4.58 4.58 Asia—
Afghanistan 2.00 2.50 2.50Bahrain 1.52 2.50 2.50Bangladesh 5.04 6.27 6.27Bhutan 5.00 5.00 5.00Brunei Darussalam 2.00 2.00 2.00Cambodia 6.00 6.00 6.00China 8.06 7.30 7.30Cyprus 5.20 5.00 5.00Hong Kong 5.22 5.50 5.50India 6.21 5.95 5.95Indonesia 7.79 7.53 7.53Iran, Islamic Republic 3.59 3.55 3.55
8

Country 1997-2000 2001-2005 2006-2010
Asia continued—Iraq 10.07 4.40 4.40Israel 4.50 5.00 5.00Japan 3.12 2.97 2.97Jordan 5.01 4.98 4.98Korea, DPR 2.00 2.00 2.00Korea, REP. 6.26 6.32 6.32Kuwait 2.30 2.00 2.00Laos 5.00 6.00 6.00Lebanon 7.00 8.00 8.00Macau 5.50 6.00 6.00Malaysia 7.95 7.68 7.68Mongolia 2.00 3.00 3.00Myanmar 6.14 4.44 4.44Nepal 5.07 5.46 5.46Oman 2.58 3.41 3.41Pakistan 5.56 5.49 5.49Philippines 5.31 5.34 5.34Qatar 1.00 3.00 3.00Saudi Arabia 2.30 2.76 2.76Singapore 6.88 6.44 6.44Sri Lanka 5.77 6.51 6.51Syrian Arab Republic 4.60 5.12 5.12Thailand 6.19 7.00 7.00Turkey 3.61 5.71 5.71United Arab Emirates 1.80 3.00 3.00Viet Nam 6.00 6.50 6.50Yemen 2.98 3.08 3.08
Oceania—Australia 3.60 3.50 3.50Cook Island 2.00 3.00 3.00Fiji 1.99 2.68 2.68French Polynesia 3.50 4.00 4.00New Caledonia 1.00 1.50 1.50New Zealand 2.66 2.80 2.80Papua New Guinea 1.86 2.28 2.28Samoa 1.50 1.50 1.50Solomon Islands 5.00 5.50 5.50Tonga 3.00 3.50 3.50Vanuatu 1.50 2.00 2.00
Europe and Former U.S.S.R.: 2.36 2.91 2.91Europe—
Albania 1.00 1.50 1.50Austria 1.90 2.20 2.20Belgium 2.24 2.40 2.40Bosnia-Herzegovina 5.00 5.50 5.50Bulgaria .48 3.38 3.38Croatia 4.90 5.50 5.50Czech Rep. 4.60 4.90 4.90Denmark 2.52 2.30 2.30Finland 3.46 2.80 2.80France 2.08 2.53 2.53Germany 2.37 2.67 2.67
Table 4—Growth rate of real gross domestic product (percent per year-1) (continued)
9

Table 4—Growth rate of real gross domestic product (percent per year-1) (continued)
Country 1997-2000 2001-2005 2006-2010
Europe continued—Greece 2.74 2.48 2.48Hungary 2.72 4.31 4.31Iceland 3.81 2.20 2.20Ireland 6.60 5.40 5.40Italy 1.97 2.57 2.57Macedonia 2.00 3.00 3.00Malta 4.11 3.38 3.38Netherlands 2.86 2.60 2.60Norway 3.56 3.00 3.00Poland 5.11 4.81 4.81Portugal 3.08 2.80 2.80Romania 2.09 4.24 4.24Slovakia 4.60 4.90 4.90Slovenia 4.90 5.50 5.50Spain 2.92 3.10 3.10Sweden 1.92 2.10 2.10Switzerland 1.55 2.52 2.52United Kingdom 2.56 2.52 2.52Yugoslav Federal Republic 3.50 4.00 4.00
Former U.S.S.R.—Armenia 6.19 5.90 5.90Azerbaijan 8.90 11.63 11.63Belarus .24 4.60 4.60Estonia 4.00 5.30 5.30Georgia 9.40 9.18 9.18Kazakhstan 3.49 5.48 5.48Kyrgyzstan 6.10 5.00 5.00Latvia 3.79 4.80 4.80Lithuania 3.71 4.80 4.80Moldova Rep .38 5.00 5.00Russian Federation 1.40 5.80 5.80Tajikistan -5.06 5.20 5.20Turkmenistan .50 5.00 5.00Ukraine -.56 5.86 5.86Uzbekistan 1.80 4.50 4.50
Supply curves for fuelwood and charcoal had the same elasticities and rates of shifts asthose for industrial roundwood. For industrial roundwood used in the round (otherindustrial roundwood), the supply curves were assumed to be horizontal so that supplyin each country was equal to the projected demand, at current prices and projectedincome. This simplification is legitimate because the world trade of this product is small.
The supply of other fiber pulp (from straw, bagasse, etc.) had the same price elasticityas industrial roundwood, 0.8, and a shift rate of 3 percent per year in China (the mainsupplier of other fiber pulp) and 4 percent per year in other countries. The supply ofwaste paper was assumed to be horizontal, with an upper bound defined by the previousyear’s consumption and the maximum recycling rate for the country.
10

Table 5—Roundwood supply shift rate, 1997-2010
Percent Percent Percent PercentCountry per year Country per year Country per year Country per year
Africa: 1.14 America: 0.71 Asia Pacific: 1.43 Europe and U.S.S.R.: 0.63Algeria 0.00 North and Central Asia— Europe—
America:Angola 0.42 Bahamas 0.00 Afghanistan 0.50 Albania -1.25Benin 0.00 Barbados 0.00 Bahrain 0.50 Austria 0.53Botswana 0.00 Belize 0.30 Bangladesh -0.80 Belgium 0.00Burkina Faso 0.00 Canada 0.60 Bhutan 0.56 Bosnia-Herz. 0.00Burundi 0.00 Cayman Islands 0.00 Brunei -0.07 Bulgaria 1.55Cameroon 1.35 Costa Rica -1.95 Cambodia 0.26 Croatia 2.26Cape Verde 0.00 Cuba -0.16 China 1.15 Czech Rep. 0.27Central Af. Rep. 0.55 Dominica 0.00 Cyprus 0.50 Denmark 0.65Chad 0.00 Dominican Rep. -1.39 Hong Kong 0.00 Finland 0.94Congo 2.00 El Salvador 3.72 India 2.54 France 0.78Côte d’Ivoire -0.30 Guatemala -1.68 Indonesia 2.13 Germany 0.15Djibouti 0.00 Haiti 0.00 Iran 0.50 Greece 0.00Egypt 0.00 Honduras -2.03 Iraq 0.50 Hungary 0.69Equatorial Guinea -0.18 Jamaica 0.00 Israel 0.50 Iceland 0.00Ethiopia 0.00 Martinique 0.00 Japan 1.52 Ireland 3.49Gabon -0.03 Mexico -0.12 Jordan 0.50 Italy 0.24Gambia 0.00 Netherlands Antil. 0.00 Korea, DPR 0.67 Macedonia 0.00Ghana -0.94 Nicaragua -1.99 Korea, Rep. 2.21 Malta 0.00Guinea -0.99 Panama -1.67 Kuwait 0.00 Netherlands 0.52Guinea Bissau 0.32 Saint Vincent 0.00 Laos 1.37 Norway 1.24Kenya 3.14 Trinidad &Tobago 0.00 Lebanon 0.50 Poland 0.09Lesotho 0.00 United States 0.60 Macau 0.50 Portugal 0.53Liberia -0.26 Malaysia -1.09 Romania 0.00Libyan Arab Jam. 0.00 South America: Mongolia -0.70 Slovakia 0.36Madagascar -0.72 Argentina 2.98 Myanmar 0.86 Slovenia 0.77Malawi 10.07 Bolivia 1.00 Nepal 1.32 Spain 1.03Mali 0.00 Brazil 1.34 Oman 0.00 Sweden 0.63Mauritania 0.00 Chile 1.69 Pakistan 1.49 Switzerland 0.46Mauritius 0.00 Colombia 0.53 Philippines 1.80 United Kingd 2.21Morocco 1.69 Ecuador -0.73 Qatar 0.50 Yugoslav FR 0.00Mozambique 0.00 French Guiana 1.82 Saudi Arabia 0.50Niger 0.00 Guyana 0.56 Singapore 0.00 Former U.S.S.R.:Nigeria -0.69 Paraguay -1.69 Sri Lanka 1.29 Armenia 0.20Reunion 0.00 Peru 0.61 Syrian Arab Rep 0.50 Azerbaijan 0.20Rwanda 0.00 Suriname 1.53 Thailand -0.06 Belarus 2.10Sao Tome and Pr. 0.00 Uruguay 2.36 Turkey 0.50 Estonia 2.79Senegal 0.00 Venezuela 0.10 Un. Arab Em. 0.00 Georgia 0.20Sierra Leone -2.60 Vietnam 3.03 Kazakhstan 0.20Somalia 0.00 Yemen, Rep. 0.50 Kyrgyzstan 0.20South Africa 2.02 Latvia 1.41Sudan -0.59 Oceania— Lithuania 2.18Swaziland 3.00 Australia 1.02 Moldova Rep 2.10Tanzania, U. Rep. 4.20 Cook Is -1.79 Russian Fed 0.20Togo 0.00 Fiji 8.33 Tajikistan 0.20Tunisia 3.00 French Polyn. 0.00 Turkmenistan 0.20Uganda 3.50 New Caledon. 0.50 Ukraine 2.10Zaire 0.57 New Zealand 3.80 Uzbekistan 0.20Zambia 1.51 Papua New Guinea 3.84Zimbabwe 4.45 Samoa 0.00
Solomon Is 3.00Tonga 0.50Vanuatu 3.19
11

The GFPM simulates the transformation, in each country, of wood and other rawmaterials (other fiber pulp and waste paper) into end products (sawnwood and panels),or intermediate products (pulps), which are in turn transformed into end products(papers). These successive transformations, and the attendant supplies and demands,are represented by activity analysis.
The corresponding input-output coefficients were estimated for the base year (1997). Theestimation procedure was such that the implied consumption, production, and trade ofall products were as close as possible to the national statistics, as reported in FAO(1999), whereas the input-output coefficients stayed within a plausible range, given priorknowledge of the technology. For example, the total amount of pulp and other fibersconsumed per ton of paper had to be close to unity.
Each production activity represented with input-output coefficients corresponds to amanufacturing cost. This is the cost of all inputs (capital, wages, energy, etc.), excludingthe cost of raw materials explicit in the model. This cost was estimated in the base year(1997) as the unit value of the output, minus the cost of all inputs, at world prices.
Similarly, all the supply curves for raw materials and the demand curves for end productswere calibrated to supply or demand the amounts observed in each country at worldprice. Because the calibration is made at world import price, the supply curves andmanufacturing costs include the cost of transportation, which is therefore set at zero forall trade flows in the base year.
Calibrated in this way, the solution of the model in the base year is almost identical tothe observed quantities and corresponding prices for all products and countries.
In the GFPM, a change in tariff is equivalent to a change in transport cost for importedcommodities. Most tariffs are ad valorem, so the effect of a change in tariff changeswith the price level. For technical reasons, the new tariff is based on last year’s worldprice, computed by the spatial equilibrium mechanism.
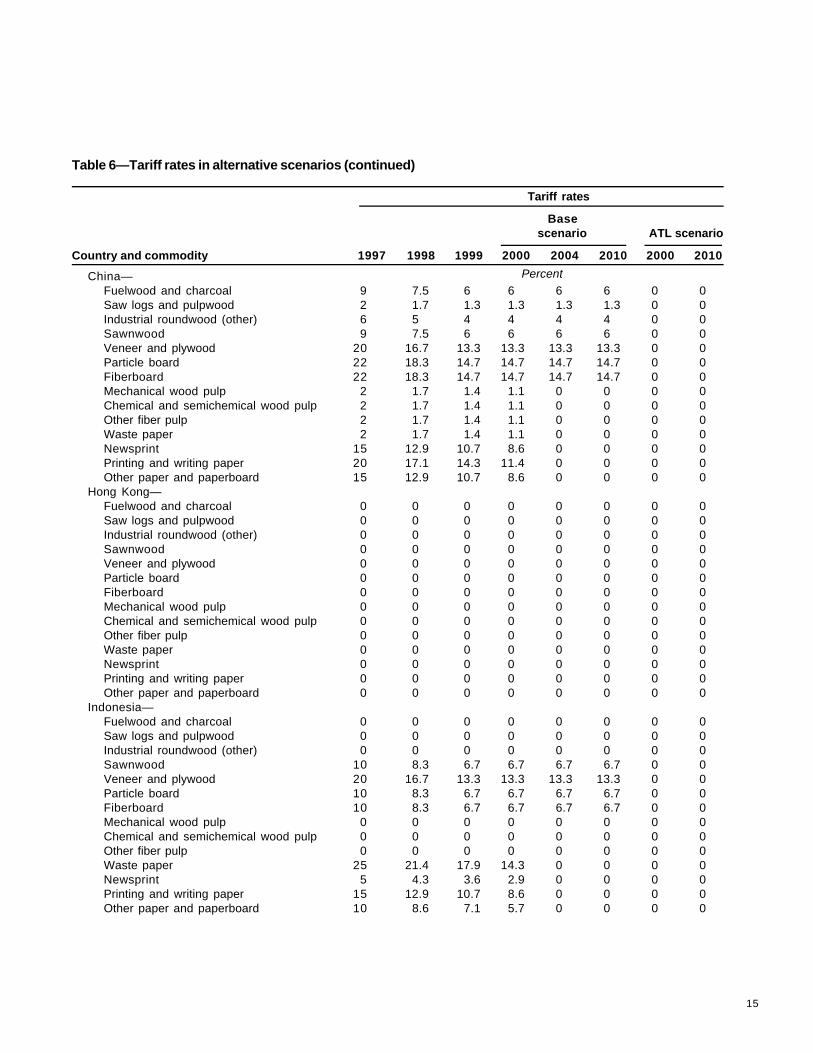
Two scenarios were implemented: (1) a base scenario, analog to the continuation ofcurrent agreements (2) and an ATL scenario to simulate the accelerated removal oftariffs. The details of the tariff reductions assumed in the two scenarios are shown intable 6.
Base scenario—According to Barbier (1996), because of the Uruguay Round of globalagreement on trade and tariffs (GATT), major developed countries were committed toreducing tariffs by 50 percent on solid wood products over 5 years starting in 1995, andcompletely phasing out tariffs on pulp and paper by 2004.
For this study, we had data on tariffs in 1997. For solid wood products (fuelwood,industrial roundwood, sawnwood, veneer and plywood, particle board, and fiberboard),we assumed that tariffs had been reduced by one-sixth from 1995 to 1997, and that theywould be reduced further by one-sixth each year in 1998 and 1999. For pulp (mechanicalpulp, chemical pulp, other fiber pulp, and waste paper) and paper (newsprint, printing andwriting paper, other paper, and paperboard), we reduced 1997 tariffs by one-seventheach year from 1998 onwards, thereby leading to total tariff elimination by 2004.
Assumptions onAccelerated TariffLiberalization
Intermediate ProductSupply and Demand
12
Text continues on page 19.

America:Canada— Percent
Fuelwood and charcoal 0 0 0 0 0 0 0 0Saw logs and pulpwood 0 0 0 0 0 0 0 0Industrial roundwood (other) 0 0 0 0 0 0 0 0Sawnwood 0 0 0 0 0 0 0 0Veneer and plywood 6 5 4 4 4 4 0 0Particle board 2.5 2.1 1.7 1.7 1.7 1.7 0 0Fiberboard 0 0 0 0 0 0 0 0Mechanical wood pulp 0 0 0 0 0 0 0 0Chemical and semichemical wood pulp 0 0 0 0 0 0 0 0Other fiber pulp 0 0 0 0 0 0 0 0Waste paper 0 0 0 0 0 0 0 0Newsprint 0 0 0 0 0 0 0 0Printing and writing paper 0 0 0 0 0 0 0 0Other paper and paperboard 2 1.7 1.4 1.1 0 0 0 0
Mexico—Fuelwood and charcoal 10 8.3 6.7 6.7 6.7 6.7 0 0Saw logs and pulpwood 10 8.3 6.7 6.7 6.7 6.7 0 0Industrial roundwood (other) 10 8.3 6.7 6.7 6.7 6.7 0 0Sawnwood 10 8.3 6.7 6.7 6.7 6.7 0 0Veneer and plywood 15 12.5 10 10 10 10 0 0Particle board 20 16.7 13.3 13.3 13.3 13.3 0 0Fiberboard 15 12.5 10 10 10 10 0 0Mechanical wood pulp 5 4.3 3.6 2.9 0 0 0 0Chemical and semichemical wood pulp 0 0 0 0 0 0 0 0Other fiber pulp 5 4.3 3.6 2.9 0 0 0 0Waste paper 0 0 0 0 0 0 0 0Newsprint 15 12.9 10.7 8.6 0 0 0 0Printing and writing paper 10 8.6 7.1 5.7 0 0 0 0Other paper and paperboard 10 8.6 7.1 5.7 0 0 0 0
United States—Fuelwood and charcoal 0 0 0 0 0 0 0 0Saw logs and pulpwood 0 0 0 0 0 0 0 0Industrial roundwood (other) 0 0 0 0 0 0 0 0Sawnwood 0 0 0 0 0 0 0 0Veneer and plywood 5 4.2 3.3 3.3 3.3 3.3 0 0Particle board 0.8 0.7 0.5 0.5 0.5 0.5 0 0Fiberboard 0.6 0.5 0.4 0.4 0.4 0.4 0 0Mechanical wood pulp 0 0 0 0 0 0 0 0Chemical and semichemical wood pulp 0 0 0 0 0 0 0 0Other fiber pulp 0 0 0 0 0 0 0 0Waste paper 0 0 0 0 0 0 0 0Newsprint 0 0 0 0 0 0 0 0Printing and writing paper 1.5 1.3 1.1 0.9 0 0 0 0Other paper and paperboard 2.4 2.1 1.7 1.4 0 0 0 0
Tariff rates
Basescenario ATL scenario
Country and commodity 1997 1998 1999 2000 2004 2010 2000 2010
Table 6—Tariff rates in alternative scenarios
13

Tariff rates
Basescenario ATL scenario
Country and commodity 1997 1998 1999 2000 2004 2010 2000 2010
Table 6—Tariff rates in alternative scenarios (continued)
Brazil— PercentFuelwood and charcoal 0 0 0 0 0 0 0 0Saw logs and pulpwood 0 0 0 0 0 0 0 0Industrial roundwood (other) 10 8.3 6.7 6.7 6.7 6.7 0 0Sawnwood 10 8.3 6.7 6.7 6.7 6.7 0 0Veneer and plywood 10 8.3 6.7 6.7 6.7 6.7 0 0Particle board 10 8.3 6.7 6.7 6.7 6.7 0 0Fiberboard 2 1.7 1.3 1.3 1.3 1.3 0 0Mechanical wood pulp 0 0 0 0 0 0 0 0Chemical and semichemical wood pulp 0 0 0 0 0 0 0 0Other fiber pulp 0 0 0 0 0 0 0 0Waste paper 0 0 0 0 0 0 0 0Newsprint 0 0 0 0 0 0 0 0Printing and writing paper 20 17.1 14.3 11.4 0 0 0 0Other paper and paperboard 12.5 10.7 8.9 7.1 0 0 0 0
Chile—Fuelwood and charcoal 11 9.2 7.3 7.3 7.3 7.3 0 0Saw logs and pulpwood 11 9.2 7.3 7.3 7.3 7.3 0 0Industrial roundwood (other) 11 9.2 7.3 7.3 7.3 7.3 0 0Sawnwood 11 9.2 7.3 7.3 7.3 7.3 0 0Veneer and plywood 11 9.2 7.3 7.3 7.3 7.3 0 0Particle board 11 9.2 7.3 7.3 7.3 7.3 0 0Fiberboard 11 9.2 7.3 7.3 7.3 7.3 0 0Mechanical wood pulp 11 9.4 7.9 6.3 0 0 0 0Chemical and semichemical wood pulp 11 9.4 7.9 6.3 0 0 0 0Other fiber pulp 11 9.4 7.9 6.3 0 0 0 0Waste paper 11 9.4 7.9 6.3 0 0 0 0Newsprint 11 9.4 7.9 6.3 0 0 0 0Printing and writing paper 11 9.4 7.9 6.3 0 0 0 0Other paper and paperboard 11 9.4 7.9 6.3 0 0 0 0
Asia and Oceania:Brunei—
Fuelwood and charcoal 0 0 0 0 0 0 0 0Saw logs and pulpwood 20 16.7 13.3 13.3 13.3 13.3 0 0Industrial roundwood (other) 20 16.7 13.3 13.3 13.3 13.3 0 0Sawnwood 20 16.7 13.3 13.3 13.3 13.3 0 0Veneer and plywood 20 16.7 13.3 13.3 13.3 13.3 0 0Particle board 20 16.7 13.3 13.3 13.3 13.3 0 0Fiberboard 0 0 0 0 0 0 0 0Mechanical wood pulp 0 0 0 0 0 0 0 0Chemical and semichemical wood pulp 0 0 0 0 0 0 0 0Other fiber pulp 0 0 0 0 0 0 0 0Waste paper 0 0 0 0 0 0 0 0Newsprint 0 0 0 0 0 0 0 0Printing and writing paper 0 0 0 0 0 0 0 0Other paper and paperboard 0 0 0 0 0 0 0 0
14
Tariff rates
Basescenario ATL scenario
Country and commodity 1997 1998 1999 2000 2004 2010 2000 2010
Table 6—Tariff rates in alternative scenarios (continued)
China— PercentFuelwood and charcoal 9 7.5 6 6 6 6 0 0Saw logs and pulpwood 2 1.7 1.3 1.3 1.3 1.3 0 0Industrial roundwood (other) 6 5 4 4 4 4 0 0Sawnwood 9 7.5 6 6 6 6 0 0Veneer and plywood 20 16.7 13.3 13.3 13.3 13.3 0 0Particle board 22 18.3 14.7 14.7 14.7 14.7 0 0Fiberboard 22 18.3 14.7 14.7 14.7 14.7 0 0Mechanical wood pulp 2 1.7 1.4 1.1 0 0 0 0Chemical and semichemical wood pulp 2 1.7 1.4 1.1 0 0 0 0Other fiber pulp 2 1.7 1.4 1.1 0 0 0 0Waste paper 2 1.7 1.4 1.1 0 0 0 0Newsprint 15 12.9 10.7 8.6 0 0 0 0Printing and writing paper 20 17.1 14.3 11.4 0 0 0 0Other paper and paperboard 15 12.9 10.7 8.6 0 0 0 0
Hong Kong—Fuelwood and charcoal 0 0 0 0 0 0 0 0Saw logs and pulpwood 0 0 0 0 0 0 0 0Industrial roundwood (other) 0 0 0 0 0 0 0 0Sawnwood 0 0 0 0 0 0 0 0Veneer and plywood 0 0 0 0 0 0 0 0Particle board 0 0 0 0 0 0 0 0Fiberboard 0 0 0 0 0 0 0 0Mechanical wood pulp 0 0 0 0 0 0 0 0Chemical and semichemical wood pulp 0 0 0 0 0 0 0 0Other fiber pulp 0 0 0 0 0 0 0 0Waste paper 0 0 0 0 0 0 0 0Newsprint 0 0 0 0 0 0 0 0Printing and writing paper 0 0 0 0 0 0 0 0Other paper and paperboard 0 0 0 0 0 0 0 0
Indonesia—Fuelwood and charcoal 0 0 0 0 0 0 0 0Saw logs and pulpwood 0 0 0 0 0 0 0 0Industrial roundwood (other) 0 0 0 0 0 0 0 0Sawnwood 10 8.3 6.7 6.7 6.7 6.7 0 0Veneer and plywood 20 16.7 13.3 13.3 13.3 13.3 0 0Particle board 10 8.3 6.7 6.7 6.7 6.7 0 0Fiberboard 10 8.3 6.7 6.7 6.7 6.7 0 0Mechanical wood pulp 0 0 0 0 0 0 0 0Chemical and semichemical wood pulp 0 0 0 0 0 0 0 0Other fiber pulp 0 0 0 0 0 0 0 0Waste paper 25 21.4 17.9 14.3 0 0 0 0Newsprint 5 4.3 3.6 2.9 0 0 0 0Printing and writing paper 15 12.9 10.7 8.6 0 0 0 0Other paper and paperboard 10 8.6 7.1 5.7 0 0 0 0
15
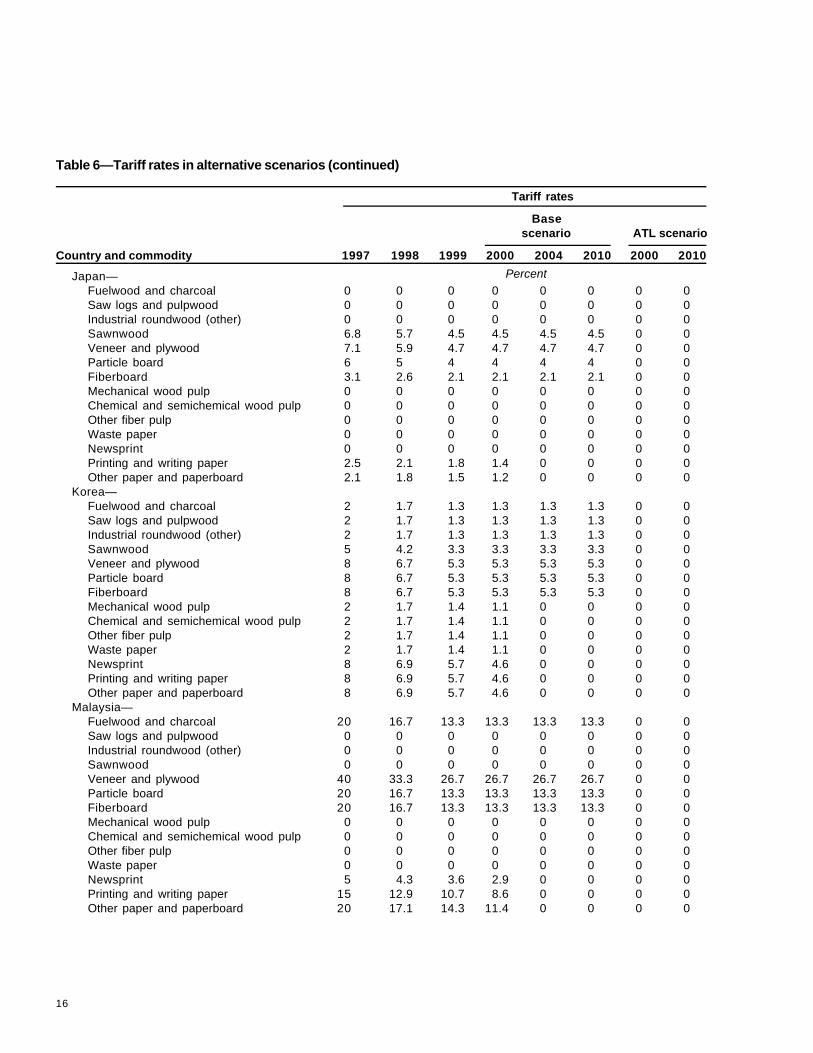
Japan— PercentFuelwood and charcoal 0 0 0 0 0 0 0 0Saw logs and pulpwood 0 0 0 0 0 0 0 0Industrial roundwood (other) 0 0 0 0 0 0 0 0Sawnwood 6.8 5.7 4.5 4.5 4.5 4.5 0 0Veneer and plywood 7.1 5.9 4.7 4.7 4.7 4.7 0 0Particle board 6 5 4 4 4 4 0 0Fiberboard 3.1 2.6 2.1 2.1 2.1 2.1 0 0Mechanical wood pulp 0 0 0 0 0 0 0 0Chemical and semichemical wood pulp 0 0 0 0 0 0 0 0Other fiber pulp 0 0 0 0 0 0 0 0Waste paper 0 0 0 0 0 0 0 0Newsprint 0 0 0 0 0 0 0 0Printing and writing paper 2.5 2.1 1.8 1.4 0 0 0 0Other paper and paperboard 2.1 1.8 1.5 1.2 0 0 0 0
Korea—Fuelwood and charcoal 2 1.7 1.3 1.3 1.3 1.3 0 0Saw logs and pulpwood 2 1.7 1.3 1.3 1.3 1.3 0 0Industrial roundwood (other) 2 1.7 1.3 1.3 1.3 1.3 0 0Sawnwood 5 4.2 3.3 3.3 3.3 3.3 0 0Veneer and plywood 8 6.7 5.3 5.3 5.3 5.3 0 0Particle board 8 6.7 5.3 5.3 5.3 5.3 0 0Fiberboard 8 6.7 5.3 5.3 5.3 5.3 0 0Mechanical wood pulp 2 1.7 1.4 1.1 0 0 0 0Chemical and semichemical wood pulp 2 1.7 1.4 1.1 0 0 0 0Other fiber pulp 2 1.7 1.4 1.1 0 0 0 0Waste paper 2 1.7 1.4 1.1 0 0 0 0Newsprint 8 6.9 5.7 4.6 0 0 0 0Printing and writing paper 8 6.9 5.7 4.6 0 0 0 0Other paper and paperboard 8 6.9 5.7 4.6 0 0 0 0
Malaysia—Fuelwood and charcoal 20 16.7 13.3 13.3 13.3 13.3 0 0Saw logs and pulpwood 0 0 0 0 0 0 0 0Industrial roundwood (other) 0 0 0 0 0 0 0 0Sawnwood 0 0 0 0 0 0 0 0Veneer and plywood 40 33.3 26.7 26.7 26.7 26.7 0 0Particle board 20 16.7 13.3 13.3 13.3 13.3 0 0Fiberboard 20 16.7 13.3 13.3 13.3 13.3 0 0Mechanical wood pulp 0 0 0 0 0 0 0 0Chemical and semichemical wood pulp 0 0 0 0 0 0 0 0Other fiber pulp 0 0 0 0 0 0 0 0Waste paper 0 0 0 0 0 0 0 0Newsprint 5 4.3 3.6 2.9 0 0 0 0Printing and writing paper 15 12.9 10.7 8.6 0 0 0 0Other paper and paperboard 20 17.1 14.3 11.4 0 0 0 0
Tariff rates
Basescenario ATL scenario
Country and commodity 1997 1998 1999 2000 2004 2010 2000 2010
Table 6—Tariff rates in alternative scenarios (continued)
16
Tariff rates
Basescenario ATL scenario
Country and commodity 1997 1998 1999 2000 2004 2010 2000 2010
Table 6—Tariff rates in alternative scenarios (continued)
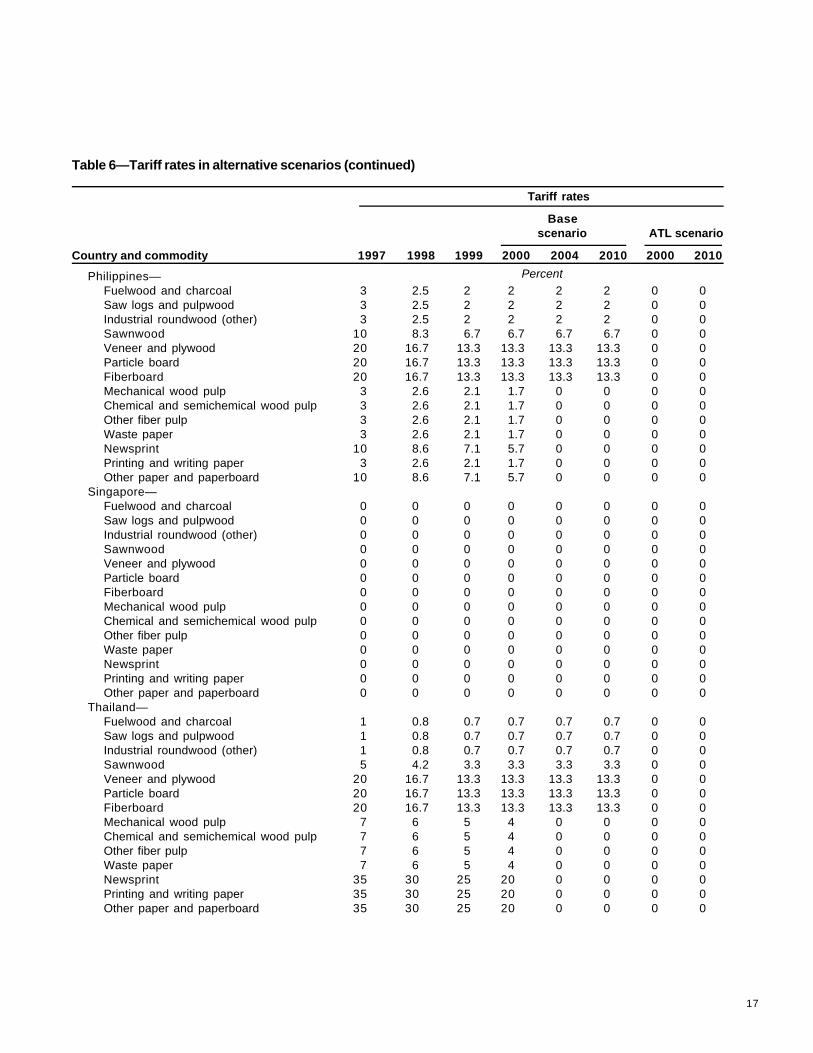
Philippines— PercentFuelwood and charcoal 3 2.5 2 2 2 2 0 0Saw logs and pulpwood 3 2.5 2 2 2 2 0 0Industrial roundwood (other) 3 2.5 2 2 2 2 0 0Sawnwood 10 8.3 6.7 6.7 6.7 6.7 0 0Veneer and plywood 20 16.7 13.3 13.3 13.3 13.3 0 0Particle board 20 16.7 13.3 13.3 13.3 13.3 0 0Fiberboard 20 16.7 13.3 13.3 13.3 13.3 0 0Mechanical wood pulp 3 2.6 2.1 1.7 0 0 0 0Chemical and semichemical wood pulp 3 2.6 2.1 1.7 0 0 0 0Other fiber pulp 3 2.6 2.1 1.7 0 0 0 0Waste paper 3 2.6 2.1 1.7 0 0 0 0Newsprint 10 8.6 7.1 5.7 0 0 0 0Printing and writing paper 3 2.6 2.1 1.7 0 0 0 0Other paper and paperboard 10 8.6 7.1 5.7 0 0 0 0
Singapore—Fuelwood and charcoal 0 0 0 0 0 0 0 0Saw logs and pulpwood 0 0 0 0 0 0 0 0Industrial roundwood (other) 0 0 0 0 0 0 0 0Sawnwood 0 0 0 0 0 0 0 0Veneer and plywood 0 0 0 0 0 0 0 0Particle board 0 0 0 0 0 0 0 0Fiberboard 0 0 0 0 0 0 0 0Mechanical wood pulp 0 0 0 0 0 0 0 0Chemical and semichemical wood pulp 0 0 0 0 0 0 0 0Other fiber pulp 0 0 0 0 0 0 0 0Waste paper 0 0 0 0 0 0 0 0Newsprint 0 0 0 0 0 0 0 0Printing and writing paper 0 0 0 0 0 0 0 0Other paper and paperboard 0 0 0 0 0 0 0 0
Thailand—Fuelwood and charcoal 1 0.8 0.7 0.7 0.7 0.7 0 0Saw logs and pulpwood 1 0.8 0.7 0.7 0.7 0.7 0 0Industrial roundwood (other) 1 0.8 0.7 0.7 0.7 0.7 0 0Sawnwood 5 4.2 3.3 3.3 3.3 3.3 0 0Veneer and plywood 20 16.7 13.3 13.3 13.3 13.3 0 0Particle board 20 16.7 13.3 13.3 13.3 13.3 0 0Fiberboard 20 16.7 13.3 13.3 13.3 13.3 0 0Mechanical wood pulp 7 6 5 4 0 0 0 0Chemical and semichemical wood pulp 7 6 5 4 0 0 0 0Other fiber pulp 7 6 5 4 0 0 0 0Waste paper 7 6 5 4 0 0 0 0Newsprint 35 30 25 20 0 0 0 0Printing and writing paper 35 30 25 20 0 0 0 0Other paper and paperboard 35 30 25 20 0 0 0 0
17

Australia— PercentFuelwood and charcoal 0 0 0 0 0 0 0 0Saw logs and pulpwood 0 0 0 0 0 0 0 0Industrial roundwood (other) 0 0 0 0 0 0 0 0Sawnwood 5 4.2 3.3 3.3 3.3 3.3 0 0Veneer and plywood 5 4.2 3.3 3.3 3.3 3.3 0 0Particle board 5 4.2 3.3 3.3 3.3 3.3 0 0Fiberboard 5 4.2 3.3 3.3 3.3 3.3 0 0Mechanical wood pulp 0 0 0 0 0 0 0 0Chemical and semichemical wood pulp 0 0 0 0 0 0 0 0Other fiber pulp 0 0 0 0 0 0 0 0Waste paper 0 0 0 0 0 0 0 0Newsprint 0 0 0 0 0 0 0 0Printing and writing paper 5 4.3 3.6 2.9 0 0 0 0Other paper and paperboard 5 4.3 3.6 2.9 0 0 0 0
New Zealand—Fuelwood and charcoal 0 0 0 0 0 0 0 0Saw logs and pulpwood 0 0 0 0 0 0 0 0Industrial roundwood (other) 0 0 0 0 0 0 0 0Sawnwood 8 6.7 5.3 5.3 5.3 5.3 0 0Veneer and plywood 8 6.7 5.3 5.3 5.3 5.3 0 0Particle board 7.5 6.3 5 5 5 5 0 0Fiberboard 6.5 5.4 4.3 4.3 4.3 4.3 0 0Mechanical wood pulp 0 0 0 0 0 0 0 0Chemical and semichemical wood pulp 0 0 0 0 0 0 0 0Other fiber pulp 0 0 0 0 0 0 0 0Waste paper 0 0 0 0 0 0 0 0Newsprint 7.5 6.4 5.4 4.3 0 0 0 0Printing and writing paper 7.5 6.4 5.4 4.3 0 0 0 0Other paper and paperboard 7.5 6.4 5.4 4.3 0 0 0 0
Papua New Guinea—Fuelwood and charcoal 40 33.3 26.7 26.7 26.7 26.7 0 0Saw logs and pulpwood 40 33.3 26.7 26.7 26.7 26.7 0 0Industrial roundwood (other) 40 33.3 26.7 26.7 26.7 26.7 0 0Sawnwood 40 33.3 26.7 26.7 26.7 26.7 0 0Veneer and plywood 100 83.3 66.7 66.7 66.7 66.7 0 0Particle board 55 45.8 36.7 36.7 36.7 36.7 0 0Fiberboard 55 45.8 36.7 36.7 36.7 36.7 0 0Mechanical wood pulp 40 34.3 28.6 22.9 0 0 0 0Chemical and semichemical wood pulp 40 34.3 28.6 22.9 0 0 0 0Other fiber pulp 40 34.3 28.6 22.9 0 0 0 0Waste paper 40 34.3 28.6 22.9 0 0 0 0Newsprint 11 9.4 7.9 6.3 0 0 0 0Printing and writing paper 11 9.4 7.9 6.3 0 0 0 0Other paper and paperboard 11 9.4 7.9 6.3 0 0 0 0
Tariff rates
Basescenario ATL scenario
Country and commodity 1997 1998 1999 2000 2004 2010 2000 2010
Table 6—Tariff rates in alternative scenarios (continued)
18

Tariff rates
Basescenario ATL scenario
Country and commodity 1997 1998 1999 2000 2004 2010 2000 2010
Table 6—Tariff rates in alternative scenarios (continued)
Europe:European Uniona— Percent
Fuelwood and charcoal 0 0 0 0 0 0 0 0Saw logs and pulpwood 1 0.8 0.7 0.7 0.7 0.7 0 0Industrial roundwood (other) 0 0 0 0 0 0 0 0Sawnwood 2 1.7 1.3 1.3 1.3 1.3 0 0Veneer and plywood 8.2 6.8 5.5 5.5 5.5 5.5 0 0Particle board 8.2 6.8 5.5 5.5 5.5 5.5 0 0Fiberboard 8.2 6.8 5.5 5.5 5.5 5.5 0 0Mechanical wood pulp 0 0 0 0 0 0 0 0Chemical and semichemical wood pulp 0 0 0 0 0 0 0 0Other fiber pulp 0 0 0 0 0 0 0 0Waste paper 0 0 0 0 0 0 0 0Newsprint 4.5 3.9 3.2 2.6 0 0 0 0Printing and writing paper 7.2 6.2 5.1 4.1 0 0 0 0Other paper and paperboard 5.7 4.9 4.1 3.3 0 0 0 0
a Each country of the European Union is treated individually: Austria, Belgium-Luxembourg, Denmark, Finland, France,Germany, Greece, Ireland, Italy, Netherlands, Portugal, Spain, Sweden, and United Kingdom.
Accelerated tariff liberalization scenario—Under the ATL scenario, tariffs are thesame as in the base scenario for 1998 and 1999. Beginning in 2000, the tariffs would beeliminated for all commodities.
There are 180 countries in the GFPM. Changes in tariffs corresponding to each scenariowere assumed only for the countries listed below (For other countries, it was assumedthat there would be no change):
• America:Canada, Mexico, United States, Brazil, and Chile
• Asia and Oceania:Brunei, China, Japan, Hong Kong, Indonesia, Korea, Malaysia, Philippines,Singapore, Thailand; Australia, New Zealand, and Papua New Guinea
• European Union:Austria, Belgium-Luxembourg, Denmark, Finland, France, Germany, Greece,Ireland, Italy, Netherlands, Portugal, Spain, Sweden, and United Kingdom
Thus, it was assumed that forest products would be traded more freely worldwidebetween 1997 and 2010 in response to market responses to the tariff cuts. Theadjustment of trade flows between countries or regions, however, will likely take time,thus inertia constraints were introduced to limit yearly trade changes to be within aspecified fraction of the previous year’s net supply (i.e., domestic supply plus imports,
19

also equal to domestic consumption plus exports). As detailed in the appendixes (seefootnote 1), this is an extension of earlier trade inertia constraints (Buongiorno andGilless 1984, Kallio et al. 1987, Zhang et al. 1997), meant to recognize the effect of thesize of the domestic market on trade (Devarajan et al. 1997).
Other assumptions governing the projected effects of the ATL agreement related tochanges in capacity, fiber input mix, and trade inertia. In the GFPM, capacity changesare endogenous. They depend on changes in past production and on relative profitabilityof additional capacity in different countries. Capacity data for the base year, 1997, wereestimated from the production data. Thereafter, global capacity growth is predicted with adistributed-lag function linking capacity change to changes in past production. Then,global capacity growth is allocated to different countries according to the shadow price(the marginal value of one unit of additional capacity) revealed by the equilibriumcomputations (Gilless and Buongiorno 1987, Zhang et al. 1993).
The technology, defined by input-output coefficients and associated manufacturingcosts, was held constant at the 1997 level, except for paper and paperboard. For paperand paperboard, it was assumed that the amount of recycled paper used in newsprint,printing and writing paper, and paper and paperboard would increase gradually between1997 and 2010 to reach levels predicted by other studies (Ince 1994, Mabee 1998).
The GFPM simulates dynamic market equilibrium for the global forest sector. Everyyear, demand, supply, trade, and prices are computed that clear markets for all productsand in all regions (static phase). Then, the model parameters are updated to reflectexogenous and endogenous changes from one year to the next (dynamic phase).Exogenous changes include economic growth, technical change, potential timbersupply, and trade inertia; they are assumptions. Endogenous changes include capacitygrowth and availability of recycled fibers; they are determined by the model. The modelthen computes the quantity-price equilibrium next year as shaped by the interveningchanges. It reiterates the static and dynamic phases for every year until the end of theprojection.
Static phase—The equilibrium for each year of the projection is obtained with anoptimization model that simulates world markets. It finds the production, consumption,and trade that maximize the total value of consumption minus the total cost ofproduction and transport, for all products in all countries, in a given year. All thevariables refer to that year. Objective function:
max Z = ΣΣ Pik (Dik)dDik - ΣΣ Pik (Sik)dSik - ΣΣYikmik - ΣΣΣ cjkTijk , (1)
where
i,j = country;k = product;P = price in U.S. $;D = final product demand;S = raw material supply;
Other Assumptions
MathematicalFormulation of GlobalForest Product Model
Dik
0ki
Sik
ki ki ki j
20
0

Y = quantity manufactured;m = cost of manufacture;T = quantity transported. In this version of the model, each country exports to the worldmarket and imports from the world market; andc = cost of transportation, including tariff.
Demand for final products:
Dik = aikPik
σ ik Xi
αik Dik,-1ηik , (2)
where
D-1 = demand in the previous year;
X = gross domestic product, in real U.S. $;σ,α,η = elasticities with respect to price, GDP, and past demand.
Wood supply and nonwood fiber supply:
Pik = Pik0
Sik < SikU
, (3)
where
P0 = cost of production, andSu = potential supply.
Material balance:
(4)
where
aikn
= input of commodity k per unit of n, andTu,TL = upper and lower bounds on imports and exports.
Price:The market-clearing price is the shadow price of the material balance constraint (4).
Manufacturing capacity:
(5)
21
Σ Tjik+Sik+Yik- Dik - ΣaiknYin- ΣTjik = 0 i,kj n j
Tjik < Tijk < TikL u i,j,k ,
Yik < Kik i,k ,

where
K = current capacity of production.
Waste paper recovery:
(6)
where
r = recycled paper, andSU = upper bound on recycled paper supply.
Dynamic phase—Yearly changes in the market equilibrium conditions are brought about by:
• Shifts of the demand curves, due to changes in X at the projected GDP growth rate.
• Shifts of the upper bounds on wood supply, S, at the assumed rate of growth ofpotential supply.
• Changes of manufacturing coefficients m to reflect technical change, especiallyincreasing use of paper recycling.
• Changes of capacity, determined as follows:
At global level, capacity change is a function of changes in production during the past 3years:
(7)
then, global capacity change is allocated to each country in proportion of its productionlevel and the marginal value of capacity revealed by the shadow price of capacity in thestatic phase.
(8)
where
∆ = yearly change, and
π = shadow price of capacity (endogenous, from constraint (5).
• Changes in waste paper recovery:
22
Sir < Sir i,r ,U
∆Kk = b1k∆Yk,-1 + b2k∆Yk,-2 + b3k∆Yk,-3 ,
∆Kik = ∆Kk ,Yik π
ΣYik πj
(9)
where
wikr
= maximum possible recovery rate (exogenous).
• Changes in tariff:
(10)
where
t = the ad valorem tariff rate, in percentage.
• Trade inertia:
(11)
where
ε = the absolute value of the maximum yearly change in the ratio of import or export tonet supply (exogenous).
The outlook presented here corresponds to the scenario with ATL. The purpose is tocompare the projections from 1997 to 2010 with past trends from 1965 to 1997. Thedetailed projections under this scenario are in appendixes 1 through 4 (see footnote 1),where they also are compared to projections without the ATL (see also “The Effects ofTariff Liberalization, 1997-2001”).
The global forest sector has expanded greatly during the last three decades, and overalltrends show a rising production, domestic consumption, and trade. In most parts of theworld, the major measurable factors affecting consumption of forest products are generaleconomic growth and prices. Many other influences, however, are relevant and reflectedindirectly by the GDP and price elasticities: level of residential investment, technical andeconomic competitiveness of sawnwood and panels in the building sector, developmentin electronic media, competitiveness of paper and paperboard for packaging, forexample.
Projections withAccelerated TariffLiberalization,1997-2010
23
Sir = ΣwikrDik,-1 ,k
U
cij = cij,-1 + (tj - tj,-1)Pjk,-1 ,
Tijk = ( + εijk)Nik,-1
Tijk,-1L
Nik,-1
NNik = Sik + ΣTJik= Dik + ΣTijk ,j j
Tijk = ( + εijk)Nik,-1
Tijk,-1U
Nik,-1

Total consumption of roundwood in the world has increased almost 50 percent between1961 and 1997, from 2.2 billion m3 to nearly 3.4 billion m3. The projections show that theworld demand for wood will continue to rise, especially in Asia where rapidly growingeconomies are concentrated (fig. 2). According to the projections, the world total round-wood consumption would reach 3.6 billion m3 by 2000 and 4.4 billion m3 by 2010, anincrease of 8 percent and 29 percent, respectively, from the 1997 level. In 1997, Asiaand Europe were net importers of roundwood. By 2010, the projections show that allregions will retain their trading status, but North and Central America will become netimporter (fig. 3). This reflects, in part, the effects of timber harvest restrictionsimplemented in the United States.
The world total consumption of fuelwood and charcoal increased 61 percent from 1billion m3 in 1965 to about 1.8 billion m3 in 1997. The projections show that the worlddemand for fuelwood and charcoal will continue to rise, especially in Asia and Africa
Figure 3—Net trade of roundwood.
Figure 2—Consumption of roundwood.
Fuelwood and Charcoal
24
Roundwood

(fig. 4). Growth would occur however, at a slower rate than in the past decade, in allregions. In North and Central America, Oceania, and Europe, fuelwood consumption isexpected to decrease slightly in the next 13 years.
Between 1965 and 1997, because of moderate growth in population and rapid growth inthe economy, world consumption of industrial roundwood has shown sustainedincreases. Total consumption was about 1523 million m3 in 1997, about one-third abovethe 1965 level. According to the projections, the world industrial roundwood consumptionwould reach 2039 million m3 by 2010, an increase of 34 percent from the 1997 level(fig. 5). Because of the regional imbalance between production and consumption, therewould be an increase in trade. The trade deficit of Asia would increase from 56 million in1997 to 68 million m3 in 2010, and the trade deficit of Europe would decrease slightly(fig. 6). Exports of South America are projected to almost double, whereas North andCentral America would become a net importer in 2010.
Figure 4—Consumption of fuelwood.
Figure 5—Consumption of industrial roundwood.
Industrial Roundwood
25
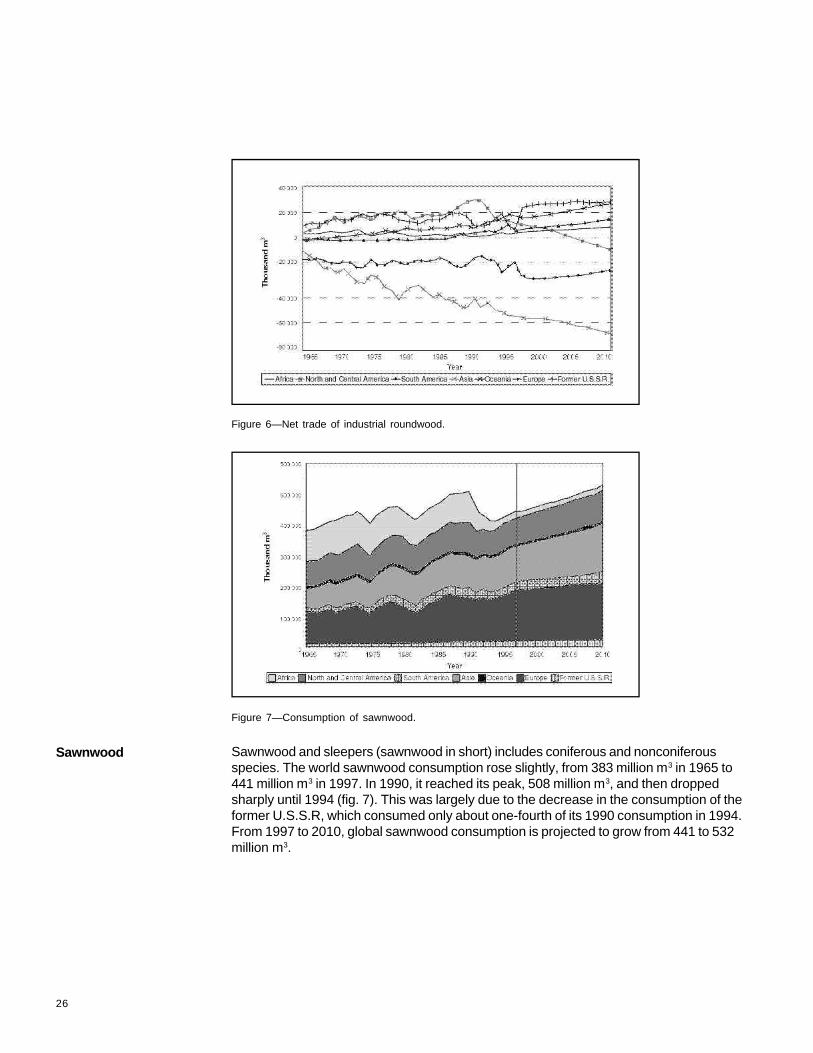
Figure 6—Net trade of industrial roundwood.
Figure 7—Consumption of sawnwood.
Sawnwood and sleepers (sawnwood in short) includes coniferous and nonconiferousspecies. The world sawnwood consumption rose slightly, from 383 million m3 in 1965 to441 million m3 in 1997. In 1990, it reached its peak, 508 million m3, and then droppedsharply until 1994 (fig. 7). This was largely due to the decrease in the consumption of theformer U.S.S.R, which consumed only about one-fourth of its 1990 consumption in 1994.From 1997 to 2010, global sawnwood consumption is projected to grow from 441 to 532million m3.
Sawnwood
26

Figure 9—Consumption of wood-based panels.
Figure 8—Net trade of sawnwood.
In 1997, the three net exporting regions were the former U.S.S.R., North and CentralAmerica, South America, and Oceania, respectively. They are projected to continue tobe net exporters by 2010 (fig. 8). By 2010, North and Central America is projected toincrease its surplus with 29 million m3 of net exports. Net exports of Oceania will almostdouble, whereas the former U.S.S.R. and South America would stay at about their 1997level. Symmetrically, the largest net importer is projected to continue to be Asia whosenet imports would reach 33 million m3 by 2010, followed by Africa at 5.5 million m3.
Wood-based panels—From 1965 to 1997, the demand for wood-based panels grewfaster than for any other forest product. World consumption went from 42 million m3 to154 million m3, with an average growth of 4.1 percent per year. The 1997 distribution ofthe world’s consumption by panel type was plywood and veneer, 40 percent; particleboard, 45 percent; and fiberboard, 15 percent. Wood-based panels consumption wasexpected to grow during the next 13 years to 231 million m3 in 2010 (fig. 9).
27

Figure 10—Net trade of wood-based panels.
Figure 11—Consumption of veneer and plywood.
From 1965 to 1993, Asia, the former U.S.S.R., and South America were net exporters,but Asia became a net importer after 1993. The projections are that by the year 2010,Europe and Oceania will become the largest and the second net exporters, respectively,whereas South America and the former U.S.S.R. would still be net exporters. Asia wouldbecome by far the largest net importer, reaching 5.8 million m3 by 2010, whereas Northand Central America would nearly balance its trade (fig. 10).
Veneer sheets and plywood—The world consumption of veneer sheets and plywoodincreased from 27 million m3 in 1965 to 60 million m3 in 1997. It is projected that worldconsumption would increase from 60 million m3 in 1997 to 89 million m3 in 2010, for anaverage annual growth rate of 3 percent (fig. 11). Although in 1997, Asia was the largestnet exporter and Europe the largest net importer, by 2010, South America is projected tobe the largest net exporter of plywood and veneer, and Europe would continue to be thelargest net importer (fig. 12).
28

Particle board—The world consumption of particle board grew fast, from 9 million m3 in1965 to 70 million m3 in 1997. Meanwhile, it is projected that the world particle boardconsumption would continue to increase to 105 million m3 in 2010 (fig. 13). Europeswitched from being the largest net importer of particle board in 1989 to the largest netexporter in 1994. In 1997, Asia was the largest net importer of particle board (fig. 14).The 2010 projections show Europe to still be the largest net exporter, at a slightly higherlevel than in 1997. Asia would continue to be the largest net importer, and its netimports of particle board would increase steadily, reaching 2224 thousand m3 by 2010.
Figure 12—Net trade of veneer and plywood.
Figure 13—Consumption of particle board.
29
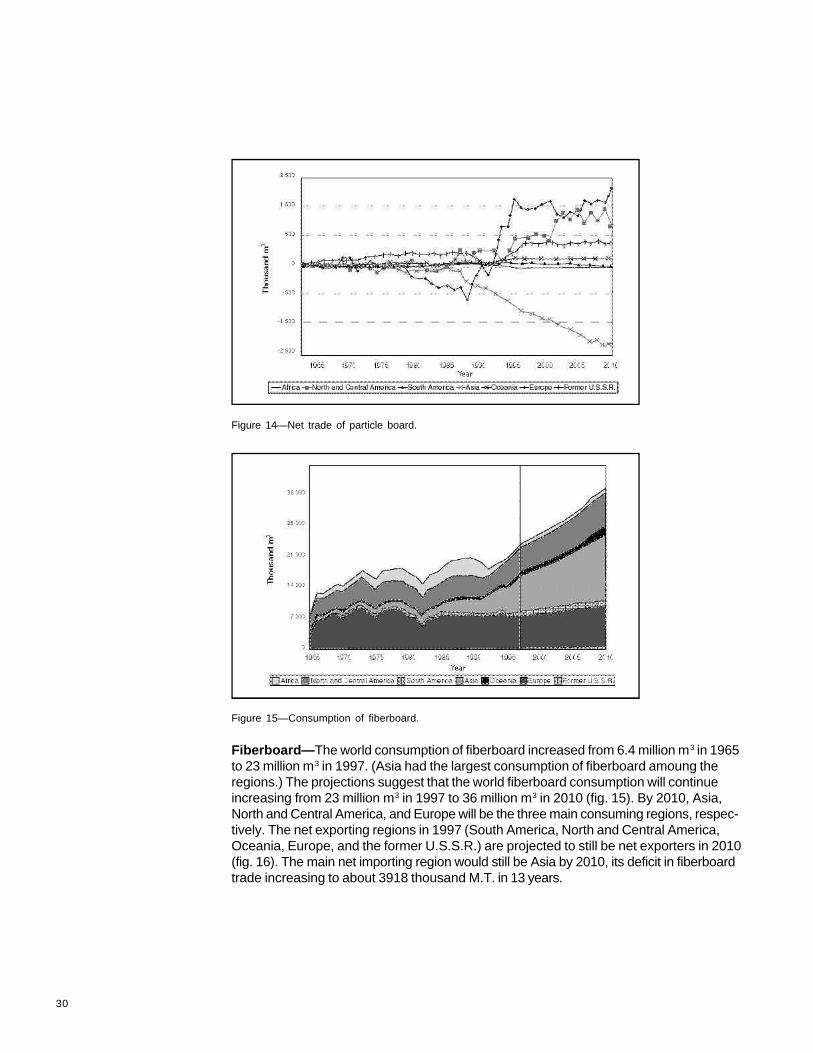
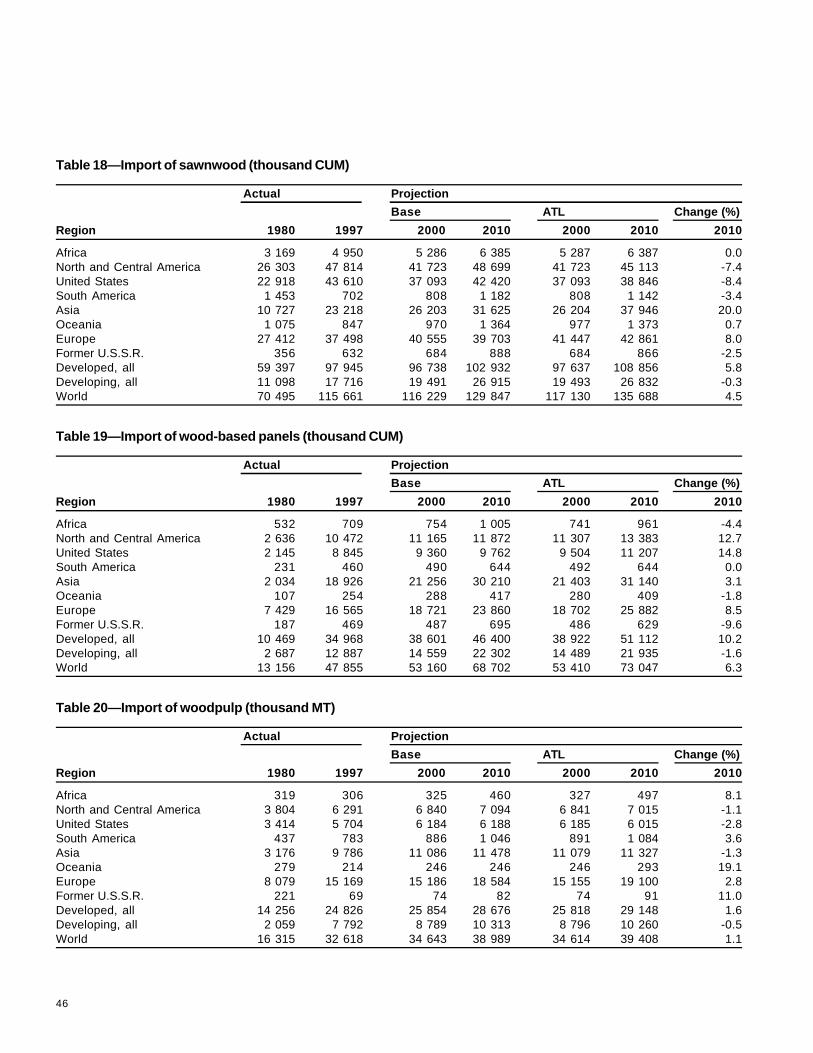
Fiberboard—The world consumption of fiberboard increased from 6.4 million m3 in 1965to 23 million m3 in 1997. (Asia had the largest consumption of fiberboard amoung theregions.) The projections suggest that the world fiberboard consumption will continueincreasing from 23 million m3 in 1997 to 36 million m3 in 2010 (fig. 15). By 2010, Asia,North and Central America, and Europe will be the three main consuming regions, respec-tively. The net exporting regions in 1997 (South America, North and Central America,Oceania, Europe, and the former U.S.S.R.) are projected to still be net exporters in 2010(fig. 16). The main net importing region would still be Asia by 2010, its deficit in fiberboardtrade increasing to about 3918 thousand M.T. in 13 years.
Figure 15—Consumption of fiberboard.
Figure 14—Net trade of particle board.
30

Fiber furnish—Total fiber furnish includes all wood pulp, waste paper, and other fiberpulps. The world consumption of fiber furnish, which almost tripled from 1965 to 1997, isprojected to reach 490 million M.T. by 2010, from 289 million M.T. in 1997.
Wood pulp—Wood pulp includes mechanical pulp and chemical pulp. Wood pulpconsumption was expected to grow to 216 million m3 by 2010, from 158 million m3 in1997 (fig. 17). In 1997, Asia was the largest net importer and North and Central Americathe largest net exporter. The projections show the same rankings for 2010 (fig. 18).
Figure 16—Net trade of fiberboard.
Figure 17—Consumption of wood pulp.
31

Mechanical pulp—From 1997 to 2010, consumption of mechanical pulp is projected togrow fastest in Asia and Africa, and slower in other regions (fig. 19). Oceania, the largestnet exporter in 1997, would continue to expand its world market share and be the largestexporter by 2010 (fig. 20). North and Central America would be the second largest netexporter, and Europe would still be a small net exporter by 2010, with little change. Asiawould continue to be the major importer and would increase its net imports by 2010 toabout 980,000 M. T.
Figure 18—Net trade of wood pulp.
Figure 19—Consumption of mechanical wood pulp.
32

Figure 21—Consumption of chemical/semichemical wood pulp.
Figure 20—Net trade of mechanical wood pulp.
Chemical pulp—Chemical pulp consumption is projected to increase the most in Africaand Oceania, and least in North and Central America (fig. 21). North and Central Americawould remain the largest net exporter of chemical pulp, and Europe would exceed Asiato be the largest net importer (fig. 22). Net exports for South America are projected todecrease slowly until 2010.
33

Figure 22—Net trade of chemical/semichemical wood pulp.
Figure 23—Consumption of other fiber pulp.
Other fiber pulp—Figure 23 indicates that consumption of other fiber pulp hasincreased rapidly in Asia after 1984 because of large fiber needs caused by quickdevelopment in the economy and limited wood fibers of the region. Other fiber pulpconsumption in Asia is projected to approach 38 million M.T. by 2010, larger than thesum of mechanical and chemical pulp consumption.
34

Waste paper—According to the projection, consumption and production of wastepaperwould increase fast in Asia and South America (fig. 24). Asia would remain the largestnet importer, whereas North and Central America would remain the major net exporter.The projections suggest that exports from the region will continue to increase fast (fig.25). Net imports for Asia would increase by 50 percent by 2010. The net surplus ofEurope also would continue to increase steadily.
Figure 24—Consumption of wastepaper.
Figure 25—Net trade of wastepaper.
35

The paper and paperboard group includes newsprint, printing and writing paper, and otherpaper and paperboard. Figure 26 shows that according to projections, Asianconsumption would exceed that of North and Central America by 2000. This is dueessentially to the faster rate of GDP growth for Asia presumed in the scenario. Figure 26also shows the world consumption of paper and paperboard would be 500 million M.T. by2010, from 294 million M.T. in 1997. Figure 27 suggests that North and Central Americawould exceed Europe to become the largest net exporter of paper and paperboard by2010, reaching 15 million M.T. Net imports for Asia would almost double in 13 years.
Figure 26—Consumption of paper and paperboard.
Figure 27—Net trade of paper and paperboard.
Paper and Paperboard
36

Newsprint—The growth of newsprint consumption would be faster than that of the1990s in all regions, especially in Asia and the former U.S.S.R. (fig. 28). World newsprintconsumption would increase from 35 million M.T. in 1997 to 60 million tons in 2010. Thelargest net exporter would still be North and Central America, followed by the formerU.S.S.R. (fig. 29). Asia would remain the largest net importer and is projected toincrease its net imports by 37 percent from 1997 to 2010.
Figure 28—Consumption of newsprint.
Figure 29—Net trade of newsprint.
37

Printing and writing paper—Consumption of printing and writing paper is projected togrow fastest in the former U.S.S.R. and Oceania. World printing and writing paperconsumption would increase from 88 million M.T. in 1997 to 163 million M.T. in 2010,almost double in 13 years (fig. 30). The positions of Europe and South America as netexporters would strengthen, though net exports would grow at a slower rate. The tradedeficit in printing and writing paper in Asia would reach nearly 3.6 million M.T. in 2010(fig. 31).
Figure 30—Consumption of printing and writing paper.
Figure 31—Net trade of printing and writing paper.
38

Other paper and paperboard—Other paper and paperboard consumption is projectedto grow slower than printing and writing paper and newsprint. Asia would experience themost increase (fig. 32). World consumption other paper and paperboard would increasefrom 170 million M.T. in 1997 to 277 million M.T. in 2010. Asia would nearly double its netimports by 2010. Net exports from North and Central America would continue to growalmost linearly, whereas net exports from Europe would decrease to one-fifth of their1997 level (fig. 33).
Figure 32—Consumption of other paper and paperboard.
Figure 33—Net trade of other paper and paperboard.
39

In market economies, prices determine, in part, the demand and supply of forestproducts. Price levels are also critical in determining the feasibility of forestry andindustry projects. It is, therefore, useful that the method to predict consumption,production, and trade also gives projections of the market clearing prices.
Industrial roundwood and sawnwood—Figure 34 presents historical trends andprojections for industrial roundwood and sawnwood prices in 1997 U.S. $ at the worldlevel. Historically, the price of sawnwood paralleled the price of industrial roundwood,mainly because roundwood is a major part of the total cost of sawmilling, reaching ashigh as 60 to 70 percent. The projections show that the relation between the two priceswill remain strong over the next 13 years.
Figure 35—Real world prices of wood-based panels.
Figure 34—Real world prices of solid wood products.
Price Trends withAccelerated TariffLiberalization
40

The price projections suggest that the real price of industrial roundwood worldwide wouldincrease by $27 per m3 over the next decade, and would rise to about $130 per m3 by2010. Because of the rising price of raw material, the price of sawnwood would increaseby $50 per m3. The price of sawnwood is projected to reach about $300 per m3 in 2010.
Wood-based panels—The price for wood-based panels fell between 1965 and 1997, asshown in figure 35. This steady fall in price was made possible mostly by a reduction incosts of production (new processes, economies of scale, cheaper raw material fromsawmill residues, for example). Among all panel products, the real price of veneer andplywood declined more than that of particle board or fiberboard.
The projections show that the real prices of veneer and plywood, particle board, andfiberboard should increase slightly during the next 13 years, almost in parallel with theincreasing price of industrial roundwood (fig. 34).
Paper and paperboard—For the pulp and paper sector, wood costs account for asmaller share of total costs, notably because of high capital costs. Because thetechnology is broadly similar throughout the world, however, wood cost is one of themeans whereby individual companies seek to gain a comparative advantage. To someextent, therefore, the price trend of paper and paperboard also followed that of industrialroundwood during the last three decades of the 20th century (fig. 36). The strong riseafter 1973 was due to high energy costs that declined subsequently.
The prices of paper and paperboard projected with the GFPM and under the ATLagreement remain stable or increase slightly from 1997 to 2010. The price trendcorresponds to the raw material price trend, dampened by the increased use of wastepaper and other fiber pulp in paper and paperboard production worldwide and in Asiaparticularly.
Figure 36—Real world prices of paper and paperboard.
41

Effects ofAccelerated TariffLiberalizationAgreement,1997-2010
Africa 45 607 59 368 59 645 68 554 59 668 68 240 -0.5North and Central America 472 122 603 287 668 147 772 411 669 264 776 478 0.5United States 307 817 399 868 452 820 512 839 452 629 518 406 1.1South America 84 432 121 134 127 437 151 138 127 444 152 703 1.0Asia 270 609 333 458 398 565 527 799 398 626 523 054 -0.9Oceania 18 837 24 205 25 190 31 048 25 201 32 662 5.2Europe 235 898 317 445 342 345 399 352 341 592 405 281 1.5Former U.S.S.R. 263 120 77 939 83 565 93 914 83 565 94 934 1.1Developed, all 1 077 492 1 094 509 1 188 693 1 385 998 1 188 796 1 386 726 0.1Developing, all 313 133 442 327 516 201 658 217 516 563 666 628 1.3World 1 390 625 1 536 836 1 704 894 2 044 215 1 705 359 2 053 353 0.4
Table 7—Consumption of industrial roundwood (thousand CUM)
Actual Projection
Base ATL Change (%)
Region 1980 1997 2000 2010 2000 2010 2010
Africa 9 917 12 017 12 646 14 930 12 646 14 940 0.1North and Central America 123 139 172 833 177 158 192 431 177 159 192 431 0.0United States 101 196 148 259 151 755 163 692 151 755 163 692 0.0South America 20 895 27 470 28 897 34 782 28 897 34 858 0.2Asia 98 201 113 623 122 106 156 728 122 106 158 041 0.8Oceania 6 104 6 580 6 787 7 550 6 787 7 546 -0.1Europe 73 465 91 722 94 072 102 956 94 072 102 956 0.0Former U.S.S.R. 91 314 17 307 17 563 20 941 17 563 20 924 -0.1Developed, all 332 848 318 180 326 060 356 520 326 060 356 501 0.0Developing, all 90 187 123 372 133 169 173 798 133 169 175 197 0.8World 423 035 441 552 459 230 530 318 459 230 531 697 0.3
Actual Projection
Base ATL Change (%)
Region 1980 1997 2000 2010 2000 2010 2010
Table 8—Consumption of sawnwood (thousand CUM)
42

Africa 1 634 2 081 2 291 3 121 2 287 3 095 -0.8North and Central America 32 021 49 865 53 470 67 158 53 469 67 258 0.1United States 27 399 44 121 47 260 58 943 47 260 59 035 0.2South America 3 239 4 571 4 952 6 708 4 952 6 714 0.1Asia 17 011 47 830 54 069 81 185 54 070 80 748 -0.5Oceania 1 148 1 972 2 163 2 940 2 163 3 806 29.5Europe 23 132 44 318 48 118 64 623 48 118 63 795 -1.3Former U.S.S.R. 9 849 3 023 3 161 5 272 3 161 5 347 1.4Developed, all 76 118 112 835 121 653 158 750 121 653 158 911 0.1Developing, all 11 916 40 825 46 570 72 256 46 567 71 852 -0.6World 88 034 153 660 168 223 231 006 168 220 230 763 -0.1
Table 9—Consumption of wood-based panels (thousand CUM)
Actual Projection
Base ATL Change (%)
Region 1980 1997 2000 2010 2000 2010 2010
Africa 932 1 782 1 986 3 086 1 988 3 121 1.1North and Central America 58 994 74 185 79 960 94 119 79 971 93 884 -0.2United States 45 539 59 285 61 481 70 800 61 481 70 879 0.1South America 3 367 5 971 6 620 9 549 6 620 9 635 0.9Asia 14 935 27 717 31 396 42 145 31 376 41 994 -0.4Oceania 1 623 1 952 2 117 2 834 2 116 2 999 5.8Europe 26 840 43 598 47 113 58 954 47 172 59 744 1.3Former U.S.S.R. 7 463 3 000 3 309 4 890 3 309 4 852 -0.8Developed, all 106 181 138 070 148 078 180 247 148 146 180 813 0.3Developing, all 7 973 20 135 24 423 35 330 24 405 35 416 0.2World 114 154 158 205 172 501 215 578 172 551 216 229 0.3
Table 10—Consumption of woodpulp (thousand MT)
Actual Projection
Base ATL Change (%)
Region 1980 1997 2000 2010 2000 2010 2010
Africa 2 452 4 183 4 661 6 798 4 661 6 862 0.9North and Central America 68 104 101 423 110 809 147 779 110 809 147 717 0.0United States 60 706 89 502 97 598 127 786 97 598 127 525 -0.2South America 6 417 11 382 12 567 18 025 12 567 18 641 3.4Asia 32 665 95 050 113 190 199 913 113 203 198 634 -0.6Oceania 2 449 3 853 4 329 6 290 4 329 6 574 4.5Europe 35 054 74 595 81 706 114 967 81 706 115 305 0.3Former U.S.S.R. 8 603 3 239 3 375 6 354 3 375 6 289 -1.0Developed, all 130 307 212 098 232 904 321 481 232 904 321 351 0.0Developing, all 25 437 81 627 97 733 17 645 97 745 178 671 0.0World 155 744 293 725 330 637 500 127 330 650 500 022 0.0
Table 11—Consumption of total paper and paperboard (thousand MT)
Actual Projection
Base ATL Change (%)
Region 1980 1997 2000 2010 2000 2010 2010
43

Africa 50 801 66 366 67 242 79 230 67 265 78 496 -0.9North and Central America 492 415 613 534 675 936 772 261 677 053 769 403 -0.4United States 327 095 416 092 467 872 524 504 467 681 525 018 0.1South America 85 487 130 085 137 566 166 878 137 572 168 458 0.9Asia 233 821 277 153 341 261 450 016 341 474 454 992 1.1Oceania 27 930 41 285 43 665 57 561 43 653 60 874 5.8Europe 217 168 291 482 314 855 376 814 313 973 383 151 1.7Former U.S.S.R. 277 700 103 019 110 458 127 544 110 458 124 068 -2.7Developed, all 1 047 723 1 072 919 1 166 592 1 361 907 1 166 821 1 363 013 0.1Developing, all 337 599 450 005 524 390 668 396 524 627 676 428 1.2World 1 385 322 1 522 924 1 690 983 2 030 303 1 691 448 2 039 441 0.5
Table 12—Production of industrial roundwood (thousand CUM)
Actual Projection
Base ATL Change (%)
Region 1980 1997 2000 2010 2000 2010 2010
Africa 7 650 8 350 8 565 9 364 8 564 9 425 0.7North and Central America 132 302 181 091 194 210 217 211 195 094 221 358 1.9United States 84 112 111 425 122 568 131 624 122 568 135 751 3.1South America 21 993 30 285 31 696 37 098 31 690 36 961 -0.4Asia 94 718 96 531 101 625 129 154 101 630 124 519 -3.6Oceania 5 801 6 981 7 238 8 287 7 231 8 283 0.0Europe 68 433 89 529 87 398 96 829 86 543 98 968 2.2Former U.S.S.R. 98 200 25 819 25 533 29 410 25 512 29 218 -0.7Developed, all 339 068 321 426 331 581 371 918 331 583 371 573 -0.1Developing, all 90 029 117 160 124 683 155 434 124 681 157 158 1.1World 429 097 438 586 456 264 527 352 456 264 528 731 0.3
Table 13—Production of sawnwood (thousand CUM)
Actual Projection
Base ATL Change (%)
Region 1980 1997 2000 2010 2000 2010 2010
Africa 1 361 1 805 2 006 2 732 2 018 2 793 2.3North and Central America 31 756 50 756 55 180 72 429 55 039 71 084 -1.9United States 26 224 38 502 41 608 53 953 41 465 52 649 -2.4South America 3 574 6 306 6 879 8 134 6 896 8 852 8.8Asia 19 005 45 837 51 197 75 369 51 197 75 364 0.0Oceania 1 197 2 607 2 880 3 809 2 888 4 766 25.1Europe 22 582 43 629 47 126 63 552 47 203 62 273 -2.0Former U.S.S.R. 10 618 4 783 5 018 7 043 5 041 7 692 9.2Developed, all 76 190 108 160 116 966 156 071 116 727 153 687 -1.5Developing, all 13 903 47 563 53 319 76 996 53 555 79 137 2.8World 90 093 155 723 170 286 233 067 170 283 232 824 -0.1
Table 14—Production of wood-based panels (thousand CUM)
Actual Projection
Base ATL Change (%)
Region 1980 1997 2000 2010 2000 2010 2010
44

Africa 1 013 2 253 2 374 3 480 2 374 3 336 -4.1North and Central America 64 894 84 550 91 507 108 653 91 449 108 218 -0.4United States 44 819 59 394 62 211 73 278 62 210 73 441 0.2South America 4 237 9 375 9 493 12 132 9 489 12 203 0.6Asia 11 893 19 431 21 994 32 581 21 991 32 818 0.7Oceania 1 819 2 324 2 508 3 581 2 508 3 628 1.3Europe 25 289 37 458 41 648 50 938 41 763 51 613 1.3Former U.S.S.R. 8 063 3 879 4 042 5 404 4 041 5 478 1.4Developed, all 109 727 140 979 152 228 185 884 152 291 186 009 0.1Developing, all 7 481 18 291 21 338 30 885 21 324 31 285 1.3World 117 208 159 270 173 565 216 768 173 615 217 294 0.2
Table 15—Production of woodpulp (thousand MT)
Actual Projection
Base ATL Change (%)
Region 1980 1997 2000 2010 2000 2010 2010
Africa 1 713 3 162 3 646 5 942 3 649 6 005 1.1North and Central America 72 379 109 037 122 216 163 438 122 229 163 144 -0.2United States 56 839 86 274 97 110 128 219 97 110 128 528 0.2South America 5 579 9 842 11 156 17 603 11 156 17 705 0.6Asia 29 651 85 235 102 908 184 263 102 793 182 194 -1.1Oceania 2 104 3 291 3 766 5 821 3 765 6 291 8.1Europe 39 001 83 729 87 147 120 751 87 259 122 466 1.4Former U.S.S.R. 8 733 3 823 4 192 6 704 4 192 6 611 -1.4Developed, all 139 461 229 718 250 588 344 119 250 713 345 690 0.5Developing, all 19 699 68 401 84 443 160 402 84 331 158 725 -1.0World 159 160 298 119 335 031 504 521 335 044 504 415 0.2
Table 16—Production of total paper and paperboard (thousand MT)
Actual Projection
Base ATL Change (%)
Region 1980 1997 2000 2010 2000 2010 2010
Africa 793 904 902 903 902 965 6.9North and Central America 6 297 10 563 11 925 15 816 11 925 16 745 5.9United States 3 021 2 019 2 214 2 536 2 214 2 543 0.3South America 99 29 133 163 133 164 0.9Asia 70 574 69 549 70 648 92 770 70 437 83 058 -10.5Oceania 8 11 38 49 38 52 7.2Europe 33 756 52 485 54 912 55 035 54 692 54 605 -0.8Former U.S.S.R. 255 815 801 662 801 659 -0.4Developed, all 94 288 111 185 114 762 131 981 114 264 122 759 -7.0Developing, all 17 494 23 171 24 596 33 417 24 663 33 489 0.2World 111 782 134 356 139 358 165 397 138 927 156 248 -5.5
Table 17—Import of industrial roundwood (thousand CUM)
Actual Projection
Base ATL Change (%)
Region 1980 1997 2000 2010 2000 2010 2010
45
Africa 3 169 4 950 5 286 6 385 5 287 6 387 0.0North and Central America 26 303 47 814 41 723 48 699 41 723 45 113 -7.4United States 22 918 43 610 37 093 42 420 37 093 38 846 -8.4South America 1 453 702 808 1 182 808 1 142 -3.4Asia 10 727 23 218 26 203 31 625 26 204 37 946 20.0Oceania 1 075 847 970 1 364 977 1 373 0.7Europe 27 412 37 498 40 555 39 703 41 447 42 861 8.0Former U.S.S.R. 356 632 684 888 684 866 -2.5Developed, all 59 397 97 945 96 738 102 932 97 637 108 856 5.8Developing, all 11 098 17 716 19 491 26 915 19 493 26 832 -0.3World 70 495 115 661 116 229 129 847 117 130 135 688 4.5
Table 18—Import of sawnwood (thousand CUM)
Actual Projection
Base ATL Change (%)
Region 1980 1997 2000 2010 2000 2010 2010
Africa 532 709 754 1 005 741 961 -4.4North and Central America 2 636 10 472 11 165 11 872 11 307 13 383 12.7United States 2 145 8 845 9 360 9 762 9 504 11 207 14.8South America 231 460 490 644 492 644 0.0Asia 2 034 18 926 21 256 30 210 21 403 31 140 3.1Oceania 107 254 288 417 280 409 -1.8Europe 7 429 16 565 18 721 23 860 18 702 25 882 8.5Former U.S.S.R. 187 469 487 695 486 629 -9.6Developed, all 10 469 34 968 38 601 46 400 38 922 51 112 10.2Developing, all 2 687 12 887 14 559 22 302 14 489 21 935 -1.6World 13 156 47 855 53 160 68 702 53 410 73 047 6.3
Table 19—Import of wood-based panels (thousand CUM)
Actual Projection
Base ATL Change (%)
Region 1980 1997 2000 2010 2000 2010 2010
Africa 319 306 325 460 327 497 8.1North and Central America 3 804 6 291 6 840 7 094 6 841 7 015 -1.1United States 3 414 5 704 6 184 6 188 6 185 6 015 -2.8South America 437 783 886 1 046 891 1 084 3.6Asia 3 176 9 786 11 086 11 478 11 079 11 327 -1.3Oceania 279 214 246 246 246 293 19.1Europe 8 079 15 169 15 186 18 584 15 155 19 100 2.8Former U.S.S.R. 221 69 74 82 74 91 11.0Developed, all 14 256 24 826 25 854 28 676 25 818 29 148 1.6Developing, all 2 059 7 792 8 789 10 313 8 796 10 260 -0.5World 16 315 32 618 34 643 38 989 34 614 39 408 1.1
Table 20—Import of woodpulp (thousand MT)
Actual Projection
Base ATL Change (%)
Region 1980 1997 2000 2010 2000 2010 2010
46

Africa 6 182 7 902 8 500 11 579 8 500 11 221 -3.1North and Central America 26 590 20 810 19 714 15 666 19 714 9 669 -38.3United States 22 299 18 243 17 266 14 200 17 266 9 155 -35.5South America 1 154 8 980 10 261 15 903 10 261 15 919 0.1Asia 33 786 13 244 13 344 14 987 13 286 14 995 0.1Oceania 9 101 17 091 18 514 26 561 18 490 28 264 6.4Europe 15 026 26 522 27 422 32 497 27 073 32 475 -0.1Former U.S.S.R. 14 835 25 895 27 693 34 292 27 693 29 793 -13.1Developed, all 64 519 89 595 92 661 107 890 92 288 99 047 -8.2Developing, all 42 155 30 849 32 785 43 595 32 727 43 289 -0.7World 106 674 120 444 125 446 151 485 125 015 142 336 -6.0
Table 22—Export of industrial roundwood (thousand CUM)
Actual Projection
Base ATL Change (%)
Region 1980 1997 2000 2010 2000 2010 2010
Africa 897 1 504 1 515 1 515 1 512 1 531 1.1North and Central America 9 531 18 285 17 415 20 475 17 415 20 395 -0.4United States 8 054 14 381 13 315 15 682 13 315 15 085 -3.8South America 1 175 3 382 3 355 3 249 3 355 3 669 12.9Asia 4 253 18 971 19 136 26 522 19 284 27 644 4.2Oceania 763 1 390 1 491 1 766 1 492 1 609 -8.9Europe 11 970 38 681 43 157 59 383 43 304 59 993 1.0Former U.S.S.R. 905 1 005 979 1 350 979 1 414 4.8Developed, all 22 867 59 827 63 615 83 095 63 764 83 186 0.1Developing, all 6 627 23 391 23 433 31 164 23 579 33 070 6.1World 29 494 83 218 87 048 114 59 87 342 116 256 1.7
Table 21—Import of total paper and paperboard (thousand MT)
Actual Projection
Base ATL Change (%)
Region 1980 1997 2000 2010 2000 2010 2010
Africa 902 1 283 1 205 819 1 205 872 6.5North and Central America 35 466 56 072 58 775 73 479 59 659 74 040 0.8United States 5 834 6 776 7 905 10 353 7 905 10 905 5.3South America 2 551 3 517 3 607 3 499 3 601 3 244 -7.3Asia 7 244 6 126 5 721 4 051 5 728 4 424 9.2Oceania 772 1 248 1 421 2 101 1 421 2 110 0.4Europe 22 380 35 305 33 880 33 575 33 918 38 873 15.8Former U.S.S.R. 7 242 9 144 8 654 9 358 8 632 9 160 -2.1Developed, all 65 617 101 191 102 259 118 330 103 159 123 928 4.7Developing, all 10 940 11 504 11 004 8 551 11 005 8 794 2.8World 76 557 112 695 113 263 126 880 114 164 132 722 4.6
Table 23—Export of sawnwood (thousand CUM)
Actual Projection
Base ATL Change (%)
Region 1980 1997 2000 2010 2000 2010 2010
47

48
Africa 158 483 500 658 500 674 2.4North and Central America 13 806 25 899 28 822 36 134 28 835 35 822 -0.9United States 4 187 11 153 12 827 16 115 12 827 16 087 -0.2South America 337 1 842 1 945 2 827 1 945 2 732 -3.3Asia 1 239 9 156 8 853 10 872 8 874 11 204 3.1Oceania 418 828 929 1 297 929 1 326 2.3Europe 15 917 47 815 48 598 65 167 48 857 67 155 3.1Former U.S.S.R. 1 035 1 589 1 796 1 700 1 796 1 737 2.1Developed, all 32 021 77 447 81 299 105 733 81 572 107 525 1.7Developing, all 889 10 165 10 143 12 921 10 164 13 123 1.6World 32 910 87 612 91 443 118 654 91 736 120 649 1.7
Table 26—Export of total paper and paperboard (thousand MT)
Actual Projection
Base ATL Change (%)
Region 1980 1997 2000 2010 2000 2010 2010
Africa 259 433 469 616 471 659 7.0North and Central America 2 371 11 363 12 876 17 143 12 877 17 208 0.4United States 970 3 226 3 708 4 772 3 708 4 821 1.0South America 566 2 195 2 417 2 070 2 437 2 782 34.4Asia 4 028 16 933 18 383 24 394 18 530 25 757 5.6Oceania 156 889 1 006 1 286 1 006 1 369 6.5Europe 6 879 15 876 17 730 22 789 17 787 24 360 6.9Former U.S.S.R. 956 2 229 2 343 2 466 2 366 2 974 20.6Developed, all 10 541 30 293 33 915 43 721 33 996 45 888 5.0Developing, all 4 674 19 625 21 309 27 043 21 477 29 220 8.1World 15 215 49 918 55 224 70 764 55 473 75 108 6.1
Table 24—Export of wood-based panels (thousand CUM)
Actual Projection
Base ATL Change (%)
Region 1980 1997 2000 2010 2000 2010 2010
Africa 400 777 712 854 712 712 -16.5North and Central America 9 704 16 656 18 388 21 627 18 320 21 349 -1.3United States 2 694 5 813 6 914 8 665 6 914 8 577 -1.0South America 1 307 4 187 3 759 3 630 3 761 3 652 0.6Asia 134 1 500 1 684 1 914 1 694 2 152 12.5Oceania 475 586 637 992 638 921 -7.1Europe 6 528 9 029 9 721 10 567 9 747 10 969 3.8Former U.S.S.R. 821 948 807 597 807 717 20.3Developed, all 17 802 27 735 30 004 34 313 29 963 34 344 0.1Developing, all 1 567 5 948 5 703 5 867 5 716 6 129 4.5World 19 369 33 683 35 707 40 180 35 678 40 473 0.7
Table 25—Export of woodpulp (thousand MT)
Actual Projection
Base ATL Change (%)
Region 1980 1997 2000 2010 2000 2010 2010

The detailed effects of the ATL agreement, by individual product and country are in theappendixes (see footnote 1). Tables 7 through 26 summarize the effects for the world, itsmain regions, and the developed and developing group of countries.
As shown in tables 7 through 11, the world consumption of forest products wouldchange little because of the ATL agreement. The largest relative change at world levelwould be in industrial roundwood, a 0.4-percent increase. This would be tied, in part, toan increase of industrial roundwood consumption of about 1 percent in the UnitedStates. Changes in the United States would be negligible for all other products.
The effects of the ATL on world production are the same as on world consumption, asthey should (see tables 12 through 16). The slight discrepancies between worldproduction and consumption are due to errors in trade statistics, which are maintainedconstant throughout the projections. In the United States, there would be practically noeffect on production. The main changes in the United States would be a 3-percentincrease in sawnwood production under ATL, and a decrease of 2 percent in panelproduction. Production of other products in the United States would be unchanged.
The effects of the ATL agreement would be much more important on trade, in relativeterms than on consumption and production. As shown in tables 17 through 21, worldimports of industrial roundwood would decrease by about 5.5 percent under ATL. Themain decrease (10 percent) would occur in Asia, mostly in Japan as shown by data inthe appendixes. The United States imports of industrial roundwood would be unaffectedby the agreement. World imports of all manufacture products would increase under theATL. World sawnwood and panels imports would rise by 5 to 6 percent, and those of pulpand paper by 1 to 2 percent. United States imports of sawnwood would decrease byabout 8 percent, whereas those of pulp and paper would decrease by 3 to 4 percent. Theonly increase in U.S. imports would be in wood-based panels, but it would be substantialat nearly 15 percent.
At the world level, the effects of the ATL agreement on exports would be the same ason imports, as they should, after adjustment for the discrepancies in import and exportstatistics. The distribution of the changes by region, however, considerably differs. Inparticular, whereas U.S. exports of industrial roundwood were unaffected by the ATL,exports decreased by 35 percent. The major roundwood exporter, the former U.S.S.R.,also would see its exports of industrial roundwood decrease by about 13 percent.Instead, exports of sawnwood and panels from the U.S. would increase by 5 percent and1 percent, respectively. Uunited States. exports of wood pulp would drop by 1 percent,whereas exports of paper and paperboard would remain unchanged. The main gains inexports, in relative terms, would occur in Asia, and to a lesser extent in Europe.
Consumption
Production
Imports
Exports
49

50
Preparation of this report was supported in part by the U.S. Department of Agriculture,Forest Service, Pacific Northwest Research Station, McIntire-Stennis grant N946, andthe School of Natural Resources, University of Wisconsin, Madison. The researchassistance of Wen-Shiuan Chao, Chia-Sheng Liu, and Bintang Simangunsong are alsogratefully acknowledged.
When you know: Multiply by: To find:
Cubic meters (m3) 35.315 Cubic feetMetric tons (M.T.) 1.102 Short tons
English Equivalents
Acknowledgments

Barbier, E.B. 1996. Impact of the Uruguay Round on international trade in forestproducts. Rome: Food and Agriculture Organization of the United Nations. 51 p.
Baudin, A.; Lundberg, L. 1987. A world model of the demand for paper and paperboard.Forest Science. 33(1): 185-196.
Bourke, I.J.; Leitch, J. 1998. Trade restrictions and their impact on international trade inforest products. Rome: Food and Agriculture Organization Forestry Department. 33 p.
Buongiorno, J. 1978. Income and price elasticities in the world demand for paper andpaperboard. Forest Science. 24(2): 231-246.
Buongiorno, J.; Gilless, J.K. 1984. A model of international trade of forest products,with an application to newsprint. Journal of World Forest Resource Management.1: 65-80.
Council on Environment Quality. 1999. Request for public comment regarding theeconomic and environmental effects of tariff elimination in the forest products sector.Federal Register. 64(122): [Pages unknown]. June 25.
Devarajan, S.; Go, D.S.; Lewis, J.D. [and others]. 1997. Simple general equilibriummodeling. In: Francois, J.F.; Reinert, K.A., eds. Applied methods for trade policyanalysis. Cambridge, MA: Cambridge University Press. 560 p.
Food and Agriculture Organization. 1998a. FAO yearbook forest products. Rome.
Food and Agriculture Organization. 1998b. FAO 1998: global fiber supply study. Rome.
Food and Agriculture Organization. 1999. FAOStat, forestry data. Rome.
Gilless, J. K.; Buongiorno, J. 1987. PAPYRUS: a model of the North American pulp andpaper industry. Forest Science Monograph 28.
Ince, P.J. 1994. Recycling and long-range timber outlook. Gen. Tech. Rep. RM-GTR-242.Fort Collins, CO: U.S. Department of Agriculture, Forest Service, Rocky MountainResearch Station. 23 p.
Kallio, M.; Dykstra, D.P.; Binkley, C. 1987. The global forest sector: an analyticalperspective. New York: John Wiley and Sons. [Pages unknown].
Mabee, W.E. 1998. The importance of recovered fiber in global fiber supply. Unasylva.49(193): 31-36.
Zhang, D.; Buongiorno, J.; Ince, P. 1993. PELPS III: a microcomputer price-endogenous linear programming system for economic modeling. Res. Pap. FPL-RP-526. Madison, WI: U.S. Department of Agriculture, Forest Service, Forest ProductsLaboratory. 43 p.
Zhang, D.; Buongiorno, J.; Zhu, S. 1997. Trend and outlook for forest productsconsumption, production and trade in the Asia-Pacific region. Working Paper No.APFSOS/WP/12. Rome: Forestry Policy and Planning Division. [Pages unknown].
Zhu, S.; Tomberlin, D.; Buongiorno, J. 1998. Global forest products consumption,production, trade and prices: global forest products model projections to 2010.Working paper GFPOS/WP/01, Forestry Policy and Planning Division. Rome: Foodand Agriculture Organization. [Pages unknown].
Literature Cited
51

The Forest Service of the U.S. Department of Agriculture is dedicated to the principleof multiple use management of the Nation’s forest resources for sustained yields ofwood, water, forage, wildlife, and recreation. Through forestry research, cooperationwith the States and private forest owners, and management of the National Forestsand National Grasslands, it strives—as directed by Congress—to provide increasinglygreater service to a growing Nation.
The U.S. Department of Agriculture (USDA) prohibits discrimination in all its programsand activities on the basis of race, color, national origin, gender, religion, age, disability,political beliefs, sexual orientation, or marital or family status. (Not all prohibited basesapply to all programs.) Persons with disabilities who require alternative means forcommunication of program information (Braille, large print, audiotape, etc.) shouldcontact USDA’s TARGET Center at (202) 720-2600 (voice and TDD).
To file a complaint of discrimination, write USDA, Director, Office of Civil Rights,Room 326-W, Whitten Building, 14th and Independence Avenue, SW, Washington, DC20250-9410 or call (202) 720-5964 (voice and TDD). USDA is an equal opportunityprovider and employer.
Pacific Northwest Research Station
Web site http://www.fs.fed.us/pnwTelephone (503) 808-2592Publication requests (503) 808-2138FAX (503) 808-2130E-mail [email protected] address Publications Distribution
Pacific Northwest Research StationP.O. Box 3890Portland, OR 97208-3890


![[Type text] 2015 · Levelized Tariff for Solar Thermal Projects not availing accelerated depreciation Without accelerated depreciation benefit INR 13.23 per kWh for 25 years GERC](https://img.pdfslide.net/doc/110x75/5ec623e759740a007745fa9c/type-text-2015-levelized-tariff-for-solar-thermal-projects-not-availing-accelerated.jpg)