Embed Size (px)
Citation preview
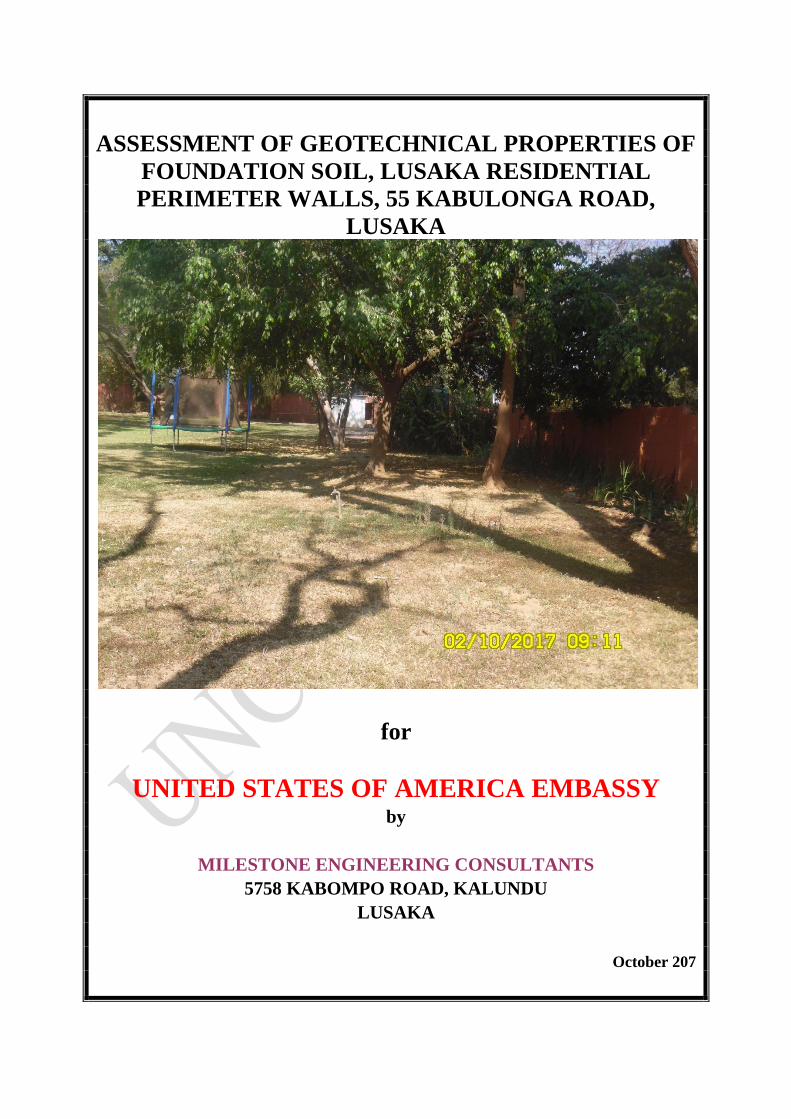
ASSESSMENT OF GEOTECHNICAL PROPERTIES OF
FOUNDATION SOIL, LUSAKA RESIDENTIAL
PERIMETER WALLS, 55 KABULONGA ROAD,
LUSAKA
for
UNITED STATES OF AMERICA EMBASSY by
MILESTONE ENGINEERING CONSULTANTS
5758 KABOMPO ROAD, KALUNDU
LUSAKA
October 207
ii
Table of Contents Page No.
1 Introduction .................................................................................................................................................. 1
1.1 Background and Reconnaissance survey ............................................................................................ 1
1.2 Tests Conducted ................................................................................................................................... 2
1.3 Location of Trial Pits ........................................................................................................................... 3
2 Trial Pitting, Sampling and Field Testing .................................................................................................. 3
3 Geotechnical Test Results ............................................................................................................................ 3
3.1 Description of Soil Profiles from the excavated trial pits ................................................................... 3
3.2 Grading Analysis .................................................................................................................................. 6
3.3 Atterberg Limits .................................................................................................................................... 6
3.4 Confirmation of the Soil Classification by the Unified Classification System ................................... 7
3.5 Shrinkage Test ...................................................................................................................................... 7
3.6 Penetration Test Results ....................................................................................................................... 8 3.6.1 Standard Penetration Test (SPT) ....................................................................................................... 8 3.6.2 Dynamic Penetration Super Heavy (DPSH) Test ............................................................................. 9 3.6.3 Angle of Internal Friction ............................................................................................................... 13
4 Conclusion and Recommendations on Geotechnical Properties............................................................. 14
BIBLIOGRAPHY ............................................................................................................................................... 15
APPENDICES
Appendix 1 Sieve Analysis
Appendix 2 Atterberg Limits
Appendix 3 Unified Classification Chart
Appendix 4 Charts for estimating Bearing Capacity and Angle of Internal Friction
1
1 Introduction
1.1 Background and Reconnaissance survey
Through a communication of October 2017, the US Embassy requested
Geotechnical Investigations of foundation soils for the proposed Lusaka
Residential Perimeter Walls on property 55 Kabulonga Road, Lusaka, Zambia.
A reconnaissance survey was conducted on 2nd
October 2017 and the field
investigations were conducted starting the same day. Laboratory testing was
conducted after collection of soil samples.
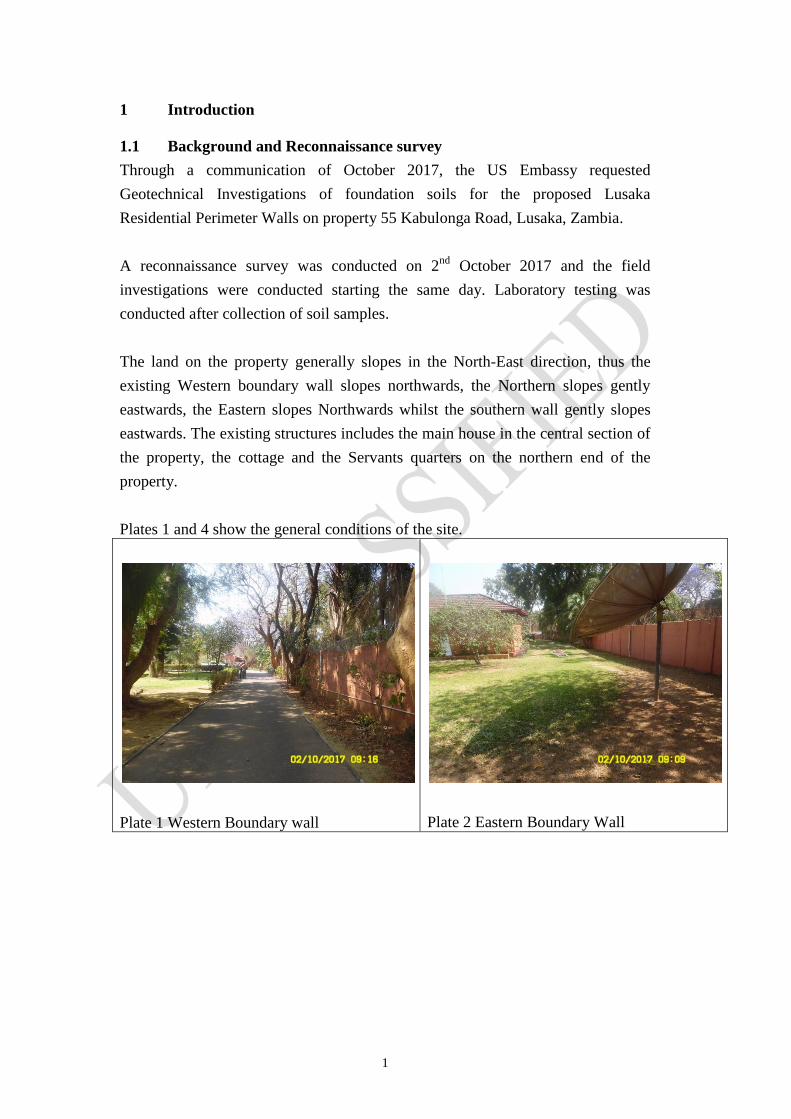
The land on the property generally slopes in the North-East direction, thus the
existing Western boundary wall slopes northwards, the Northern slopes gently
eastwards, the Eastern slopes Northwards whilst the southern wall gently slopes
eastwards. The existing structures includes the main house in the central section of
the property, the cottage and the Servants quarters on the northern end of the
property.
Plates 1 and 4 show the general conditions of the site.
Plate 1 Western Boundary wall
Plate 2 Eastern Boundary Wall
2
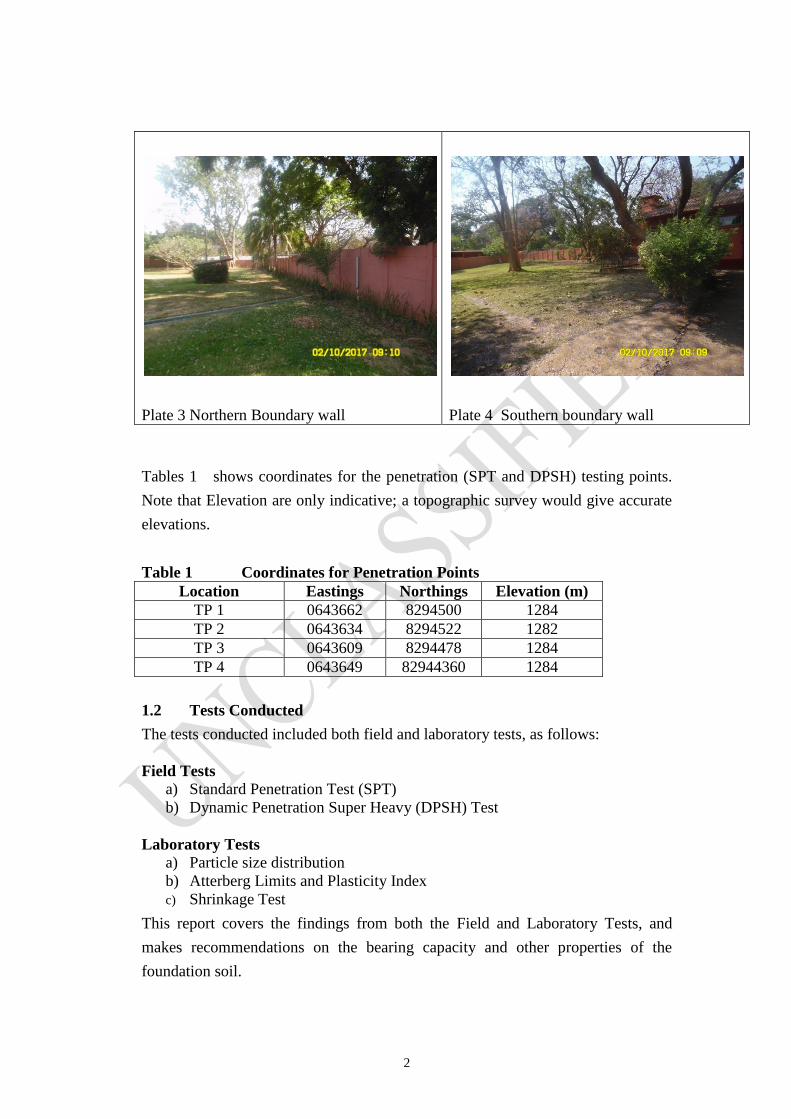
Plate 3 Northern Boundary wall
Plate 4 Southern boundary wall
Tables 1 shows coordinates for the penetration (SPT and DPSH) testing points.
Note that Elevation are only indicative; a topographic survey would give accurate
elevations.
Table 1 Coordinates for Penetration Points
Location Eastings Northings Elevation (m)
TP 1 0643662 8294500 1284
TP 2 0643634 8294522 1282
TP 3 0643609 8294478 1284
TP 4 0643649 82944360 1284
1.2 Tests Conducted
The tests conducted included both field and laboratory tests, as follows:
Field Tests
a) Standard Penetration Test (SPT)
b) Dynamic Penetration Super Heavy (DPSH) Test
Laboratory Tests
a) Particle size distribution
b) Atterberg Limits and Plasticity Index
c) Shrinkage Test
This report covers the findings from both the Field and Laboratory Tests, and
makes recommendations on the bearing capacity and other properties of the
foundation soil.
3
1.3 Location of Trial Pits
Four trial pits were dug on the proposed site, using hand excavation. The trial pits
were sited as per coordinates presented in Table 1, to a maximum depth of 1.5m.
2 Trial Pitting, Sampling and Field Testing
The pits were identified as TP 1 to TP 4. The trial pits were located on the
western, northern, eastern and southern walls, respectively.
The Standard Penetration Tests (SPTs) were conducted at a depth of 1.5m. The
Dynamic Penetration Super Heavy (DPSH) Test was conducted at all the four
locations, next to each trial pit.
The water table was found to be lower than the maximum depth of 1.5m from the
ground surface.
3 Geotechnical Test Results
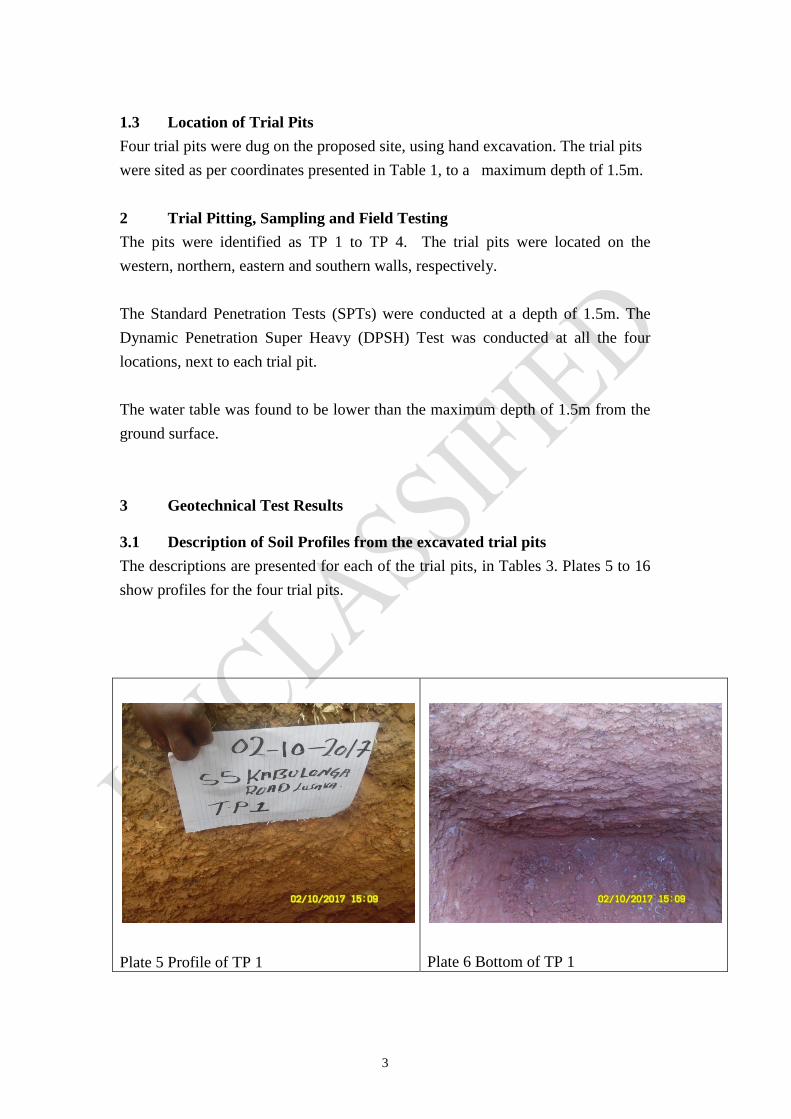
3.1 Description of Soil Profiles from the excavated trial pits
The descriptions are presented for each of the trial pits, in Tables 3. Plates 5 to 16
show profiles for the four trial pits.
Plate 5 Profile of TP 1
Plate 6 Bottom of TP 1
4
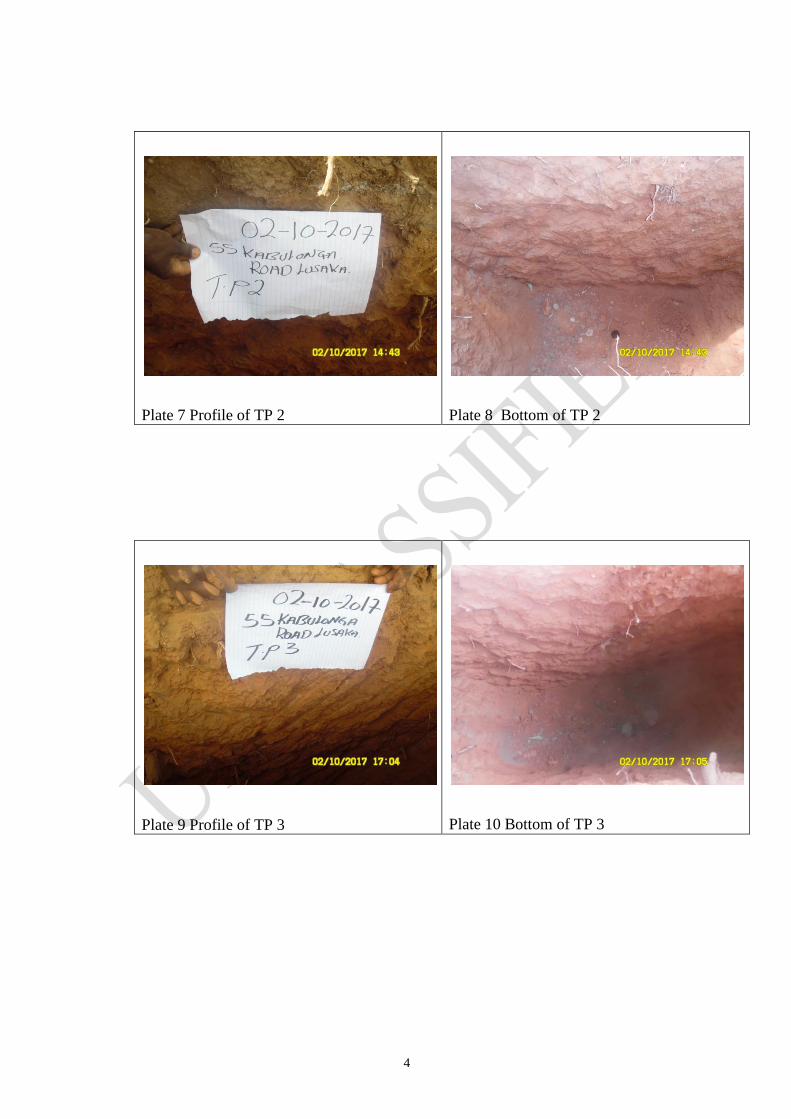
Plate 7 Profile of TP 2
Plate 8 Bottom of TP 2
Plate 9 Profile of TP 3
Plate 10 Bottom of TP 3
5
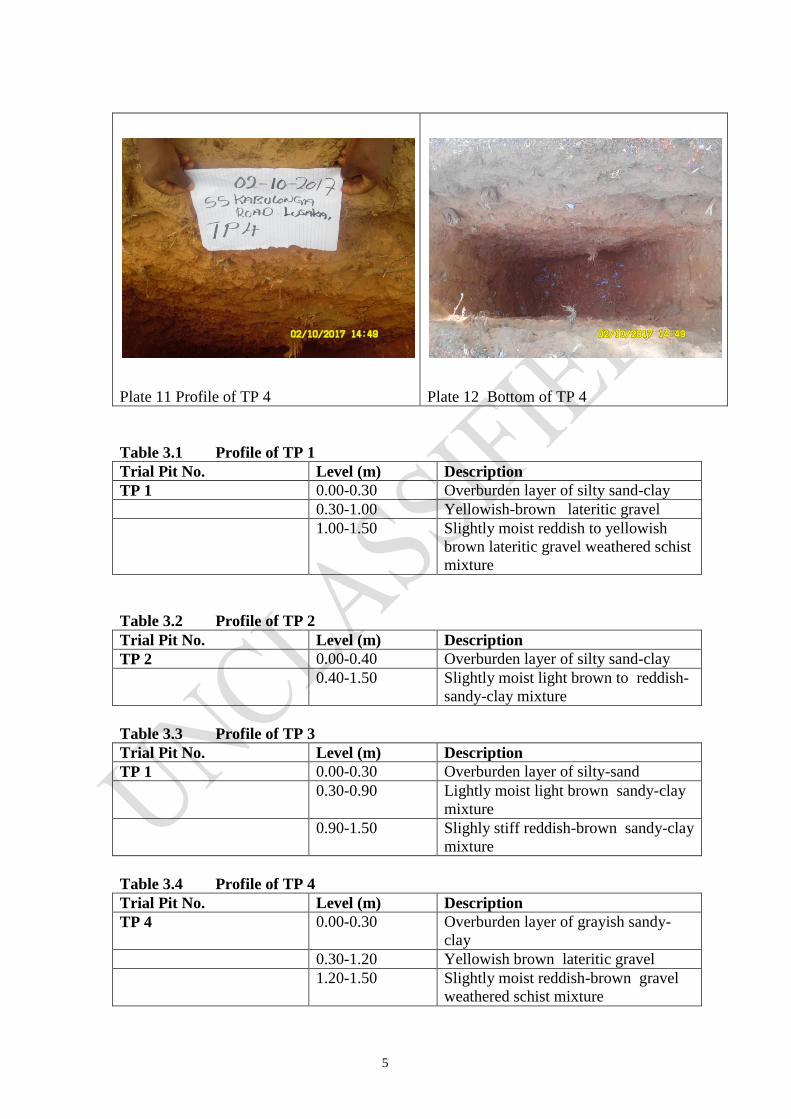
Plate 11 Profile of TP 4
Plate 12 Bottom of TP 4
Table 3.1 Profile of TP 1
Trial Pit No. Level (m) Description
TP 1 0.00-0.30 Overburden layer of silty sand-clay
0.30-1.00 Yellowish-brown lateritic gravel
1.00-1.50 Slightly moist reddish to yellowish
brown lateritic gravel weathered schist
mixture
Table 3.2 Profile of TP 2
Trial Pit No. Level (m) Description
TP 2 0.00-0.40 Overburden layer of silty sand-clay
0.40-1.50 Slightly moist light brown to reddish-
sandy-clay mixture
Table 3.3 Profile of TP 3
Trial Pit No. Level (m) Description
TP 1 0.00-0.30 Overburden layer of silty-sand
0.30-0.90 Lightly moist light brown sandy-clay
mixture
0.90-1.50 Slighly stiff reddish-brown sandy-clay
mixture
Table 3.4 Profile of TP 4
Trial Pit No. Level (m) Description
TP 4 0.00-0.30 Overburden layer of grayish sandy-
clay
0.30-1.20 Yellowish brown lateritic gravel
1.20-1.50 Slightly moist reddish-brown gravel
weathered schist mixture
6
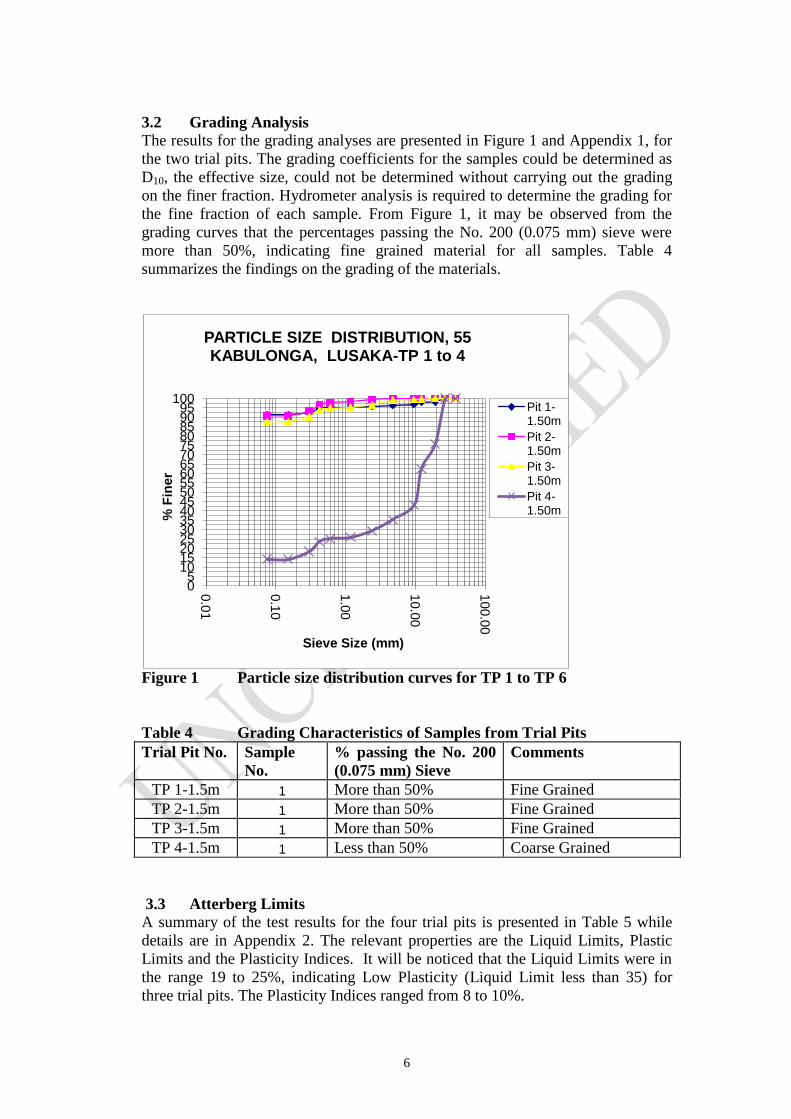
3.2 Grading Analysis
The results for the grading analyses are presented in Figure 1 and Appendix 1, for
the two trial pits. The grading coefficients for the samples could be determined as
D10, the effective size, could not be determined without carrying out the grading
on the finer fraction. Hydrometer analysis is required to determine the grading for
the fine fraction of each sample. From Figure 1, it may be observed from the
grading curves that the percentages passing the No. 200 (0.075 mm) sieve were
more than 50%, indicating fine grained material for all samples. Table 4
summarizes the findings on the grading of the materials.
Figure 1 Particle size distribution curves for TP 1 to TP 6
Table 4 Grading Characteristics of Samples from Trial Pits
Trial Pit No. Sample
No.
% passing the No. 200
(0.075 mm) Sieve
Comments
TP 1-1.5m 1 More than 50% Fine Grained
TP 2-1.5m 1 More than 50% Fine Grained
TP 3-1.5m 1 More than 50% Fine Grained
TP 4-1.5m 1 Less than 50% Coarse Grained
3.3 Atterberg Limits
A summary of the test results for the four trial pits is presented in Table 5 while
details are in Appendix 2. The relevant properties are the Liquid Limits, Plastic
Limits and the Plasticity Indices. It will be noticed that the Liquid Limits were in
the range 19 to 25%, indicating Low Plasticity (Liquid Limit less than 35) for
three trial pits. The Plasticity Indices ranged from 8 to 10%.
0 5
10 15 20 25 30 35 40 45 50 55 60 65 70 75 80 85 90 95
100
0.0
1
0.1
0
1.0
0
10.0
0
100.0
0
% F
iner
Sieve Size (mm)
PARTICLE SIZE DISTRIBUTION, 55 KABULONGA, LUSAKA-TP 1 to 4
Pit 1-1.50m
Pit 2-1.50m
Pit 3-1.50m
Pit 4-1.50m
7
Table 5 Atterberg Limits
Trial Pit No. Liquid
Limit (%)
Plastic
Limit (%)
Plasticity
Index
TP 1-1.5m 35 25 10
TP 2-1.5m 28 20 8
TP 3-1.5m 27 19 8
TP 4-1.5m 38 - -
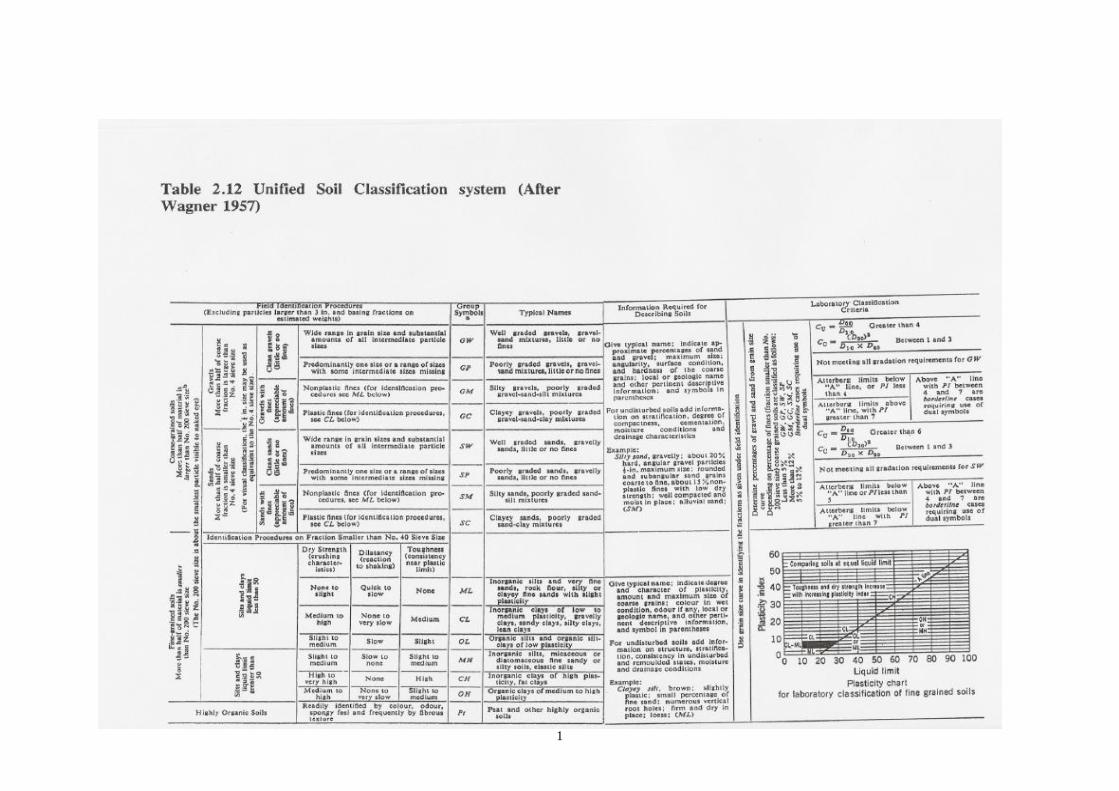
3.4 Confirmation of the Soil Classification by the Unified Classification
System
The Unified Classification chart is presented in Appendix 3. The classifications
were determined, based on the Liquid Limits and the Plasticity Indices. Table 6
summarizes the classifications, based on the Unified Classification system.
Table 6 Unified Classification
Trial Pit
No.
LL
(%)
PI
(%)
Position
relative
to A-line
Unified Classification
TP 1-1.5m 35 10 Below CL or ML- Inorganic Sandy-clays
or Silty-Clays of Low Plasticity.
TP 2-1.5m 28 8 Above CL - Inorganic Sandy-Clays of
Low plasticity.
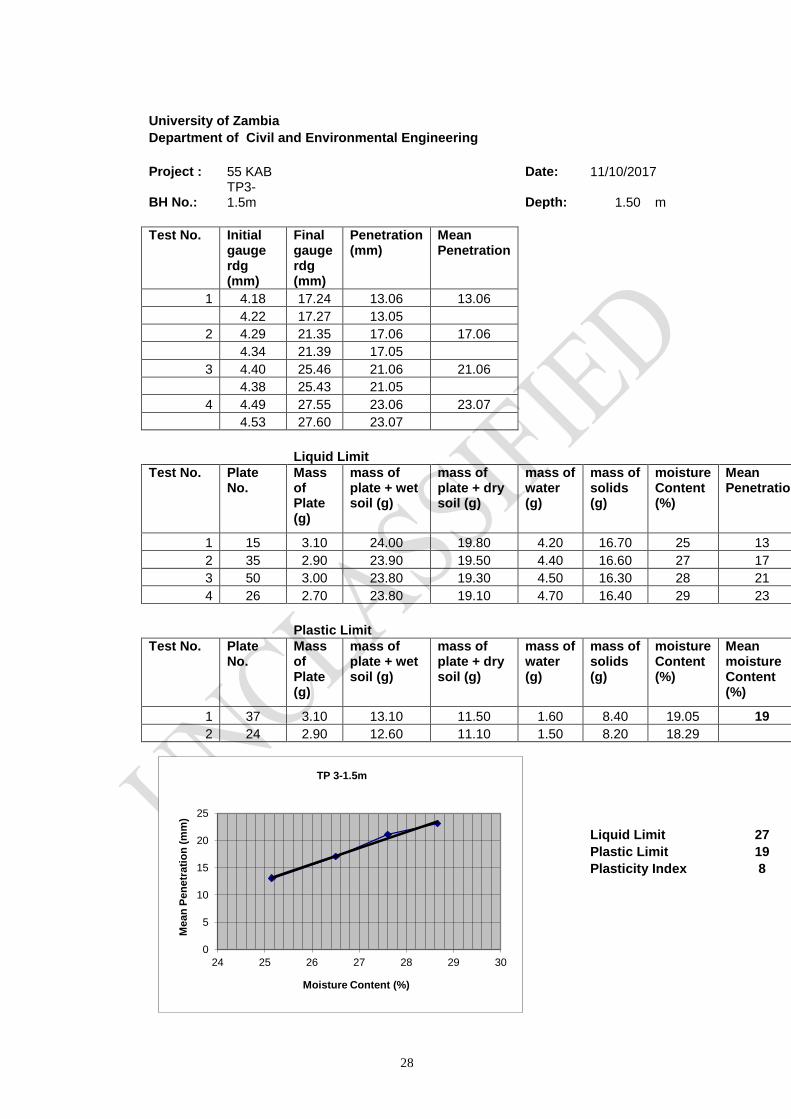
TP 3-1.5m 27 8 Above CL - Inorganic Sandy-Clays of
Low plasticity.
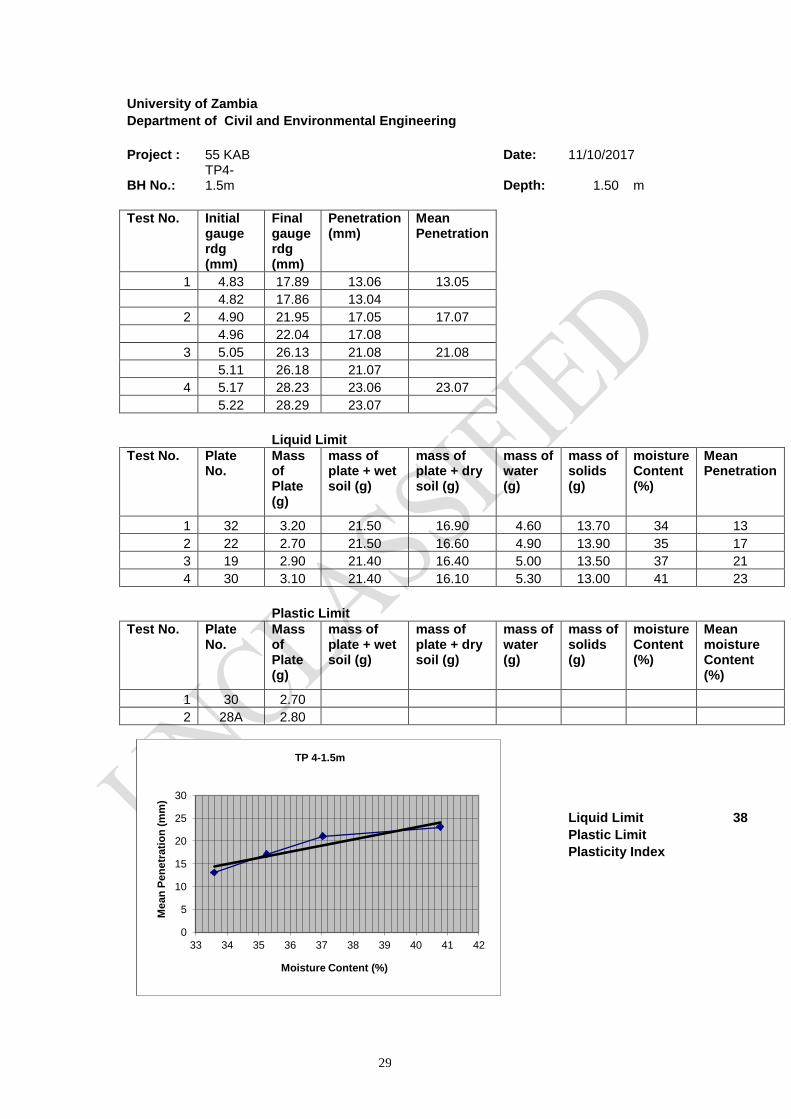
TP 4-1.5m 38 - - -
The samples indicated Low Plasticity and based on the Unified Classification
Chart, the samples may be classified as CL or ML-Inorganic Sandy-Clays or Silty-
Clays of Low plasticity. The sample from TP 4 was too coarse to be classified.
3.5 Shrinkage Test
The shrinkage values give an indication of the settlement characteristics of
foundation soils. The higher the plasticity of the soil, the higher the shrinkage
value. Table 7 summarizes the results of the shrinkage test at the indicated depths
for the four trial holes.
Table 7 Shrinkage Values
Sample
No.
Dept
h (m)
Total
mass
dry
sample
(g)
Mass of
material
passing
the 425um
Sieve
% Mass of
material
passing the
425um Sieve
Initial
Length of
specimen
(A), mm
Length of
Oven Dry
Specimen
(B), mm
Linear
Shrinkag
e (%)
100(1-
B/A)
TP 1-1.5m 1.5 150.00 50.00 140 132 5.71
TP 2-1.5m 1.5 150.00 50.00 140 131 6.43
TP 3-1.5m 1.5 150.00 50.00 140 132 5.71
TP 4-1.5m 1.5 150.00 50.00 140 136 2.86
8
It will be noted that the shrinkage value ranged from 3 to 6 percent, averaging 5%.
This value is acceptable in view of the clayey-sand foundation materials.
3.6 Penetration Test Results
The penetration test was conducted using a tripod, 63.5 kg hammer and
corresponding penetration heads. The Continuous Dynamic Penetration Test
(DPSH) apparatus was used and the number of blows was correlated to the safe
bearing capacity of the soil at various points. The test points were located close to
the trial pits. For these, the tests were conducted from the soil surface to the
required depth, or refusal, at depth increments of 0.3m. For the Standard
Penetration Test (SPT), the depth was conducted at the indicated maximum
excavated depth for each trial pit.
The recorded N values from the SPT were not corrected for effective overburden
pressure to arrive at the bearing capacity.
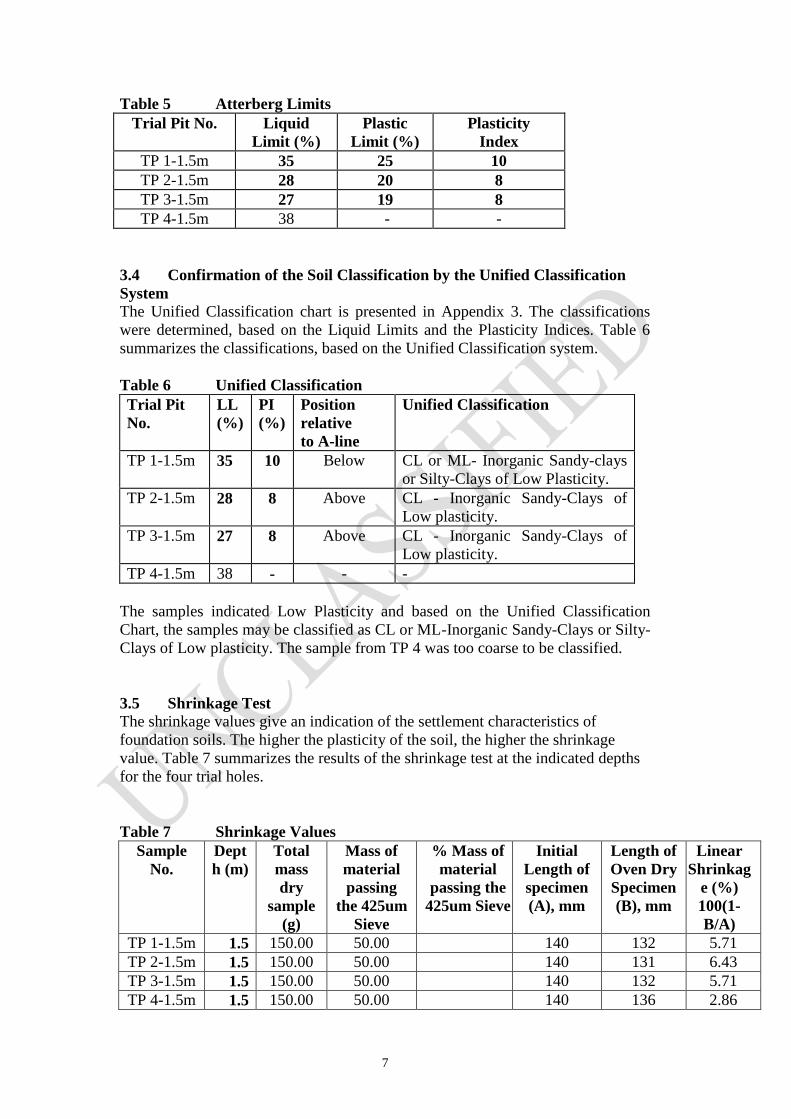
3.6.1 Standard Penetration Test (SPT)
This test was conducted at the indicated depth for each trial pit. Plates 13 to 16
show the SPT in progress whilst the test results and estimated safe bearing
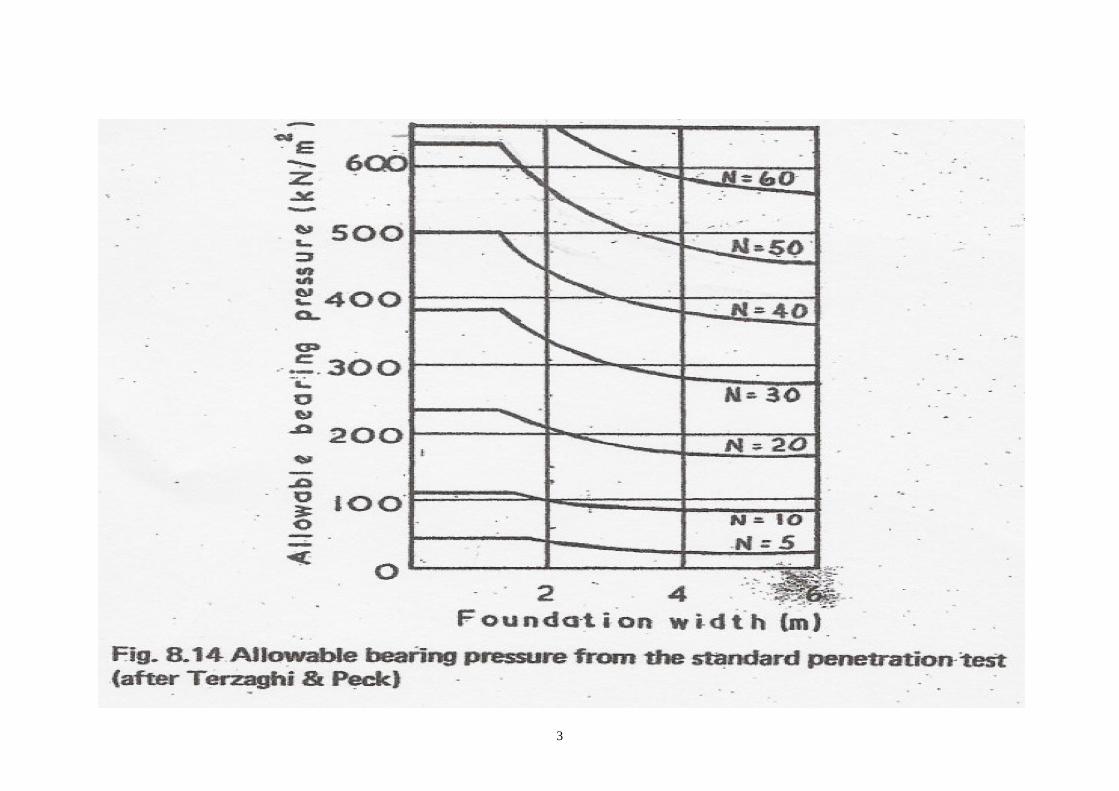
strengths are presented in Table 7. The bearing capacity values are estimated from
the attached charts in Appendix 5, after Terzaghi and Peck.
Plate 13 SPT in progress
Plate 14 SPT in progress
9
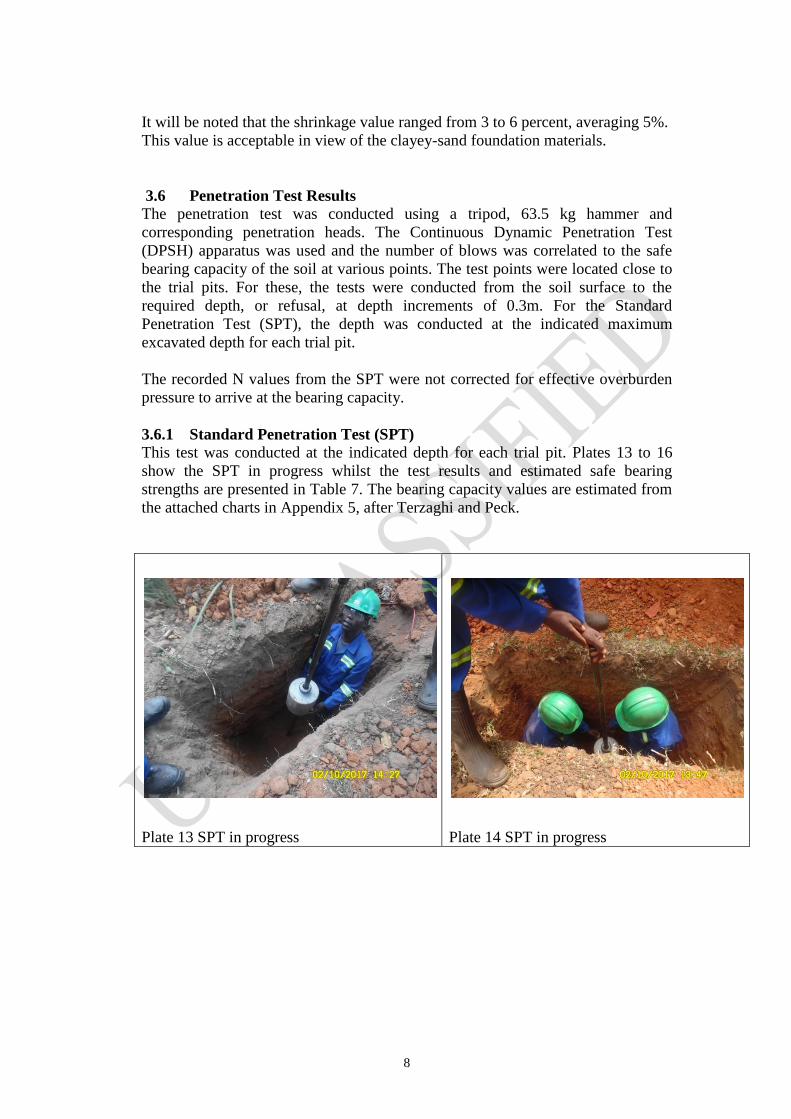
Plate 15 SPT in progress
Plate 16 Material from the Split Spoon
sampler
Table 7 Bearing capacity estimated from Standard Penetration Test
(SPT)
Trial Pit
No.
Depth
(m)
N value Bearing
Capacity (kPa)
TP 1-1.5m 1.50 16 195
TP 2-1.5m 1.50 9 100
TP 3-1.5m 1.50 21 245
TP 4-1.5m 1.50 20 230
It will be observed that the bearing capacities at 1.5m ranged from 100 to 245 kPa.
The lowest value of 100 kPa may be due to the relatively moist conditions of the
soil at location of TP 2.
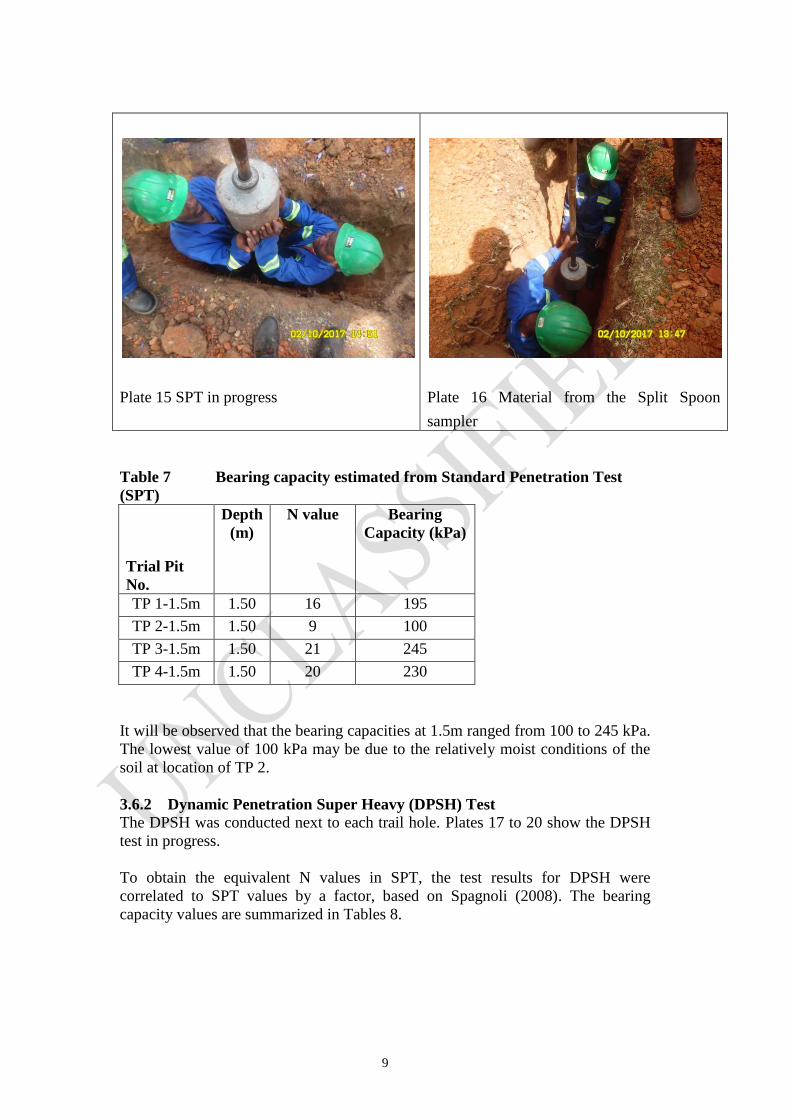
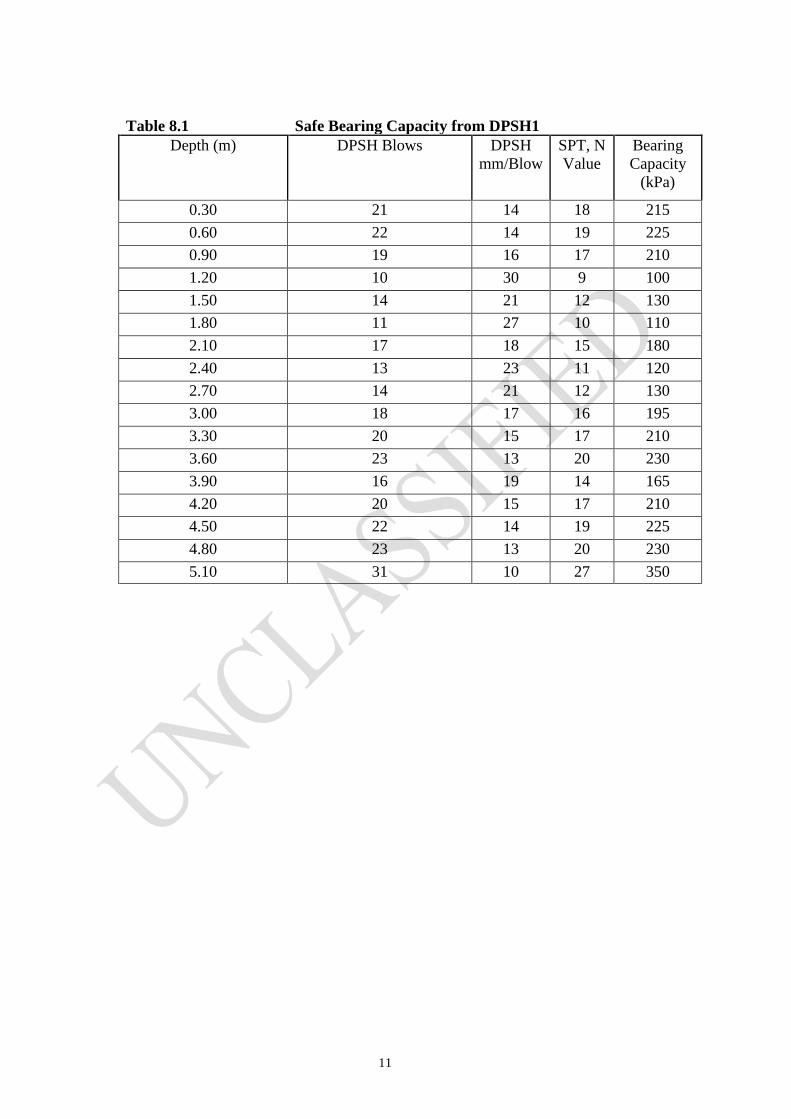
3.6.2 Dynamic Penetration Super Heavy (DPSH) Test
The DPSH was conducted next to each trail hole. Plates 17 to 20 show the DPSH
test in progress.
To obtain the equivalent N values in SPT, the test results for DPSH were
correlated to SPT values by a factor, based on Spagnoli (2008). The bearing
capacity values are summarized in Tables 8.
10
Plate 17 DPSH test in progress at Point 1
Plate 18 DPSH test in progress at Point 2
Plate 19 DPSH test in progress at Point 3
Plate 20 DPSH test in progress at Point 4
11
Table 8.1 Safe Bearing Capacity from DPSH1 Depth (m) DPSH Blows DPSH
mm/Blow
SPT, N
Value
Bearing
Capacity
(kPa)
0.30 21 14 18 215
0.60 22 14 19 225
0.90 19 16 17 210
1.20 10 30 9 100
1.50 14 21 12 130
1.80 11 27 10 110
2.10 17 18 15 180
2.40 13 23 11 120
2.70 14 21 12 130
3.00 18 17 16 195
3.30 20 15 17 210
3.60 23 13 20 230
3.90 16 19 14 165
4.20 20 15 17 210
4.50 22 14 19 225
4.80 23 13 20 230
5.10 31 10 27 350
12
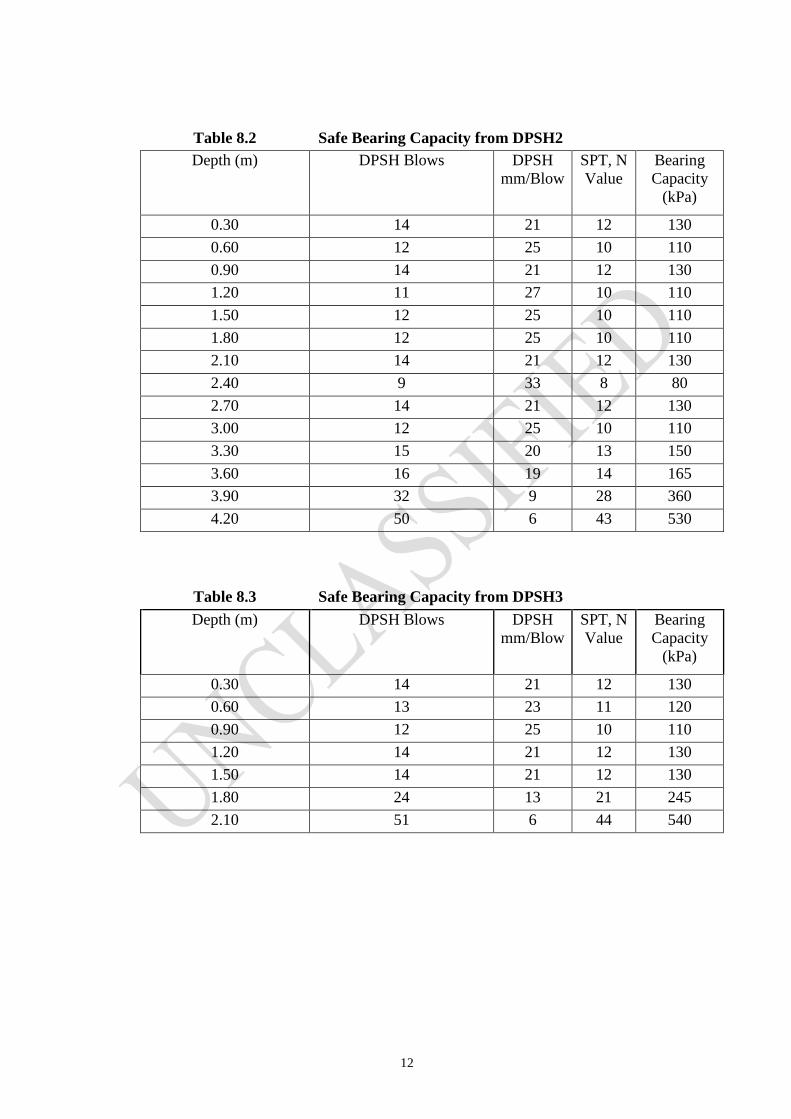
Table 8.2 Safe Bearing Capacity from DPSH2
Depth (m) DPSH Blows DPSH
mm/Blow
SPT, N
Value
Bearing
Capacity
(kPa)
0.30 14 21 12 130
0.60 12 25 10 110
0.90 14 21 12 130
1.20 11 27 10 110
1.50 12 25 10 110
1.80 12 25 10 110
2.10 14 21 12 130
2.40 9 33 8 80
2.70 14 21 12 130
3.00 12 25 10 110
3.30 15 20 13 150
3.60 16 19 14 165
3.90 32 9 28 360
4.20 50 6 43 530
Table 8.3 Safe Bearing Capacity from DPSH3
Depth (m) DPSH Blows DPSH
mm/Blow
SPT, N
Value
Bearing
Capacity
(kPa)
0.30 14 21 12 130
0.60 13 23 11 120
0.90 12 25 10 110
1.20 14 21 12 130
1.50 14 21 12 130
1.80 24 13 21 245
2.10 51 6 44 540
13
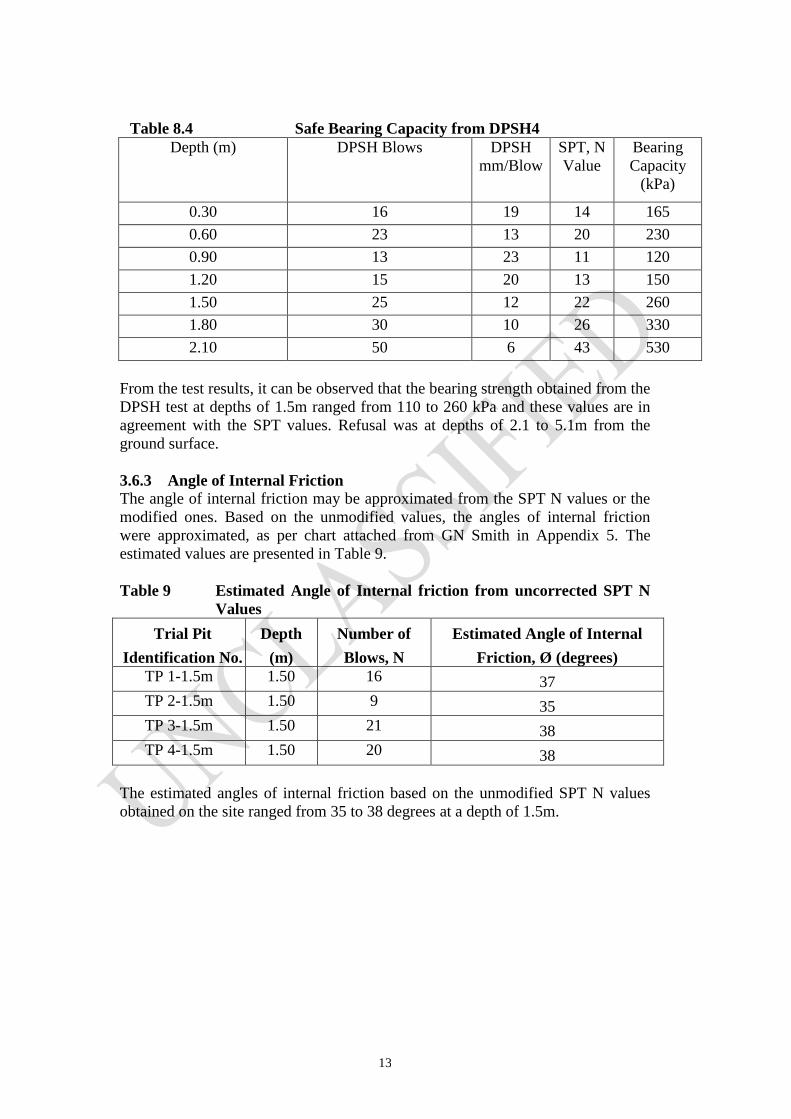
Table 8.4 Safe Bearing Capacity from DPSH4 Depth (m) DPSH Blows DPSH
mm/Blow
SPT, N
Value
Bearing
Capacity
(kPa)
0.30 16 19 14 165
0.60 23 13 20 230
0.90 13 23 11 120
1.20 15 20 13 150
1.50 25 12 22 260
1.80 30 10 26 330
2.10 50 6 43 530
From the test results, it can be observed that the bearing strength obtained from the
DPSH test at depths of 1.5m ranged from 110 to 260 kPa and these values are in
agreement with the SPT values. Refusal was at depths of 2.1 to 5.1m from the
ground surface.
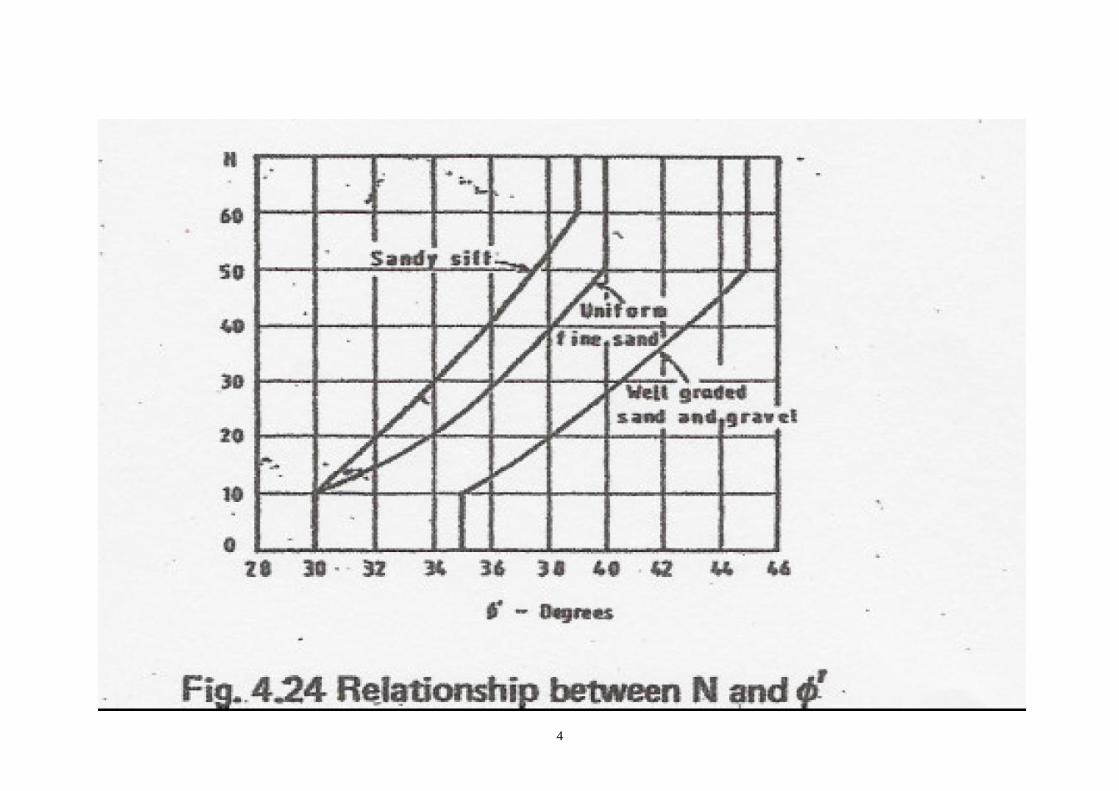
3.6.3 Angle of Internal Friction
The angle of internal friction may be approximated from the SPT N values or the
modified ones. Based on the unmodified values, the angles of internal friction
were approximated, as per chart attached from GN Smith in Appendix 5. The
estimated values are presented in Table 9.
Table 9 Estimated Angle of Internal friction from uncorrected SPT N
Values
Trial Pit
Identification No.
Depth
(m)
Number of
Blows, N
Estimated Angle of Internal
Friction, Ø (degrees)
TP 1-1.5m 1.50 16 37
TP 2-1.5m 1.50 9 35
TP 3-1.5m 1.50 21 38
TP 4-1.5m 1.50 20 38
The estimated angles of internal friction based on the unmodified SPT N values
obtained on the site ranged from 35 to 38 degrees at a depth of 1.5m.
14
4 Conclusion and Recommendations on Geotechnical Properties
The trial pits at the proposed site indicated that the water table was lower than the
1.5m depth from the ground surface.
From the grain size distribution characteristics of the samples, the trial pits
exhibited fine grained material, at 1.5m depth, for three trial pits. One trial pit
exhibited coarse grained texture.
The samples indicated Low Plasticity and based on the Unified Classification
Chart, the samples may be classified as CL or ML-Inorganic Sandy-Clays or Silty-
Clays of Low plasticity. The sample from TP 4 was too coarse to be classified.
The shrinkage values averaged 5%, which appear reasonable for the Silty-clay or
sandy-clay soil at 1.5m depth.
The SPT indicated bearing capacity values of the range 100 to 245 kPa, at a depth
of 1.5m. The DPSH test indicated bearing values of 100 to 210 kPa at a depth of
1.5m. Thus the SPT and the DPSH tests gave similar results. Refusal was at depths
2.1 to 4.2m from the ground surface. Thus a minimum bearing capacity of 100 kPa
may be assumed for the site.
The estimated angles of internal friction ranged from 35 to 38 Degrees, at a depth
of 1.5m.
15
BIBLIOGRAPHY
Bowles, J E (1982), Foundation Analysis and Design, McGraw Hill Book
Company, USA.
BSI 1377 (1990), Methods of test for soils for Civil Engineering purposes, British
Standards Institution, UK.
BSI 5930 (1981), Code of Practice for Site Investigations, British Standards
Institution, UK
Fleming, WGK et al (1985), Piling Engineering, Surrey University Press, UK.
Gulhati, SK, Engineering Properties of Soils, TATA McGrall-Hill Publishing
Company, 1978.
Smith, GN, Elements of Soil Mechanics for Civil and Mining Engineers, 5th
Edition, Granada publishing Limited, 1982.
Taylor, GD, Construction materials, 1st Edition, Longman Scientific and
Technical, 1991.
Tomlison MJ (1986), Foundation Design and Construction, 5th
Edition, Longman
Group Ltd, UK.
TRRL/ODA (1992), Overseas Road Note 9, A Design Manual for Small Bridges,
TRRL.

16
APPENDIX 1 SIEVE ANALYSES
17
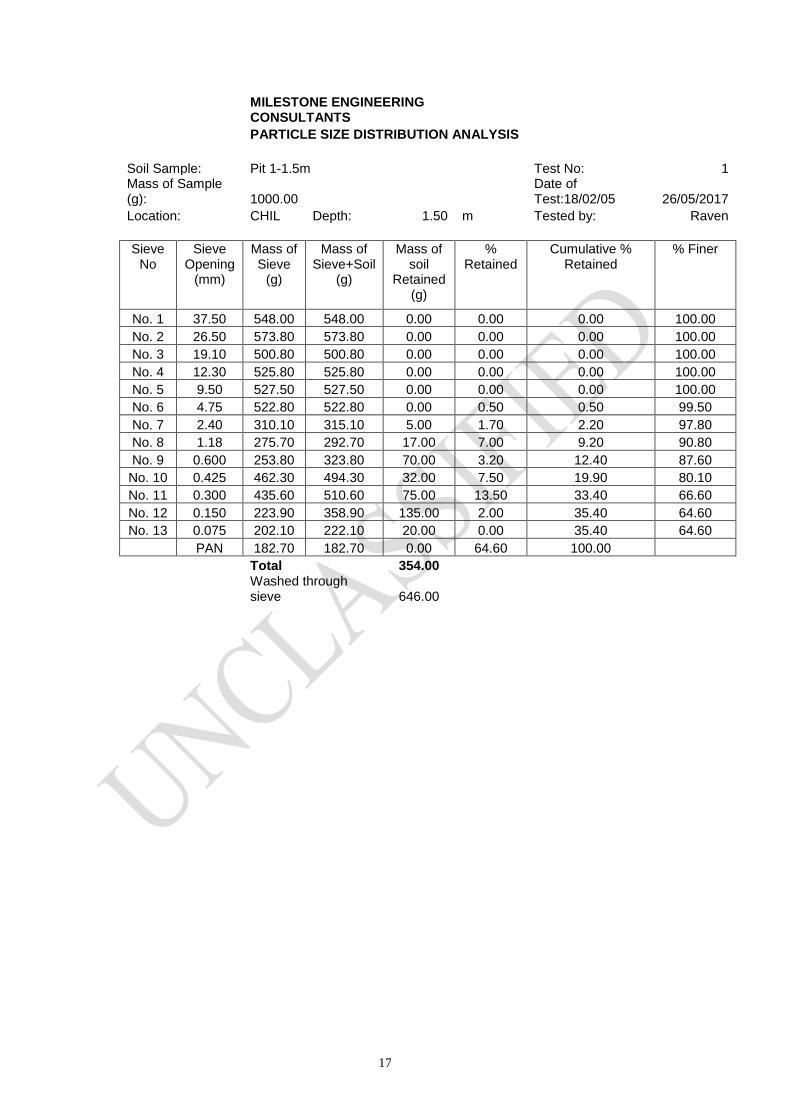
MILESTONE ENGINEERING CONSULTANTS
PARTICLE SIZE DISTRIBUTION ANALYSIS
Soil Sample: Pit 1-1.5m
Test No: 1 Mass of Sample (g): 1000.00
Date of Test:18/02/05 26/05/2017
Location: CHIL Depth: 1.50 m Tested by: Raven
Sieve No
Sieve Opening
(mm)
Mass of Sieve
(g)
Mass of Sieve+Soil
(g)
Mass of soil
Retained (g)
% Retained
Cumulative % Retained
% Finer
No. 1 37.50 548.00 548.00 0.00 0.00 0.00 100.00
No. 2 26.50 573.80 573.80 0.00 0.00 0.00 100.00
No. 3 19.10 500.80 500.80 0.00 0.00 0.00 100.00
No. 4 12.30 525.80 525.80 0.00 0.00 0.00 100.00
No. 5 9.50 527.50 527.50 0.00 0.00 0.00 100.00
No. 6 4.75 522.80 522.80 0.00 0.50 0.50 99.50
No. 7 2.40 310.10 315.10 5.00 1.70 2.20 97.80
No. 8 1.18 275.70 292.70 17.00 7.00 9.20 90.80
No. 9 0.600 253.80 323.80 70.00 3.20 12.40 87.60
No. 10 0.425 462.30 494.30 32.00 7.50 19.90 80.10
No. 11 0.300 435.60 510.60 75.00 13.50 33.40 66.60
No. 12 0.150 223.90 358.90 135.00 2.00 35.40 64.60
No. 13 0.075 202.10 222.10 20.00 0.00 35.40 64.60
PAN 182.70 182.70 0.00 64.60 100.00
Total
354.00
Washed through sieve 646.00
18
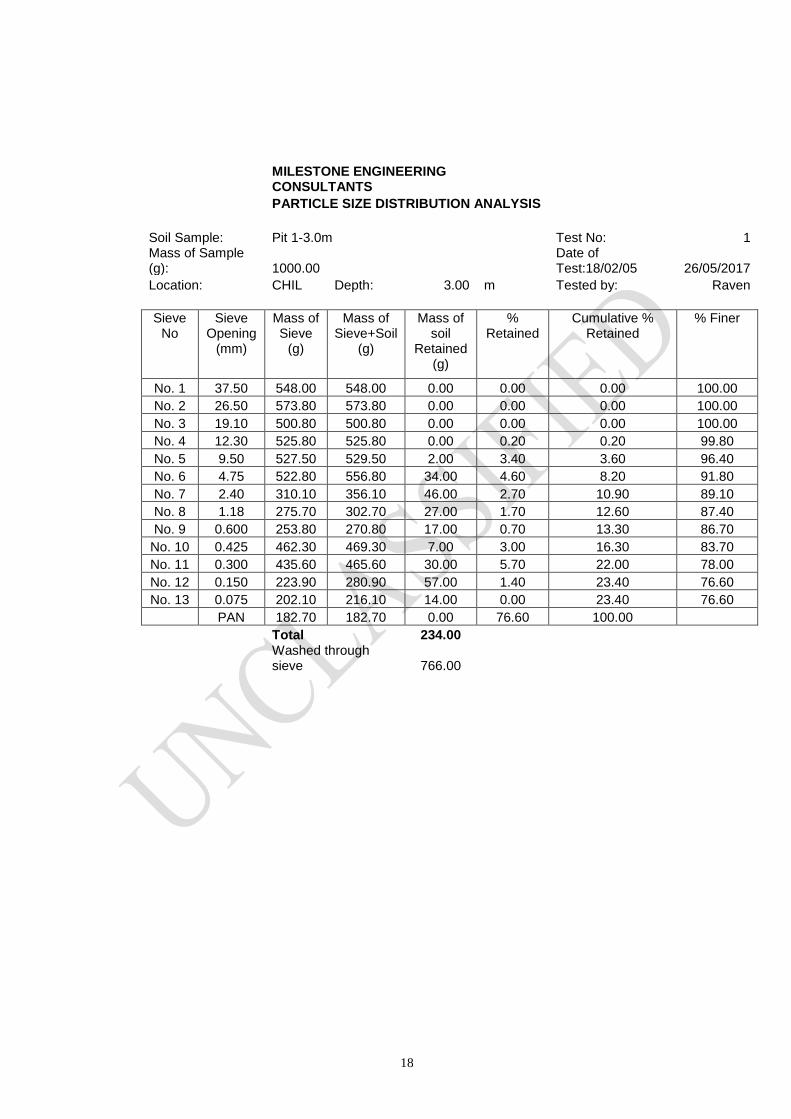
MILESTONE ENGINEERING CONSULTANTS
PARTICLE SIZE DISTRIBUTION ANALYSIS
Soil Sample: Pit 1-3.0m
Test No: 1 Mass of Sample (g): 1000.00
Date of Test:18/02/05 26/05/2017
Location: CHIL Depth: 3.00 m Tested by: Raven
Sieve No
Sieve Opening
(mm)
Mass of Sieve
(g)
Mass of Sieve+Soil
(g)
Mass of soil
Retained (g)
% Retained
Cumulative % Retained
% Finer
No. 1 37.50 548.00 548.00 0.00 0.00 0.00 100.00
No. 2 26.50 573.80 573.80 0.00 0.00 0.00 100.00
No. 3 19.10 500.80 500.80 0.00 0.00 0.00 100.00
No. 4 12.30 525.80 525.80 0.00 0.20 0.20 99.80
No. 5 9.50 527.50 529.50 2.00 3.40 3.60 96.40
No. 6 4.75 522.80 556.80 34.00 4.60 8.20 91.80
No. 7 2.40 310.10 356.10 46.00 2.70 10.90 89.10
No. 8 1.18 275.70 302.70 27.00 1.70 12.60 87.40
No. 9 0.600 253.80 270.80 17.00 0.70 13.30 86.70
No. 10 0.425 462.30 469.30 7.00 3.00 16.30 83.70
No. 11 0.300 435.60 465.60 30.00 5.70 22.00 78.00
No. 12 0.150 223.90 280.90 57.00 1.40 23.40 76.60
No. 13 0.075 202.10 216.10 14.00 0.00 23.40 76.60
PAN 182.70 182.70 0.00 76.60 100.00
Total
234.00
Washed through sieve 766.00

19
MILESTONE ENGINEERING CONSULTANTS
PARTICLE SIZE DISTRIBUTION ANALYSIS
Soil Sample: Pit 2-1.5m
Test No: 1 Mass of Sample (g): 1000.00
Date of Test:18/02/05 26/05/2017
Location: CHIL Depth: 1.50 m Tested by: Raven
Sieve No
Sieve Opening
(mm)
Mass of Sieve
(g)
Mass of Sieve+Soil
(g)
Mass of soil
Retained (g)
% Retained
Cumulative % Retained
% Finer
No. 1 37.50 548.00 548.00 0.00 0.00 0.00 100.00
No. 2 26.50 573.80 573.80 0.00 0.00 0.00 100.00
No. 3 19.10 500.80 500.80 0.00 0.00 0.00 100.00
No. 4 12.30 525.80 525.80 0.00 0.00 0.00 100.00
No. 5 9.50 527.50 527.50 0.00 0.00 0.00 100.00
No. 6 4.75 522.80 522.80 0.00 0.40 0.40 99.60
No. 7 2.40 310.10 314.10 4.00 1.80 2.20 97.80
No. 8 1.18 275.70 293.70 18.00 6.90 9.10 90.90
No. 9 0.600 253.80 322.80 69.00 3.70 12.80 87.20
No. 10 0.425 462.30 499.30 37.00 7.90 20.70 79.30
No. 11 0.300 435.60 514.60 79.00 13.70 34.40 65.60
No. 12 0.150 223.90 360.90 137.00 3.10 37.50 62.50
No. 13 0.075 202.10 233.10 31.00 0.00 37.50 62.50
PAN 182.70 182.70 0.00 62.50 100.00
Total
375.00
Washed through sieve 625.00
20
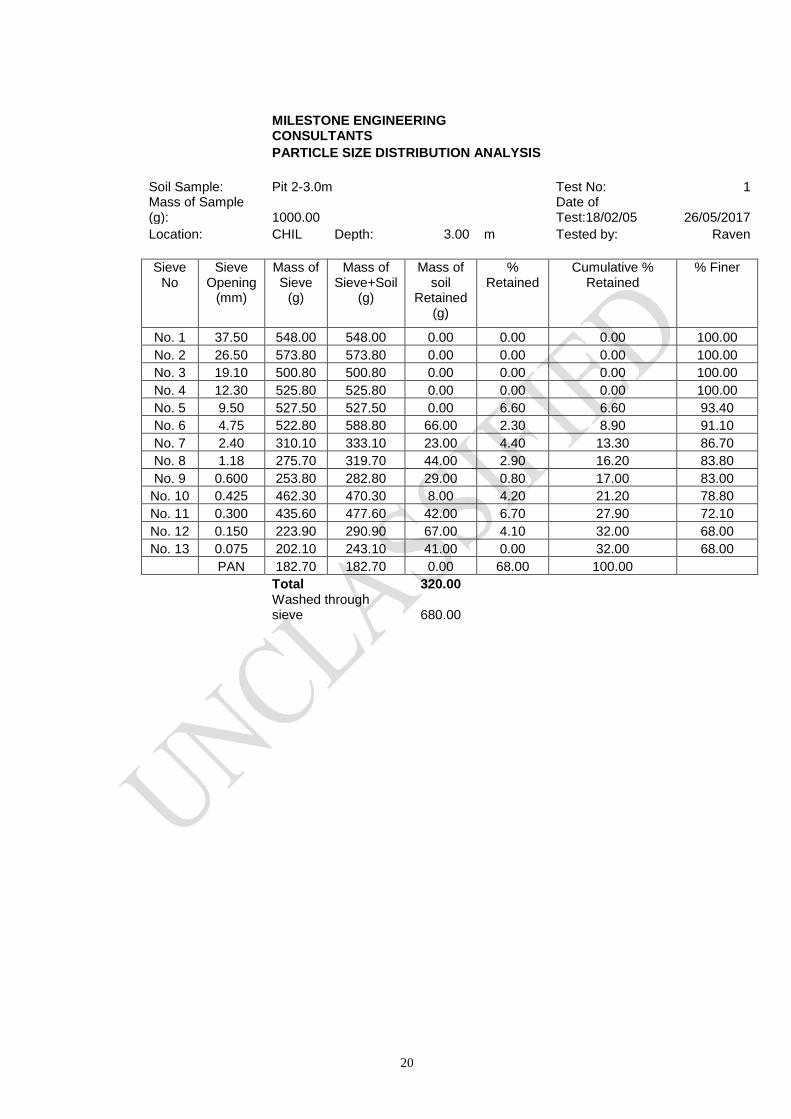
MILESTONE ENGINEERING CONSULTANTS
PARTICLE SIZE DISTRIBUTION ANALYSIS
Soil Sample: Pit 2-3.0m
Test No: 1 Mass of Sample (g): 1000.00
Date of Test:18/02/05 26/05/2017
Location: CHIL Depth: 3.00 m Tested by: Raven
Sieve No
Sieve Opening
(mm)
Mass of Sieve
(g)
Mass of Sieve+Soil
(g)
Mass of soil
Retained (g)
% Retained
Cumulative % Retained
% Finer
No. 1 37.50 548.00 548.00 0.00 0.00 0.00 100.00
No. 2 26.50 573.80 573.80 0.00 0.00 0.00 100.00
No. 3 19.10 500.80 500.80 0.00 0.00 0.00 100.00
No. 4 12.30 525.80 525.80 0.00 0.00 0.00 100.00
No. 5 9.50 527.50 527.50 0.00 6.60 6.60 93.40
No. 6 4.75 522.80 588.80 66.00 2.30 8.90 91.10
No. 7 2.40 310.10 333.10 23.00 4.40 13.30 86.70
No. 8 1.18 275.70 319.70 44.00 2.90 16.20 83.80
No. 9 0.600 253.80 282.80 29.00 0.80 17.00 83.00
No. 10 0.425 462.30 470.30 8.00 4.20 21.20 78.80
No. 11 0.300 435.60 477.60 42.00 6.70 27.90 72.10
No. 12 0.150 223.90 290.90 67.00 4.10 32.00 68.00
No. 13 0.075 202.10 243.10 41.00 0.00 32.00 68.00
PAN 182.70 182.70 0.00 68.00 100.00
Total
320.00
Washed through sieve 680.00
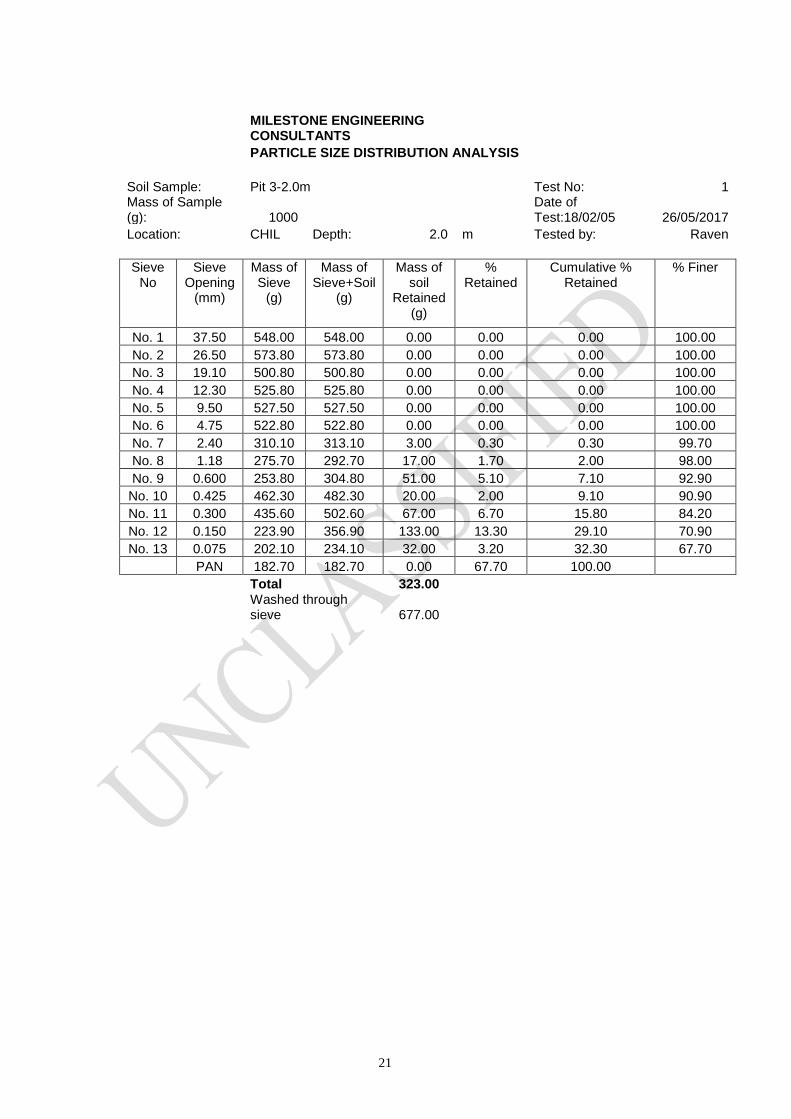
21
MILESTONE ENGINEERING CONSULTANTS
PARTICLE SIZE DISTRIBUTION ANALYSIS
Soil Sample: Pit 3-2.0m
Test No: 1 Mass of Sample (g): 1000
Date of Test:18/02/05 26/05/2017
Location: CHIL Depth: 2.0 m Tested by: Raven
Sieve No
Sieve Opening
(mm)
Mass of Sieve
(g)
Mass of Sieve+Soil
(g)
Mass of soil
Retained (g)
% Retained
Cumulative % Retained
% Finer
No. 1 37.50 548.00 548.00 0.00 0.00 0.00 100.00
No. 2 26.50 573.80 573.80 0.00 0.00 0.00 100.00
No. 3 19.10 500.80 500.80 0.00 0.00 0.00 100.00
No. 4 12.30 525.80 525.80 0.00 0.00 0.00 100.00
No. 5 9.50 527.50 527.50 0.00 0.00 0.00 100.00
No. 6 4.75 522.80 522.80 0.00 0.00 0.00 100.00
No. 7 2.40 310.10 313.10 3.00 0.30 0.30 99.70
No. 8 1.18 275.70 292.70 17.00 1.70 2.00 98.00
No. 9 0.600 253.80 304.80 51.00 5.10 7.10 92.90
No. 10 0.425 462.30 482.30 20.00 2.00 9.10 90.90
No. 11 0.300 435.60 502.60 67.00 6.70 15.80 84.20
No. 12 0.150 223.90 356.90 133.00 13.30 29.10 70.90
No. 13 0.075 202.10 234.10 32.00 3.20 32.30 67.70
PAN 182.70 182.70 0.00 67.70 100.00
Total
323.00
Washed through sieve 677.00

22
MILESTONE ENGINEERING CONSULTANTS
PARTICLE SIZE DISTRIBUTION ANALYSIS
Soil Sample: Pit 4-2.0m
Test No: 1 Mass of Sample (g): 1000.00
Date of Test:18/02/05 26/05/2017
Location: CHIL Depth: 2.0 m Tested by: Raven
Sieve No
Sieve Opening
(mm)
Mass of Sieve
(g)
Mass of Sieve+Soil
(g)
Mass of soil
Retained (g)
% Retained
Cumulative % Retained
% Finer
No. 1 37.50 548.00 548.00 0.00 0.00 0.00 100.00
No. 2 26.50 573.80 573.80 0.00 0.00 0.00 100.00
No. 3 19.10 500.80 500.80 0.00 0.00 0.00 100.00
No. 4 12.30 525.80 525.80 0.00 0.00 0.00 100.00
No. 5 9.50 527.50 527.50 0.00 0.00 0.00 100.00
No. 6 4.75 522.80 523.80 1.00 0.10 0.10 99.90
No. 7 2.40 310.10 312.10 2.00 0.20 0.30 99.70
No. 8 1.18 275.70 283.70 8.00 0.80 1.10 98.90
No. 9 0.600 253.80 308.80 55.00 5.50 6.60 93.40
No. 10 0.425 462.30 519.30 57.00 5.70 12.30 87.70
No. 11 0.300 435.60 504.60 69.00 6.90 19.20 80.80
No. 12 0.150 223.90 400.90 177.00 17.70 36.90 63.10
No. 13 0.075 202.10 234.10 32.00 3.20 40.10 59.90
PAN 182.70 182.70 0.00 59.90 100.00
Total
401.00
Washed through sieve 599.00

23
MILESTONE ENGINEERING CONSULTANTS
PARTICLE SIZE DISTRIBUTION ANALYSIS
Soil Sample: Pit 5-2.0m
Test No: 1 Mass of Sample (g): 1000.00
Date of Test:18/02/05 26/05/2017
Location: CHIL Depth: 2.0 m Tested by: Raven
Sieve No
Sieve Opening
(mm)
Mass of Sieve
(g)
Mass of Sieve+Soil
(g)
Mass of soil
Retained (g)
% Retained
Cumulative % Retained
% Finer
No. 1 37.50 548.00 548.00 0.00 0.00 0.00 100.00
No. 2 26.50 573.80 573.80 0.00 0.00 0.00 100.00
No. 3 19.10 500.80 500.80 0.00 0.00 0.00 100.00
No. 4 12.30 525.80 525.80 0.00 0.00 0.00 100.00
No. 5 9.50 527.50 527.50 0.00 0.00 0.00 100.00
No. 6 4.75 522.80 522.80 0.00 0.00 0.00 100.00
No. 7 2.40 310.10 311.10 1.00 0.10 0.10 99.90
No. 8 1.18 275.70 290.70 15.00 1.50 1.60 98.40
No. 9 0.600 253.80 311.80 58.00 5.80 7.40 92.60
No. 10 0.425 462.30 486.30 24.00 2.40 9.80 90.20
No. 11 0.300 435.60 504.60 69.00 6.90 16.70 83.30
No. 12 0.150 223.90 358.90 135.00 13.50 30.20 69.80
No. 13 0.075 202.10 234.10 32.00 3.20 33.40 66.60
PAN 182.70 182.70 0.00 66.60 100.00
Total
334.00
Washed through sieve 666.00
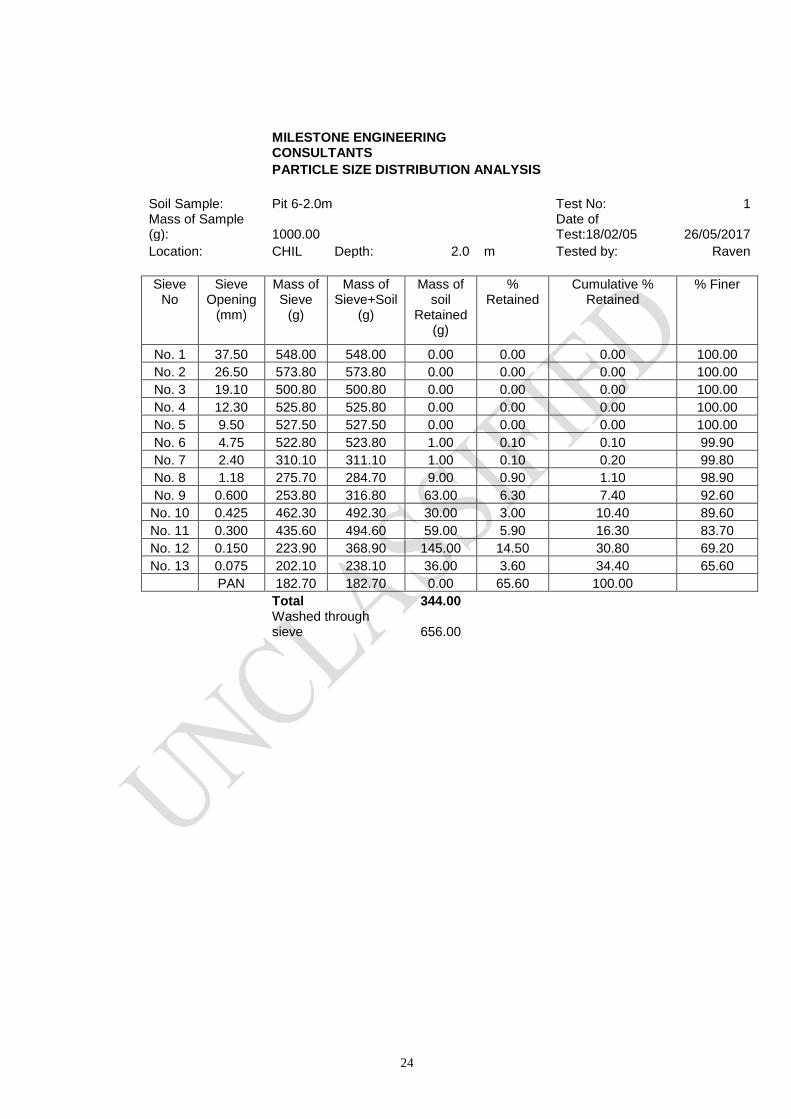
24
MILESTONE ENGINEERING CONSULTANTS
PARTICLE SIZE DISTRIBUTION ANALYSIS
Soil Sample: Pit 6-2.0m
Test No: 1 Mass of Sample (g): 1000.00
Date of Test:18/02/05 26/05/2017
Location: CHIL Depth: 2.0 m Tested by: Raven
Sieve No
Sieve Opening
(mm)
Mass of Sieve
(g)
Mass of Sieve+Soil
(g)
Mass of soil
Retained (g)
% Retained
Cumulative % Retained
% Finer
No. 1 37.50 548.00 548.00 0.00 0.00 0.00 100.00
No. 2 26.50 573.80 573.80 0.00 0.00 0.00 100.00
No. 3 19.10 500.80 500.80 0.00 0.00 0.00 100.00
No. 4 12.30 525.80 525.80 0.00 0.00 0.00 100.00
No. 5 9.50 527.50 527.50 0.00 0.00 0.00 100.00
No. 6 4.75 522.80 523.80 1.00 0.10 0.10 99.90
No. 7 2.40 310.10 311.10 1.00 0.10 0.20 99.80
No. 8 1.18 275.70 284.70 9.00 0.90 1.10 98.90
No. 9 0.600 253.80 316.80 63.00 6.30 7.40 92.60
No. 10 0.425 462.30 492.30 30.00 3.00 10.40 89.60
No. 11 0.300 435.60 494.60 59.00 5.90 16.30 83.70
No. 12 0.150 223.90 368.90 145.00 14.50 30.80 69.20
No. 13 0.075 202.10 238.10 36.00 3.60 34.40 65.60
PAN 182.70 182.70 0.00 65.60 100.00
Total
344.00
Washed through sieve 656.00

25
APPENDIX 2 ATTERBERG LIMITS
26
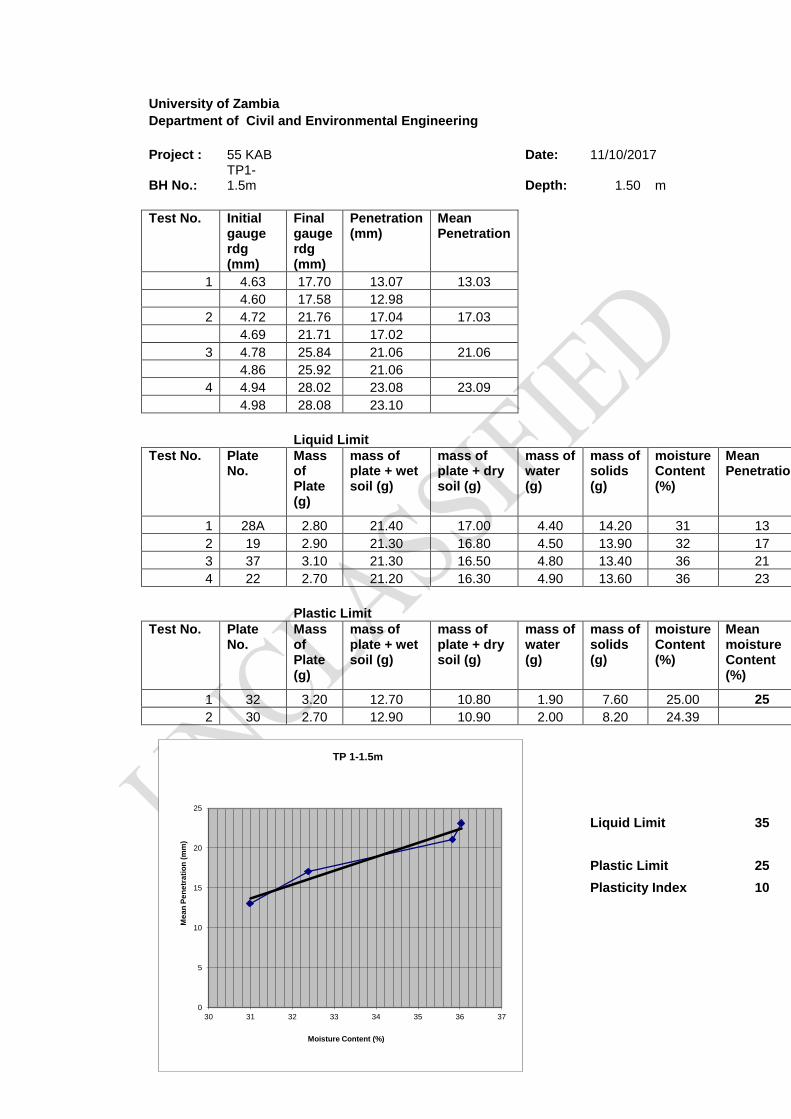
University of Zambia Department of Civil and Environmental Engineering
Project : 55 KAB
Date: 11/10/2017
BH No.: TP1-1.5m
Depth: 1.50 m
Test No. Initial gauge rdg (mm)
Final gauge rdg (mm)
Penetration (mm)
Mean Penetration
1 4.63 17.70 13.07 13.03 4.60 17.58 12.98 2 4.72 21.76 17.04 17.03 4.69 21.71 17.02 3 4.78 25.84 21.06 21.06 4.86 25.92 21.06 4 4.94 28.02 23.08 23.09 4.98 28.08 23.10
Liquid Limit
Test No. Plate No.
Mass of Plate (g)
mass of plate + wet soil (g)
mass of plate + dry soil (g)
mass of water (g)
mass of solids (g)
moisture Content (%)
Mean Penetration
1 28A 2.80 21.40 17.00 4.40 14.20 31 13
2 19 2.90 21.30 16.80 4.50 13.90 32 17
3 37 3.10 21.30 16.50 4.80 13.40 36 21
4 22 2.70 21.20 16.30 4.90 13.60 36 23
Plastic Limit
Test No. Plate No.
Mass of Plate (g)
mass of plate + wet soil (g)
mass of plate + dry soil (g)
mass of water (g)
mass of solids (g)
moisture Content (%)
Mean moisture Content (%)
1 32 3.20 12.70 10.80 1.90 7.60 25.00 25
2 30 2.70 12.90 10.90 2.00 8.20 24.39
Liquid Limit 35
Plastic Limit 25
Plasticity Index 10
0
5
10
15
20
25
30 31 32 33 34 35 36 37
Me
an
Pe
ne
tra
tio
n (
mm
)
Moisture Content (%)
TP 1-1.5m
27
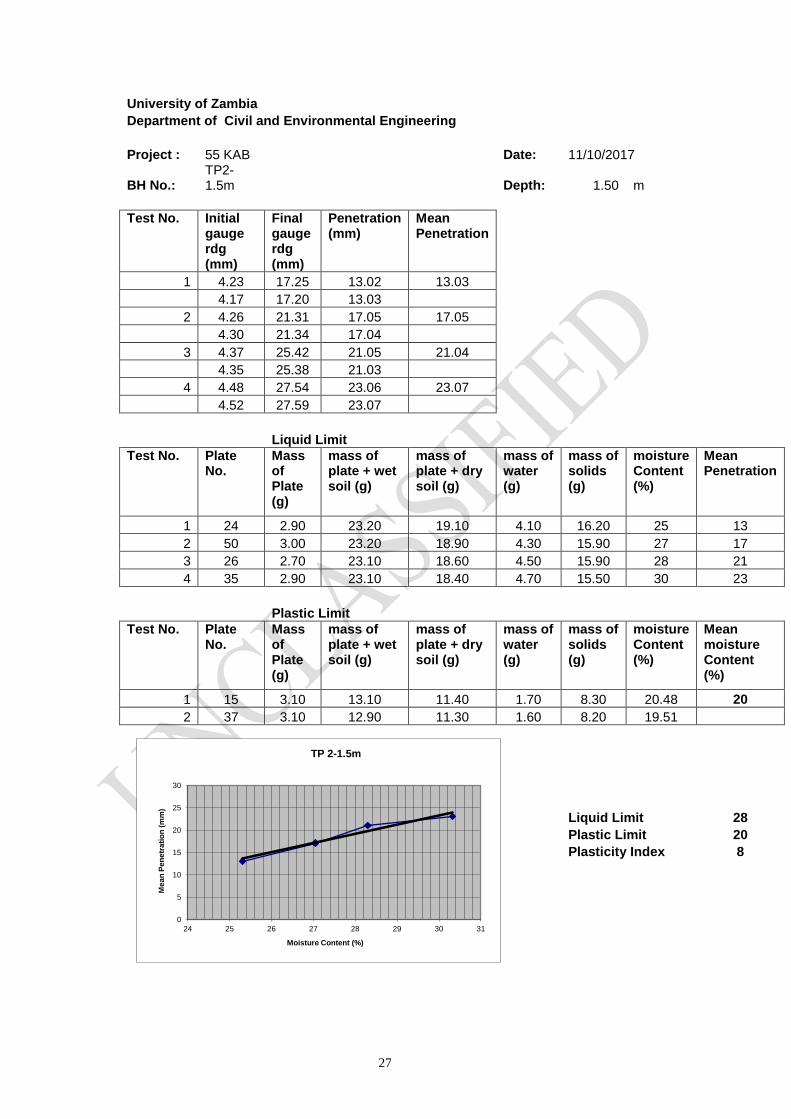
University of Zambia Department of Civil and Environmental Engineering
Project : 55 KAB
Date: 11/10/2017
BH No.: TP2-1.5m
Depth: 1.50 m
Test No. Initial gauge rdg (mm)
Final gauge rdg (mm)
Penetration (mm)
Mean Penetration
1 4.23 17.25 13.02 13.03 4.17 17.20 13.03 2 4.26 21.31 17.05 17.05 4.30 21.34 17.04 3 4.37 25.42 21.05 21.04 4.35 25.38 21.03 4 4.48 27.54 23.06 23.07 4.52 27.59 23.07
Liquid Limit
Test No. Plate No.
Mass of Plate (g)
mass of plate + wet soil (g)
mass of plate + dry soil (g)
mass of water (g)
mass of solids (g)
moisture Content (%)
Mean Penetration
1 24 2.90 23.20 19.10 4.10 16.20 25 13
2 50 3.00 23.20 18.90 4.30 15.90 27 17
3 26 2.70 23.10 18.60 4.50 15.90 28 21
4 35 2.90 23.10 18.40 4.70 15.50 30 23
Plastic Limit
Test No. Plate No.
Mass of Plate (g)
mass of plate + wet soil (g)
mass of plate + dry soil (g)
mass of water (g)
mass of solids (g)
moisture Content (%)
Mean moisture Content (%)
1 15 3.10 13.10 11.40 1.70 8.30 20.48 20
2 37 3.10 12.90 11.30 1.60 8.20 19.51
Liquid Limit 28
Plastic Limit 20
Plasticity Index 8
0
5
10
15
20
25
30
24 25 26 27 28 29 30 31
Me
an
Pe
ne
tra
tio
n (
mm
)
Moisture Content (%)
TP 2-1.5m
28
University of Zambia Department of Civil and Environmental Engineering
Project : 55 KAB
Date: 11/10/2017
BH No.: TP3-1.5m
Depth: 1.50 m
Test No. Initial gauge rdg (mm)
Final gauge rdg (mm)
Penetration (mm)
Mean Penetration
1 4.18 17.24 13.06 13.06 4.22 17.27 13.05 2 4.29 21.35 17.06 17.06 4.34 21.39 17.05 3 4.40 25.46 21.06 21.06 4.38 25.43 21.05 4 4.49 27.55 23.06 23.07 4.53 27.60 23.07
Liquid Limit
Test No. Plate No.
Mass of Plate (g)
mass of plate + wet soil (g)
mass of plate + dry soil (g)
mass of water (g)
mass of solids (g)
moisture Content (%)
Mean Penetration
1 15 3.10 24.00 19.80 4.20 16.70 25 13
2 35 2.90 23.90 19.50 4.40 16.60 27 17
3 50 3.00 23.80 19.30 4.50 16.30 28 21
4 26 2.70 23.80 19.10 4.70 16.40 29 23
Plastic Limit
Test No. Plate No.
Mass of Plate (g)
mass of plate + wet soil (g)
mass of plate + dry soil (g)
mass of water (g)
mass of solids (g)
moisture Content (%)
Mean moisture Content (%)
1 37 3.10 13.10 11.50 1.60 8.40 19.05 19
2 24 2.90 12.60 11.10 1.50 8.20 18.29
Liquid Limit 27
Plastic Limit 19
Plasticity Index 8
0
5
10
15
20
25
24 25 26 27 28 29 30
Mean
Pen
etr
ati
on
(m
m)
Moisture Content (%)
TP 3-1.5m
29
University of Zambia Department of Civil and Environmental Engineering
Project : 55 KAB
Date: 11/10/2017
BH No.: TP4-1.5m
Depth: 1.50 m
Test No. Initial gauge rdg (mm)
Final gauge rdg (mm)
Penetration (mm)
Mean Penetration
1 4.83 17.89 13.06 13.05 4.82 17.86 13.04 2 4.90 21.95 17.05 17.07 4.96 22.04 17.08 3 5.05 26.13 21.08 21.08 5.11 26.18 21.07 4 5.17 28.23 23.06 23.07 5.22 28.29 23.07
Liquid Limit
Test No. Plate No.
Mass of Plate (g)
mass of plate + wet soil (g)
mass of plate + dry soil (g)
mass of water (g)
mass of solids (g)
moisture Content (%)
Mean Penetration
1 32 3.20 21.50 16.90 4.60 13.70 34 13
2 22 2.70 21.50 16.60 4.90 13.90 35 17
3 19 2.90 21.40 16.40 5.00 13.50 37 21
4 30 3.10 21.40 16.10 5.30 13.00 41 23
Plastic Limit
Test No. Plate No.
Mass of Plate (g)
mass of plate + wet soil (g)
mass of plate + dry soil (g)
mass of water (g)
mass of solids (g)
moisture Content (%)
Mean moisture Content (%)
1 30 2.70
2 28A 2.80
Liquid Limit 38
Plastic Limit
Plasticity Index
0
5
10
15
20
25
30
39 40 41 42 43 44 45 46 47 48 49 50 51 52 53 54 55
Mean
Pen
etr
ati
on
(m
m)
Moisture Content (%)
TP 2-1.4m
0
5
10
15
20
25
30
33 34 35 36 37 38 39 40 41 42
Mean
Pen
etr
ati
on
(m
m)
Moisture Content (%)
TP 4-1.5m

30
APPENDIX 3 UNIFIED
CLASSIFICATION CHART
1
2
APPENDIX 4 CHARTS FOR ESTIMATING BEARING CAPACITY AND
ANGLE OF INTERNAL FRICTION
3
4
![318 Catalog pg 03-36:08 E-Switch Catalog p · 2019-08-01 · 14.10 555] [-150) so. 4.00 [.15'] 0.50 1.00 x [.07 t) 0.30 1.80 3.50 t. 138) 1.197] 12.50 [.492) 14.10 1.30 1.00 x 0.30](https://img.pdfslide.net/doc/110x75/5f66c8e57bde9248ef79d3dc/318-catalog-pg-03-3608-e-switch-catalog-p-2019-08-01-1410-555-150-so-400.jpg)