Embed Size (px)
Citation preview

United States Railroad Retirement Board2018 Annual Report
U.S. Railroad Retirement Board844 North Rush Street
Chicago, IL 60611-1275
Toll Free: (877) 772-5772TTY: (312) 751-4701
Directory: (312) 751-4300www.rrb.gov
United States R
ailroad Retirem
ent Board 2018 Annual R
eport

U.S. Railroad Retirement BoardMission Statement
The Railroad Retirement Board’s mission is to administer retirement/survivor and unemployment/sickness insurance benefit programs for railroad workers and their families under the Railroad Retirement Act and the Railroad Unemployment Insurance Act. These programs provide income protection during old age and in the event of disability, death or temporary unemployment and sickness. The Railroad Retirement Board also administers aspects of the Medicare program and has administrative responsibilities under the Social Security Act and the Internal Revenue Code.
In carrying out its mission, the Railroad Retirement Board will pay benefits to the right people, in the right amounts, in a timely manner, and will take appropriate action to safeguard our customers’ trust funds. The Railroad Retirement Board will treat every person who comes into contact with the agency with courtesy and concern, and respond to all inquiries promptly, accurately and clearly.
If you have comments or suggestions regarding the informationin this report, please let us know. You can call us at 312-751-4777,
e-mail us at [email protected] or write us at the following address: Public Affairs
U.S. Railroad Retirement Board 844 North Rush Street
Chicago, IL 60611-1275
UNITED STATES RAILROAD RETIREMENT BOARD
2018 Annual ReportFor Fiscal Year Ended September 30, 2017
The RepoRT in BRief 1
A Review of opeRATions 6
AdminisTRATive developmenTs 34
legAl Rulings 45
sTATisTicAl TABles 48
RRB.gov

1
The RepoRT in BRief
Benefits and Beneficiaries
Benefits paid under the Railroad Retirement and Railroad Unemployment Insurance Acts totaled almost $12.6 billion in the fiscal year ending
September 30, 2017. Retirement and survivor benefits were paid by the RRB to about 548,000 beneficiaries during the fiscal year, of whom 517,000 were on the RRB’s annuity rolls at the end of the year. Approximately 28,000 railroad employees were paid unemployment and/or sickness insurance benefits. About 2,000 beneficiaries received payments under both the Railroad Retirement Act and the Railroad Unemployment Insurance Act.
Retirement and survivor benefit payments of $12.5 billion during fiscal year 2017 were $122.5 million more than payments in the prior year. Employee and spouse annuitants were paid some $10.3 billion, accounting for 83 percent of the total payments. Employees received almost $7.5 billion in age annuities (including $1.3 billion to annuitants full retirement age and over originally awarded a disability annuity), $1 billion in disability annuities, and $61.2 million in supplemental annuities, while spouses and divorced spouses received approximately $1.8 billion.1 Survivors were paid $2.1 billion in annuities and nearly $2.4 million in lump-sum benefits. The total number of beneficiaries who received retirement and survivor benefits declined by about 5,000 from fiscal year 2016.
Railroad retirement and unemployment insurance benefits totaling almost $12.6 billion were paid by the Railroad Retirement Board (RRB) to about 574,000
beneficiaries in fiscal year 2017. Financial reports issued in 2018 on the solvency of the railroad retirement and railroad unemployment insurance systems
were both favorable. Total railroad retirement system assets equaled $27.8 billion as of September 30, 2017.
Note: Statistics are presented on the cash basis of accounting instead of the accrual basis of accounting for much of the Report. However, with the exception of the first paragraph on page 2, the Federal Income Tax Transfers section on page 9 and the accompanying table on page 10, which are also presented as cash, the information on pages 2, 6-14 and 26-28 is presented on the accrual basis of accounting. The primary difference between the 2 bases of accounting is that the cash basis recognizes revenue and expenditures only when cash is received and paid. The accrual basis, on the other hand, recognizes rev-enue when it is earned and expenses when they are incurred.1 In the Annual Reports for the years through 2014, annuitants who were full retirement age and over and who were originally awarded a disability annuity were included in the disability counts. Effective with the 2015 and later reports, annuitants full retirement age and over originally awarded a disability annuity are included in the employee age and service counts because a disability annuity converts to an age and service annuity when the annuitant attains full retirement age.

2 2018 Annual Report, U.S. Railroad Retirement Board
Gross unemployment and sickness benefits paid in fiscal year 2017 totaled about $130 million. Net benefits totaled almost $105.4 million after adjustment for recoveries of benefit payments, including injury settlements, some of which were made in prior years. Total gross benefit payments decreased by some $25.8 million while net benefit payments decreased by nearly $28 million from the preceding year. In accordance with the Balanced Budget and Emergency Deficit Control Act of 1985, as amended by the Budget Control Act of 2011, amounts reflect a sequestration reduction of 7.3 percent for days of unemployment and sickness after September 30, 2014, 6.8 percent for days after September 30, 2015, and 6.9 percent for days after September 30, 2016.
Gross unemployment benefits decreased by 33 percent compared to the previous year due to the slower decline in employment than the prior year. Gross unemployment benefits totaling $53.8 million ($46.6 million net) were paid to 12,400 claimants, while gross sickness benefits of $76.3 million ($58.8 million net) were paid to 16,400 claimants. This includes a total of $0.2 million net recoveries in temporary extended unemployment benefits under the American Recovery and Reinvestment Act of 2009 and the Worker, Homeownership, and Business Assistance Act of 2009, as amended by the Tax Relief, Unemployment Insurance Reauthorization, and Job Creation Act of 2010, the Temporary Payroll Tax Cut Continuation Act of 2011, the Middle Class Tax Relief and Job Creation Act of 2012, and the American Taxpayer Relief Act of 2012.
Financial Reports
The RRB’s 27th triennial actuarial valuation, submitted to Congress in 2018, was generally favorable, concluding that, barring a sudden, unanticipated, large decrease in railroad employment, or substantial investment losses, the railroad retirement system will experience no cash-flow problems during the next 29 years. Cash-flow problems arise only under the most pessimistic employment assumption, and then not until 2047. The long-term stability of the system, however, is not assured. Under the current financing structure, actual levels of railroad employment and investment return over the coming years will determine whether corrective action is necessary.
The RRB’s 2018 railroad unemployment insurance financial report was also generally favorable. Even as projected maximum benefit rates increase 51 percent (from $72 to $109) from 2017 to 2028, experience-based contribution rates maintain solvency. The report also predicted average employer contribution rates well below the maximum throughout the projection period. A 1.5 percent surcharge was imposed in calendar year 2018 in order to maintain a minimum account balance. Under all three employment assumptions, the report projects a 1.5 percent surcharge in 2019, with a 1.5 percent surcharge probable in 2020 under the intermediate and pessimistic assumptions, and intermittently thereafter.
The RepoRT in BRief 3
The National Railroad Retirement Investment Trust’s annual management report for fiscal year 2017 showed that, as of September 30, 2017, the net asset value of the Trust-managed assets was $26.5 billion. This represented an increase from $25.1 billion in the previous year, with a net investment return for the year of 13.4 percent. The ending balance also reflects a transfer of $1.8 billion to the U.S. Treasury for the payment of railroad retirement (tier II) benefits. Total railroad retirement system assets, including those maintained at the Treasury, equaled $27.8 billion.
The 2018 railroad retirement and railroad unemployment insurance financial reports and the National Railroad Retirement Investment Trust’s 2017 annual management report are available at RRB.gov.
Service Delivery
Customer Service PlanIn fiscal year 2017, customers received benefit services within the timeframes promised
in the RRB’s Customer Service Plan 98.9 percent of the time.
Service EnhancementsThe RRB continued to improve its Employer Reporting System that allows employers
to submit forms and information electronically, processed a cost-of-living adjustment for retirement and survivor benefits, took steps to further reduce improper payments, and implemented initiatives to improve processing of disability benefits and Medicare payments.
Office of Inspector General
During fiscal year 2017, the Office of Inspector General continued its independent oversight of agency operations and its efforts to combat fraud, waste, and abuse. This included the issuance of 8 audit reports and 3 assessments that recommended improvements in agency operations.
Investigative activities resulted in 3 arrests, 29 indictments and/or informations, 39 convictions, 11 civil judgments, and more than $149 million in financial accomplish-ments. This reflects fraud amounts related to programs administered exclusively by the RRB as well as fraud amounts from other Federal programs such as Medicare or social security which were identified during Office of Inspector General joint investigative work.
4 2018 Annual Report, U.S. Railroad Retirement Board
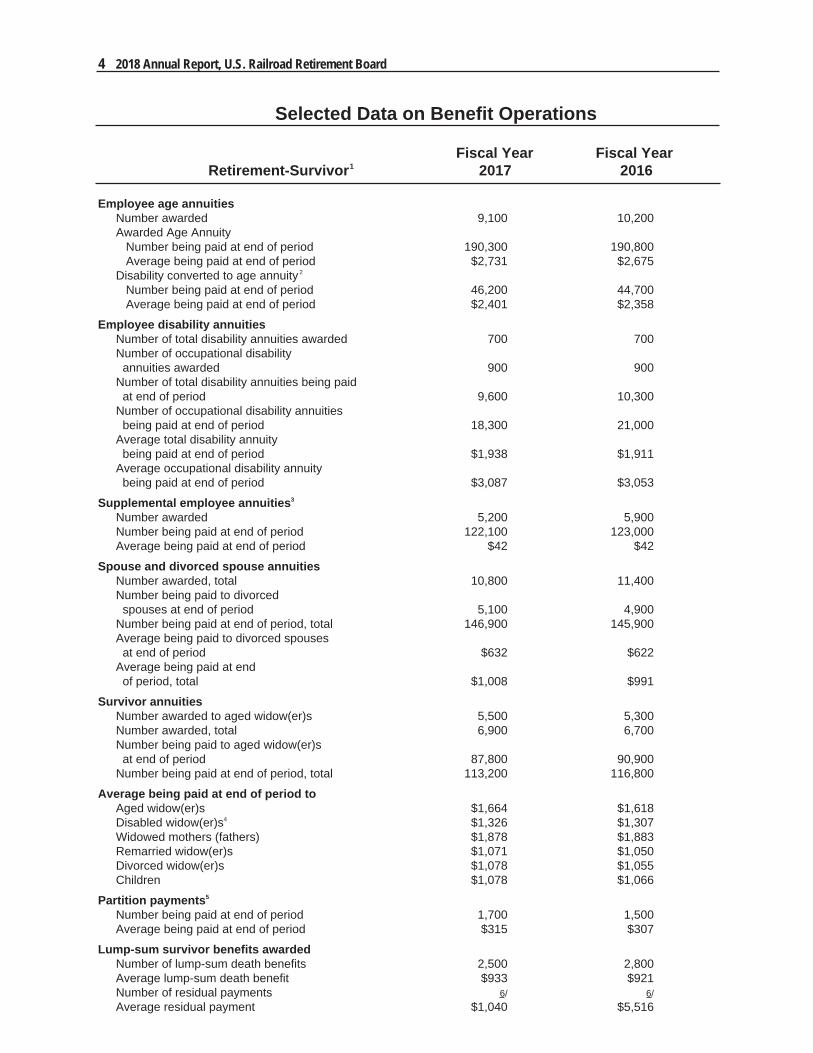
Selected Data on Benefit Operations
Fiscal Year Fiscal Year Retirement-Survivor1 2017 2016
Employee age annuities Number awarded 9,100 10,200 Awarded Age Annuity Number being paid at end of period 190,300 190,800 Average being paid at end of period $2,731 $2,675 Disability converted to age annuity2
Number being paid at end of period 46,200 44,700 Average being paid at end of period $2,401 $2,358
Employee disability annuities Number of total disability annuities awarded 700 700 Number of occupational disability annuities awarded 900 900 Number of total disability annuities being paid at end of period 9,600 10,300 Number of occupational disability annuities being paid at end of period 18,300 21,000 Average total disability annuity being paid at end of period $1,938 $1,911 Average occupational disability annuity being paid at end of period $3,087 $3,053
Supplemental employee annuities3
Number awarded 5,200 5,900 Number being paid at end of period 122,100 123,000 Average being paid at end of period $42 $42
Spouse and divorced spouse annuities Number awarded, total 10,800 11,400 Number being paid to divorced spouses at end of period 5,100 4,900 Number being paid at end of period, total 146,900 145,900 Average being paid to divorced spouses at end of period $632 $622 Average being paid at end of period, total $1,008 $991
Survivor annuities Number awarded to aged widow(er)s 5,500 5,300 Number awarded, total 6,900 6,700 Number being paid to aged widow(er)s at end of period 87,800 90,900 Number being paid at end of period, total 113,200 116,800
Average being paid at end of period to Aged widow(er)s $1,664 $1,618 Disabled widow(er)s4 $1,326 $1,307 Widowed mothers (fathers) $1,878 $1,883 Remarried widow(er)s $1,071 $1,050 Divorced widow(er)s $1,078 $1,055 Children $1,078 $1,066
Partition payments5
Number being paid at end of period 1,700 1,500 Average being paid at end of period $315 $307
Lump-sum survivor benefits awarded Number of lump-sum death benefits 2,500 2,800 Average lump-sum death benefit $933 $921 Number of residual payments 6/ 6/ Average residual payment $1,040 $5,516
The RepoRT in BRief 5
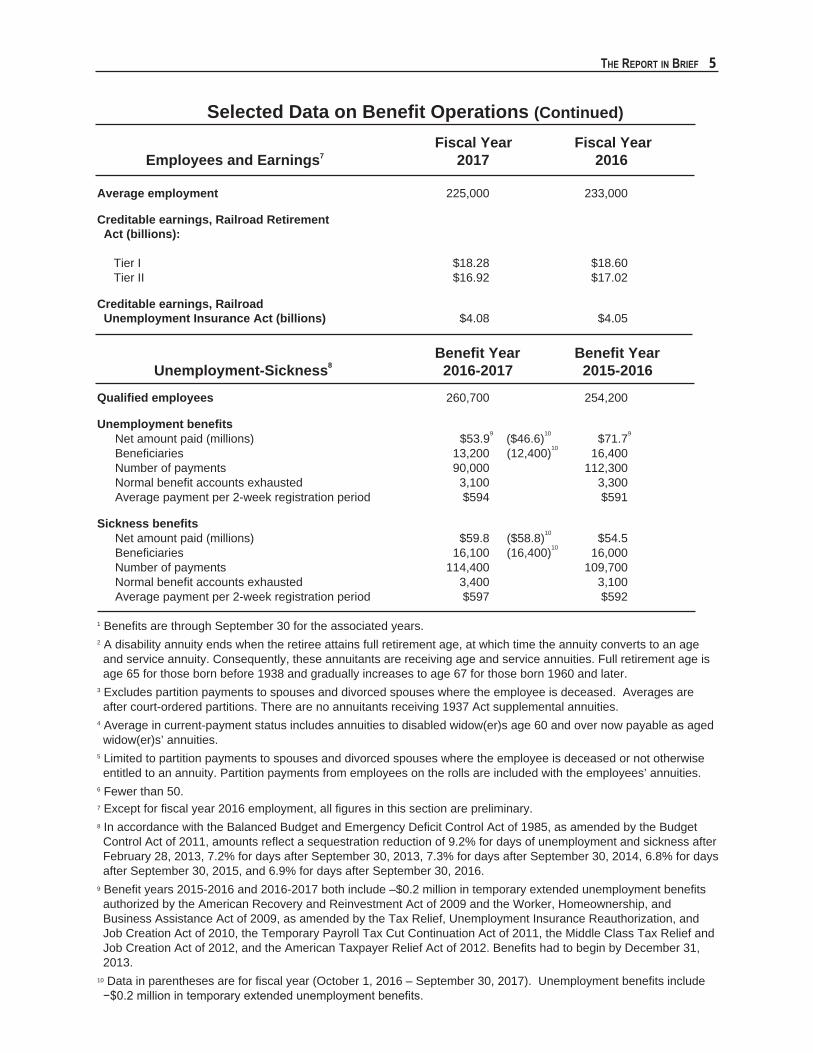
Selected Data on Benefit Operations (Continued)
Fiscal Year Fiscal Year Employees and Earnings7 2017 2016
Average employment 225,000 233,000
Creditable earnings, Railroad Retirement Act (billions):
Tier I $18.28 $18.60 Tier II $16.92 $17.02
Creditable earnings, Railroad Unemployment Insurance Act (billions) $4.08 $4.05
Benefit Year Benefit Year Unemployment-Sickness8 2016-2017 2015-2016
Qualified employees 260,700 254,200
Unemployment benefits Net amount paid (millions) $53.99 ($46.6)10 $71.79
Beneficiaries 13,200 (12,400)10 16,400 Number of payments 90,000 112,300 Normal benefit accounts exhausted 3,100 3,300 Average payment per 2-week registration period $594 $591
Sickness benefits Net amount paid (millions) $59.8 ($58.8)10 $54.5 Beneficiaries 16,100 (16,400)10 16,000 Number of payments 114,400 109,700 Normal benefit accounts exhausted 3,400 3,100 Average payment per 2-week registration period $597 $592
1 Benefits are through September 30 for the associated years.2 A disability annuity ends when the retiree attains full retirement age, at which time the annuity converts to an age and service annuity. Consequently, these annuitants are receiving age and service annuities. Full retirement age is age 65 for those born before 1938 and gradually increases to age 67 for those born 1960 and later.
3 Excludes partition payments to spouses and divorced spouses where the employee is deceased. Averages are after court-ordered partitions. There are no annuitants receiving 1937 Act supplemental annuities.
4 Average in current-payment status includes annuities to disabled widow(er)s age 60 and over now payable as aged widow(er)s’ annuities.
5 Limited to partition payments to spouses and divorced spouses where the employee is deceased or not otherwise entitled to an annuity. Partition payments from employees on the rolls are included with the employees’ annuities.
6 Fewer than 50.7 Except for fiscal year 2016 employment, all figures in this section are preliminary.8 In accordance with the Balanced Budget and Emergency Deficit Control Act of 1985, as amended by the Budget Control Act of 2011, amounts reflect a sequestration reduction of 9.2% for days of unemployment and sickness after February 28, 2013, 7.2% for days after September 30, 2013, 7.3% for days after September 30, 2014, 6.8% for days after September 30, 2015, and 6.9% for days after September 30, 2016.
9 Benefit years 2015-2016 and 2016-2017 both include –$0.2 million in temporary extended unemployment benefits authorized by the American Recovery and Reinvestment Act of 2009 and the Worker, Homeownership, and Business Assistance Act of 2009, as amended by the Tax Relief, Unemployment Insurance Reauthorization, and Job Creation Act of 2010, the Temporary Payroll Tax Cut Continuation Act of 2011, the Middle Class Tax Relief and Job Creation Act of 2012, and the American Taxpayer Relief Act of 2012. Benefits had to begin by December 31, 2013.
10 Data in parentheses are for fiscal year (October 1, 2016 – September 30, 2017). Unemployment benefits include −$0.2 million in temporary extended unemployment benefits.
A Review of opeRAtions
6
RAILROAD RETIREMENT AND SURVIVOR PROGRAM
As of September 30, 2017, total railroad retirement system assets, including those maintained in U.S. Treasury accounts and those maintained by the National
Railroad Retirement Investment Trust (the “Trust” or “NRRIT”), equaled $27.8 billion, an increase of $1.3 billion during the fiscal year. Amounts in the (RR) Account not needed to pay current administrative expenses and amounts in the Social Security Equivalent Benefit (SSEB) Account not needed to pay current benefits and administrative expenses are transferred to the NRRIT, whose Board of 7 trustees is empowered to invest Trust assets in non-governmental assets, such as equities and debt, as well as in governmental securities.
FINANCIAL OPERATIONS - U.S. TREASURY ACCOUNTS
During fiscal year 2017, railroad retirement and survivor benefit payments were financed through four U.S. Treasury accounts.
The SSEB Account, established in fiscal year 1985, pays the portion of railroad retirement benefits equivalent to a social security benefit from various income sources related to these benefits. The RR Account funds retirement, survivor and disability benefits, in excess of social security equivalent benefits, from payroll taxes on employers and employees and other income sources. Supplemental benefit payments are also paid from the RR Account. The Dual Benefits Payments (DBP) Account and Federal Payments (FP) Account, funded by congressional appropriations from general revenues, finance the phase-out costs of certain vested dual benefits and interest on unnegotiated checks, respectively. The four accounts together incurred $12.5 billion in benefit obligations (excluding $1.6 billion in social security benefits which were reimbursed by the Social Security Administration) during fiscal year 2017.
At the end of fiscal year 2017, total railroad retirement system assets equaled $27.8 billion. During fiscal year 2017, benefits totaling approximately $12.6 billion
were paid under the Railroad Retirement and Railroad Unemployment Insurance Acts. Retirement and survivor benefits accounted for almost all of this amount.
Net unemployment and sickness benefits totaled $104.6 million.
A Review of opeRations 7
Financing SourcesPayroll Taxes
The primary source of income to the railroad retirement and survivor program is payroll taxes levied on covered employers and their employees. Payroll taxes amounted to $6.0 billion, representing 47 percent of total financing sources (excluding an increase of $1,515.6 million, mostly due to a change in NRRIT net assets) and $39.3 million more than in fiscal year 2016.
Railroad employees and employers pay tier I taxes which, by law, are the same as social security taxes. The 2017 rate of 7.65 percent was split between 6.20 percent for retirement and 1.45 percent for Medicare hospital insurance. The maximum amount of earnings subject to the 6.20 percent rate in calendar year 2017 was $127,200, with all earnings subject to the 1.45 percent Medicare tax.
Since 2013, employees pay an additional 0.9 percent Medicare tax on earnings above $200,000 (for those who file an individual return) or $250,000 (for those who file a joint return). This additional tax rate is not reflected in the tax rates shown above.
Both employees and employers also pay a tier II tax to finance railroad retirement benefit payments over and above social security levels. This tax, on earnings up to $94,500 and $88,200 in 2017 and 2016, respectively, was 4.9 percent on employees in both years. It was 13.1 percent on employers in both 2017 and 2016.
Tier I and tier II taxes for fiscal year 2017 amounted to $2.8 billion and $3.1 billion, respectively.
Financial Interchange TransfersThe second major source of income to the railroad retirement and survivor program
consists of transfers from the social security trust funds under a financial interchange between the two systems. The financial interchange is intended to place the Social Security Old-Age, Survivors and Disability Insurance and Hospital Insurance Trust Funds in the same position in which they would have been had railroad employment been covered by the Social Security and Federal Insurance Contributions Acts. This involves computing the amount of social security taxes that would have been collected on railroad employment, and computing the amount of additional benefits which social security would have paid to railroad retirement beneficiaries during the same fiscal year.
In the computation of the latter amount, credit is given for any social security benefits actually paid to railroad retirement beneficiaries. When benefit reimbursements exceed payroll taxes, the difference, with an allowance for interest and administrative expenses, is transferred from the Social Security Trust Funds to the SSEB Account. If taxes exceed benefit reimbursements (this has not happened since 1951), a transfer would be made in favor of the Social Security Trust Funds. The net financial interchange transfer to the SSEB Account during fiscal year 2017 amounted to $4.1 billion.
(text continued on page 9)

8 2018 Annual Report, U.S. Railroad Retirement Board
C o s t s - F i s c a l Y e a r 2 0 1 7 ( I n M i l l i o n s )TOTAL: $12,705.1
RETIREMENT AND SURVIVOR PROGRAM
Note.--Percentages may not add to 100 due to rounding.
F i n a n c i n g S o u r c e s - F i s c a l Y e a r 2 0 1 7 ( I n M i l l i o n s ) GROSS TOTAL: $12,692.31
1Excludes −$1,515.7 million as shown under Other Financing Sources on page 11.
National Railroad Retirement
Investment TrustTransfers-In 14.3%
$1,821.0
Interest onInvestments 0.2%
$31.2Federal Income
Taxes 5.6%$710.0
Payroll Taxes 47.0%$5,966.7 Financial Interchange 32.6%
$4,133.4
General Appropriations 0.2%
$30.0
Benefit Payments 98.1%$12,461.0
Salaries and Expenses 1.1%
$143.1
Interest Expense 0.8%
$101.0
A Review of opeRations 9
Interest on Investments and Other RevenueInterest revenue decreased from $34.3 million in fiscal year 2016 to $31.2 million in
fiscal year 2017. Interest revenue was also earned from financial interchange advances.
Federal Income Tax Transfers Legislation enacted in 1983 subjecting social security and railroad retirement benefits
to Federal income taxes also provided for a transfer of the tax revenues to the social security and railroad retirement systems for the payment of benefits. Most of the revenue from income taxes on social security equivalent railroad retirement benefits is transferred to the SSEB Account, although a portion attributable to higher-income taxpayers is transferred to the Federal Hospital Insurance Trust Fund. Revenue derived from taxing regular railroad retirement benefits in excess of social security equivalent benefits is transferred to the RR Account. Revenue from taxing the vested dual benefits funded by the general revenue appropriations previously described is transferred to the DBP Account.
At the beginning of each quarter, income tax transfers are made from Treasury general funds to the SSEB, RR and DBP Accounts. These transfers are estimates of expected tax revenues for the quarter. Adjustments are made later to reconcile the estimates for a taxable year with actual tax revenues for the year. On a cash basis, original tax transfers for fiscal year 2017 amounted to $712 million during the year. Original transfers for fiscal year 2016 totaled $683 million. There were no reconciliation adjustments in fiscal year 2017. Net transfers in fiscal year 2016 were $759 million, including $76 million in reconciliation adjustments.
The information in the preceding paragraph is on a fiscal year basis, while the table on page 10 shows income tax transfers to the accounts for taxable (calendar) years 2008 through 2017, including reconciliation adjustments through 2012.
General AppropriationsGeneral revenue appropriations were provided by the Railroad Retirement Act of 1974
to fund the phase-out costs of certain dual railroad retirement/social security benefits considered vested prior to 1975, and by the Railroad Retirement Solvency Act of 1983 to fund interest on unnegotiated checks. The total amounts appropriated by the Congress for vested dual benefits for fiscal years 2017 and 2016 were $25.0 million and $28.0 million, respectively. These amounts include Federal income tax transfers for 2017 and 2016. The amount appropriated for fiscal year 2017 was 10.7 percent less than fiscal year 2016, reflecting the continuing decrease in eligibility for these benefits, which are not increased for the cost of living. The total amount appropriated by the Congress for interest on unnegotiated checks was $150,000 for fiscal years 2016-2017, and also $150,000 for fiscal years 2015-2016.
(text continued on page 13)

10 2018 Annual Report, U.S. Railroad Retirement Board
1 Includes non-SSEB portion of tier I.2 Receives taxes on social security equivalent benefit (SSEB) portion of tier I.3 Receives taxes on vested dual benefit component beginning October 1, 1988.4 The year in parentheses is the year the adjustments were made.
Federal Income Tax Transfers by Recipient Account and Benefit Component, Taxable Years 2008-2017 (Millions)
Revenue from taxes on
RRA benefits treated as RRA benefits treated as SSA benefits private or public pensions
Taxable year SSEB Tier II and tier I non-SSEB Vested benefits tier I benefits1 dual benefits
SSEB Account2 RR Account DBP Account3
Original transfers during the year2008 $144 $325 $52009 144 304 32010 159 315 32011 160 300 32012 194 318 42013 199 333 32014 250 348 2 2015 263 386 2 2016 281 412 22017 292 422 2
Reconciliation adjustments4
2008 (2012) 24 −69 12009 (2013) 20 2 12010 (2013) 23 16 12011 (2015) 32 49 ▪ ▪ 2012 (2016) 17 60 −1
A Review of opeRations 11
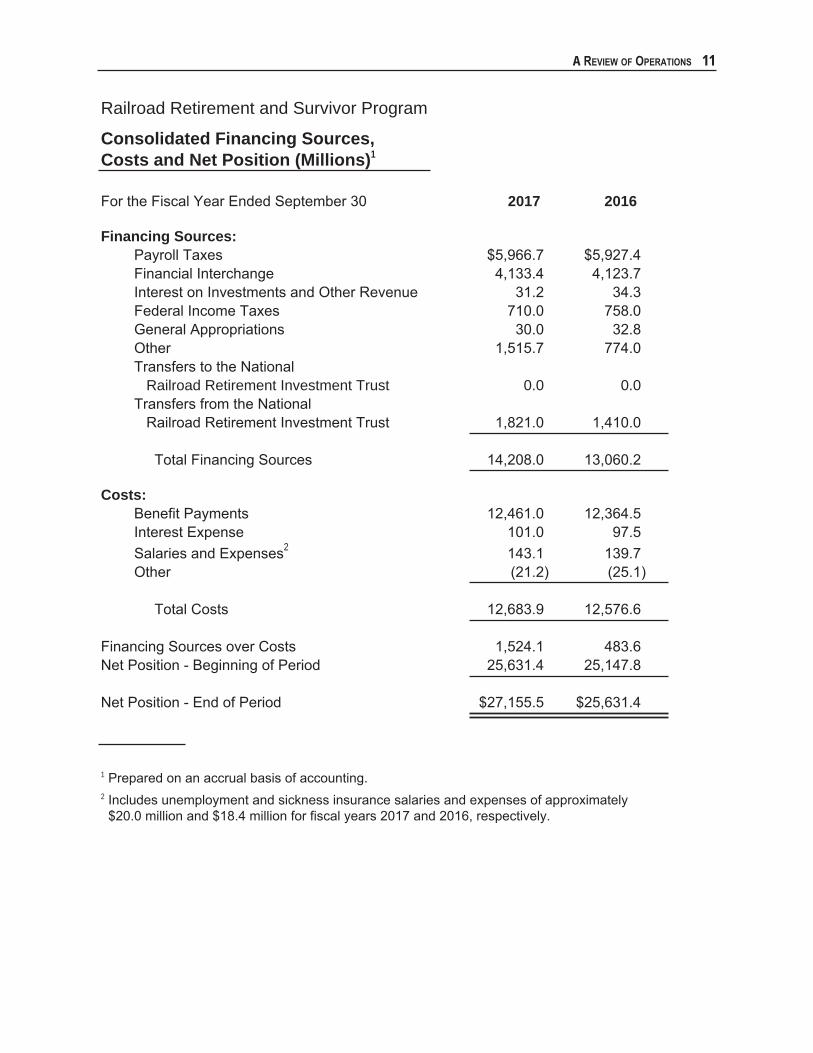
Railroad Retirement and Survivor Program
Consolidated Financing Sources, Costs and Net Position (Millions)1
For the Fiscal Year Ended September 30 2017 2016 Financing Sources: Payroll Taxes $5,966.7 $5,927.4 Financial Interchange 4,133.4 4,123.7 Interest on Investments and Other Revenue 31.2 34.3 Federal Income Taxes 710.0 758.0 General Appropriations 30.0 32.8 Other 1,515.7 774.0 Transfers to the National Railroad Retirement Investment Trust 0.0 0.0 Transfers from the National Railroad Retirement Investment Trust 1,821.0 1,410.0
Total Financing Sources 14,208.0 13,060.2
Costs: Benefit Payments 12,461.0 12,364.5 Interest Expense 101.0 97.5 Salaries and Expenses2 143.1 139.7 Other (21.2) (25.1)
Total Costs 12,683.9 12,576.6
Financing Sources over Costs 1,524.1 483.6Net Position - Beginning of Period 25,631.4 25,147.8
Net Position - End of Period $27,155.5 $25,631.4
1 Prepared on an accrual basis of accounting. 2 Includes unemployment and sickness insurance salaries and expenses of approximately $20.0 million and $18.4 million for fiscal years 2017 and 2016, respectively.

12 2018 Annual Report, U.S. Railroad Retirement Board
Market value of assets managed by NRRIT on September 30, 2017 $26.5 billion
Rate of return of investment portfolio managed by NRRIT for full year ended September 30, 2017 13.38%
Source: NRRIT All NRRIT annual management reports and quarterly updates are available at RRB.gov.
National Railroad Retirement Investment Trust (NRRIT) Fiscal Year 2017 Summary

A Review of opeRations 13
Other Financing SourcesOther financing sources consisted of $6.5 million to be provided by the Office of
Personnel Management to pay future retirement benefits to RRB employees and $26.8 million from the railroad unemployment trust funds in transfers-in for current budget fiscal year salaries and expenses. These financing sources were offset by an increase in NRRIT net assets of $1.3 billion, transfers-out of $8.8 million for salaries and expenses of the RRB’s Office of Inspector General, and a $2.4 million decrease in unexpended appropriations.
Costs The RRB pays all salaries and expenses under a single administrative fund (Limitation
on Administration) for both the railroad retirement and survivor program and the unemployment and sickness insurance program. Consequently, of the $143.1 million and $139.7 million shown on page 11 for salaries and expenses in fiscal years 2017 and 2016, respectively, about $20.0 million for fiscal year 2017 and $18.4 million for fiscal year 2016 were for the unemployment and sickness insurance program. About $0.9 million in other costs for fiscal year 2017 and $0.8 million for fiscal year 2016 were for the unemployment and sickness insurance program.
Excluding $17.6 million from total costs of $12.7 billion for fiscal year 2017 and $17.6 million from total costs of $12.6 billion for fiscal year 2016, total costs for the railroad retirement and survivor program for fiscal year 2017 increased $105.5 million, or 0.8 percent.
Benefit PaymentsIn fiscal year 2017, railroad retirement benefit payments increased $96.5 million, or
almost 0.8 percent, to about $12.5 billion on an accrual basis, including $23.7 million in vested dual benefits.
Interest ExpenseInterest expense of $101.0 million represents interest on the financial interchange
advances made by the U.S. Treasury during the fiscal year.
Salaries and ExpensesExcluding unemployment and sickness insurance salaries and expenses of
$20.0 million for fiscal year 2017 and $18.4 million for fiscal year 2016, salaries and expenses for the railroad retirement and survivor program were about $123.1 million for fiscal year 2017 and about $121.3 million for fiscal year 2016, a $1.8 million or 1.5 percent increase. Adjusted by the $20.0 million in salaries and expenses and $0.9 million in other costs for the unemployment and sickness insurance program, fiscal year 2017 administrative expenses for the railroad retirement and survivor program were about 0.96 percent of total costs.
14 2018 Annual Report, U.S. Railroad Retirement Board
Other CostsOther costs consisted primarily of post-retirement benefits (pensions, health and life
insurance) for RRB employees of $5.6 million for the railroad retirement and survivor program and $0.9 million for the unemployment and sickness insurance program. In addition, carrier refunds of $3,000 were incurred. These costs were offset by approximately $27.2 million in reimbursements from the Centers for Medicare & Medicaid Services for Part B Medicare costs, reimbursement of approximately $0.4 million from the RRB’s Office of Inspector General for RRB-incurred expenses, and various other revenues of approximately $1,800.
NATIONAL RAILROAD RETIREMENT INVESTMENT TRUST OPERATIONS
Funds not needed immediately for benefit payments or administrative expenses are invested through the NRRIT. The Trust was established pursuant to section 105 of the Railroad Retirement and Survivors’ Improvement Act of 2001 for the sole purpose of investing railroad retirement assets. The Act authorizes the Trust to invest the assets of the RR Account in a diversified investment portfolio in the same manner as those of private sector retirement plans. Prior to the Act, investment of RR Account assets was limited to U.S. Government securities. Although the Trust was created by Congress to hold and invest Federal assets, it is not an agency or instrumentality of the Federal government. It is a tax-exempt entity governed by a seven-member Board, three selected by rail management, three selected by rail labor and one independent trustee selected by the six rail trustees.
During fiscal year 2017, the net asset value of Trust-managed assets increased from $25.1 billion on October 1, 2016, to $26.5 billion on September 30, 2017. This includes $1.8 billion that the Trust transferred to the U.S. Treasury for the payment of railroad retirement benefits during the year. The rate of return on Trust-managed assets for the year (net of fees) was 13.4 percent.
Total railroad retirement system assets (Trust-managed assets and reserves held in Treasury accounts) grew from $20.7 billion in 2002 to $27.8 billion as of the end of fiscal year 2017, after net transfers for benefit payments of approximately $21.1 billion over the same time frame.
Trust operations are described in detail in the NRRIT Annual Management Report for fiscal year 2017, which is available at RRB.gov.
BENEFIT OPERATIONSRetirement and survivor benefits paid, including vested dual benefits and supplemen-
tal employee annuities, totaled $12.5 billion in fiscal year 2017, $122 million more than in fiscal year 2016. Benefits were paid to about 547,700 beneficiaries in fiscal year 2017, and nearly 517,000 beneficiaries were being paid at the end of the year.

A Review of opeRations 15
The table shown here presents retirement and survivor benefit payments for fiscal years 2017 and 2016, by type of benefit, and the percent changes in payments between the 2 years.
Under the two-tier railroad retirement formulas, the tier I annuity portion approximates a social security benefit and increases by the cost-of-living percentage applied to social security benefits. The tier II portion, which is comparable to retirement benefits paid over and above social security benefits to workers in other industries, increases by 32.5 percent of the social security percentage.
Effective December 2017, tier I benefits increased by 2.0 percent due to a cost-of-living adjustment, while tier II benefits increased by 0.7 percent. Increases of 0.3 percent for tier I and 0.1 percent for tier II were effective December 2016.
Monthly retirement and survivor benefits being paid numbered nearly 648,300 at the end of the 2017 fiscal year, about 5,900 less than at the end of the prior year. Monthly beneficiaries on the rolls declined by approximately 5,000 over the year, from 522,000 to 517,000. The number of monthly benefits paid is always greater than the number of beneficiaries on the rolls, since many annuitants receive more than one type of benefit. Although the second benefit is usually a supplemental employee annuity, some employees also receive a spouse or widow(er)’s annuity.
Regular employee annuities in payment status at the end of fiscal year 2017 numbered 264,500, about 2,400 less than at the end of the previous fiscal year. The number of age annuities being paid, including 46,200 disability annuities converted to age, rose slightly from 235,600 to 236,500 over the year, while disability annuities decreased from 31,300 to 28,000. Supplemental annuities being paid to employees declined by approximately 900, numbering 122,100 at the end of the year. The number of divorced spouse annuities being paid rose nearly 200, to 5,100. Spouse and divorced spouse annuities together increased by almost 1,000, totaling 146,900 at year-end. About 113,200 monthly survivor benefits were being paid at the end of fiscal year 2017, a decrease of 3,600 from the previous year. Approximately 1,700 partition payments to spouses and divorced spouses where the employee
Amount (in millions)
Fiscal year Fiscal year Percent Type of benefit 2017 2016 change
Retirement benefits
Employee annuitiesAge1 $7,489.8 $7,309.2 +2.5Disability 1,015.4 1,106.2 −8.2
Supplemental2 61.2 61.6 −0.6
Spouse and divorcedspouse annuities 1,775.0 1,725.5 +2.9
Total 10,341.4 10,202.4 +1.4
Survivor benefits
Annuities 2,119.5 2,136.5 −0.8
Lump-sum benefits 2.4 2.7 −12.4
Total 2,121.9 2,139.2 −0.8
Partition payments3 6.2 5.4 +14.8
Grand total $12,469.5 $12,347.0 +1.01A disability annuity ends when the retiree attains full retirement age, at which
time the annuity converts to an age and service annuity. FY 2017 and FY 2016 include $1,291.4 million and $1,227.7 million, respectively, in payments to annuitants full retirement age and over originally awarded a disability annuity.
2Excludes partition payments to spouses and divorced spouses where the employee is deceased.
3Limited to partition payments to spouses and divorced spouses where the employee is deceased or not otherwise entitled to an annuity. Partition payments from employees on the rolls are included with the employees’ annuities.
Note.--Detail may not add to total due to rounding.
16 2018 Annual Report, U.S. Railroad Retirement Board
is deceased or not otherwise entitled to an annuity were being paid at the end of fiscal year 2017, an increase of nearly 200 from the prior year.
RetirementRegular employee annuities
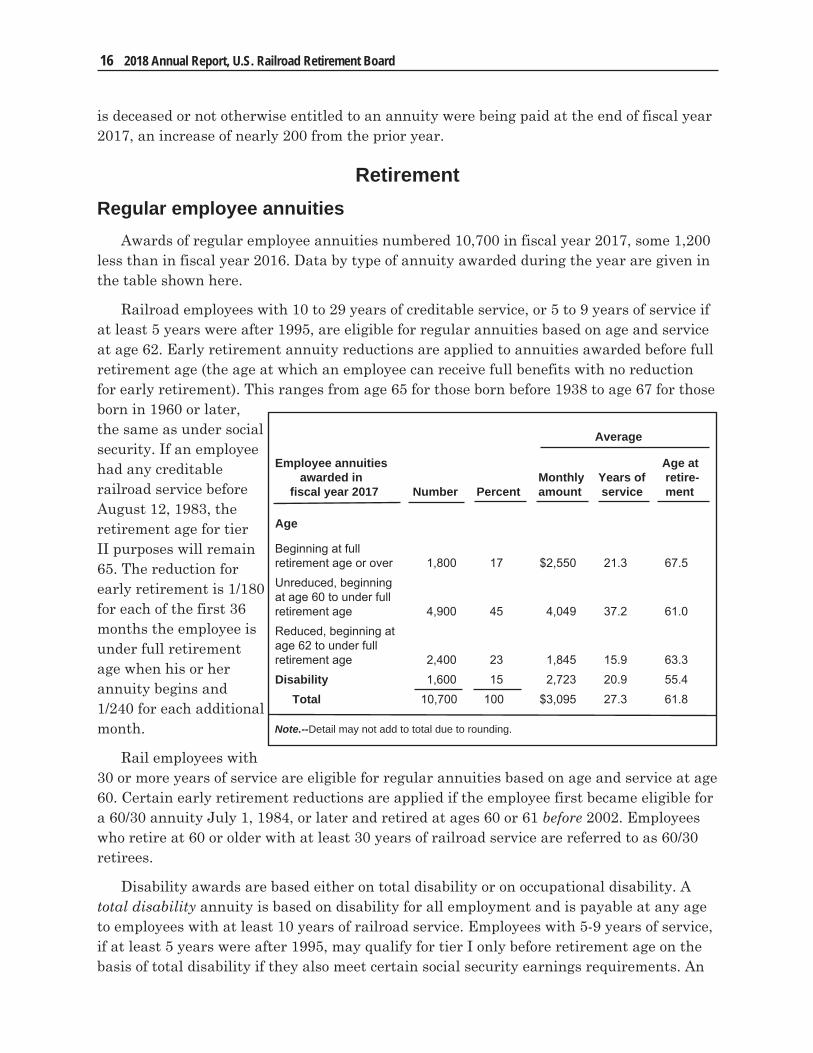
Awards of regular employee annuities numbered 10,700 in fiscal year 2017, some 1,200 less than in fiscal year 2016. Data by type of annuity awarded during the year are given in the table shown here.
Railroad employees with 10 to 29 years of creditable service, or 5 to 9 years of service if at least 5 years were after 1995, are eligible for regular annuities based on age and service at age 62. Early retirement annuity reductions are applied to annuities awarded before full retirement age (the age at which an employee can receive full benefits with no reduction for early retirement). This ranges from age 65 for those born before 1938 to age 67 for those born in 1960 or later, the same as under social security. If an employee had any creditable railroad service before August 12, 1983, the retirement age for tier II purposes will remain 65. The reduction for early retirement is 1/180 for each of the first 36 months the employee is under full retirement age when his or her annuity begins and 1/240 for each additional month.
Rail employees with 30 or more years of service are eligible for regular annuities based on age and service at age 60. Certain early retirement reductions are applied if the employee first became eligible for a 60/30 annuity July 1, 1984, or later and retired at ages 60 or 61 before 2002. Employees who retire at 60 or older with at least 30 years of railroad service are referred to as 60/30 retirees.
Disability awards are based either on total disability or on occupational disability. A total disability annuity is based on disability for all employment and is payable at any age to employees with at least 10 years of railroad service. Employees with 5-9 years of service, if at least 5 years were after 1995, may qualify for tier I only before retirement age on the basis of total disability if they also meet certain social security earnings requirements. An
Average
Employee annuities Age at awarded in Monthly Years of retire- fiscal year 2017 Number Percent amount service ment
Age
Beginning at fullretirement age or over 1,800 17 $2,550 21.3 67.5Unreduced, beginning at age 60 to under fullretirement age 4,900 45 4,049 37.2 61.0Reduced, beginning atage 62 to under fullretirement age 2,400 23 1,845 15.9 63.3Disability 1,600 15 2,723 20.9 55.4
Total 10,700 100 $3,095 27.3 61.8
Note.--Detail may not add to total due to rounding.
A Review of opeRations 17
employee is considered totally disabled if medical evidence shows that a permanent physical or mental condition exists which prevents the performance of any regular work. A condition is considered to be permanent if it has lasted or may be expected to last for at least 12 months.
An occupational disability annuity is based on disability for the employee’s regular railroad occupation and is payable to employees with a current connection with the rail industry at age 60 if the employee has 10 years of service, or at any age if the employee has at least 20 years of service. An employee is considered occupationally disabled if the physical or mental condition is such that the employee is permanently disabled for work in his or her regular railroad occupation, even though the employee may be able to perform other kinds of work.
Of the year’s 1,600 disability awards, 700 averaging $2,029 per month were for total disability and 900 averaging $3,259 were for occupational disability. Many employees who are disabled for all employment but are otherwise qualified for an occupational disability annuity are initially awarded occupational disability annuities in order to expedite payment.
An estimated two-thirds of all employees recently awarded disability annuities will meet the medical criteria for a disability freeze determination. The standards for freeze determinations follow social security law and are comparable to the criteria for granting total disability. Also, an employee granted a disability freeze may qualify
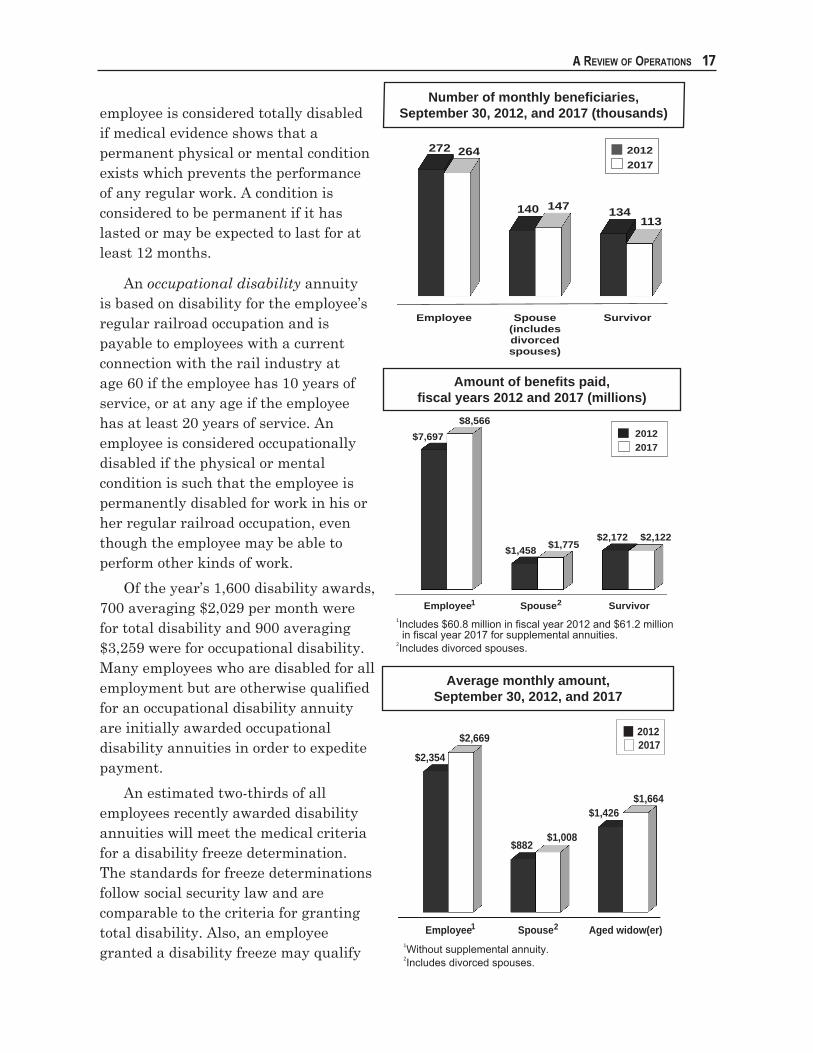
Number of monthly beneficiaries, September 30, 2012, and 2017 (thousands)
Amount of benefits paid,fiscal years 2012 and 2017 (millions)
1Includes $60.8 million in fiscal year 2012 and $61.2 million in fiscal year 2017 for supplemental annuities.
2Includes divorced spouses.
1Without supplemental annuity.2Includes divorced spouses.
Average monthly amount,September 30, 2012, and 2017
Employee Spouse Survivor
$7,697
$1,458$2,172
$8,566
$1,775$2,122
2
20122017
1
Employee Spouse Aged widow(er)
$2,354
$882
$1,426
$2,669
$1,008
$1,664
1 2
20122017
Employee Spouse (includes divorced spouses)
Survivor
272
140 134
264
147113
20122017

18 2018 Annual Report, U.S. Railroad Retirement Board
for early Medicare coverage and lower Federal income taxes on his or her annuity.
Of the employees who were awarded regular annuities in fiscal year 2017, nearly 7,400, or 69 percent, last worked for a railroad either in the calendar year their annuity began or in the preceding year. Such retirements are termed “immediate,” while those that occur 2 or more calendar years after the year of last railroad employment are called “deferred.” As a group, immediate retirees represent career railroad employees who worked in the industry until retirement. Awards based on immediate retirement averaged $3,601 per month, compared to $1,953 for the 3,300 awards based on deferred retirement. Immediate retirees averaged 32 years of railroad service, almost twice the average of 17 years for deferred retirees. Of the year’s awards, 53 percent of normal age retirements were immediate. While 94 percent of all 60/30 retirements were immediate, only 28 percent of the reduced age awards to employees with less than 30 years of service were immediate. Immediate retirements accounted for 76 percent of the year’s disability awards.
The 264,500 retired employees on the rolls as of September 30, 2017, were being paid regular monthly annuities averaging $2,669. The table shown here presents data by type of annuity for these benefits.
Of the 28,000 disability annuities being paid, 9,600 were for total disability and 18,300 for occupational disability. The two types of disability annuities averaged $1,938 and $3,087, respectively. In fiscal year 2017, payments totaled over $243 million for total disability annuities and $772 million for occupational disability annuities.
Approximately 186,800 employees on the rolls at the end of fiscal year 2017 were immediate retirees and their regular annuities averaged $3,082 per month. Annuities of the 77,600 deferred retirees averaged $1,674. Although their average railroad retirement annuity was much lower, a greater proportion of the deferred annuitants also received social security benefits – 25 percent compared to 5 percent for the immediate retirees. Moreover, the average social security benefit paid to deferred retirees was higher than that paid to immediate retirees. Combined railroad retirement
Employee annuities Average Percent in current-payment status monthly immediate on September 30, 2017 Number Percent amount retirementsAgeBeginning at fullretirement age or over 21,300 8 $2,131 48
Unreduced, beginning at age 60 to under fullretirement age 107,400 41 3,487 92
Reduced, beginning atage 60 to under fullretirement age 61,700 23 1,621 29
Disability converted toage annuity1 46,200 17 2,401 81
Disability 28,000 11 2,691 80
Total 264,500 100 $2,669 71
1A disability annuity ends when the retiree attains full retirement age, at which time the annuity converts to an age and service annuity. Consequently, these annuitants are receiving age and service annuities. Full retire-ment age is age 65 for those born before 1938 and gradually increases to age 67 for those born 1960 and later.
Note.--Detail may not add to total due to rounding.
A Review of opeRations 19
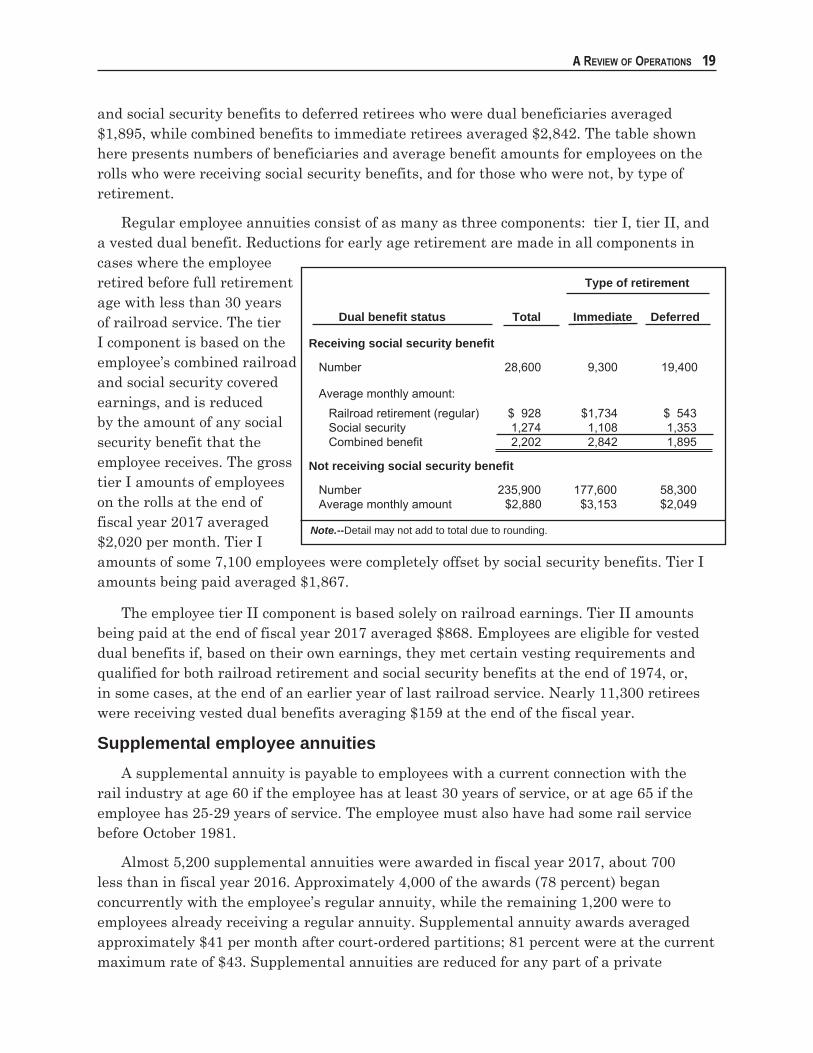
and social security benefits to deferred retirees who were dual beneficiaries averaged $1,895, while combined benefits to immediate retirees averaged $2,842. The table shown here presents numbers of beneficiaries and average benefit amounts for employees on the rolls who were receiving social security benefits, and for those who were not, by type of retirement.
Regular employee annuities consist of as many as three components: tier I, tier II, and a vested dual benefit. Reductions for early age retirement are made in all components in cases where the employee retired before full retirement age with less than 30 years of railroad service. The tier I component is based on the employee’s combined railroad and social security covered earnings, and is reduced by the amount of any social security benefit that the employee receives. The gross tier I amounts of employees on the rolls at the end of fiscal year 2017 averaged $2,020 per month. Tier I amounts of some 7,100 employees were completely offset by social security benefits. Tier I amounts being paid averaged $1,867.
The employee tier II component is based solely on railroad earnings. Tier II amounts being paid at the end of fiscal year 2017 averaged $868. Employees are eligible for vested dual benefits if, based on their own earnings, they met certain vesting requirements and qualified for both railroad retirement and social security benefits at the end of 1974, or, in some cases, at the end of an earlier year of last railroad service. Nearly 11,300 retirees were receiving vested dual benefits averaging $159 at the end of the fiscal year.
Supplemental employee annuitiesA supplemental annuity is payable to employees with a current connection with the
rail industry at age 60 if the employee has at least 30 years of service, or at age 65 if the employee has 25-29 years of service. The employee must also have had some rail service before October 1981.
Almost 5,200 supplemental annuities were awarded in fiscal year 2017, about 700 less than in fiscal year 2016. Approximately 4,000 of the awards (78 percent) began concurrently with the employee’s regular annuity, while the remaining 1,200 were to employees already receiving a regular annuity. Supplemental annuity awards averaged approximately $41 per month after court-ordered partitions; 81 percent were at the current maximum rate of $43. Supplemental annuities are reduced for any part of a private
Type of retirement Dual benefit status Total Immediate Deferred
Receiving social security benefit
Number 28,600 9,300 19,400
Average monthly amount: Railroad retirement (regular) $ 928 $1,734 $ 543 Social security 1,274 1,108 1,353 Combined benefit 2,202 2,842 1,895
Not receiving social security benefit
Number 235,900 177,600 58,300 Average monthly amount $2,880 $3,153 $2,049
Note.--Detail may not add to total due to rounding.
20 2018 Annual Report, U.S. Railroad Retirement Board
railroad pension attributable to employer contributions. During the fiscal year, 1,200 supplemental annuities were not awarded because they were entirely offset by private pensions. In a few cases, the supplemental annuity was partially offset by the pension, or the supplemental annuity was not offset because the pension was reduced.
Supplemental annuities were being paid to almost 122,100, or 46 percent, of the retired employees on the rolls at the end of the 2017 fiscal year. These annuities averaged $42 after court-ordered partitions.
Spouse and divorced spouse annuitiesAnnuity awards to spouses and divorced spouses of retired employees numbered 10,800
in fiscal year 2017, 600 less than in the previous year. The table on page 21 presents numbers and average amounts of spouse and divorced spouse annuities awarded during the year and being paid at the end of the year, by type of annuity and whether subject to age reduction.
If an employee is at least age 62 and retires with 10-29 years of railroad service, or has 5-9 years of service and at least 5 years were after 1995, the employee’s spouse is eligible for an annuity at age 62. Full retirement age for a spouse is gradually rising from 65 to 67, depending on the year of birth. Early retirement reductions are applied to the spouse annuity if the spouse retires before full retirement age. The reduction for early retirement is 1/144 for each of the first 36 months the spouse is under full retirement age when her or his annuity begins and 1/240 for each month (if any) over 36.
If an employee retires with at least 30 years of service and is at least age 60, the employee’s spouse is eligible for an annuity at age 60. Prior to 2002, certain early retirement reductions were applied to the tier I component of such a spouse annuity if the employee retired before age 62, unless the employee attained age 60 and completed 30 years of service prior to July 1, 1984. If a 30-year employee retired at age 62, no age reduction applied to the spouse annuity. December 2001 legislation liberalized early retirement benefits for 30-year employees retiring at ages 60 or 61 after 2001 and their spouses. A spouse of an employee qualified for an age and service annuity is eligible for a spouse annuity at any age if caring for the employee’s unmarried child, and the child is under age 18 or the child became disabled before age 22.
Of the approximately 2,700 reduced spouse annuities awarded in fiscal year 2017, fewer than 50 averaging $836 per month were to spouses of 30-year employees, and over 2,700 averaging $547 were to spouses of employees with less than 30 years of service.
At the end of fiscal year 2017, nearly 141,800 spouse annuities averaging $1,022 per month were being paid. Almost 5,100 divorced spouse annuities averaging $632 per month were also being paid. These included some 80, averaging $662, where the employee was not yet entitled to an annuity. Families with an employee and spouse on the rolls were paid combined railroad retirement benefits averaging $3,915. This included $2,894 in regular and supplemental employee annuities and $1,022 in spouse annuities.

A Review of opeRations 21
Some 56,700, or 39 percent, of the spouses and divorced spouses on the rolls were also receiving social security benefits. Combined railroad retirement and social security benefits to these annuitants averaged $1,558 per month, including $399 in railroad retirement benefits and $1,159 in social security benefits. Railroad retirement annuities to the 87,100 spouses not receiving social security benefits averaged $1,410, while railroad retirement annuities to the 3,000 divorced spouses not receiving social security benefits averaged $842.
Like regular employee annuities, spouse annuities consist of up to three components. The tier I component equals one-half of the employee’s tier I amount before any reduction for the employee’s social security benefit. The spouse tier I amount is reduced for the spouse’s receipt of a social security benefit and may be reduced for a spouse’s public service pension. The tier I portion may also be reduced if the spouse receives a railroad retirement employee annuity, but this reduction is usually restored through an addition to the spouse tier II amount. Divorced spouses receive only a tier I benefit.
The spouse tier II component equals 45 percent of the employee’s tier II amount. Railroad retirement amendments in 1981 precluded further awards of vested dual benefits to spouses.
Of the 141,800 spouses on the rolls at the end of fiscal year 2017, 94,300 were being paid tier I amounts averaging $895 per month. The tier I amounts of 47,500 spouses were completely offset by other benefits also due. Spouse tier II amounts averaged $464. Vested dual benefits averaging $128 were being paid to fewer than 10 spouses. The 5,100 divorced spouses on the rolls at the end of fiscal year 2017 were being paid tier I amounts averaging $648 per month, not reflecting all annuity adjustments.
Lump-sum retirement benefitsA lump-sum benefit may be payable at retirement to employees who received
separation or severance payments after 1984. This benefit approximates the tier II payroll taxes deducted from separation or severance payments that did not yield additional service
In current-payment Awarded in status on fiscal year 2017 September 30, 2017 Monthly spouse Average Average benefits Number amount Number amount
Beginning at full retirement age or over 1,800 $ 624 17,100 $ 582With minor or disabled child in care 300 1,273 1,700 1,308
Unreduced, beginning at age 60 to under full retirement age 5,200 1,493 77,500 1,410
Reduced rate 2,700 548 45,500 514
Total 10,100 1,073 141,800 1,022Divorced spouseannuities 700 669 5,100 632
Grand total 10,800 $1,047 146,900 $1,008
Note.--Detail may not add to total due to rounding.
22 2018 Annual Report, U.S. Railroad Retirement Board
credits for retirement. About $0.3 million was paid in separation/severance lump-sum benefits during fiscal year 2017.
Employees who have at least 10 years of railroad service and are not entitled to a vested dual benefit may be eligible for a dual retirement tax refund if they had concurrent railroad retirement and social security earnings within the period 1951-74. The refund is equal to the social security taxes that the employee paid on the combined railroad and social security earnings in excess of the annual railroad retirement creditable earnings maximum. During the 2017 fiscal year, the RRB paid over 100 dual retirement tax refunds averaging $77. Most of the payments were to employees retiring during the year. Fewer than 50 refunds were to survivors, mostly widows, of employees who died before receiving the refund. Employees entitled to dual retirement tax refunds for years after 1974 may claim them on their Federal income tax returns.
Survivor Monthly benefits
Annuity awards to survivors of deceased railroad employees numbered 6,900 during fiscal year 2017, about 200 more than the previous year. Some 113,200 survivor annuities were being paid at the end of the fiscal year, including 300 temporarily paid at spouse or divorced spouse annuity rates pending recomputation to widow(er)s’ rates. Approximately 87,800, or 78 percent, of the survivor annuities were to aged widows and widowers.1
The table on page 23 presents numbers and average monthly amounts of survivor annuities, by type, for those awarded in the year and those being paid at the end of the year.
Survivor annuities, like regular employee and spouse annuities, consist of as many as three components: tier I, tier II and, for widows and widowers only, a vested dual benefit. As with spouses, legislation in 1981 precluded new awards of vested dual benefits to widow(er)s. The tier I component is computed according to social security formulas and is based on the deceased employee’s combined railroad and social security earnings. A reduction is made for the survivor’s receipt of a social security benefit. There may also be a tier I reduction if the survivor receives a railroad retirement employee annuity or public pension. Remarried and divorced widow(er)s receive a tier I benefit only. A dependent parent receives only a tier I amount if another family member is also receiving benefits or if the parent has remarried.
Survivor tier II amounts are figured as a percentage of an employee tier II benefit. Prior to 2002, the percentages were 50 percent for a widow(er), 15 percent for a child, and 35 per-cent for a parent. The total tier II amount for a survivor family was subject to a minimum of 35 percent and a maximum of 80 percent of the employee tier II benefit, and all survivor tier II amounts were proportionately adjusted when either limit applied. December 2001 legislation established an “initial minimum amount” for widow(er)s which provides a tier II benefit equal to 100 percent of the tier II amount of the deceased employee. The maximum tier II amount payable to a family rose to 130 percent of the employee’s tier II amount. 1Aged widower statistics in the Survivor section exclude benefits to disabled widow(er)s age 60 and over now payable as
aged widow(er)’s annuities.

A Review of opeRations 23
Widows and widowers are guaranteed a total tier I and tier II amount not less than what they were paid as a spouse, any necessary increase being added to tier II.
Aged widow(er)s, who are eligible for benefits at age 60, have their tier I and tier II amounts reduced if the annuity begins before full retirement age. The eligibility age for unreduced annuities is gradually rising from age 65 to age 67. The maximum age reductions range from 17.1 percent to 20.36 percent, depending on the widow(er)’s date of birth. Excluding nearly 300 annuities temporarily paid at spouse or divorced spouse rates, aged widow(er)s’ annuities being paid at the end of the 2017 fiscal year included 44,900 which were reduced for age. Aged widow(er)s’ tier I amounts being paid averaged $1,318 per month. In nearly 6,700 cases, the tier I amount was wholly offset by reductions for other benefits. Approximately 28,500 aged widow(er)s were also receiving social security benefits, and these averaged $1,059. Tier II amounts averaged $448. About 100 vested dual benefits, averaging $72, were being paid to aged widow(er)s.
The tier I and tier II amounts of disabled widow(er)s’ annuities, which begin at ages 50-59, are reduced 28.5 percent for age. At the end of fiscal year 2017, tier I amounts being paid to disabled widow(er)s on the rolls averaged $1,083. (In about 100 cases, the tier I amount was wholly offset by reductions.) Social security benefits being paid to some 1,400 disabled widow(er)s averaged $940. Tier II amounts averaged $287, while the less than 50 vested dual benefits being paid averaged $107.
Tier I amounts paid to widowed mothers and fathers (widows and widowers caring for children) generally equal 75 percent of the full amount payable to an aged widow(er) before any reductions, similar to a social security mother’s or father’s benefit. Eligible children and grandchildren are paid this same tier I amount. However, if the sum of the tier I amounts of all members of a survivor family exceeds the social security family maximum, then tier I amounts are proportionately reduced so that the total equals the maximum. Reductions for the family maximum usually occur when the family includes three or more
In current-payment Awarded in status on fiscal year 2017 September 30, 2017
Monthly survivor Average Average benefits Number amount Number amount Aged widow(er)s 5,500 $2,113 87,800 $1,664
Disabled widow(er)s1 100 1,752 3,500 1,326 Widowed mothers (fathers) 100 1,806 600 1,878
Remarried widow(er)s 100 1,189 3,000 1,071 Divorced widow(er)s 700 1,209 9,700 1,078 Children: Under age 18 300 1,379 1,600 1,382 Student * 1,553 100 1,497 Disabled 100 1,300 6,800 999
Parents * 844 * 907 Total 6,900 ... 113,200 ...
1Number and average in current-payment status include annuities to disabled widow(er)s age 60 and over now payable as aged widow(er)s’ annuities.
*Fewer than 50.
Note.--Detail may not add to total due to rounding.
24 2018 Annual Report, U.S. Railroad Retirement Board
beneficiaries. Tier I amounts being paid as of the end of fiscal year 2017 averaged $1,341 for widowed mothers and fathers and $995 for children. Fewer than 50 mothers/fathers and nearly 2,100 children received social security benefits averaging $1,088 and $633, respectively. Tier II amounts paid mothers/fathers and children averaged, respectively, $574 and $113.
Lump-sum survivor benefitsA lump-sum death benefit can be payable at the time of an employee’s death only
if there are no survivors immediately eligible for monthly benefits. For survivors of employees who had at least 10 years of railroad service before 1975, the lump-sum death benefit is based on the employee’s earnings through 1974, with a maximum amount of approximately $1,200. If the employee completed the 10th year of service after 1974, the lump-sum death benefit is limited to $255, the maximum benefit payable under social security law, and only the widow or widower living in the same household is eligible for the benefit. Lump-sum benefits may also be payable to survivors of employees with less than 10 years of service, but at least 5 years after 1995, if the employee met the social security insured status requirements. More than 2,500 lump-sum death benefits averaging $933 were awarded during fiscal year 2017. Approximately 300 benefits were to widow(er)s, while some 2,200 were to other individuals who paid the funeral expenses.
Another lump-sum survivor benefit, the residual payment, can be made if no other benefits based at least in part on an employee’s railroad service will be payable in the future, and the total of prior benefit payments is less than what the employee paid in pre-1975 railroad retirement taxes. Fewer than 10 residual payments were awarded in the 2017 fiscal year; they averaged $1,040.
Partition PaymentsThe Pension Protection Act of 2006, as amended, continues the court-ordered
partitioned portion of the tier II, vested dual and supplemental benefit payments to former spouses after the death of the employee. It also allows for payment of court-ordered partitioned payments where the employee is not entitled to an annuity if (1) the employee has 120 months of railroad service or 60 months of service after 1995, and (2) both the employee and spouse or divorced spouse are 62 for a full month, or, if the employee is deceased, the employee would be 62 for a full month.
At the end of fiscal year 2017, there were nearly 1,700 spouses and divorced spouses receiving payments averaging $315 where the employee was deceased or not otherwise entitled to an annuity. While all but 4 received a partitioned tier II benefit, only 4 percent received a partitioned vested dual benefit and 36 percent received a partitioned supplemental benefit.
A Review of opeRations 25
Medicare EnrollmentsThe Medicare program provides health insurance to persons ages 65 and older, as
well as persons under age 65 who have been entitled to monthly benefits based on total disability for at least 24 months. In the case of some disability diagnoses, the waiting period is waived.
Medicare has several parts to its program. Basic hospital insurance, or Medicare Part A, is financed through payroll taxes. There is also an elective supplementary medical insurance, or Medicare Part B, plan for which monthly premiums are charged. Medicare also offers Medicare Part C (Medicare Advantage) plans that include both Parts A and B coverage and additional benefits, sometimes at an additional cost. Finally, Medicare Part D provides optional prescription drug coverage for an additional premium. Medicare Parts C and D are offered through private insurance companies approved by Medicare.
Eligible railroad retirement annuitants and social security beneficiaries whose benefits are payable by the RRB are automatically enrolled under Part A and Part B; however, Part B may be declined by the annuitant or beneficiary. Eligible nonretired persons must apply in order to obtain Medicare coverage. The RRB automatically enrolled more than 26,400 beneficiaries for Medicare during fiscal year 2017. As of the end of the fiscal year, about 465,900 persons were enrolled in the Part A plan, and approximately 446,400 (96 percent) of them were also enrolled in Part B.
Except for benefits for services in Canada, which are paid from the Railroad Retirement Account, Part A benefits for railroad enrollees are paid from the Federal Hospital Insurance Trust Fund, the same as for persons covered under the social security system. Part B benefits are paid from the Federal Supplementary Medical Insurance (SMI) Trust Funds. The carrier for Part B claims of railroad Medicare enrollees made payments totaling $850 million in the 2017 fiscal year.
The regular monthly premium for Part B during fiscal year 2017 was $121.80 for coverage through December 2016 and $134.00 thereafter. Beneficiaries with modified adjusted gross incomes above certain thresholds pay higher Part B and Part D premiums under the Income Related Monthly Adjustment Amount (IRMAA) provisions of law. At the end of fiscal year 2017, approximately 14,300 Part B premiums and about 11,300 Part D premiums were increased by an IRMAA amount.
The RRB generally withholds Part B premiums from the annuitant’s benefit payments, and at the end of fiscal year 2017 about 427,100 annuitants were having their premiums withheld. Of the remaining Part B enrollees, nearly 3,000 were paying premiums to the RRB, either directly or through an intermediary, and 16,300 had their premiums paid by state agencies. The RRB periodically transfers premiums to the SMI Trust Funds.
The agency is also able to collect Part C and Part D premiums from monthly benefits through an exchange process. While this option has grown in popularity, many annuitants pay their Part C and Part D premiums directly to their plan. At the end of fiscal year 2017, about 12,300 Part C premiums and approximately 49,300 Part D premiums were deducted from benefits paid by the RRB.

26 2018 Annual Report, U.S. Railroad Retirement Board
RAILROAD UNEMPLOYMENT AND SICKNESS INSURANCE PROGRAM
FINANCIAL OPERATIONSCosts for the railroad unemployment and sickness insurance program during fiscal year
2017 were less than financing sources by $10.0 million and the net position increased by $9.9 million from $214.6 million at the end of fiscal year 2016 to $224.5 million at the end of fiscal year 2017. For fiscal year 2017 as compared to fiscal year 2016, total financing sources for the railroad unemployment and sickness insurance program increased by $12.1 million (11.7 percent) to $115.2 million.
(text continued on page 28)
Unemployment and Sickness Insurance ProgramConsolidated Financing Sources, Costs and Net Position (Millions)1
For the Fiscal Year Ended September 30 2017 2016
Financing Sources: Employer Payroll Taxes $126.4 $117.2 Interest Income 4.0 2.3 General Appropriations 0.0 0.0 Other (15.2) (16.4)
Total Financing Sources 115.2 103.1
Costs: Benefit Payments: Unemployment 47.6 74.9 Sickness 56.8 51.8 Other2 0.8 5.6
Total Costs 105.2 132.3
Financing Sources over Costs 10.0 (29.2)Net Position - Beginning of Period 214.6 243.8
Net Position - End of Period2 $224.6 $214.6
1 Prepared on an accrual basis of accounting. 2 Includes funds from the American Recovery and Reinvestment Act of 2009, and the Worker, Homeownership, and Business Assistance Act of 2009, as amended.

A Review of opeRations 27
Benefit Payments 100%$104.4
F i n a n c i n g S o u r c e s - F i s c a l Y e a r 2 0 1 7 ( I n M i l l i o n s )GROSS TOTAL $130.4
UNEMPLOYMENT AND SICKNESS INSURANCE PROGRAM
1Less Transfers-Out and carriers’ refunds of $15.2 million.
C o s t s - F i s c a l Y e a r 2 0 1 7 ( I n M i l l i o n s )TOTAL $104.4
Employer Payroll Taxes1 96.9%
$126.4
Interest Income 3.1%$4.0
28 2018 Annual Report, U.S. Railroad Retirement Board
Financing Sources
The primary ongoing financing source of the railroad unemployment and sickness insurance program is a payroll tax on railroad employers, based on the taxable earnings of their employees. The employees themselves are not taxed.
Each employer pays taxes at a rate which takes into consideration its employees’ actual incidence of benefit usage. Under experience rating, employers whose employees have low incidences of unemployment and sickness pay taxes at a lower rate than those with higher levels of benefit usage. Each employer’s rate also has a component for administrative expenses and a component to cover costs shared by all employers. The rate applies to monthly earnings up to an indexed maximum. In calendar year 2017, the taxable earnings base was the first $1,545 of each employee’s monthly earnings. The earnings base is indexed each year by a rate which is equal to approximately two-thirds of the annual rate of increase in the maximum base for railroad retirement tier I taxes.
In 2017, the basic tax rates on railroad employers, including covered commuter railroads, ranged from a minimum of 2.15 percent to a maximum of 12.0 percent. There was also a surcharge of 1.5 percent in 2017. Most employers were assessed the minimum rate in 2017. New employers in 2017 paid an initial rate of 1.62 percent.
Employer Payroll TaxesPayroll taxes by employers totaled $126.4 million during fiscal year 2017. This was an
increase of 7.8 percent or $9.2 million more than the previous year.
InterestCash not needed immediately for unemployment and sickness insurance benefits
or operating expenses is held in the Federal Unemployment Insurance Trust Fund and invested by the Secretary of the Treasury. The fund earned an average rate of return of 2.2 percent in fiscal year 2017, of which the RRB earned $4.0 million as its pro rata share.
CostsTotal costs for the railroad unemployment and sickness insurance program decreased
by $27.1 million (20.5 percent) to $105.2 million.
Benefit PaymentsDuring fiscal year 2017, unemployment insurance benefit payments decreased by
$27.3 million (36.4 percent) to $47.6 million. Sickness insurance benefit payments increased by $5.0 million (9.7 percent) to $56.8 million.
A Review of opeRations 29
BENEFIT OPERATIONS
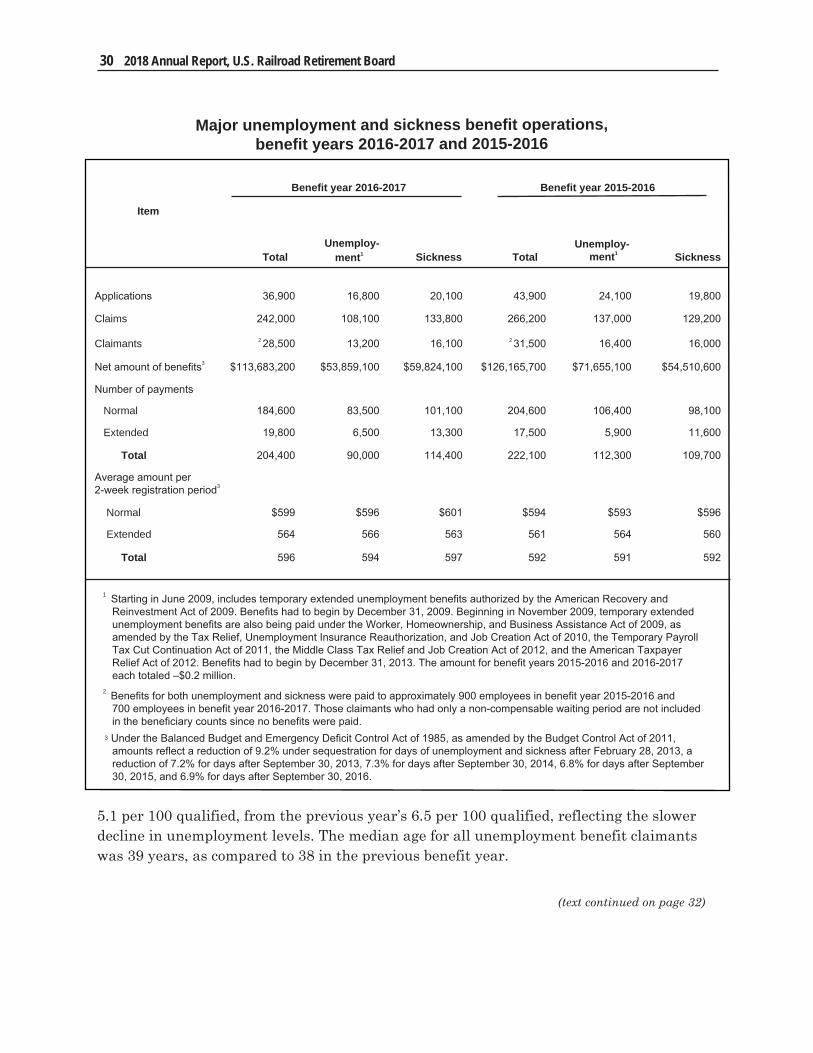
Net unemployment and sickness benefits totaling nearly $113.7 million were paid in the 2016-2017 benefit year, $12.5 million less than in the prior year. In accordance with the Balanced Budget and Emergency Deficit Control Act of 1985, as amended by the Budget Control Act of 2011, amounts reflect a reduction of 7.2 percent for days of unemployment and sickness after September 30, 2013, 7.3 percent for days after September 30, 2014, 6.8 percent for days after September 30, 2015, and 6.9 percent for days after September 30, 2016. Beneficiaries numbered 28,500, in comparison to the previous year’s total of 31,500. Almost 700 employees received both unemployment and sickness benefits during the 2016-2017 benefit year. The number of unemployment benefit claimants decreased by 20 percent, while sickness benefit claimants increased by less than 1 percent. Total net unemployment benefit payments decreased by 25 percent, while net sickness benefits increased by 10 percent. The number of employees qualified for benefits under the Railroad Unemployment Insurance Act increased 3 percent to 260,700.
Benefits are payable for each day of unemployment or sickness in excess of 7 during the first 14-day registration period in a benefit year. During benefit year 2016-2017, there were 10,600 and 13,700 unemployment and sickness benefit waiting period claims, respectively.
Unemployment
Almost 13,200 railroad workers were paid $53.9 million in net unemployment benefits during the 2016-2017 benefit year, including $0.2 million in recovered temporary extended benefits under the American Recovery and Reinvestment Act of 2009 and the Worker, Homeownership, and Business Assistance Act of 2009, as amended by the Tax Relief, Unemployment Insurance Reauthorization, and Job Creation Act of 2010, the Temporary Payroll Tax Cut Continuation Act of 2011, the Middle Class Tax Relief and Job Creation Act of 2012, and the American Taxpayer Relief Act of 2012. The number of benefit claimants decreased by approximately 3,200 from the prior year total of 16,400, and the benefit amount decreased $17.8 million from the prior year’s total of $71.7 million. The average number of compensable days per unemployment benefit claimant was 68 in benefit year 2016-2017, the same as the previous benefit year.
The mid-month unemployment count in the 2016-2017 benefit year began with a July count of 4,100 claimants. The count fluctuated slightly higher until December 2016, when it began to rise before peaking at 5,300 in January 2017. The count began to decline in February before reaching a low of 2,300 in June 2017. For the 2016-2017 benefit year as a whole, the weekly number of claimants averaged 3,800 in comparison to an average of 4,800 in the previous benefit year. The overall unemployment benefit claimant rate, measured in relation to the number of employees qualified to receive benefits under the Railroad Unemployment Insurance Act during a particular time period, fell 22 percent to
NOTE.--Railroad unemployment and sickness benefits are paid on the basis of benefit years beginning July 1 and ending June 30 of the following year. Consequently, operational data in this “Benefit Operations” section are generally presented for this time span, rather than fiscal years beginning October 1 and ending September 30.
30 2018 Annual Report, U.S. Railroad Retirement Board
Item
Benefit year 2016-2017 Benefit year 2015-2016
Total
Unemploy-
ment1
Sickness
Total
Unemploy-
ment1
Sickness
Applications 36,900 16,800 20,100 43,900 24,100 19,800
Claims 242,000 108,100 133,800 266,200 137,000 129,200
Claimants 2 28,500 13,200 16,100 2 31,500 16,400 16,000
Net amount of benefits3 $113,683,200 $53,859,100 $59,824,100 $126,165,700 $71,655,100 $54,510,600
Number of payments
Normal 184,600 83,500 101,100 204,600 106,400 98,100
Extended 19,800 6,500 13,300 17,500 5,900 11,600
Total 204,400 90,000 114,400 222,100 112,300 109,700
Average amount per 2-week registration period3
Normal $599 $596 $601 $594 $593 $596
Extended 564 566 563 561 564 560
Total 596 594 597 592 591 592
1 Starting in June 2009, includes temporary extended unemployment benefits authorized by the American Recovery and Reinvestment Act of 2009. Benefits had to begin by December 31, 2009. Beginning in November 2009, temporary extended unemployment benefits are also being paid under the Worker, Homeownership, and Business Assistance Act of 2009, as amended by the Tax Relief, Unemployment Insurance Reauthorization, and Job Creation Act of 2010, the Temporary Payroll Tax Cut Continuation Act of 2011, the Middle Class Tax Relief and Job Creation Act of 2012, and the American Taxpayer Relief Act of 2012. Benefits had to begin by December 31, 2013. The amount for benefit years 2015-2016 and 2016-2017 each totaled –$0.2 million.
2 Benefits for both unemployment and sickness were paid to approximately 900 employees in benefit year 2015-2016 and 700 employees in benefit year 2016-2017. Those claimants who had only a non-compensable waiting period are not included in the beneficiary counts since no benefits were paid.
3 Under the Balanced Budget and Emergency Deficit Control Act of 1985, as amended by the Budget Control Act of 2011, amounts reflect a reduction of 9.2% under sequestration for days of unemployment and sickness after February 28, 2013, a reduction of 7.2% for days after September 30, 2013, 7.3% for days after September 30, 2014, 6.8% for days after September 30, 2015, and 6.9% for days after September 30, 2016.
Major unemployment and sickness benefit operations, benefit years 2016-2017 and 2015-2016
(text continued on page 32)
5.1 per 100 qualified, from the previous year’s 6.5 per 100 qualified, reflecting the slower decline in unemployment levels. The median age for all unemployment benefit claimants was 39 years, as compared to 38 in the previous benefit year.

a Review of opeRations 31
Unemployment and Sickness Benefit Claimants by Age, Benefit Year 2016-2017
Claimants under the Railroad Unemployment Insurance Act, Benefit Years 2012-2013 through 2016-2017
10,7149,970
7,568
16,420
13,194
15,841 15,611 15,516 15,963 16,052
2012-2013 2013-2014 2014-2015 2015-2016 2016-2017
Unemployment
Sickness
419
4,173 4,152
2,783
1,565
10284
1,954
3,787
4,506
5,210
511
Under 25 25-34 35-44 45-54 55-64 65 & Over
Unemployment
Sickness

32 2018 Annual Report, U.S. Railroad Retirement Board
SicknessThe number of sickness benefit claimants during the 2016-2017 benefit year was
16,100, about 100 more than the previous year. The benefit year claimant count increased for the second year in a row after hitting the lowest level since sickness benefits began in benefit year 1947-1948. Gross sickness benefits of $77.1 million were paid, $3.2 million more than in the prior benefit year. Net sickness benefits totaled $59.8 million, reflecting repayment of a large amount of benefits following settlements of suits for injuries. Benefits payable for an injury are recoverable if the claimant is awarded damages or receives a settlement for the injury. Net benefits increased by $5.3 million in comparison with the previous year.
The utilization rate for sickness benefits was 6.2 percent of qualified employees, slightly lower than the previous benefit year and the lowest figure since the program’s inception. The average duration of sickness was 71 days in benefit year 2016-2017, up from 69 in the previous benefit year.
Among the most common causes of sickness were injuries that included fractures or wounds (affecting 27 percent of beneficiaries), arthritis and disk disorders (22 percent), mental disorders, including drug and alcohol addictions (12 percent), and symptoms, signs and all ill-defined conditions (7 percent). The median age of all sickness benefit claimants was 49 years, the same as the previous benefit year.
a Review of opeRations 33
RAILROAD EMPLOYMENT
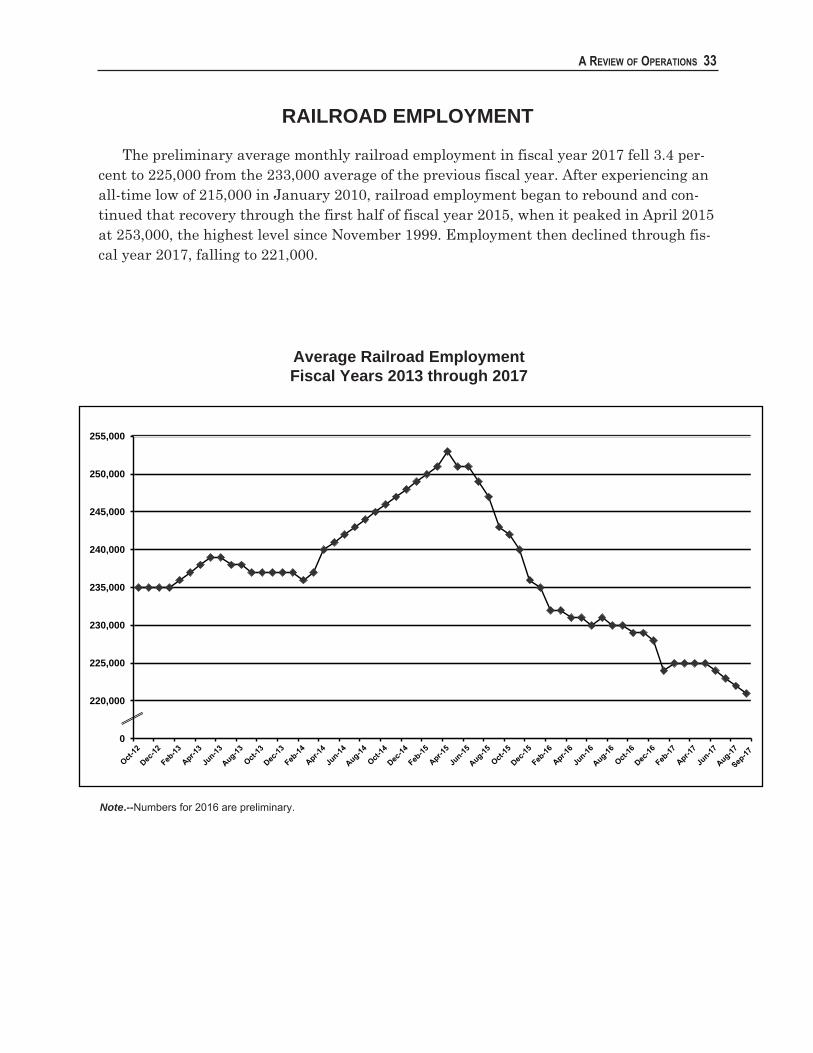
The preliminary average monthly railroad employment in fiscal year 2017 fell 3.4 per-cent to 225,000 from the 233,000 average of the previous fiscal year. After experiencing an all-time low of 215,000 in January 2010, railroad employment began to rebound and con-tinued that recovery through the first half of fiscal year 2015, when it peaked in April 2015 at 253,000, the highest level since November 1999. Employment then declined through fis-cal year 2017, falling to 221,000.
Note.--Numbers for 2016 are preliminary.
Average Railroad EmploymentFiscal Years 2013 through 2017
215,000
220,000
225,000
230,000
235,000
240,000
245,000
250,000
255,000
34
Performance Management
Customer Service Plan
The RRB’s Customer Service Plan promotes the principles and objectives of customer-driven quality service agency-wide. An important part of the plan is to
keep customers informed of how well the RRB is meeting timeliness standards. The RRB publicizes the Customer Service Plan and performance results and posts them in every field office. The plan is reviewed and updated periodically based on agency experience, customer feedback and comparison with similar best-in-business models.
The agency uses an index to measure the overall timeliness of customer service in 4 benefit areas: retirement applications; survivor applications; disability applications and payments; and railroad unemployment and sickness benefit applications and claims. In addition, this composite indicator, based on a weighted average, allows for a more concise and meaningful presentation of its customer service efforts in these 4 areas. During fiscal year 2017, the overall benefit timeliness index was 98.9 percent. This means that the RRB provided benefit services within the timeframes promised in the Customer Service Plan 98.9 percent of the time. The timeliness index for retirement applications, survivor applications, disability applications and payments only, the processing of which includes considerable manual intervention, is 91 percent, whereas the timeliness index for railroad unemployment and sickness benefit applications and claims only, a highly automated process, is 99.9 percent. Overall performance and processing times during fiscal year 2017 were the same as in fiscal year 2016 levels. (The composite for 2016 was also 98.9.) The RRB also met or exceeded 7 out of 10 of its customer service performance goals for the year in its Annual Performance Plan.
Reducing Improper PaymentsThe RRB developed an agency risk assessment plan in response to provisions of the
Improper Payments Elimination and Recovery Act and Office of Management and Budget (OMB) guidance. The objective is to evaluate payment outlays susceptible to improper payments by assessing risk for all of the benefit and non-benefit programs that the agency administers. The agency completed risk assessments for the Railroad Retirement Act (RRA), Railroad Unemployment Insurance Act (RUIA), and Medicare programs in fiscal
AdministrAtive developmentsThe following describes some major activities and issues addressed in 2017 and 2018
as part of the RRB’s efforts to improve operations and customer service.
AdministrAtive developments 35
year 2016. Per OMB guidance, the fiscal year 2019 Annual Performance Plan will be the next time risk assessments for these programs have to be completed.
In fiscal year 2017, the agency’s Office of Programs reviewed its RRA and RUIA benefit payment programs for fiscal year 2016, as required by OMB Circulars A-123 and A-136. (This analysis has been conducted annually since fiscal year 2003.) The RRB’s Performance and Accountability Report for fiscal year 2017 (based on fiscal year 2016 data) includes the results of that analysis, along with a summary of the root causes of errors and projections of future improper payment levels. The analysis shows that the RRB does not have significant improper payments, as defined by OMB guidelines for implementing the Improper Payments Information Act of 2002.
The fiscal year 2017 report was unlike previous agency reports, in that it used 3 quarters of data from the RRB’s legacy Program Accounts Receivable system, and 1 quarter of data from its newest accounting system, the Financial Management Integrated System, to compile the improper payment analysis for the RRA and RUIA programs.
In addition, at OMB’s request, the agency submitted an improper payment reduction outlook, a breakdown of the root causes, amounts, and percentages of fiscal year 2016 RRA and RUIA improper payments, and overpayments recaptured outside payment-recapture audits, as well as the dollar amount of confirmed fraud by the Office of Inspector General. Information from this request was included on PaymentAccuracy.gov, an OMB-designed website which features improper-payment rates for all government agencies.
The RRB will continue to review its benefit payment programs to determine if the level of improper payments is significant. Ongoing activities aimed at improving the accuracy of payments and reducing erroneous payments include automation enhancements, quality assurance reviews, and monitoring programs. This includes looking for additional operational improvements to minimize improper payments and enhance recovery efforts.
Disability Benefits
The RRB undertook several initiatives to improve the accuracy and timeliness of disability claims processing.
• In May 2017, “The Work Number” was implemented for use by initial disability claims examiners. This system allows agency employees to obtain income verification reports that contain basic employment information about an individual’s job title, employment status, and income. Such information can be extremely useful in adjudicating disability benefit applications. In August 2017, this system was expanded to include post examiners conducting continuing disability reviews for existing annuitants.
• The agency developed a new form, the Occupational Disability Certification (RL-8A), which is released to select disability annuitants to help determine

36 2018 Annual Report, U.S. Railroad Retirement Board
whether they continue to be disabled. The form was first released to 152 disability annuitants in August 2017.
• While all initial disability claim types (employee, widow, and children) have been converted from paper files to digital images, in 2018 the RRB plans to add more disability workloads to this project, such as continuing disability reviews. Coupled with the reengineering of other business processes, this will enhance migration from a paper-based system to an electronic environment for all disability benefit processes.
Service Enhancements
Employer Reporting SystemThe Employer Reporting System (ERS) is a web-based platform that enables railroad
employers to submit information to the RRB in an electronic format instead of mailing paper forms. In fiscal year 2017, the agency added an electronic version of Form RL-5a, Notice of Annuity Award, and Form G73a.1, Notice of Death of Railroad Retirement Annuitant, to the ERS. Employers can now receive both notices electronically and on-demand via the internet. As additional employers enroll in this service, this will reduce manual processing, as well as printing and mailing costs.
Cost-of-Living AdjustmentIn December 2017, tier I benefits increased by 2 percent while tier II benefits rose by
0.7 percent, due to a cost-of-living adjustment (COLA). The increases were effective with the January 2018 payments, with Federal income taxes calculated using new tax tables. The increase was paid to 528,376 annuitants, and was also included in RRB-paid social security benefits to 118,324 beneficiaries. The total amount of the COLA was just over $14.4 million in railroad retirement annuities and almost $2.8 million in social security benefits. The standard Medicare Part B premium for 2017 stayed the same as the previous year at $134 per month, with increased premiums for some high-income beneficiaries.
Medicare Payments and PremiumsThe Medicare Payment System went into production in January 2017. This system
was developed to allow Medicare claims examiners to create award activities for refunding Medicare premiums and paying Medicare Part A hospital insurance benefits for services furnished in Canada. In addition, a new Medicare interface with the agency’s Overpayment Recovery Correspondence System went into production in April 2017. This system can now be used by Medicare examiners to review overpayments and prepare letters to beneficiaries that are more informative and timely.
AdministrAtive developments 37
Officials
Walter A. Barrows continues to serve as the Labor Member, as does Steven J. Anthony as the Management Member. Mr. Barrows was appointed to the Board in 2011 and Mr. Anthony in 2014. The office of Chairman of the Board has been vacant since August 2015. Martin J. Dickman has been the Inspector General for the RRB since 1994.
In June 2017, the Board named Ana M. Kocur as its General Counsel. At the time of her appointment, she was Deputy Director of the Executive Office for Immigration Review at the Department of Justice in Washington, D.C. In March 2018, the Board named Shawna R. Weekley as its Chief Financial Officer and Pamela M. Tate as its Director of Equal Opportunity. Before joining the RRB’s Bureau of Fiscal Operations in January 2017, Ms. Weekley worked for the Department of Energy, most recently as Director of Accounting and Finance at its Chicago Office of Science, based at Argonne National Laboratory. Ms. Tate has been an RRB employee since 1985, starting out as a claims examiner. Since 2008, she has been an equal employment specialist at the agency.
Human Capital Management
StaffingLike other organizations in the Federal community, the RRB has an aging workforce
with about 50 percent of its employees having 20 or more years of service. Additionally, about 30 percent of the agency’s current workforce will be eligible for retirement by the end of fiscal year 2019. To help cope with the loss of experience and bridge the knowledge gap, the RRB is placing increased emphasis on strategic management of human capital, particularly in the areas of training, development and succession planning. A new methodology is currently being developed to identify potential areas of skills and knowledge gaps and is planned to be implemented within the Learning Management System (LMS). This methodology will incorporate job analysis of agency positions to identify critical competencies and identify skill gaps within our current employee base.
The RRB continues to work on improving its assessment and hiring processes. With assistance from the Office of Personnel Management (OPM), the agency has developed online assessment tools for entry-level claims examiners and claims representative positions. Because of budget constraints, external hiring slowed considerably in 2017, and the agency was unable to hire any external candidates for retirement, survivor, Medicare, and sickness/unemployment claims examiner or claims representative positions. The RRB does expect to fill several of these positions in fiscal year 2018, along with some external hires in actuarial and information technology positions.
Despite the lack of external hiring in 2017, several training classes for new claims examiners were initiated or completed, including initial and post examiners in the areas of disability benefits, retirement benefits, survivor benefits, unemployment and sickness
38 2018 Annual Report, U.S. Railroad Retirement Board
benefits, and Medicare. The RRB projects a continuing need for additional initial and post training classes in the RRA and RUIA program areas into fiscal year 2019.
TrainingThe training section in the RRB’s Bureau of Human Resources continues to create,
implement and modify an overall training program with the goal of creating opportunities to assist employees in building the knowledge, skills and abilities needed to achieve the agency’s strategic goals. In 2017, they hosted the first ever employee fair for headquarters employees. It was a 2-day event that included workshops and informational booths for different RRB-provided services and topics. In addition, the training team conducted workshops on individual development plans throughout the year. They also hosted and coordinated a 3-day program for new supervisors; created and published online courseware to the agency’s Learning Management System (LMS) to satisfy mandatory Federal training requirements, as well as online training for new policies and procedures implemented during the year; assisted in developing LMS training curriculums for new claims representatives and claims examiners; and, coordinated the delivery of more than 25 in-person, instructor-led training sessions on 19 technical and soft-skill topics.
The agency continues to use its LMS, also known as RRB University, as the cornerstone of its training and development activities. This platform allows the agency to accurately track, document and deliver training opportunities to employees throughout the RRB, and has been incorporated into mandatory technical training for employees in the agency’s Bureau of Field Service and Office of Programs. In 2017, more than 989 employees and contractors completed 832 different online and instructor-led training courses managed through the LMS, for a total of 19,020 course completions.
In 2017, the Office of Programs also completed a 9-month training program for user analysts in its Policy and Systems division. These employees develop procedures and testing, and update systems for examiner use in handling benefit applications and claims. Enhancing analyst skills in these areas will allow the agency to improve the performance of claims examiners in adjudicating, processing and paying benefits.
Employee SurveyThe Federal Employee Viewpoint Survey, developed by OPM, is a tool that measures
employees’ perceptions of whether, and to what extent, conditions characterizing successful organizations are present in their agencies. Similar to prior years, the responses by RRB employees to the 2017 survey were positive. Of particular note, of the 870 employees invited to complete the survey, 449 did so, for a response rate of 52 percent, an increase of 14 percent over 2016. Scoring for 55 survey items increased from 2016, while only 11 items had lower scores. Additionally, 41 survey items were identified as strengths (65 percent or more positive) while only 1 survey item was identified as a challenge (35 percent or more negative). The agency’s “engagement index” score met OPM’s goal for 2017 of 69
AdministrAtive developments 39
percent, and met or exceeded the governmentwide score in all areas (overall, leaders lead, supervisors, and intrinsic work experience).
Based on OPM guidelines for determining notable results, the RRB scored especially high (greater than 65 percent favorable) on the majority of items measuring personal work experiences. Over 93 percent of the RRB respondents think the work they do is important, about 86 percent know how their work relates to the agency’s goals and priorities, and 72 percent feel their work gives them a feeling of personal accomplishment. Almost 80 percent like the kind of work they do, and 84 percent feel they are held accountable for achieving results. Also, 83 percent of agency employees feel supported by their supervisors in balancing work and other life issues.
The lowest scores were on items gauging performance culture and talent management, although these scores still represent a minority of the employees that responded. For example, only 37 percent agree that steps are taken to deal with poor performers, while 39 percent feel creativity and innovation are rewarded. Almost 35 percent feel they do not have sufficient resources to get their jobs done, with this item showing the largest decline from the previous survey (3 percentage points). As a result, this is an area the agency intends to concentrate on improving in the coming years.
Employee Recognition
The RRB recognizes its employees for their contributions to the agency, and service to the railroad public, as part of its annual “Award for Excellence” program. All agency employees, supervisors and work teams have the opportunity to be recognized for their accomplishments, with the nominees, finalists and winners honored at an annual awards ceremony. The 30th awards ceremony was held in July 2017 at Kasbeer Hall on Loyola University Chicago’s nearby Water Tower campus. The program honored 11 individual nominations and 4 team nominations. The RRB also participates in the Chicago Federal Executive Board’s “Federal Employee of the Year” awards program that recognizes outstanding Federal employees throughout the metropolitan area. In 2017, the RRB had 1 individual nomination and 1 team nomination. Susan Leszkowicz, a supervisory auditor in the agency’s Office of Inspector General, was named the winner in the career achievement category.
Information Technology
Website RedesignIn 2017, the RRB launched its extensively improved public-facing website,
RRB.gov. Throughout the revision process, the project team focused on creating a more approachable, better organized website accessible from any device. The site was re-built from scratch using innovative technology known as Drupal, an open source web content management system popular across other digital government platforms. Drupal’s key
40 2018 Annual Report, U.S. Railroad Retirement Board
features enhance user experience for web content managers and site visitors alike that align with Federal priorities in efficiency, transparency, and accessibility, including:
• Efficient Content Management and Rapid Delivery – Content providers can now control, edit, and publish their own material without relying on technical programming staff. With this more direct workflow, content is managed and delivered instantly.
• Flexible Usability and Mobile-Friendly – RRB.gov is now configured for responsive compatibility, ehancing convenience for browsing the site from any device regardless of screen size.
• Improved Accessibility – The new framework enables staff to adopt, implement, and maintain accessibility standards required by law for website visitors with disabilities.
• Enriched User Experience – A clean, consistent presentation offers quick and easy access to essential information. The main menu is now streamlined and equipped with dropdown subcategories prompting intuitive navigation.
Information Security
The RRB is committed to protecting its annuitants’ information from unauthorized use or disclosure, and continues to work on improving its security capabilities. In 2017, the RRB’s information security team administered statutorily required security-awareness training for agency employees and contractors. Staff members identified as having more significant information security responsibilities participated in enhanced role-based security training. In addition, the RRB’s privacy team prepared and coordinated training for all employees and necessary contractors on safeguarding controlled unclassified information, Federal tax information and Privacy Act information.
Information Resources ManagementIn fiscal year 2017, the RRB coordinated and secured computer matching agreements
with 18 states. The agency also secured OMB approval of 24 information collections. A central goal of the OMB review process is to help agencies strike a balance between collecting information needed to fulfill their statutory missions and guarding against unnecessary or duplicative requests that impose unjustified costs on the public.
Digital SavingsThe RRB worked internally to develop a central repository for the agency’s procedure
manuals using Microsoft’s SharePoint platform. Previously, the RRB paid annual maintenance and licensing fees to a contractor for this capability, resulting in savings of approximately $40,000. Also, the RRB revised its RUIA processes to cease producing paper

41 2018 Annual Report, U.S. Railroad Retirement Board AdministrAtive developments 41
unemployment and sickness claims for online filers. This change resulted in a 52 percent reduction in printed claim volume, saving the agency about $32,000.
Office of Equal Opportunity
Equal Opportunity Policies and Procedures
The agency’s Equal Employment Opportunity complaint program has policies and procedures in place to address all forms of discrimination, including harassment. Training is conducted to ensure employees know their rights and responsibilities, and the discrimination complaint process has the elements of impartiality, timeliness and credibility. Both the agency’s website and its intranet include information to ensure the public and agency employees have access to information regarding the discrimination complaint program.
Diversity Program
Throughout the year, the agency’s Office of Equal Opportunity (OEO) sponsored many events and activities to foster an inclusive work environment and enhance the understanding of disability issues. These included a variety of cultural enrichment events to commemorate African American History Month, Women’s History Month, Asian Pacific Heritage Month and Hispanic Heritage Month, as well as an event that was part of an ongoing program theme of “What if I become disabled tomorrow?”
Recruitment
The RRB is committed to maintaining a diverse workforce. The OEO worked cooperatively with the Bureau of Human Resources in 2017 to create a diverse pool of external job applicants by identifying sources for the recruitment of individuals with disabilities, various underrepresented groups, and disabled veterans.
Public Information Activities
The RRB maintains direct contact with railroad retirement beneficiaries through its field offices located across the country. Field personnel explain benefit rights and responsibilities on an individual basis, assist railroad employees in applying for benefits and answer any questions related to the benefit programs. The RRB also relies on railroad labor groups and employers for assistance in keeping railroad personnel informed about its benefit programs.
At informational conferences sponsored by the Labor Member of the Board for railroad labor union officials, RRB representatives describe and discuss the benefits available under the railroad retirement-survivor, unemployment-sickness and Medicare programs, and the
42 2018 Annual Report, U.S. Railroad Retirement Board
attendees are provided with comprehensive informational materials. Now in its 61st year, in 2017 a total of 1,078 railroad labor union officials attended 29 informational conferences held in cities throughout the United States. The Labor Member’s Office also sponsors a program of pre-retirement seminars designed for railroad employees and their spouses nearing retirement. Thirteen seminars were held during 2017, with 582 individuals in attendance. In addition, railroad labor unions frequently request that RRB representatives speak before their meetings, seminars and conventions. In 2017, the Labor Member’s Office was represented at 14 union gatherings attended by 1,751 railroad labor officials. Field personnel addressed 41 local union meetings with 1,334 members in attendance.
At seminars for railroad executives and managers, agency representatives review programs, financing, and administration, with special emphasis on those areas which require cooperation between railroads and RRB offices. During 2017, the Management Member’s Office conducted 5 seminars/presentations for 260 railroad officials, as well as benefit update presentations and pre-retirement counseling seminars attended by railroad employees and their spouses. In August 2017, the Office of the Management Member hosted 19 representatives of several Class I employers, which include the largest railroads, for an informational session at RRB headquarters. The meeting covered updates on agency initiatives regarding the disability program, issues related to electronic payments, and changes to online reporting forms and systems, including development of a new online benefit application in conjunction with the governmentwide Login.Gov effort.
Office of Inspector General
The Office of Inspector General (OIG) for the RRB focuses its audit and investigative efforts on protecting the integrity of the agency’s trust funds by providing comprehensive program and operational oversight. Reports issued by the OIG, and other documents referenced in this section, can be found at RRB.gov/oig.
Office of AuditDuring fiscal year 2017, the Office of Audit published 11 reports, including mandated
audits and assessments such as the annual information security audit, the annual Improper Payments Elimination and Recovery Acts of 2010 and 2012 compliance audit, and the annual financial statement audit. Other issued audits focused on the following topics: compliance with Federal records management directives; the RRB’s program evaluation process; and the RRB’s compliance with Federal travel regulations. In total, the Office of Audit issued 110 recommendations to agency management and identified $19 million in questioned costs.
Pursuant to the Reports Consolidation Act of 2000 and the requirements of OMB Circular A-136, the OIG issued a document that identified the most serious management challenges facing the RRB and its progress in addressing them. The OIG identified the following challenges: program integrity to strengthen the RRB’s disability program; information technology security and modernization; management of railroad Medicare;

43 2018 Annual Report, U.S. Railroad Retirement Board AdministrAtive developments 43
preventing and detecting improper payments; agency succession planning; material weaknesses for financial statement reporting; and limited transparency at the National Railroad Retirement Investment Trust.
Office of Investigations
The Office of Investigations focuses on identifying, investigating, and presenting RRB fraud cases for prosecution or monetary recovery action. It also seeks to prevent and deter RRB program fraud by reporting systemic weaknesses in agency operations and processes identified through investigative work. In order to maximize the impact of its resources, the office pursues cooperative investigative activities in coordination with other Inspectors General, such as the Office of Inspector General for the Department of Health and Human Services, and law enforcement agencies, such as the Federal Bureau of Investigation and the U.S. Secret Service.
As of September 30, 2017, the Office of Investigations’ caseload totaled 290 matters, which represents more than $552.8 million in potential fraud losses.1 During fiscal year 2017, the office secured 3 arrests, 29 indictments and/or informations, 39 convictions, 11 civil judgments, and more than $149 million in financial accomplishments.2
1 This reflects potential fraud amounts related to programs administered exclusively by the RRB and potential fraud amounts from other Federal programs such as Medicare or social security which have been identified by Office of Investigations’ joint investigative work.2 The total amount of financial accomplishments reflects fraud amounts related to programs administered exclusively by the RRB and fraud amounts from other Federal programs such as Medicare or social security which were included in the disposition resulting from the investigation.


LegaL RuLings
45
Court Cases
One petition for review was filed during the year, and 5 cases were ruled upon by several circuits of the U.S. Courts of Appeal. At the conclusion of fiscal year
2017, there were no cases pending decisions with any circuit of the U.S. Courts of Appeal.
Legal OpinionsThe RRB’s Office of General Counsel issued 59 formal legal opinions in fiscal year 2017.
The following are of special interest.
Independent Partition Awards L-2017-03
This opinion clarifies procedures for payment of a partition award to a former spouse when the railroad employee is not receiving an annuity. The opinion provides details for calculating partitions in the event of employee death and when the employee becomes re-entitled to an annuity at a later date. The opinion also explains that in the event of employee death, a court order entered prior to employee death, but served on the RRB after death, may still be honored for partition payment.
Railroad Compensation as Excess Earnings for Work Deductions L-2017-04
This opinion addresses Section 2(f)(1) of the Railroad Retirement Act (RRA), which provides for deductions to the tier I portion of an annuity on account of work pursuant to Section 203 of the Social Security Act as if tier I were a benefit under the Social Security Act. The opinion determines that railroad earnings should be treated the same as social security wages for work deduction and annual earnings test purposes. The opinion also addresses month-by-month earnings and monthly exempt amounts and details rules for grace-year earnings.
Church Donations L-2017-16
Pursuant to the RRA, an overpayment may be waived if the individual is found without fault in causing the overpayment and if recovery would deprive the individual of ordinary and necessary living expenses or be against equity or good conscience. The RRB’s regulations do not specifically state that donations to a church are considered as ordinary and necessary living expenses, but the examples set forth in section 255.12(d) of the RRB’s
Five rulings on cases involving the RRB were issued by the various U.S. Courtsof Appeal during fiscal year 2017, and 59 legal opinions were issued
by the RRB’S Office of General Counsel.

regulations and in relevant sections of the agency’s Retirement Claims Manual are not exclusive. Donations to a church or other religious entity can be interpreted to fall within section 255.12(d)(4) of the RRB’s regulations based on the Social Security Administration’s Program Operations Manual (POMS GN 02250.120), which specifically refers to such a donation as an ordinary and necessary living expense. However, the governing provisions of the Internal Revenue Code should be followed when allowing the maximum amount of the donation that can be considered as an expense that can be deducted from an individual’s adjusted gross income.
State Payments for In-Home Supportive Services L-2017-28
The recipient of a disability annuity was receiving payments under a Medicaid waiver to care for a disabled adult child. Such payments qualify as earnings for purposes of work deductions from a disability annuity. The fact that these payments are not taxable under the Internal Revenue Code or the Federal Insurance Contributions Act (social security)does not require a different result. Under the variant of the Wisconsin waiver program at issue, the employment relationship is between the caregiver and the waiver recipient, and earnings to the caregiver should be evaluated as regular employment.
Appropriations – Seal L-2017-46
This opinion provides guidance on the unofficial use of the RRB seal. The opinion describes steps that must be taken to obtain agency approval for use of the seal. It also describes the copyright exception that prevents the agency seal from being considered part of the public domain.
AppealsAny claimant for benefits under the RRA or the Railroad Unemployment Insurance
Act (RUIA) may appeal a determination he or she feels is not justified. This appeal must be filed within certain time frames. Appeals are heard and decided by the RRB’s Bureau of Hearings and Appeals. An appellant who is dissatisfied with the decision on his or her appeal may further appeal the case to the three-member Board within a prescribed period of time.
RRA
During fiscal year 2017, 292 appeals were filed with the Bureau of Hearings and Appeals under the RRA, and the Bureau rendered decisions in 279 appeals. The reconsideration decision was sustained in 153 cases. In 126 appeals the decision was favorable to the claimant in whole or in part.
Forty-eight appeals were filed with the Board in fiscal year 2017, and the Board issued 89 decisions. In 60 cases the previous ruling of the hearings officer was affirmed, in 5 cases the decision was fully favorable to the appellant, and in 6 cases the decision was partially favorable. The Board remanded 8 cases: 4 to the Bureau of Hearings and Appeals, 3 to the Office of Programs, and 1 to the Debt Recovery Division. Ten appeals were dismissed. At the end of the year, 113 appeals were pending before the Board.
46 2018 AnnuAl RepoRt, u.S. RAilRoAd RetiRement BoARd

legAl RulingS 47
RUIA
During fiscal year 2017, 54 appeals were filed with the Bureau of Hearings and Appeals under the RUIA, and the Bureau rendered decisions in 56 appeals. The reconsideration decision was sustained in 40 cases. In 16 appeals the decision was favorable to the claimant in whole or in part.
Seven appeals were filed with the Board in fiscal year 2017. The Board rendered decisions in 8 appeals affirming the decision of the hearings officer, and in 3 appeals the decision was favorable to the appellant. At the end of the year, 7 appeals were pending before the Board.

STATISTICAL TABLES

StatiStical tableS 49
Tota
l1R
etire
men
t2S
urvi
vor2
Une
mpl
oym
ent3,
4S
ickn
ess4
BEN
EFIC
IAR
IES
(in th
ousa
nds)
2008
......
......
......
......
......
……
……
……
……
.62
343
317
411
1920
09...
......
......
......
......
...…
……
……
……
….
626
430
167
2418
2010
......
......
......
......
......
……
……
……
……
.61
742
816
122
1820
11...
......
......
......
......
...…
……
……
……
….
603
429
156
1118
2012
......
......
......
......
......
……
……
……
……
.59
542
915
010
1720
13...
......
......
......
......
...…
……
……
……
….
592
429
146
1116
2014
......
......
......
......
......
……
……
……
……
.58
542
814
110
1620
15...
......
......
......
......
...…
……
……
……
….
581
428
136
916
2016
......
......
......
......
......
……
……
……
……
.58
342
813
117
1720
17...
......
......
......
......
...…
……
……
……
….
574
427
127
1216
B
ENEF
IT P
AYM
ENTS
(in
mill
ions
)
2008
......
......
......
......
......
……
……
……
……
.$1
0,11
5.4
$7,8
77.0
$2,1
58.1
$35.
1$4
4.9
2009
......
......
......
......
......
……
……
……
……
.10
,663
.88,
311.
02,
192.
011
1.7
48.1
2010
......
......
......
......
......
……
……
……
……
.10
,939
.88,
588.
62,
187.
110
9.6
50.0
2011
......
......
......
......
......
……
……
……
……
.11
,047
.28,
778.
52,
165.
348
.352
.320
12...
......
......
......
......
...…
……
……
……
….
11,4
18.8
9,15
5.4
2,17
1.7
41.1
47.5
2013
......
......
......
......
......
……
……
……
……
.11
,726
.49,
456.
52,
175.
547
.842
.920
14...
......
......
......
......
...…
……
……
……
….
11,9
80.9
9,72
4.9
2,16
7.2
37.7
46.7
2015
......
......
......
......
......
……
……
……
……
.12
,257
.310
,012
.22,
156.
934
.049
.220
16...
......
......
......
......
...…
……
……
……
….
12,4
80.4
10,2
02.4
2,13
9.2
77.6
55.7
2017
......
......
......
......
......
……
……
……
……
.12
,574
.910
,341
.42,
121.
946
.658
.8
1 Beg
inni
ng in
fisc
al y
ear 2
008,
ben
efic
iarie
s an
d be
nefit
pay
men
ts in
clud
e pa
rtitio
n pa
ymen
ts to
spo
uses
and
div
orce
d sp
ouse
s w
here
the
empl
oyee
is d
ecea
sed
or n
ot o
ther
wis
e en
title
d to
an
annu
ity.
Ben
efit
paym
ents
als
o in
clud
e a
smal
l am
ount
of p
aym
ents
for h
ospi
tal i
nsur
ance
ben
efits
for s
ervi
ces
in C
anad
a.2 R
etire
men
t ben
efits
incl
ude
vest
ed d
ual b
enef
it an
d su
pple
men
tal a
nnui
ty p
aym
ents
. S
urvi
vor b
enef
its in
clud
e ve
sted
dua
l ben
efit
paym
ents
.3 In
clud
es te
mpo
rary
ext
ende
d un
empl
oym
ent b
enef
its u
nder
the
Am
eric
an R
ecov
ery
and
Rei
nves
tmen
t Act
of 2
009
and
Wor
ker,
Hom
eow
ners
hip,
and
Bus
ines
s A
ssis
tanc
e A
ct o
f 200
9, a
s am
ende
d by
the
Tax
Rel
ief,
Une
mpl
oym
ent I
nsur
ance
Rea
utho
rizat
ion,
and
Job
Cre
atio
n A
ct o
f 201
0, th
e Te
mpo
rary
Pay
roll
Tax
Cut
Con
tinua
tion
Act
of 2
011,
the
Mid
dle
Cla
ss T
ax R
elie
f and
Job
Cre
atio
n A
ct o
f 201
2, a
nd th
e A
mer
ican
Tax
paye
r Rel
ief A
ct o
f 201
2. B
enef
its h
ad to
beg
in b
y D
ecem
ber 3
1, 2
013.
4 In a
ccor
danc
e w
ith th
e B
alan
ced
Bud
get a
nd E
mer
genc
y D
efic
it C
ontro
l Act
of 1
985,
as
amen
ded
by th
e B
udge
t Con
trol A
ct o
f 201
1, a
mou
nts
refle
ct a
redu
ctio
n of
9.2
% u
nder
s
eque
stra
tion
for d
ays
of u
nem
ploy
men
t and
sic
knes
s af
ter F
ebru
ary
28, 2
013,
7.2
% fo
r day
s af
ter S
epte
mbe
r 30,
201
3, 7
.3%
for d
ays
afte
r Sep
tem
ber 3
0, 2
014,
6.8
% fo
r d
ays
afte
r Sep
tem
ber 3
0, 2
015,
and
6.9
% fo
r day
s af
ter S
epte
mbe
r 30,
201
6.
Tabl
e 1.
--Ben
efic
iarie
s an
d be
nefit
s pa
id u
nder
the
Rai
lroad
Ret
irem
ent A
ct
Fisc
al y
ear
and
the
Rai
lroad
Une
mpl
oym
ent I
nsur
ance
Act
, by
fisca
l yea
r, 20
08-2
017,
cas
h ba
sis
NO
TE.--
Num
ber o
f ben
efic
iarie
s re
pres
ents
all
indi
vidu
als
paid
ben
efits
in y
ear.
In to
tal n
umbe
r for
eac
h ye
ar, b
enef
icia
ries
are
coun
ted
only
onc
e, e
ven
thou
gh th
ey m
ay h
ave
rece
ived
mor
e th
an o
ne ty
pe o
f ben
efit.
In
fisca
l yea
r 201
7, 7
,000
indi
vidu
als
rece
ived
bot
h re
tirem
ent a
nd s
urvi
vor b
enef
its, 8
00 e
mpl
oyee
s re
ceiv
ed b
oth
unem
ploy
men
t and
si
ckne
ss b
enef
its, a
nd 1
,800
em
ploy
ees
rece
ived
ben
efits
und
er b
oth
the
Rai
lroad
Ret
irem
ent A
ct a
nd th
e R
ailro
ad U
nem
ploy
men
tIns
uran
ce A
ct.
Thes
e fig
ures
are
par
tly
estim
ated
, and
tota
ls fo
r ear
lier y
ears
are
sim
ilarly
adj
uste
d.
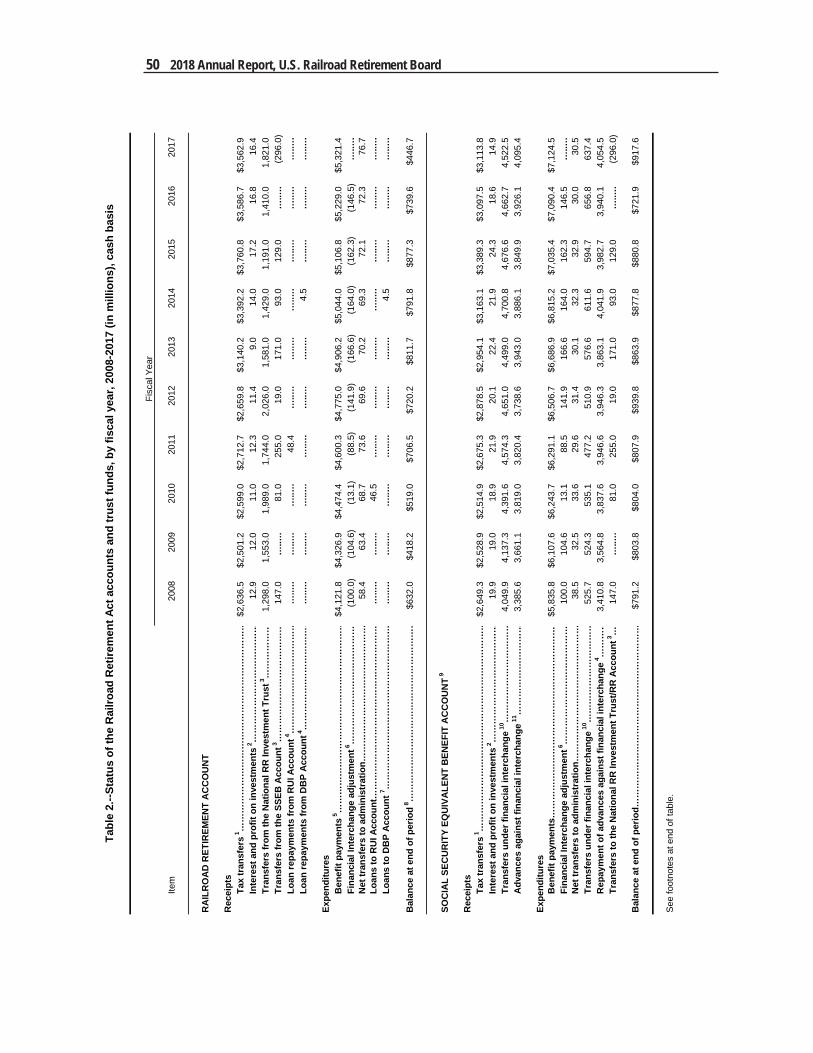
Item
2008
2009
2010
2011
2012
2013
2014
2015
2016
2017
RA
ILR
OA
D R
ETIR
EMEN
T A
CC
OU
NT
Rec
eipt
sTa
x tr
ansf
ers 1
……
……
……
……
……
……
……
……
……
……
……
…$2
,636
.5$2
,501
.2$2
,599
.0$2
,712
.7$2
,659
.8$3
,140
.2$3
,392
.2$3
,760
.8$3
,586
.7$3
,562
.9In
tere
st a
nd p
rofit
on
inve
stm
ents
2…
……
……
……
……
……
……
12.9
12.0
11.0
12.3
11.4
9.0
14.0
17.2
16.8
16.4
Tran
sfer
s fr
om th
e N
atio
nal R
R In
vest
men
t Tru
st 3
……
……
……
1,29
8.0
1,55
3.0
1,98
9.0
1,74
4.0
2,02
6.0
1,58
1.0
1,42
9.0
1,19
1.0
1,41
0.0
1,82
1.0
Tran
sfer
s fr
om th
e SS
EB A
ccou
nt 3
……
……
……
……
……
……
…14
7.0
…..…
81
.025
5.0
19.0
171.
093
.012
9.0
…..…
(2
96.0
)Lo
an re
paym
ents
from
RU
I Acc
ount
4…
……
……
.……
……
……
……
..…
…..…
…
..…
48.4
…..…
…
..…
…..…
…
..…
…..…
…
..…
Loan
repa
ymen
ts fr
om D
BP
Acc
ount
4…
……
……
.……
……
……
……
..…
…..…
…
..…
…..…
…
..…
…..…
4.
5…
..…
…..…
…
..…
Expe
nditu
res
Ben
efit
paym
ents
5…
……
……
……
……
……
……
……
……
……
……
$4,1
21.8
$4,3
26.9
$4,4
74.4
$4,6
00.3
$4,7
75.0
$4,9
06.2
$5,0
44.0
$5,1
06.8
$5,2
29.0
$5,3
21.4
Fina
ncia
l Int
erch
ange
adj
ustm
ent 6
……
……
……
……
……
……
…(1
00.0
)(1
04.6
)(1
3.1)
(88.
5)(1
41.9
)(1
66.6
)(1
64.0
)(1
62.3
)(1
46.5
)…
..…
Net
tran
sfer
s to
adm
inis
trat
ion…
……
……
……
……
……
……
……
58.4
63.4
68.7
73.6
69.6
70.2
69.3
72.1
72.3
76.7
Loan
s to
RU
I Acc
ount
……
……
……
……
……
……
……
……
……
……
..…
…..…
46
.5…
..…
…..…
…
..…
…..…
…
..…
…..…
…
..…
Loan
s to
DB
P A
ccou
nt 7 …
……
……
……
……
……
……
……
……
……
..…
…..…
…
..…
…..…
…
..…
…..…
4.
5…
..…
…..…
…
..…
Bal
ance
at e
nd o
f per
iod 8
……
……
……
……
……
……
……
……
……
……
$632
.0$4
18.2
$519
.0$7
06.5
$720
.2$8
11.7
$791
.8$8
77.3
$739
.6$4
46.7
SOC
IAL
SEC
UR
ITY
EQU
IVA
LEN
T B
ENEF
IT A
CC
OU
NT 9
Rec
eipt
sTa
x tr
ansf
ers 1
……
……
……
……
……
……
……
……
……
……
……
…$2
,649
.3$2
,528
.9$2
,514
.9$2
,675
.3$2
,878
.5$2
,954
.1$3
,163
.1$3
,389
.3$3
,097
.5$3
,113
.8In
tere
st a
nd p
rofit
on
inve
stm
ents
2…
……
……
……
……
……
……
19.9
19.0
18.9
21.9
20.1
22.4
21.9
24.3
18.6
14.9
Tran
sfer
s un
der f
inan
cial
inte
rcha
nge 1
0 ……
……
……
……
……
…4,
049.
94,
137.
34,
391.
64,
574.
34,
651.
04,
499.
04,
700.
84,
676.
64,
662.
74,
522.
5A
dvan
ces
agai
nst f
inan
cial
inte
rcha
nge 1
1 ……
……
……
……
……
3,38
5.6
3,66
1.1
3,81
9.0
3,82
0.4
3,73
8.6
3,94
3.0
3,88
6.1
3,84
9.9
3,92
6.1
4,09
5.4
Expe
nditu
res
Ben
efit
paym
ents
……
……
……
……
……
……
……
……
……
……
….
$5,8
35.8
$6,1
07.6
$6,2
43.7
$6,2
91.1
$6,5
06.7
$6,6
86.9
$6,8
15.2
$7,0
35.4
$7,0
90.4
$7,1
24.5
Fina
ncia
l Int
erch
ange
adj
ustm
ent 6
……
……
……
……
……
……
…10
0.0
104.
613
.188
.514
1.9
166.
616
4.0
162.
314
6.5
…..…
N
et tr
ansf
ers
to a
dmin
istr
atio
n……
……
……
……
……
……
……
…38
.532
.533
.629
.631
.430
.132
.332
.930
.030
.5Tr
ansf
ers
unde
r fin
anci
al in
terc
hang
e 10 …
……
……
……
……
……
525.
752
4.3
535.
147
7.2
510.
957
6.6
611.
659
4.7
656.
863
7.4
Rep
aym
ent o
f adv
ance
s ag
ains
t fin
anci
al in
terc
hang
e 4…
……
…3,
410.
83,
564.
83,
837.
63,
946.
63,
946.
33,
863.
14,
041.
93,
982.
73,
940.
14,
054.
5Tr
ansf
ers
to th
e N
atio
nal R
R In
vest
men
t Tru
st/R
R A
ccou
nt 3
…14
7.0
…..…
81
.025
5.0
19.0
171.
093
.012
9.0
…..…
(2
96.0
)
Bal
ance
at e
nd o
f per
iod…
……
……
……
……
……
……
……
……
……
…$7
91.2
$803
.8$8
04.0
$807
.9$9
39.8
$863
.9$8
77.8
$880
.8$7
21.9
$917
.6
See
foot
note
s at
end
of t
able
.
Tabl
e 2.
--Sta
tus
of th
e R
ailro
ad R
etire
men
t Act
acc
ount
s an
d tr
ust f
unds
, by
fisca
l yea
r, 20
08-2
017
(in m
illio
ns),
cash
bas
is
Fisc
al Y
ear
50 2018 Annual Report, U.S. Railroad Retirement Board

StatiStical tableS 51
Item
2008
2009
2010
2011
2012
2013
2014
2015
2016
2017
NA
TIO
NA
L R
AIL
RO
AD
RET
IREM
ENT
INVE
STM
ENT
TRU
ST 1
2
Cas
h an
d in
vest
men
t bal
ance
at e
nd o
f per
iod 1
3 ……
……
……
……
…$2
5,27
1.5
$23,
330.
8$2
3,77
0.4
$22,
119.
0$2
3,58
6.2
$24,
963.
7$2
6,03
9.9
$24,
483.
9$2
5,00
7.7
$26,
389.
6
DU
AL
BEN
EFIT
S PA
YMEN
TS A
CC
OU
NT 1
4
Dua
l ben
efit
tran
sfer
s 15 …
……
……
……
……
……
……
……
……
……
……
$79.
0$7
2.0
$64.
0$5
6.9
$50.
9$4
4.9
$39.
0$3
4.0
$29.
0$2
5.0
Loan
s fr
om R
ailro
ad R
etire
men
t Acc
ount
7 ……
……
……
……
……
……
…..…
…
..…
…..…
…
..…
…..…
…
..…
4.5
…..…
…
..…
…..…
B
enef
it pa
ymen
ts…
……
……
……
……
……
……
……
……
……
……
……
…77
.769
.562
.155
.248
.642
.637
.231
.927
.523
.6R
epay
men
t of l
oans
from
Rai
lroad
Ret
irem
ent A
ccou
nt 4 …
……
……
…..…
…
..…
…..…
…
..…
…..…
…
..…
4.5
…..…
…
..…
…..…
B
alan
ce a
t end
of p
erio
d 8…
……
……
……
……
……
……
……
……
……
…$1
.3$2
.5$1
.9$1
.7$2
.3$2
.3$1
.8$2
.1$1
.5$1
.4
Tabl
e 2.
--Sta
tus
of th
e R
ailro
ad R
etire
men
t Act
acc
ount
s an
d tr
ust f
unds
, by
fisca
l yea
r, 20
08-2
017
(in m
illio
ns),
cash
bas
is -
Con
tinue
d
Fisc
al Y
ear
1N
et o
f U.S
. Tre
asur
y ad
just
men
ts fo
r pay
roll
tax
refu
nds
to c
erta
in c
arrie
rs a
nd th
eir e
mpl
oyee
s fo
r prio
r per
iods
. In
clud
esFe
dera
l inc
ome
tax
trans
fers
und
er s
ectio
n 72
(r) o
f the
Inte
rnal
Rev
enue
Cod
e as
am
ende
d. I
n ca
lend
ar y
ears
201
1-20
12, S
ocia
l Sec
urity
Equ
ival
ent B
enef
it A
ccou
nt in
clud
es g
ener
al re
venu
e tra
nsfe
rs u
nder
the
Tax
Rel
ief,
Une
mpl
oym
ent I
nsur
ance
Rea
utho
rizat
ion,
and
Job
Cre
atio
n A
ct o
f 201
0 an
d th
e M
iddl
e C
lass
Tax
Rel
ief a
nd J
ob C
reat
ion
Act
of 2
012,
resp
ectiv
ely.
The
fina
l rec
onci
liatio
n fo
r cal
enda
r yea
rs 2
011-
2012
occu
rred
in J
une
2015
. In
fisc
al y
ear 2
012,
Soc
ial S
ecur
ity E
quiv
alen
t Ben
efit
Acc
ount
incl
udes
a o
ne-ti
me
gene
ral r
even
ue tr
ansf
er u
nder
the
Hiri
ng In
cent
ives
to R
esto
re E
mpl
oym
ent A
ctof
201
0.2
Net
of i
nter
est o
n U
.S. T
reas
ury
adju
stm
ents
for p
ayro
ll ta
x re
fund
s (s
ee n
ote
1).
3U
nder
the
Rai
lroad
Ret
irem
ent a
nd S
urvi
vors
' Im
prov
emen
t Act
of 2
001,
as
amen
ded,
the
porti
on o
f the
Rai
lroad
Ret
irem
ent A
ccou
nt n
ot n
eede
d to
pay
cur
rent
adm
inis
trativ
e ex
pens
esis
to b
e tra
nsfe
rred
to th
e N
atio
nal R
ailro
ad R
etire
men
t Inv
estm
ent T
rust
(Tru
st).
The
Tru
st m
ay tr
ansf
er fu
nds
back
to th
e R
ailro
ad R
etire
men
t Acc
ount
for p
aym
ent o
f ben
efits
. Th
e ba
lanc
e of
the
Soc
ial S
ecur
ity E
quiv
alen
t Ben
efit
(SS
EB
) Acc
ount
not
nee
ded
to p
ay c
urre
nt b
enef
its a
nd a
dmin
istra
tive
expe
nses
is to
be
trans
ferr
ed to
the
Trus
t or t
o th
e R
ailro
ad
Ret
irem
ent A
ccou
nt.
The
SS
EB
Acc
ount
tran
sfer
red
fund
s to
the
Trus
t in
fisca
l yea
r 200
3 an
d to
the
Rai
lroad
Ret
irem
ent A
ccou
nt th
erea
fter.
In fi
scal
yea
r 201
7 th
e R
ailro
ad R
etire
men
tA
ccou
nt tr
ansf
erre
d fu
nds
to th
e S
SE
B A
ccou
nt to
pay
ben
efits
.4
Incl
udes
inte
rest
.5
Effe
ctiv
e Ja
nuar
y 1,
200
2, s
uppl
emen
tal b
enef
its a
re p
aid
from
the
Rai
lroad
Ret
irem
ent A
ccou
nt.
6A
djus
tmen
ts in
ben
efit
paym
ents
cha
rged
to th
e S
ocia
l Sec
urity
Equ
ival
ent B
enef
it A
ccou
nt a
s co
mpa
red
to a
ctua
l fin
anci
al in
terc
hang
e be
nefit
s, w
ith in
tere
st.
This
adj
ustm
ent w
asdi
scon
tinue
d in
fisc
al y
ear 2
017.
7D
ue to
del
ay in
ena
ctm
ent o
f a c
ontin
uing
reso
lutio
n, th
e D
ual B
enef
its P
aym
ents
Acc
ount
bor
row
ed $
4,50
0,00
0 fro
m th
e R
ailro
adR
etire
men
t Acc
ount
in O
ctob
er 2
013
in o
rder
to p
ayve
sted
dua
l ben
efits
. Th
e lo
anw
as re
paid
in e
ntire
ty in
Dec
embe
r 201
3.8
The
Rai
lroad
Ret
irem
ent A
ccou
nt b
alan
ce re
flect
s (a
) the
cur
rent
net
diff
eren
ce b
etw
een
Rai
lroad
Ret
irem
ent B
oard
pay
men
ts o
f soc
ial s
ecur
ity b
enef
its a
nd th
e re
ceip
t of
reim
burs
emen
ts fo
r suc
h pa
ymen
ts, (
b) li
abilit
ies
for u
ncas
hed
chec
k cr
edits
rece
ived
from
U.S
. Tre
asur
y, a
nd (c
) cre
dits
for u
ndis
tribu
ted
paym
ent r
etur
ns a
nd re
cove
ries.
The
Dua
lB
enef
its P
aym
ents
Acc
ount
bal
ance
doe
s no
t car
ry o
ver t
o th
e fo
llow
ing
year
.9
Est
ablis
hed
Oct
ober
1, 1
984,
to k
eep
track
of t
he fi
nanc
ing
and
paym
ent o
f soc
ial s
ecur
ity le
vel p
ortio
ns o
f rai
lroad
retir
emen
t ben
efits
.10
Tr
ansf
ers
to o
r fro
m O
AS
DH
I Tru
st F
unds
und
er s
ectio
n 7(
c)(2
) of t
he 1
974
Rai
lroad
Ret
irem
ent A
ct.
11A
dvan
ces,
incl
udin
g in
tere
st, f
rom
U.S
. Tre
asur
y to
offs
et la
g in
rece
ipt o
f fin
anci
al in
terc
hang
e fu
nds
unde
r sec
tion
7(c)
(4) o
f the
197
4 R
ailro
ad R
etire
men
t Act
as
amen
ded.
12E
stab
lishe
d Fe
brua
ry 1
, 200
2, fo
r inv
estm
ent o
f rai
lroad
retir
emen
t ass
ets.
13S
ourc
e: N
atio
nal R
ailro
ad R
etire
men
t Inv
estm
ent T
rust
.14
Est
ablis
hed
Oct
ober
1, 1
981,
to k
eep
track
of t
he fi
nanc
ing
and
paym
ent o
f ves
ted
dual
ben
efits
.15
Tran
sfer
s fro
m U
.S. T
reas
ury
unde
r sec
tion
15(d
) of t
he R
ailro
ad R
etire
men
t Act
of 1
974
and
Fede
ral i
ncom
e ta
x tra
nsfe
rs u
nder
sect
ion
72(r
) of t
he In
tern
al R
even
ue C
ode
as a
men
ded.

52 2018 Annual Report, U.S. Railroad Retirement Board
Tabl
e 3.
--Sta
tus
of th
e R
ailro
ad U
nem
ploy
men
t Ins
uran
ce A
ccou
nt, b
y fis
cal y
ear,
2013
-201
7 (in
thou
sand
s), c
ash
basi
s
Fisc
al y
ear
It
em20
1320
1420
1520
1620
17
REC
EIPT
S
Tax
es…
……
……
……
……
……
……
……
……
……
……
$84,
679
$6,2
48$4
6,67
2$9
0,24
1$1
00,0
30 I
nter
est…
……
……
……
……
……
……
……
……
……
…5,
686
4,41
53,
165
2,51
41,
945
Tra
nsfe
r fro
m A
dmin
istr
atio
n fu
nd
und
er s
ec. 1
1(d)
of t
he R
UI A
ct…
……
……
……
…10
,706
12,2
5711
,339
13,3
7512
,357
Und
istr
ibut
ed re
cove
ries
of b
enef
it pa
ymen
ts1 …
…(1
10)
(271
)36
82,
458
(2,8
66)
T
otal
……
……
……
……
……
……
……
……
……
……
$100
,961
$22,
649
$61,
544
$108
,588
$111
,466
EXPE
ND
ITU
RES
Ben
efit
paym
ents
2, 3
……
……
……
……
……
……
……
$83,
691
$83,
823
$83,
501
$133
,492
$105
,614
Fun
ding
for O
ffice
of I
nspe
ctor
Gen
eral
……
……
…94
11,
037
1,05
31,
080
1,26
0
T
otal
……
……
……
……
……
……
……
……
……
……
$84,
633
$84,
860
$84,
554
$134
,572
$106
,875
Cas
h ba
lanc
e en
d of
per
iod…
……
……
……
……
……
$180
,223
$118
,012
$95,
002
$69,
019
$73,
610
1 Net
of d
istri
bute
d pa
ymen
ts.
2 Exc
lude
s te
mpo
rary
ext
ende
d un
empl
oym
ent b
enef
its a
utho
rized
by
the
Am
eric
an R
ecov
ery
and
Rei
nves
tmen
t Act
of 2
009,
the
Wor
ker,
Hom
eow
ners
hip,
and
Bus
ines
s A
ssis
tanc
e A
ct o
f 200
9,
the
Tax
Rel
ief,
Une
mpl
oym
ent I
nsur
ance
Rea
utho
rizat
ion,
and
Job
Cre
atio
n A
ct o
f 201
0, th
e Te
mpo
rary
Pay
roll
Tax
Cut
Con
tinua
tion
Act
of 2
011,
the
Mid
dle
Cla
ss T
ax R
elie
f and
Job
Cre
atio
n
Act
of 2
012,
and
the
Am
eric
an T
axpa
yer R
elie
f Act
of 2
012.
Ben
efits
had
to b
egin
by
Dec
embe
r 31,
201
3. F
Y 2
013:
$6,
982,
000,
FY
201
4: $
619,
000,
FY
201
5: -$
308,
000,
FY
201
6: -$
154,
000,
an
d FY
201
7: -$
229,
000.
3 In
acco
rdan
ce w
ith th
e B
alan
ced
Bud
get a
nd E
mer
genc
y D
efic
it C
ontro
l Act
of 1
985,
as
amen
ded
by th
e B
udge
t Con
trol A
ct o
f 201
1, a
mou
nts
refle
ct a
redu
ctio
n of
9.2
% u
nder
seq
uest
ratio
n fo
r day
s
of u
nem
ploy
men
t and
sic
knes
s af
ter F
ebru
ary
28, 2
013,
7.2
% fo
r day
s af
ter S
epte
mbe
r 30,
201
3, 7
.3%
for d
ays
afte
r Sep
tem
ber 3
0, 2
014,
6.8
% fo
r day
s af
ter S
epte
mbe
r 30,
201
5, a
nd 6
.9%
for
da
ys a
fter S
epte
mbe
r 30,
201
6.

StatiStical tableS 53
Tabl
e 4.
--S
tatu
s of
the
RU
IA A
dmin
istr
atio
n Fu
nd, b
y fis
cal y
ear,
200
8-20
17 (i
n th
ousa
nds)
, cas
h ba
sis
Tra
nsfe
r to
Rai
lroad
Une
mpl
oym
ent
Insu
ranc
eT
axes
and
Adm
inis
trat
ive
Acc
ount
und
erB
alan
ce a
tF
isca
l yea
rin
tere
stex
pend
iture
s1S
ec. 1
1d2
end
of p
erio
d
2008
......
......
......
......
......
......
..$2
3,94
5
$1
4,71
3
$8
,711
$1
0,42
7
20
09...
......
......
......
......
......
.....
23,1
51
14,3
05
9,80
8
9,
465
2010
......
......
......
......
......
......
..22
,990
15
,729
8,
305
8,42
1
20
11...
......
......
......
......
......
.....
23,7
22
12,4
42
7,91
8
11
,783
20
12...
......
......
......
......
......
.....
25,4
63
14,6
08
11,2
19
11,4
19
2013
......
......
......
......
......
......
..26
,202
14
,591
10
,706
12
,324
20
14...
......
......
......
......
......
.....
25,2
25
15,1
72
12,2
57
10,1
20
2015
......
......
......
......
......
......
..28
,063
12
,987
11
,339
13
,858
20
16...
......
......
......
......
......
.....
27,1
46
15,4
98
13,3
75
12,1
32
2017
......
......
......
......
......
......
..26
,551
14
,842
12
,357
11
,483
1E
xpen
ditu
res
for e
ach
year
incl
uded
enc
umbr
ance
s as
of e
nd o
f yea
r. F
isca
l yea
rs 2
008-
2009
and
201
1-20
17 r
efle
ct
real
loca
tion
of p
rior
perio
d ad
min
istr
ativ
e ex
pens
es b
etw
een
the
Rai
lroad
Ret
irem
ent A
ct a
nd R
ailro
ad U
nem
ploy
men
t In
sura
nce
Act
pro
gram
s.
2T
rans
fers
to th
e R
ailro
ad U
nem
ploy
men
t Ins
uran
ce A
ccou
nt a
re b
ased
on
the
exce
ss o
f the
acc
rual
bal
ance
on
the
prio
rS
epte
mbe
r 30
ove
r $6
,000
,000
.
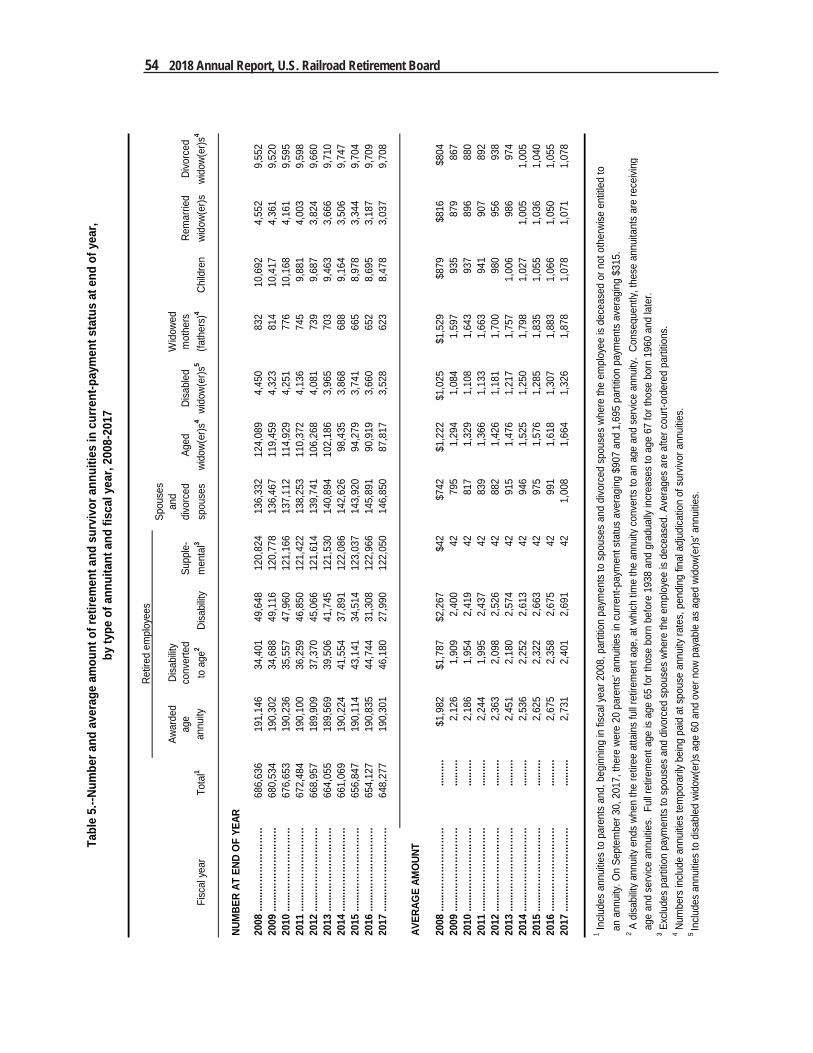
54 2018 Annual Report, U.S. Railroad Retirement Board
Retir
ed e
mpl
oyee
sSp
ouse
sAw
arde
dDi
sabi
lityan
dW
idow
edag
eco
nver
ted
Supp
le-
divo
rced
Aged
Disa
bled
mot
hers
Rem
arrie
d
Divo
rced
T
otal
1an
nuity
to a
ge2
Disa
bility
men
tal3
spou
ses
wido
w(er
)s4
wido
w(er
)s5
(fath
ers)
4Ch
ildre
nwi
dow(
er)s
wid
ow(e
r)s4
NUM
BER
AT E
ND O
F YE
AR
2008
.....
..……
……
……
…68
6,63
619
1,14
634
,401
49,6
4812
0,82
413
6,33
212
4,08
94,
450
832
10,6
924,
552
9,55
220
09 ..
.....…
……
……
……
680,
534
190,
302
34,6
8849
,116
120,
778
136,
467
119,
459
4,32
381
410
,417
4,36
19,
520
2010
.....
..……
……
……
…67
6,65
319
0,23
635
,557
47,9
6012
1,16
613
7,11
211
4,92
94,
251
776
10,1
684,
161
9,59
520
11 ..
.....…
……
……
……
672,
484
190,
100
36,2
5946
,850
121,
422
138,
253
110,
372
4,13
674
59,
881
4,00
39,
598
2012
.....
..……
……
……
…66
8,95
718
9,90
937
,370
45,0
6612
1,61
413
9,74
110
6,26
84,
081
739
9,68
73,
824
9,66
020
13 ..
.....…
……
……
……
664,
055
189,
569
39,5
0641
,745
121,
530
140,
894
102,
186
3,96
570
39,
463
3,66
69,
710
2014
.....
..……
……
……
…66
1,06
919
0,22
441
,554
37,8
9112
2,08
614
2,62
698
,435
3,86
868
89,
164
3,50
69,
747
2015
.....
..……
……
……
…65
6,84
719
0,11
443
,141
34,5
1412
3,03
714
3,92
094
,279
3,74
166
58,
978
3,34
49,
704
2016
.....
..……
……
……
…65
4,12
719
0,83
544
,744
31,3
0812
2,96
614
5,89
190
,919
3,66
065
28,
695
3,18
79,
709
2017
.....
..……
……
……
…64
8,27
719
0,30
146
,180
27,9
9012
2,05
014
6,85
087
,817
3,52
862
38,
478
3,03
79,
708
AVER
AGE
AMO
UNT
2008
.....
..……
……
……
…...
..….
$1,9
82$1
,787
$2,2
67$4
2$7
42$1
,222
$1,0
25$1
,529
$879
$816
$804
2009
.....
..……
……
……
…...
..….
2,12
61,
909
2,40
042
795
1,29
41,
084
1,59
793
587
986
720
10 ..
.....…
……
……
……
.....…
.2,
186
1,95
42,
419
4281
71,
329
1,10
81,
643
937
896
880
2011
.....
..……
……
……
…...
..….
2,24
41,
995
2,43
742
839
1,36
61,
133
1,66
394
190
789
220
12 ..
.....…
……
……
……
.....…
.2,
363
2,09
82,
526
4288
21,
426
1,18
11,
700
980
956
938
2013
.....
..……
……
……
…...
..….
2,45
12,
180
2,57
442
915
1,47
61,
217
1,75
71,
006
986
974
2014
.....
..……
……
……
…...
..….
2,53
62,
252
2,61
342
946
1,52
51,
250
1,79
81,
027
1,00
51,
005
2015
.....
..……
……
……
…...
..….
2,62
52,
322
2,66
342
975
1,57
61,
285
1,83
51,
055
1,03
61,
040
2016
.....
..……
……
……
…...
..….
2,67
52,
358
2,67
542
991
1,61
81,
307
1,88
31,
066
1,05
01,
055
2017
.....
..……
……
……
…...
..….
2,73
12,
401
2,69
142
1,00
81,
664
1,32
61,
878
1,07
81,
071
1,07
8
1 Inclu
des
annu
ities
to p
aren
ts a
nd, b
egin
ning
in fi
scal
yea
r 200
8, p
artit
ion
paym
ents
to s
pous
es a
nd d
ivorc
ed s
pous
es w
here
the
empl
oyee
is d
ecea
sed
or n
ot o
ther
wise
ent
itled
toan
ann
uity
. On
Sept
embe
r 30,
201
7, th
ere
were
20
pare
nts'
annu
ities
in c
urre
nt-p
aym
ent s
tatu
s av
erag
ing
$907
and
1,6
95 p
artit
ion
paym
ents
ave
ragi
ng $
315.
2 A d
isabi
lity a
nnui
ty e
nds
when
the
retir
ee a
ttain
s fu
ll ret
irem
ent a
ge, a
t whi
ch ti
me
the
annu
ity c
onve
rts to
an
age
and
serv
ice a
nnui
ty.
Cons
eque
ntly,
thes
e an
nuita
nts
are
rece
iving
age
and
ser
vice
annu
ities.
Ful
l ret
irem
ent a
ge is
age
65
for t
hose
bor
n be
fore
193
8 an
d gr
adua
lly in
crea
ses
to a
ge 6
7 fo
r tho
se b
orn
1960
and
late
r.3 E
xclu
des
parti
tion
paym
ents
to s
pous
es a
nd d
ivorc
ed s
pous
es w
here
the
empl
oyee
is d
ecea
sed.
Ave
rage
s ar
e af
ter c
ourt-
orde
red
parti
tions
.4 N
umbe
rs in
clude
ann
uitie
s te
mpo
raril
y be
ing
paid
at s
pous
e an
nuity
rate
s, p
endi
ng fi
nal a
djud
icatio
n of
sur
vivor
ann
uitie
s.
5In
clude
s an
nuitie
s to
disa
bled
wid
ow(e
r)s a
ge 6
0 an
d ov
er n
ow p
ayab
le a
s ag
ed w
idow
(er)s
' ann
uitie
s.
Tabl
e 5.
--Num
ber a
nd a
vera
ge a
mou
nt o
f ret
irem
ent a
nd s
urvi
vor a
nnui
ties
in c
urre
nt-p
aym
ent s
tatu
s at
end
of y
ear,
by ty
pe o
f ann
uita
nt a
nd fi
scal
yea
r, 20
08-2
017
Fisc
al y
ear

StatiStical tableS 55
Ret
ired
empl
oyee
sS
pous
esan
dW
idow
edS
uppl
e-di
vorc
edA
ged
Dis
able
dm
othe
rsR
emar
ried
Div
orce
d T
otal
1A
geD
isab
ility
men
tal2
spou
ses
wid
ow(e
r)sw
idow
(er)s
(fath
ers)
Chi
ldre
nw
idow
(er)s
wid
ow(e
r)s
NU
MB
ER A
WAR
DED
2008
......
......
..……
……
38,5
919,
753
3,40
27,
090
10,1
276,
511
166
143
515
188
693
2009
......
......
..……
……
39,3
1710
,310
3,21
37,
015
10,9
196,
283
181
142
463
166
622
2010
......
......
..……
……
40,1
9110
,712
3,16
17,
319
11,2
566,
163
189
9942
915
770
220
11...
......
.....…
……
…39
,647
10,5
423,
086
7,08
711
,301
6,05
317
311
041
715
871
820
12...
......
.....…
……
…38
,649
10,0
542,
858
6,77
811
,479
5,82
818
111
545
416
473
420
13...
......
.....…
……
…38
,094
10,2
112,
324
6,50
211
,444
5,99
516
411
145
614
673
920
14...
......
.....…
……
…37
,294
10,2
101,
800
6,67
311
,495
5,58
213
311
139
814
474
520
153 ...
......
……
……
…36
,316
10,0
591,
686
6,19
411
,300
5,54
612
099
462
151
696
2016
......
...…
……
……
.35
,950
10,2
361,
682
5,91
011
,373
5,31
912
394
380
116
715
2017
......
...…
……
……
.33
,540
9,12
11,
562
5,17
810
,758
5,48
486
8639
012
774
6
Cum
ulat
ive
1937
-201
75,
272,
471
1,53
2,63
452
8,72
152
7,96
71,
233,
265
1,05
6,92
419
,134
85,5
9823
9,57
416
,220
28,8
80
AVER
AGE
AMO
UN
T
2008
......
....…
……
……
......
..$2
,650
$2,4
41$4
1$9
11$1
,629
$1,3
85$1
,721
$1,1
53$9
64$9
0120
09...
......
.……
……
…...
.....
2,68
52,
558
4193
11,
708
1,44
31,
709
1,23
31,
030
996
2010
......
....…
……
……
......
..2,
786
2,50
941
950
1,74
01,
536
1,77
81,
203
1,06
496
320
11...
......
.……
……
…...
.....
2,81
42,
524
4195
81,
789
1,53
11,
779
1,19
41,
077
991
2012
......
....…
……
……
......
..2,
888
2,58
541
981
1,85
91,
515
1,64
71,
220
1,13
01,
049
2013
......
....…
……
……
......
..2,
921
2,56
541
1,00
31,
911
1,50
31,
916
1,33
21,
161
1,10
420
14...
......
.……
……
…...
.....
3,04
12,
624
411,
024
1,98
51,
615
1,87
41,
294
1,15
11,
095
2015
......
....…
……
……
......
..3,
114
2,61
141
1,05
52,
031
1,68
51,
728
1,30
21,
153
1,17
520
16...
......
.……
……
…...
.....
3,12
42,
667
411,
062
2,09
61,
677
2,03
41,
371
1,16
61,
174
2017
......
....…
……
……
......
..3,
159
2,72
341
1,04
72,
113
1,75
21,
806
1,36
81,
189
1,20
9
Tabl
e 6.
--Num
ber a
nd a
vera
ge a
mou
nt o
f ret
irem
ent a
nd s
urvi
vor a
nnui
ties
awar
ded
durin
g ye
ar,
Fisc
al y
ear
by ty
pe o
f ann
uita
nt a
nd fi
scal
yea
r, 20
08-2
017
1E
xclu
des
parti
tion
paym
ents
to s
pous
es a
nd d
ivor
ced
spou
ses
whe
re th
e em
ploy
ee is
dec
ease
d or
not
oth
erw
ise
entit
led
to a
n an
nuity
. Inc
lude
s an
nuiti
es to
par
ents
. Fi
scal
yea
r 201
7 to
tal i
nclu
des
2 an
nuiti
es to
par
ents
ave
ragi
ng $
844.
Cum
ulat
ive
tota
l inc
lude
s 3,
554
annu
ities
to p
aren
ts.
2E
xclu
des
parti
tion
paym
ents
to s
pous
es a
nd d
ivor
ced
spou
ses
whe
re th
e em
ploy
ee is
dec
ease
d. A
vera
ges
are
afte
r cou
rt-or
dere
d pa
rtitio
ns.
3S
uppl
emen
tal a
nnui
ty a
war
ds e
xclu
de m
ore
than
1,0
00 re
stor
atio
ns d
ue to
Leg
al O
pini
on 2
014-
2, R
educ
tions
to S
uppl
emen
tal A
nnui
ties
for 4
01(k
) Dis
tribu
tions
.
NO
TE.--
Cum
ulat
ive
figur
es re
flect
adj
ustm
ents
not
mad
e in
yea
rly d
ata,
but
ave
rage
am
ount
s fo
r eac
h ye
ar in
clud
e ef
fect
s of
cha
nges
in ra
tes
mad
e by
the
end
of th
e ye
ar.

56 2018 Annual Report, U.S. Railroad Retirement Board
Tota
l1R
etire
men
t ben
efits
2S
urvi
vor b
enef
its
M
onth
ly
Mon
thly
M
onth
lyS
tate
3
Num
ber
a
mou
nt
N
umbe
r
am
ount
Num
ber
a
mou
nt
Ala
bam
a……
……
……
……
……
……
……
……
……
……
……
……
...11
,800
$18,
904
9,70
0$1
5,54
32,
100
$3,3
58A
lask
a……
……
……
……
……
……
……
……
……
……
……
……
…...
200
292
200
238
(4)
53
Ariz
ona…
……
……
……
……
……
……
……
……
……
……
……
…...
..11
,900
18,7
619,
800
15,5
532,
000
3,19
1A
rkan
sas…
……
……
……
……
……
……
……
……
……
……
……
….
12,4
0019
,661
10,4
0016
,664
1,90
02,
984
Cal
iforn
ia…
……
……
……
……
……
……
……
……
……
……
……
….
32,0
0048
,760
26,1
0040
,172
5,80
08,
564
Col
orad
o……
……
……
……
……
……
……
……
……
……
……
…...
...10
,400
17,3
138,
900
14,8
981,
500
2,40
9C
onne
ctic
ut…
……
……
……
……
……
……
……
……
……
…...
......
...2,
900
5,51
62,
300
4,63
760
087
8D
elaw
are…
……
……
……
……
……
……
……
……
……
……
……
…..
2,90
04,
898
2,50
04,
284
400
613
Was
hing
ton
DC
……
……
……
……
……
……
……
……
……
......
......
.40
062
330
053
210
091
Flor
ida…
……
……
……
……
……
……
……
……
……
……
……
…...
...36
,200
57,8
9630
,400
49,3
785,
800
8,49
1
Geo
rgia
……
……
……
……
……
……
……
……
……
……
……
……
....
21,1
0034
,219
17,8
0029
,035
3,30
05,
177
Haw
aii…
……
……
……
……
……
……
……
……
……
……
……
…...
....
200
264
200
216
(4)
47
Idah
o……
……
……
……
……
……
……
……
……
……
……
……
......
..5,
700
9,25
64,
800
7,75
290
01,
496
Illin
ois…
……
……
……
……
……
……
……
……
……
……
……
......
....
39,9
0062
,296
32,8
0051
,529
6,90
010
,724
Indi
ana…
……
……
……
……
……
……
……
……
……
……
……
…...
..19
,100
30,3
7615
,600
25,0
163,
400
5,34
0
Iow
a……
……
……
……
……
……
……
……
……
……
……
……
......
....
11,3
0018
,057
9,40
015
,065
1,90
02,
977
Kan
sas…
……
……
……
……
……
……
……
……
……
……
……
…...
..17
,100
28,0
2114
,400
23,6
892,
600
4,31
9K
entu
cky…
……
……
……
……
……
……
……
……
……
……
……
......
17,6
0027
,113
14,4
0022
,071
3,20
05,
029
Loui
sian
a……
……
……
……
……
……
……
……
……
……
……
......
..9,
100
14,1
957,
400
11,6
671,
700
2,52
4M
aine
...…
……
……
……
……
……
……
……
……
……
……
……
…...
..2,
900
4,12
62,
300
3,25
560
086
9
Mar
ylan
d……
……
……
……
……
……
……
……
……
……
……
…...
...10
,300
16,3
278,
400
13,6
361,
800
2,68
7M
assa
chus
etts
……
……
……
……
……
……
……
……
……
......
......
..4,
600
7,25
53,
800
6,06
480
01,
190
Mic
higa
n……
……
……
……
……
……
……
……
……
……
……
…...
...16
,000
24,9
0713
,100
20,2
842,
900
4,60
5M
inne
sota
……
……
……
……
……
……
……
……
……
……
……
......
.17
,100
26,8
1314
,100
22,2
623,
000
4,53
0M
issi
ssip
pi…
……
……
……
……
……
……
……
……
……
…...
......
....
7,00
010
,817
5,70
08,
753
1,30
02,
061
Mis
sour
i……
……
……
……
……
……
……
……
……
……
……
…...
....
23,5
0037
,097
19,7
0031
,231
3,80
05,
844
Mon
tana
……
……
……
……
……
……
……
……
……
……
……
……
...7,
400
11,9
306,
300
10,1
531,
100
1,76
9N
ebra
ska…
……
……
……
……
……
……
……
……
……
……
……
.....
18,3
0032
,285
16,1
0028
,527
2,20
03,
741
Nev
ada.
……
……
……
……
……
……
……
……
……
……
……
……
....
4,00
06,
293
3,40
05,
276
700
1,01
3N
ew H
amps
hire
……
……
……
……
……
……
……
……
……
......
......
1,00
01,
660
900
1,37
620
028
4
New
Jer
sey…
……
……
……
……
……
……
……
……
……
……
......
...10
,000
17,6
198,
100
14,7
231,
900
2,89
4N
ew M
exic
o……
……
……
……
……
……
……
……
……
……
…...
.....
5,00
07,
903
4,10
06,
463
900
1,43
5N
ew Y
ork…
……
……
……
……
……
……
……
……
……
……
……
.....
23,8
0041
,186
19,3
0034
,436
4,50
06,
741
Nor
th C
arol
ina…
……
……
……
……
……
……
……
……
......
......
......
12,2
0018
,502
9,90
015
,170
2,30
03,
325
Nor
th D
akot
a……
……
……
……
……
……
……
……
……
…...
......
....
3,90
06,
436
3,20
05,
289
700
1,14
2
See
foot
note
s at
end
of t
able
.
Tabl
e 7.
--Ret
irem
ent a
nd s
urvi
vor b
enef
its in
cur
rent
-pay
men
t sta
tus
on S
epte
mbe
r 30,
201
7, b
y cl
ass
and
stat
e (a
mou
nts
in th
ousa
nds)

StatiStical tableS 57
Tota
l1R
etire
men
t ben
efits
2Su
rviv
or b
enef
its
M
onth
ly
Mon
thly
M
onth
lySt
ate3
N
umbe
r
am
ount
Num
ber
a
mou
nt
N
umbe
r
am
ount
Ohi
o...…
……
……
……
……
……
……
……
……
……
……
……
…...
..29
,200
$44,
391
23,2
00 $
35,2
375,
900
$9,
136
Okl
ahom
a……
……
……
……
……
……
……
……
……
……
……
…...
6,00
09,
446
4,80
07,
647
1,10
01,
793
Ore
gon.
……
……
……
……
……
……
……
……
……
……
……
……
...9,
400
14,6
297,
800
12,0
681,
600
2,54
7Pe
nnsy
lvan
ia…
……
……
……
……
……
……
……
……
……
......
......
37,3
0059
,428
29,6
0047
,831
7,60
011
,580
Rho
de Is
land
……
……
……
……
……
……
……
……
……
…...
......
...70
01,
198
600
1,01
510
018
3
Sout
h C
arol
ina…
……
……
……
……
……
……
……
……
......
......
....
8,40
013
,321
7,00
011
,198
1,40
02,
119
Sout
h D
akot
a……
……
……
……
……
……
……
……
……
…...
......
..2,
200
3,54
71,
900
3,07
230
047
3Te
nnes
see…
……
……
……
……
……
……
……
……
……
……
…...
..15
,100
23,9
5312
,400
19,9
352,
600
4,00
6Te
xas.
.……
……
……
……
……
……
……
……
……
……
……
……
....
42,3
0069
,775
35,2
0058
,629
7,00
011
,082
Uta
h...…
……
……
……
……
……
……
……
……
……
……
……
…...
...6,
100
10,1
065,
100
8,40
01,
000
1,69
9
Verm
ont…
……
……
……
……
……
……
……
……
……
……
……
…..
800
1,17
570
090
220
027
2Vi
rgin
ia…
……
……
……
……
……
……
……
……
……
……
……
......
.19
,400
31,1
0315
,800
25,6
983,
600
5,39
5W
ashi
ngto
n……
……
……
……
……
……
……
……
……
……
…...
....
13,2
0020
,895
10,8
0017
,224
2,30
03,
661
Wes
t Virg
inia
……
……
……
……
……
……
……
……
……
......
......
...9,
500
15,0
187,
500
11,8
752,
000
3,13
8W
isco
nsin
……
……
……
……
……
……
……
……
……
……
……
......
11,9
0018
,200
9,80
015
,012
2,00
03,
177
Wyo
min
g……
……
……
……
……
……
……
……
……
……
……
……
4,60
08,
054
4,00
07,
114
500
933
Out
side
Uni
ted
Stat
es:
Can
ada.
……
……
……
……
……
……
……
……
……
……
……
……
...2,
100
1,35
31,
400
702
700
651
Mex
ico.
……
……
……
……
……
……
……
……
……
……
……
……
...20
019
410
072
100
122
Oth
er..…
……
……
……
……
……
……
……
……
……
……
……
…...
..60
072
440
050
120
022
3
To
tal5 …
……
……
……
……
……
……
……
……
……
……
......
......
..64
8,30
0$1
,034
,098
533,
400
$858
,980
113,
200
$174
,585
Tabl
e 7.
--Ret
irem
ent a
nd s
urvi
vor b
enef
its in
cur
rent
-pay
men
t sta
tus
on S
epte
mbe
r 30,
201
7, b
y cl
ass
and
stat
e (a
mou
nts
in th
ousa
nds)
- C
ontin
ued
1In
clud
es 1
,700
par
titio
n pa
ymen
ts to
spo
uses
and
div
orce
d sp
ouse
s w
here
the
empl
oyee
is d
ecea
sed
or n
ot o
ther
wis
e en
title
d to
an a
nnui
ty.
2In
clud
es 1
22,0
00 s
uppl
emen
tal a
nnui
ties
to e
mpl
oyee
s re
ceiv
ing
regu
lar a
nnui
ties.
In
a re
lativ
ely
smal
l num
ber o
f cas
es, e
mpl
oyee
s w
ere
also
rece
ivin
g sp
ouse
or w
idow
(er)
's b
enef
its.
3St
ate
of re
side
nce
of b
enef
icia
ry o
n Se
ptem
ber 3
0, 2
017.
4Le
ss th
an 5
0.5In
clud
es b
enef
icia
ries
who
se s
tate
of r
esid
ence
was
unk
now
n.
NO
TE.--
Ret
irem
ent b
enef
its in
clud
e re
gula
r and
sup
plem
enta
l em
ploy
ee a
nnui
ties,
spo
use
annu
ities
and
div
orce
d sp
ouse
ann
uitie
s. S
urvi
vor b
enef
its in
clud
e an
nuiti
es to
age
d an
d di
sabl
ed w
idow
(er)
s, w
idow
ed m
othe
rs a
nd fa
ther
s, re
mar
ried
and
divo
rced
wid
ow(e
r)s,
chi
ldre
n, p
aren
ts, a
nd w
idow
(er)
s an
nuiti
este
mpo
raril
y be
ing
paid
at s
pous
e an
nuity
rate
s pe
ndin
g fin
al a
djud
icat
ion
of s
urvi
vor a
nnui
ties.
Ben
efit
amou
nts
excl
ude
soci
al s
ecur
ity p
aym
ents
to d
ual b
enef
icia
ries.
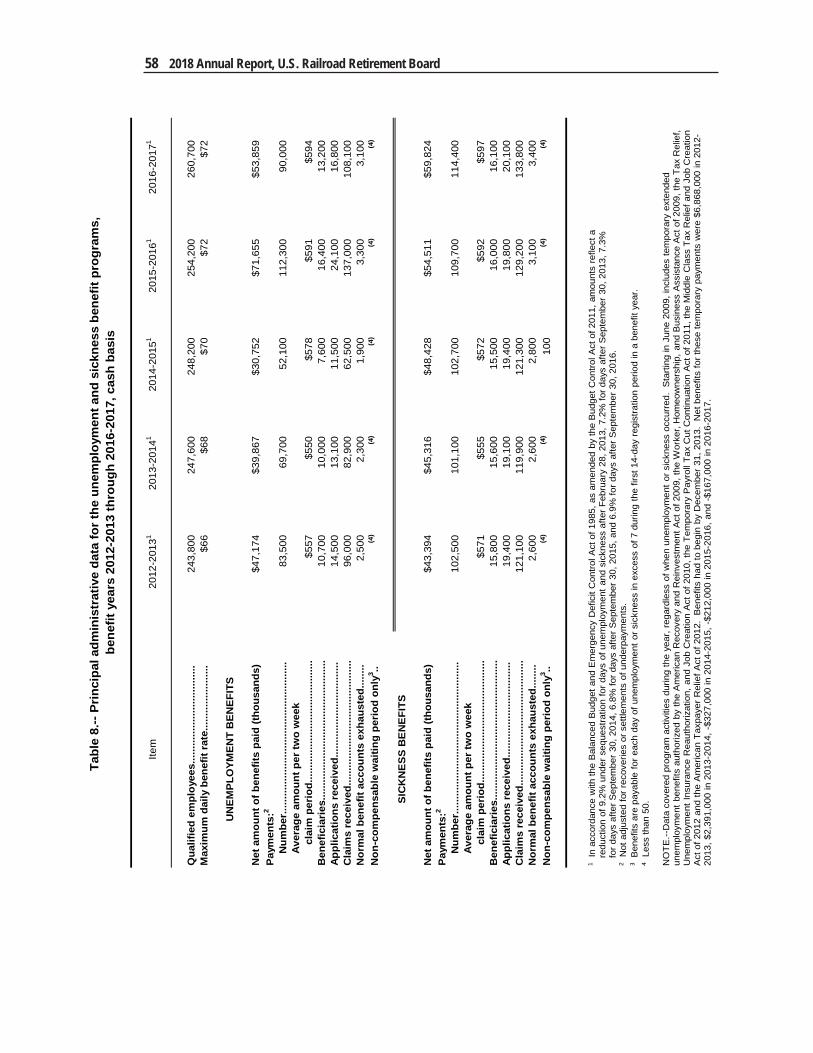
58 2018 Annual Report, U.S. Railroad Retirement Board
Tabl
e 8.
-- P
rinci
pal a
dmin
istr
ativ
e da
ta fo
r the
une
mpl
oym
ent a
nd s
ickn
ess
bene
fit p
rogr
ams,
be
nefit
yea
rs 2
012-
2013
thro
ugh
2016
-201
7, c
ash
basi
s
Item
2012
-201
3120
13-2
0141
2014
-201
5120
15-2
0161
2016
-201
71
Qua
lifie
d em
ploy
ees.
......
......
......
......
......
..24
3,80
024
7,60
024
8,20
025
4,20
026
0,70
0M
axim
um d
aily
ben
efit
rate
......
......
......
....
$66
$68
$70
$72
$72
UN
EM
PLO
YME
NT
BE
NE
FITS
Net
am
ount
of b
enef
its p
aid
(thou
sand
s)$4
7,17
4$3
9,86
7$3
0,75
2$7
1,65
5$5
3,85
9P
aym
ents
:2
N
umbe
r....
......
......
......
......
......
......
......
.....
83,5
0069
,700
52,1
0011
2,30
090
,000
A
vera
ge a
mou
nt p
er tw
o w
eek
cla
im p
erio
d....
......
......
......
......
......
......
.$5
57$5
50$5
78$5
91$5
94B
enef
icia
ries
......
......
......
......
......
......
......
.....
10,7
0010
,000
7,60
016
,400
13,2
00A
pplic
atio
ns r
ecei
ved.
......
......
......
......
......
.14
,500
13,1
0011
,500
24,1
0016
,800
Cla
ims
rece
ived
......
......
......
......
......
......
......
96,0
0082
,900
62,5
0013
7,00
010
8,10
0N
orm
al b
enef
it ac
coun
ts e
xhau
sted
......
..2,
500
2,30
01,
900
3,30
03,
100
Non
-com
pens
able
wai
ting
peri
od o
nly3 ..
(4)
(4)
(4)
(4)
(4)
S
ICK
NE
SS
BE
NE
FITS
Net
am
ount
of b
enef
its p
aid
(thou
sand
s)$4
3,39
4$4
5,31
6$4
8,42
8$5
4,51
1$5
9,82
4P
aym
ents
:2
N
umbe
r....
......
......
......
......
......
......
......
.....
102,
500
101,
100
102,
700
109,
700
114,
400
A
vera
ge a
mou
nt p
er tw
o w
eek
cla
im p
erio
d....
......
......
......
......
......
......
.$5
71$5
55$5
72$5
92$5
97B
enef
icia
ries
......
......
......
......
......
......
......
.....
15,8
0015
,600
15,5
0016
,000
16,1
00A
pplic
atio
ns r
ecei
ved.
......
......
......
......
......
.19
,400
19,1
0019
,400
19,8
0020
,100
Cla
ims
rece
ived
......
......
......
......
......
......
......
121,
100
119,
900
121,
300
129,
200
133,
800
Nor
mal
ben
efit
acco
unts
exh
aust
ed...
.....
2,60
02,
600
2,80
03,
100
3,40
0N
on-c
ompe
nsab
le w
aitin
g pe
riod
onl
y3 ..(4
)(4
)10
0(4
)(4
)
1In
acc
orda
nce
with
the
Bal
ance
d B
udge
t and
Em
erge
ncy
Def
icit
Con
trol A
ct o
f 198
5, a
s am
ende
d by
the
Bud
get C
ontro
l Act
of 2
011,
am
ount
s re
flect
are
duct
ion
of 9
.2%
und
er s
eque
stra
tion
for d
ays
of u
nem
ploy
men
t and
sic
knes
s af
ter F
ebru
ary
28, 2
013,
7.2
% fo
r day
s af
ter S
epte
mbe
r 30
, 201
3, 7
.3%
fo
r day
s af
ter S
epte
mbe
r 30
, 201
4, 6
.8%
for d
ays
afte
r Sep
tem
ber
30, 2
015,
and
6.9
% fo
r day
s af
ter S
epte
mbe
r 30
, 201
6.2
Not
adj
uste
d fo
r rec
over
ies
or s
ettle
men
ts o
f und
erpa
ymen
ts.
3B
enef
its a
re p
ayab
le fo
r eac
h da
y of
une
mpl
oym
ent o
r sic
knes
s in
exc
ess
of 7
dur
ing
the
first
14-
day
regi
stra
tion
perio
d in
a b
enef
it ye
ar.
4Le
ss th
an 5
0.
NO
TE.--
Dat
a co
vere
d pr
ogra
m a
ctiv
ities
dur
ing
the
year
, reg
ardl
ess
of w
hen
unem
ploy
men
t or s
ickn
ess
occu
rred
. S
tarti
ng in
Jun
e 20
09, i
nclu
des
tem
pora
ry e
xten
ded
unem
ploy
men
t ben
efits
aut
horiz
ed b
y th
e A
mer
ican
Rec
over
y an
d R
einv
estm
ent A
ct o
f 200
9, th
e W
orke
r, H
omeo
wne
rshi
p, a
nd B
usin
ess
Ass
ista
nce
Act
of 2
009,
the
Tax
Rel
ief,
Une
mpl
oym
ent I
nsur
ance
Rea
utho
rizat
ion,
and
Job
Cre
atio
n A
ct o
f 201
0, th
e Te
mpo
rary
Pay
roll
Tax
Cut
Con
tinua
tion
Act
of 2
011,
the
Mid
dle
Cla
ss T
ax R
elie
f and
Job
Cre
atio
n A
ct o
f 201
2 an
d th
e A
mer
ican
Tax
paye
r Rel
ief A
ct o
f 201
2. B
enef
its h
ad to
beg
in b
y D
ecem
ber
31, 2
013.
Net
ben
efits
for t
hese
tem
pora
ry p
aym
ents
wer
e $6
,868
,000
in 2
012-
2013
, $2,
391,
000
in 2
013-
2014
, -$3
27,0
00 in
201
4-20
15, -
$212
,000
in 2
015-
2016
, and
-$16
7,00
0 in
201
6-20
17.

Tabl
e 9.
--All
empl
oyee
s, n
ew e
ntra
nts,
em
ploy
ees
qual
ified
for R
UIA
ben
efits
, and
rela
ted
data
, by
empl
oyer
, 201
6
All e
mpl
oyee
sN
ew e
ntra
nts
Cre
dita
ble
Com
pens
atio
n (th
ousa
nds)
With
With
12
mon
ths
suffi
cien
t Q
ualif
ied
Qua
lifie
dof
ser
vice
serv
ice
for
for R
UIA
for R
UIA
Cla
ss o
r nam
e of
em
ploy
erTo
tal
in 2
016
RR
A an
nuity
bene
fits
Tota
lbe
nefit
sTi
er I
Tier
IIR
UIA
CLA
SS O
F EM
PLO
YER
Cla
ss I
railr
oads
......
......
......
......
......
......
......
......
......
......
....
192,
173
154,
587
143,
892
185,
102
3,17
11,
727
$13,
775,
322
$12,
942,
499
$3,0
51,5
33C
lass
II ra
ilroa
ds...
......
......
......
......
......
......
......
......
......
......
5,17
84,
212
3,41
94,
841
270
128
335,
541
320,
075
79,9
87C
lass
III r
ailro
ads
and
sw
itchi
ng &
term
inal
com
pani
es...
......
......
......
......
......
46,1
5836
,915
31,9
7843
,498
3,14
81,
845
3,30
0,74
03,
006,
082
720,
701
Car
-loan
com
pani
es...
......
......
......
......
......
......
......
......
......
2,19
51,
803
1,11
22,
099
221
165
133,
686
127,
302
35,1
20M
isce
llane
ous
empl
oyer
s1 ……
……
……
……
……
……
…7,
248
5,69
34,
486
6,58
264
236
152
2,56
845
5,62
210
8,24
2
To
tal..
......
......
......
......
......
......
......
......
......
......
......
......
......
252,
952
203,
210
184,
887
242,
122
7,45
24,
226
$18,
067,
857
$16,
851,
582
$3,9
95,5
83
SELE
CTE
D E
MPL
OYE
RS
BN
SF R
ailw
ay C
o....
......
......
......
......
......
......
......
......
......
...46
,936
38,0
4833
,553
45,5
7616
373
$3,6
18,6
70$3
,339
,442
$750
,364
Can
adia
n N
atio
nal,
U.S
. Ope
ratio
ns
Bes
sem
er a
nd L
ake
Erie
Rai
lroad
Co.
......
......
......
.....
7458
4872
11
5,00
74,
922
1,17
8
Chi
cago
Cen
tral
and
Pac
ific
Rai
lroad
Co.
......
......
.....
280
215
206
275
98
22,4
9520
,210
4,46
5
Gra
nd T
runk
Wes
tern
Rai
lroad
Co.
......
......
......
......
....
812
627
628
796
1616
67,0
2059
,933
12,7
08
Illin
ois
Cen
tral
Rai
lroad
Co.
......
......
......
......
......
......
....
3,93
73,
216
2,93
63,
834
8238
315,
270
285,
520
63,2
22
Pitt
sbur
gh a
nd C
onne
aut D
ock
Co.
......
......
......
......
...42
2320
381
11,
866
1,86
660
7
Wis
cons
in C
entr
al T
rans
port
atio
n C
orp…
……
..2,
110
1,71
91,
519
2,07
132
1517
1,91
115
7,88
234
,073
Can
adia
n Pa
cific
, Soo
Lin
e C
orpo
ratio
n
Dak
ota,
Min
neso
ta &
Eas
tern
Rai
lroad
Cor
p....
......
..67
853
752
964
87
646
,932
44,4
0510
,384
D
elaw
are
and
Hud
son
Rai
lway
Co.
Inc.
......
......
......
...25
317
318
524
8...
.....
..15
,690
15,1
363,
888
S
oo L
ine
Rai
lroad
Co…
......
......
......
......
......
......
......
.....
2,38
51,
797
1,74
52,
267
4718
175,
483
160,
064
36,3
50C
SX T
rans
port
atio
n In
c....
......
......
......
......
......
......
......
.....
28,4
8722
,169
22,7
2427
,160
144
802,
052,
877
1,94
4,45
444
5,13
7K
ansa
s C
ity S
outh
ern
Rai
lway
Co.
......
......
......
......
......
..3,
045
2,52
32,
178
2,94
390
5421
3,91
820
3,60
448
,949
G
atew
ay E
aste
rn R
ailw
ay C
o....
......
......
......
......
......
....
1010
1010
.....
.....
634
634
175
T
exas
Mex
ican
Rai
lway
Co.
......
......
......
......
......
......
.....
227
191
140
214
21
17,7
5016
,359
3,58
5N
atio
nal R
ailro
ad P
asse
nger
Cor
p. (A
mtr
ak)..
......
......
..22
,424
17,8
9015
,493
21,6
171,
376
890
1,51
1,19
51,
414,
614
357,
824
Nor
folk
Sou
ther
n C
orp.
......
......
......
......
......
......
......
......
...30
,969
24,6
6023
,594
29,3
7275
029
01,
993,
552
1,93
0,41
948
5,17
7U
nion
Pac
ific
Rai
lroad
Co.
......
......
......
......
......
......
......
....
49,5
0440
,731
38,3
8447
,961
451
236
3,54
5,05
03,
343,
035
793,
447
1 Incl
udes
labo
r org
aniz
atio
ns, l
esso
r com
pani
es, e
mpl
oyer
ass
ocia
tions
and
mis
cella
neou
s ca
rrie
r affi
liate
s.
NO
TE.--
Tier
I co
mpe
nsat
ion
excl
udes
mis
cella
neou
s co
mpe
nsat
ion
taxa
ble
at th
e tie
r I ta
x ra
te.
StatiStical tableS 59


United States Railroad Retirement Board2018 Annual Report
U.S. Railroad Retirement Board844 North Rush Street
Chicago, IL 60611-1275
Toll Free: (877) 772-5772 TTY: (312) 751-4701
Directory: (312) 751-4300 RRB.gov
United States R
ailroad Retirem
ent Board 2018 Annual R
eport