Embed Size (px)
Citation preview
Use these links to rapidly review the documentTABLE OF CONTENTSITEM 8. Financial Statements and Supplementary Data.
Table of Contents
UNITED STATESSECURITIES AND EXCHANGE COMMISSION
Washington, D.C. 20549
FORM 10-K
ANNUAL REPORT PURSUANT TO SECTION 13 OR 15(d) OFTHE SECURITIES EXCHANGE ACT OF 1934
For the fiscal year ended September 30, 2014
Commission file number: 1-12997
MAXIMUS, INC.(Exact name of registrant as specified in its charter)
Virginia (State or other jurisdiction ofincorporation or organization)
54-1000588 (I.R.S. Employer
Identification No.)
1891 Metro Center Drive, Reston, Virginia
(Address of principal executive offices)
20190
(Zip Code)
Registrant's telephone number, including area code: (703) 251-8500
Securities registered pursuant to Section 12(b) of the Act:
Title of each class Name of each exchange on which registered
Common Stock, no par value New York Stock Exchange
Securities registered pursuant to Section 12(g) of the Act: None
Indicate by check mark if the registrant is a well-known seasoned issuer, as defined in Rule 405 of the SecuritiesAct. Yes � No �
Indicate by check mark if the registrant is not required to file reports pursuant to Section 13 or Section 15(d) of theAct. Yes � No �
Indicate by check mark whether the registrant (1) has filed all reports required to be filed by Section 13 or 15(d) of theSecurities Exchange Act of 1934 during the preceding 12 months (or for such shorter period that the registrant was requiredto file such reports), and (2) has been subject to such filing requirements for the past 90 days. Yes � No �
Indicate by check mark whether the registrant has submitted electronically and posted on its corporate Website, if any,every Interactive Data File required to be submitted and posted pursuant to Rule 405 of Regulation S-T (§232.405 of thischapter) during the preceding 12 months (or for such shorter period that the registrant was required to submit and post suchfiles). Yes � No �
Indicate by check mark if disclosure of delinquent filers pursuant to Item 405 of Regulation S-K is not contained herein,and will not be contained, to the best of registrant's knowledge, in definitive proxy or information statements incorporated byreference in Part III of this Form 10-K or any amendment to this Form 10-K. �
Indicate by check mark whether the registrant is a large accelerated filer, an accelerated filer, or a non-accelerated filer.See definition of "accelerated filer and large accelerated filer" in Rule 12b-2 of the Exchange Act. (Check one):

Large accelerated filer � Accelerated filer � Non-accelerated filer �(Do not check if a
smaller reporting company)
Smaller reporting company �
Indicate by check mark whether the registrant is a shell company (as defined in Rule 12b-2 of the Act). Yes � No �
The aggregate market value of outstanding voting stock held by non-affiliates of the registrant as of March 31, 2014was $2,985,201,164 based on the last reported sale price of the registrant's Common Stock on The New York Stock Exchangeas of the close of business on that day.
There were 65,859,637 shares of the registrant's Common Stock outstanding as of November 1, 2014.
DOCUMENTS INCORPORATED BY REFERENCE
Portions of the registrant's definitive Proxy Statement for its 2015 Annual Meeting of Shareholders to be held onMarch 11, 2015, which definitive Proxy Statement will be filed with the Securities and Exchange Commission not later than120 days after the end of the registrant's fiscal year, are incorporated by reference into Part III of this Form 10-K.
Table of Contents
MAXIMUS, Inc.Form 10-K
September 30, 2014Table of Contents
PART I ITEM 1. Business 4 ITEM 1A. Risk Factors 15 ITEM 2. Properties 15 ITEM 3. Legal Proceedings 15 ITEM 4. Mine Safety Disclosures 16 PART II ITEM 5. Market for Registrant's Common Equity, Related Stockholder Matters and Issuer
Purchases of Equity Securities
17 ITEM 6. Selected Financial Data 20 ITEM 7. Management's Discussion and Analysis of Financial Condition and Results of Operation 21 ITEM 7A. Quantitative and Qualitative Disclosures About Market Risk 33 ITEM 8. Financial Statements and Supplementary Data 34 ITEM 9. Changes in and Disagreements with Accountants on Accounting and Financial
Disclosure
65 ITEM 9A. Controls and Procedures 65 PART III ITEM 10. Directors, Executive Officers and Corporate Governance 67 ITEM 11. Executive Compensation 67 ITEM 12. Security Ownership of Certain Beneficial Owners and Management and Related
Stockholder Matters
67 ITEM 13. Certain Relationships and Related Transactions, and Director Independence 67 ITEM 14. Principal Accounting Fees and Services 67 PART IV ITEM 15. Exhibits, Financial Statement Schedules 68
2

Table of Contents
SPECIAL NOTE REGARDING FORWARD-LOOKING STATEMENTS
Included in this Annual Report on Form 10-K are forward-looking statements within the meaning of the PrivateSecurities Litigation Reform Act of 1995. These forward-looking statements are based on current expectations, estimates,forecasts and projections about our company, the industry in which we operate and other matters, as well as management'sbeliefs and assumptions and other statements that are not historical facts. Words such as "anticipate," "believe," "could,""expect," "estimate," "intend," "may," "opportunity," "plan," "potential," "project," "should," "will" and similar expressionsare intended to identify forward-looking statements and convey uncertainty of future events or outcomes. These statementsare not guarantees and involve risks, uncertainties and assumptions that are difficult to predict. Actual outcomes and resultsmay differ materially from such forward-looking statements due to a number of factors, including without limitation:
• a failure on our part to comply with laws governing our business, which might result in the Company being subjectto fines, penalties and other sanctions;
• a failure to meet performance requirements in our contracts, which might lead to contract termination andliquidated damages;
• the outcome of reviews or audits, which might result in financial penalties and reduce our ability to respond toinvitations for new work;
• the effects of future legislative or government budgetary and spending changes;
• difficulties in integrating acquired businesses;
• matters related to business we have disposed of or divested;
• our failure to successfully bid for and accurately price contracts to generate our desired profit;
• our ability to maintain relationships with key government entities upon whom a substantial portion of our revenueis derived;
• the ability of government customers to terminate contracts on short notice, with or without cause;
• our ability to manage capital investments and start-up costs incurred before receiving related contract payments;
• our ability to maintain technology systems and otherwise protect confidential or protected information;
• the costs and outcome of litigation; and
• other factors set forth in Exhibit 99.1 of this Annual Report on Form 10-K under the caption "SpecialConsiderations and Risk Factors."
As a result of these and other factors, our past financial performance should not be relied on as an indication of futureperformance. Additionally, we caution investors not to place undue reliance on any forward-looking statements as thesestatements speak only as of the date when made. Except as otherwise required by law, we undertake no obligation to publiclyupdate or revise any forward-looking statements, whether resulting from new information, future events or otherwise.
3

Table of Contents
PART I
ITEM 1. Business.
Throughout this annual report, the terms "MAXIMUS," "Company," "we," "our" and "us" refer to MAXIMUS, Inc. andits subsidiaries.
General
We provide business process services (BPS) to government health and human services agencies under our mission ofHelping Government Serve the People.® We are one of the largest pure-play health and human services BPS providers togovernments in the United States, Australia, Canada, the United Kingdom and Saudi Arabia. We use our experience, businessprocess management expertise and advanced technological solutions to help government agencies run efficient andcost-effective programs and improve program accountability and outcomes, while enhancing the quality of services providedto program beneficiaries.
Over the course of the past five years, our revenue and earnings have grown primarily as a result of demographic,economic and legislative trends. These trends drive demand for services from providers, such as MAXIMUS, who canprovide efficient and cost-effective solutions to problems, including:
• A need for governments to manage budgets in the face of increasing demands for social services;
• Aging populations that place a greater strain on health care and welfare systems;
• A global demand for social services that are based upon measurable outcomes; and
• Legislative initiatives, such as the Affordable Care Act (ACA) in the U.S. and the Work Programme in the U.K.,which require the implementation of new services.
With our proven track record and expertise, we are in a strong position to provide these services. We believe that webring the right combination of people, business process and technology to deliver the best-value solution to governments. Oursuccess has allowed us to gain market share in the areas in which we operate. As a result, we are:
• The largest operator of Medicaid and the Children's Health Insurance Program (CHIP) in the U.S.;
• A leading operator of U.S. health insurance exchange customer contact centers, with services provided to 5 of the15 states operating state-based exchanges, as well as to the District of Columbia, and two customer contact centersfor the federal marketplace;
• The largest provider of government-sponsored health benefit appeals and assessments in the U.S.;
• One of the largest occupational health providers in the U.K.; and
• An established provider of welfare-to-work services throughout all of our geographies including the U.S., Australia,the U.K., Saudi Arabia and Canada.
We also pursue selective acquisitions to enhance and expand our offerings or geographic presence. In 2013, we acquiredHealth Management Limited, a leading provider of independent medical assessments in the U.K. In 2012, we acquired PolicyStudies, Inc., a provider of health and human services operations in the U.S. In 2010, we acquired DeltaWare Services, Inc., aprovider of software in Canada.
4

Table of Contents
Much of our revenue is derived from long-term contractual arrangements with governments. Base contracts are typicallythree to five years and often have additional option periods, which provide good visibility in terms of predicting revenue.Most of our contracts are related to programs that are long-term in nature, such as Medicaid, Medicare and the WorkProgramme. Our client relationships are frequently decades long.
Our business segments
Our reportable segments are Health Services and Human Services. For more information concerning our segmentpresentation, including comparative revenue, gross profit, operating profit, identifiable assets and related financialinformation for the 2014, 2013 and 2012 fiscal years, see "Note 2. Business segments" within Item 8 of this Form 10-K,which we incorporate by reference herein.
Health Services Segment
Our Health Services Segment generated 74% of our total revenue in fiscal year 2014. This segment provides a variety ofbusiness process services, as well as related consulting services, for state, provincial and national government programs.These programs include the Affordable Care Act (ACA), Medicaid, CHIP, Medicare and the Supplemental NutritionAssistance Program (SNAP) in the U.S.; the Health and Disability Assessment Service and the Health and Work Service (Fitfor Work) in the U.K.; and Health Insurance BC (British Columbia) in Canada. The segment's services help people accessand utilize government programs as well as to help improve the efficiency, cost effectiveness, quality and accountability ofgovernment-sponsored health and disability benefit programs.
In this Segment, our comprehensive government health insurance program administration services include:
• Health insurance exchange customer contact center operations and support services;
• Health insurance program eligibility and enrollment services to help beneficiaries make the best choice for theirhealth insurance coverage and improve their access to health care;
• Beneficiary outreach and education—including multilingual customer contact centers and multi-channelself-service options, such as Web-based portals—for easy enrollment;
• Application assistance and independent health plan enrollment counseling to beneficiaries;
• Premium payment processing and administration, such as invoicing and reconciliation;
• Health plan oversight; and
• Comprehensive eHealth solutions with the Medigent® product suite.
Our independent health review services include:
• Independent disability and health assessments;
• Occupational health clinical assessments;
• Independent medical reviews; and
• Health appeals dispute resolution.
Our consulting services include:
• Medicaid Management Information System (MMIS) planning, oversight and consulting services; and
• Specialized program consulting services.
5

Table of Contents
The Health Services business experiences seasonality due to transaction-based work, such as periodic program openenrollment and activity related to contract life cycles. Most notably, the segment may experience revenue and marginfluctuations associated with the ACA, which provides a three-month open enrollment period that begins in our first fiscalquarter and extends into our second fiscal quarter, but may be subject to change. During the first quarter of our fiscal year,reductions in working days due to holidays and vacations may impact our sales and accounts receivable, but the effect isgenerally not significant.
Human Services Segment
Our Human Services Segment generated 26% of our total revenue in fiscal year 2014. This segment provides national,state and county human services agencies with a variety of business process services and related consulting services forwelfare-to-work, child support, higher education and K-12 special education programs. Our services can be described asfollows:
• Comprehensive welfare-to-work services to help disadvantaged individuals transition from government assistanceprograms to sustainable employment and economic independence; these include eligibility determination, casemanagement, job-readiness preparation, job search and employer outreach, job retention and career advancement,and selected educational and training services;
• Full and specialized child support case management services, customer contact center operations, and program andsystems consulting services;
• Management tools and professional consulting services for higher education institutions;
• K-12 special education case management solutions;
• Program consulting services, including independent verification and validation, cost allocation plans, repeatablemanagement services and other specialized consulting offerings; and
• Tax credit and employer services.
The Human Services Segment may experience some seasonality due to holidays and vacations during the first quarter ofour fiscal year.
Geographic Information
We operate in the U.S., Australia, Canada, the U.K. and Saudi Arabia. The distribution of revenue and assets among theU.S., Australia and the rest of the world are included in "Note 2. Business Segments" within Item 8 of this Form 10-K.
Market overview
We expect that demand for our core health and human services offerings will continue to increase over the next fewyears, driven by new legislation, an increasing propensity by governments to implement outcomes-based programs, austeritymeasures and increasing caseloads, as governments strive to deliver more services with fewer resources. Health and welfarereform initiatives and legislation has created increased demand for our services, a trend we expect to continue over the nextseveral years. Notable programs include the ACA in the U.S. and the Work Programme, the Health and DisabilityAssessment Service and the Health and Work Service (Fit for Work) in the U.K. We believe that we remain well-positionedto benefit from this increasing demand as governments look for ways to improve overall program efficiency, deliver theoutcomes that matter, and achieve value for funds spent on social benefits programs.
6
Table of Contents
Demand for our services is contingent upon factors that affect governments, including:
• The need for governments to deliver efficient, cost-effective services to program beneficiaries while meetingrequirements and achieving programmatic goals;
• The requirement of U.S. state governments to implement federal initiatives and maintain federal matching funds,such as ACA, which expands health insurance coverage to millions of Americans;
• The impact of continued budgetary pressures, which result in governments having to operate more programs withthe same level of resources and/or implement cost-control measures; and
• The need to improve business processes, push innovations, and update technology for public programs asgovernments seek outside sources of support to gain needed expertise or to address trends as more public workersbecome eligible for retirement.
As a result, governments hire BPS companies, such as MAXIMUS, to help them deliver innovative, efficient andcost-effective services to beneficiaries on their behalf. We possess the knowledge and resources to operate government healthand human programs efficiently, while maintaining the service levels demanded by our government clients. With the abilityto balance resources with demand, we also offer the flexibility and scalability that governments do not always possess.
Health Services Market Environment
Over the past decade, health care costs have risen substantially and this trend is expected to continue. For example, U.S.health care spending, among the highest of all industrialized countries, is increasing at a rate that outpaces inflation andnational income growth. Stemming these costs, as well as improving quality and access to health care, is a major policypriority for governments.
Governments seek efficient and cost-effective solutions to manage their public health programs and programs meant tosupport individuals with disabilities and long-term medical conditions, as well as those with shorter-term health conditions.
Outside the U.S., many governments are seeking partners to help them manage, administer or operate their socialbenefits programs. Countries like the U.K. are examining how public health relates to productivity, cost reduction andeconomic growth. In the U.K., the government provides a range of social welfare benefits for people who are unable to workas a result of a disability, long-term illness or other health condition. In order for the government to determine the level ofbenefits for individuals with long-term sickness or disabilities, it has decided that the best method is independent healthassessments provided by a vendor partner through the Health and Disability Assessment Service. In addition and under aseparate program, the government has also decided to launch a new service to help people with health conditions, which tendto be shorter-term in nature, to remain in or return to work through the new Health and Work Service (Fit for Work). UnderFit for Work, the government sought a vendor partner to provide occupational health assessments and general health andwork advice to employees, employers and general practitioners to assist employees with a wellness and return-to-work plan.We believe there is market demand for companies like MAXIMUS, one of the largest occupational health care providers inthe U.K., to conduct independent assessments for participants of public benefit programs.
In the U.S., many states have made program changes, most notably through benefit changes and the expansion ofmanaged care to new populations—including the aged, blind and disabled (ABD) populations—that have historically beenserved through fee-for-service Medicaid. Although ABD populations represent only a quarter of the total Medicaidpopulation, they are responsible for approximately 70% of the costs. We have seen growth in our current Medicaid programsfrom the expansion of managed care. We believe that we remain well-positioned to benefit from future expansion due to ourrole as the administrative enrollment vendor for 19 Medicaid managed care programs.
7
Table of Contents
In March 2010, Congress passed ACA, a comprehensive overhaul of the U.S. health insurance system to expand accessto health care, improve quality and reduce overall delivery costs. The expanded access to health insurance is primarilythrough insurance subsidies and Medicaid expansion. States are not required to expand their Medicaid programs, but theCongressional Budget Office estimates that most will expand coverage over the next several years. The ACA also extendsCHIP through 2019, provides increased matching federal funds and guarantees funding through 2015. We currently serve asthe administrative vendor for CHIP in nine states.
The law established health insurance exchanges to compare and purchase qualified health plans. In 2014, 13 states, aswell as the District of Columbia operate their own exchanges. In addition, 10 states participate in a partnership model and 27states have opted to use the federal marketplace, but may transition to their own state-based exchanges in the future. Wecurrently operate customer contact centers for the District of Columbia and five state-based exchanges, as well as twocustomer contact centers as a subcontractor for the federal marketplace. ACA promotes the integration of exchanges withexisting state Medicaid and CHIP programs to provide a "no wrong door" entry for program beneficiaries. Many of the corefunctions of an exchange are similar to Medicaid and CHIP, including consumer outreach and education, eligibility andenrollment, customer contact centers, Web portals and BPS to help individuals understand their options and select aninsurance plan.
ACA also requires an independent, evidence-based external review process and the option for individuals to appealcoverage determinations or claims to insurance companies. This expands the requirement to states that do not have anexisting compliant external review process and non-governmental, self-insured plans which previously were not required tohave an objective independent health appeals process. We are presently managing the eligibility appeals process for theFederally Facilitated Marketplace and we are one of the largest providers of evidence-based health insurance appeals toMedicare and 48 state agencies.
We believe the current U.S. health environment positions us to benefit from continued demand under the ACA. Overall,we expect the underlying demand for our services to increase over the next several years as states consider transitioning fromthe federal exchange to their own state-based exchanges and some also contemplate Medicaid expansion.
Human Services Market Environment
The Human Services market has experienced increased demand driven by the need for governments to reduce costs andimprove efficiency of social benefits programs. The most dynamic portion of the market is in the welfare-to-work arenawhere governments worldwide are seeking to reform their programs as an important component of comprehensive fiscalausterity measures. Certain governments are modeling new welfare reforms after established programs in Australia and theU.S. Variations of these models, with which we have a substantial amount of experience, knowledge and expertise, are beingemulated around the world through public-private partnerships, with MAXIMUS being a leading provider.
We believe we are well-positioned to compete for these global welfare-to-work opportunities because of our establishedpresence, strong brand recognition, and ability to achieve the requisite performance requirements and outcomes outlined inthe new reform measures. We offer clients demonstrated results and decades of proven experience in administeringwelfare-to-work programs in several states and countries.
8

Table of Contents
We provide comprehensive welfare-to-work case management services throughout the U.S., Australia, the U.K., Canadaand Saudi Arabia. In Australia, we are one of the largest and highest rated welfare-to-work providers, operating more than100 sites and 85 outreach locations. We also have an established presence in the U.K.'s welfare-to-work market and presentlyprovide employment and job training services under the Work Programme, a key component of the coalition government'sausterity plan to rein in costly benefits programs and reduce mounting debt.
In addition to welfare reform, we have seen an increase in initiatives to use private firms for children's services, such asfamily maintenance and child support. We currently provide services to the Family Maintenance Enforcement Program inBritish Columbia as well as several jurisdictions throughout the U.S., including Shelby County, Tennessee and Baltimore,Maryland, two of the largest child support privatization efforts in the nation.
We believe ongoing reform initiatives, as well as measures to reduce costs and improve efficiencies, combined with ouroutstanding performance, expertise and proven solutions, will continue to drive demand for our core human services businessacross multiple geographies.
Our growth strategy
Our goal is to enable future growth by remaining a leading provider of BPS and consulting services to governmentagencies. The key components of our business growth strategy include the following:
Pursue new domestic and international business opportunities and expand our customer base. With nearly 40 years ofbusiness expertise in the government market, we continue to be a leader in developing innovative solutions to meet theevolving needs of government agencies. We seek to grow our domestic and international businesses by leveraging ourexisting core capabilities, consistently delivering the required outcomes for governments to achieve program goals, andpursuing opportunities with new and current clients.
Grow long-term, recurring revenue streams. We seek to enter into long-term relationships with clients to meet theirongoing objectives. As a result, long-term contracts (three to five years with additional option years) are often the preferredmethod of delivery for customers and are also beneficial to us. We believe an incumbent has a considerable advantage inrecompetes and that customer relationships can last for decades.
Pursue strategic acquisitions. We will selectively identify and pursue strategic acquisitions. Acquisitions can provideus with a rapid and cost-effective method to enhance our services, obtain additional skill sets, expand our customer base,cross-sell additional services, enhance our technical capabilities and establish or expand our geographic presence.
Continue to optimize our current operations to drive innovation and quality to customers. We continue to seekefficiencies and optimize operations in order to achieve sustainable, profitable growth. We will continue to deliver qualitybusiness process services to clients to improve cost effectiveness, program efficiency and overall program scalability asgovernments deal with rising demand and increasing caseloads.
Recruit and retain highly skilled professionals. We continually strive to recruit motivated individuals, including topmanagers from larger organizations, former government officials, consultants experienced in our service areas and recentcollege graduates with degrees aligned with our mission, such as degrees in government policy and administration. Webelieve we can continue to attract and retain experienced and educated personnel by capitalizing on our focused marketapproach and our reputation as a premier government services provider.
9

Table of Contents
Focus on core health and human services business lines. We have centered our core business offerings on deliveringbusiness process managed services to government health and human services agencies. Our market focus and establishedpresence positions us to benefit from health care and welfare reform initiatives both in the U.S. and internationally.
See Exhibit 99.1 of this Annual Report on Form 10-K under the caption "Special Considerations and Risk Factors" forinformation on risks and uncertainties that could affect our business growth strategy.
Competitive advantages
We offer a private sector alternative for the operation and management of critical government-funded health and humanservices programs. Our reputation and extensive experience give us a competitive advantage as governments value the levelof expertise, proven delivery and brand recognition that we bring our customers. The following are the competitiveadvantages that allow us to capitalize on various market opportunities:
Proven track record, ability to deliver outcomes and exceptional brand recognition. Since 1975, we have successfullyassisted governments in delivering cost-effective services to beneficiaries of government programs. We run large-scaleprogram management operations on behalf of government agencies, improving the quality of services provided to theirbeneficiaries and achieving the necessary outcomes to help them cost-effectively meet their program goals. This has furtherenhanced our brand recognition as a proven partner with government agencies.
Subject matter expertise. Our workforce includes many individuals who possess substantial subject matter expertise inareas critical to the successful design, implementation, administration and operation of government health and humanservices programs. Many of our employees have worked for governments in management positions and can offer insights intohow we can best provide valuable, practical and effective services to our clients.
Intellectual property that supports the administration of government programs. We have proprietary solutions toaddress client requirements in our market that are configurable or provide a platform that can be transferred to meetcontractual needs. We leverage commercial off-the-shelf platforms across multiple contracts in which we have considerableexpertise to ensure we can deploy repeatable proven solutions. We also leverage software development methodology toshorten software development cycles. Extensive use of shared infrastructure and standard solutions provides considerableprice and quality advantages. Management believes our extensive industry focus and expertise embedded in our systems andprocess provide us with a competitive advantage.
Flexibility and Scalability. We are experienced in launching large-scale operations under compressed time frames. Weoffer clients the flexibility and scalability to deliver the people, processes and technology to complete short- and long-termcontractual assignments in the most efficient and cost-effective manner.
Financial strength. We maintain a strong balance sheet, generate consistent annual cash flow and have access to a$100 million revolving credit facility. We possess the financial strength to ensure clients can confidently trust us to safelyoperate their high-profile public health and human services programs.
Focused portfolio of services. We are one of the largest publicly traded companies that provide a portfolio of BPShealth and human services specifically to government customers. Our government program expertise and proven ability todeliver defined, measurable outcomes differentiate us from other firms and non-profit organizations, as well as from largeconsulting firms that serve multiple industries and lack the focus necessary to manage the complexities of serving health andhuman services government agencies efficiently.
10

Table of Contents
Established international presence. International governments are seeking to improve government-sponsored healthand human services programs and contain costs. We have an established presence in Australia, Canada, the U.K. and SaudiArabia. Our international efforts are focused on delivering cost effective welfare-to-work and health benefits services tobeneficiaries on behalf of governments.
Expertise in competitive bidding. Government agencies typically award contracts through a comprehensive, complexand competitive requests for proposals (RFPs) and bidding process. Although the bidding criteria varies from contract tocontract, we believe that typical contracts are awarded based upon a mix of technical solution and price. In some cases,governments award points for past performance tied to program outcomes. With nearly 40 years of experience in respondingto RFPs, we have the necessary experience and resources to navigate government procurement processes. We possess theexpertise and experience to assess and allocate the appropriate resources necessary for successful project completion inaccordance with contractual terms.
Our clients
Our primary customers are government agencies, with the majority at the national, provincial and state level and, to alesser extent, some at the county and municipal level. In the U.S., even when our direct customers are state governments, asignificant amount of our revenue is ultimately provided by the United States Federal Government in the form of cost-sharingarrangements with the states, such as is the case with Medicaid. In the year ended September 30, 2014, approximately 55% ofour total revenue was derived from state government agencies whose programs received significant federal funding, 20%from foreign government agencies, 17% from U.S. federal government agencies, and 8% from other sources including localmunicipalities and commercial customers. We were not significantly affected by the shut-down of the United States FederalGovernment in October 2013. The nature of our programs is such that they are typically deemed essential, which means that ashort-term shut-down would not be expected to cause significant disruption to our operations. However, an extended delaymay affect certain government programs that rely upon federal funding and may also have an effect on our cash flows fromoperations if payments are delayed.
For the year ended September 30, 2014, we derived approximately 17% of our consolidated revenue from contracts withthe U.S. Federal Government and approximately 10% from each of Australia, California and Texas. Revenue from the U.S.Federal Government, California and Texas was principally in our Health Services Segment; revenue from Australia wasexclusively within our Human Services Segment.
We typically contract with government clients under four primary contract types: performance-based, cost-plus,fixed-price and time-and-materials. For the year ended September 30, 2014, 49% of our contracts were performance based,25% were cost-plus, 23% were fixed-price and 3% were time-and-materials.
Generally, the relationships with our clients are long-term, multi-year contracts, subject to option years and periodicrebids. See the "Backlog" section below for more details.
Competition
The market for providing our services to government agencies is competitive and subject to rapid change. However,given the specialized nature of our services and the programs we serve, market entry can be difficult for new or inexperiencedfirms. The complex nature of competitive bidding and required investment in subject-matter expertise, repeatable processesand support infrastructure and the need to achieve specific program outcomes creates barriers to entry for potential newcompetitors unfamiliar with the nature of government procurement.
11

Table of Contents
In the U.S., our primary competitors in the Health Services Segment market are Affiliated Computer Services, a XeroxCompany, and Electronic Data Systems, an HP Company. We consider ourselves to be a significant competitor in the marketsin which we operate as we are the largest provider of Medicaid and CHIP administrative programs and operate morestate-based health insurance exchanges than any other commercial provider. Our primary competitors in the Human Servicesmarket vary according to specific business line, but are primarily specialized consulting service providers and local non-profitorganizations. Outside of the U.S., our primary competitors in both the Health Services Segment and the Human ServicesSegment markets include Serco, Atos Origin, Ingeus, a Providence Service Company, and other specialized privatecompanies and non-profit organizations. Although the basis for competition varies from contract to contract, we believe thattypical contracts are awarded based upon a mix of technical solution and price. In some cases, customers award points forpast performance tied to program outcomes.
Legislative initiatives
We actively monitor legislative initiatives and respond to opportunities as they develop. Over the past several years,legislative initiatives created new growth opportunities and potential markets for us. Legislation passed in all the geographiesin which we operate has significant public policy implications for all levels of government and presents viable businessopportunities in the health and human services arena. We are well-positioned to meet the operations program managementand consulting needs resulting from that legislation and subsequent regulatory and program implementation efforts.
Some recent legislative initiatives in the U.S. that have created new growth opportunities for MAXIMUS include:
Work Innovation and Opportunity Act (WIOA). Signed into law in July 2014, WIOA replaces the WorkforceInvestment Act of 1998 and takes effect on July 1, 2015. The law coordinates several core federal employment, training,education and literacy programs. It also requires states to strategically align their workforce development programs, with theoption to include TANF (Temporary Assistance for Needy Families), to help job seekers access the necessary supportservices and to match employers with skilled workers they need to compete in the global economy. WIOA representspotential new opportunities for us to complement our existing TANF welfare-to-work operations in the U.S.
U.K. Health and Work Service. In 2011, the U.K. government set up a review of the sickness absence system to helpreduce the 140 million days lost to sickness absence every year. The review considered how the current sickness absencesystem could be changed to help people stay in work, reduce costs and contribute to economic growth. One of the outcomesof the study is a new Health and Work Service that provides occupational health assessments and general health and workadvice to employees, employers and general practitioners to help people with a health condition to stay in or return to work.We have been operating the Health and Work Service program on behalf of the Department for Work and Pensions (DWP)since August 2014.
U.K. Work Programme. The Work Programme, part of the U.K. government's debt reduction measures, is agovernment-sponsored welfare-to-work model that consolidates several existing employment programs into a singlecomprehensive back-to-work program in an effort to achieve higher quality, longer-term and sustainable employmentoutcomes for job seekers in the U.K. The Work Programme presented new opportunities for us and we have been deliveringemployment services throughout Thames Valley, Hampshire and the Isle of Wight and West London since June 2011.
12

Table of Contents
Affordable Care Act (ACA). In March 2010, the U.S. enacted comprehensive health care reform, known as ACA, toexpand access to health coverage, protect consumer rights, control health care costs, and improve the overall health caredelivery system. In June 2012, the Supreme Court of the United States upheld ACA while allowing states to opt out of thepreviously mandated Medicaid expansion. The law presents several opportunities for MAXIMUS including: the operation ofhealth insurance exchange operations, Medicaid expansion, the extension of CHIP, the integration of state eligibilityprocessing for entitlement programs, new initiatives for long-term care that allow states more flexibility in Medicaid for homeand community-based services, the expansion of independent medical appeals services and the Medicaid demonstrationprojects for the dual eligible population (those individuals eligible for both Medicaid and Medicare)
CHIPRA. CHIPRA was signed into law on February 2, 2009, extending the previous SCHIP program. As part of theACA, CHIP has been extended through 2019 and funding has been extended through 2015, which is two additional yearsbeyond the original CHIPRA Act. By expanding state options to find and enroll eligible children through "express laneeligibility" and "auto enrollment," CHIPRA has presented us with an opportunity to expand our partnerships with states forthe administration of CHIP programs. The advent of state and federal exchanges at the beginning of 2014 will increaseparticipation of eligible children in CHIP.
Shift to Medicaid Managed Care. As Medicaid programs become larger, more complex and costly, states look to newmodels. Estimates from the Centers for Medicare and Medicaid Services (CMS) indicate that although the fee-for-servicesystem covers less than half of the total Medicaid population, it accounts for more than 80% of all Medicaid spending. Inresponse, several states have initiatives to reduce the current costs of Medicaid by moving different populations ofbeneficiaries from fixed-fee-for-service models to managed care, which represents new growth opportunities for us.
Employment Program of British Columbia (Canada). In 2009, the Province of British Columbia (BC) and theGovernment of Canada signed a Labor Market Development Agreement that delegates responsibility for delivery ofemployment and training programs from the federal to the provincial level. In response, the new Employment Program of BCwas created to provide all British Columbians eligible for work a single point of entry to employment and labor marketservices. This program represents a shift in policy to a consolidation and integration of programs into a "one-stop" and"employment first" model with required contracted services that are responsive, inclusive, accessible and client-centered.This program presented an opportunity for us to expand our workforce services offerings to new jurisdictions.
U.K. Work Capability Assessment. The Welfare Reform Act of 2007 replaced incapacity benefits with theEmployment and Support Allowance, included a Work Capability Assessment (WCA). The WCA was designed todistinguish people who could not work due to health-related problems from people who were 'fit for work' or, with additionalsupport, could eventually return to work. In 2010, the Coalition Government decided to reassess the 2.5 million people whohad previously been determined to be eligible to receive Incapacity Benefits.
Backlog
At September 30, 2014, we estimate that we had approximately $3.8 billion of revenue in backlog. Backlog representsan estimate of the remaining future revenue from existing signed base contracts and revenue from contracts that have beenawarded, but not yet signed. Our backlog estimate includes revenue expected under the current terms of executed contractsand revenue from contracts in which the scope and duration of the services required are not definite but estimable (such asperformance-based contracts). Our backlog estimate does not assume any contract renewals or option exercises.
13

Table of Contents
Increases in backlog result from the awarding of new contracts or the extension or renewal of existing contracts andoption periods. Reductions come from fulfilling contracts and early termination of contracts. Increases and decreases canfollow from changes in management's estimates, particularly for performance-related contracts.
The backlog associated with our performance-based contracts is an estimate based upon management's experience ofcase loads and similar transaction volume from which actual results may vary. Our contracts typically contain provisionspermitting government customers to terminate the contract on short notice, with or without cause.
We believe that period-to-period backlog comparisons are difficult and may not necessarily accurately reflect futurerevenue we may receive. The actual timing of revenue receipts, if any, on projects included in backlog could change for anyof the aforementioned reasons. The dollar amount by segment of our backlog as of September 30, 2014 and 2013 was asfollows:
Backlog as ofSeptember 30,
2014 2013 (In millions)
Health Services $ 2,900 $ 2,379 Human Services 900 1,021
Total $ 3,800 $ 3,400
Our BPS businesses typically involve contracts covering a number of years. Once contracts are signed, they typicallytake three to six months to begin generating revenue. At September 30, 2014, the average weighted life of these contracts wasapproximately 5 years, including option periods. Although the exercise of options is uncertain, we believe the incumbentcontractor enjoys significant advantages and they are exercised nearly 100% of the time. The longevity of these contractsassists management in predicting revenue, operating income and cash flows. We expect approximately 45% of the backlogbalance to be realized as revenue in fiscal 2015 and, with the inclusion of anticipated option period renewals, to representapproximately 90% of current estimated 2015 revenue.
Employees
As of September 30, 2014, we had approximately 13,000 employees, consisting of 9,800 employees in the HealthServices Segment, 3,000 employees in the Human Services Segment and 200 corporate administrative employees. Oursuccess depends in large part on attracting, retaining and motivating talented, innovative, experienced and educatedprofessionals at all levels.
As of September 30, 2014, 412 of our employees in Canada were covered under three different collective bargainingagreements, each of which has different components and requirements. There are 399 employees covered by two collectivebargaining agreements with the British Columbia Government and Services Employees' Union and 13 employees covered bya collective bargaining agreement with the Professional Employees Association. These collective bargaining agreementsexpire in 2015.
As of September 30, 2014, 1,400 of our employees in Australia were covered under a Collective Agreement, which issimilar in form to a collective bargaining agreement. The Collective Agreement is renewed annually.
None of our other employees are covered under any such agreement. We consider our relations with our employees to begood.
Other information
MAXIMUS, Inc. is a Virginia Corporation, founded in 1975.
14

Table of Contents
Our principal executive offices are located at 1891 Metro Center Drive, Reston, Virginia, 20190. Our telephone numberis 703-251-8500.
Our Internet address is http://www.maximus.com. We make our website available for information purposes only. Itshould not be relied upon for investment purposes, nor is it incorporated by reference into this Form 10-K.
We make our Annual Report on Form 10-K, quarterly reports on Form 10-Q, current reports on Form 8-K, and the proxystatement for our annual shareholders' meeting, as well as any amendments to those reports, available free of charge throughour website as soon as reasonably practical after we file that material with, or furnish it to, the SEC. Our SEC filings may beaccessed through the Investor Relations page of our website. These materials, as well as similar materials for other SECregistrants, may be obtained directly from the SEC through their website at http://www.sec.gov. This information may also beread and copied at the SEC's Public Reference Room at 100 F Street NE, Washington, DC 20549. Information on theoperation of the Public Reference Room may be obtained by calling the SEC at 1-800-SEC-0330.
ITEM 1A. Risk Factors.
Our operations are subject to many risks that could adversely affect our future financial condition, results of operationsand cash flows and, therefore, the market value of our securities. See Exhibit 99.1 of this Annual Report on Form 10-K underthe caption "Special Considerations and Risk Factors" for information on risks and uncertainties that could affect our futurefinancial condition and performance. The information in Exhibit 99.1 is incorporated by reference into this Item 1A.
ITEM 2. Properties.
We own a 60,000 square foot office building in Reston, Virginia. We also lease offices for operations, management andadministrative functions in connection with the performance of our services. At September 30, 2014, we leased 114 offices inthe United States totaling approximately 2.2 million square feet. In four countries outside the United States, we leased 202offices totaling approximately 0.5 million square feet. The lease terms vary from month- to-month to ten-year leases and aregenerally at market rates. In the event that a property is used for our services in the U.S., we typically negotiate clauses toallow termination of the lease if the service contract is terminated by our customer. Such clauses are not standard in foreignleases.
We believe that our properties are maintained in good operating condition and are suitable and adequate for ourpurposes.
ITEM 3. Legal Proceedings.
We are involved in various legal proceedings, including the matters described below, in the ordinary course of ourbusiness.
In March 2009, a state Medicaid agency asserted a claim against us, related to a discontinued business line, in theamount of $2.3 million in connection with a contract we had through February 1, 2009 to provide Medicaid administrativeclaiming services to school districts in the state. We entered into separate agreements with the school districts under which wehelped the districts prepare and submit claims to the state Medicaid agency which, in turn, submitted claims forreimbursement to the United States Federal Government. No legal action has been initiated. The state has asserted that itsagreement with us requires the Company to reimburse the state for the amounts owed to the Federal Government. However,the Company's agreements with the school districts require them to reimburse us for such payments and therefore we believethe school districts are responsible for any amounts disallowed by the state Medicaid agency or the Federal Government. Webelieve our exposure in this matter is limited to our fees associated with this work and that the school districts will beresponsible for the remainder. We have exited the federal health care claiming business and no longer provide the services atissue in this matter.
15

Table of Contents
In 2008, we sold the SchoolMAX student information system business line as part of the divestiture of the MAXIMUSEducation Systems division. In 2012, a school district ("District") which was a SchoolMAX client initiated arbitrationalleging that we and the buyer failed to (i) use best practices in developing the software and (ii) deliver and test productreleases as required by the contract, resulting in damages of at least $10 million. In December 2012, the arbitration paneldenied the District's claims in their entirety, and the District filed a motion in court seeking to vacate that decision.Separately, in late 2012, the District claimed that we had defrauded the District in 2007 or 2008 by misrepresenting ourintentions regarding the sale of the Education Systems division. That allegation was not part of the arbitration, and no formalclaim or lawsuit was filed. The parties settled all claims among them at no cost to us in September 2014.
In January 2014, we were named a defendant in Norton et al. v. MAXIMUS in the U.S. District Court for Idaho. Theplaintiffs in this purported class action are current and former trainers and supervisors at the MAXIMUS federal health careprojects in Boise, Idaho and Brownsville, Texas. They allege we willfully misclassified them as exempt employees under theFair Labor Standards Act and failed to pay them overtime, and they seek to establish a nationwide class covering thecompany's federal health care operations. The plaintiffs allege compensatory and punitive damages of at least $5.0 million.We have since reclassified the trainers as non-exempt employees and are seeking an expedited resolution of their wageclaims. We deny liability as to the supervisors and will contest the matter vigorously. As of September 30, 2014, theCompany reserved $0.6 million to cover the estimated legal costs of defending this lawsuit, in addition to estimated liabilitiesto employees.
ITEM 4. Mine Safety Disclosures
Not applicable
16

Table of Contents
PART II
ITEM 5. Market for Registrant's Common Equity, Related Stockholder Matters and Issuer Purchases of EquitySecurities.
Our common stock trades on the New York Stock Exchange under the symbol "MMS." The following table sets forth,for the fiscal periods indicated, the range of high and low sales prices for our common stock and the cash dividends per sharedeclared on the common stock.
Price Range High Low Dividends
Year Ended September 30, 2014: First Quarter $ 50.55 $ 42.71 $ 0.045 Second Quarter 50.24 40.61 0.045 Third Quarter 46.48 40.27 0.045 Fourth Quarter 43.40 37.94 0.045
Year Ended September 30, 2013: First Quarter $ 32.58 $ 27.20 $ 0.045 Second Quarter 40.50 31.76 0.045 Third Quarter 40.69 35.32 0.045 Fourth Quarter 45.35 34.65 0.045
As of October 31, 2014, there were 61 holders of record of our outstanding common stock. The number of holders ofrecord is not representative of the number of beneficial owners due to the fact that many shares are held by depositories,brokers or nominees. We estimate there are approximately 24,000 beneficial owners of our common stock.
We expect to continue our policy of paying regular cash dividends, although there is no assurance as to future dividends.Future cash dividends, if any, will be paid at the discretion of our Board of Directors and will depend, among other things,upon our future operations and earnings, capital requirements and surplus, general financial condition, contractual restrictionsand other factors our Board of Directors may deem relevant.
As partial consideration for the acquisition of Health Management Limited (HML) on July 1, 2013, we issued 202,972unregistered shares of our common stock to the former owners of HML. The recipients have agreed to hold these shares for aperiod of at least two years. The shares were issued pursuant to Section 4(a)(2) of the Securities Act and Regulation Spromulgated under the Securities Act.
17

Table of Contents
The following table sets forth information regarding repurchases of common stock that we made during the three monthsended September 30, 2014:
Period
TotalNumber of
SharesPurchased
AveragePrice Paidper Share
Total Number ofShares Purchased as
Part of PubliclyAnnounced Plans(1)
Approximate DollarValue of Shares that
May Yet BePurchased
Under the Plan(in thousands)
Jul. 1, 2014 - Jul. 31, 2014 403,433 $ 42.25 403,433 $ 170,294 Aug. 1, 2014 - Aug. 31, 2014 423,880 40.20 423,880 153,268 Sep. 1, 2014 - Sep. 30, 2014(2) 745,546 40.83 438,171 135,176
Total 1,572,859 41.02 1,265,484
(1) Under a resolution adopted in November 2011, the Board of Directors authorized the repurchase, at management'sdiscretion, of up to an aggregate of $125 million of the Company's common stock. Under a resolution adopted in June2014, the Company increased this balance by $150 million. The resolution also authorized the use of option exerciseproceeds for the repurchase of the Company's common stock.
(2) The total number of shares purchased in September 2014 includes 307,375 restricted stock units which vested in thismonth but which were utilized by the recipients to net-settle personal income tax obligations. The shares were notissued and a payment for this liability was made by us in October 2014.
18

Table of Contents
Stock Performance Graph
The following graph compares the cumulative total shareholder return on our common stock for the five-year periodfrom September 30, 2009 to September 30, 2014, with the cumulative total return for the NYSE Stock Market (U.S.Companies) Index. In addition, we have compared the results of two peer groups to our performance. The first peer groupcomprises Accenture, CGI, Hewlett Packard, IBM and Xerox and represents a mix of information technology, BPS andmanagement consultancy businesses. We have historically shown these entities in comparing our performance. The secondpeer group is comprised of companies noted in our annual proxy statement as entities with whom we compete for executivetalent. These companies are SAIC, Unisys, CACI International, ManTech International, CIBER, Navigant Consulting andSapient. The peer groups are weighted by market capitalization. This graph assumes the investment of $100 on September 30,2009 in our common stock, the NYSE Stock Market (U.S. Companies) Index and our peer groups and assumes dividends arereinvested.
Comparison of 5 Year Cumulative Total ReturnAssumes Initial Investment of $100
September 2014
Notes:
A. The lines represent index levels derived from compounded daily returns that include all dividends.
B. The indexes are reweighted daily, using the market capitalization on the previous trading day.
C. If the monthly interval, based on the fiscal year-end, is not a trading day, the preceding trading day is used.
D. The index level for all series was set to $100.0 on 09/30/2009.
19

Table of Contents
ITEM 6. Selected Financial Data.
We have derived the selected consolidated financial data presented below from our consolidated financial statements andthe related notes. The revenue and operating results related to the acquisition of companies using the purchase accountingmethod are included from the respective acquisition dates. The selected financial data should be read in conjunction with"Management's Discussion and Analysis of Financial Condition and Results of Operations" included as Item 7 of this AnnualReport on Form 10-K and with the Consolidated Financial Statements and related Notes included as Item 8 of this AnnualReport on Form 10-K. The historical results set forth in this Item 6 are not necessarily indicative of the results of operationsto be expected in the future.
Year Ended September 30, 2014 2013 2012 2011 2010 (In thousands, except per share data)
Statement of operations data: Revenue $ 1,700,912 $ 1,331,279 $ 1,050,145 $ 929,633 $ 831,749 Operating income 225,308 185,155 127,334 122,401 107,406 Net income attributable to MAXIMUS 145,440 116,731 76,133 81,168 70,409 Basic earnings per share attributable
MAXIMUS $ 2.15 $ 1.71 $ 1.12 $ 1.18 $ 1.01 Diluted earnings per share attributable to
MAXIMUS $ 2.11 $ 1.67 $ 1.09 $ 1.14 $ 0.98 Weighted average shares outstanding:
Basic 67,680 68,165 67,734 68,834 69,653 Diluted 69,087 69,893 69,611 71,062 71,860
Cash dividends per share of common stock $ 0.18 $ 0.18 $ 0.18 $ 0.15 $ 0.12
At September 30, 2014 2013 2012 2011 2010 (In thousands)
Balance Sheet Data: Cash and cash equivalents $ 158,112 $ 125,617 $ 189,312 $ 172,950 $ 155,321 Total assets 900,996 857,978 695,293 565,279 527,741 Long-term debt 1,217 1,489 1,736 1,696 1,411 Total MAXIMUS shareholders'
equity 555,962 529,508 451,106 374,457 338,789
20

Table of Contents
ITEM 7. Management's Discussion and Analysis of Financial Condition and Results of Operation.
The following discussion and analysis of financial condition and results of operations is provided to enhance theunderstanding of, and should be read in conjunction with, our Consolidated Financial Statements and the related Notes.
Business overview
We provide business process services (BPS) to government health and human services agencies under our mission ofHelping Government Serve the People.® We are one of the largest pure-play health and human services BPS providers togovernments in the United States, Australia, Canada, the United Kingdom and Saudi Arabia. We use our experience, businessprocess management expertise and advanced technological solutions to help government agencies run efficient andcost-effective programs, improve program accountability and outcomes, while enhancing the quality of services provided toprogram beneficiaries.
During the past five years, we have focused on our core health and human services businesses. Prior to this point, anumber of non-core businesses were divested or discontinued while operations were expanded in the United States andinternationally through a combination of organic growth and the acquisition of companies with complementary capabilities.We believe that this focus, balanced by a risk-management structure, has enabled us to attain profitable growth in recentyears.
Both within the United States and internationally, governments are being challenged by factors that increase socialburdens, including aging populations and demands for health care reform, offset by reduced funds with which to deal withthese demands. We believe that these trends will continue to provide a demand for services that can be met by companiessuch as MAXIMUS. We are also seeing increased scrutiny and heightened accountability within the markets which we serve.We believe that a combination of our rigorous employee training, stringent adherence to our Standards of Business Conductand Ethics, robust financial performance and global experience gives existing and future customers the confidence thatMAXIMUS can reliably operate their high-profile public health and human services programs.
Significant recent acquisitions
On July 1, 2013, we acquired Health Management Limited (HML), a leading provider of independent health assessmentswithin the United Kingdom. We acquired HML in order to expand our independent medical assessment business and tostrengthen the presence of our Health Services Segment in the United Kingdom.
On April 30, 2012, we acquired Policy Studies, Inc. (PSI). PSI supports government clients in the administration of anumber of health and human services programs exclusively within the United States. We acquired PSI, among other reasons,to strengthen our leadership in the administration of public health and human services programs. The acquired assets andbusiness have been integrated into both the Health Services and Human Services Segments.
In assessing the performance of our business, we believe that it is helpful to our investors to show organic revenuegrowth, which represents the increase in revenue from contracts excluding those provided by our acquired businesses.Organic growth is a non-GAAP number that we believe provides a useful basis for assessing the performance of the businessexcluding the effects of HML. In order to calculate organic growth, we remove the acquired business' prior year pro formarevenue from the current period. Organic growth is not meant to be used in isolation, nor as an alternative to revenue growthas a measure of performance. In addition, this non-GAAP financial measure, as determined and presented by us, may not becomparable with related or similarly-titled measures presented by other companies.
21

Table of Contents
Financial overview
We have experienced strong year-over-year growth in both revenue and operating profit.
• In both fiscal years 2014 and 2013, the Health Services Segment achieved significant organic growth driven byrevenue from services related to the Affordable Care Act, the transfers of Medicaid populations to managed-careplans and volume growth in our Medicare federal appeals business.
• During fiscal year 2013, the Human Services Segment achieved organic growth though the ramp up of itsinternational businesses, particularly in the United Kingdom and Saudi Arabia. Growth in fiscal year 2014 has beentempered by the completion of a significant fixed price contract.
• We benefitted from acquired growth from HML and PSI.
We continue to see opportunities to expand further our business related to the Affordable Care Act (ACA) andMedicaid-related initiatives. We are currently providing customer contact centers for five states, the District of Columbia andthe United States Federal Government. At present, 37 states use the federal marketplace or a partnership model, rather than astate-based health insurance exchange and we anticipate that some of these states may migrate to their own exchanges overthe next several years. If this does occur, there will be opportunities for experienced service providers such as MAXIMUS tooperate these exchanges. In international markets, we continue to see demand as governments rationalize their benefitsprograms and increase their propensity to outsource. We believe that this will provide opportunities to providers likeMAXIMUS in both our existing and new markets.
Our cash flows in fiscal year 2013 were constrained through the additional requirements for working capital necessitatedby our growth, as well as increases in the time taken by our customers to pay us. Free cash flow, which includes cashoutflows related to capital expenditures, was also tempered by the need to invest in the necessary infrastructure primarilyassociated with new contract awards, particularly in the United States. We have seen significant cash flows in fiscal year2014 as these investments and improvements in working capital have resulted in improved net cash flow.
Sales pipeline at September 30, 2014 was $3.5 billion, compared to $2.4 billion at September 30, 2013. At the start ofthe current year, we had a significant number of new contracts in start-up and these converted opportunities were the principaldriver behind the current fiscal year's growth in revenue. The sales pipeline only reflects opportunities where the request forproposal (RFP) is expected to be released within the next six months. Under most circumstances, contract opportunities thatare carried within the pipeline reflect the base contract value and do not include future option periods. Option periods aretypically reported in the pipeline six months before they are eligible to be exercised. For contracts with the United StatesFederal Government, it is common to see a single year base contract with multiple options, whereas state, local andinternational contracts typically have longer base periods. Our assessment of pipeline reflects only opportunities that we arepursuing or planning to pursue and should not be considered as indicative of guaranteed future revenue.
International businesses
We operate in international locations and, accordingly, transact business in currencies other than the United StatesDollar, principally the Australian Dollar, the Canadian Dollar, the British Pound and the Saudi Arabian Riyal. During the yearended September 30, 2014, we earned approximately 23% and 20% of revenue and operating income, respectively, from ourforeign subsidiaries. At September 30, 2014, approximately 36% of our assets are held by foreign subsidiaries. Internationalbusiness exposes us to certain risks.
22

Table of Contents
• International tax rules may limit the use of cash in other parts of the business without increasing significantadditional tax expense or withholding. We mitigate this risk by maintaining sufficient capital within our foreignsubsidiaries to support the short-term and long-term capital requirements of the businesses. We establish our legalentities to make the most efficient use of tax laws and holding companies to minimize this exposure.
• We may be subject to exposure from foreign currency fluctuations. Our foreign subsidiaries typically incur costs inthe same currency as they earn revenue, thus limiting our exposure to unexpected currency fluctuations. Theoperations of the U.S. business do not depend upon cash flows from foreign subsidiaries.
Summary of consolidated results
The following table sets forth, for the fiscal year ends indicated, selected statements of operations data:
Year ended September 30, 2014 2013 2012
(dollars in thousands,except per share data)
Revenue $ 1,700,912 $ 1,331,279 $ 1,050,145 Gross profit 452,123 386,033 287,943 Gross profit margin 26.6% 29.0% 27.4%Selling, general and administrative expense 226,815 200,878 160,609 Selling, general and administrative expense as a percentage
of revenue 13.3% 15.1% 15.3%Operating income 225,308 185,155 127,334 Operating income margin 13.2% 13.9% 12.1%Interest and other income, net 2,061 3,867 4,172 Income before income taxes 227,369 189,022 131,506 Provision for income taxes 81,973 71,673 55,675 Effective tax rate 36.1% 37.9% 42.3%Net income 145,396 117,349 75,831 Loss/(income) attributable to noncontrolling interests 44 (618) 302 Net income attributable to MAXIMUS $ 145,440 $ 116,731 $ 76,133 Basic earnings per share attributable to MAXIMUS $ 2.15 $ 1.71 $ 1.12 Diluted earnings per share attributable to MAXIMUS $ 2.11 $ 1.67 $ 1.09
The following provides an overview of the significant elements of our Consolidated Statements of Operations. As ourbusiness segments have different factors driving revenue growth and profitability, the sections that follow cover thesesegments in greater detail.
23

Table of Contents
Fiscal year 2014 compared to fiscal year 2013
Revenue increased 28% to $1,701 million. Much of the growth was organic, particularly in the Health Services segment,supplemented with acquired growth from HML. In fiscal year 2013, we terminated a contract which had been acquired as partof the PSI acquisition, resulting in a one-time benefit of $16.0 million to revenue, $10.9 million to pre-tax profit and $0.09 todiluted earnings per share. This contract was in the Human Services Segment. Excluding the effect of this termination,revenue growth was 29% and organic revenue growth was 27%.
Dollars inThousands
Percentagechange
excludingterminated
contract
Revenue for fiscal year 2013 $ 1,331,279 Terminated contract (16,035)
Revenue for fiscal year 2013 excluding the effect of the terminated contract 1,315,244 Organic growth 348,548 26.5%Acquired growth 37,120 2.8%
Revenue for fiscal year 2014 $ 1,700,912 29.3%
Gross profit increased 17% to $452.1 million, representing a profit margin of 26.6% compared to 29.0% in the prioryear. Gross profit margins declined due to new, cost-plus contracts in the Health Services segment, which typically operate atlower margins than performance-based or fixed fee arrangements. Margins in fiscal year 2013 had received the benefit of theterminated contract.
Selling, general and administrative expense (SG&A) consists of costs related to general management, marketing andadministration. These costs include salaries, benefits, bid and proposal efforts, travel, recruiting, continuing education,employee training, non-chargeable labor costs, facilities costs, printing, reproduction, communications, equipmentdepreciation, intangible amortization, legal expenses and the costs of business combinations. Our SG&A as a percentage ofrevenue has declined between fiscal years 2013 to 2014, as the revenue growth of the business overall exceeded that of ouradministrative cost base.
Operating income increased 22% to $225.3 million representing a profit margin of 13.2% for the year endedSeptember 30, 2014, compared to 13.9% in the prior year. This growth was principally driven by new work tied to the ACAin our Health Services Segment.
Interest and other income declined due to decreases in our international cash balances, which generated the majority ofour interest income. These funds were used to acquire HML in fiscal year 2013.
Our tax rate for fiscal year 2014 was 36.1%, compared to 37.9% in 2013. This decline has been caused by the utilizationof significant additional employment-related tax credits in fiscal year, the utilization of a tax net operating loss in Canadawhich had previously been fully reserved and a benefit to our state taxes for the difference between the estimates in fiscalyear 2013 to the tax returns filed in the fourth quarter of fiscal year 2014. For fiscal year 2015, the Company is anticipating atax rate between 37.0% and 37.5%.
24

Table of Contents
Fiscal year 2013 compared to fiscal year 2012
Revenue increased 27% to $1,331 million. Much of the growth was organic, particularly in the Health Services segment,as well as acquired growth from PSI and HML. We also received a one-time benefit from the termination of a contract.
Gross profit increased 34% to $386.0 million, representing a profit margin of 29.0% compared to 27.4% in the prioryear. Gross profit margins within the Health Services Segment were driven principally by the accretive nature of the highervolumes in our federal Medicare appeals business. Gross profit margins declined within our Human Services Segment, drivenin part by additional costs within our Australian business.
Our SG&A as a percentage of revenue remained broadly consistent between fiscal year 2013 and 2012.
Operating income increased 45% to $185.2 million for the year ended September 30, 2013, compared to the prior year.This growth was driven by new work in our Health Services Segment, the acquisitions of PSI and HML and $10.9 million ofincome related to the terminated contract.
Interest and other income declined due to decreases in our international cash balances, which generated the majority ofour interest income. These funds were used to acquire HML.
Our tax rate for fiscal year 2013 was 37.9%, compared to 42.3% in 2012. The prior year tax rate includes a charge of$2.7 million to correct an error from prior years, without which the rate would have been 40.3%. During fiscal year 2013, wereceived the benefit of increased profits in locations with lower tax rates than the United States, particularly in the UnitedKingdom, where the ramp up of the U.K. Work Programme contract and the acquisition of HML resulted in profits taxed atlower rates.
Health Services Segment
The Health Services Segment provides a variety of business process services, as well as related consulting services, forstate, provincial and national government programs, including Medicaid, CHIP, Supplemental Nutrition Assistance Program(SNAP), Medicare, the Affordable Care Act (ACA), Health Insurance BC (British Columbia) and the Health and WorkProgramme in the United Kingdom.
Year ended September 30, 2014 2013 2012 (dollars in thousands)
Revenue $ 1,250,565 $ 862,879 $ 671,181 Gross profit 325,559 248,100 172,456 Operating income 175,378 129,834 80,619 Gross profit margin 26.0% 28.8% 25.7%Operating profit margin 14.0% 15.0% 12.0%
Fiscal year 2014 versus fiscal year 2013
Revenue increased by 45% to $1,251 million. Gross profit increased by 31% and operating profit increased by 35%.Profit margins declined year-over-year.
The results for the Segment were driven by:
• Work related to the ACA, including new work and the expansion of work on existing contracts;
• The benefit of a full year of HML's business, which was acquired in July 2013; and
• Other significant new contracts which commenced during the 2013 and 2014 fiscal years.
25

Table of Contents
Gross and operating profit margins were lower than in prior years driven by:
• An increase in our portfolio of cost-plus contracts, which have lower margins;
• Contract start-up activity in late fiscal year 2014, related to the U.K. Health and Work Service (Fit for Work) andthe U.S. Federal Department of Education Debt Management contract; and
• The launch, during fiscal year 2014, of an unprofitable contract which had been acquired with PSI.
For our fiscal year 2015, we are anticipating that the majority of our ACA related work will recur, but we expect that acombination of one-time services in fiscal year 2014 and anticipated declines in volumes may reduce revenue by between$50 million and $100 million. We expect growth in our appeals and assessments business driven by expansion on existingprograms and new contracts in the United Kingdom, but this will be partially offset by declines in the company's federalMedicare appeals business resulting from changes in the Recovery Audit Contractor program. Both the Fit for Work and DebtManagement contracts noted above are anticipated to report start-up losses which will be recovered over the life of thecontract. We will also commence work in fiscal year 2015 on a new contract to provide health and disability assessments inthe United Kingdom which is expected to contribute revenues of between $140 million to $165 million. This contract isanticipated to be accretive in fiscal year 2015.
Fiscal year 2013 versus fiscal year 2012
Revenue increased by 29% to $862.9 million. Growth was not significantly affected by year-over-year fluctuations inforeign currency exchange rates. Gross profit increased by 44% and operating profit increased by 61%, with marginsincreasing year-over-year.
The results for the segment were driven by:
• New work, particularly that associated with ACA;
• Expansion of existing contracts, including strong volumes in our federal Medicare appeals practice; and
• The benefit of a full year of PSI's business, as well as three months of HML's business.
The expansion of the gross and operating profit margins was driven principally by the accretive nature of the highervolumes in our federal Medicare business.
Human Services Segment
The Human Services Segment provides national, state and county human services agencies with a variety of businessprocess services and related consulting services for welfare-to-work, child support, higher education and K-12 specialeducation programs.
Year ended September 30, 2014 2013 2012 (dollars in thousands)
Revenue $ 450,347 $ 468,400 $ 378,964 Gross profit 126,564 137,933 115,487 Operating income 50,542 58,091 49,922 Gross profit margin 28.1% 29.4% 30.5%Operating profit margin 11.2% 12.4% 13.2%
The results for the Human Services Segment in fiscal year 2013 were affected by a one-time benefit from thetermination of a system-integration contract acquired with PSI. The termination
26
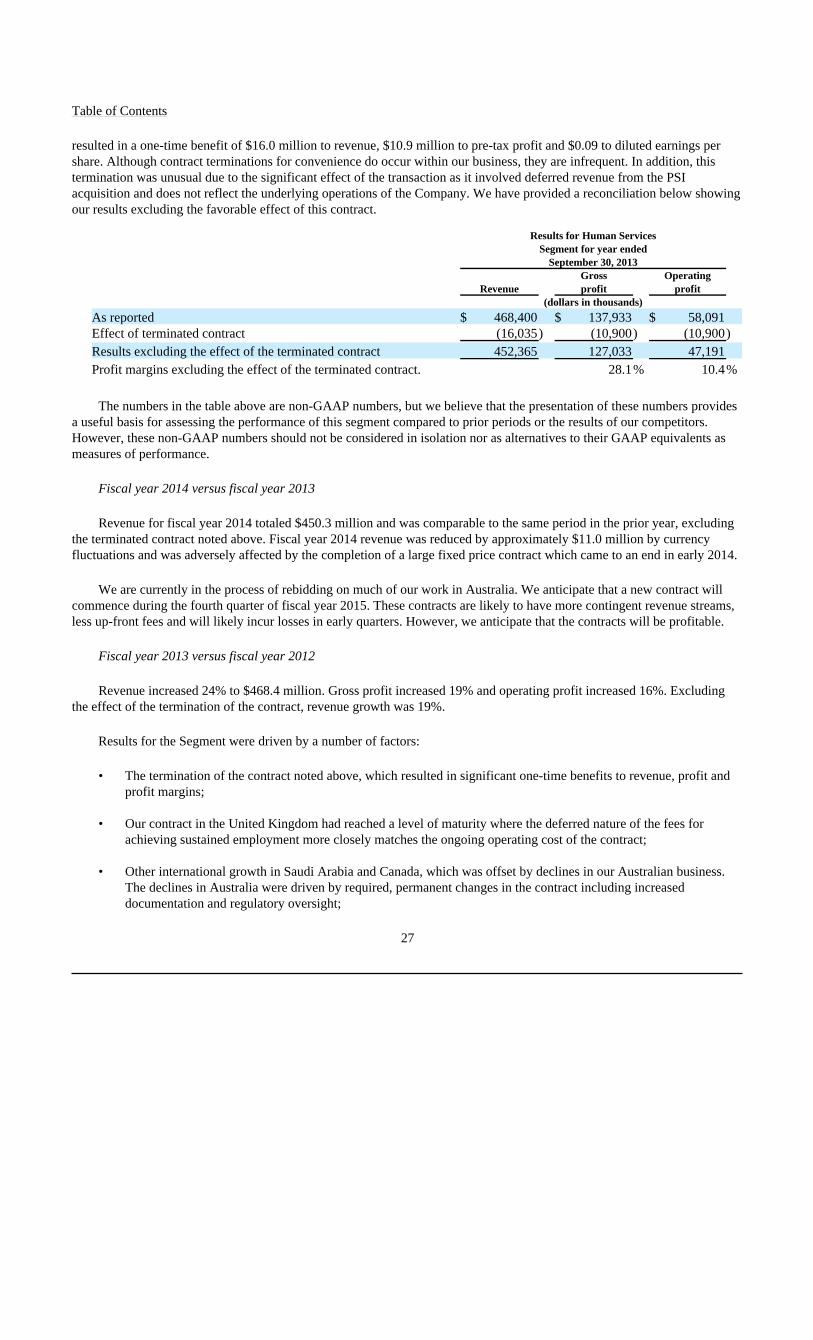
Table of Contents
resulted in a one-time benefit of $16.0 million to revenue, $10.9 million to pre-tax profit and $0.09 to diluted earnings pershare. Although contract terminations for convenience do occur within our business, they are infrequent. In addition, thistermination was unusual due to the significant effect of the transaction as it involved deferred revenue from the PSIacquisition and does not reflect the underlying operations of the Company. We have provided a reconciliation below showingour results excluding the favorable effect of this contract.
Results for Human ServicesSegment for year ended
September 30, 2013
Revenue Grossprofit
Operatingprofit
(dollars in thousands)
As reported $ 468,400 $ 137,933 $ 58,091 Effect of terminated contract (16,035) (10,900) (10,900)
Results excluding the effect of the terminated contract 452,365 127,033 47,191
Profit margins excluding the effect of the terminated contract. 28.1% 10.4%
The numbers in the table above are non-GAAP numbers, but we believe that the presentation of these numbers providesa useful basis for assessing the performance of this segment compared to prior periods or the results of our competitors.However, these non-GAAP numbers should not be considered in isolation nor as alternatives to their GAAP equivalents asmeasures of performance.
Fiscal year 2014 versus fiscal year 2013
Revenue for fiscal year 2014 totaled $450.3 million and was comparable to the same period in the prior year, excludingthe terminated contract noted above. Fiscal year 2014 revenue was reduced by approximately $11.0 million by currencyfluctuations and was adversely affected by the completion of a large fixed price contract which came to an end in early 2014.
We are currently in the process of rebidding on much of our work in Australia. We anticipate that a new contract willcommence during the fourth quarter of fiscal year 2015. These contracts are likely to have more contingent revenue streams,less up-front fees and will likely incur losses in early quarters. However, we anticipate that the contracts will be profitable.
Fiscal year 2013 versus fiscal year 2012
Revenue increased 24% to $468.4 million. Gross profit increased 19% and operating profit increased 16%. Excludingthe effect of the termination of the contract, revenue growth was 19%.
Results for the Segment were driven by a number of factors:
• The termination of the contract noted above, which resulted in significant one-time benefits to revenue, profit andprofit margins;
• Our contract in the United Kingdom had reached a level of maturity where the deferred nature of the fees forachieving sustained employment more closely matches the ongoing operating cost of the contract;
• Other international growth in Saudi Arabia and Canada, which was offset by declines in our Australian business.The declines in Australia were driven by required, permanent changes in the contract including increaseddocumentation and regulatory oversight;
27

Table of Contents
• The benefit of a full year of revenue from PSI, which resulted in increased revenue. However, profit margins on theUnited States human services business tend to earn lower margins than our international businesses; and
• Revenue and margins within the United States were adversely affected by the absence of a benefit received in fiscalyear 2012 from a fixed-price program that contributed $6.8 million to revenue and profit associated with a revisionin the estimate of the cost to complete this contract.
Liquidity and capital resources
Our principal source of liquidity remains cash flows from operations. We rely upon these cash flows to fund workingcapital and capital expenditures, acquire businesses, repurchase our own common shares and pay dividends. Cash collectionsfrom customers are driven by a number of factors. For many contracts, particularly those in our Human Services Segment,customer payments may be based upon our success at delivering outcomes and, accordingly, our cash inflows will notcorrespond with the related cash outflows. Customer payments may also be subject to delays. These most often occur at thebeginning of a contract as processes for billing and review and processing are being established. We have also experiencedshort-term payment delays from customers where budget constraints have occurred. We were not significantly affected by theshut-down of the U.S. Federal Government in early fiscal year 2014 but, in the event of a more protracted delay, it is possiblethat our cash flows, operations and profitability could be affected. Our operating cash outflows will also be affected by ourcontract life-cycle. At the beginning of contracts, we will typically incur one-time capital expenses and the costs ofcommencing a contract, as well as increasing the required levels of working capital that we will need.
We hold significant cash balances and have access to additional funds. At September 30, 2014, we held $158.1 millionof cash and cash equivalents and had access to up to $95.3 million from a revolving credit facility. With the exception of a$1.2 million interest-free loan in Canada, we had no borrowings. At September 30, 2014, our foreign subsidiaries heldapproximately $173 million of cumulative earnings. We consider undistributed earnings of our foreign subsidiaries to beindefinitely reinvested outside of the United States and, accordingly, no U.S. deferred taxes have been recorded with respectto such earnings in accordance with the relevant accounting guidance for income taxes. Should the earnings be remitted asdividends, we may be subject to additional U.S. taxes, net of allowable foreign tax credits. It is not practicable to estimate theamount of any additional taxes which may be payable on the undistributed earnings given the various tax planningalternatives we could employ should we decide to repatriate these earnings in a tax efficient manner. As of September 30,2014, our foreign subsidiaries held approximately $95 million of cash and cash equivalents. In November 2014, we remitted$32 million from an international subsidiary to the U.S. as a return of capital on a tax-free basis.
28

Table of Contents
The Company's acquisition of Centacare in January 2014 resulted in a net cash payment of $2.7 million, which was paidfrom cash held outside the United States. The Company's acquisition of HML in July 2013 resulted in a net cash payment of$71.4 million, which was paid from cash held outside the United States. The Company's acquisition of PSI in April 2012resulted in a net cash payment of $63.4 million, using cash held in the United States.
The following table provides a summary of our cash flow information for the three years ended September 30, 2014.
Year ended September 30, 2014 2013 2012 (dollars in thousands)
Net cash provided by (used in): Operating activities $ 213,600 $ 120,938 $ 115,160 Investing activities (49,389) (129,833) (86,612)Financing activities (127,144) (41,862) (17,765)Effect of exchange rates on cash and cash equivalents (4,572) (12,938) 5,579
Net increase (decrease) in cash and cash equivalents 32,495 $ (63,695) $ 16,362
Cash provided by operating activities was $213.6 million in fiscal year 2014, which was $92.7 million higher than infiscal year 2013. This has been driven by a significant increase in our business, as well as improvements in our workingcapital. During the final quarter of fiscal year 2013 and the first quarter of fiscal year 2014, we commenced a significantnumber of new contracts. As is typically the case, the new contracts resulted in an expansion of our working capital as well asadditional costs as contracts started. As these new contracts have matured, net operating cash flows have improved. Duringthe first two fiscal quarters of fiscal year 2015, we will be establishing two new large contracts in the United Kingdom and,accordingly, we anticipate that these contracts will constrain our operating cash flows in fiscal year 2015.
Cash provided by operating activities for fiscal year 2013 was $120.9 million, an improvement of $5.8 million overfiscal year 2012 despite an increase in net income of $41.5 million for the same periods. As noted above, operating cash flowsin fiscal year 2013 were dampened by the working capital needs of new contracts.
Cash used in investing activities includes net cash outflows related to acquisitions of businesses of $2.7 million,$68.1 million and $66.0 million in fiscal years 2014, 2013 and 2012, respectively. These cash flows relate to the acquisitionsof Centacare, HML and PSI. Excluding these payments, the principal driver of investing activities was our investments inproperty and equipment and internal-use capitalized software. These cash outflows were at their most significant in fiscal year2013, reflecting the significant investment required in establishing several new projects in early fiscal year 2014. Futureinvesting cash flows will be contingent upon acquisition activity and new business awards.
29

Table of Contents
Cash used in financing activities was $127.1 million, $41.9 million and $17.8 million in fiscal years 2014, 2013 and2012, respectively. These cash flows were principally driven by repurchases of common stock of $111.1 million,$33.3 million and $13.0 million, respectively. We have repurchased in excess of four million shares over these three yearsand, at September 30, 2014, we had $135.2 million available for future repurchases under a plan approved by our Board ofDirectors. This is in addition to our existing dividend, which has provided payments of approximately $12 million per year.Both our share repurchases and cash dividends are at the discretion of our Board of Directors and depend upon our futureoperations and earnings, capital requirements general financial condition, contractual restrictions and other factors our Boardof Directors may deem relevant. During the first quarter of fiscal year 2015 through November 17, 2014, we acquired anadditional 0.8 million shares at a cost of $30.6 million. Based upon our shares repurchased and our expectations for futurepurchases, we are anticipating that our diluted number of shares for fiscal year 2015 will be approximately 67 million. Inaddition, we declared a dividend of $0.045 per common share which will be paid on November 28, 2014 to shareholders ofrecord on November 14, 2014. Based on the number of shares outstanding, the payment will be approximately $3.0 million.
The detrimental effect of exchange rates on cash and cash equivalents of $4.6 million in the 2014 fiscal year primarilyreflects the strengthening of the United States Dollar against the Australian Dollar.
To supplement our statements of cash flows presented on a GAAP basis, we use the non-GAAP measure of free cashflow to analyze the funds generated from operations. We believe free cash flow is a useful basis for comparing ourperformance with our competitors. The presentation of non-GAAP free cash flow is not meant to be considered in isolation,nor as an alternative to net income as an indicator of performance, nor as an alternative to cash flows from operating activitiesas a measure of liquidity. We calculate free cash flow as follows:
Year ended September 30, 2014 2013 2012 (dollars in thousands)
Cash provided by operating activities 213,600 $ 120,938 $ 115,160 Purchases of property and equipment (36,262) (43,580) (18,369)Capitalized software costs (10,886) (18,596) (4,779)
Free cash flow 166,452 $ 58,762 $ 92,012
Obligations and commitments
The following table summarizes our contractual obligations at September 30, 2014 that require the Company to makefuture cash payments (in thousands):
Payments due by period
Contractual obligations Total Less than
1 year 1 - 3 years 3 - 5 years More than
5 years (Dollars in thousands)
Operating leases $ 154,041 $ 56,264 $ 64,405 $ 24,097 $ 9,275 Long-term debt 1,217 157 314 314 432 Deferred compensation plan
liabilities(1) 19,520 752 1,461 855 16,452
Total(2) $ 174,778 $ 57,173 $ 66,180 $ 25,266 $ 26,159
(1) Deferred compensation plan liabilities are typically payable at times elected by the employee at the time of deferral.However, early withdrawal is permitted for certain conditions, including employee hardship or termination, whichmay accelerate the payment of these liabilities.
30

Table of Contents
(2) Due to the uncertainty with respect to the timing of future cash flows associated with the Company's unrecognizedincome tax benefits at September 30, 2014, we are unable to reasonably estimate settlements with taxing authorities.The above table does not reflect unrecognized income tax benefits of approximately $1.1 million, of whichapproximately $0.5 million is related interest and penalties. See "Note 17. Income Taxes" of the ConsolidatedFinancial Statements for a further discussion on income taxes.
The contractual obligations table also omits our liabilities with respect to acquisition-related contingent consideration.As part of the acquisition arrangement for DeltaWare Systems, Inc., which was acquired in fiscal year 2010, weagreed to pay up to $4.0 million (Canadian) in the event that certain sales targets are reached up to 2016. At present,we have accrued $0.4 million based upon a probability-weighted assessment of our likely payments under thisarrangement. At this time, no sales arrangements have been entered into which would require a payment to be made.See "Note 4. Business combinations" of the Consolidated Financial Statements for additional information.
Off-balance sheet arrangements
Other than our operating lease commitments, we do not have material off-balance sheet risk or exposure to liabilities thatare not recorded or disclosed in our financial statements. We have significant operating lease commitments for office space;those commitments are generally tied to the period of performance under related contracts. Additionally, although on certaincontracts we are bound by performance bond commitments and standby letters of credit, we have not had any defaultsresulting in draws on performance bonds. Also, we do not speculate in derivative transactions.
Effects of inflation
As measured by revenue, approximately 25% of our business in fiscal year 2014 was conducted under cost-reimbursablecontracts that adjust revenue to cover costs increased by inflation. Approximately 3% of the business was time-and-materialcontracts where labor rates are often fixed for several years. We generally have been able to price these contracts in a mannerthat accommodates the rates of inflation experienced in recent years. The remaining portions of our contracts are fixed-priceand performance-based and are typically priced to account for the likely inflation from period to period to mitigate the risk ofour business being adversely affected by inflation.
Critical accounting policies and estimates
The preparation of financial statements in conformity with accounting principles generally accepted in the United Statesrequires us to make estimates and judgments that affect the amounts reported. We consider the accounting policies below tobe the most important to our financial position and results of operations either because of the significance of the financialstatement item or because of the need to use significant judgment in recording the balance. We base our estimates onhistorical experience and on various other assumptions that are believed to be reasonable under the circumstances, the resultsof which form the basis for making judgments about the carrying values of assets and liabilities. Actual results could differfrom those estimates.
Revenue Recognition. Revenue is generated from contracts with various pricing arrangements, including:
• performance-based criteria, constituting approximately 49% of total revenue in fiscal year 2014;
• costs incurred plus a negotiated fee ("cost-plus") (25%);
• fixed-price (23%); and
• time-and-materials (3%).
31

Table of Contents
We recognize revenue on arrangements as work is performed and amounts are earned. We consider amounts to beearned once evidence of an arrangement has been obtained, services have been delivered, fees are fixed or determinable andcollectability of revenue is reasonably assured.
We recognize revenue on performance-based contracts when earned, which generally occurs when amounts are billableto customers. This may result in revenue being recognized in irregular increments.
Revenue on cost-plus contracts is recognized based on costs incurred plus an estimate of the negotiated fee earned. Forcertain contracts, the nature and allocation of costs incurred is subject to judgment and differing amounts could be recorded ifunderlying assumptions or estimates were to change. The Company closely monitors its methodology for recording cost-plusrevenue and incorporates the results of client audits where applicable to refine these estimates. Changes in estimates mayresult in significant changes to revenue.
We recognize revenue on fixed-priced contracts when earned, as services are provided. Revenue is generally recognizedon a straight-line basis unless evidence suggests that revenue is earned or obligations are fulfilled in a different pattern. Thetiming of expense recognition may result in irregular profit margins.
For certain fixed-price contracts, primarily systems design, development and implementation, we generally recognizerevenue based upon costs incurred to date and our anticipated gross profit. The cumulative impact of any revisions inestimated revenue and costs is recognized in the period in which the facts that give rise to the revision become known.Provisions for estimated losses on incomplete contracts are provided for in full in the period in which such losses becomeknown. This policy may result in revenue being recognized at different points from amounts being billable. Such contractsrequire a number of estimates including the timing of future work to be performed, the future costs of labor and materials and,where considered to be estimable and probable, adjustments to revenue from change orders or contract incentives. Changes tothese estimates may result in changes to revenue and project profitability. Where the Company enters into contracts wheresignificant uncertainty exists over the ability of management to estimate the future costs, the Company will typically defer allrevenue until such time as future costs are estimable or the system implementation is complete.
Revenue on time-and-materials contracts is recognized based on hours worked and expenses incurred.
Where contracts have multiple deliverables, we evaluate these deliverables at the inception of each contract and as eachitem is delivered. As part of this evaluation, we consider whether a delivered item has value to a customer on a stand-alonebasis and whether the delivery of the undelivered items is considered probable and substantially within our control, if ageneral right of return exists. Where deliverables, or groups of deliverables, have both of these characteristics, we treat eachdeliverable item as a separate element in the arrangement, allocate a portion of the allocable arrangement consideration usingthe relative selling price method to each element and apply the relevant revenue recognition guidance to each element. Theallocation of revenue to individual elements requires judgment as, in many cases, we do not provide directly comparableservices or products on a standalone basis.
Business combinations and goodwill. The purchase price of an acquired business is allocated to tangible assets andseparately identifiable intangible assets acquired less liabilities assumed based upon their respective fair values. The excessbalance is recorded as goodwill. Accounting for business combinations requires the use of judgment in determining the fairvalue of assets acquired and liabilities assumed in order to allocate the purchase price of entities acquired. Our estimates ofthese fair values are based upon assumptions we believe to be reasonable and, where appropriate, include assistance fromthird-party appraisal firms.
32
Table of Contents
Goodwill is not amortized, but is subject to impairment testing on an annual basis, or more frequently if impairmentindicators arise. Impairment testing is performed at the reporting unit level. This process requires judgment in identifying ourreporting units, appropriately allocating goodwill to these reporting units and assessing the fair value of these reporting units.At July 1, 2014, the Company performed the annual impairment test and determined that there had been no impairment ofgoodwill. In performing this assessment, the Company utilizes an income approach. Such an approach requires estimation offuture operating cash flows including business growth, utilization of working capital and discount rates. The valuation of thebusiness as a whole is compared to the Company's market capital at the date of the acquisition in order to verify thecalculation. In all cases, we determined that the fair value of our reporting units was significantly in excess of our carryingvalue to the extent that a 25% decline in fair value in any reporting unit would not have resulted in an impairment charge.
Long-Lived Assets (Excluding Goodwill). The Company reviews long-lived assets for impairment whenever events orcircumstances indicate that the carrying amount of an asset may not be fully recoverable. Our review is based on ourprojection of the undiscounted future operating cash flows of the related customer project. To the extent such projectionsindicate that future undiscounted cash flows are not sufficient to recover the carrying amount, we recognize a non-cashimpairment charge to reduce the carrying amount to equal projected future discounted cash flows. No impairment chargeswere recorded in the three years ending September 30, 2014.
Contingencies. From time to time, we are involved in legal proceedings, including contract and employment claims, inthe ordinary course of business. We assess the likelihood of any adverse judgments or outcomes to these contingencies, aswell as potential ranges of probable losses and establish reserves accordingly. The amount of reserves required may change infuture periods due to new developments in each matter or changes in approach to a matter such as a change in settlementstrategy.
Income Taxes. The Company recognizes the financial statement benefit of a tax position only after determining that therelevant tax authority would "more likely than not" sustain the position following an audit. For tax positions meeting the"more likely than not" threshold, the amount recognized in the financial statements is the largest benefit that has a greaterthan 50 percent likelihood of being realized upon ultimate settlement with the relevant tax authority. The assumptions andestimates used in preparing these calculations may change over time and may result in adjustments that will affect our taxcharge.
ITEM 7A. Quantitative and Qualitative Disclosures About Market Risk.
Our exposure to market risks generally relates to changes in interest rates and foreign currency exchange rates.
We are exposed to market rate risk relating to interest rates through our cash equivalent balances and our revolvingcredit facility. Our cash equivalent balances are held in highly rated securities with maturities of three months or less. Wecurrently have no borrowings under the revolving credit facility. Accordingly, we believe our exposure to risk from changesin interest rates is immaterial at this time.
We are exposed to foreign currency exchange risk through our businesses in Australia, Canada and the United Kingdom.At September 30, 2014, we held net assets in functional currencies other than the U.S. Dollar of $221.6 million and,accordingly, in the event of a 10% fluctuation in the value of the local currencies, we would report a $22.2 million gain orloss in our statement of comprehensive income. Our foreign-based businesses mitigate their currency risks through incurringcosts in the same currency as their revenue. The operations of the U.S. business do not depend upon cash flows from theforeign businesses.
33

Table of Contents
ITEM 8. Financial Statements and Supplementary Data.
The following consolidated financial statements and supplementary data are included as part of this Annual Report onForm 10-K:
Report of Independent Registered Public Accounting Firm 35 Consolidated Statements of Operations for the years ended September 30, 2014, 2013 and 2012 36 Consolidated Statements of Comprehensive Income for the years ended September 30, 2014, 2013 and 2012 37 Consolidated Balance Sheets as of September 30, 2014 and 2013 38 Consolidated Statements of Cash Flows for the years ended September 30, 2014, 2013 and 2012 39 Consolidated Statements of Changes in Shareholders' Equity for the years ended September 30, 2014, 2013
and 2012
40 Notes to Consolidated Financial Statements 41
34

Table of Contents
REPORT OF ERNST & YOUNG LLP,INDEPENDENT REGISTERED PUBLIC ACCOUNTING FIRM,
ON THE AUDITED CONSOLIDATED FINANCIAL STATEMENTS
The Board of Directors and Shareholders of MAXIMUS, Inc.,
We have audited the accompanying consolidated balance sheets of MAXIMUS, Inc. as of September 30, 2014 and 2013,and the related consolidated statements of operations, comprehensive income, shareholders' equity and cash flows for each ofthe three years in the period ended September 30, 2014. These financial statements are the responsibility of the Company'smanagement. Our responsibility is to express an opinion on these financial statements based on our audits.
We conducted our audits in accordance with the standards of the Public Company Accounting Oversight Board (UnitedStates). Those standards require that we plan and perform the audit to obtain reasonable assurance about whether the financialstatements are free of material misstatement. An audit includes examining, on a test basis, evidence supporting the amountsand disclosures in the financial statements. An audit also includes assessing the accounting principles used and significantestimates made by management, as well as evaluating the overall financial statement presentation. We believe that our auditsprovide a reasonable basis for our opinion.
In our opinion, the financial statements referred to above present fairly, in all material respects, the consolidatedfinancial position of MAXIMUS, Inc. at September 30, 2014 and 2013, and the consolidated results of its operations and itscash flows for each of the three years in the period ended September 30, 2014, in conformity with U.S. generally acceptedaccounting principles.
We also have audited, in accordance with the standards of the Public Company Accounting Oversight Board (UnitedStates), MAXIMUS, Inc.'s internal control over financial reporting as of September 30, 2014, based on criteria established inInternal Control-Integrated Framework issued by the Committee of Sponsoring Organizations of the Treadway Commission(1992 framework) and our report dated November 17, 2014 expressed an unqualified opinion thereon.
/s/ Ernst & Young LLP
McLean, VirginiaNovember 17, 2014
35

Table of Contents
MAXIMUS, Inc.
CONSOLIDATED STATEMENTS OF OPERATIONS
(Amounts in thousands, except per share data)
Year ended September 30, 2014 2013 2012
Revenue $ 1,700,912 $ 1,331,279 $ 1,050,145 Cost of revenue 1,248,789 945,246 762,202
Gross profit 452,123 386,033 287,943 Selling, general and administrative expenses 226,815 200,878 160,609
Operating income 225,308 185,155 127,334 Interest and other income, net 2,061 3,867 4,172
Income before income taxes 227,369 189,022 131,506 Provision for income taxes 81,973 71,673 55,675
Net income 145,396 117,349 75,831 Loss/(income) attributable to noncontrolling interests 44 (618) 302
Net income attributable to MAXIMUS $ 145,440 $ 116,731 $ 76,133
Basic earnings per share attributable to MAXIMUS: $
2.15
$
1.71
$
1.12
Diluted earnings per share attributable to MAXIMUS: $
2.11
$
1.67
$
1.09
Dividends per share $
0.18
$
0.18
$
0.18
Weighted average shares outstanding:
Basic 67,680 68,165 67,734
Diluted 69,087 69,893 69,611
See accompanying notes to consolidated financial statements.
36

Table of Contents
MAXIMUS, Inc.
CONSOLIDATED STATEMENTS OF COMPREHENSIVE INCOME
(Amounts in thousands)
Year ended September 30, 2014 2013 2012
Net income 145,396 117,349 75,831 Foreign currency translation adjustments (7,757) (12,253) 7,760
Comprehensive income 137,639 105,096 83,591
Comprehensive loss/(income) attributable to noncontrolling interests 44 (618) 302
Comprehensive income attributable to MAXIMUS 137,683 104,478 83,893
See accompanying notes to consolidated financial statements.
37
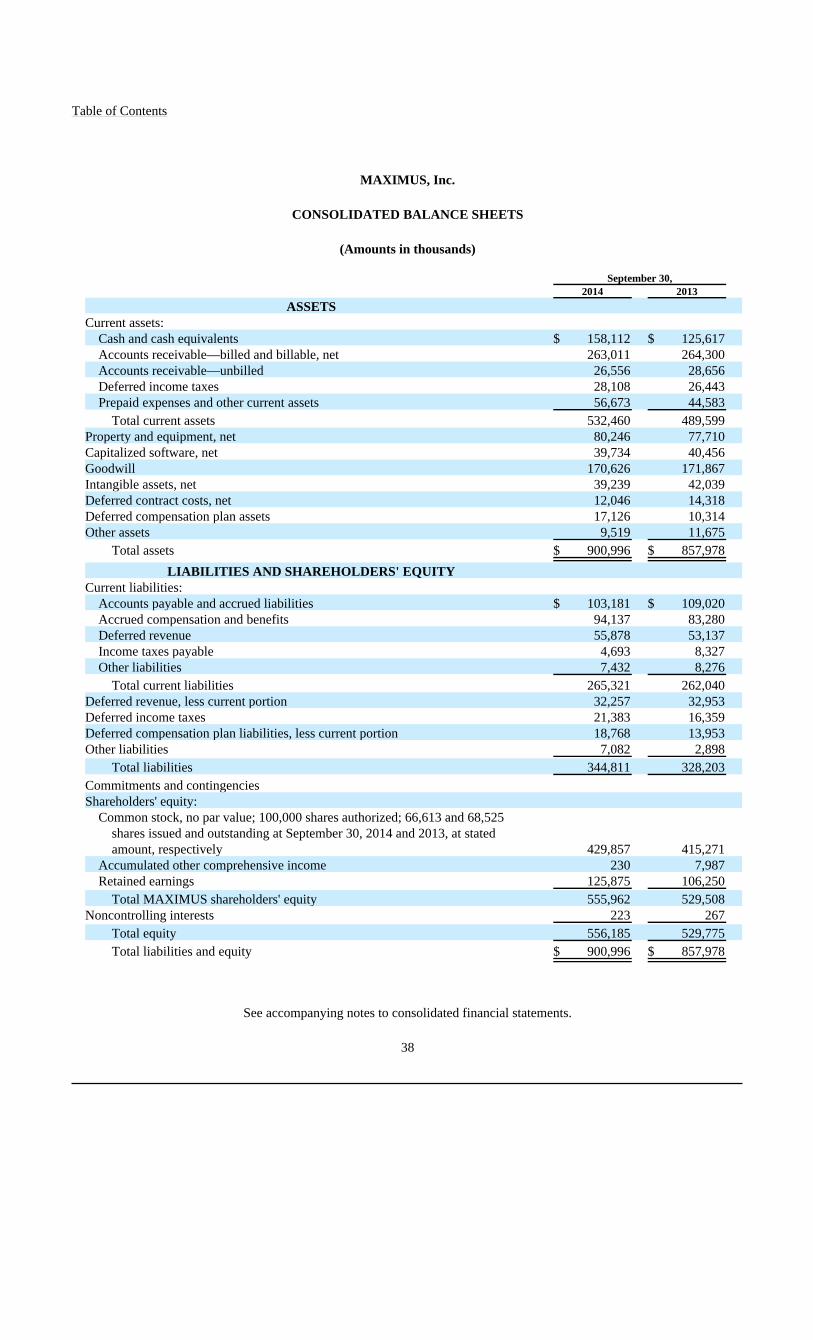
Table of Contents
MAXIMUS, Inc.
CONSOLIDATED BALANCE SHEETS
(Amounts in thousands)
September 30, 2014 2013
ASSETS Current assets:
Cash and cash equivalents $ 158,112 $ 125,617 Accounts receivable—billed and billable, net 263,011 264,300 Accounts receivable—unbilled 26,556 28,656 Deferred income taxes 28,108 26,443 Prepaid expenses and other current assets 56,673 44,583
Total current assets 532,460 489,599 Property and equipment, net 80,246 77,710 Capitalized software, net 39,734 40,456 Goodwill 170,626 171,867 Intangible assets, net 39,239 42,039 Deferred contract costs, net 12,046 14,318 Deferred compensation plan assets 17,126 10,314 Other assets 9,519 11,675
Total assets $ 900,996 $ 857,978
LIABILITIES AND SHAREHOLDERS' EQUITY Current liabilities:
Accounts payable and accrued liabilities $ 103,181 $ 109,020 Accrued compensation and benefits 94,137 83,280 Deferred revenue 55,878 53,137 Income taxes payable 4,693 8,327 Other liabilities 7,432 8,276
Total current liabilities 265,321 262,040 Deferred revenue, less current portion 32,257 32,953 Deferred income taxes 21,383 16,359 Deferred compensation plan liabilities, less current portion 18,768 13,953 Other liabilities 7,082 2,898
Total liabilities 344,811 328,203
Commitments and contingencies Shareholders' equity:
Common stock, no par value; 100,000 shares authorized; 66,613 and 68,525shares issued and outstanding at September 30, 2014 and 2013, at statedamount, respectively 429,857 415,271
Accumulated other comprehensive income 230 7,987 Retained earnings 125,875 106,250
Total MAXIMUS shareholders' equity 555,962 529,508 Noncontrolling interests 223 267
Total equity 556,185 529,775
Total liabilities and equity $ 900,996 $ 857,978
See accompanying notes to consolidated financial statements.
38

Table of Contents
MAXIMUS, Inc.
CONSOLIDATED STATEMENTS OF CASH FLOWS
(Amounts in thousands)
Year ended September 30, 2014 2013 2012
Cash flows from operating activities: Net income 145,396 $ 117,349 $ 75,831 Adjustments to reconcile net income to net cash provided by
operating activities: Depreciation and amortization of property, plant, equipment
and capitalized software 42,778 30,933 23,730 Amortization of intangible assets 5,890 4,883 2,730 Deferred income taxes 2,898 2,396 (3,274)Stock compensation expense 17,278 14,555 12,077 Changes in assets and liabilities, net of effects of business
combinations and divestitures: Accounts receivable—billed and billable (144) (87,999) (8,170)Accounts receivable—unbilled 2,056 (14,998) 3,171 Prepaid expenses and other current assets (2,540) (2,492) (6,018)Deferred contract costs 2,254 (5,073) (1,221)Accounts payable and accrued liabilities (2,928) 31,453 6,451 Accrued compensation and benefits 12,277 21,308 (2,648)Deferred revenue 2,841 6,304 9,827 Income taxes (10,974) 2,034 6,885 Other assets and liabilities (3,482) 285 (4,211)
Cash provided by operating activities 213,600 120,938 115,160
Cash flows from investing activities: Acquisition of businesses, net of cash acquired (2,670) (71,435) (66,003)Proceeds from settlement of final PSI price — 3,380 — Purchases of property and equipment (36,262) (43,580) (18,369)Capitalized software costs (10,886) (18,596) (4,779)Proceeds from note receivable 429 398 299 Proceeds from sale of discontinued operations — — 2,240
Cash used in investing activities (49,389) (129,833) (86,612)
Cash flows from financing activities: Cash dividends paid (12,187) (12,272) (12,180)Repurchases of common stock (111,141) (33,287) (12,977)Stock compensation tax benefit 9,665 10,569 7,268 Tax withholding related to RSU vesting (14,681) (8,868) (4,464)Stock option exercises 1,362 2,168 6,441 Issuance of debt 15,000 — — Repayment of debt (15,162) (172) (44)Acquisition-related contingent consideration — — (1,809)
Cash used in financing activities (127,144) (41,862) (17,765)
Effect of exchange rate changes on cash (4,572) (12,938) 5,579
Net increase (decrease) in cash and cash equivalents 32,495 (63,695) 16,362 Cash and cash equivalents, beginning of period 125,617 189,312 172,950
Cash and cash equivalents, end of period $ 158,112 $ 125,617 $ 189,312
See accompanying notes to consolidated financial statements.
39

Table of Contents
MAXIMUS, Inc.
CONSOLIDATED STATEMENTS OF CHANGES IN SHAREHOLDERS' EQUITY
(Amounts in thousands)
CommonShares
Outstanding Common
Stock
AccumulatedOther
ComprehensiveIncome
RetainedEarnings
NoncontrollingInterest Total
Balance at September 30, 2011 67,587 $ 377,579 $ 12,480 $ (15,602) $ (49) $ 374,408 Net income — — — 76,133 (302) 75,831 Foreign currency translation — — 7,760 — — 7,760 Cash dividends — — — (12,180) — (12,180)Dividends on RSUs — 656 — (656) — — Repurchases of common stock (612) — — (12,796) — (12,796)Stock compensation expense — 12,077 — — — 12,077 Stock compensation tax benefit — 7,268 — — — 7,268 Tax withholding related to RSU vesting — (8,054) — — — (8,054)Stock option exercises and RSU releases 996 6,441 — — — 6,441
Balance at September 30, 2012 67,971 395,967 20,240 34,899 (351) 450,755 Net income — — — 116,731 618 117,349 Foreign currency translation — — (12,253) — — (12,253)Cash dividends — — — (12,272) — (12,272)Dividends on RSUs — 583 — (583) — — Repurchases of common stock (974) — — (32,525) — (32,525)Stock compensation expense — 14,555 — — — 14,555 Stock compensation tax benefit — 10,569 — — — 10,569 Common stock issued pursuant to acquisition of HML 203 6,425 — — — 6,425 Tax withholding relating to RSU vesting — (14,996) — — — (14,996)Stock option exercises and RSU releases 1,325 2,168 — — — 2,168
Balance at September 30, 2013 68,525 415,271 7,987 106,250 267 529,775 Net income — — — 145,440 (44) 145,396 Foreign currency translation — — (7,757) — — (7,757)Cash dividends — — — (12,187) — (12,187)Dividends on RSUs — 493 — (493) — — Repurchases of common stock (2,672) — — (113,135) — (113,135)Stock compensation expense — 17,278 — — — 17,278 Stock compensation tax benefit — 9,665 — — — 9,665 Tax withholding related to RSU vesting — (14,212) — — — (14,212)Stock option exercises and RSU releases 760 1,362 — — — 1,362
Balance at September 30, 2014 66,613 $ 429,857 $ 230 $ 125,875 $ 223 $ 556,185
See accompanying notes to consolidated financial statements.
40

Table of Contents
MAXIMUS, Inc.
Notes to Consolidated Financial Statements
For the years ended September 30, 2014, 2013 and 2012
1. Business and summary of significant accounting policies
(a) Description of business
MAXIMUS, Inc. (the "Company" or "we") provides business process services (BPS) to government health and humanservices agencies in the United States and to foreign governments. We conduct our operations through two businesssegments: Health Services and Human Services. The Health Services Segment provides a variety of business processservices, as well as related consulting services, for state, provincial and national government programs, including Medicaid,CHIP, Supplemental Nutrition Assistance Program (SNAP), Medicare, the Affordable Care Act (ACA), Health Insurance BC(British Columbia) and the Health and Work Programme in the United Kingdom. The Human Services Segment providesnational, state and county human services agencies with a variety of business process services and related consulting servicesfor welfare-to-work, child support, higher education and K-12 special education programs.
(b) Principles of consolidation
The consolidated financial statements include the accounts of MAXIMUS, Inc. and its wholly-owned subsidiaries. Allintercompany balances and transactions have been eliminated in consolidation.
Where MAXIMUS owns less than 100% of the share capital of its subsidiaries, but is still considered to have sufficientownership to control the businesses, the results of these business operations are consolidated within our financial statements.The ownership interests held by other parties are shown as noncontrolling interests.
(c) Use of estimates
The preparation of financial statements in conformity with accounting principles generally accepted in the United Statesrequires management to make estimates and assumptions that affect the reported amounts of assets and liabilities, thedisclosure of contingent assets and liabilities and the reported amounts of revenue and expenses during each reporting period.Actual results could differ from those estimates. Our significant estimates include estimates of the fair value of assetsacquired and liabilities assumed in business combinations, estimates of the collectability of receivables, estimates of futurediscounts in performance-based contracts, evaluation of asset impairment, accrual of estimated liabilities and valuation ofacquisition-related contingent consideration liabilities.
(d) Revenue recognition
Revenue is generated from contracts with various pricing arrangements, including:
• performance-based criteria, constituting approximately 49% of total revenue in fiscal year 2014;
• costs incurred plus a negotiated fee ("cost-plus") (25%);
• fixed-price (23%); and
• time-and-materials (3%).
We recognize revenue on arrangements as work is performed and amounts are earned. We consider amounts to beearned once evidence of an arrangement has been obtained, services have been delivered, fees are fixed or determinable andcollectability of revenue is reasonably assured.
41
Table of Contents
MAXIMUS, Inc.
Notes to Consolidated Financial Statements (Continued)
For the years ended September 30, 2014, 2013 and 2012
1. Business and summary of significant accounting policies (Continued)
We recognize revenue on performance-based contracts when earned, which occurs when we have achieved theperformance goal. This revenue generally occurs when amounts are billable to customers and may result in revenue beingrecognized in irregular increments.
Revenue on cost-plus contracts is recognized based on costs incurred plus an estimate of the negotiated fee earned.
We recognize revenue on fixed-priced contracts when earned, as services are provided. Revenue is generally recognizedon a straight-line basis unless evidence suggests that revenue is earned or obligations are fulfilled in a different pattern. Thetiming of expense recognition may result in irregular profit margins.
For certain fixed-price contracts, primarily systems design, development and implementation, we generally recognizerevenue based upon costs incurred to date and our anticipated gross profit. The cumulative impact of any revisions inestimated revenue and costs is recognized in the period in which the facts that give rise to the revision become known.Provisions for estimated losses on incomplete contracts are provided for in full in the period in which such losses becomeknown. This policy may result in revenue being recognized at different points from amounts being billable. Where we enterinto contracts where significant uncertainty exists over the ability of management to estimate the future costs, we willtypically defer all revenue until such time as future costs are estimable or the system implementation is complete.
Revenue on time-and-materials contracts is recognized based on hours worked and expenses incurred.
Where contracts have multiple deliverables, we evaluate these deliverables at the inception of each contract and as eachitem is delivered. As part of this evaluation, we consider whether a delivered item has value to a customer on a stand-alonebasis and whether the delivery of the undelivered items is considered probable and substantially within our control, if ageneral right of return exists. Where deliverables, or groups of deliverables, have both of these characteristics, we treat eachdeliverable item as a separate element in the arrangement, allocate a portion of the allocable arrangement consideration usingthe estimated relative selling price method to each element and apply the relevant revenue recognition guidance to eachelement.
Sales and purchases in jurisdictions subject to indirect taxes, such as value added tax, are recorded net of tax collectedand paid.
In May 2014, the Financial Accounting Standards Board issued Accounting Standards Update No. 2014-09, Revenuefrom Contracts with Customers. This new standard will change the manner in which we evaluate revenue recognition for allcontracts with customers, although the effect of the changes on revenue recognition will vary from contract to contract. Wewill adopt this standard during our 2018 fiscal year. The standard permits a retrospective or cumulative effect transitionmethod. At present, we are continuing to evaluate the effect of this standard and have not yet determined a transition methodor the likely effects on the business.
(e) Cash and cash equivalents
We consider all highly liquid investments with an original maturity of three months or less when purchased to be cashequivalents. Where we are obliged to hold cash balances as collateral for lease,
42

Table of Contents
MAXIMUS, Inc.
Notes to Consolidated Financial Statements (Continued)
For the years ended September 30, 2014, 2013 and 2012
1. Business and summary of significant accounting policies (Continued)
credit card or letter of credit arrangements, or where we hold funds on behalf of clients, this balance is reported within othercurrent assets. The balance was $10.6 million and $12.2 million at September 30, 2014 and 2013, respectively.
(f) Accounts receivable and allowance for doubtful accounts
Accounts receivable are recorded at their face amount less an allowance for doubtful accounts. We maintain anallowance for doubtful accounts at an amount we estimate to be sufficient to cover the risk of collecting less than fullpayment on our receivables. We re-evaluate our client receivables on a quarterly basis, especially receivables that are pastdue, and reassess our allowance for doubtful accounts based on specific client collection issues.
(g) Business combinations and goodwill
The purchase price of an acquired business is allocated to tangible assets and separately identifiable intangible assetsacquired less liabilities assumed based upon their respective fair values. The excess balance is recorded as goodwill. Costsincurred directly related to an acquisition, including legal, accounting and valuation services, are expensed as incurred.
The separately identifiable intangible assets are amortized on a straight-line basis over useful lives estimated at the timeof the business combination.
Goodwill is not amortized but is subject to impairment testing on an annual basis, or more frequently if impairmentindicators arise. Impairment testing is performed at the reporting unit level. A reporting unit is the operating segment, or abusiness one level below that operating segment (the component level) if discrete financial information is prepared andreviewed regularly by segment management. However, components are aggregated if they have similar economiccharacteristics. The evaluation is performed by comparing the fair value of the relevant reporting unit to the carrying value,including goodwill, of the reporting unit. If the fair value of the reporting unit exceeds the carrying value, no impairment lossis recognized. However, if the carrying value of the reporting unit exceeds the fair value, the goodwill of the reporting unitmay be impaired.
We perform our annual impairment test as of July 1 of each year. At July 1, 2014, we performed the annual impairmenttest and determined that there had been no impairment of goodwill. In performing this assessment, we utilized an incomeapproach. Such an approach requires estimation of future operating cash flows including business growth, utilization ofworking capital and discount rates. The valuation of the business as a whole is compared to our market value at the date of thetest in order to verify the calculation.
(h) Long-lived assets (excluding goodwill)
Property and equipment is recorded at cost. Depreciation is recorded over the assets' respective useful economic lives,which are not to exceed 39.5 years for our buildings and seven years for office furniture and equipment. Leaseholdimprovements are amortized over the shorter of their useful life or the remaining term of the lease. Repairs and maintenancecosts are expensed as incurred.
43

Table of Contents
MAXIMUS, Inc.
Notes to Consolidated Financial Statements (Continued)
For the years ended September 30, 2014, 2013 and 2012
1. Business and summary of significant accounting policies (Continued)
All of the Company's capitalized software represents development costs for software that is intended for our internal use.Direct costs of time and material incurred for the development of application software for internal use are capitalized andamortized using the straight-line method over the estimated useful life of the software, ranging from three to eight years.Costs incurred for upgrades and enhancements that do not result in additional functionality are expensed as incurred.
Deferred contract costs consist of contractually recoverable direct set-up costs related to long-term service contracts.These costs include direct and incremental costs incurred prior to the commencement of us providing service to enable us toprovide the contracted services to our customer. These costs are expensed over the period the services are provided on astraight-line basis.
We review long-lived assets for impairment whenever events or circumstances indicate that the carrying amount of anasset may not be fully recoverable. Our review is based on our projection of the undiscounted future operating cash flows ofthe related asset group. To the extent such projections indicate that future undiscounted cash flows are not sufficient torecover the carrying amount, we recognize a non-cash impairment charge to reduce the carrying amount to equal projectedfuture discounted cash flows. No impairment charges were recorded in the three years ending September 30, 2014.
(i) Income taxes
Deferred tax liabilities and assets are determined based on the difference between the financial statement and tax basis ofassets and liabilities and are measured by applying enacted tax rates and laws for the taxable years in which those differencesare expected to reverse. In addition, a valuation allowance is recorded if it is believed more likely than not that a deferred taxasset will not be fully realized.
We recognize the financial statement benefit of a tax position only after determining that the relevant tax authoritywould "more likely than not" sustain the position following an audit. For tax positions meeting the "more likely than not"threshold, the amount recognized in the financial statements is the largest benefit that has a greater than 50 percent likelihoodof being realized upon ultimate settlement with the relevant tax authority.
(j) Foreign currency
For all foreign operations, the functional currency is the local currency. The assets and liabilities of foreign operationsare translated into U.S. dollars at period-end exchange rates, and revenue and expenses are translated at average exchangerates for the year. The resulting cumulative translation adjustment is included in accumulated other comprehensive income onthe consolidated balance sheet. Gains and losses from foreign currency transactions are included in interest and other incomeand are typically immaterial.
(k) Contingencies
From time to time, we are involved in legal proceedings, including contract and employment claims, in the ordinarycourse of business. We assess the likelihood of any adverse judgments or outcomes to these contingencies, as well aspotential ranges of probable losses and establish reserves accordingly. The amount of reserves required may change in futureperiods due to new developments in each matter or changes in approach to a matter such as a change in settlement strategy.
44
Table of Contents
MAXIMUS, Inc.
Notes to Consolidated Financial Statements (Continued)
For the years ended September 30, 2014, 2013 and 2012
1. Business and summary of significant accounting policies (Continued)
(l) Fair Value of Financial Instruments
The carrying amounts of cash and cash equivalents, accounts receivable, accounts payable and other amounts includedwithin current assets and liabilities that meet the definition of a financial instrument approximate fair value due to theshort-term nature of these balances.
(m) Reclassifications
Certain financial results have been reclassified to conform to the current year presentation.
The statements of operations have been reclassified to exclude immaterial discontinued operations. We recorded a lossof $0.4 million and a profit of less than $0.1 million for the years ended September 30, 2013 and 2012, respectively. Thesebalances are now included in "Selling, general and administrative expense" and in "Interest and other income, net."
The statements of operations, balance sheet and statements of cash flows have been reclassified to show noncontrollinginterests that were previously considered to be immaterial.
The balance sheet and statements of cash flows have been reclassified to show retainage balances as unbilledreceivables.
Certain immaterial items have been consolidated on the balance sheet.
45

Table of Contents
MAXIMUS, Inc.
Notes to Consolidated Financial Statements (Continued)
For the years ended September 30, 2014, 2013 and 2012
2. Business segments
The Company is organized and managed based upon the services it provides. We operate in two business segments,Health Services and Human Services. The results of these segments for the three years ended September 30, 2014 are shownbelow (in thousands):
Year ended September 30, 2014 2013 2012
Revenue: Health Services $ 1,250,565 $ 862,879 $ 671,181 Human Services 450,347 468,400 378,964
Total $ 1,700,912 $ 1,331,279 $ 1,050,145
Gross Profit: Health services $ 325,559 $ 248,100 $ 172,456 Human Services 126,564 137,933 115,487
Total $ 452,123 $ 386,033 $ 287,943
Selling, general and administrative expense: Health Services $ 150,181 $ 118,266 $ 91,837 Human Services 76,022 79,842 65,565 Acquisition-related expenses — 2,168 2,876 Legal and settlement expenses /(recoveries), net 596 (202) 90 Other 16 804 241
Total $ 226,815 $ 200,878 $ 160,609
Operating income Health Services $ 175,378 $ 129,834 $ 80,619 Human Services 50,542 58,091 49,922 Acquisition-related expenses — (2,168) (2,876)Legal and settlement recoveries / (expenses), net (596) 202 (90)Other (16) (804) (241)
Total $ 225,308 $ 185,155 $ 127,334
Depreciation and amortization: Health Services $ 36,740 $ 20,846 $ 16,908 Human Services 11,928 14,970 9,552
Total $ 48,668 $ 35,816 $ 26,460
Acquisition-related expenses are costs directly incurred from the purchases of HML in 2013 and PSI in 2012, as well asany unsuccessful transactions. No significant costs were incurred in the acquisition of Centacare. Legal and settlementexpenses (recoveries), net consists of costs, net of reimbursed insurance claims, related to significant legal settlements andnon-routine legal matters, including future probable legal costs estimated to be incurred in connection with those matters.Legal expenses incurred in the ordinary course of business are included in their respective business segments.
46
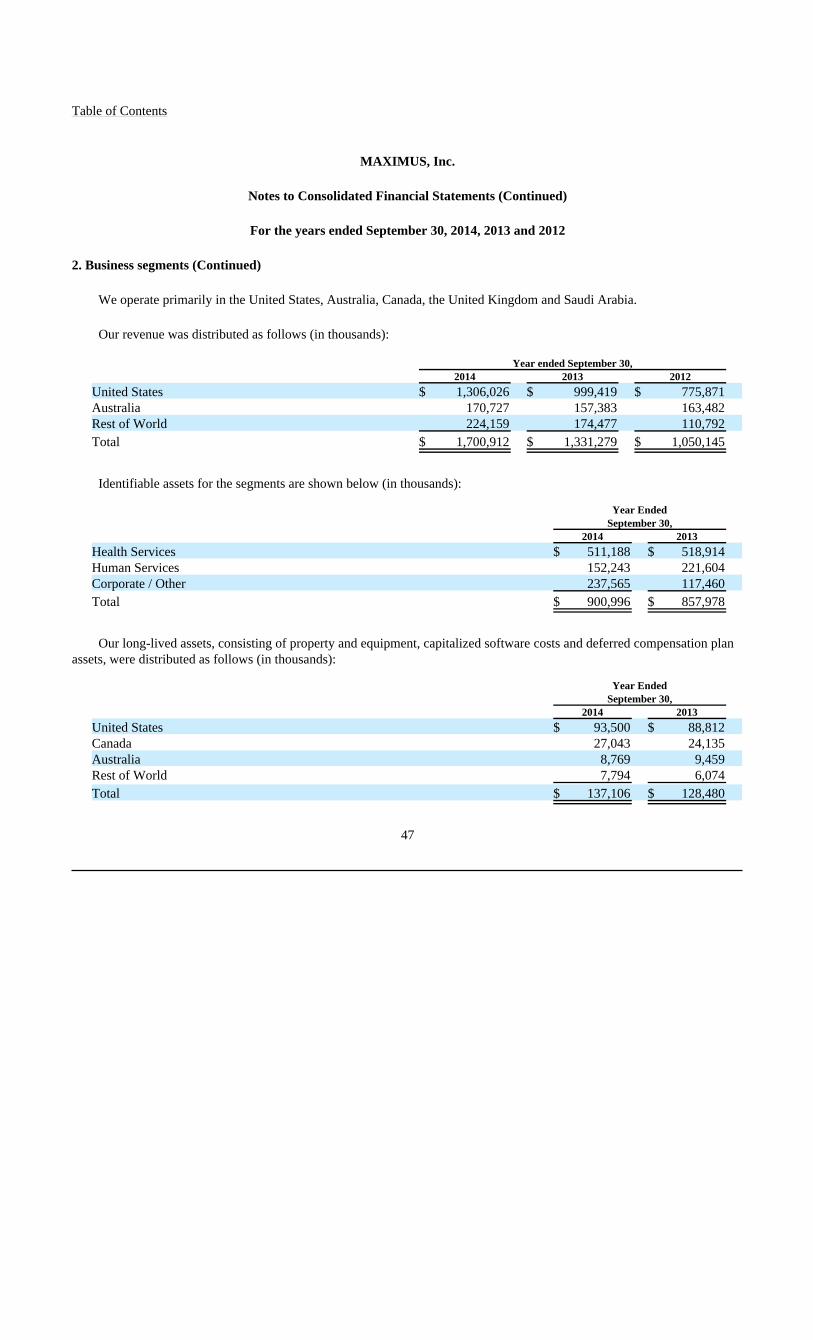
Table of Contents
MAXIMUS, Inc.
Notes to Consolidated Financial Statements (Continued)
For the years ended September 30, 2014, 2013 and 2012
2. Business segments (Continued)
We operate primarily in the United States, Australia, Canada, the United Kingdom and Saudi Arabia.
Our revenue was distributed as follows (in thousands):
Year ended September 30, 2014 2013 2012
United States $ 1,306,026 $ 999,419 $ 775,871 Australia 170,727 157,383 163,482 Rest of World 224,159 174,477 110,792
Total $ 1,700,912 $ 1,331,279 $ 1,050,145
Identifiable assets for the segments are shown below (in thousands):
Year Ended
September 30, 2014 2013
Health Services $ 511,188 $ 518,914 Human Services 152,243 221,604 Corporate / Other 237,565 117,460
Total $ 900,996 $ 857,978
Our long-lived assets, consisting of property and equipment, capitalized software costs and deferred compensation planassets, were distributed as follows (in thousands):
Year Ended
September 30, 2014 2013
United States $ 93,500 $ 88,812 Canada 27,043 24,135 Australia 8,769 9,459 Rest of World 7,794 6,074
Total $ 137,106 $ 128,480
47

Table of Contents
MAXIMUS, Inc.
Notes to Consolidated Financial Statements (Continued)
For the years ended September 30, 2014, 2013 and 2012
3. Earnings per share
The following table sets forth the components of basic and diluted earnings per share (in thousands):
Year ended September 30, 2014 2013 2012
Numerator: Net income $ 145,396 $ 117,349 $ 75,831 Loss/(income) attributable to noncontrolling interests 44 (618) 302
Net income attributable to MAXIMUS $ 145,440 $ 116,731 $ 76,133
Denominator: Weighted average shares outstanding 67,680 68,165 67,734 Effect of employee stock options and unvested restricted stock
awards 1,407 1,728 1,877
Denominator for diluted earnings per share 69,087 69,893 69,611
For the year ended September 30, 2014, 286,000 unvested restricted stock units have been excluded from the calculationof diluted earnings per share as the effect of including them would have been anti-dilutive. The number of unvested restrictedstock units excluded from the calculations in earlier years is immaterial.
4. Business combinations
Centacare
On January 31, 2014, we acquired certain businesses from Centacare for $2.7 million ($3.1 million Australian) in cash.The operations of these businesses are consistent with the welfare-to-work services we provide Australia. The Companyacquired these businesses in order to expand our operations in Australia.
Of the purchase price, we allocated $3.2 million to intangible assets, representing customer relationships, and$0.5 million to deferred revenue. The intangible assets will be amortized over the anticipated lives of the customerrelationships, which are approximately four years.
The businesses acquired with Centacare were immediately integrated into our existing business within our HumanServices segment. The results of the acquired business would not be material for any periods shown.
Health Management Limited
On July 1, 2013 (the acquisition date), we acquired 100% of the share capital of Health Management Limited (HML) fortotal consideration of $77.9 million (£51.1 million). The consideration was comprised of $71.4 million (£46.9 million) in cashand 202,972 shares of MAXIMUS stock worth $6.4 million (£4.2 million).
48

Table of Contents
MAXIMUS, Inc.
Notes to Consolidated Financial Statements (Continued)
For the years ended September 30, 2014, 2013 and 2012
4. Business combinations (Continued)
HML provides independent health assessments within the U.K. We acquired HML, among other reasons, to expand theCompany's independent medical assessment business and to establish a strong presence in the U.K. health services market.The acquired assets and business have been integrated into our Health Services Segment.
We allocated the acquisition price to the fair value of the assets and liabilities of HML at the acquisition date. Weprovided estimates of these balances at September 30, 2013 and updated these estimates as more information becameavailable. We have completed this exercise. The assets and liabilities of HML recorded in our financial statements at theacquisition date are summarized below (in thousands):
Updated through
September 30, 2013 Adjustments Updated through
September 30, 2014
Cash consideration, net of cash acquired $ 71,435 $ — $ 71,435 Stock consideration 6,425 — 6,425
Purchase consideration, net of cashacquired $ 77,860 $ — $ 77,860
Accounts receivable and unbilledreceivables $ 7,671 $ — $ 7,671
Other current assets 1,382 — 1,382 Property and equipment 2,752 — 2,752 Intangible assets 20,542 — 20,542
Total identifiable assets acquired 32,347 — 32,347
Accounts payable and other liabilities 6,228 — 6,228 Deferred revenue 1,149 — 1,149 Current income tax liability 612 144 756 Deferred tax liability 4,814 (113) 4,701
Total liabilities assumed 12,803 31 12,834
Net identifiable assets acquired 19,544 (31) 19,513 Goodwill 58,316 31 58,347
Net assets acquired $ 77,860 $ — $ 77,860
The difference between the acquisition date fair value of the consideration and the estimated fair value of the net assetsacquired was recorded as goodwill. We consider the goodwill to represent benefits that are expected to be realized as a resultof the business combination, including, but not limited to, the assembled workforce and the benefit of the enhancedknowledge and capabilities of HML. Goodwill is not deductible for tax purposes.
49
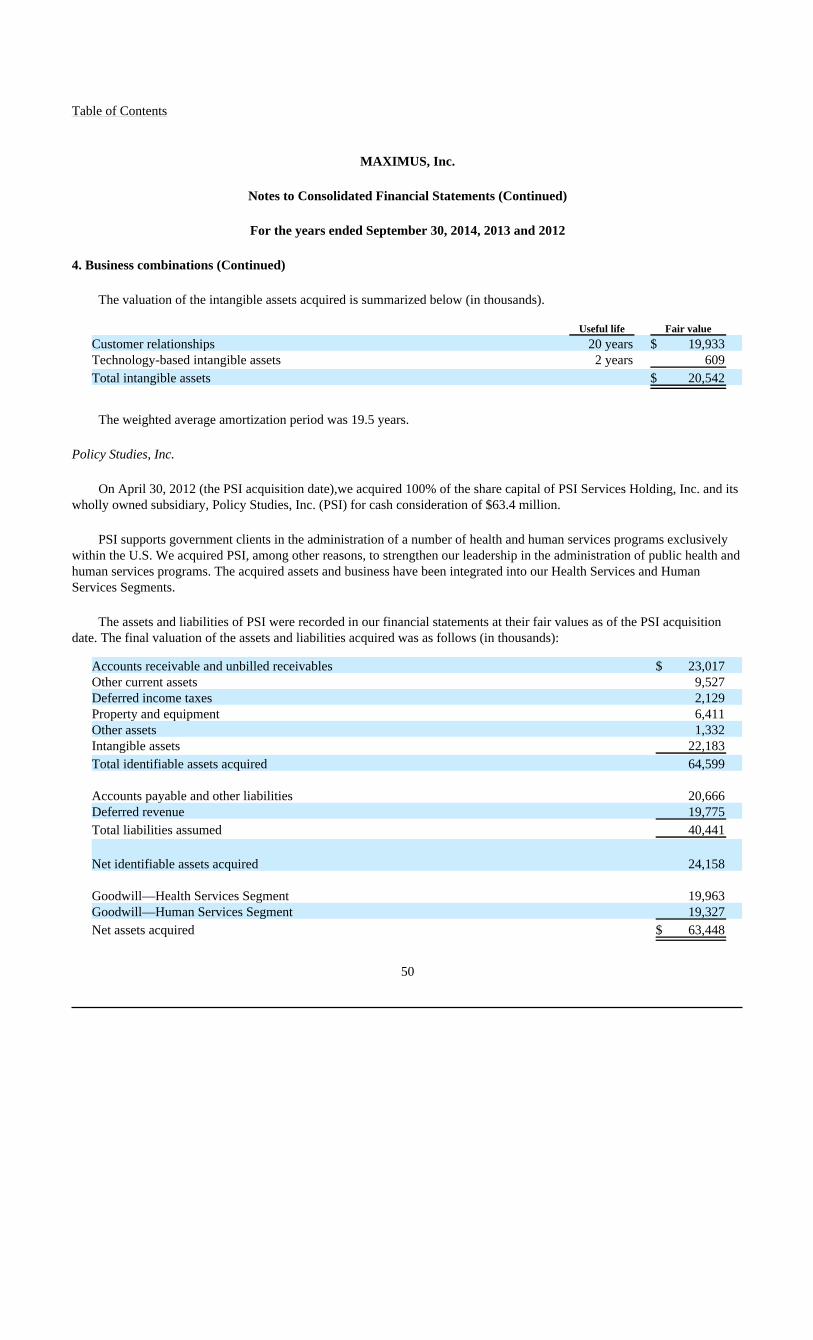
Table of Contents
MAXIMUS, Inc.
Notes to Consolidated Financial Statements (Continued)
For the years ended September 30, 2014, 2013 and 2012
4. Business combinations (Continued)
The valuation of the intangible assets acquired is summarized below (in thousands).
Useful life Fair value
Customer relationships 20 years $ 19,933 Technology-based intangible assets 2 years 609
Total intangible assets $ 20,542
The weighted average amortization period was 19.5 years.
Policy Studies, Inc.
On April 30, 2012 (the PSI acquisition date),we acquired 100% of the share capital of PSI Services Holding, Inc. and itswholly owned subsidiary, Policy Studies, Inc. (PSI) for cash consideration of $63.4 million.
PSI supports government clients in the administration of a number of health and human services programs exclusivelywithin the U.S. We acquired PSI, among other reasons, to strengthen our leadership in the administration of public health andhuman services programs. The acquired assets and business have been integrated into our Health Services and HumanServices Segments.
The assets and liabilities of PSI were recorded in our financial statements at their fair values as of the PSI acquisitiondate. The final valuation of the assets and liabilities acquired was as follows (in thousands):
Accounts receivable and unbilled receivables $ 23,017 Other current assets 9,527 Deferred income taxes 2,129 Property and equipment 6,411 Other assets 1,332 Intangible assets 22,183
Total identifiable assets acquired 64,599
Accounts payable and other liabilities
20,666 Deferred revenue 19,775
Total liabilities assumed 40,441
Net identifiable assets acquired
24,158
Goodwill—Health Services Segment
19,963 Goodwill—Human Services Segment 19,327
Net assets acquired $ 63,448
50
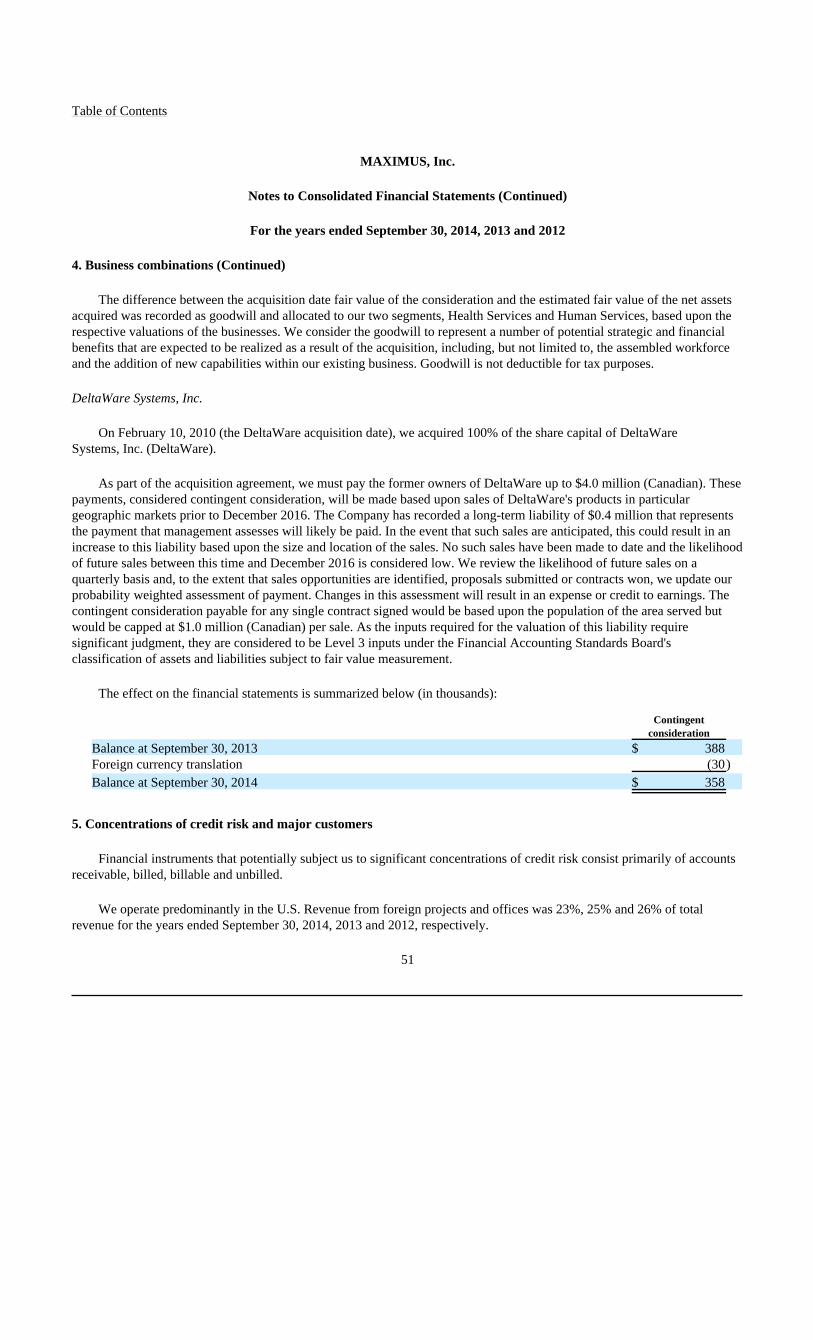
Table of Contents
MAXIMUS, Inc.
Notes to Consolidated Financial Statements (Continued)
For the years ended September 30, 2014, 2013 and 2012
4. Business combinations (Continued)
The difference between the acquisition date fair value of the consideration and the estimated fair value of the net assetsacquired was recorded as goodwill and allocated to our two segments, Health Services and Human Services, based upon therespective valuations of the businesses. We consider the goodwill to represent a number of potential strategic and financialbenefits that are expected to be realized as a result of the acquisition, including, but not limited to, the assembled workforceand the addition of new capabilities within our existing business. Goodwill is not deductible for tax purposes.
DeltaWare Systems, Inc.
On February 10, 2010 (the DeltaWare acquisition date), we acquired 100% of the share capital of DeltaWareSystems, Inc. (DeltaWare).
As part of the acquisition agreement, we must pay the former owners of DeltaWare up to $4.0 million (Canadian). Thesepayments, considered contingent consideration, will be made based upon sales of DeltaWare's products in particulargeographic markets prior to December 2016. The Company has recorded a long-term liability of $0.4 million that representsthe payment that management assesses will likely be paid. In the event that such sales are anticipated, this could result in anincrease to this liability based upon the size and location of the sales. No such sales have been made to date and the likelihoodof future sales between this time and December 2016 is considered low. We review the likelihood of future sales on aquarterly basis and, to the extent that sales opportunities are identified, proposals submitted or contracts won, we update ourprobability weighted assessment of payment. Changes in this assessment will result in an expense or credit to earnings. Thecontingent consideration payable for any single contract signed would be based upon the population of the area served butwould be capped at $1.0 million (Canadian) per sale. As the inputs required for the valuation of this liability requiresignificant judgment, they are considered to be Level 3 inputs under the Financial Accounting Standards Board'sclassification of assets and liabilities subject to fair value measurement.
The effect on the financial statements is summarized below (in thousands):
Contingent
consideration
Balance at September 30, 2013 $ 388 Foreign currency translation (30)
Balance at September 30, 2014 $ 358
5. Concentrations of credit risk and major customers
Financial instruments that potentially subject us to significant concentrations of credit risk consist primarily of accountsreceivable, billed, billable and unbilled.
We operate predominantly in the U.S. Revenue from foreign projects and offices was 23%, 25% and 26% of totalrevenue for the years ended September 30, 2014, 2013 and 2012, respectively.
51

Table of Contents
MAXIMUS, Inc.
Notes to Consolidated Financial Statements (Continued)
For the years ended September 30, 2014, 2013 and 2012
5. Concentrations of credit risk and major customers (Continued)
In the year ended September 30, 2014, approximately 55% of our total revenue was derived from state governmentagencies whose programs received significant federal funding, 20% from foreign government agencies, 17% from U.S.-basedfederal government agencies, and 8% from other sources including local municipalities and commercial customers. Webelieve that the credit risk associated with our receivables is limited due to the credit worthiness of these customers.
During fiscal year 2014, we had four customers who each provided more than 10% of the our annual revenue: the UnitedStates Federal Government, the States of California and Texas and the Government of Australia. Revenue from the U.S.Federal Government, California and Texas was principally within the Health Services Segment. Revenue from Australia wasexclusively within the Human Services Segment. The proportion of revenue recognized from customers providing in excessof 10% of our consolidated revenue for each of the three years ended September 30, 2014 was as follows:
Year ended
September 30, 2014 2013 2012
U.S. Federal 17% 12% * Australia 10% 12% 16%California 10% * 10%Texas 10% 14% 18%
* Entity provided less than 10% of our consolidated revenue in this year.
6. Billed and unbilled receivables
Changes in the reserves against current billed, billable and unbilled accounts receivable were as follows (in thousands):
Year ended September 30, 2014 2013 2012
Balance at beginning of year $ 3,828 $ 3,975 $ 3,265 Additions to reserve 1,767 2,334 2,061 Deductions (2,457) (2,481) (1,351)
Balance at end of year $ 3,138 $ 3,828 $ 3,975
In evaluating the net realizable value of accounts receivable, we consider such factors as current economic trends,customer credit-worthiness, and changes in the customer payment terms and collection trends. Changes in the assumptionsused in analyzing a specific account receivable may result in a reserve being recognized in the period in which the changeoccurs.
At September 30, 2014 and 2013, $8.8 million and $8.3 million of our unbilled receivables related to amounts pursuantto contractual retainage provisions. We anticipate that the majority of the fiscal 2014 balance will be collected during the2015 fiscal year.
52

Table of Contents
MAXIMUS, Inc.
Notes to Consolidated Financial Statements (Continued)
For the years ended September 30, 2014, 2013 and 2012
7. Goodwill and intangible assets
Changes in goodwill for the years ended September 30, 2014 and 2013 are as follows (in thousands):
Health Services Human Services Total
Balance as of September 30, 2012 $ 63,517 $ 48,515 $ 112,032 Goodwill acquired with HML 58,316 — 58,316 Adjustment to goodwill acquired with PSI 65 64 129 Foreign currency translation 3,198 (1,808) 1,390
Balance as of September 30, 2013 125,096 46,771 171,867 Adjustment to goodwill acquired with HML 31 — 31 Foreign currency translation (207) (1,065) (1,272)
Balance as of September 30, 2014 $ 124,920 $ 45,706 $ 170,626
There have been no impairment charges in our goodwill.
The following table sets forth the components of intangible assets (in thousands):
As of September 30, 2014 As of September 30, 2013
Cost AccumulatedAmortization
IntangibleAssets, net Cost
AccumulatedAmortization
IntangibleAssets, net
Customer contracts and relationships $ 42,403 $ 7,821 $ 34,582 $ 39,243 $ 3,953 $ 35,290 Technology-based intangible assets 9,295 6,910 2,385 9,583 5,974 3,609 Trademarks and trade names 4,374 2,102 2,272 4,421 1,303 3,118 Non-compete arrangements — — — 243 221 22
Total $ 56,072 $ 16,833 $ 39,239 $ 53,490 $ 11,451 $ 42,039
The intangible assets include $3.4 million of fully amortized technology-based assets still in use. Our intangible assetshave a weighted average remaining life of 11.7 years, comprising 12.9 years for customer contracts and relationships,3.2 years for technology-based intangible assets and 3.0 years for trademarks and trade names. Amortization expense for theyears ended September 30, 2014, 2013 and 2012 was $5.9 million, $4.9 million and $2.7 million, respectively. Estimatedfuture amortization expense is estimated as follows (in thousands):
Year ending September 30, 2015 $ 5,875 Year ending September 30, 2016 5,613 Year ending September 30, 2017 5,214 Year ending September 30, 2018 4,002 Year ending September 30, 2019 3,042
53

Table of Contents
MAXIMUS, Inc.
Notes to Consolidated Financial Statements (Continued)
For the years ended September 30, 2014, 2013 and 2012
8. Property and equipment
Property and equipment, at cost, consists of the following (in thousands):
As of September 30, 2014 2013
Land $ 1,738 $ 1,738 Building and improvements 11,707 11,661 Office furniture and equipment 177,939 149,796 Leasehold improvements 23,124 17,870
214,508 181,065 Less: Accumulated depreciation and amortization (134,262) (103,355)
Total property and equipment, net $ 80,246 $ 77,710
Fixed asset depreciation expense for the years ended September 30, 2014, 2013 and 2012 was $32.9 million,$26.3 million and $18.8 million, respectively.
9. Capitalized software
Capitalized software consists of the following (in thousands):
As of September 30, 2014 2013
Capitalized software $ 72,758 $ 64,189 Less: Accumulated amortization (33,024) (23,733)
Total Software development costs, net $ 39,734 $ 40,456
Capitalized software amortization expense for the years ended September 30, 2014, 2013 and 2012 was $9.9 million,$4.6 million and $4.9 million, respectively.
10. Deferred contract costs
Deferred contract costs consist of contractually recoverable direct set-up costs relating to long-term service contracts.These costs include direct and incremental costs incurred prior to the commencement of us providing contracted services toour customers. These costs are expensed over the period the services are provided. Deferred contract costs consist of thefollowing (in thousands):
As of September 30, 2014 2013
Deferred contract costs $ 25,489 $ 23,623 Less: accumulated amortization (13,443) (9,305)
Total deferred contract costs, net $ 12,046 $ 14,318
54

Table of Contents
MAXIMUS, Inc.
Notes to Consolidated Financial Statements (Continued)
For the years ended September 30, 2014, 2013 and 2012
11. Credit facilities
On March 15, 2013, we entered into an unsecured five-year revolving credit agreement (the "Credit Agreement"). TheCredit Agreement amended and restated our existing revolving credit agreement entered into in January 2008. The CreditAgreement provides for a revolving line of credit up to $100 million that may be used for revolving loans, swingline loans(subject to a sublimit of $5 million), and to request letters of credit, subject to a sublimit of $30 million. The line of credit isavailable for general corporate purposes, including working capital, capital expenditures and acquisitions. The arrangementwill terminate on March 15, 2018, at which time all outstanding borrowings must be repaid.
We had no borrowings under the Credit Agreement at September 30, 2014.
At September 30, 2014, our only indebtedness under the Credit Agreement was three letters of credit totaling$4.7 million. Each of these letters of credit may be called by customers in the event that the Company defaults under theterms of a contract, the probability of which we believe is remote. In addition, two letters of credit totaling $3.0 million,secured with restricted cash balances, are held with another financial institution to cover similar obligations.
The Credit Agreement requires us to comply with certain financial covenants and other covenants including a maximumtotal leverage ratio and a minimum fixed charge coverage ratio. We were in compliance with all covenants as ofSeptember 30, 2014. Our obligations under the Credit Agreement are guaranteed by material domestic subsidiaries of theCompany. The Credit Facility is currently unsecured. In the event that our total leverage ratio, as defined in the creditagreement, exceeds 2.5 to 1.0 or we incur a certain level of indebtedness outside of the Credit Agreement, the CreditAgreement will become secured by the assets of the parent company and certain of its subsidiaries. At September 30, 2014,our total leverage ratio was negligible.
The Credit Agreement provides for an annual commitment fee payable on funds not borrowed or utilized for letters ofcredit. This charge is based upon our leverage and varies between 0.15% and 0.3%. Borrowings under the Credit Agreementbear interest at our choice at either (a) a Base Rate plus a margin that varies between 0.0% and 0.75% per year, (b) aEurocurrency Rate plus an applicable margin that varies between 1.0% and 1.75% per year or (c) an Index Rate plus anapplicable margin which varies between 1.0% and 1.75% per year. The Base Rate, Eurocurrency Rate and Index Rate aredefined by the Credit Agreement.
In addition to this revolving credit facility, we have a loan agreement with the Atlantic Innovation Fund of Canada. Thisprovided a loan of $1.8 million (Canadian), the proceeds of which were required to be used for specific technology-basedresearch and development. The loan has no interest charge. At September 30, 2014, $1.2 million ($1.4 million Canadian) wasoutstanding under this agreement, which is repayable in 31 remaining quarterly installments.
Certain contracts require us to provide a surety bond as a guarantee of performance. At September 30, 2014, we hadperformance bond commitments totaling $38.2 million. These bonds are typically renewed annually and remain in place untilthe contractual obligations have been satisfied. Although the triggering events vary from contract to contract, in general wewould only be liable for the amount of these guarantees in the event of default in our performance of our obligations undereach contract, the probability of which we believe is remote.
55

Table of Contents
MAXIMUS, Inc.
Notes to Consolidated Financial Statements (Continued)
For the years ended September 30, 2014, 2013 and 2012
12. Commitments and contingencies
Litigation
We are involved in various legal proceedings, including the matters described below, in the ordinary course of ourbusiness.
In March 2009, a state Medicaid agency asserted a claim against us, related to a discontinued business line, in theamount of $2.3 million in connection with a contract we had through February 1, 2009 to provide Medicaid administrativeclaiming services to school districts in the state. We entered into separate agreements with the school districts under which wehelped the districts prepare and submit claims to the state Medicaid agency which, in turn, submitted claims forreimbursement to the United States Federal Government. No legal action has been initiated. The state has asserted that itsagreement with us requires the Company to reimburse the state for the amounts owed to the Federal Government. However,the Company's agreements with the school districts require them to reimburse us for such payments and therefore we believethe school districts are responsible for any amounts disallowed by the state Medicaid agency or the Federal Government. Webelieve our exposure in this matter is limited to our fees associated with this work and that the school districts will beresponsible for the remainder. We have exited the federal health care claiming business and no longer provide the services atissue in this matter.
In 2008, we sold the SchoolMAX student information system business line as part of the divestiture of the MAXIMUSEducation Systems division. In 2012, a school district ("District") which was a SchoolMAX client initiated arbitrationalleging that we and the buyer failed to (i) use best practices in developing the software and (ii) deliver and test productreleases as required by the contract, resulting in damages of at least $10 million. In December 2012, the arbitration paneldenied the District's claims in their entirety, and the District filed a motion in court seeking to vacate that decision.Separately, in late 2012, the District claimed that we had defrauded the District in 2007 or 2008 by misrepresenting ourintentions regarding the sale of the Education Systems division. That allegation was not part of the arbitration, and no formalclaim or lawsuit was filed. The parties settled all claims among them at no cost to us in September 2014.
In January 2014, we were named a defendant in Norton et al. v. MAXIMUS in the U.S. District Court for Idaho. Theplaintiffs in this purported class action are current and former trainers and supervisors at the MAXIMUS federal health careprojects in Boise, Idaho and Brownsville, Texas. They allege we willfully misclassified them as exempt employees under theFair Labor Standards Act and failed to pay them overtime, and they seek to establish a nationwide class covering thecompany's federal health care operations. The plaintiffs allege compensatory and punitive damages of at least $5.0 million.We have since reclassified the trainers as non-exempt employees and are seeking an expedited resolution of their wageclaims. We deny liability as to the supervisors and will contest the matter vigorously. As of September 30, 2014, theCompany reserved $0.6 million to cover the estimated legal costs of defending this lawsuit, in addition to estimated liabilitiesto employees.
Acquired loss-making contract
As part of the acquisition of PSI in April 2012, we acquired a systems-integration contract that was anticipated to recordsignificant future losses. The fair value of the obligation to provide these services at a loss was calculated and recorded on ourbalance sheet at acquisition as deferred revenue of $15.1 million.
56

Table of Contents
MAXIMUS, Inc.
Notes to Consolidated Financial Statements (Continued)
For the years ended September 30, 2014, 2013 and 2012
12. Commitments and contingencies (Continued)
The contract was an arrangement that included both significant production and customization of software as well aspostcontract customer support for these services. As we were unable to estimate the costs of providing these services,management deferred all revenue and costs related to service in anticipation of recognizing revenue at the commencement ofthe postcontract customer support services.
In February 2013, we received a formal notice of termination for convenience for this contract. The work was terminatedas part of a broad, state-wide initiative to focus resources on a select number of projects. At the termination of this agreement,we reimbursed the client for certain funds received and undertook to provide future services. All other obligations to provideservices have been extinguished and no material future costs will be incurred. Accordingly, revenue of $16.0 million wasrecognized in the year ended September 30, 2013. In addition, costs of $5.1 million, including costs which had been deferred,were recognized in the same period for an operating profit of $10.9 million.
Employment agreements
We have an employment agreement with our chief executive officer with a term ending in April 2018.
Collective bargaining agreements
Approximately 14% of our employees are covered by collective bargaining agreements or similar arrangements.
13. Leases
We lease office space and equipment under various operating leases. Lease expense for the years ended September 30,2014, 2013 and 2012 was $61.8 million, $49.0 million and $37.6 million, respectively. Our operating leases may contain rentescalations or concessions. Lease expense is recorded on a straight-line basis over the life of the respective lease.
Minimum future lease commitments under leases in effect as of September 30, 2014 are as follows (in thousands):
Office space Equipment Total
Year ended September 30, 2015 $ 52,906 $ 3,358 $ 56,264 2016 35,007 1,394 36,401 2017 27,241 763 28,004 2018 14,751 648 15,399 2019 8,439 259 8,698 Thereafter 9,275 — 9,275
Total minimum lease payments $ 147,619 $ 6,422 $ 154,041
57

Table of Contents
MAXIMUS, Inc.
Notes to Consolidated Financial Statements (Continued)
For the years ended September 30, 2014, 2013 and 2012
14. Employee benefit plans and deferred compensation
We have 401(k) plans for the benefit of employees who meet certain eligibility requirements. The plans provide forcompany match, specified company contributions and discretionary company contributions. During the years endedSeptember 30, 2014, 2013 and 2012, we contributed $4.3 million, $3.8 million and $3.0 million to the 401(k) plans,respectively.
We also have a deferred compensation plan, which is a non-qualified plan available to a restricted number of highlycompensated employees. The plan enables participants to defer compensation for tax purposes. These deferred employeecontributions are held within a rabbi trust with investments directed by the respective employees. The assets of the rabbi trustare available to satisfy the claims of general creditors in the event of bankruptcy. The assets within the rabbi trust include$6.2 million invested in mutual funds which have quoted prices in active markets. These assets, as well as the relatedemployee liabilities, are recorded at fair value with changes in fair value being recorded in the statement of operations.
15. Stock compensation
At September 30, 2014, 2.4 million shares remained available for grants under our 2011 Equity Incentive Plan. Wetypically issue new shares in satisfying our obligations under our stock plans.
In recent years, we have granted equity awards to officers, employees and directors in the form of restricted stock units(RSUs). RSUs issued generally vest ratably over five years. The fair value of the RSUs, based on our stock price at the grantdate, is expensed in equal installments over the vesting period. For the fiscal years ended September 30, 2014, 2013 and2012, compensation expense recognized related to RSUs was $17.3 million, $14.6 million and $12.1 million, respectively.Employees who are granted RSUs also receive dividend-equivalent payments in the form of additional RSUs. However, untilthe shares are issued, they have no voting rights and employees may not buy or sell these RSUs. In the event that an award isforfeited, the dividend-equivalent payments received by the holder with respect to that award are also forfeited.
A summary of our RSU activity for the year ended September 30, 2014, is as follows:
Shares
Weighted-AverageGrant-DateFair Value
Non-vested shares outstanding at September 30, 2013 2,418,954 $ 17.47 Granted 451,741 46.49 Vested (946,478) 17.46 Forfeited (39,316) 22.90
Non-vested shares outstanding at September 30, 2014 1,884,901 24.32
The weighted-average grant-date fair value of RSUs granted in the years ended September 30, 2013 and 2012 was$30.66 and $21.00, respectively. The total fair value of RSUs which vested during the years ended September 30, 2014, 2013and 2012 was $38.7 million, $40.8 million and $25.0 million, respectively. As of September 30, 2014, the total remainingunrecognized compensation cost related to unvested RSUs was $31.8 million. This charge is expected to be realized over thenext four years, with a weighted average life of 1.6 years.
58

Table of Contents
MAXIMUS, Inc.
Notes to Consolidated Financial Statements (Continued)
For the years ended September 30, 2014, 2013 and 2012
15. Stock compensation (Continued)
Prior to fiscal year 2008, we granted stock options to certain employees. These were granted at exercise prices equal tothe fair market value of our common stock at the date of grant, vested over a period of four years and expired ten years afterthe date of the grant. No compensation expenses related to stock options were recorded in any of the years shown.
A summary of our stock option activity for the year ended September 30, 2014, is as follows:
Options Weighted Average
Exercise Price
Outstanding at September 30, 2013 421,464 $ 8.85 Exercised (161,020) 8.60 Expired (444) 10.22
Outstanding and exercisable at September 30, 2014 260,000 9.00
The intrinsic value of outstanding and exercisable stock options at September 30, 2014 was $8.1 million with a weightedaverage remaining life of 1.9 years.
The following table summarizes information pertaining to the stock options vested and exercised for the years presented(in thousands):
Year ended September 30, 2014 2013 2012
Aggregate intrinsic value of all stock options exercised $ 5,698 $ 7,081 $ 10,920 Net cash proceeds from exercise of stock options 1,362 2,168 6,441
The total income tax benefit recognized in the income statement for share-based compensation arrangements was$7.0 million, $5.2 million and $4.3 million for the fiscal years ended September 30, 2014, 2013 and 2012, respectively.
Employees are permitted to forfeit a certain number of shares to cover their personal tax liability, with the Companymaking tax payments to the relevant authorities. These payments are reported in the statements of cash flows as financingcash flows. During the year ended September 30, 2014, our employees forfeited 349,353 shares in this manner, resulting in aliability of $14.2 million.
Cash flows resulting from the tax benefits generated from tax deductions in excess of the compensation costs recognizedfor those options and RSUs (excess tax benefits) are classified as financing cash flows.
16. Stock repurchase programs
Under a resolution adopted in November 2011, the Board of Directors authorized the repurchase, at management'sdiscretion, of up to an aggregate of $125 million of our common stock. Under a resolution adopted in June 2014, theCompany increased this balance by $150 million. The resolutions also authorized the use of option exercise proceeds for therepurchase of our common stock. During the years ended September 30, 2014, 2013 and 2012, we repurchased 2.7 million,1.0 million and 0.6 million common shares at a cost of $113.1 million, $32.5 million and $12.8 million, respectively. AtSeptember 30, 2014, $135.2 million remained available for future stock repurchases.
59

Table of Contents
MAXIMUS, Inc.
Notes to Consolidated Financial Statements (Continued)
For the years ended September 30, 2014, 2013 and 2012
16. Stock repurchase programs (Continued)
We acquired an additional 0.8 million common shares at a cost of $30.6 million between October 1, 2014 andNovember 17, 2014.
17. Income taxes
The components of income before income taxes and the corresponding provision for income taxes are as follows (inthousands):
Year ended September 30, 2014 2013 2012
Income before income taxes: United States $ 180,820 $ 139,716 $ 93,475 Foreign 46,549 49,306 38,031
Income before income taxes $ 227,369 $ 189,022 $ 131,506
Year ended September 30, 2014 2013 2012
Current provision: Federal 55,656 $ 43,199 $ 36,371 State and local 12,003 11,257 9,006 Foreign 11,416 14,821 13,572
Total current provision 79,075 69,277 58,949
Deferred tax expense (benefit): Federal 1,750 2,741 (1,272)State and local 181 851 (471)Foreign 967 (1,196) (1,531)
Total deferred tax expense (benefit) 2,898 2,396 (3,274)
Provision for income taxes $ 81,973 $ 71,673 $ 55,675
60

Table of Contents
MAXIMUS, Inc.
Notes to Consolidated Financial Statements (Continued)
For the years ended September 30, 2014, 2013 and 2012
17. Income taxes (Continued)
The provision for income taxes differs from that which would have resulted from the use of the federal statutory incometax rate as follows (in thousands):
Year ended September 30, 2014 2013 2012
Federal income tax provision at statutory rate of 35% $ 79,579 $ 66,158 $ 46,027 State income taxes, net of federal benefit 7,920 8,151 5,561 Foreign taxation (3,909) (3,715) (1,844)Permanent items 1,286 708 2,808 Tax credits (1,623) (217) (109)True up to prior year — — 2,715 Valuation allowances on net operating loss carryforwards (962) — 305 Other (318) 588 212
Income tax expense $ 81,973 $ 71,673 $ 55,675
61

Table of Contents
MAXIMUS, Inc.
Notes to Consolidated Financial Statements (Continued)
For the years ended September 30, 2014, 2013 and 2012
17. Income taxes (Continued)
The significant items comprising our deferred tax assets and liabilities as of September 30, 2014 and 2013 are as follows(in thousands):
As of September 30, 2014 2013
Deferred tax assets—current: Deferred revenue $ 19,815 $ 10,930 Costs deductible in future periods 14,944 21,186 Net operating loss carryforwards 207 — Other — 544
Total deferred tax assets—current 34,966 32,660
Deferred tax liabilities—current: Accounts receivable—unbilled 6,858 6,217
Net deferred tax asset—current $ 28,108 $ 26,443
Deferred tax assets—non-current: Net operating loss carryforwards $ 2,355 $ 4,080 Valuation allowance on net operating loss carryforwards — (968)
Net operating loss carryforwards net of valuation reserve 2,355 3,112 Deferred revenue 7,089 10,340 Stock compensation 4,100 4,601 Costs deductible in future periods 1,662 1,528 Other 7,828 5,360
Total deferred tax assets—non-current 23,034 24,941
Deferred tax liabilities—non-current Amortization of goodwill and intangible assets 20,261 19,383 Capitalized software 12,057 9,045 Property and equipment 10,045 10,127 Deferred contract costs 1,762 2,059 Other 292 686
Total deferred tax liability—non-current $ 44,417 $ 41,300
Net deferred tax liability—non-current $ 21,383 $ 16,359
At September 30, 2014, our foreign subsidiaries held approximately $173 million of cumulative earnings. We considerundistributed earnings of our foreign subsidiaries to be indefinitely reinvested outside of the United States and, accordingly,no U.S. deferred taxes have been recorded with respect to such earnings in accordance with the relevant accounting guidancefor income taxes. Should the earnings be remitted as dividends, we may be subject to additional U.S. taxes, net of allowableforeign tax credits. It is not practicable to estimate the amount of any additional taxes which may be payable on theundistributed earnings given the various tax planning alternatives we could employ should we decide to repatriate theseearnings in a tax-efficient manner. As of September 30, 2014, our foreign subsidiaries held approximately $95 million of cashand cash equivalents. In November 2014, we remitted $32 million from an international subsidiary to the U.S. as a return ofcapital on a tax-free basis.
62

Table of Contents
MAXIMUS, Inc.
Notes to Consolidated Financial Statements (Continued)
For the years ended September 30, 2014, 2013 and 2012
17. Income taxes (Continued)
We had $4.5 million and $6.9 million of net operating loss carryforwards in the U.S. at September 30, 2014 and 2013,respectively. These balances resulted in deferred tax assets of $2.4 million and $3.1 million, respectively, and relateexclusively to the losses held by PSI prior to the acquisition in 2012. Although our ability to use these loss carryforwards willbe restricted to an annual allowance, we have sufficient profits and time within the jurisdictions where losses have arisen toensure that these losses will be utilized in full through fiscal year 2017. Accordingly, no reserve has been recorded againstthese balances. These net operating loss carryforwards expire between 2027 and 2031.
We had $0.8 million and $3.9 million of net operating loss carryforwards in Canada at September 30, 2014 and 2013,respectively, resulting in deferred tax assets of $0.2 million and $1.0 million. The balance at September 30, 2013 was fullyreserved. During fiscal year 2014, $3.1 million of these net operating losses were utilized and the balance of the existingreserve was reversed. These net operating loss carryforwards expire through 2027 to 2031.
Cash paid for income taxes during the years ended September 30, 2014, 2013, and 2012 was $79.4 million,$58.2 million and $44.3 million, respectively.
We account for uncertain tax positions by recognizing the financial statement effects of a tax position only when, basedupon the technical merits, it is "more-likely-than-not" that the position will be sustained upon examination. Our netunrecognized tax benefits totaled $1.1 million and $1.0 million at September 30, 2014 and 2013, respectively. The totalamount of unrecognized tax benefits that, if recognized, would affect our annual effective income tax rate was $1.1 million atSeptember 30, 2014.
We report interest and penalties as a component of income tax expense. In the fiscal years ending September 30, 2014,2013 and 2012, we recognized interest expense relating to unrecognized tax benefits of less than $0.1 million in each year.The net liability balance at September 30, 2014 and 2013 includes approximately $0.5 million of interest and penalties.
We recognize and present uncertain tax positions on a gross basis (i.e., without regard to likely offsets for deferred taxassets, deductions and/or credits that would result from payment of uncertain tax amounts). The reconciliation of thebeginning and ending amount of gross unrecognized tax benefits was as follows (in thousands):
Year Ended September 30, 2014 2013 2012
Balance at beginning of year $ 812 $ 1,059 $ 1,172 Lapse of statute of limitation — (230) (113)Reductions for tax positions of prior years — (17) —
Balance at end of year $ 812 $ 812 $ 1,059
We file income tax returns in the U.S. federal jurisdiction and in various state and foreign jurisdictions. We are no longersubject to federal income tax examinations for years before 2011 and to state and local income tax examinations by taxauthorities for years before 2009. In international jurisdictions, similar rules apply to filed income tax returns, although thetax examination limitations and requirements may vary. We are no longer subject to audit by tax authorities for foreignjurisdictions for years prior to 2009.
63

Table of Contents
MAXIMUS, Inc.
Notes to Consolidated Financial Statements (Continued)
For the years ended September 30, 2014, 2013 and 2012
18. Quarterly information (unaudited)
Set forth below are selected quarterly statement of operations data for the fiscal years ended September 30, 2014 and2013. We derived this information from unaudited quarterly financial statements that include, in the opinion of ourmanagement, all adjustments necessary for a fair presentation of the information for such periods. Results of operations forany fiscal quarter are not necessarily indicative of results for any future period.
As disclosed in Note 1, we have made certain reclassifications in our presentation of the statements of operations. Thesereclassifications have been made below and, accordingly, these results will be different from those previously reported.
Earnings per share amounts are computed independently each quarter. As a result, the sum of each quarter's earnings pershare amount may not equal the total earnings per share amount for the respective year.
Quarter Ended
Dec. 31,
2013 March 31,
2014 June 30,
2014 Sept. 30,
2014 (In thousands, except per share data)
Revenue $ 406,592 $ 439,015 $ 419,899 $ 435,406 Gross profit 105,916 120,672 112,603 112,932 Net income 33,355 41,461 34,428 36,152 Net income attributable to MAXIMUS 33,859 41,207 34,138 36,236 Basic earnings per share $ 0.50 $ 0.61 $ 0.50 $ 0.54
Diluted earnings per share $ 0.49 $ 0.59 $ 0.49 $ 0.53
Quarter Ended
Dec. 31,
2012 March 31,
2013 June 30,
2013 Sept. 30,
2013 (In thousands, except per share data)
Revenue $ 286,266 $ 326,351 $ 334,323 $ 384,339 Gross profit 76,530 97,444 94,560 117,499 Net income 21,299 32,049 28,581 35,420 Net income attributable to MAXIMUS 21,316 31,689 28,100 35,626 Basic earnings per share $ 0.31 $ 0.46 $ 0.41 $ 0.52
Diluted earnings per share $ 0.31 $ 0.45 $ 0.40 $ 0.51
19. Dividend
On October 3, 2014, our Board of Directors declared a quarterly cash dividend of $0.045 for each share of theCompany's common stock outstanding. The dividend will be paid on November 28, 2014 to shareholders of record onNovember 14, 2014. Based on the number of shares outstanding, the payment will be approximately $3.0 million.
64

Table of Contents
ITEM 9. Changes in and Disagreements with Accountants on Accounting and Financial Disclosure.
None.
ITEM 9A. Controls and Procedures.
Evaluation of Disclosure Controls and Procedures. Our management, with the participation of our principal executiveofficer and principal financial officer, has evaluated the effectiveness of the design and operation of our disclosure controlsand procedures (as defined in Rule 13a-15(e) under the Securities Exchange Act of 1934 (the "Exchange Act")) as of the endof the period covered by this Annual Report on Form 10-K. Based on this evaluation, our principal executive officer andprincipal financial officer concluded that our disclosure controls and procedures are effective and designed to ensure that theinformation required to be disclosed in our reports filed or submitted under the Exchange Act is recorded, processed,summarized and reported within the time periods specified by the SEC's rules and forms and that such information isaccumulated and communicated to our management, including our principal executive officer and principal financial officeras appropriate, to allow timely decisions regarding required disclosure.
Management's Report on Internal Control Over Financial Reporting. Our management is responsible for establishingand maintaining adequate internal control over financial reporting (as defined in Rule 13a-15(f) under the Exchange Act). Ourinternal control over financial reporting is designed to provide reasonable assurance regarding the reliability of our financialreporting and the preparation of published financial statements in accordance with generally accepted accounting principles.
Because of its inherent limitations, internal control over financial reporting may not prevent or detect misstatements.Therefore, even those systems determined to be effective can provide only reasonable assurance with respect to financialstatement preparation and presentation. Also, projections of any evaluation of effectiveness to future periods are subject to therisk that controls may become inadequate because of changes in conditions, or that the degree of compliance with the policiesor procedures may deteriorate.
Management assessed the effectiveness of our internal control over financial reporting as of September 30, 2014. Inmaking this assessment, management used the criteria set forth by the Committee of Sponsoring Organizations of theTreadway Commission (COSO) in Internal Control—Integrated Framework. Based on our assessment, we believe that as ofSeptember 30, 2014, our internal control over financial reporting was effective based on criteria set forth by COSO inInternal Control—Integrated Framework.
The attestation report concerning the effectiveness of our internal control over financial reporting as of September 30,2014, issued by Ernst & Young LLP, the independent registered public accounting firm who also audited our consolidatedfinancial statements, is included following this Item 9A.
Changes in Internal Control Over Financial Reporting. There was no change in our internal control over financialreporting (as defined in Rules 13a-15(f) and 15d-15(f) under the Exchange Act) identified in connection with the evaluationof our internal control that occurred during our fourth fiscal quarter of 2014 that has materially affected, or is reasonablylikely to materially affect, our internal control over financial reporting.
65

Table of Contents
REPORT OF ERNST & YOUNG LLP,INDEPENDENT REGISTERED PUBLIC ACCOUNTING FIRM,
REGARDING INTERNAL CONTROL OVER FINANCIAL REPORTING
The Board of Directors and Shareholders of MAXIMUS, Inc.,
We have audited MAXIMUS, Inc.'s internal control over financial reporting as of September 30, 2014, based on criteriaestablished in Internal Control—Integrated Framework issued by the Committee of Sponsoring Organizations of theTreadway Commission (1992 framework) (the COSO criteria). MAXIMUS, Inc.'s management is responsible for maintainingeffective internal control over financial reporting, and for its assessment of the effectiveness of internal control over financialreporting included in the accompanying Management's Report on Internal Control Over Financial Reporting. Ourresponsibility is to express an opinion on the company's internal control over financial reporting based on our audit.
We conducted our audit in accordance with the standards of the Public Company Accounting Oversight Board (UnitedStates). Those standards require that we plan and perform the audit to obtain reasonable assurance about whether effectiveinternal control over financial reporting was maintained in all material respects. Our audit included obtaining anunderstanding of internal control over financial reporting, assessing the risk that a material weakness exists, testing andevaluating the design and operating effectiveness of internal control based on the assessed risk, and performing such otherprocedures as we considered necessary in the circumstances. We believe that our audit provides a reasonable basis for ouropinion.
A company's internal control over financial reporting is a process designed to provide reasonable assurance regardingthe reliability of financial reporting and the preparation of financial statements for external purposes in accordance withgenerally accepted accounting principles. A company's internal control over financial reporting includes those policies andprocedures that (1) pertain to the maintenance of records that, in reasonable detail, accurately and fairly reflect thetransactions and dispositions of the assets of the company; (2) provide reasonable assurance that transactions are recorded asnecessary to permit preparation of financial statements in accordance with generally accepted accounting principles, and thatreceipts and expenditures of the company are being made only in accordance with authorizations of management anddirectors of the company; and (3) provide reasonable assurance regarding prevention or timely detection of unauthorizedacquisition, use, or disposition of the company's assets that could have a material effect on the financial statements.
Because of its inherent limitations, internal control over financial reporting may not prevent or detect misstatements.Also, projections of any evaluation of effectiveness to future periods are subject to the risk that controls may becomeinadequate because of changes in conditions, or that the degree of compliance with the policies or procedures may deteriorate.
In our opinion, MAXIMUS, Inc. maintained, in all material respects, effective internal control over financial reporting asof September 30, 2014, based on the COSO criteria.
We also have audited, in accordance with the standards of the Public Company Accounting Oversight Board (UnitedStates), the consolidated balance sheets of MAXIMUS, Inc. as of September 30, 2014 and 2013, and the related consolidatedstatements of operations, comprehensive income, shareholders' equity and cash flows for each of the three years in the periodended September 30, 2014 of MAXIMUS, Inc. and our report dated November 17, 2014 expressed an unqualified opinionthereon.
/s/ Ernst & Young LLP
McLean, VirginiaNovember 17, 2014
66
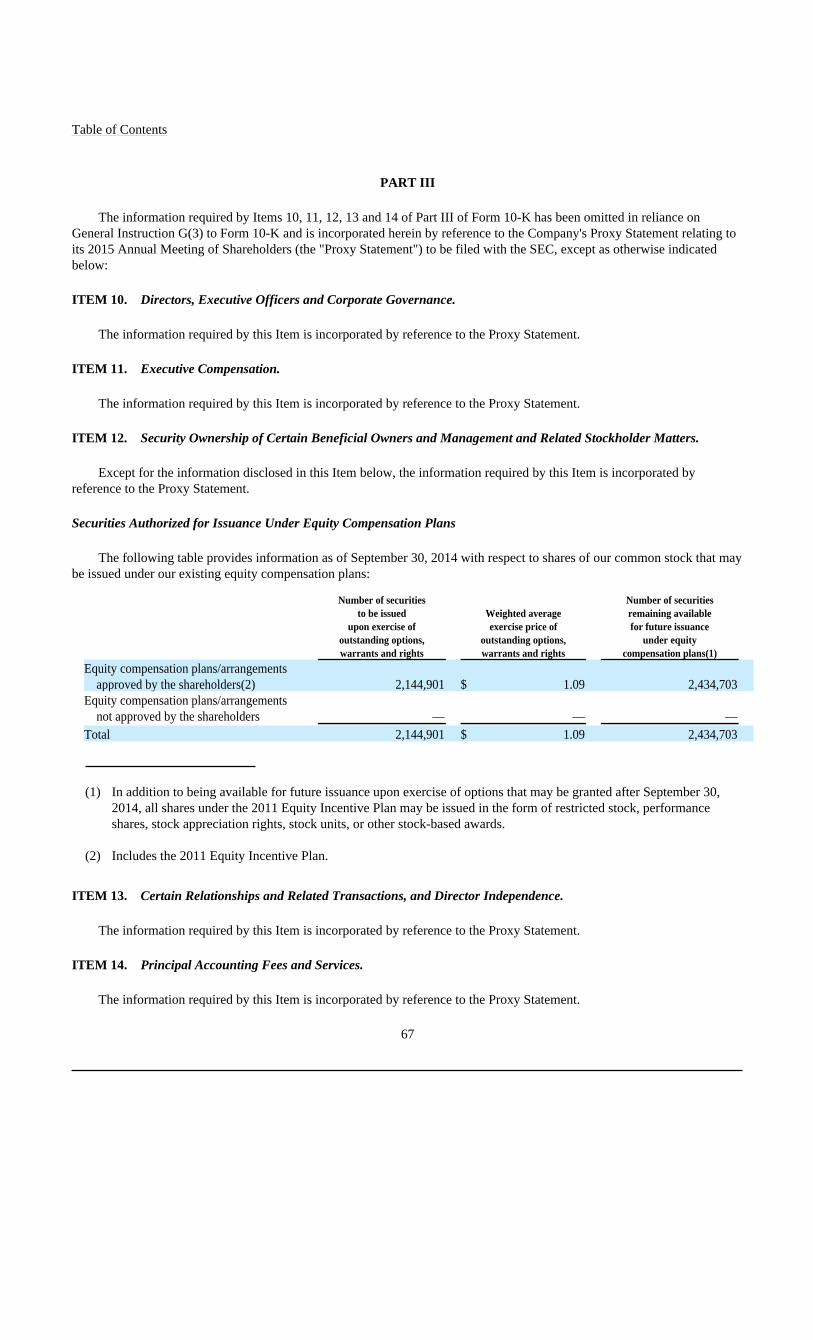
Table of Contents
PART III
The information required by Items 10, 11, 12, 13 and 14 of Part III of Form 10-K has been omitted in reliance onGeneral Instruction G(3) to Form 10-K and is incorporated herein by reference to the Company's Proxy Statement relating toits 2015 Annual Meeting of Shareholders (the "Proxy Statement") to be filed with the SEC, except as otherwise indicatedbelow:
ITEM 10. Directors, Executive Officers and Corporate Governance.
The information required by this Item is incorporated by reference to the Proxy Statement.
ITEM 11. Executive Compensation.
The information required by this Item is incorporated by reference to the Proxy Statement.
ITEM 12. Security Ownership of Certain Beneficial Owners and Management and Related Stockholder Matters.
Except for the information disclosed in this Item below, the information required by this Item is incorporated byreference to the Proxy Statement.
Securities Authorized for Issuance Under Equity Compensation Plans
The following table provides information as of September 30, 2014 with respect to shares of our common stock that maybe issued under our existing equity compensation plans:
Number of securitiesto be issued
upon exercise ofoutstanding options,warrants and rights
Weighted averageexercise price of
outstanding options,warrants and rights
Number of securitiesremaining availablefor future issuance
under equitycompensation plans(1)
Equity compensation plans/arrangementsapproved by the shareholders(2) 2,144,901 $ 1.09 2,434,703
Equity compensation plans/arrangementsnot approved by the shareholders — — —
Total 2,144,901 $ 1.09 2,434,703
(1) In addition to being available for future issuance upon exercise of options that may be granted after September 30,2014, all shares under the 2011 Equity Incentive Plan may be issued in the form of restricted stock, performanceshares, stock appreciation rights, stock units, or other stock-based awards.
(2) Includes the 2011 Equity Incentive Plan.
ITEM 13. Certain Relationships and Related Transactions, and Director Independence.
The information required by this Item is incorporated by reference to the Proxy Statement.
ITEM 14. Principal Accounting Fees and Services.
The information required by this Item is incorporated by reference to the Proxy Statement.
67

Table of Contents
PART IV
ITEM 15. Exhibits, Financial Statement Schedules.
(a) 1. Financial Statements.
The consolidated financial statements are listed under Item 8 of this Annual Report on Form 10-K.
2.
Financial Statement Schedules.
None. Financial statement schedules are not required under the related instructions.
3.
Exhibits.
The Exhibits filed as part of this Annual Report on Form 10-K are listed on the Exhibit Index immediatelypreceding such Exhibits, which Exhibit Index is incorporated herein by reference.
(b)
Exhibits—see Item 15(a)(3) above.
(c)
Financial Statement Schedules—see Item 15(a)(2) above.
68

Table of Contents
SIGNATURES
Pursuant to the requirements of Section 13 or 15(d) of the Securities Exchange Act of 1934, as amended, the registranthas duly caused this Annual Report on Form 10-K to be signed on its behalf by the undersigned, thereunto duly authorized.
Dated: November 17, 2014 MAXIMUS, INC.
By:
/s/ RICHARD A. MONTONI
Richard A. MontoniChief Executive Officer
Pursuant to the requirements of the Securities Exchange Act of 1934, as amended, this Annual Report on Form 10-K hasbeen signed below by the following persons on behalf of the registrant and in the capacities and on the dates indicated.
Signature Title Date
/s/ RICHARD A. MONTONI
Richard A. Montoni
President, Chief Executive Officer andDirector (principal executive officer)
November 17, 2014
/s/ RICHARD J. NADEAU
Richard J. Nadeau
Chief Financial Officer and Treasurer(principal financial and accounting officer)
November 17, 2014
/s/ PETER B. POND
Peter B. Pond
Chairman of the Board of Directors
November 17, 2014
/s/ RUSSELL A. BELIVEAU
Russell A. Beliveau
Director
November 17, 2014
/s/ JOHN J. HALEY
John J. Haley
Director
November 17, 2014
/s/ PAUL R. LEDERER
Paul R. Lederer
Director
November 17, 2014
/s/ RAYMOND B. RUDDY
Raymond B. Ruddy
Director
November 17, 2014
69

Table of Contents
Signature Title Date
/s/ MARILYN R. SEYMANN
Marilyn R. Seymann Director November 17, 2014
/s/ JAMES R. THOMPSON, JR.
James R. Thompson, Jr.
Director
November 17, 2014
/s/ WELLINGTON E. WEBB
Wellington E. Webb
Director
November 17, 2014
70
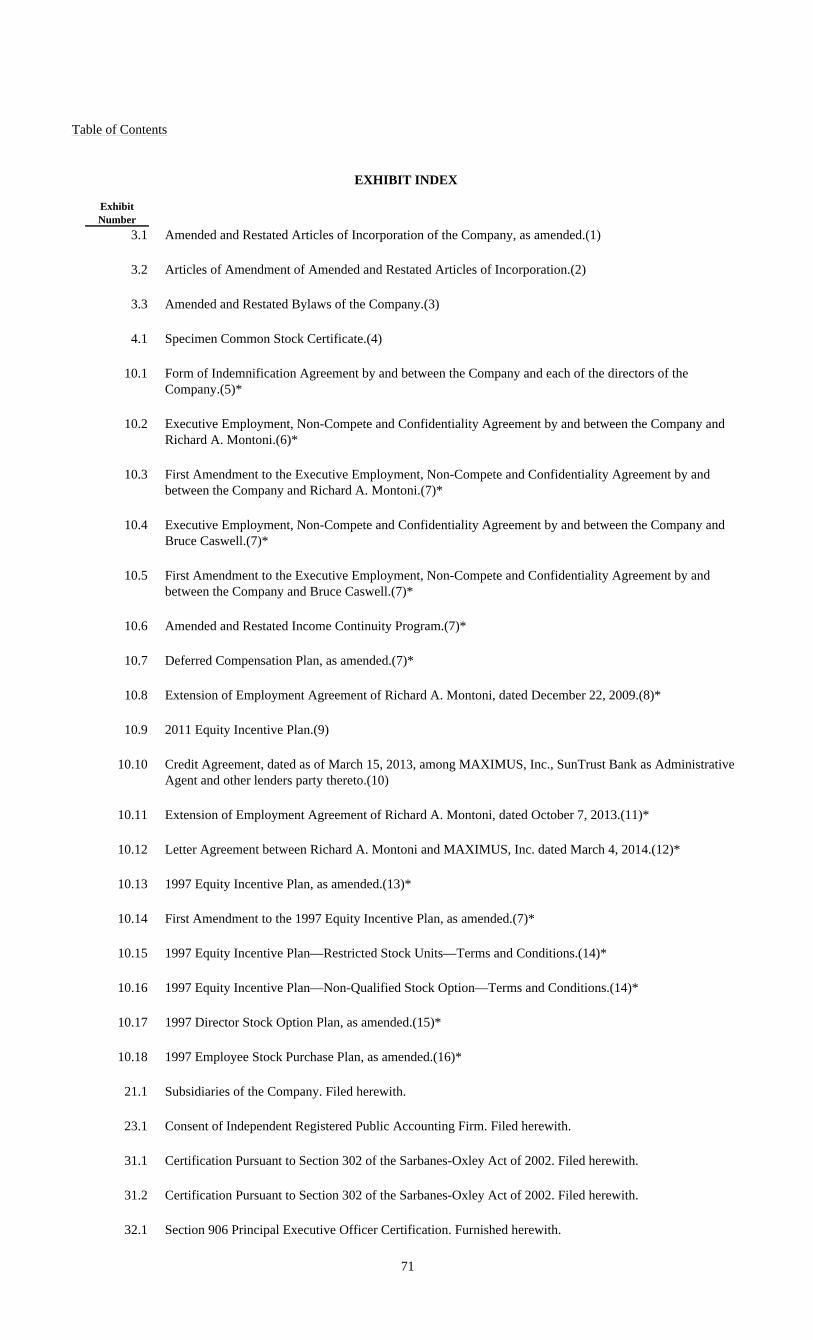
Table of Contents
EXHIBIT INDEX
ExhibitNumber
3.1 Amended and Restated Articles of Incorporation of the Company, as amended.(1)
3.2
Articles of Amendment of Amended and Restated Articles of Incorporation.(2)
3.3
Amended and Restated Bylaws of the Company.(3)
4.1
Specimen Common Stock Certificate.(4)
10.1
Form of Indemnification Agreement by and between the Company and each of the directors of theCompany.(5)*
10.2
Executive Employment, Non-Compete and Confidentiality Agreement by and between the Company andRichard A. Montoni.(6)*
10.3
First Amendment to the Executive Employment, Non-Compete and Confidentiality Agreement by andbetween the Company and Richard A. Montoni.(7)*
10.4
Executive Employment, Non-Compete and Confidentiality Agreement by and between the Company andBruce Caswell.(7)*
10.5
First Amendment to the Executive Employment, Non-Compete and Confidentiality Agreement by andbetween the Company and Bruce Caswell.(7)*
10.6
Amended and Restated Income Continuity Program.(7)*
10.7
Deferred Compensation Plan, as amended.(7)*
10.8
Extension of Employment Agreement of Richard A. Montoni, dated December 22, 2009.(8)*
10.9
2011 Equity Incentive Plan.(9)
10.10
Credit Agreement, dated as of March 15, 2013, among MAXIMUS, Inc., SunTrust Bank as AdministrativeAgent and other lenders party thereto.(10)
10.11
Extension of Employment Agreement of Richard A. Montoni, dated October 7, 2013.(11)*
10.12
Letter Agreement between Richard A. Montoni and MAXIMUS, Inc. dated March 4, 2014.(12)*
10.13
1997 Equity Incentive Plan, as amended.(13)*
10.14
First Amendment to the 1997 Equity Incentive Plan, as amended.(7)*
10.15
1997 Equity Incentive Plan—Restricted Stock Units—Terms and Conditions.(14)*
10.16
1997 Equity Incentive Plan—Non-Qualified Stock Option—Terms and Conditions.(14)*
10.17
1997 Director Stock Option Plan, as amended.(15)*
10.18
1997 Employee Stock Purchase Plan, as amended.(16)*
21.1
Subsidiaries of the Company. Filed herewith.
23.1
Consent of Independent Registered Public Accounting Firm. Filed herewith.
31.1
Certification Pursuant to Section 302 of the Sarbanes-Oxley Act of 2002. Filed herewith.
31.2
Certification Pursuant to Section 302 of the Sarbanes-Oxley Act of 2002. Filed herewith.
32.1
Section 906 Principal Executive Officer Certification. Furnished herewith.
71


Table of Contents
ExhibitNumber
32.2 Section 906 Principal Financial Officer Certification. Furnished herewith.
99.1
Special Considerations and Risk Factors. Filed herewith.
101
The following materials from the MAXIMUS, Inc. Annual Report on Form 10-K for the year endedSeptember 30, 2014 formatted in eXtensible Business Reporting Language (XBRL): (i) ConsolidatedStatements of Operations, (ii) Consolidated Statements of Comprehensive Income, (iii) ConsolidatedBalance Sheets, (iv) Consolidated Statements of Cash Flows, (v) Consolidated Statements of Changes inShareholders' Equity and (vi) Notes to Consolidated Financial Statements. Filed electronically herewith.
* Denotes management contract or compensation plan.
(1) Filed as an exhibit to the Company's Quarterly Report on Form 10-Q for the quarter ended June 30, 2000 (File No. 1-12997) on August 14, 2000 and incorporated herein by reference.
(2) Filed as an exhibit to the Company's Quarterly Report on Form 10-Q for the quarter ended March 31, 2013 (FileNo. 1- 12997) on May 10, 2013 and incorporated herein by reference.
(3) Filed as an exhibit to the Company's Current Report on Form 8- K (File No. 1-12997) on September 15, 2011 andincorporated herein by reference.
(4) Filed as an exhibit to the Company's Quarterly Report on Form 10-Q for the quarter ended June 30, 1997 (File No. 1-12997) on August 14, 1997 and incorporated herein by reference.
(5) Filed as an exhibit to the Company's Registration Statement on Form S-1 (File No. 333-21611) on February 12, 1997and incorporated herein by reference.
(6) Filed as an exhibit to the Company's Current Report on Form 8- K (File No. 1-12997) on April 26, 2006 andincorporated herein by reference.
(7) Filed as an exhibit to the Company's Current Report on Form 8- K (File No. 1-12997) on November 27, 2007 andincorporated herein by reference.
(8) Filed as an exhibit to the Company's Quarterly Report on Form 10-Q for the Quarter ended December 31, 2009 (FileNo. 1- 12997) on February 4, 2010 and incorporated herein by reference.
(9) Filed as an exhibit to the Company's Proxy Statement on Schedule 14A (File No. 1-12997) on January 27, 2012 andincorporated herein by reference.
(10) Filed as an exhibit to the Company's Current Report on Form 8-K (File No. 1-12997) on March 21, 2013 andincorporated herein by reference.
(11) Filed as an exhibit to the Company's Current Report on Form 8-K (File No. 1-12997) on October 7, 2013 andincorporated herein by reference.
(12) Filed as an exhibit to the Company's Current Report on Form 8-K (File No. 1-12997) on March 4, 2014 andincorporated herein by reference.
(13) Filed as an exhibit to the Company's Registration Statement on Form S-8 (File No. 333 - 136400) on August 8, 2006and incorporated herein by reference.
(14) Filed as an exhibit to the Company's Current Report on Form 8- K (File No. 1-12997) on June 23, 2006 andincorporated herein by reference.
(15) Filed as an exhibit to the Company's Annual Report on Form 10- K for the year ended September 30, 1997 (FileNo. 1-12997) on December 22, 1997 and incorporated herein by reference.
(16) Filed as an exhibit to the Company's Registration Statement on Form S-8 (File No. 333 - 122711) on February 10,2005 and incorporated herein by reference.
72
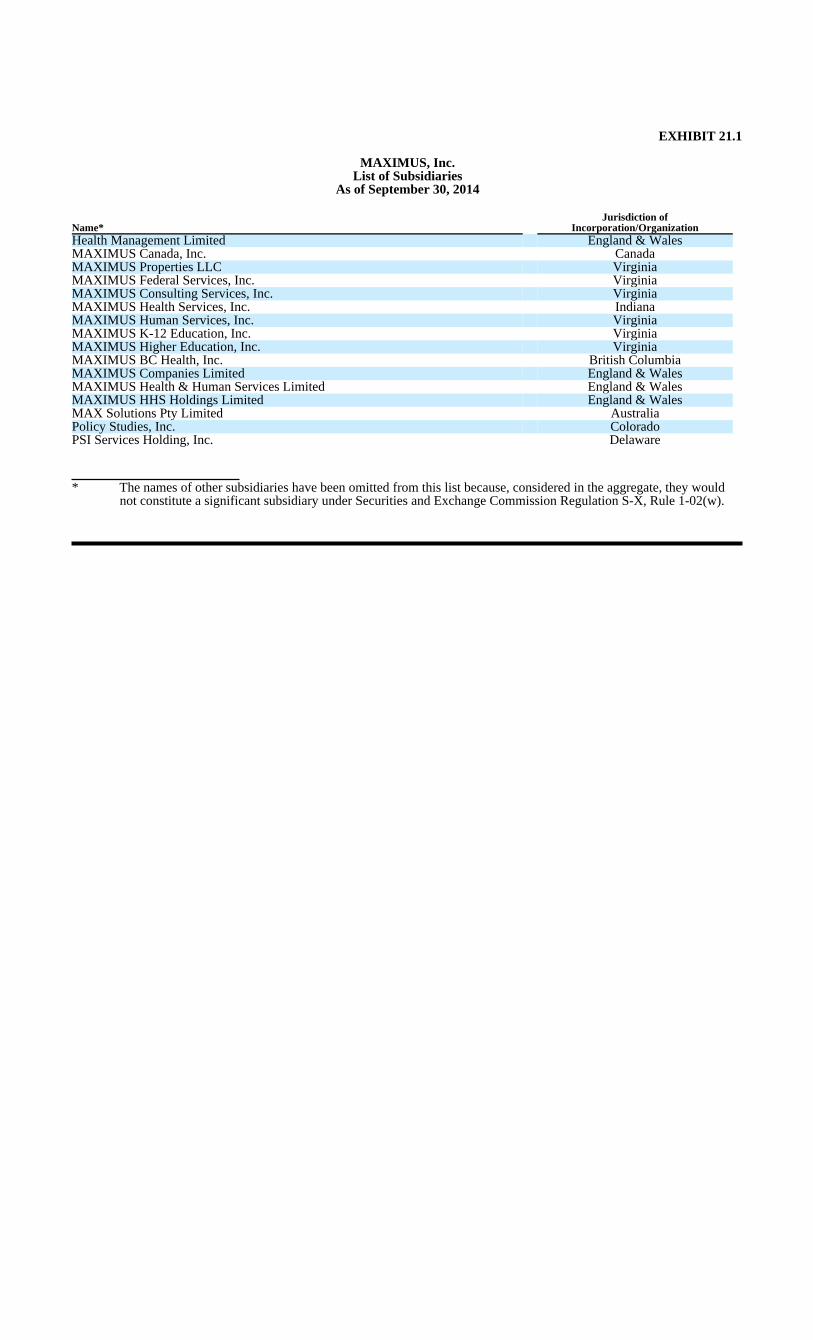
EXHIBIT 21.1
MAXIMUS, Inc.List of Subsidiaries
As of September 30, 2014
Name*
Jurisdiction ofIncorporation/Organization
Health Management Limited England & WalesMAXIMUS Canada, Inc. CanadaMAXIMUS Properties LLC VirginiaMAXIMUS Federal Services, Inc. VirginiaMAXIMUS Consulting Services, Inc. VirginiaMAXIMUS Health Services, Inc. IndianaMAXIMUS Human Services, Inc. VirginiaMAXIMUS K-12 Education, Inc. VirginiaMAXIMUS Higher Education, Inc. VirginiaMAXIMUS BC Health, Inc. British ColumbiaMAXIMUS Companies Limited England & WalesMAXIMUS Health & Human Services Limited England & WalesMAXIMUS HHS Holdings Limited England & WalesMAX Solutions Pty Limited AustraliaPolicy Studies, Inc. ColoradoPSI Services Holding, Inc. Delaware
* The names of other subsidiaries have been omitted from this list because, considered in the aggregate, they wouldnot constitute a significant subsidiary under Securities and Exchange Commission Regulation S-X, Rule 1-02(w).

EXHIBIT 23.1
CONSENT OF INDEPENDENT REGISTERED PUBLIC ACCOUNTING FIRM
We consent to the incorporation by reference in the following Registration Statements: (1) Registration Statements (Form S-8, Nos. 333-88012, 333-41871, 333-62380, 333-75263 and 333-136400) pertaining to
the 1997 Equity Incentive Plan of MAXIMUS, Inc.; (2) Registration Statement (Form S-8, Nos. 333-41867 and 333-122711) pertaining to the 1997 Employee Stock Purchase
Plan of MAXIMUS, Inc.; and (3) Registration Statement (Form S-8, No. 333-41869) pertaining to the 1997 Director Stock Option Plan of
MAXIMUS, Inc. of our reports dated November 17, 2014, with respect to the consolidated financial statements of MAXIMUS, Inc. and theeffectiveness of internal control over financial reporting of MAXIMUS, Inc. included in this Annual Report (Form 10-K) ofMAXIMUS, Inc. for the year ended September 30, 2014.
/s/ Ernst & Young LLP
McLean, VirginiaNovember 17, 2014

EXHIBIT 31.1
Certification Pursuant to Section 302 of the Sarbanes-Oxley Act of 2002
I, Richard A. Montoni, certify that: 1. I have reviewed this Annual Report on Form 10-K of MAXIMUS, Inc.; 2. Based on my knowledge, this report does not contain any untrue statement of a material fact or omit to state a
material fact necessary to make the statements made, in light of the circumstances under which such statements weremade, not misleading with respect to the period covered by this report;
3. Based on my knowledge, the financial statements, and other financial information included in this report, fairly
present in all material respects the financial condition, results of operations and cash flows of the registrant as of,and for, the periods presented in this report;
4. The registrant’s other certifying officer and I are responsible for establishing and maintaining disclosure controls and
procedures (as defined in Exchange Act Rules 13a-15(e) and 15d-15(e)) and internal control over financial reporting(as defined in Exchange Act Rules 13a-15(f) and 15d-15(f)) for the registrant and have:
a) Designed such disclosure controls and procedures, or caused such disclosure controls and procedures to be
designed under our supervision, to ensure that material information relating to the registrant, including itsconsolidated subsidiaries, is made known to us by others within those entities, particularly during the periodin which this report is being prepared;
b) Designed such internal control over financial reporting, or caused such internal control over financial
reporting to be designed under our supervision, to provide reasonable assurance regarding the reliability offinancial reporting and the preparation of financial statements for external purposes in accordance withgenerally accepted accounting principles;
c) Evaluated the effectiveness of the registrant’s disclosure controls and procedures and presented in this
report our conclusions about the effectiveness of the disclosure controls and procedures, as of the end of theperiod covered by this report based on such evaluation; and
d) Disclosed in this report any change in the registrant’s internal control over financial reporting that occurred
during the registrant’s most recent fiscal quarter (the registrant’s fourth fiscal quarter in the case of anannual report) that has materially affected, or is reasonably likely to materially affect, the registrant’sinternal control over financial reporting.
5. The registrant’s other certifying officer and I have disclosed, based on our most recent evaluation of internal control
over financial reporting, to the registrant’s auditors and the audit committee of the registrant’s board of directors (orpersons performing the equivalent functions):
a) All significant deficiencies and material weaknesses in the design or operation of internal control over
financial reporting which are reasonably likely to adversely affect the registrant’s ability to record, process,summarize and report financial information; and
b) Any fraud, whether or not material, that involves management or other employees who have a significant
role in the registrant’s internal control over financial reporting.
Dated: November 17, 2014 /s/ RICHARD A. MONTONI
Richard A. Montoni
Chief Executive Officer

EXHIBIT 31.2
Certification Pursuant to Section 302 of the Sarbanes-Oxley Act of 2002
I, Richard J. Nadeau, certify that: 1. I have reviewed this Annual Report on Form 10-K of MAXIMUS, Inc.; 2. Based on my knowledge, this report does not contain any untrue statement of a material fact or omit to state a
material fact necessary to make the statements made, in light of the circumstances under which such statements weremade, not misleading with respect to the period covered by this report;
3. Based on my knowledge, the financial statements, and other financial information included in this report, fairly
present in all material respects the financial condition, results of operations and cash flows of the registrant as of,and for, the periods presented in this report;
4. The registrant’s other certifying officer and I are responsible for establishing and maintaining disclosure controls and
procedures (as defined in Exchange Act Rules 13a-15(e) and 15d-15(e)) and internal control over financial reporting(as defined in Exchange Act Rules 13a-15(f) and 15d-15(f)) for the registrant and have:
a) Designed such disclosure controls and procedures, or caused such disclosure controls and procedures to be
designed under our supervision, to ensure that material information relating to the registrant, including itsconsolidated subsidiaries, is made known to us by others within those entities, particularly during the periodin which this report is being prepared;
b) Designed such internal control over financial reporting, or caused such internal control over financial
reporting to be designed under our supervision, to provide reasonable assurance regarding the reliability offinancial reporting and the preparation of financial statements for external purposes in accordance withgenerally accepted accounting principles;
c) Evaluated the effectiveness of the registrant’s disclosure controls and procedures and presented in this
report our conclusions about the effectiveness of the disclosure controls and procedures, as of the end of theperiod covered by this report based on such evaluation; and
d) Disclosed in this report any change in the registrant’s internal control over financial reporting that occurred
during the registrant’s most recent fiscal quarter (the registrant’s fourth fiscal quarter in the case of anannual report) that has materially affected, or is reasonably likely to materially affect, the registrant’sinternal control over financial reporting.
5. The registrant’s other certifying officer and I have disclosed, based on our most recent evaluation of internal control
over financial reporting, to the registrant’s auditors and the audit committee of the registrant’s board of directors (orpersons performing the equivalent functions):
a) All significant deficiencies and material weaknesses in the design or operation of internal control over
financial reporting which are reasonably likely to adversely affect the registrant’s ability to record, process,summarize and report financial information; and
b) Any fraud, whether or not material, that involves management or other employees who have a significant
role in the registrant’s internal control over financial reporting.
Dated: November 17, 2014 /s/ RICHARD J. NADEAU
Richard J. Nadeau
Chief Financial Officer

EXHIBIT 32.1
Section 906 CEO Certification
I, Richard A. Montoni, Chief Executive Officer of MAXIMUS, Inc. (“the Company”), do hereby certify, under thestandards set forth in and solely for the purposes of 18 U.S.C. Section 1350, as adopted pursuant to Section 906 of theSarbanes-Oxley Act of 2002, that, to my knowledge:
1. The Annual Report on Form 10-K of the Company for the fiscal year ended September 30, 2014 (the
“Annual Report”) fully complies with the requirements of Section 13(a) or 15(d) of the Securities ExchangeAct of 1934 (15 U.S.C. Section 78m or 78o(d)) and
2. The information contained in the Annual Report fairly presents, in all material respects, the financial
condition and results of operations of the Company.
Dated: November 17, 2014 /s/ RICHARD A. MONTONI
Richard A. Montoni
Chief Executive Officer

EXHIBIT 32.2
Section 906 CFO Certification
I, Richard J. Nadeau, Chief Financial Officer of MAXIMUS, Inc. (“the Company”), do hereby certify, under thestandards set forth in and solely for the purposes of 18 U.S.C. Section 1350, as adopted pursuant to Section 906 of theSarbanes-Oxley Act of 2002, that, to my knowledge:
1. The Annual Report on Form 10-K of the Company for the fiscal year ended September 30, 2014 (the
“Annual Report”) fully complies with the requirements of Section 13(a) or 15(d) of the Securities ExchangeAct of 1934 (15 U.S.C. Section 78m or 78o(d)) and
2. The information contained in the Annual Report fairly presents, in all material respects, the financial
condition and results of operations of the Company.
Dated: November 17, 2014 /s/ RICHARD J. NADEAU
Richard J. Nadeau
Chief Financial Officer

EXHIBIT 99.1
Special Considerations and Risk Factors
Our operations are subject to many risks, including those described below, that could adversely affect our futurefinancial condition and performance and, therefore, the market value of securities.
We may be subject to fines, penalties and other sanctions if we fail to comply with laws governing our business.
Our business lines operate within a variety of complex regulatory schemes, including but not limited to the FederalAcquisition Regulation (FAR), Federal Cost Accounting Standards, the Truth in Negotiations Act, the Fair Debt CollectionPractices Act (and analogous national and state laws), the United Kingdom Bribery Act, as well as the regulations governingMedicaid and Medicare. If a government audit uncovers improper or illegal activities by us or we otherwise determine thatthese activities have occurred, we may be subject to civil and criminal penalties and administrative sanctions, includingtermination of contracts, forfeitures of profits, suspension of payments, fines and suspension or disqualification from doingbusiness with the government. Any adverse determination could adversely impact our ability to bid in response to requests forproposals (RFPs) in one or more jurisdictions. Further, as a government contractor subject to the types of regulatory schemesdescribed above, we are subject to an increased risk of investigations, criminal prosecution, civil fraud, whistleblowerlawsuits and other legal actions and liabilities to which private sector companies are not, the result of which could have amaterial adverse effect on our operating results, cash flows and financial condition.
If we fail to satisfy our contractual obligations or meet performance standards, our contracts may be terminated andwe may incur significant costs or liabilities, including liquidated damages and penalties, which could adversely impactour operating results, financial condition and our ability to compete for future contracts.
Our contracts may be terminated for our failure to satisfy our contractual obligations or to meet performancestandards and often require us to indemnify customers. In addition, some of our contracts contain substantial liquidateddamages provisions and financial penalties related to performance failures. Although we have liability insurance, the policycoverage and limits may not be adequate to provide protection against all potential liabilities. Further, for certain contracts,we have posted significant performance bonds or issued letters of credit to secure our performance, indemnification and otherobligations. If a claim is made against a performance bond or letter of credit, we would be required to reimburse the issuer forthe amount of the claim. Consequently, as a result of the above matters, we may incur significant costs or liabilities, includingpenalties, which could adversely impact our operating results, cash flows, financial condition and our ability to compete forfuture contracts.
We are subject to review and audit by governments at their sole discretion and, if any improprieties are found, wemay be required to refund revenue we have received, or forego anticipated revenue, which could have a materialadverse impact on our revenue and our ability to bid in response to RFPs.
As a provider of services to government agencies, we are subject to periodic audits and other reviews bygovernments of our costs and performance, accounting and general business practices relating to our contracts with thosegovernment agencies. As part of that process, the government agency reviews our performance on the contract, our pricingpractices, our cost structure and our compliance with applicable laws, regulations and standards. Based on the results of theseaudits, government agencies may demand refunds or adjust our contract-related costs and fees, including internal costs andexpense allocation. Although adjustments arising from government audits and reviews have not had a material adverse effecton our results of operations in the past, there can be no assurance that future audits and reviews would not have such effects.

Our business could be adversely affected by future legislative or government budgetary and spending changes.
The market for our services depends largely on federal and state legislative programs and the budgetary capability tosupport programs, including the continuance of existing programs. Many of our contracts are not fully-funded at inceptionand rely upon future appropriations of funds. Accordingly, a failure to receive additional, anticipated funding may result in anearly termination of a contract. In addition, many of our contracts include clauses which allow clients to unilaterally modifyor terminate contracts with little or no recompense.
Changes in government initiatives or in the level of government spending due to budgetary or deficit considerations
may have a significant impact on our future financial performance. For example, increased or changed spending on defense,security or anti-terrorism threats may impact the level of demand for our services. Many state programs in the United States,such as Medicaid, are federally mandated and fully or partially funded by the United States Federal Government. Changes,such as program eligibility, benefits, or the level of federal funding may impact the demand for our services. Certain changesmay present new opportunities to us, while other changes may reduce the level of demand for services provided by us, whichcould materially adversely impact our future financial performance.
If we do not successfully integrate the businesses that we acquire, our results of operations could be adversely affected.
Business combinations involve a number of factors that affect operations, including: • diversion of management’s attention; • loss of key personnel; • entry into unfamiliar markets; • assumption of unanticipated legal or financial liabilities; • becoming significantly leveraged as a result of incurring debt to finance an acquisition; • unanticipated operating, accounting or management difficulties in connection with the acquired entities; • impairment of acquired intangible assets, including goodwill; and • dilution to our earnings per share. Businesses we acquire may not achieve the revenue and earnings we anticipated. Customer dissatisfaction or
performance problems with an acquired firm could materially and adversely affect our reputation as a whole. As a result, wemay be unable to profitably manage businesses that we have acquired or that we may acquire or we may fail to integrate themsuccessfully without incurring substantial expenses, delays or other problems that could materially negatively impact ourbusiness and results of operations.

We may face liabilities arising from divested or discontinued businesses.
During 2008, we divested our Security Solutions, Unison, Education Systems, Justice Solutions and Asset Solutionsbusinesses. During fiscal 2010, we divested our ERP Solutions business. The transaction documents for those divestiturescontain a variety of representations, warranties and indemnification obligations. We could face indemnification claims andliabilities from alleged breaches of representations or warranties.
During 2009, we exited the revenue maximization business. Although we no longer provide those services, former
projects that we performed for state clients remain subject to federal audits. Our contracts for that business generally providethat the company will refund the portion of its fee associated with any federal disallowance. Accordingly, we may beobligated to refund amounts paid for such revenue maximization services depending on the outcome of federal audits. InMarch 2009, for example, a state Medicaid agency asserted a claim against MAXIMUS in the amount of $2.3 million inconnection with a contract MAXIMUS had to provide Medicaid administrative claiming services to school districts in thestate. MAXIMUS had entered into separate agreements with the school districts under which MAXIMUS helped the districtsprepare and submit claims to the state Medicaid agency which, in turn, submitted claims for reimbursement to the UnitedStates Federal Government. The state asserted that its agreement with MAXIMUS requires the Company to reimburse thestate for amounts owed to the Federal Government. No legal proceedings have been instituted in that matter. The Companycould face similar claims arising from such projects for other state clients.
If we fail to accurately estimate the factors upon which we base our contract pricing, we may generate less profit thanexpected or incur losses on those contracts.
We derived approximately 23% of our fiscal 2014 revenue from fixed-price contracts and approximately 49% of ourfiscal 2014 revenue from performance-based contracts. For fixed-price contracts, we receive our fee based on servicesprovided. Those services might include operating a Medicaid enrollment center pursuant to specified standards, designing andimplementing computer systems or applications, or delivering a planning document under a consulting arrangement. Forperformance-based contracts, we receive our fee on a per-transaction basis. These contracts include, for example, childsupport enforcement contracts in which we often receive a fee based on the amount of child support collected. To earn aprofit on these contracts, we must accurately estimate costs involved and assess the probability of completing individualtransactions within the contracted time period. If our estimates prove to be inaccurate, we may not achieve the level of profitwe expected or we may incur a net loss on a contract.
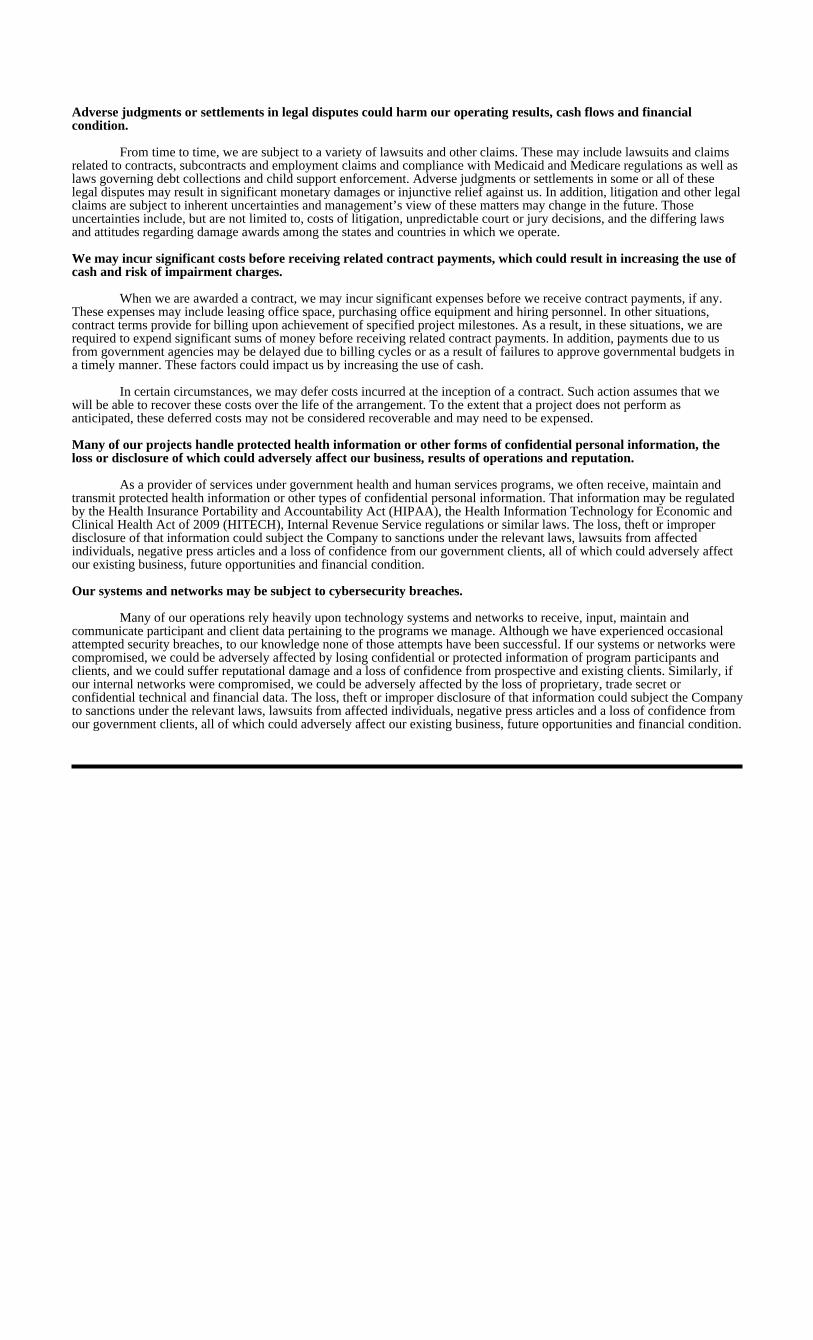
Adverse judgments or settlements in legal disputes could harm our operating results, cash flows and financialcondition.
From time to time, we are subject to a variety of lawsuits and other claims. These may include lawsuits and claimsrelated to contracts, subcontracts and employment claims and compliance with Medicaid and Medicare regulations as well aslaws governing debt collections and child support enforcement. Adverse judgments or settlements in some or all of theselegal disputes may result in significant monetary damages or injunctive relief against us. In addition, litigation and other legalclaims are subject to inherent uncertainties and management’s view of these matters may change in the future. Thoseuncertainties include, but are not limited to, costs of litigation, unpredictable court or jury decisions, and the differing lawsand attitudes regarding damage awards among the states and countries in which we operate.
We may incur significant costs before receiving related contract payments, which could result in increasing the use ofcash and risk of impairment charges.
When we are awarded a contract, we may incur significant expenses before we receive contract payments, if any.These expenses may include leasing office space, purchasing office equipment and hiring personnel. In other situations,contract terms provide for billing upon achievement of specified project milestones. As a result, in these situations, we arerequired to expend significant sums of money before receiving related contract payments. In addition, payments due to usfrom government agencies may be delayed due to billing cycles or as a result of failures to approve governmental budgets ina timely manner. These factors could impact us by increasing the use of cash.
In certain circumstances, we may defer costs incurred at the inception of a contract. Such action assumes that we
will be able to recover these costs over the life of the arrangement. To the extent that a project does not perform asanticipated, these deferred costs may not be considered recoverable and may need to be expensed.
Many of our projects handle protected health information or other forms of confidential personal information, theloss or disclosure of which could adversely affect our business, results of operations and reputation.
As a provider of services under government health and human services programs, we often receive, maintain andtransmit protected health information or other types of confidential personal information. That information may be regulatedby the Health Insurance Portability and Accountability Act (HIPAA), the Health Information Technology for Economic andClinical Health Act of 2009 (HITECH), Internal Revenue Service regulations or similar laws. The loss, theft or improperdisclosure of that information could subject the Company to sanctions under the relevant laws, lawsuits from affectedindividuals, negative press articles and a loss of confidence from our government clients, all of which could adversely affectour existing business, future opportunities and financial condition.
Our systems and networks may be subject to cybersecurity breaches.
Many of our operations rely heavily upon technology systems and networks to receive, input, maintain andcommunicate participant and client data pertaining to the programs we manage. Although we have experienced occasionalattempted security breaches, to our knowledge none of those attempts have been successful. If our systems or networks werecompromised, we could be adversely affected by losing confidential or protected information of program participants andclients, and we could suffer reputational damage and a loss of confidence from prospective and existing clients. Similarly, ifour internal networks were compromised, we could be adversely affected by the loss of proprietary, trade secret orconfidential technical and financial data. The loss, theft or improper disclosure of that information could subject the Companyto sanctions under the relevant laws, lawsuits from affected individuals, negative press articles and a loss of confidence fromour government clients, all of which could adversely affect our existing business, future opportunities and financial condition.

We obtain most of our business through competitive bidding in response to government RFPs. We may not beawarded contracts through this process at the same level in the future as in the past, and contracts we are awardedmay not be profitable.
Substantially all of our customers are government agencies. To market our services to government customers, we areoften required to respond to government RFPs, which may result in contract awards on a competitive basis. To do soeffectively, we must estimate accurately our cost structure for servicing a proposed contract, the time required to establishoperations and likely terms of the proposals submitted by competitors. We must also assemble and submit a large volume ofinformation within an RFP’s rigid timetable. Our ability to respond successfully to RFPs will greatly impact our business.There is no assurance that we will continue to obtain contracts in response to government RFPs and our proposals may notresult in profitable contracts. In addition, competitors may protest contracts awarded to us through the RFP process whichmay cause the award to be delayed or overturned or may require the customer to reinitiate the RFP process.
Government entities have in the past and may in the future terminate their contracts with us earlier than we expect,which may result in revenue shortfalls and unrecovered costs.
Many of our government contracts contain base periods of one or more years, as well as option periods coveringmore than half of the contract’s potential duration. Government agencies do not have to exercise these option periods, andthey may elect not to exercise them for budgetary, performance or any other reason. Our contracts also typically containprovisions permitting a government customer to terminate the contract on short notice, with or without cause. Terminationwithout cause provisions generally allow the government to terminate a contract at any time, and enable us to recover onlyour costs incurred or committed, and settlement expenses and profit, if any, on the work completed prior to termination. Wemay or may not be able to recover all the costs incurred during the start-up phase of a terminated contract. The unexpectedtermination of significant contracts could result in significant revenue shortfalls. If revenue shortfalls occur and are not offsetby corresponding reductions in expenses, our business could be adversely affected. We cannot anticipate if, when or to whatextent a customer might terminate its contracts with us.
If we are unable to manage our growth, our profitability will be adversely affected.
Sustaining our growth places significant demands on our management as well as on our administrative, operationaland financial resources. For us to continue to manage our growth, we must continue to improve our operational, financial andmanagement information systems and expand, motivate and manage our workforce. If our growth comes at the expense ofproviding quality service and generating reasonable profits, our ability to successfully bid for contracts and our profitabilitywill be adversely affected.
We rely on key contracts with state and local governments for a significant portion of our revenue. A substantialreduction in those contracts would materially adversely affect our operating results.
In fiscal year 2014, approximately 55% of our total revenue was derived from contracts with state and localgovernment agencies. Approximately 47% of our total revenue was derived from four customers: the U.S. FederalGovernment, the Australian Government and the States of California and Texas. Any significant disruption or deterioration inour relationship with state and local governments and a corresponding reduction in these contracts would significantly reduceour revenue and could substantially harm our business.
Government unions may oppose outsourcing of government programs to outside vendors such as us, which could limitour market opportunities and could impact us adversely. In addition, our unionized workers could disrupt ouroperations.
Our success depends in part on our ability to win profitable contracts to administer and manage health and humanservices programs traditionally administered by government employees. Many government employees, however, belong tolabor unions with considerable financial resources and lobbying networks. Unions have in the past applied, and are likely tocontinue to apply, political pressure on legislators and other officials seeking to outsource government programs. Unionopposition to these programs may result in fewer opportunities for us to service government agencies and/or longer and morecomplex procurements.
We do operate outsourcing programs using unionized employees in Canada. We have experienced opposition from
the union, which does not favor the outsourcing of government programs. As a result, we have received negative presscoverage as the union continues to oppose our program operations. Such press coverage and union opposition may have anadverse affect on the willingness of government agencies to outsource such projects as well as certain contracts that areoperated within a unionized environment. Our unionized workers could also declare a strike which could adversely affect ourperformance and financial results.

We may be precluded from bidding and performing certain work due to other work we currently perform.
Various laws and regulations prohibit companies from performing work for government agencies that might beviewed as an actual or apparent conflict of interest. These laws may limit our ability to pursue and perform certain types ofwork. For example, some of our businesses assist government agencies in developing RFPs for various governmentprograms. In those situations, the divisions involved in operating such programs would likely be precluded from bidding onthose RFPs. Similarly, regulations governing the independence of Medicaid enrollment brokers and Medicare appealproviders could prevent us from providing services to other organizations such as health plans.
We may lose executive officers and senior managers on whom we rely to generate business and execute projectssuccessfully.
The ability of our executive officers and our senior managers to generate business and execute projects successfullyis important to our success. The loss of an executive officer or senior manager could impair our ability to secure and manageengagements, which could harm our business, prospects, financial condition, results of operations and cash flows.
Inaccurate, misleading or negative media coverage could adversely affect our reputation and our ability to bid forgovernment contracts.
Because of the public nature of many of our business lines, the media frequently focus their attention on ourcontracts with government agencies. If the media coverage is negative, it could influence government officials to slow thepace of outsourcing government services, which could reduce the number of RFPs. The media also focus their attention onthe activities of political consultants engaged by us, and we may be tainted by adverse media coverage about their activities,even when those activities are unrelated to our business. Moreover, inaccurate, misleading or negative media coverage aboutus could harm our reputation and, accordingly, our ability to bid for and win government contracts.
We may be unable to attract and retain sufficient qualified personnel to sustain our business.
Our delivery of services is labor-intensive. When we are awarded a government contract, we must quickly hireproject leaders and case management personnel. The additional staff also creates a concurrent demand for increasedadministrative personnel. Our success requires that we attract, develop, motivate and retain:
• experienced and innovative executive officers; • senior managers who have successfully managed or designed government services programs; and • information technology professionals who have designed or implemented complex information technology
projects. Innovative, experienced and technically proficient individuals are in great demand and are likely to remain a limited
resource. There can be no assurance that we will be able to continue to attract and retain desirable executive officers andsenior managers. Our inability to hire sufficient personnel on a timely basis or the loss of significant numbers of executiveofficers and senior managers could adversely affect our business.
If we fail to establish and maintain important relationships with government entities and agencies, our ability tosuccessfully bid under RFPs may be adversely affected.
To facilitate our ability to prepare bids in response to RFPs, we rely in part on establishing and maintainingrelationships with officials of various government entities and agencies. These relationships enable us to provide informalinput and advice to the government entities and agencies prior to the development of an RFP. We also engage marketingconsultants, including lobbyists, to establish and maintain relationships with elected officials and appointed members ofgovernment agencies. The effectiveness of these consultants may be reduced or eliminated if a significant political changeoccurs. In that circumstance, we may be unable to successfully manage our relationships with government entities andagencies and with elected officials and appointees. Any failure to maintain positive relationships with government entitiesand agencies may adversely affect our ability to bid successfully in response to RFPs.

Our clients may limit or prohibit the outsourcing of certain programs or may refuse to grant consents and/or waiversnecessary to permit private entities, such as us, to perform certain elements of government programs.
Governments could limit or prohibit private contractors like MAXIMUS from operating or performing elements ofcertain programs. Within the U.S., state or local governments could be required to operate such programs with governmentemployees as a condition of receiving federal funding. Moreover, under current law, in order to privatize certain functions ofgovernment programs, the U.S. Federal Government must grant a consent and/or waiver to the petitioning state or localagency. If the Federal Government does not grant a necessary consent or waiver, the state or local agency will be unable tooutsource that function to a private entity, such as us. This situation could eliminate a contracting opportunity or reduce thevalue of an existing contract.
We may rely on subcontractors and partners to provide clients with a single-source solution.
From time to time, we may engage subcontractors, teaming partners or other third parties to provide our customerswith a single-source solution. While we believe that we perform appropriate due diligence on our subcontractors and teamingpartners, we cannot guarantee that those parties will comply with the terms set forth in their agreements or remain financiallysound. We may have disputes with our subcontractors, teaming partners or other third parties arising from the quality andtimeliness of the subcontractor’s work, customer concerns about the subcontractor or other matters. Subcontractorperformance deficiencies could result in a customer terminating our contract for default. We may be exposed to liability, andwe and our clients may be adversely affected if a subcontractor or teaming partner fails to meet its contractual obligations.
We face competition from a variety of organizations, many of which have substantially greater financial resourcesthan we do; we may be unable to compete successfully with these organizations.
Our primary competitors in the Health Services Segment market in the United States are Affiliated ComputerServices, a Xerox Company; Electronic Data Systems, an HP Company; and specialized private service providers. Ourprimary competitors in the Human Services Segment market include Serco, Atos Origin and other specialized consultingcompanies and non-profit organizations.
Many of these companies are national and international in scope, are larger than us, and have greater financial
resources, name recognition and larger technical staffs. Substantial resources could enable certain competitors to initiatesevere price cuts or take other measures in an effort to gain market share. In addition, we may be unable to compete for thelimited number of large contracts because we may not be able to meet an RFP’s requirement to obtain and post a largeperformance bond. Also, in some geographic areas, we face competition from smaller consulting firms with establishedreputations and political relationships. There can be no assurance that we will be able to compete successfully against ourexisting or any new competitors.
A number of factors may cause our cash flows and results of operations to vary from quarter to quarter.
Factors which may cause our cash flows and results of operations to vary from quarter to quarter include: • the terms and progress of contracts; • caseloads and other volume where revenue is derived on transactional volume on contracts; • the levels of revenue earned and profitability of fixed-price and performance-based contracts; • expenses related to certain contracts which may be incurred in periods prior to revenue being recognized; • the commencement, completion or termination of contracts during any particular quarter; • the schedules of government agencies for awarding contracts; • the timing of change orders being signed;

• the terms of awarded contracts; and • potential acquisitions. Changes in the volume of activity and the number of contracts commenced, completed or terminated during any
quarter may cause significant variations in our cash flows and results of operations because a large amount of our expensesare fixed.
We are subject to the risks of doing business internationally.
For the year ended September 30, 2014, 23% of our revenue was driven from jurisdictions outside the U.S. Thisshare of business is likely to increase in fiscal year 2015 owing to two new contracts in the United Kingdom. As a result, asignificant portion of our business operations are subject to foreign financial, tax and business risks which could arise in theevent of:
• foreign exchange fluctuations; • unexpected increases in tax rates or changes in U.S. or foreign tax laws; • non-compliance with international laws and regulations, such as data privacy, employment regulations and
trade barriers; • non-compliance with U.S. laws affecting the activities of U.S. companies in international locations
including the Foreign Corrupt Practices Act; • the absence in some jurisdictions of effective laws to protect our intellectual property rights; • new regulatory requirements or changes in local laws that materially affect the demand for our services or
directly affect our foreign operations; • local economic and political conditions including severe or protracted recessions in foreign economies and
inflation risk; • the length of payment cycles and potential difficulties in collecting accounts receivable; • unusual or unexpected monetary exchange controls, price controls or restrictions on transfers of cash; or • civil disturbance, terrorism or other catastrophic events that reduce business activity in other parts of the
world. These factors may lead to decreased revenues and profits and therefore have a material adverse effect on our
business, financial condition and results of operations.
Much of our cash is held in jurisdictions outside the United States. If we needed to remit these funds to the UnitedStates, we may incur significant taxation expense.
At September 30, 2014, our foreign subsidiaries held approximately $173 million of cumulative earnings. Weconsider undistributed earnings of our foreign subsidiaries to be indefinitely reinvested outside of the United States and,accordingly, no U.S. deferred taxes have been recorded with respect to such earnings in accordance with the relevantaccounting guidance for income taxes. Should the earnings be remitted as dividends, we may be subject to additional U.S.taxes, net of allowable foreign tax credits. It is not practicable to estimate the amount of any additional taxes which may bepayable on the undistributed earnings given the various tax planning alternatives we could employ should we decide torepatriate these earnings in a tax efficient manner. As of September 30, 2014, our foreign subsidiaries held approximately$95 million of cash and cash equivalents. In November 2014, we remitted $32 million from an international subsidiary to theU.S. as a return of capital on a tax-free basis.

Our Articles of Incorporation and bylaws include provisions that may have anti-takeover effects.
Our Articles of Incorporation and bylaws include provisions that may delay, deter or prevent a takeover attempt thatshareholders might consider desirable. For example, our Articles of Incorporation provide that our directors are to be dividedinto three classes and elected to serve staggered three-year terms. This structure could impede or discourage an attempt toobtain control of MAXIMUS by preventing stockholders from replacing the entire board in a single proxy contest, making itmore difficult for a third party to take control of MAXIMUS without the consent of our Board of Directors. Our Articles ofIncorporation further provide that our shareholders may not take any action in writing without a meeting. This prohibitioncould impede or discourage an attempt to obtain control of MAXIMUS by requiring that any corporate actions initiated byshareholders be adopted only at properly called shareholder meetings.