Embed Size (px)
Citation preview
U N I T E D S T A T E S SEPTEMBER 24, 2002
F I X E D I N C O M E
R E S E A R C H
Asset-Backed Securities UNITED STATES
Mary E. Kane (212) 816-8409 [email protected]
New York
This report can be accessed electronically via:
➤ SSB Direct
➤ Yield Book
Please contact your salesperson to receive SSB fixed-income research electronically.
Student Loan ABS Primer Education — The Investment of a Lifetime
➤ The US Department of Education reinsures FFELP loans, conveying an explicit federal guaranty.
➤ Student loans are an important sector of the ABS market, with over $10 billion in supply in 2001. In fiscal year 2003, students and their parents are expected to take out 10 million student loans totaling $40.7 billion under federal student loan programs.
➤ Student loan default rates have been declining since 1998, when Congress further restricted the discharge of most student loan debt in personal bankruptcy.
➤ Bachelor’s degree recipients earn 80% more than those with only a high school diploma. Over a lifetime, this difference exceeds $1 million.
➤ About 29% of today’s jobs require some level of advanced education, but not a college degree. A vocational program or associate’s degree teaching technical skills can also lead to gainful employment.
September 24, 2002 Student Loan ABS Primer
Contents
Executive Summary ......................................................................................................................... 3
Introduction...................................................................................................................................... 5 Student Loan Classifications............................................................................................................. 10 The Student Loan ABS Market......................................................................................................... 21 Defaults, Loss Curves and Prepayments............................................................................................ 24 Generic Student Loan Structures....................................................................................................... 30 Risks Assessment ............................................................................................................................. 35 Appendix. FFELP Terms.................................................................................................................. 42
Figures Figure 1. Median Household Income in 1999 Versus Completed Education Levels ......................................................................................... 6 Figure 2. Estimated Student Aid by Source for Academic Year 2000–2001 (Current Dollars in Billions) ......................................................... 8 Figure 3. Average Tuition and Fee Changes (Enrolment Weighted) in Constant Dollars, 1990–2001 ............................................................. 8 Figure 4. Distribution of Undergraduate Students at Four-Year Institutions in 2001–2002 by Tuition and Fees Charged ............................... 9 Figure 5. Consolidation Loan Program — Amounts and Applicable Terms..................................................................................................... 11
Figure 6. FFELP Annual Commitment Volume a ............................................................................................................................................. 13 Figure 7. Stafford Loan Annualized Lifetime Loan Limits................................................................................................................................. 14 Figure 8. Representative Financial Aid Packages............................................................................................................................................ 14 Figure 9. Largest FFELP Guarantors First Six Months of 2001 and 2002 .................................................................................................. 17 Figure 10. Largest Originators of FFELP Loans Federal Fiscal Years 2000 and 2001 (Dollars in Millions)............................................... 19 Figure 11. Largest FFELP Holders (Dollars in Millions), 30 Sep 01................................................................................................................. 19 Figure 12. Student Loan ABS New-Issue Volume, 1991–June 2002 (Dollars in Billions) ............................................................................... 21 Figure 13. Largest Student Loan ABS Issuers (Dollars in Millions), 1992–2002 ............................................................................................. 22 Figure 14. Sallie Mae LIBOR Floater New Issue Pricing Jun 99–Aug 02 ........................................................................................................ 23 Figure 15. Default Percentages on FFELP Loans (Excluding Consolidation Loans) 1966–2000 ................................................................... 24 Figure 16. Student Loan Loss Curve — Rating Agencies Stress 100% in Three Years ................................................................................. 25 Figure 17. FFELP Loan Volume Commitments for Subsidized and Unsubsidized Stafford Loans, Plus Loans, and Consolidation Loans,
1997–2000 (Dollars in Thousands)................................................................................................................................................ 26 Figure 18. Sallie Mae Transaction Speeds From 1995–1 to 2002-2 as of Jul 02 ............................................................................................ 27 Figure 19. Default Percentages on FFELP Loans (Excluding Consolidation Loans) 1966–2000 ................................................................... 27 Figure 20. Sallie Mae Transactions’ Prepay Curves From 1995-1 to 2002-2 as of Jul 02 .............................................................................. 28 Figure 21. Sallie Mae 200-4 (A1): Yield, Price, and Cash-Flow Effects of Pricing Speeds ............................................................................. 29 Figure 22. Three- Month LIBOR Versus Three- Months Treasury Bill Yield Differentials, Aug 95–Aug 02 .................................................... 29
Figure 23. Student Loan ABS Security Structurea ........................................................................................................................................... 31 Figure 24. Available Funds Rate Calculation (Percent) ................................................................................................................................... 33 Figure 25. Stafford Loan Cohort Default Rates by School Type 1985-1999.................................................................................................... 41 Figure 26. FFELP Interest Payment Methods .................................................................................................................................................. 44 Figure 27. Special Allowance Margins, 25 Jul 02............................................................................................................................................. 44 Figure 28. Borrower Rates, 30 Jun 02.............................................................................................................................................................. 45 Figure 29. FFELP Principal Payment Terms .................................................................................................................................................... 46
Acknowledgements: The authors would like to thank Ana Edwards for her cheerful assistance in preparing this report. We would also like to thank Jordan Erenrich, a summer intern, for his contribution to the research for this report.

September 24, 2002 Student Loan ABS Primer
3
The US Department of Education facilitates attractive loan
financing to students and their parents by subsidizing the loan cost
to a private-sector lender.
FFELP Loans — Reinsured by the US Department of Education
Federal Family Education Loan Program (FFELP) loans are originated by eligible lenders and 98% guaranteed by state-designated guarantors. The US Department of Education (DOE) reinsures FFELP loans between 95% and 100% of principal and interest (depending on the origination date). If the guarantor encounters problems, the DOE stands behind them, providing explicit federal support for these loans.
Liquid and High-Quality ABS — Typically Floaters
Most student-loan ABSs are triple-A-rated floaters. The credit enhancement is typically subordination of a single-A-rated class subordinated in cash flow to the triple-A sequential classes. The underlying interest rate to the students is floating, resetting once a year, (effective from July 1 to June 30) at a spread over Treasury bills. However, the interest rate to ABS investors benchmarks to either three-month LIBOR or Treasury bills. After January 1, 2000, the special allowance payment (SAP) subsidy for lenders benchmarks to three-months commercial paper rates instead of to Treasury-bill rates. This change in benchmark reduces the basis risk to the lender, as well as to ABS investors. For LIBOR-indexed transactions, the trust executes a basis swap to fully eliminate the basis risk to investors.
Repayment Period Up to Ten Years
Students pay interest only while in school. Undergraduate students may continue to pay interest only and borrow additional money for graduate school. Upon graduation, the student will repay the loan over a ten-year period. The interest rate would continue to float annually, resetting each July 1.
Consolidation Loans: Fixed Rate and Repayment to 30 Years
Students have a one-time option to convert all outstanding student indebtedness to a consolidation loan at a fixed interest rate up to 30 years. The aggregation of loans may allow the student to qualify for a longer repayment period than repaying individual loans separately. Refinancing via the consolidation loan program acts as a prepayment in conventional student loan pools.
Speeds Generally Stable
Student-loan ABSs typically price at 7% CPR and generally have been paying more slowly, between 4% and 6% CPR. However, some Sallie Mae transactions have been paying exceptionally fast in the past few quarters as a result of increasing proportions of students exercising their right to consolidate their loans at a fixed interest rate. The current consolidation wave has resulted from the uniquely low interest-rate environment. We expect speeds to revert to more typical levels once there is clarity in Fed policy and the interest-rate environment. Speed variability has little impact on typical floaters.

September 24, 2002 Student Loan ABS Primer
4
Rejected Claims Represent Principal Risk
The principal risk of student-loan ABSs backed by FFELP loans is that servicing error will result in uncured, rejected claims. However, rejected claims are usually curable, and rejected, uncured claims are usually relatively minimal.
September 24, 2002 Student Loan ABS Primer
5
Introduction
Post-secondary education has taken on crucial importance in today’s society. Young adults face advances in technology, information, and globalization unimaginable to earlier generations. In this knowledge-based economy, demand for low-skilled, less-educated labor is increasingly giving way to demand for highly skilled, well-educated workers. Good jobs will go to those with strong academic and technical skills, especially in math, science, and technology, and in the ability to reason, solve problems, and communicate effectively.
Economically speaking, post-secondary education returns tangible cash flows to those that invest in further education. Recent Census Bureau data indicate that individuals with a bachelor’s degree or higher earn nearly twice as much as those with only a high school diploma. Over a lifetime, this difference exceeds $1 million.1 Furthermore, the unemployment rate for adults with post-secondary education is less than half that of high school graduates.2 Therefore, obligors with advanced education have the potential to be good credit risks.
Jobs that once required at most a high school education now increasingly require some post-secondary education. In addition, occupations that were once open to individuals without any post-secondary education increasingly require such education. For example, 30 years ago individuals with no more education than the completion of high school filled about half of white-collar office jobs. Today, less than one-third of those jobs are held by someone with no more than a high school diploma.3 Jobs that require skills associated with having an undergraduate degree are expected to grow at a faster rate than jobs that do not require such training.4
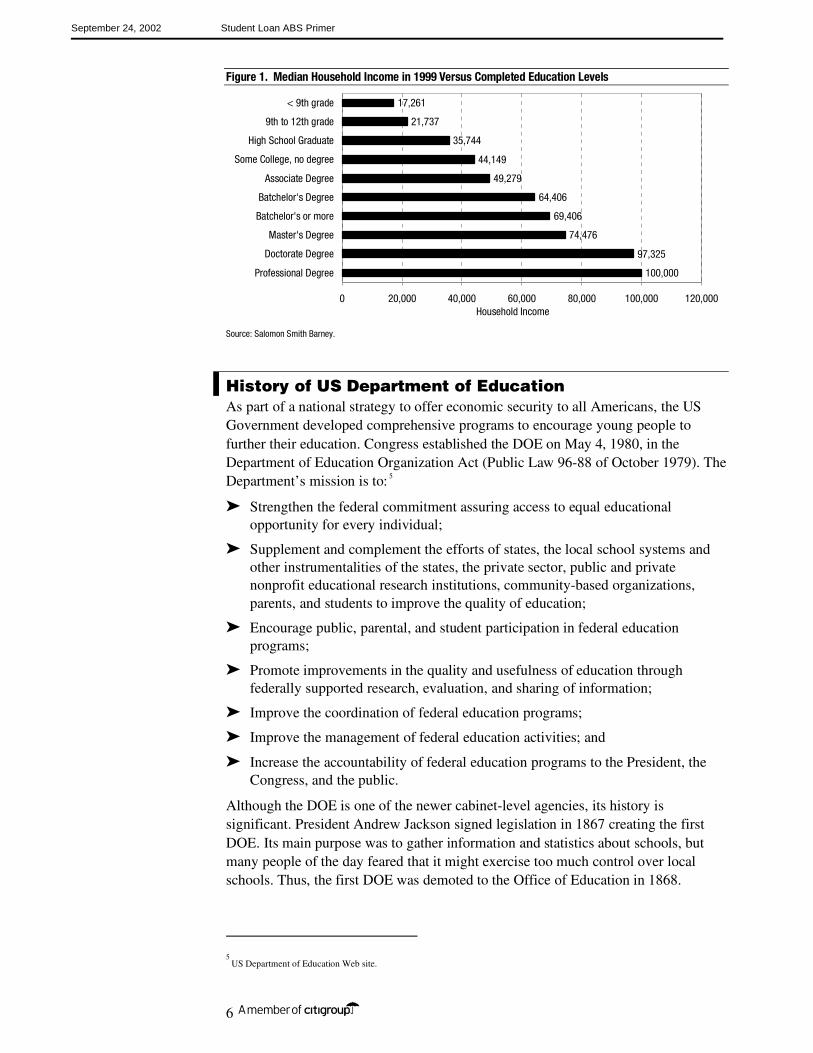
Moreover, the difference in earnings between high school graduates and college-educated workers has doubled since 1979. We show the dramatic link between income and education in Figure 1. The figure shows that the median household income (in 1999) for a college graduate was $64,400, while it was $35,700 for a high school graduate. Individuals earn 80% more income, on average, when they have completed a bachelor’s degree. It is little wonder that the number of Americans choosing to pursue higher education is growing; the financial rewards are tangible, and the return on investment is significant.
1 “High Schools and Transition into the Workforce,” statement of Susan B. Neuman, Assistant Secretary for Elementary and Secondary before the House Subcommittee on Labor/ Education Appropriations, April 25, 2002.
2 Ibid.
3 Ibid.
4 Ibid.
Post-secondary education returns
tangible cash flows.
Bachelor’s degree recipients earn 80% more
income, on average.
September 24, 2002 Student Loan ABS Primer
6
Figure 1. Median Household Income in 1999 Versus Completed Education Levels
100,000
97,325
74,476
69,406
64,406
49,279
44,149
35,744
21,737
17,261
0 20,000 40,000 60,000 80,000 100,000 120,000
Professional Degree
Doctorate Degree
Master's Degree
Batchelor's or more
Batchelor's Degree
Associate Degree
Some College, no degree
High School Graduate
9th to 12th grade
< 9th grade
Household Income
Source: Salomon Smith Barney.
History of US Department of Education As part of a national strategy to offer economic security to all Americans, the US Government developed comprehensive programs to encourage young people to further their education. Congress established the DOE on May 4, 1980, in the Department of Education Organization Act (Public Law 96-88 of October 1979). The Department’s mission is to: 5
➤ Strengthen the federal commitment assuring access to equal educational opportunity for every individual;
➤ Supplement and complement the efforts of states, the local school systems and other instrumentalities of the states, the private sector, public and private nonprofit educational research institutions, community-based organizations, parents, and students to improve the quality of education;
➤ Encourage public, parental, and student participation in federal education programs;
➤ Promote improvements in the quality and usefulness of education through federally supported research, evaluation, and sharing of information;
➤ Improve the coordination of federal education programs;
➤ Improve the management of federal education activities; and
➤ Increase the accountability of federal education programs to the President, the Congress, and the public.
Although the DOE is one of the newer cabinet-level agencies, its history is significant. President Andrew Jackson signed legislation in 1867 creating the first DOE. Its main purpose was to gather information and statistics about schools, but many people of the day feared that it might exercise too much control over local schools. Thus, the first DOE was demoted to the Office of Education in 1868.
5
US Department of Education Web site.
September 24, 2002 Student Loan ABS Primer
7
Over the years, the office remained relatively small, operating under different titles and housed in various government agencies, including the US Department of the Interior and the former US Department of Health, Education, and Welfare (now the US Department of Health and Human Services). Beginning in the 1950s, political and social changes resulted in expanded federal funding of education. The expansion of programs continued in the 1970s with national efforts to help racial minorities, women, people with disabilities, and non-English-speaking students gain equal access to education. In October 1979, Congress passed the US Department of Education Organization Act, and in May 1980, the new agency began operations.
Higher Education Demand on An Uptick More young Americans are enrolling in post-secondary education than ever before because of population increases and a greater proportion of students pursuing degrees. The Bureau of Labor Statistics projections for 2010 indicate that 70% of the fastest-growing jobs in the economy (e.g., computer support professionals, paralegals and legal assistants, and health occupations) will require some type of education and training beyond high school. Of these, 21% will require a bachelor's degree or higher.6
Alternatively, vocational and technical education offers attractive career choices, as well. This segment of the student population has also grown significantly over the past decade. About 29% of today’s jobs require some level of post-secondary education, but only a small percentage require a baccalaureate degree. For most students, obtaining a strong set of written and oral communication skills linked with specific technical skills through an associate’s degree can also successfully lead to gainful employment.
In order to keep pace with the demand for higher education, the US Government is allocating significant resources to this cause. The private sector supplements these resources. The government provides the majority of its aid through loan guarantees to private institutions that actually make the loans to students or their parents. The loan guarantees fall under the FFELP program. In fiscal year 2003, the DOE is forecasting that students and their parents will take out 10 million student loans totaling $40.7 billion under the FFELP and Federal Direct Student Loan Program.7
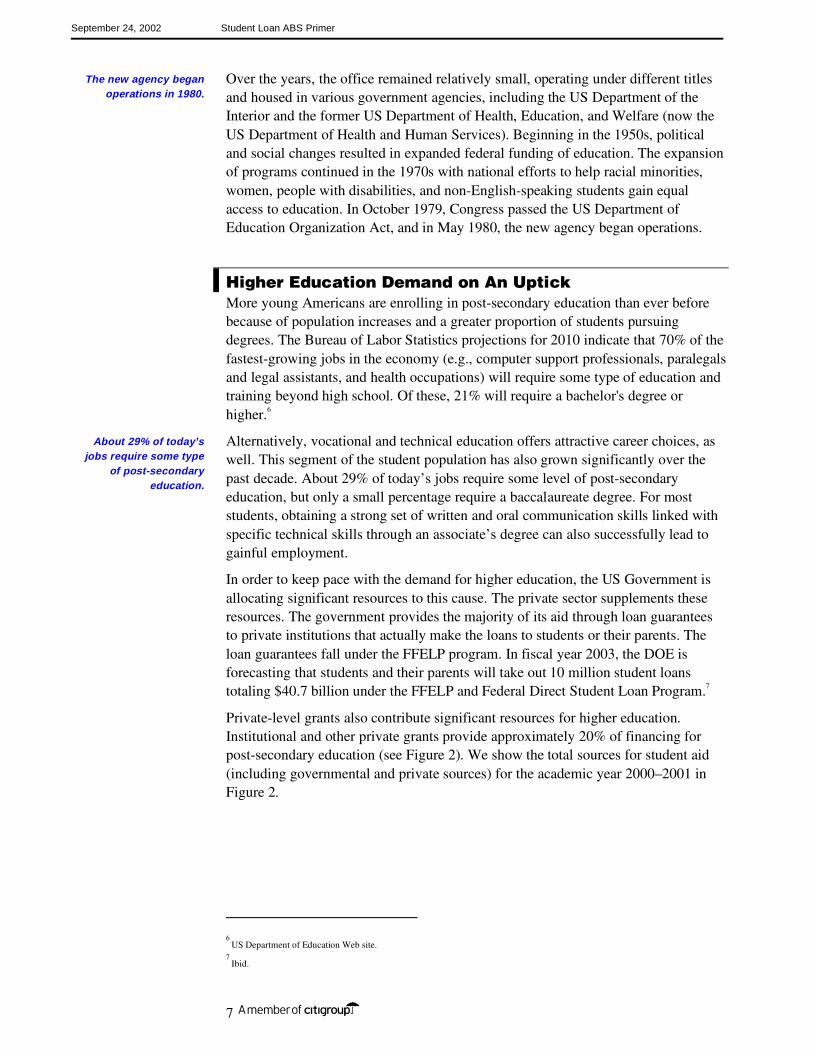
Private-level grants also contribute significant resources for higher education. Institutional and other private grants provide approximately 20% of financing for post-secondary education (see Figure 2). We show the total sources for student aid (including governmental and private sources) for the academic year 2000–2001 in Figure 2.
6
US Department of Education Web site. 7
Ibid.
The new agency began operations in 1980.
About 29% of today’s jobs require some type
of post-secondary education.
September 24, 2002 Student Loan ABS Primer
8
Figure 2. Estimated Student Aid by Source for Academic Year 2000–2001 (Current Dollars in Billions)
Federal andOther Loans
49%
Institutional andOther Grants
20%
Federal Pell Grants11%
State Grants6%
Nonfederal Loans6%Other Federal Programs
4%Federal Campus-Based
4%
Sources: Trends in Student Aid 2001, The College Board, New York N.Y.
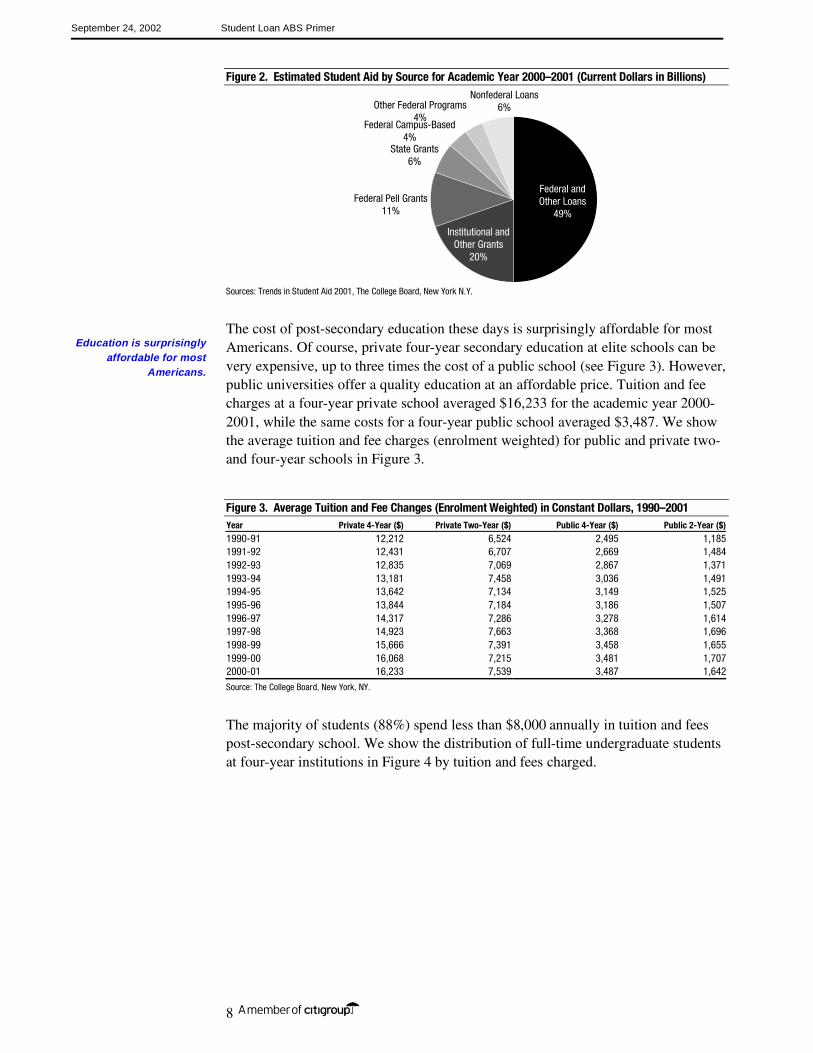
The cost of post-secondary education these days is surprisingly affordable for most Americans. Of course, private four-year secondary education at elite schools can be very expensive, up to three times the cost of a public school (see Figure 3). However, public universities offer a quality education at an affordable price. Tuition and fee charges at a four-year private school averaged $16,233 for the academic year 2000-2001, while the same costs for a four-year public school averaged $3,487. We show the average tuition and fee charges (enrolment weighted) for public and private two- and four-year schools in Figure 3.
Figure 3. Average Tuition and Fee Changes (Enrolment Weighted) in Constant Dollars, 1990–2001 Year Private 4-Year ($) Private Two-Year ($) Public 4-Year ($) Public 2-Year ($)
1990-91 12,212 6,524 2,495 1,1851991-92 12,431 6,707 2,669 1,4841992-93 12,835 7,069 2,867 1,3711993-94 13,181 7,458 3,036 1,4911994-95 13,642 7,134 3,149 1,5251995-96 13,844 7,184 3,186 1,5071996-97 14,317 7,286 3,278 1,6141997-98 14,923 7,663 3,368 1,6961998-99 15,666 7,391 3,458 1,6551999-00 16,068 7,215 3,481 1,7072000-01 16,233 7,539 3,487 1,642
Source: The College Board, New York, NY.
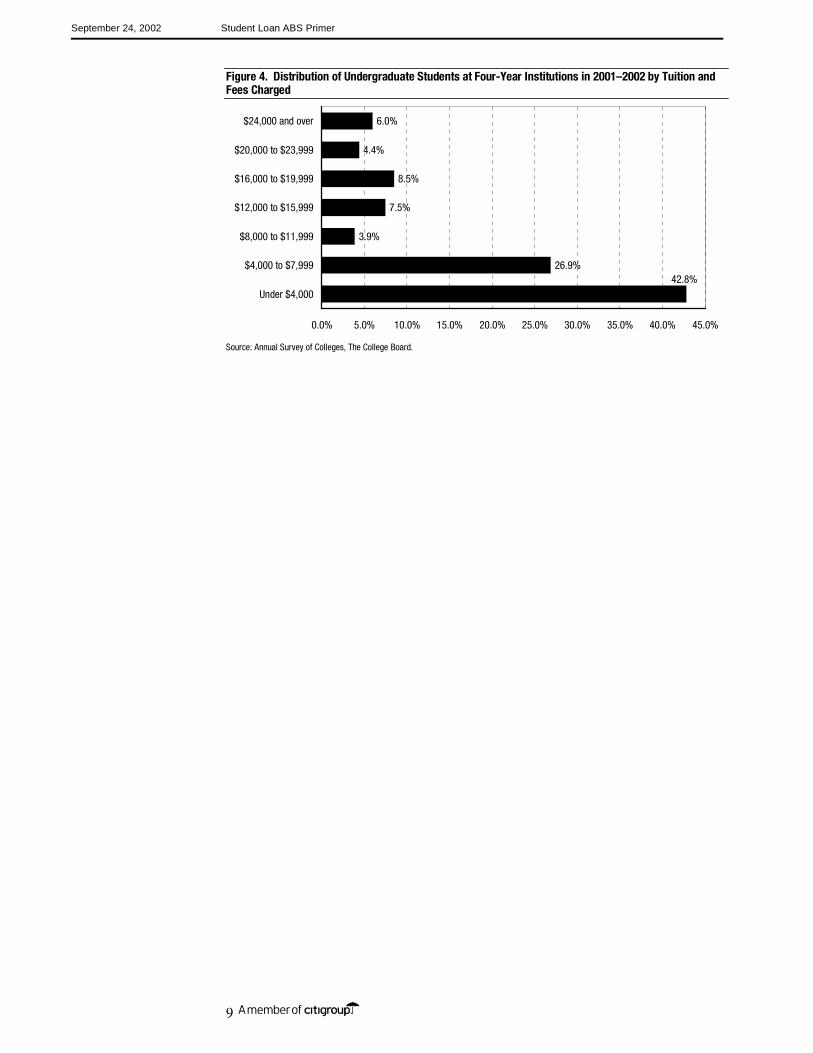
The majority of students (88%) spend less than $8,000 annually in tuition and fees post-secondary school. We show the distribution of full-time undergraduate students at four-year institutions in Figure 4 by tuition and fees charged.
Education is surprisingly affordable for most
Americans.
September 24, 2002 Student Loan ABS Primer
9
Figure 4. Distribution of Undergraduate Students at Four-Year Institutions in 2001–2002 by Tuition and Fees Charged
26.9%
3.9%
7.5%
8.5%
4.4%
6.0%
42.8%
0.0% 5.0% 10.0% 15.0% 20.0% 25.0% 30.0% 35.0% 40.0% 45.0%
Under $4,000
$4,000 to $7,999
$8,000 to $11,999
$12,000 to $15,999
$16,000 to $19,999
$20,000 to $23,999
$24,000 and over
Source: Annual Survey of Colleges, The College Board.
September 24, 2002 Student Loan ABS Primer
10
Student Loan Classifications
The student loan industry operates through a unique collaboration of federal and state agencies and not-for profit and for-profit corporations. These entities originate, service, and guaranty student loans under the federally sponsored student loan program known as the Federal Family Education Loan Program (FFELP). On a smaller scale, privately sponsored supplemental loan programs have developed to fund the gaps in federally sponsored aid. The following explains, in detail, the various loan programs and participants.
1 Federally sponsored loans. Federally insured student loans have protection against default via principal insurance of 98% or 100%, ultimately guaranteed by the DOE.
2 Non-federally sponsored loans. Privately insured student loans are not guaranteed by the DOE, and only have protection against default via the guaranty of private companies or from reserves pledged to the securitization.
As the majority of student-loan-backed securitizations are composed of federally and privately insured loans, we discuss the attributes of these two collateral types.
Federally Sponsored Loans The FFELP, formerly known as the Guaranteed Student Loan Program, is authorized by Title IV of the Higher Education Act of 1965. Since its inception in 1966, the FFELP has provided students with about $343 billion8 of loan commitments to finance the cost of post-secondary academic and vocational training.
The DOE facilitates attractive loan financing for students by subsidizing the difference between the loan rate and the market cost to the lender. The interest rate on the majority of FFELP loans is floating, and resets only once a year — effective from July 1 to June 30. The new applicable interest rate set in May 2002 is at historically low levels. FFELP student loans are 98% guaranteed by the US Department of Education. The index for these FFELP student loans is the yield on the 91-day US Treasury bill, plus the applicable spread, depending on the program. The T-bill yield is based on the results of the Treasury auction in the last week of May.
For example, the new rates for FFELP loans originated between July 1998 and June 2002 will be 91-day T-bills plus 1.70% when the borrower is in school (repaying interest only) and + 2.30% when the borrower is in the repayment period. Undergraduate students may continue to pay interest only and borrow additional money for graduate school. Upon graduation, the student will repay the loan over a ten-year period. The interest rate on that loan would continue to float annually, resetting each July 1.
8
Sallie Mae Fact Sheet, September 30, 2001.
The May Treasury-bill auction determines the
new annual FFELP loans reset rate.
September 24, 2002 Student Loan ABS Primer
11
FFELP Loan Types
The FFELP has four major types of loans:
1 Subsidized Stafford loans
2 Unsubsidized Stafford loans
3 Parental Loans for Undergraduate Students (PLUS)
4 Consolidation loans
The subsidized Stafford loan is the basic FFELP loan type, making up 49.0% of FFELP fiscal year 2000 commitment volume. Because the DOE pays loan interest while borrowers are attending school, students must meet a family income means test to be eligible for the program, and Congress sets annual and lifetime borrowing limits to maximize the number of students able to access the program. The unsubsidized Stafford loan program was created in 1992 to serve dependent students with family income or assets that make them ineligible for subsidized Stafford loans, and for dependent and independent students who have exhausted their borrowing capacity under the subsidized Stafford loan program. Except for different loan limits and eligibility for interest-rate subsidies, subsidized and unsubsidized Stafford loans have similar terms.
PLUS loans are loans to parents of dependent students. Parents may borrow up to the sum of their required parental contribution to the student’s financial aid package and any unmet financial need remaining after the student’s other sources of financial aid are exhausted. Beginning July 1, 1993, parents were required to have a satisfactory credit history to receive a PLUS loan.
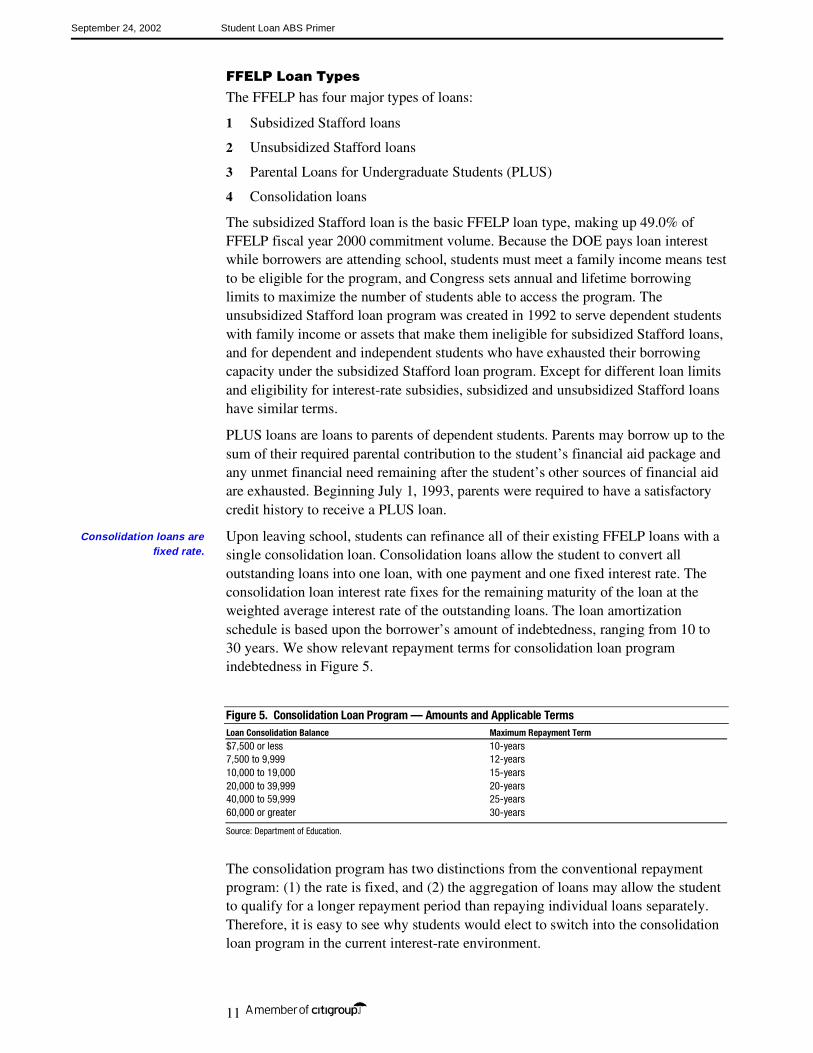
Upon leaving school, students can refinance all of their existing FFELP loans with a single consolidation loan. Consolidation loans allow the student to convert all outstanding loans into one loan, with one payment and one fixed interest rate. The consolidation loan interest rate fixes for the remaining maturity of the loan at the weighted average interest rate of the outstanding loans. The loan amortization schedule is based upon the borrower’s amount of indebtedness, ranging from 10 to 30 years. We show relevant repayment terms for consolidation loan program indebtedness in Figure 5.
Figure 5. Consolidation Loan Program — Amounts and Applicable Terms Loan Consolidation Balance Maximum Repayment Term
$7,500 or less 10-years 7,500 to 9,999 12-years 10,000 to 19,000 15-years 20,000 to 39,999 20-years 40,000 to 59,999 25-years 60,000 or greater 30-years
Source: Department of Education.
The consolidation program has two distinctions from the conventional repayment program: (1) the rate is fixed, and (2) the aggregation of loans may allow the student to qualify for a longer repayment period than repaying individual loans separately. Therefore, it is easy to see why students would elect to switch into the consolidation loan program in the current interest-rate environment.
Consolidation loans are fixed rate.
September 24, 2002 Student Loan ABS Primer
12
Low consolidation loan rates do not penalize the lenders, who remain entitled to special allowance payments (SAP). The SAP benchmarks to the conventional student loan floating rates. If the fixed rate consolidation loan rate is less than the conventional student loan floating rate, the lender is entitled to receive the difference, in the form of an SAP.
FFELP Program Supply and Participation
The FFELP was a broad-based middle-class entitlement program through the 1970s. Rapid inflation of college costs and budgetary constraints during the 1980s, however, increasingly forced the program to concentrate on the borrowing needs of the most needy students. By the 1989–1990 school year, only 16% of American students received Stafford loans, with Stafford loans making up just 25% of the average financial aid package. Extensive program amendments in 1992 and 1993, however, lifted program participation rates to 52.8% of full-time students by the 1995–1996 school year.
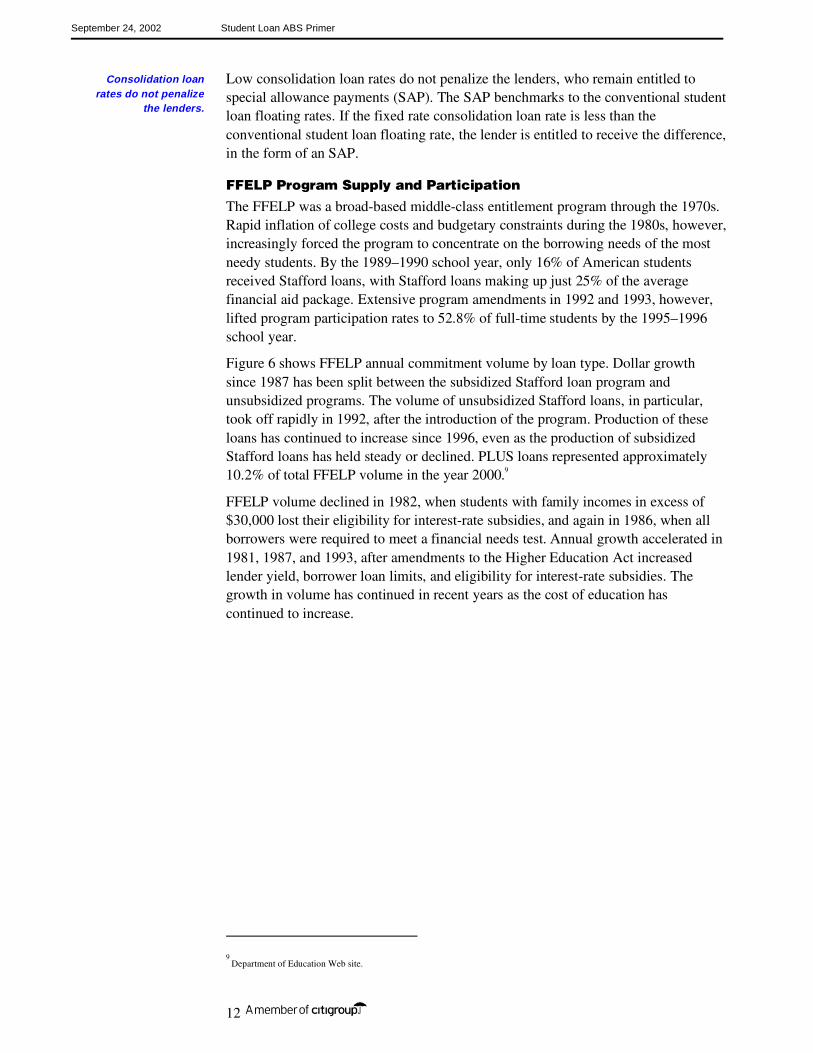
Figure 6 shows FFELP annual commitment volume by loan type. Dollar growth since 1987 has been split between the subsidized Stafford loan program and unsubsidized programs. The volume of unsubsidized Stafford loans, in particular, took off rapidly in 1992, after the introduction of the program. Production of these loans has continued to increase since 1996, even as the production of subsidized Stafford loans has held steady or declined. PLUS loans represented approximately 10.2% of total FFELP volume in the year 2000.9
FFELP volume declined in 1982, when students with family incomes in excess of $30,000 lost their eligibility for interest-rate subsidies, and again in 1986, when all borrowers were required to meet a financial needs test. Annual growth accelerated in 1981, 1987, and 1993, after amendments to the Higher Education Act increased lender yield, borrower loan limits, and eligibility for interest-rate subsidies. The growth in volume has continued in recent years as the cost of education has continued to increase.
9
Department of Education Web site.
Consolidation loan rates do not penalize
the lenders.
September 24, 2002 Student Loan ABS Primer
13
Figure 6. FFELP Annual Commitment Volume a
0
5,000
10,000
15,000
20,000
25,000
30,000
1979 1981 1983 1985 1987 1989 1991 1993 1995 1997 1999
PLUSSLSUnsubsidized StaffordSubsidized Stafford
a Federal Fiscal year ending September 30,2000. Dollars in billions. The SLS program was merged into the unsubsidized Stafford program on July 1, 1994. Source: US Department of Education.
Privately Insured Loan Programs Students enrolled in expensive private institutions or lengthy graduate or professional degree programs often exhaust their FFELP borrowing capacity and need additional loans to cover their remaining financial need. Parents who wish to spread payment of their required parental contribution over several years or avoid liquidating appreciated assets also take out loans to finance their required contribution to student expenses.
A number of alternative, private, or supplemental loan programs are sponsored by not-for-profit 501(c)(3) corporations10 affiliated with networks of private universities and graduate and professional schools. Access Group, Inc., a Delaware nonstock corporation based in Wilmington, is a membership organization, whose members include state-operated and nonprofit American Bar Association-approved law schools located in the United States. Until July 1, 1998, Access was a loan marketing organization that received marketing fees from a lender for allowing the lender to make loans to students attending Access member schools. KeyCorp has securitized Access Program Loans since 1993. Access now retains the right to purchase and finance the loans from the program lender and also entered the bond market in 2000.
Supplemental lenders generally limit themselves to program design and marketing, contracting-out underwriting, servicing, and funding to high-volume, third-party servicers, such as PHEAA and USA Group Loan Services, Inc., both of which service FFELP portfolios for a number of student-loan ABS issuers.
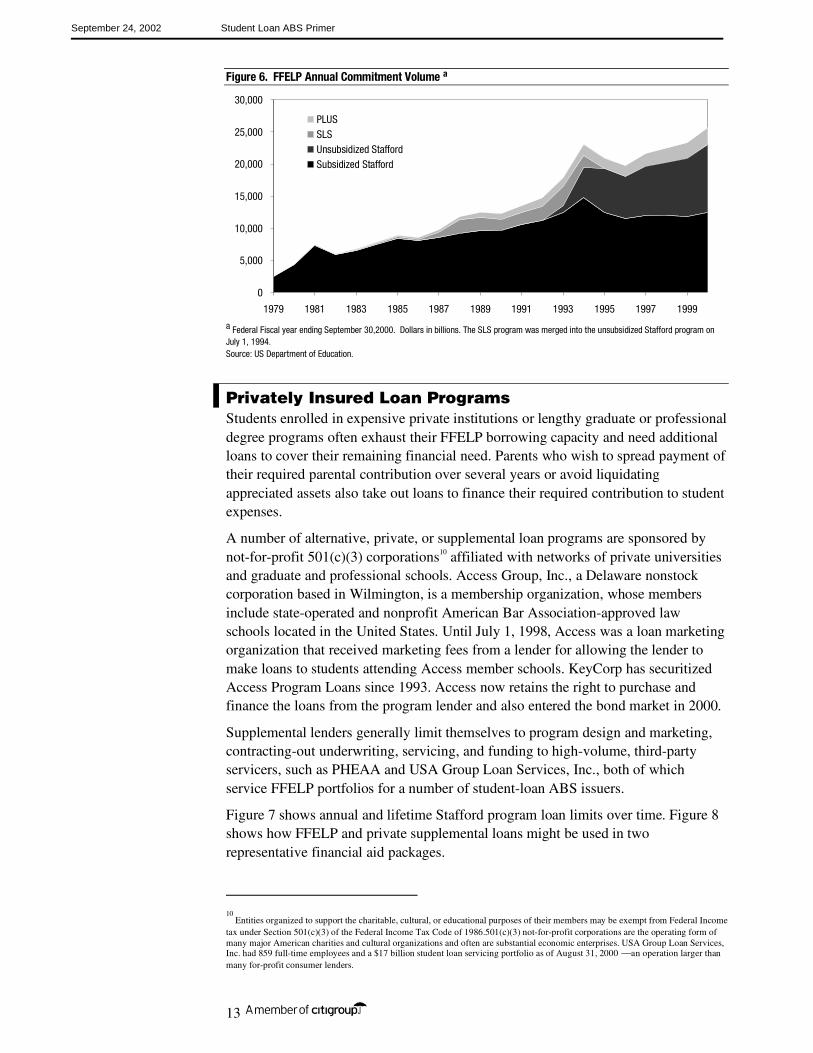
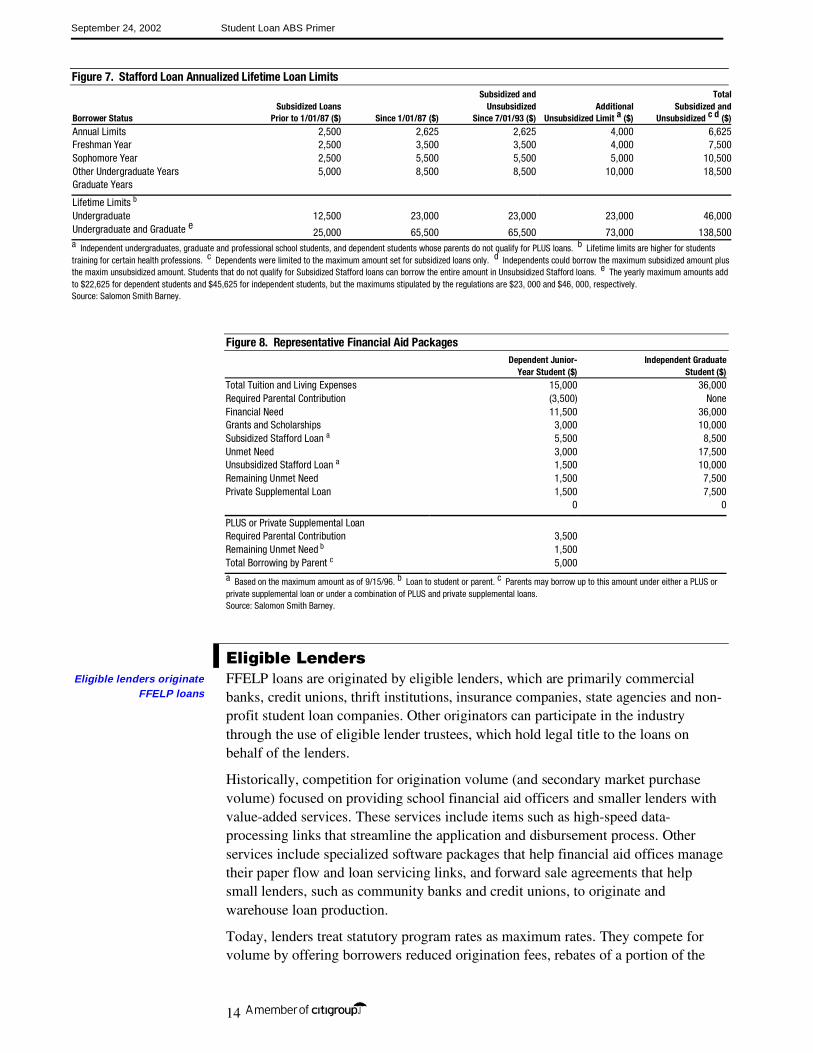
Figure 7 shows annual and lifetime Stafford program loan limits over time. Figure 8 shows how FFELP and private supplemental loans might be used in two representative financial aid packages.
10
Entities organized to support the charitable, cultural, or educational purposes of their members may be exempt from Federal Income tax under Section 501(c)(3) of the Federal Income Tax Code of 1986.501(c)(3) not-for-profit corporations are the operating form of many major American charities and cultural organizations and often are substantial economic enterprises. USA Group Loan Services, Inc. had 859 full-time employees and a $17 billion student loan servicing portfolio as of August 31, 2000 an operation larger than many for-profit consumer lenders.
September 24, 2002 Student Loan ABS Primer
14
Figure 7. Stafford Loan Annualized Lifetime Loan Limits Subsidized and Total Subsidized Loans Unsubsidized Additional Subsidized andBorrower Status Prior to 1/01/87 ($) Since 1/01/87 ($) Since 7/01/93 ($) Unsubsidized Limit a ($) Unsubsidized c d ($)
Annual Limits 2,500 2,625 2,625 4,000 6,625Freshman Year 2,500 3,500 3,500 4,000 7,500Sophomore Year 2,500 5,500 5,500 5,000 10,500Other Undergraduate Years 5,000 8,500 8,500 10,000 18,500Graduate Years Lifetime Limits b Undergraduate 12,500 23,000 23,000 23,000 46,000Undergraduate and Graduate e 25,000 65,500 65,500 73,000 138,500a Independent undergraduates, graduate and professional school students, and dependent students whose parents do not qualify for PLUS loans. b Lifetime limits are higher for students training for certain health professions. c Dependents were limited to the maximum amount set for subsidized loans only. d Independents could borrow the maximum subsidized amount plus the maxim unsubsidized amount. Students that do not qualify for Subsidized Stafford loans can borrow the entire amount in Unsubsidized Stafford loans. e The yearly maximum amounts add to $22,625 for dependent students and $45,625 for independent students, but the maximums stipulated by the regulations are $23, 000 and $46, 000, respectively. Source: Salomon Smith Barney.
Figure 8. Representative Financial Aid Packages Dependent Junior- Independent Graduate Year Student ($) Student ($)Total Tuition and Living Expenses 15,000 36,000 Required Parental Contribution (3,500) NoneFinancial Need 11,500 36,000Grants and Scholarships 3,000 10,000Subsidized Stafford Loan a 5,500 8,500Unmet Need 3,000 17,500Unsubsidized Stafford Loan a 1,500 10,000Remaining Unmet Need 1,500 7,500Private Supplemental Loan 1,500 7,500 0 0
PLUS or Private Supplemental Loan Required Parental Contribution 3,500Remaining Unmet Need b 1,500Total Borrowing by Parent c 5,000a Based on the maximum amount as of 9/15/96. b Loan to student or parent. c Parents may borrow up to this amount under either a PLUS or private supplemental loan or under a combination of PLUS and private supplemental loans. Source: Salomon Smith Barney.
Eligible Lenders FFELP loans are originated by eligible lenders, which are primarily commercial banks, credit unions, thrift institutions, insurance companies, state agencies and non-profit student loan companies. Other originators can participate in the industry through the use of eligible lender trustees, which hold legal title to the loans on behalf of the lenders.
Historically, competition for origination volume (and secondary market purchase volume) focused on providing school financial aid officers and smaller lenders with value-added services. These services include items such as high-speed data-processing links that streamline the application and disbursement process. Other services include specialized software packages that help financial aid offices manage their paper flow and loan servicing links, and forward sale agreements that help small lenders, such as community banks and credit unions, to originate and warehouse loan production.
Today, lenders treat statutory program rates as maximum rates. They compete for volume by offering borrowers reduced origination fees, rebates of a portion of the
Eligible lenders originate FFELP loans
September 24, 2002 Student Loan ABS Primer
15
lender margin, and flexible repayment terms. This marketing environment favors well-capitalized, high-volume lenders able to devote the fixed resources necessary to develop and support expensive value-added services and with the scale necessary to process volume profitably at reduced yields.
Guaranty Agencies
The Higher Education Act requires each state to designate a single guarantor that must guaranty the FFELP loan of any student who is a state resident, or who is attending a school located in the state. The designated guarantor for most states is typically a state agency that administers a number of education finance-related programs for the state. Some states contract with guaranty agencies in neighboring states to serve as the designated guarantor for their state, or with a national guarantor such as USA Funds, Inc. (USAF). Guaranty agencies may guaranty loans from states where they are not the designated guarantor, and many of the larger guarantors compete for loan volume because of the value of lender relationships for related lines of business, such as third-party loan servicing and secondary-market activities.
To mitigate lender concerns about guarantor solvency, 1992 amendments to the Higher Education Act required the DOE to honor the guaranty obligations of insolvent guaranty agencies. Although the DOE has never drafted regulations that set out the conditions that would cause it to declare a guaranty agency insolvent, the major credit rating agencies believe that clear congressional intent makes it highly likely that the DOE will honor valid lender claims against an insolvent guaranty agency. Passage of the 1992 amendments was critical to the development of the student-loan ABS market because it allowed the rating agencies to assume that FFELP loans are guaranteed by a unit of the US Government, rather than by a number of thinly capitalized state guaranty agencies. The rating agencies assume delays of up to 540 days for claims payments filed with the DOE because of the lack of written regulations about the direct claims process.
The DOE guarantees FFELP guarantors payment of 95% of principal and accrued interest due on defaulted loans. (Loans originated prior to July 1998 are guaranteed at 98% and loans prior to October 1, 1993, carry 100% coverage.) Full reimbursement also applies to loans where the default was due to the death, disability, or bankruptcy of the borrower. A loan is generally defined as defaulted when it becomes 270 days past due.
Delays may occur from the time that the claim is made until the DOE reimburses the agency. Guaranty agencies fund claims payments to lenders primarily from reinsurance payments received from the DOE. Guaranty agencies generally receive 95% of claims expenses (loans originated prior to July 1998 are reinsured at 98%). However, if the agency has excessive default rates, (exceeding 5% of original principal) reinsurance rates can drop to as low as 75% of claims expense (see “Excessive Claims” in Appendix for details).
A number of guaranty agencies expanded their commitment volume in the late 1980s when FFELP regulations were changed, which resulted in increased lending to students attending proprietary trade schools. These loans defaulted at extremely high rates, and a number of guaranty agencies were merged into other guaranty agencies
The 1992 amendment allowed the rating
agencies to assume that a unit of the US
Government guarantees the FFELP loans.
Excessive claims can lower reinsurance
coverage.
September 24, 2002 Student Loan ABS Primer
16
when they could not cover the shortfall between lender claims and DOE reinsurance payments.
An important historical precedent has generally provided comfort to investors that the DOE will back up guarantors’ commitments. In 1991, the Higher Education Assistance Foundation (HEAF) experienced recurring losses and cash flow shortages. HEAF had contracted with Minnesota Guarantor Servicing, Inc., (MGSI) a subsidiary of SLMA for management services over several years. A business plan was developed whereby HEAF’s portfolio of guaranteed loans was distributed to other guarantee agencies under the Higher Education Act. HEAF continued to pay or reject claims on guaranteed loans remaining in the portfolio, in accordance with the applicable statutory and contractual provisions. However, pursuant to an agreement among the DOE, SLMA and MGSI, of which HEAF is a third- party beneficiary, the DOE agreed to pay 100% of eligible reinsurance claims filed by HEAF after October 31, 1990. This averted the potential for material losses as a result of HEAF’s financial situation.
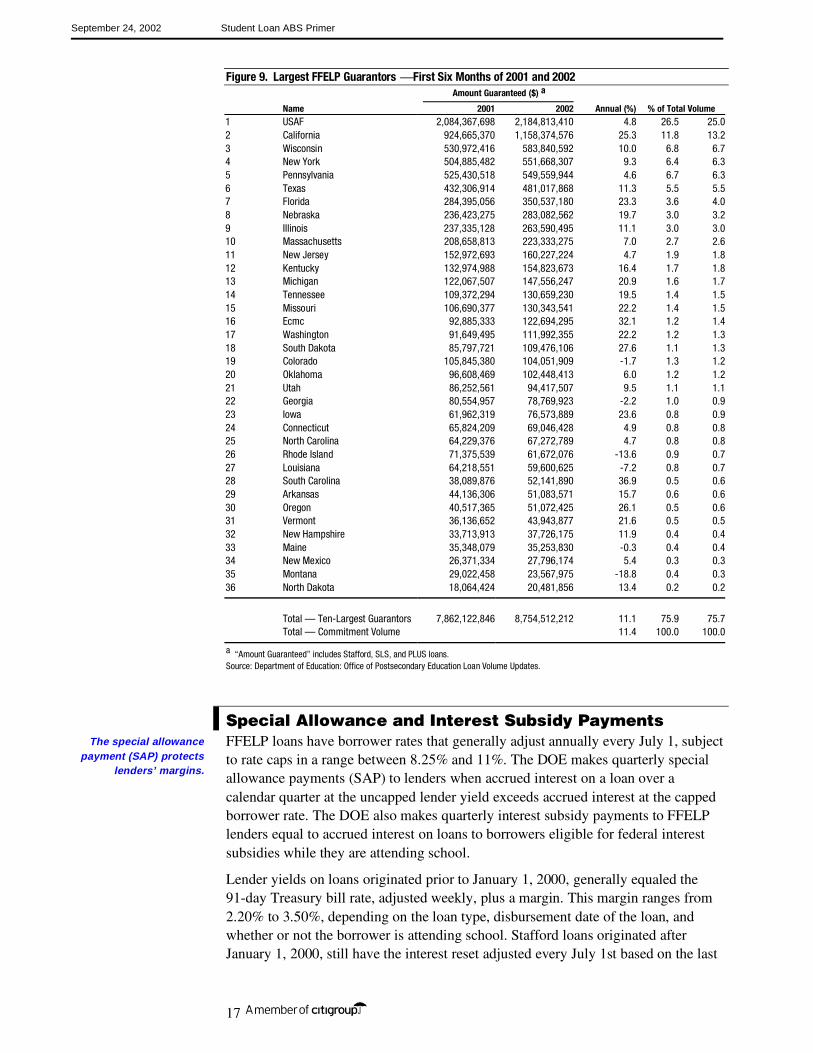
Figure 9 ranks the largest guarantors by annual commitment volume. The market share of the ten-largest guarantors has not changed much between 2000 and 2001.
An important DOE action in 1990 supports the
expectation of guarantor coverage.
September 24, 2002 Student Loan ABS Primer
17
Figure 9. Largest FFELP Guarantors First Six Months of 2001 and 2002 Amount Guaranteed ($) a
Name 2001 2002 Annual (%) % of Total Volume 1 USAF 2,084,367,698 2,184,813,410 4.8 26.5 25.02 California 924,665,370 1,158,374,576 25.3 11.8 13.23 Wisconsin 530,972,416 583,840,592 10.0 6.8 6.74 New York 504,885,482 551,668,307 9.3 6.4 6.35 Pennsylvania 525,430,518 549,559,944 4.6 6.7 6.36 Texas 432,306,914 481,017,868 11.3 5.5 5.57 Florida 284,395,056 350,537,180 23.3 3.6 4.08 Nebraska 236,423,275 283,082,562 19.7 3.0 3.29 Illinois 237,335,128 263,590,495 11.1 3.0 3.010 Massachusetts 208,658,813 223,333,275 7.0 2.7 2.611 New Jersey 152,972,693 160,227,224 4.7 1.9 1.812 Kentucky 132,974,988 154,823,673 16.4 1.7 1.813 Michigan 122,067,507 147,556,247 20.9 1.6 1.714 Tennessee 109,372,294 130,659,230 19.5 1.4 1.515 Missouri 106,690,377 130,343,541 22.2 1.4 1.516 Ecmc 92,885,333 122,694,295 32.1 1.2 1.417 Washington 91,649,495 111,992,355 22.2 1.2 1.318 South Dakota 85,797,721 109,476,106 27.6 1.1 1.319 Colorado 105,845,380 104,051,909 -1.7 1.3 1.220 Oklahoma 96,608,469 102,448,413 6.0 1.2 1.221 Utah 86,252,561 94,417,507 9.5 1.1 1.122 Georgia 80,554,957 78,769,923 -2.2 1.0 0.923 Iowa 61,962,319 76,573,889 23.6 0.8 0.924 Connecticut 65,824,209 69,046,428 4.9 0.8 0.825 North Carolina 64,229,376 67,272,789 4.7 0.8 0.826 Rhode Island 71,375,539 61,672,076 -13.6 0.9 0.727 Louisiana 64,218,551 59,600,625 -7.2 0.8 0.728 South Carolina 38,089,876 52,141,890 36.9 0.5 0.629 Arkansas 44,136,306 51,083,571 15.7 0.6 0.630 Oregon 40,517,365 51,072,425 26.1 0.5 0.631 Vermont 36,136,652 43,943,877 21.6 0.5 0.532 New Hampshire 33,713,913 37,726,175 11.9 0.4 0.433 Maine 35,348,079 35,253,830 -0.3 0.4 0.434 New Mexico 26,371,334 27,796,174 5.4 0.3 0.335 Montana 29,022,458 23,567,975 -18.8 0.4 0.336 North Dakota 18,064,424 20,481,856 13.4 0.2 0.2
Total — Ten-Largest Guarantors 7,862,122,846 8,754,512,212 11.1 75.9 75.7 Total — Commitment Volume 11.4 100.0 100.0
a “Amount Guaranteed” includes Stafford, SLS, and PLUS loans. Source: Department of Education: Office of Postsecondary Education Loan Volume Updates.
Special Allowance and Interest Subsidy Payments FFELP loans have borrower rates that generally adjust annually every July 1, subject to rate caps in a range between 8.25% and 11%. The DOE makes quarterly special allowance payments (SAP) to lenders when accrued interest on a loan over a calendar quarter at the uncapped lender yield exceeds accrued interest at the capped borrower rate. The DOE also makes quarterly interest subsidy payments to FFELP lenders equal to accrued interest on loans to borrowers eligible for federal interest subsidies while they are attending school.
Lender yields on loans originated prior to January 1, 2000, generally equaled the 91-day Treasury bill rate, adjusted weekly, plus a margin. This margin ranges from 2.20% to 3.50%, depending on the loan type, disbursement date of the loan, and whether or not the borrower is attending school. Stafford loans originated after January 1, 2000, still have the interest reset adjusted every July 1st based on the last
The special allowance payment (SAP) protects
lenders’ margins.
September 24, 2002 Student Loan ABS Primer
18
T-bill auction in May. However, the SAP paid on these Stafford loans is based on the daily average of the 3-month financial commercial paper (CP) rate for the previous quarter plus a margin ranging between 1.74% and 2.34%, dependent of the same characteristics mentioned above. Consolidation and PLUS loans originated after January 1, 2000, also receive SAP based on the above CP calculation, plus a margin of 2.64%. The commercial paper benchmark substantially reduces the lenders’ exposure to basis risk, and ultimately reduces this risk to investors.
Eligible Servicers
A guaranty agency can reject a guaranty claim submitted by a lender if the loan was not originated or serviced according to DOE guidelines. This means that lenders bear default risk on FFELP loans to the extent of uncured servicing errors, with loss severity ranging from the loss of accrued interest to full loss of principal and interest. Typical violations include due diligence errors made by originators, such as failure to verify a borrower’s eligibility for the program, and servicing errors such as the failure to contact a delinquent borrower within the required time limits.
FFELP reporting and processing guidelines are highly technical, and the penalty for violating a guideline is expensive. To minimize technical violations, the student loan servicing environment is highly automated, and many lenders contract out some or all of their underwriting, disbursement, and collections functions to high-volume, third-party servicers. Third-party servicers must meet solvency and performance standards to be eligible to service FFELP loans.
Secondary Markets
Many lenders hold subsidized loans only while the borrowers attend school and loan collections consist of quarterly federal interest subsidy and special allowance payments. These lenders typically sell loans to specialized investors called secondary markets when borrowers graduate and the loan servicing function shifts from quarterly collection of lump-sum federal payments to monthly collection of principal and interest from individual borrowers.
Secondary markets include Sallie Mae, commercial banks, many of the state guaranty agencies, and a number of non-profit corporations. Secondary markets either keep the loans on their balance sheet, fund them through the issuance of student loan revenue bonds in the municipal bond market, or sell them into the ABS market. Not-for-profit entities tend to view their secondary market activities as a revenue generating rather than member service function and attempt to earn a positive spread on their financing activities to subsidize other programs.
Sallie Mae is the largest purchaser of secondary-market student loans in the market. Congress chartered Sallie Mae in 1972 to provide secondary market liquidity to the student loan industry. Sallie Mae executes its mandate by purchasing loans from originators and holding them in portfolio, or more recently, selling them into the student-loan ABS market. Like Fannie Mae and Freddie Mac in the residential mortgage market, Sallie Mae is a shareholder-owned, government-sponsored enterprise (GSE) that had federal agency debt status because of the public-purpose nature of its activities. Unlike Fannie Mae and Freddie Mac mortgage-backed securities, however, Sallie Mae student-loan ABSs do not carry the corporate guaranty of their sponsor.
Third-party servicers must meet solvency and performance standards.
Sallie Mae is the largest secondary-market
provider.

September 24, 2002 Student Loan ABS Primer
19
In October 1996, Congress passed legislation that will effectively privatize Sallie Mae. Today Sallie Mae is owned by a holding company called the SLM Corporation (formerly USA Education, Inc.). Sallie Mae expects to surrender its GSE status by September 30, 2006.
Figure 10 ranks the largest FFELP originators by annual commitment volume. Note that only a limited number of lenders have annual origination volume large enough to support an efficient ABS program without secondary market purchases from other lenders.
Figure 10. Largest Originators of FFELP Loans Federal Fiscal Years 2000 and 2001 (Dollars in Millions) Amount Guaranteed ($)a Annual % of Total Volume
2000 Rank 2001 2000 Growth (%) 2001 20002 JP Morgan Chase Bank NY (Garden City) 2,295.0 2,025.1 13.33 8.8 8.73 Bank One Ed Fin Group OH (Columbus) 2,203.3 1,999.8 10.18 8.5 8.61 Citibank, Student Loan Corp NY (Pittsford) 2,167.0 2,057.1 5.35 8.3 8.85 Bank of America CA (Los Angeles) 1,639.6 1,512.9 8.38 6.3 6.54 Wells Farge Education Financial Services SD (Sioux Falls) 1,583.5 1,580.7 0.18 6.1 6.8
8 Sallie Mae VA (Reston) 1,383.5 860.0 60.87 5.3 3.76 First Union Natl Bank (Classnotes) CA (Sacramento) 1,248.7 1,231.2 1.42 4.8 5.37 National City Bank OH (Cleveland) 896.6 886.6 1.12 3.5 3.812 American Express Ed Assurance Co CA (San Diego) 882.5 565.7 56.00 3.4 2.49 Firstar Bank WI (Milwaukee) 798.6 712.3 12.12 3.1 3.1
Total — Ten Largest Originators 15,098.3 13,431.3 12.41 58.2 57.6 Total — All Originators 25,960.3 23,317.9 11.33 100.0 100.0a “Includes volume reported for Academic Management Service. Amount Guaranteed” includes Stafford, PLUS and SLS loans, does not include Consolidation loans. Source: US Department of Education of Postsecondary Education Loan Volume Updates.
We list the largest holders of FFELP loans as of September 30, 2001 the most recently available federal data — in Figure 11. Note that the groups of originators and holders are distinct, as some of the largest student loan originators hold very little collateral in their portfolios. This pattern exists because most private-market lenders find it more attractive to sell the loans to Sallie Mae or state guaranty agencies than to fund these loans on balance sheet.
Figure 11. Largest FFELP Holders (Dollars in Millions), 30 Sep 01 Outstanding % Total Market2000 Rank Balance (M) Volume1 Sallie Mae VA (Reston) 65,291.0 41.72 Citibank, Student Loan Corp NY (Pittsford) 16,030.2 10.23 First Union Natl Bank (Classnotes) CA (Sacramento) 7,102.0 4.54 Wells Fargo Ed Financial Services SD (Sioux Falls) 5,913.0 3.85 National Education Loan Network NE (Lincoln) 4,185.7 2.76 Brazos Group TX (Waco) 3,909.7 2.57 Key Corp OH (Cleveland) 2,743.1 1.88 Bank of America CA (Los Angeles) 2,549.7 1.69 Penna Higher Ed Assistance Agency PA (Harrisburg) 2,545.1 1.610 Efs Finance Co IN (Indianapolis) 2,487.4 1.6
Total — Ten Largest Holders 112,756.9 72.1 Total -— Outstanding 156,467.0 100.0a “Outstanding Balance” includes Stafford, PLUS, SLS, and Consolidation Loans. Securitized loans are reported under the original holder. Source: Department of Education: Office of Postsecondary Education Loan Volume Updates.
September 24, 2002 Student Loan ABS Primer
20
The Federal Direct Lending Program The Omnibus Budget Reconciliation Act of 1993 made major changes to the FFELP, including expansion of the federal direct lending program. The direct lending program requires that the DOE originate FFELP loans directly to its own balance sheet, where loans are funded at Treasury-bill rates plus servicing costs. The direct lending program called for direct federal funding of at least 60% of federally sponsored student loan volume by the 1998–1999 school year. In recent years, the direct lending market share has been relatively constant at about 33%. The inability of the Direct Lending Program to capture the market share anticipated is generally attributed to customer service to schools that ranks below that offered by private lenders together with aggressive price competition on the part of private lenders. For a brief period of time following the 1998 reauthorization of the Higher Education Act, the direct lending program originated consolidation loans at rates that were more favorable than consolidation loans originated by the private sector. The direct program did see an increase in consolidation volume during this time, but because of to limited marketing of these loans, the availability of the favorable rates was not widely known.
September 24, 2002 Student Loan ABS Primer
21
The Student Loan ABS Market
The beginning of the student-loan ABS market usually is dated to the November 1992 adoption of Rule 3(a)-7 of the Investment Company Act of 1940. Rule 3(a)-7 exempted issuers of ABSs backed by a broad class of consumer assets, including federally sponsored student loans, from investment company reporting requirements.
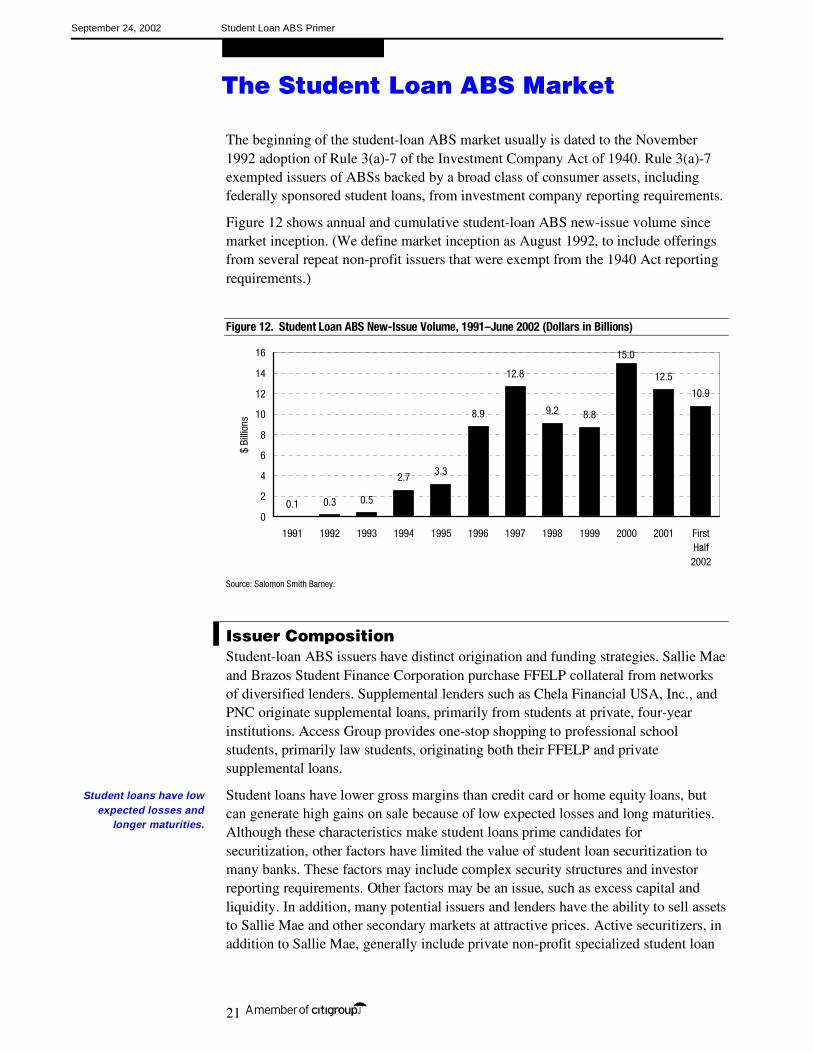
Figure 12 shows annual and cumulative student-loan ABS new-issue volume since market inception. (We define market inception as August 1992, to include offerings from several repeat non-profit issuers that were exempt from the 1940 Act reporting requirements.)
Figure 12. Student Loan ABS New-Issue Volume, 1991–June 2002 (Dollars in Billions)
0.1 0.3 0.5
2.7 3.3
8.9
12.8
9.2 8.8
12.5
10.9
15.0
0
2
4
6
8
10
12
14
16
1991 1992 1993 1994 1995 1996 1997 1998 1999 2000 2001 FirstHalf2002
$ Bi
llion
s
Source: Salomon Smith Barney.
Issuer Composition Student-loan ABS issuers have distinct origination and funding strategies. Sallie Mae and Brazos Student Finance Corporation purchase FFELP collateral from networks of diversified lenders. Supplemental lenders such as Chela Financial USA, Inc., and PNC originate supplemental loans, primarily from students at private, four-year institutions. Access Group provides one-stop shopping to professional school students, primarily law students, originating both their FFELP and private supplemental loans.
Student loans have lower gross margins than credit card or home equity loans, but can generate high gains on sale because of low expected losses and long maturities. Although these characteristics make student loans prime candidates for securitization, other factors have limited the value of student loan securitization to many banks. These factors may include complex security structures and investor reporting requirements. Other factors may be an issue, such as excess capital and liquidity. In addition, many potential issuers and lenders have the ability to sell assets to Sallie Mae and other secondary markets at attractive prices. Active securitizers, in addition to Sallie Mae, generally include private non-profit specialized student loan
Student loans have low expected losses and
longer maturities.

September 24, 2002 Student Loan ABS Primer
22
lenders and for-profit lenders with roots in the non-profit sector. Consequently, the student loan issuance has been concentrated among few large players. In addition to regular issuers, state education authorities enter the ABS market from time to time, because of IRS caps on the amount of tax-exempt bond issuance allowed to the state, or favorable arbitrage opportunities.
We list the largest student-loan ABS issuers, from August 1992 through November 2000 in Figure 13.
Figure 13. Largest Student Loan ABS Issuers (Dollars in Millions), 1992–2002 Issuer New Issue Volume
Sallie Mae Student Loan Trust $36,730.1SMS Student Loan Trust 6,015.8KeyCorp Student Ln Trust 5,258.5Brazos Student Finance Corporation 1,982.6Nelnet Student Loan Corporation (f/k/a Union Financial Services) 2,410.5Class Notes Trust 1,404.0Student Loan Funding Corporation 1,352.7EMT Inc 1,336.0Banc One Student Loan Trust 1,223.8Education Loans Inc 1,049.8PNC Student Loan Trust 1,030.0Access Group Inc 801.5Education Finance Group 663.5Chela Financial USA 570.0Society Student Loan Trust 454.7Signet Student Loan Trust 428.4First Union Student Loan Trust 405.6University Support Services 277.8Crestar Student Loan Trust 222.9Educaid Student Loan Trust 203.0Panhandle Plains Higher Education Authority 200.0South Carolina Student Loan Corporation 150.0North Carolina State Education Authority 105.0
Total $64,276.2
Source: Salomon Smith Barney.
Credit Ratings Approximately 96% of student-loan ABSs have been rated triple-A at offering. The high percentage of triple-A rated balances largely is a result of low levels of required credit support for structures backed by pools of FFELP loans.
Pricing Indexes
Today’s student-loan ABSs have floating-rate coupons indexed to three-month LIBOR. Many offerings from July 1995 through 1997 had been indexed to the bond-equivalent yield on the 91-day Treasury bill, adjusted weekly, which provides an almost perfect match with underlying asset yield. Though this posed some basis risk for many investors who typically fund themselves off of LIBOR, the risk was not deemed significant.
However, for a period of time prior to Y2K, as the spread relationship between 91-day T-bill and 1-month LIBOR became more volatile. Issuers were forced to index student loan debt issuance to 1-month and 3-month LIBOR to meet changed investor demand. Sallie Mae, which traditionally issued all of its debt benchmarked to 91-day
September 24, 2002 Student Loan ABS Primer
23
T-bills, altered its strategy. Sallie Mae issued as much T-bill based debt as the market would absorb. Sallie issued the remainder as LIBOR indexed bonds.
All other issuers indexing to 91-day T-bills were also forced to follow Sallie Mae’s lead. This effectively shifted basis risk away from the investor and to the issuer. Much of the basis risk concern in respect to LIBOR-indexed bonds was alleviated when it was announced that the SAP paid on student loans would become indexed off the three-month financial CP rate. The historical spread relationship between CP and LIBOR has proven more stable than that between 91-day T-bill and LIBOR.
Both the change in the SAP calculation rate and the change in the index away from 91-day T-bills have added significantly to the attractiveness of student-loan ABSs. In 2001 approximately 2% of new issue volume was indexed to the 91-day Treasury bill. This represents a dramatic change from just several years earlier when 70% of student-loan ABSs indexed to the 91-day T-bill. Another major development was the increased issuance of auction rate debt, which accounted for approximately 40% of total industry issuance in 2001 compared to less than 19% of the total debt issued in 1996.
Maturity Distribution
Larger offerings generally tranche senior notes into several classes of sequential-pay notes. Some smaller issues, however, have issued only a single class of senior notes.
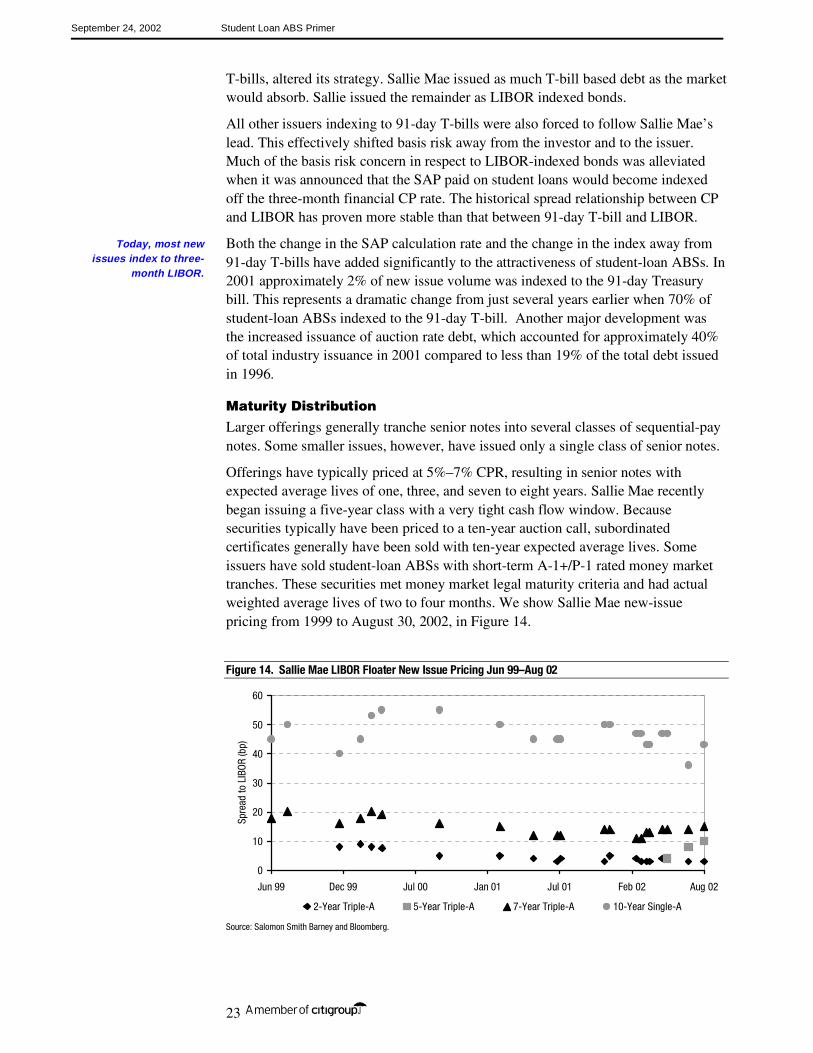
Offerings have typically priced at 5%–7% CPR, resulting in senior notes with expected average lives of one, three, and seven to eight years. Sallie Mae recently began issuing a five-year class with a very tight cash flow window. Because securities typically have been priced to a ten-year auction call, subordinated certificates generally have been sold with ten-year expected average lives. Some issuers have sold student-loan ABSs with short-term A-1+/P-1 rated money market tranches. These securities met money market legal maturity criteria and had actual weighted average lives of two to four months. We show Sallie Mae new-issue pricing from 1999 to August 30, 2002, in Figure 14.
Figure 14. Sallie Mae LIBOR Floater New Issue Pricing Jun 99–Aug 02
0
10
20
30
40
50
60
Jun 99 Dec 99 Jul 00 Jan 01 Jul 01 Feb 02 Aug 02
Spre
ad to
LIB
OR (b
p)
2-Year Triple-A 5-Year Triple-A 7-Year Triple-A 10-Year Single-A
Source: Salomon Smith Barney and Bloomberg.
Today, most new issues index to three-
month LIBOR.
September 24, 2002 Student Loan ABS Primer
24
Defaults, Loss Curves and Prepayments
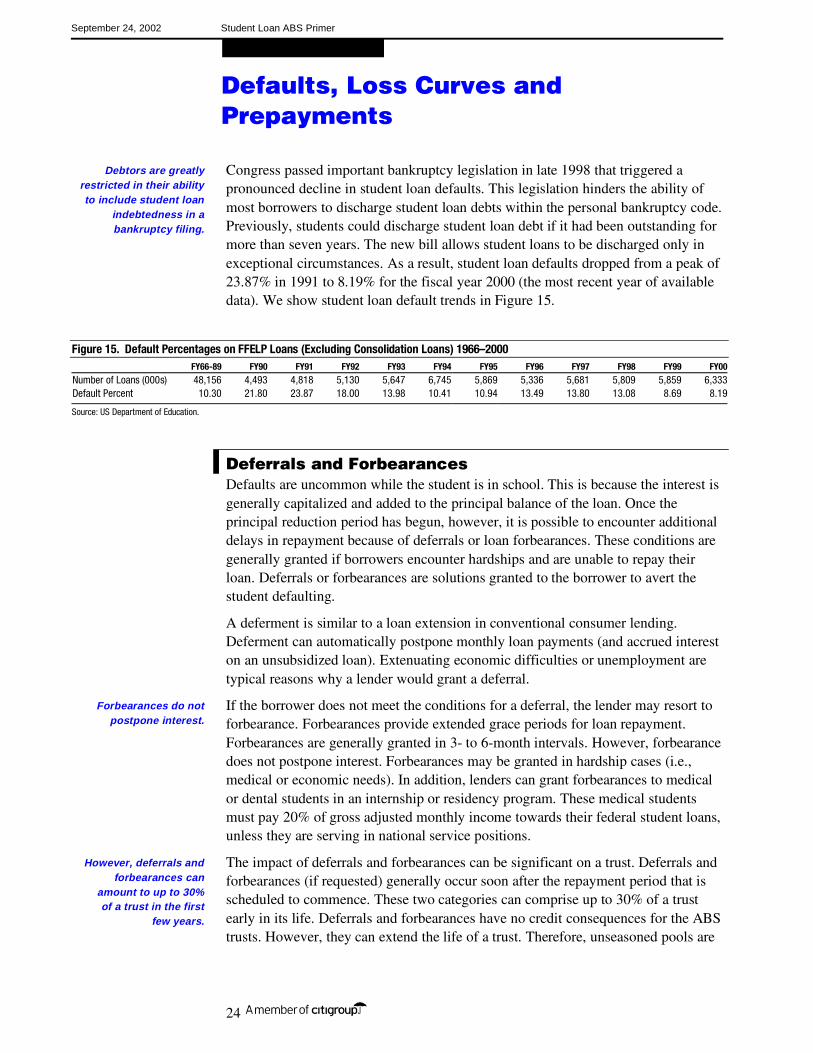
Congress passed important bankruptcy legislation in late 1998 that triggered a pronounced decline in student loan defaults. This legislation hinders the ability of most borrowers to discharge student loan debts within the personal bankruptcy code. Previously, students could discharge student loan debt if it had been outstanding for more than seven years. The new bill allows student loans to be discharged only in exceptional circumstances. As a result, student loan defaults dropped from a peak of 23.87% in 1991 to 8.19% for the fiscal year 2000 (the most recent year of available data). We show student loan default trends in Figure 15.
Figure 15. Default Percentages on FFELP Loans (Excluding Consolidation Loans) 1966–2000 FY66-89 FY90 FY91 FY92 FY93 FY94 FY95 FY96 FY97 FY98 FY99 FY00
Number of Loans (000s) 48,156 4,493 4,818 5,130 5,647 6,745 5,869 5,336 5,681 5,809 5,859 6,333Default Percent 10.30 21.80 23.87 18.00 13.98 10.41 10.94 13.49 13.80 13.08 8.69 8.19
Source: US Department of Education.
Deferrals and Forbearances Defaults are uncommon while the student is in school. This is because the interest is generally capitalized and added to the principal balance of the loan. Once the principal reduction period has begun, however, it is possible to encounter additional delays in repayment because of deferrals or loan forbearances. These conditions are generally granted if borrowers encounter hardships and are unable to repay their loan. Deferrals or forbearances are solutions granted to the borrower to avert the student defaulting.
A deferment is similar to a loan extension in conventional consumer lending. Deferment can automatically postpone monthly loan payments (and accrued interest on an unsubsidized loan). Extenuating economic difficulties or unemployment are typical reasons why a lender would grant a deferral.
If the borrower does not meet the conditions for a deferral, the lender may resort to forbearance. Forbearances provide extended grace periods for loan repayment. Forbearances are generally granted in 3- to 6-month intervals. However, forbearance does not postpone interest. Forbearances may be granted in hardship cases (i.e., medical or economic needs). In addition, lenders can grant forbearances to medical or dental students in an internship or residency program. These medical students must pay 20% of gross adjusted monthly income towards their federal student loans, unless they are serving in national service positions.
The impact of deferrals and forbearances can be significant on a trust. Deferrals and forbearances (if requested) generally occur soon after the repayment period that is scheduled to commence. These two categories can comprise up to 30% of a trust early in its life. Deferrals and forbearances have no credit consequences for the ABS trusts. However, they can extend the life of a trust. Therefore, unseasoned pools are
Debtors are greatly restricted in their ability to include student loan
indebtedness in a bankruptcy filing.
Forbearances do not postpone interest.
However, deferrals and forbearances can
amount to up to 30% of a trust in the first
few years.
September 24, 2002 Student Loan ABS Primer
25
impacted to a greater extent than seasoned pools. We will discuss the impact of deferrals and forbearances again later in the speed section.
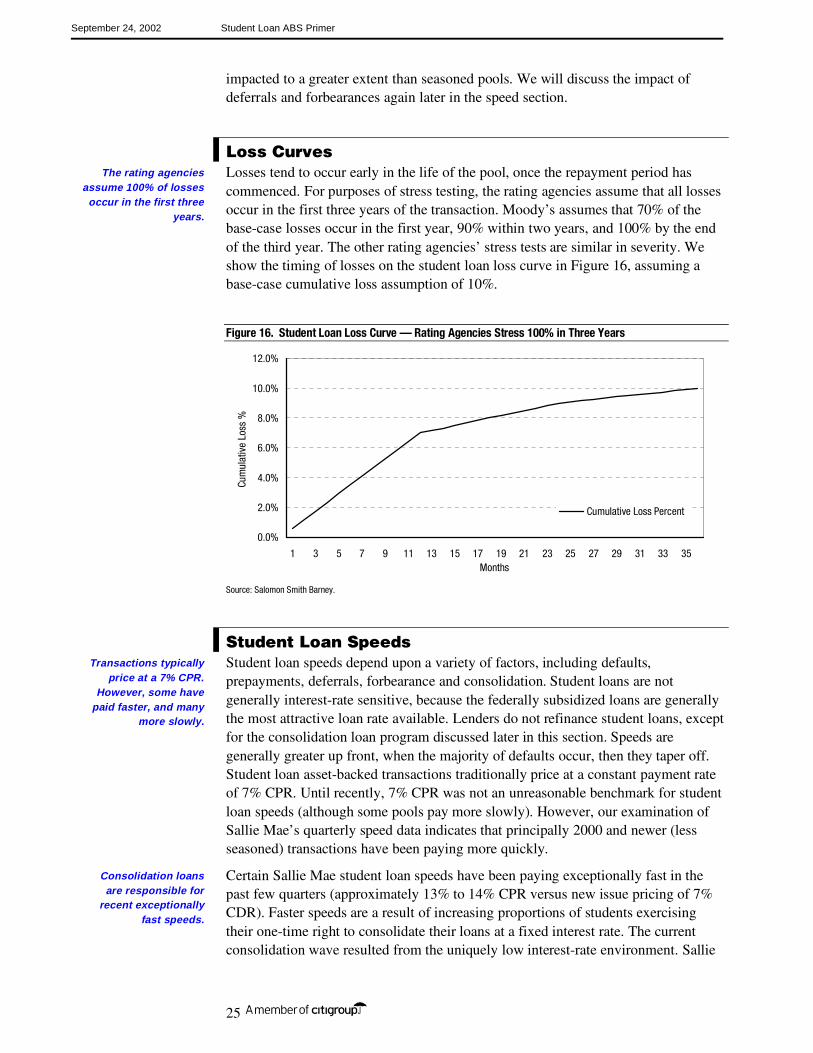
Loss Curves Losses tend to occur early in the life of the pool, once the repayment period has commenced. For purposes of stress testing, the rating agencies assume that all losses occur in the first three years of the transaction. Moody’s assumes that 70% of the base-case losses occur in the first year, 90% within two years, and 100% by the end of the third year. The other rating agencies’ stress tests are similar in severity. We show the timing of losses on the student loan loss curve in Figure 16, assuming a base-case cumulative loss assumption of 10%.
Figure 16. Student Loan Loss Curve — Rating Agencies Stress 100% in Three Years
0.0%
2.0%
4.0%
6.0%
8.0%
10.0%
12.0%
1 3 5 7 9 11 13 15 17 19 21 23 25 27 29 31 33 35Months
Cum
ulat
ive
Loss
%
Cumulative Loss Percent
Source: Salomon Smith Barney.
Student Loan Speeds Student loan speeds depend upon a variety of factors, including defaults, prepayments, deferrals, forbearance and consolidation. Student loans are not generally interest-rate sensitive, because the federally subsidized loans are generally the most attractive loan rate available. Lenders do not refinance student loans, except for the consolidation loan program discussed later in this section. Speeds are generally greater up front, when the majority of defaults occur, then they taper off. Student loan asset-backed transactions traditionally price at a constant payment rate of 7% CPR. Until recently, 7% CPR was not an unreasonable benchmark for student loan speeds (although some pools pay more slowly). However, our examination of Sallie Mae’s quarterly speed data indicates that principally 2000 and newer (less seasoned) transactions have been paying more quickly.
Certain Sallie Mae student loan speeds have been paying exceptionally fast in the past few quarters (approximately 13% to 14% CPR versus new issue pricing of 7% CDR). Faster speeds are a result of increasing proportions of students exercising their one-time right to consolidate their loans at a fixed interest rate. The current consolidation wave resulted from the uniquely low interest-rate environment. Sallie
The rating agencies assume 100% of losses
occur in the first three years.
Transactions typically price at a 7% CPR.
However, some have paid faster, and many
more slowly.
Consolidation loans are responsible for
recent exceptionally fast speeds.
September 24, 2002 Student Loan ABS Primer
26
Mae expects speeds to remain high at least until June 2003. Sallie Mae is weighing whether to change future new-issue pricing speeds, and plans to make a decision upon further study. However, Sallie Mae expects new-issue speeds to eventually return to more conventional 7% CPR levels after June 2003. We believe this reversion will occur once there is clarity in Fed policy, the interest-rate environment, and a flatter yield curve.
The current low-interest-rate scenario presents a window of opportunity for students. This opportunity is not unlike the current window in fixed-rate mortgages. Based on the recent unprecedented low reset rates, students have never been able to borrow at such attractive rates. Until recently, many students may have believed that interest rates were likely to remain unchanged or to decline further. However, many currently believe that interest rates will never again be this low. This is a major incentive for students to fix their interest rate via the consolidation loan program.
Sallie Mae considers the consolidation loan program a principal cause for the prepayment spike in some pools. In the past, consolidation loans have been a very low percentage of total annual FFELP loan commitments, ranging from approximately 13% to 19% of total commitments. However, the trend is increasing (see Figure 17).
Figure 17. FFELP Loan Volume Commitments for Subsidized and Unsubsidized Stafford Loans, Plus Loans, and Consolidation Loans, 1997–2000 (Dollars in Thousands)
1997 1998 1999 2000Consolidation Loan Commitments ($) 3,997,603 3,349,643 5,004,005 6,000,032 All other Student Loan Commitments ($) 21,658,870 22,496,707 23,323,934 25,656,044
Total ($) 25,656,473 25,846,350 28,327,939 31,656,076 Consolidation Loans Percentage of Total 15.58 12.96 17.66 18.95
Source: US Department of Education.
Students electing to consolidate their loans at today’s low interest rates procure a significant benefit that will facilitate their transition into the “real world.” The FFELP loan program offers students a one-time opportunity to consolidate their loans at the weighted average interest rate of their underlying loans. The opportunity to consolidate may present more payment flexibility to students who qualify for a longer repayment period by consolidating their loans than repaying them individually.
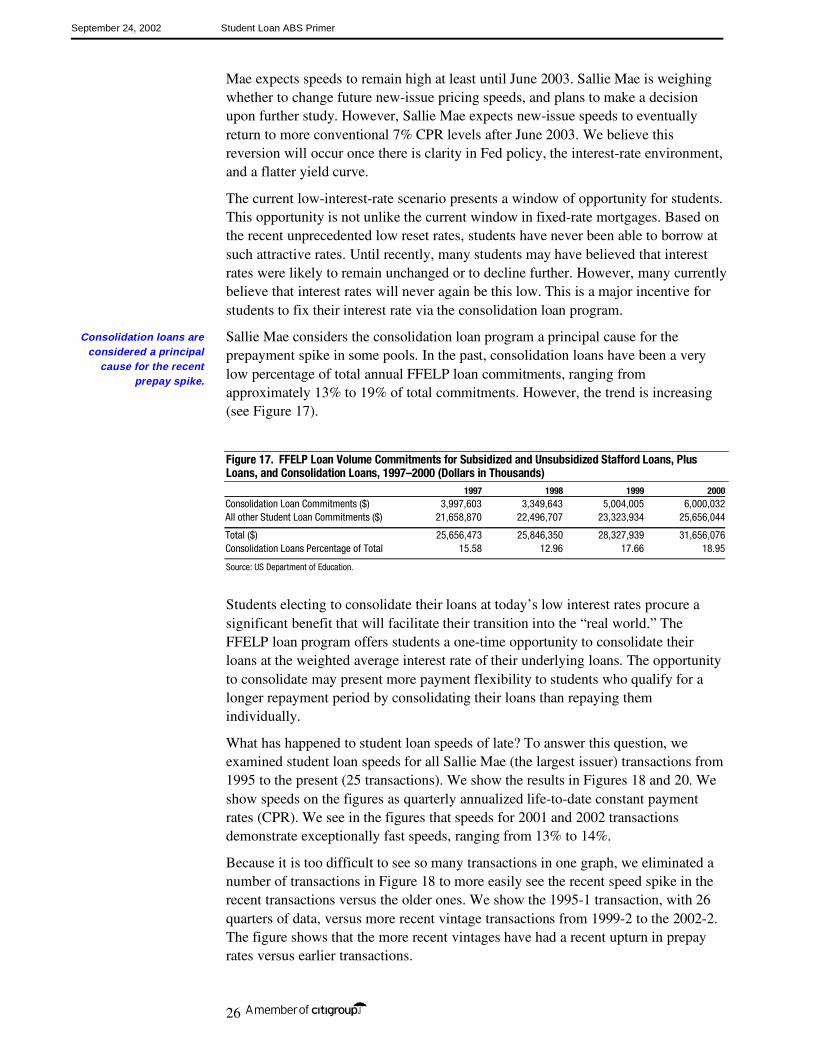
What has happened to student loan speeds of late? To answer this question, we examined student loan speeds for all Sallie Mae (the largest issuer) transactions from 1995 to the present (25 transactions). We show the results in Figures 18 and 20. We show speeds on the figures as quarterly annualized life-to-date constant payment rates (CPR). We see in the figures that speeds for 2001 and 2002 transactions demonstrate exceptionally fast speeds, ranging from 13% to 14%.
Because it is too difficult to see so many transactions in one graph, we eliminated a number of transactions in Figure 18 to more easily see the recent speed spike in the recent transactions versus the older ones. We show the 1995-1 transaction, with 26 quarters of data, versus more recent vintage transactions from 1999-2 to the 2002-2. The figure shows that the more recent vintages have had a recent upturn in prepay rates versus earlier transactions.
Consolidation loans are considered a principal
cause for the recent prepay spike.
September 24, 2002 Student Loan ABS Primer
27
Figure 18. Sallie Mae Transaction Speeds From 1995–1 to 2002-2 as of Jul 02
0%
4%
8%
12%
16%
20%
1 2 3 4 5 6 7 8 9 10 11 12 13 14 15 16 17 18 19 20 21 22 23 24 25 26 27
1995-1 1999-2 2000-22000-3 2000-4 2001-12001-2 2001-3 2001-42002-1 2002-2 2002-3
Source: Servicing Statements on Sallie Mae Website.
Defaults, the other major factor in prepays, have been decreasing in recent years. Therefore, consolidation loans are the major factor responsible for the acceleration of prepayment rates. We show default information for FFELP loans (excluding consolidation loans) in Figure 19 from 1966 to 2000. Losses had been on a declining trend, and were further assisted by the passage in late 1998 of a modification to the bankruptcy laws that greatly hinders the ability of debtors to discharge student loans in bankruptcy.
Figure 19. Default Percentages on FFELP Loans (Excluding Consolidation Loans) 1966–2000 FY66-89 FY90 FY91 FY92 FY93 FY94 FY95 FY96 FY97 FY98 FY99 FY00
Number of Loans (000s) 48,156 4,493 4,818 5,130 5,647 6,745 5,869 5,336 5,681 5,809 5,859 6,333Default Percent 10.30 21.80 23.87 18.00 13.98 10.41 10.94 13.49 13.80 13.08 8.69 8.19
Source: US Department of Education.
The earlier vintages have not prepaid as aggressively as the more recent vintages because seasoned pre-1999 transactions are more immunized from prepayments than the more recent transactions. In theory, students may exercise their one-time right to consolidate and fix the interest rate on their loans at any time. Therefore, the older vintage transactions are not immune from higher prepayments from consolidation loan refinancing.
Recent consolidation loan activity has accelerated the prepayments in the older transactions as well as the new transactions. However, the net effect of prepayments on the seasoned, laggard transactions is to bring them closer to where they should have originally been paying. The seasoned transactions are more insulated from the refinancing wave because they had so significantly slowed prior to this action. The amount of deferments and forbearances has mostly stabilized in the older transactions, while still developing in the newer transactions. The CPR for the more seasoned pre-1999 issues is likely to remain around 7% or less.
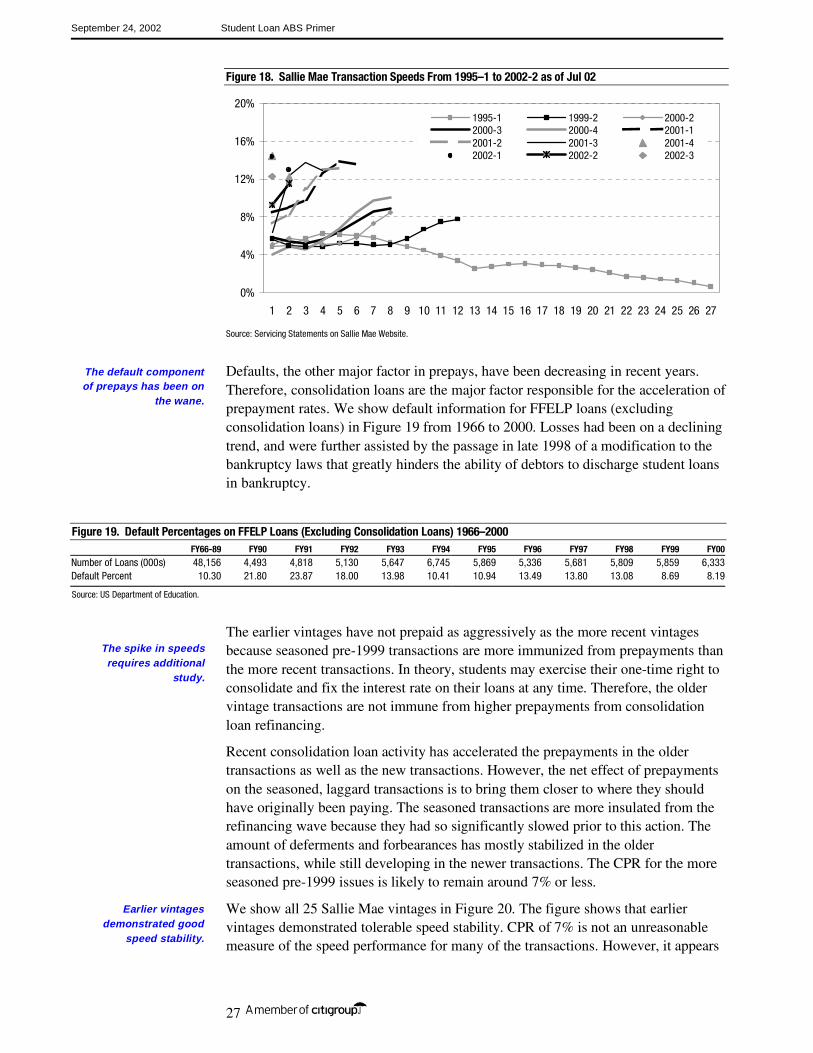
We show all 25 Sallie Mae vintages in Figure 20. The figure shows that earlier vintages demonstrated tolerable speed stability. CPR of 7% is not an unreasonable measure of the speed performance for many of the transactions. However, it appears
The default component of prepays has been on
the wane.
The spike in speeds requires additional
study.
Earlier vintages demonstrated good
speed stability.
September 24, 2002 Student Loan ABS Primer
28
that 7% may be somewhat faster than some pools pay. We note that the quarterly annualized lifetime speeds for 11 out of the 25 transactions were less than 6%. The average speed for those transactions was actually somewhat less than 4% (all seasoned transactions). Therefore, the faster speeds displayed in recent Sallie Mae vintages may actually serve to bring the older transactions into line with 7% CPR performance by the end of the transaction.
The student loan speed curve rises moderately early in the transaction, then flattens. The figure shows that speed acceleration is in the first 15 to 30 months of the transaction (shown as quarterly intervals on the figure). This increase is because of greater defaults early in the transaction. The faster speed exceptions are more readily apparent in the later transactions, beginning with the 2001 vintages.
Figure 20. Sallie Mae Transactions’ Prepay Curves From 1995-1 to 2002-2 as of Jul 02
0%
2%
4%
6%
8%
10%
12%
14%
16%
0 5 10 15 20 25 30
Quarters From Issuance
CPR
(%)
1995-1 1996-1 1996-2 1996-3 1996-4
1997-1 1997-2 1997-3 1997-4 1998-1
1998-2 1999-1 1999-2 1999-3 2000-1
2000-2 2000-3 2000-4 2001-1 2001-2
2001-3 2001-4 2002-1 2002-2 2002-3
Source: Salomon Smith Barney.
Speed Impact on Structures
LIBOR floater structures and prices are largely resilient to speed variability. Therefore, speed acceleration will have little impact on LIBOR-indexed bond prices. We examine a typical LIBOR floater in Figure 21. We show the SLMA 200-4 class (A1). Although this transaction is currently paying at 14.33% CPR, we expect deferments and forbearances, as well as higher interest rates to have a bearing on the future speeds. The long-run speed should slow below current levels. We estimate that speed to level out at approximately 10% CPR.
Faster speeds will have little influence on the LIBOR-indexed cash-flow window. The figure shows that the difference in the cash-flow window between a 7% CPR and 10% CPR is only seven months. Assuming the investor paid 100-1 for the bond, the difference in yield is one-third of a basis point. However, if the transaction were to pay more slowly than 7% CPR, the investor picks up somewhat more spread. However, the price variability is insignificant.
LIBOR floaters are largely immune to speed variability.
September 24, 2002 Student Loan ABS Primer
29
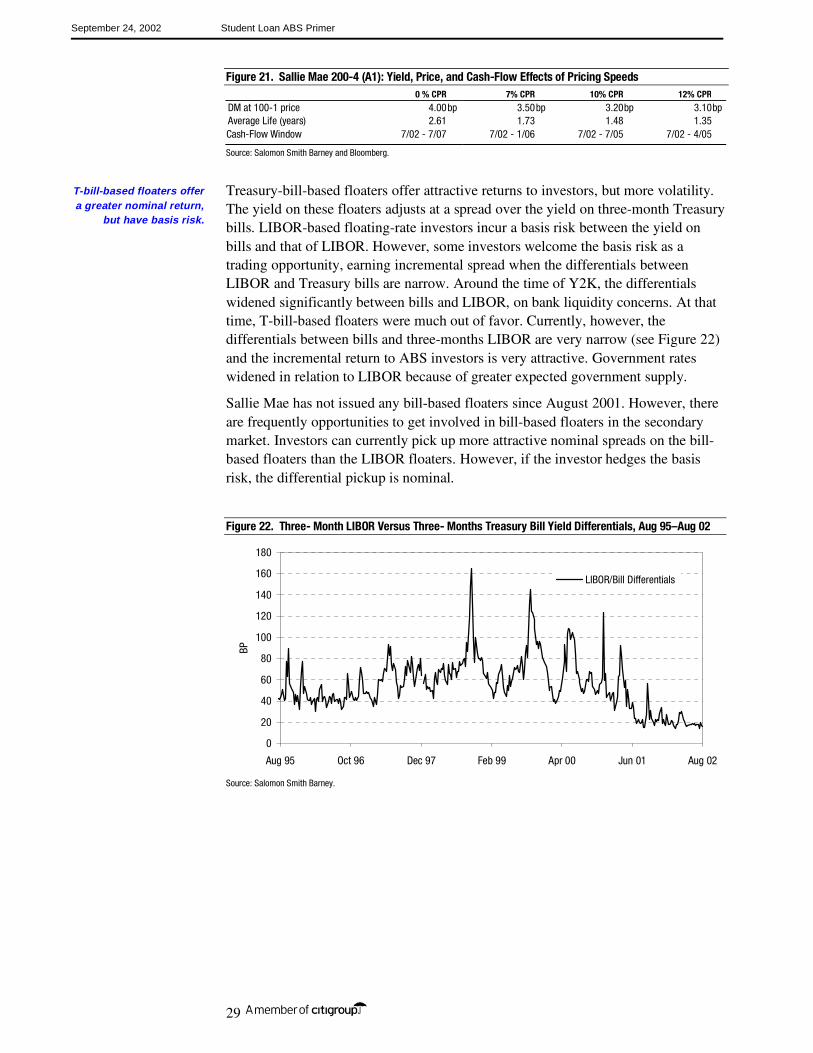
Figure 21. Sallie Mae 200-4 (A1): Yield, Price, and Cash-Flow Effects of Pricing Speeds 0 % CPR 7% CPR 10% CPR 12% CPR
DM at 100-1 price 4.00bp 3.50bp 3.20bp 3.10bpAverage Life (years) 2.61 1.73 1.48 1.35 Cash-Flow Window 7/02 - 7/07 7/02 - 1/06 7/02 - 7/05 7/02 - 4/05
Source: Salomon Smith Barney and Bloomberg.
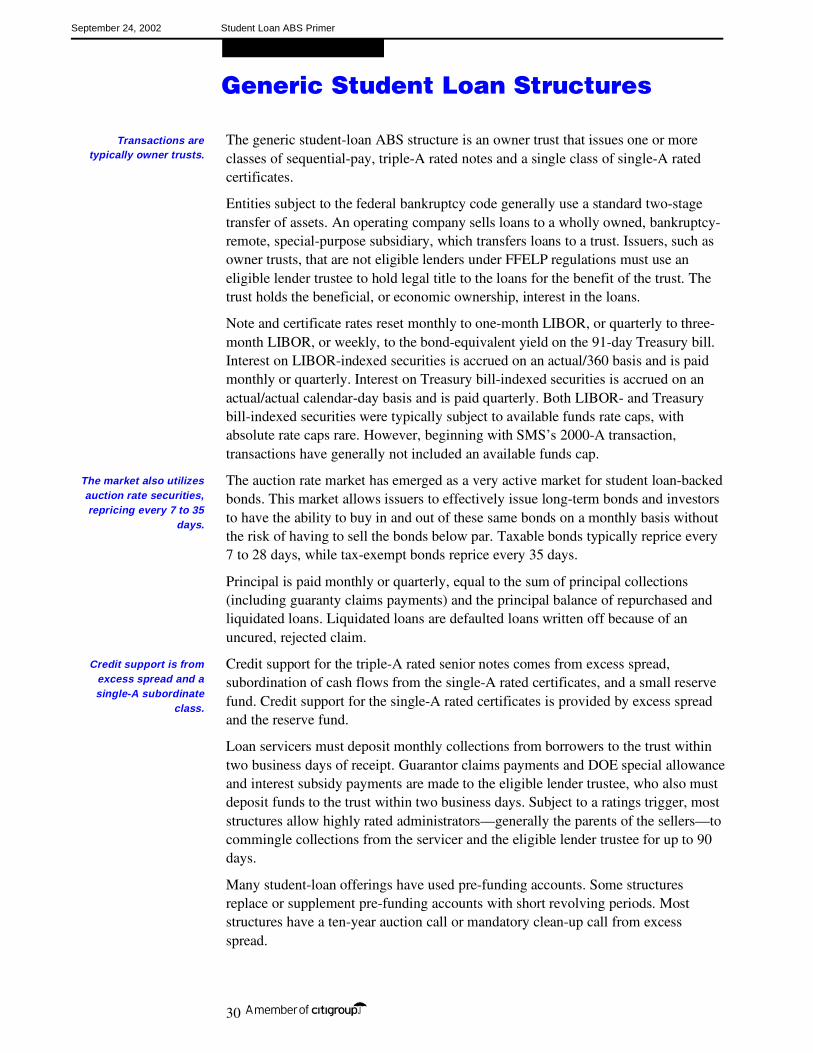
Treasury-bill-based floaters offer attractive returns to investors, but more volatility. The yield on these floaters adjusts at a spread over the yield on three-month Treasury bills. LIBOR-based floating-rate investors incur a basis risk between the yield on bills and that of LIBOR. However, some investors welcome the basis risk as a trading opportunity, earning incremental spread when the differentials between LIBOR and Treasury bills are narrow. Around the time of Y2K, the differentials widened significantly between bills and LIBOR, on bank liquidity concerns. At that time, T-bill-based floaters were much out of favor. Currently, however, the differentials between bills and three-months LIBOR are very narrow (see Figure 22) and the incremental return to ABS investors is very attractive. Government rates widened in relation to LIBOR because of greater expected government supply.
Sallie Mae has not issued any bill-based floaters since August 2001. However, there are frequently opportunities to get involved in bill-based floaters in the secondary market. Investors can currently pick up more attractive nominal spreads on the bill-based floaters than the LIBOR floaters. However, if the investor hedges the basis risk, the differential pickup is nominal.
Figure 22. Three- Month LIBOR Versus Three- Months Treasury Bill Yield Differentials, Aug 95–Aug 02
0
20
40
60
80
100
120
140
160
180
Aug 95 Oct 96 Dec 97 Feb 99 Apr 00 Jun 01 Aug 02
BP
LIBOR/Bill Differentials
Source: Salomon Smith Barney.
T-bill-based floaters offer a greater nominal return,
but have basis risk.
September 24, 2002 Student Loan ABS Primer
30
Generic Student Loan Structures
The generic student-loan ABS structure is an owner trust that issues one or more classes of sequential-pay, triple-A rated notes and a single class of single-A rated certificates.
Entities subject to the federal bankruptcy code generally use a standard two-stage transfer of assets. An operating company sells loans to a wholly owned, bankruptcy- remote, special-purpose subsidiary, which transfers loans to a trust. Issuers, such as owner trusts, that are not eligible lenders under FFELP regulations must use an eligible lender trustee to hold legal title to the loans for the benefit of the trust. The trust holds the beneficial, or economic ownership, interest in the loans.
Note and certificate rates reset monthly to one-month LIBOR, or quarterly to three-month LIBOR, or weekly, to the bond-equivalent yield on the 91-day Treasury bill. Interest on LIBOR-indexed securities is accrued on an actual/360 basis and is paid monthly or quarterly. Interest on Treasury bill-indexed securities is accrued on an actual/actual calendar-day basis and is paid quarterly. Both LIBOR- and Treasury bill-indexed securities were typically subject to available funds rate caps, with absolute rate caps rare. However, beginning with SMS’s 2000-A transaction, transactions have generally not included an available funds cap.
The auction rate market has emerged as a very active market for student loan-backed bonds. This market allows issuers to effectively issue long-term bonds and investors to have the ability to buy in and out of these same bonds on a monthly basis without the risk of having to sell the bonds below par. Taxable bonds typically reprice every 7 to 28 days, while tax-exempt bonds reprice every 35 days.
Principal is paid monthly or quarterly, equal to the sum of principal collections (including guaranty claims payments) and the principal balance of repurchased and liquidated loans. Liquidated loans are defaulted loans written off because of an uncured, rejected claim.
Credit support for the triple-A rated senior notes comes from excess spread, subordination of cash flows from the single-A rated certificates, and a small reserve fund. Credit support for the single-A rated certificates is provided by excess spread and the reserve fund.
Loan servicers must deposit monthly collections from borrowers to the trust within two business days of receipt. Guarantor claims payments and DOE special allowance and interest subsidy payments are made to the eligible lender trustee, who also must deposit funds to the trust within two business days. Subject to a ratings trigger, most structures allow highly rated administrators—generally the parents of the sellers—to commingle collections from the servicer and the eligible lender trustee for up to 90 days.
Many student-loan offerings have used pre-funding accounts. Some structures replace or supplement pre-funding accounts with short revolving periods. Most structures have a ten-year auction call or mandatory clean-up call from excess spread.
Transactions are typically owner trusts.
The market also utilizes auction rate securities, repricing every 7 to 35
days.
Credit support is from excess spread and a single-A subordinate
class.
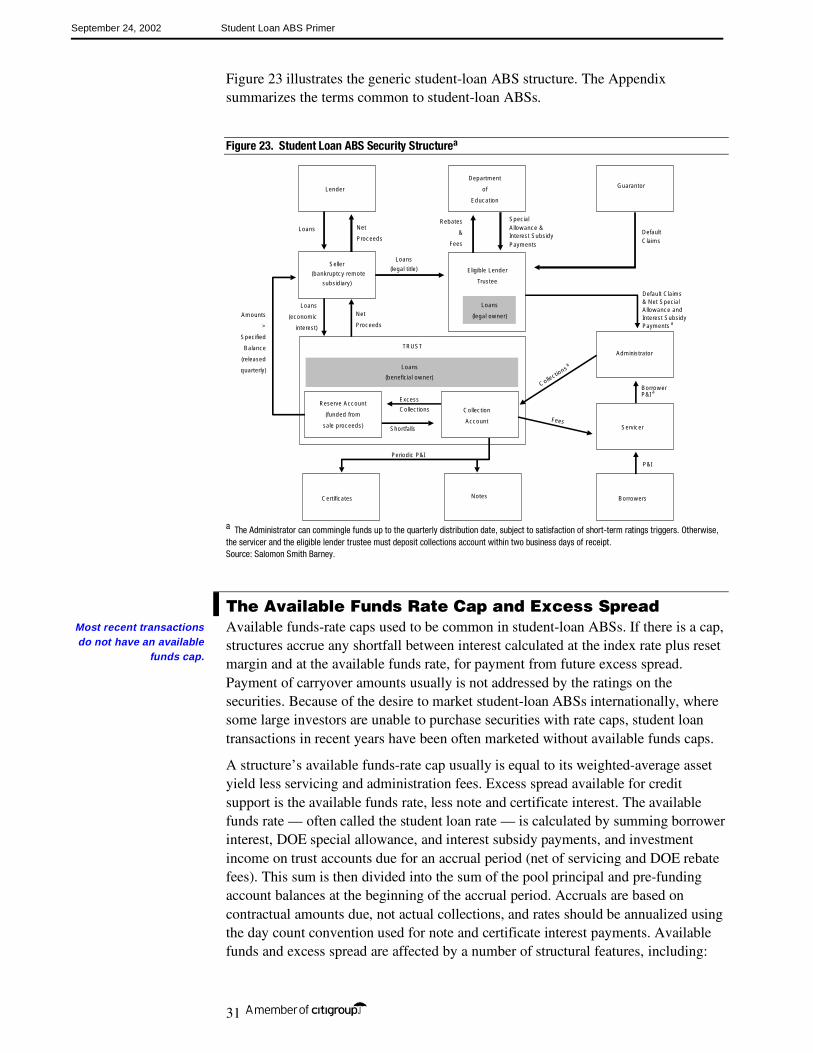
September 24, 2002 Student Loan ABS Primer
31
Figure 23 illustrates the generic student-loan ABS structure. The Appendix summarizes the terms common to student-loan ABSs.
Figure 23. Student Loan ABS Security Structurea
Department
of
Education
GuarantorLender
Seller
(bankruptcy remote
subsidiary)
Eligible Lender
Trustee
Loans
(legal owner)
TRUST
Loans
(beneficial owner)
Collection
Account
SpecialAllowance &Interest SubsidyPayments
Rebates
&
Fees
Net
Proceeds
Loans
Excess
CollectionsReserve Account
(funded from
sale proceeds) Shortfalls
Administrator
Servicer
BorrowersCertificates Notes
Loans
(legal title)
Amounts
>
Specified
Balance
(released
quarterly)
Net
Proceeds
Loans
(economic
interest)
DefaultClaims
Default Claims& Net SpecialAllowance andInterest SubsidyPayments a
BorrowerP&I a
P&I
Collections
Fees
Periodic P&I
a
a The Administrator can commingle funds up to the quarterly distribution date, subject to satisfaction of short-term ratings triggers. Otherwise, the servicer and the eligible lender trustee must deposit collections account within two business days of receipt. Source: Salomon Smith Barney.
The Available Funds Rate Cap and Excess Spread Available funds-rate caps used to be common in student-loan ABSs. If there is a cap, structures accrue any shortfall between interest calculated at the index rate plus reset margin and at the available funds rate, for payment from future excess spread. Payment of carryover amounts usually is not addressed by the ratings on the securities. Because of the desire to market student-loan ABSs internationally, where some large investors are unable to purchase securities with rate caps, student loan transactions in recent years have been often marketed without available funds caps.
A structure’s available funds-rate cap usually is equal to its weighted-average asset yield less servicing and administration fees. Excess spread available for credit support is the available funds rate, less note and certificate interest. The available funds rate — often called the student loan rate — is calculated by summing borrower interest, DOE special allowance, and interest subsidy payments, and investment income on trust accounts due for an accrual period (net of servicing and DOE rebate fees). This sum is then divided into the sum of the pool principal and pre-funding account balances at the beginning of the accrual period. Accruals are based on contractual amounts due, not actual collections, and rates should be annualized using the day count convention used for note and certificate interest payments. Available funds and excess spread are affected by a number of structural features, including:
Most recent transactions do not have an available
funds cap.
September 24, 2002 Student Loan ABS Primer
32
Collateral Mix
Collateral mix affects asset yield. The lender yield on almost all seasoned FFELP loans equals the weekly average of the 91-day Treasury-bill rate plus a gross margin of 2.80% to 3.25%. Stafford loans originated on or after July 1, 1998, however, pay only a 2.20% lender margin on loans when the borrower is still attending school and servicing costs are relatively low. This means that pools with high proportions of recently originated, in-school Stafford loans, will have weaker excess spread and a lower available funds-rate cap than pools of seasoned collateral loans with generic 3.10%–3.25% margins. Separately, the SAP paid on Stafford Loans originated after January 1, 2000, is based on the daily average of three-month financial CP rate for the previous quarter plus a margin in between 1.74% and 2.34%. PLUS loans are eligible for special allowance payments only when the borrower rate is at its maximum rate. In high interest-rate environments, PLUS loans look like generic Stafford pools. In low, but rising, rate environments, pools with high PLUS concentrations will experience weakening excess spread and a tightening available funds rate cap relative to generic Stafford collateral.11 Appendix 26A describes FFELP loan collateral in detail.
Negative Carry
Asset yield is stressed when pool assets include assets subject to negative carry. Routine sources of negative carry in student-loan ABSs include principal collections commingled for up to three months in low-interest-bearing collection accounts; pre-funding account balances invested at less than the weighted average of the note and certificate rates; negative equity; accrued capitalized interest that is classified as principal under ABS investor reporting, but that does not generate contractual interest from the borrower until it is converted to principal at loan repayment; and cure periods for rejected claims, if the seller or servicer is not obligated to cover accrued interest lost on the loan during the time it takes for the rejected loan to be cured. (Remember that cured rejected claims usually are loans that are made eligible for loan guaranty payments, not necessarily loans that are restored to current payment status.) Potential, but unlikely, sources of negative carry include delayed payments from the DOE or guaranty agencies.
Servicing Fees
Given relatively homogeneous collateral pools and structures, servicing fees cause some student-loan ABSs to be more sensitive to available funds- rate caps than other structures and to have less excess spread than other structures. Existing pools have annual servicing fees that range from 23bp to 167bp, with average servicing fees of approximately 90bp. This range is material if asset yield also is strained by adverse collateral mix and negative carry. Some structures compensate for early-period spread weakness by charging graduated servicing fees over time, or lower servicing fees for loans with in-school status.
11
PLUS borrower rates adjust annually to the 91-day Treasury bill rate plus a 3.10%-3.25% margin. Given a generic 3.10% margin and 9%-12% caps, most PLUS loans will be capped when the rate on the 91-day Treasury bill on the annual adjustment date is more than 5.91%.
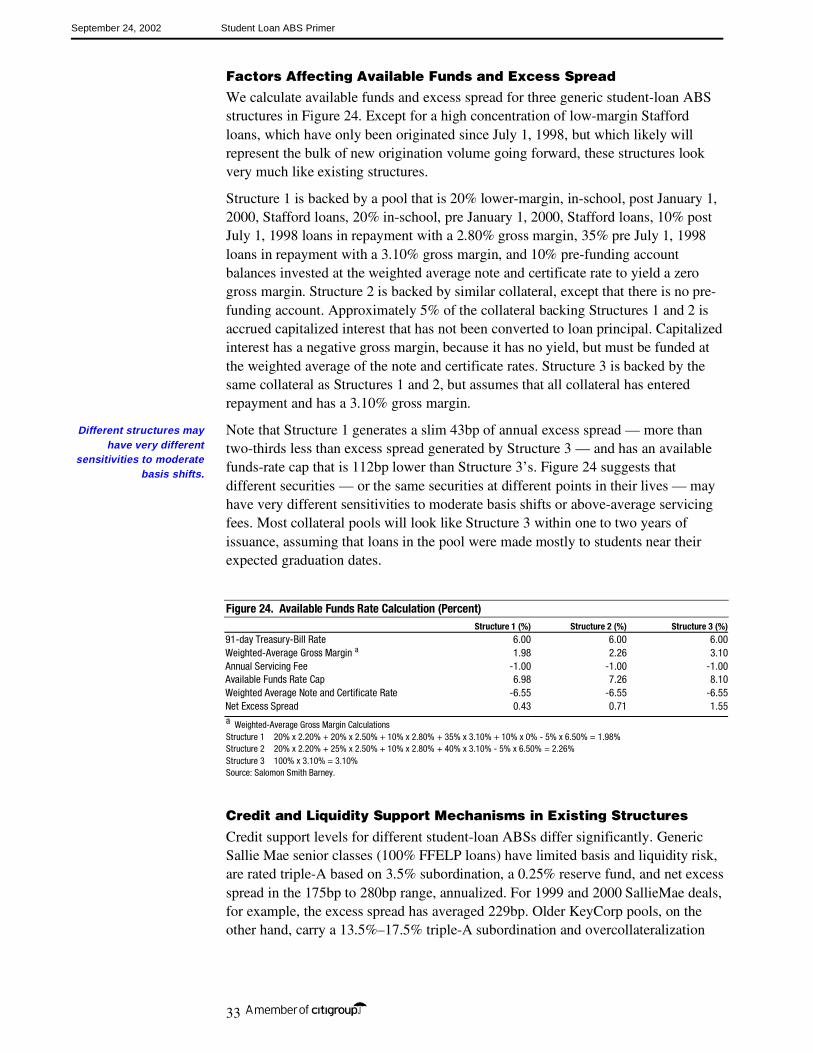
September 24, 2002 Student Loan ABS Primer
33
Factors Affecting Available Funds and Excess Spread
We calculate available funds and excess spread for three generic student-loan ABS structures in Figure 24. Except for a high concentration of low-margin Stafford loans, which have only been originated since July 1, 1998, but which likely will represent the bulk of new origination volume going forward, these structures look very much like existing structures.
Structure 1 is backed by a pool that is 20% lower-margin, in-school, post January 1, 2000, Stafford loans, 20% in-school, pre January 1, 2000, Stafford loans, 10% post July 1, 1998 loans in repayment with a 2.80% gross margin, 35% pre July 1, 1998 loans in repayment with a 3.10% gross margin, and 10% pre-funding account balances invested at the weighted average note and certificate rate to yield a zero gross margin. Structure 2 is backed by similar collateral, except that there is no pre-funding account. Approximately 5% of the collateral backing Structures 1 and 2 is accrued capitalized interest that has not been converted to loan principal. Capitalized interest has a negative gross margin, because it has no yield, but must be funded at the weighted average of the note and certificate rates. Structure 3 is backed by the same collateral as Structures 1 and 2, but assumes that all collateral has entered repayment and has a 3.10% gross margin.
Note that Structure 1 generates a slim 43bp of annual excess spread — more than two-thirds less than excess spread generated by Structure 3 — and has an available funds-rate cap that is 112bp lower than Structure 3’s. Figure 24 suggests that different securities — or the same securities at different points in their lives — may have very different sensitivities to moderate basis shifts or above-average servicing fees. Most collateral pools will look like Structure 3 within one to two years of issuance, assuming that loans in the pool were made mostly to students near their expected graduation dates.
Figure 24. Available Funds Rate Calculation (Percent) Structure 1 (%) Structure 2 (%) Structure 3 (%)91-day Treasury-Bill Rate 6.00 6.00 6.00Weighted-Average Gross Margin a 1.98 2.26 3.10Annual Servicing Fee -1.00 -1.00 -1.00Available Funds Rate Cap 6.98 7.26 8.10Weighted Average Note and Certificate Rate -6.55 -6.55 -6.55Net Excess Spread 0.43 0.71 1.55a Weighted-Average Gross Margin Calculations Structure 1 20% x 2.20% + 20% x 2.50% + 10% x 2.80% + 35% x 3.10% + 10% x 0% - 5% x 6.50% = 1.98% Structure 2 20% x 2.20% + 25% x 2.50% + 10% x 2.80% + 40% x 3.10% - 5% x 6.50% = 2.26% Structure 3 100% x 3.10% = 3.10% Source: Salomon Smith Barney.
Credit and Liquidity Support Mechanisms in Existing Structures
Credit support levels for different student-loan ABSs differ significantly. Generic Sallie Mae senior classes (100% FFELP loans) have limited basis and liquidity risk, are rated triple-A based on 3.5% subordination, a 0.25% reserve fund, and net excess spread in the 175bp to 280bp range, annualized. For 1999 and 2000 SallieMae deals, for example, the excess spread has averaged 229bp. Older KeyCorp pools, on the other hand, carry a 13.5%–17.5% triple-A subordination and overcollateralization
Different structures may have very different
sensitivities to moderate basis shifts.
September 24, 2002 Student Loan ABS Primer
34
levels, owing to the presence of 30% to 40% non-FFELP supplemental collateral in their collateral mix.
Single-A-rated student loan subordinated certificates generally have been backed by a minimal reserve fund and excess spread. Although this credit support structure may seem sparse, particularly compared with single-A credit support structures for credit cards and retail auto collateral, it is similar to credit support for subordinated ABSs backed by other assets with long maturities, such as manufactured housing and recreational vehicle loans. Assets with 15- to 20-year maturities are expected to generate significant excess spread over their lifetimes.
With the exception of TERI, which reports extensive static pool data, supplemental programs have limited static-pool loss histories, and required credit support levels for supplemental loans are relatively high compared with other types of ABS collateral. Recent KeyCorp pools that are 50% to 60% FFELP loans by principal balance have triple-A subordination/overcollateralization levels of approximately 11.25%. Assuming a 3.5% level for the FFELP collateral, a 11.25% weighted average level suggests 19% triple-A subordination/overcollateralization levels for the supplemental loans in the pool.
Supplemental loans may or may not be guaranteed by a third party, such as the borrower’s school or an affiliated 501(c)(3) corporation. Law school access loans included in Access Group ABSs, for example, are guaranteed by The Education Resources Institute, Inc. (TERI), a non-profit corporation that administers private scholarship and financial aid programs for affiliated schools. Moody’s and Fitch currently rate TERI Baa3 and A, respectively.
The long maturity of the assets creates
significant excess spread over the lifetime
of the security.
September 24, 2002 Student Loan ABS Primer
35
Risks Assessment
Rejected Claims and Credit and Liquidity Risks The primary risk of principal loss in most student-loan ABSs backed by FFELP loans is the risk that servicing error will cause uncured, rejected claims. Reporting on servicer performance has improved, but many student loan offerings have not disclosed even minimal information about the size of the servicer’s portfolio, historical delinquency and default rates, or the servicer’s or the seller’s historical rejected and cured claims rates. An interesting point to consider is that issuers provide extensive information about guarantor performance, which has not been a credit risk since 1992, likely because the DOE collects and reports this data.
Relatively low required credit support levels for pools of FFELP collateral suggest that rejected claims rates are minimal, as do servicer repurchase obligations. (We assume that repurchase obligations are triggered at levels that are set at or above historical rejected claims rates.) The USA Group’s Loan Services, Inc., for example, is obligated to repurchase defective loans from SMS pools when annualized losses from rejected claims exceed 15bp of recent outstanding principal balance. Sallie Mae is obligated to repurchase defective loans from SLM pools when unpaid rejected claims exceed approximately 1% of the outstanding pool balance. Sallie Mae's loan loss provision expense for its on-balance-sheet portfolio also suggests that rejected claims are probably less than 10bp annually, as a percentage of outstandings. (Sallie Mae’s provision expense, however, reflects only errors that it makes as loan servicer. Lenders who sold the loans to Sallie Mae typically bear the cost of any rejected claims resulting from origination error.)
Most structures have some form of seller repurchase or servicer purchase obligation, a significant strength considering the high credit quality of most student loan sellers and servicers. These purchase obligations generally are not considered a source of ABS credit support by the rating agencies, to isolate the ABS security ratings from corporate downgrade risk. Investors should review the sections of the prospectus that summarize the transfer and servicing agreements because seller/servicer purchase obligations differ materially among structures and different lenders have different servicing contracts with third-party servicers.
Co-insurance Risk
Some ABS structures lack a mechanism to access the 2% credit support to offset a principal loss until the final maturity of the security. The most subordinated class of securities in these structures is sensitive to principal loss to the extent that losses on co-insured loans might exceed the reserve fund balance on the final maturity date of the ABS. Investors should review an offering’s principal distribution formula to make sure that the amount of the co-insurance loss incurred in a quarter is promised to investors each quarter, thereby triggering a draw on excess spread or the reserve fund.
The main risk of principal loss is rejected
claims.
However, rejected claims appear to be minimal.
September 24, 2002 Student Loan ABS Primer
36
Negative Equity
Student-loan ABSs are unique in the ABS market in that some pools have been issued with 1%–3% negative equity — that is, with 1% to 3% less collateral than the par amount of securities issued. Negative equity usually is a result of purchase of the loan collateral by the trust at a 102%–104% premium and the financing of issuance costs in the transaction.
We do not believe that moderate levels of negative equity represent a credit risk, given the long time period available to most student-loan ABSs to generate sufficient excess spread necessary to cure the shortfall. Purchase of loans at a premium should cease two or three years after issuance, however, to allow the pool time to generate sufficient excess spread to reduce bond principal down to the loan balance.
Basis Risk
Available funds rate caps in older student-loan ABS structures prevent note and certificate rates from exceeding net asset yield. Basis risk between asset yield and the weighted average of the note and certificate rates is minimal in structures where both asset yield and liability cost are indexed to the same Treasury bill rate. Structures with Treasury bill-indexed Stafford loans funded by LIBOR-indexed notes and certificates, however, are subject to basis risk. This has been partially remedied as of January 1, 2000, after which SAP was indexed to the three-month financial CP rate, an index that tracks more closely to the three-month LIBOR than does the 91-day Treasury bill. Structures with PLUS collateral funded by either LIBOR- or Treasury bill-indexed obligations are subject to both interest-rate risk and basis risk in low and moderate interest-rate environments, when the PLUS loans are effectively capped at the borrower rate. In high-rate environments, when PLUS loans receive uncapped special allowance payments indexed to the 91-day Treasury-bill rate, like Stafford loans, structures with PLUS loans have no interest-rate risk, and basis risk only if they have LIBOR-indexed obligations.
The probability that a student-loan ABS will hit its available funds rate cap as a result of basis risk is minimal. Historical spreads between 91-day Treasury-bill rates averaged over one month (the index for asset yield) and one-month LIBOR at the beginning of the month (the index for note and certificate rates) suggest that there is little risk that a student-loan ABS available funds cap will be hit because of adverse basis movement. This data would also suggest that default risk (the possibility that expenses in a given period would be greater than available funds) associated with transactions that are structured without available funds rate caps is also minimal. Excess spread erosion is a concern, however, for securities that also have high servicing costs or negative carry. Historical spreads also suggest that PLUS collateral does not add substantial risk of hitting the available funds rate cap or potential for excess spread erosion.
To protect themselves against spread erosion and potential downgrade risk, investors in LIBOR-indexed securities may prefer to hold seasoned versus unseasoned collateral or pools with low PLUS concentrations. Investors also should remember that the rating agencies generally incorporate adverse assumptions about basis movement into their rating levels and that actual basis shifts must be more adverse than these expected levels to trigger a ratings downgrade.
Newer transactions do not have basis risk.
September 24, 2002 Student Loan ABS Primer
37
Liquidity Risk
Student-loan ABSs are more subject to liquidity risk than other ABS structures, primarily because of delayed payments from the DOE and guarantors. In addition, delinquency rates can ramp up to 18% to 20% of total pool balance over the first months after offering. Loans in deferral or forbearance payment status often add up to another 10%–20% of pool principal. Liquidity risk affects the timing of the payment of interest to subordinated classes, with the risk most extreme immediately after issuance and for structures that pay certificate interest junior to note principal.
It is possible for actual cash collections for a student loan pool in the early periods after sale to be significantly less than the accrued amount due — a risk that the rating agencies are well aware of, and so they size it into their required reserve account levels. As a result, transactions may draw on their reserve accounts or borrow from future period collections to cover liquidity shortfalls. These draws generally are cured within one to two quarters, when high monthly delinquencies and delayed federal support payments, should they occur, cure themselves on a rolling basis.
Many structures can draw on their reserve fund to cover both principal and interest shortfalls. High losses in a single distribution period — a possible, but unlikely, scenario — could exhaust reserve funds for several periods, removing liquidity support available to pay subordinated interest until the reserve fund is replenished. Certain supplemental loan structures, such as those from the University Support Services and Nellie Mae, reallocate subordinated certificate interest to make accelerated principal distributions to the senior classes if required overcollateralization levels for the senior classes of securities are breached. Investors concerned about delayed interest payments should purchase subordinated classes where certificate interest is paid senior to note principal, or where reserve fund draws are limited to interest only, such as in the generic Sallie Mae structure.
Co-Mingling Risk
The presence of highly rated sellers and servicers in the student loan sector introduces commingling risk of a magnitude not typically seen in other ABS sectors. The ability of the administrator in most student-loan ABSs to commingle funds over a quarterly collection period means that as much as 5%–8% of pool balances are subject to short-term corporate credit risk. The necessity of using eligible lender trustees to hold legal title to federally insured student loans adds a unique co-mingling risk to student-loan ABS structures. The DOE may assume that all loans held by the trustee comprise a single loan portfolio for purposes of calculating special allowance and interest subsidy payments. If monthly rebate and other amounts due to the DOE from a single pool held by the trustee exceed payments due to that pool, cash flows due to other pools also held by the trustee could experience temporary or permanent cash flow shortages until they are reimbursed by the deficit pool. We believe that trustee commingling risk is minor for eligible lender trustees that hold large, diversified loan pools.
The cash reserve account compensates for
the delays involved in actual cash collections.
Quarterly payments introduces co-mingling risks not typically seen
in other ABSs.
September 24, 2002 Student Loan ABS Primer
38
Other Structural Risks
Qualitative Servicing Risk
Student-loan ABSs have servicing risks that may be more significant than rejected claims risk, although these risks are more difficult to quantify. Many servicing contracts, for example, have contract termination fees and task-based fees that are paid senior to note and certificate distributions. These fees may not be trivial. The DOE, for example, could require extensive new due diligence procedures or other servicing requirements that could involve one-time or continuing data processing expense that is paid senior to note and certificate interest. Servicing contracts also may not last the full life of a loan pool, and servicing fees may have to be increased to attract a new servicer.
Although servicing risk is not likely to create a principal loss on a transaction, reduced available funds-rate caps could affect security price, and weakened excess spread could increase downgrade risk. We believe that servicing risk could cause spread relationships to shift among transactions over time. Investors may prefer to purchase an issue that has a highly rated master servicer committed to servicing the pool over the life of the securities. Alternative attractive selections include issues in which the seller and servicer are owned by the same economic entity, such as in the Sallie Mae and SMS structures.
Regulatory Risk
Deficit reduction measures could significantly affect the economics of the student loan industry. To the extent that the industry is highly concentrated, certain sellers or issuers, such as Sallie Mae, could be particularly vulnerable to regulatory action. The federal government could take adverse action without changing the terms of existing loans, for example, by offering attractively priced consolidation loans to current borrowers. A general industry contraction could cause servicers to exit the business or cause unit costs for loan servicing to increase, affecting servicing quality.
We consider regulatory risk to be remote, but not improbable. The only protection investors have is to purchase pools from larger, or repeat issuers that have an incentive to spend their own funds to litigate if necessary to protect the performance of existing pools.
Prefunding and Recycling — Prepayment and Extension Risk Many student-loan ABSs have had pre-funding accounts that ranged from 10% to 20% of initial pool assets. Most structures limit pre-funding activity to the purchase each month of accrued capitalized interest on loans owned by the trust, to the purchase of loans to existing borrowers held outside the trust that must be purchased by the trust to originate a consolidation loan, and to the purchase of serial loans, which are loans to existing borrowers to finance additional years of schooling. Prefunding generally is limited to one year.
Some transactions replace or supplement pre-funding accounts with recycling. Recycling uses principal collections to purchase loans from existing and new borrowers rather than to pay down principal on the notes. Illinois Student Assistance

September 24, 2002 Student Loan ABS Primer
39
Commission Series 5 and 6, for example, have a short revolving period following its pre-funding period, while some SMS pools allow unrestricted purchase of serial loans from principal collections over the full life of the pool.
Most student-loan ABSs place extensive restrictions on the type of loans that can be purchased during pre-funding and recycling periods. Such restrictions include limits on the maximum amount of consolidation and serial loans that can be purchased (to limit extension risk) and limits on the purchase of loans that may have significantly different remaining terms or margin.
Given restrictions on potential asset purchases, we believe that student-loan ABS prefunding accounts and recycling can strengthen a structure. Prefunding and recycling can strengthen liquidity during periods when the structure has a high percentage of loans with capitalized interest, by reclassifying principal collections as current interest for pool accounting purposes. Purchase of serial loans also reduces the likelihood that a borrower will take out loans with a lender other than the trust. This reduces the probability that the borrower will receive a consolidation loan from a lender other than the trust upon graduation, which reduces prepayment risk. However, pre-funding accounts and recycling complicate prepayment measurement and modeling.
Some structures purchase additional loans at a premium. This is not a credit risk if the purchase premium is paid from excess spread that would be released from the structure anyway. However, the purchase of assets at a premium introduces the same risk to a pool as issuance of bond principal in excess of asset value. The risk is that the loans may be prepaid or called at auction before the pool has generated sufficient excess spread to align asset balances with note and certificate balances.
Collateral Auctions and Other Call Provisions Many student-loan ABS structures have required that the trustee auction the collateral approximately ten years after the issuance date, with some structures supplementing or replacing this auction call with a mandatory clean-up call from excess spread. Because almost all student-loan ABSs have auction calls, auction calls should not affect relative performance within the sector. Absent extended deferral periods, most pool balances also should be significantly reduced by their auction date, giving the auction call the same performance implications as a clean-up call in other ABS sectors.
Principal Payment Rates: Scheduled Payments, Prepayments, and Defaults Intuition and anecdotal evidence suggest that the following factors affect student loan principal payments:
Refinancing Risk
Student loan collateral is not generally subject to interest-rate-related refinancing risk because of a lack of economically attractive alternative loan sources. Consolidation loans are becoming better publicized, but are generally made at the same or a higher rate than the weighted-average rate on the student's existing loans. The
Some structures purchase premium
loans at a premium.
September 24, 2002 Student Loan ABS Primer
40
extraordinarily low current consolidation rate has resulted in a wave of refinancing with consolidation loans. However, we do not expect this refinancing wave to continue once the yield curve flattens and interest rates rise.
Collateral Mix
Loan type, loan status, and school type are the important collateral characteristics to look at when projecting principal payments. Pools with high concentrations of loans in grace status, for example, may be about to experience a rapid increase in principal payments, as loans enter repayment. Pools with high concentrations of SLS loans,12 which industry studies have shown have high expected default rates, could pay down faster than pools made up primarily of subsidized Stafford loans to students from four-year institutions. Loans with high average balances may be more subject to consolidation risk, which could manifest itself in rapid early period repayments in pools that do not have mechanisms to buy loans from outside the pool, or extension risk, in pools able to convert existing collateral to longer-maturity consolidation loans. Low-average-balance loans could pay down faster than larger loans, because the minimum $600 annual payment will amortize the loans more quickly than ten years. In high-rate environments, pools of Stafford loans will amortize more quickly than PLUS loans, because the 8.25%–10% borrower rate caps on the Stafford loans are less than the 9%–12% caps on the PLUS loans.
Cohort Defaults
Numerous industry studies suggest that default risk is highest during a student loan’s first three years of repayment, with school type determining the magnitude of the default curve. Figure 25 shows cohort default rates calculated by the DOE for Stafford loans. These cohort default rates represent the cumulative initial principal balance of loans that entered repayment in a fiscal year and defaulted during the next fiscal year, expressed as a percentage of the initial principal balance of all similar loans that entered repayment in the same calendar year. With the exception of rates for proprietary schools and private two-year institutions, the DOE cohort default rates were stable over time, at 9%–13% cumulatively, and then began falling gradually throughout the 1990s. Proprietary trade schools, however, showed extremely high cohort default rates — in the 44%–57% range — likely reflecting aggressive student enrolment practices during the late 1980s that since have been limited. Proprietary school default rates have continued to decrease at a much higher rate over time than many of the other loan types, reflecting stricter DOE standards. DOE data also suggest that as much as one-half of three-year cumulative defaults are first-payment defaults. This could cause ABSs with concentrated first-payment dates to show very high one-quarter principal payment rates six to nine months after the occurrence of the first payment dates.
DOE cohort default rates cover the period between 1985 and 1998, during the early years of which the loan programs were very different from current programs. The cohorts include students in school during the early 1980s, when all students were eligible for interest subsidies. This may have drawn a higher proportion of wealthier students into the program than in more recent years. The DOE cohort default studies
12
The majority of SLS borrowers have been proprietary school students.
Default risk is highest in the first three years.
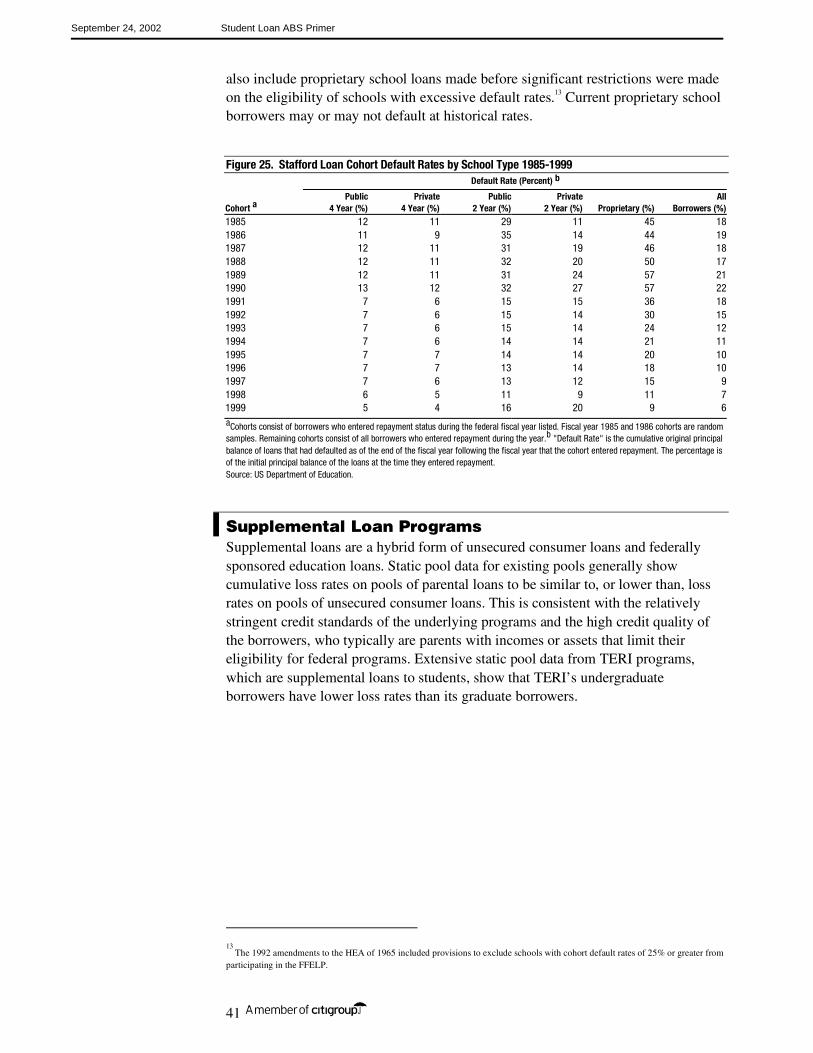
September 24, 2002 Student Loan ABS Primer
41
also include proprietary school loans made before significant restrictions were made on the eligibility of schools with excessive default rates.13 Current proprietary school borrowers may or may not default at historical rates.
Figure 25. Stafford Loan Cohort Default Rates by School Type 1985-1999 Default Rate (Percent) b
Public Private Public Private AllCohort a 4 Year (%) 4 Year (%) 2 Year (%) 2 Year (%) Proprietary (%) Borrowers (%)
1985 12 11 29 11 45 181986 11 9 35 14 44 191987 12 11 31 19 46 181988 12 11 32 20 50 171989 12 11 31 24 57 211990 13 12 32 27 57 221991 7 6 15 15 36 181992 7 6 15 14 30 151993 7 6 15 14 24 121994 7 6 14 14 21 111995 7 7 14 14 20 101996 7 7 13 14 18 101997 7 6 13 12 15 91998 6 5 11 9 11 71999 5 4 16 20 9 6aCohorts consist of borrowers who entered repayment status during the federal fiscal year listed. Fiscal year 1985 and 1986 cohorts are random samples. Remaining cohorts consist of all borrowers who entered repayment during the year.b "Default Rate" is the cumulative original principal balance of loans that had defaulted as of the end of the fiscal year following the fiscal year that the cohort entered repayment. The percentage is of the initial principal balance of the loans at the time they entered repayment. Source: US Department of Education.
Supplemental Loan Programs Supplemental loans are a hybrid form of unsecured consumer loans and federally sponsored education loans. Static pool data for existing pools generally show cumulative loss rates on pools of parental loans to be similar to, or lower than, loss rates on pools of unsecured consumer loans. This is consistent with the relatively stringent credit standards of the underlying programs and the high credit quality of the borrowers, who typically are parents with incomes or assets that limit their eligibility for federal programs. Extensive static pool data from TERI programs, which are supplemental loans to students, show that TERI’s undergraduate borrowers have lower loss rates than its graduate borrowers.
13
The 1992 amendments to the HEA of 1965 included provisions to exclude schools with cohort default rates of 25% or greater from participating in the FFELP.
September 24, 2002 Student Loan ABS Primer
42
Appendix. FFELP Terms
Eligible Students and Institutions Students are eligible to receive a FFELP loan if they are enrolled at least half-time in eligible institutions, have a demonstrated financial need, as calculated by a central federal processing service, and have not reached annual and lifetime borrowing limits or defaulted on existing education loans. Eligible institutions are accredited public or non-profit two-year or four-year colleges or universities. Trade schools with shorter vocational courses also can be eligible institutions if the schools meet conditions that include satisfactory historical default rates.
Guaranty Payments and Federal Reinsurance FFELP loans are guaranteed by a state guaranty agency and reinsured by the DOE. Lenders receive 100% of defaulted principal and interest on loans disbursed prior to October 1, 1993, and 98% of defaulted principal and accrued interest due on loans disbursed on or after October 1, 1993. Default due to the borrower’s death, disability, or bankruptcy is covered at 100%, and default is generally defined as 180 days past due for loans originated before July 1, 1998, and 270 days past due after such date.
A guaranty agency can reject a guaranty claim submitted by a lender if the loan was not originated or serviced according to DOE guidelines. This means that lenders bear default risk on FFELP loans to the extent of uncured servicing errors, with loss severity ranging from the loss of accrued interest, to full loss of principal and interest.
Excessive Claims Guaranty agencies fund their claims payments primarily with reinsurance payments received from the DOE. If the amount of reinsurance claims paid by the DOE to a guarantor in a given year exceeds 5% of the original principal balance of the guarantor’s loans that were in repayment status at the beginning of the year, (the agency’s claims experience), the guarantor's reinsurance rate drops from 98% to 95% of the claim expense. For loans originated before July 1, 1998, and after July 1, 1998, respectively, reinsurance drops to 88% and 85%, for all additional claims submitted during the remainder of the year. If the guarantor’s claims experience exceeds 9%, reinsurance payments on remaining claims are reduced to 78% or 75% for loans originated before July 1, 1998, and after July 1, 1998, respectively. (Comparable reinsurance rates are 100%, 90%, and 80% for loans originated prior to October 1, 1993, and for all loans that defaulted owing to the death, disability, or bankruptcy of the borrower.)
Since the 1992 amendments to the Higher Education Act, the DOE has been required by law to honor the guaranty obligations of insolvent guaranty agencies on terms no more stringent than the terms of the original guaranty. This obligation makes guaranty agency performance primarily a liquidity, rather than a credit risk, in student-loan ABS structures.
September 24, 2002 Student Loan ABS Primer
43
Guarantor performance, however, is still important to ABS investors. Some agencies with claims rates near trigger rates have disputed valid claims to defer recognition of the claim until the following fiscal year. Higher claims rates also are correlated with higher rejected claims risk, because the likelihood of committing a servicing error is highest for seriously delinquent and defaulted loans. Finally, pools with loans backed by guarantors with high claims rates may prepay more quickly than pools of loans from guarantors with low defaults. Most student-loan ABSs offering documents provide extensive loss data for guarantors represented in the collateral pool.
Loan Status A FFELP loan has a defined life cycle. Generally, loans have in-school status when the borrower is enrolled at least half time in a degree program. Loans enter grace status when the borrower graduates or ceases to be enrolled at least half time. Loans to borrowers who return to school, who are in the Peace Corps or the armed forces, or who are temporarily disabled, have deferral status, while loans to borrowers who are unemployed or who are experiencing a temporary financial hardship have forbearance status. Grace periods generally equal six months, while deferral for financial hardship or enlistment in the armed forces or the Peace Corps generally is limited to three years.
Interest Subsidy Payments and Capitalized Interest The DOE makes quarterly interest subsidy payments to lenders equal to accrued interest at the borrower rate for eligible borrowers who have in-school, grace, or deferral loan status. Payments are due to the lender 45 to 60 days after the close of each calendar quarter and are backed by the full faith and credit of the United States. Interest subsidy payments are a major program expense and FFELP program changes over time reflect the conflict between maximum student access to interest-rate subsidies and program cost.
Borrowers who are not eligible for interest subsidies must pay interest currently, or may capitalize interest on loans that are not in repayment status. Capitalized interest generally is added to the principal balance of a FFELP loan only when the loan enters or returns to repayment status, meaning that accrued capitalized interest does not bear interest until it is converted to principal at loan repayment. Capitalized accrued interest introduces negative carry into most student-loan ABS structures, which typically convert capitalized interest to principal monthly for trust accounting purposes. Interest on FFELP loans accrues on a simple interest basis, with the coupon rate applied on an actual/actual day basis.
Figure 26 lists interest payment methods for the major FFELP loan types.

September 24, 2002 Student Loan ABS Primer
44
Figure 26. FFELP Interest Payment Methods Loan Status Subsidized Stafford Unsubsidized Stafford SLS a PLUS Consolidation
In-School Interest Subsidy Capitalized Capitalized NA NA Grace Interest Subsidy Capitalized Capitalized b NA NA Deferral Interest Subsidy Capitalized Capitalized NA Interest Subsidy c Forbearance Capitalized Capitalized Capitalized [Capitalized] Capitalized Repayment Current Current Current Current Current
NA Not applicable. a The SLS program was eliminated July 1, 1994. b SLS interest can be capitalized during the grace period for any outstanding Stafford loans. Otherwise, interest is due currently. c Consolidation loans with applications received between 1/1/93 and 8/9/93 receive interest subsidies during deferral periods. Loans with applications received on or after 8/10/93 receive interest subsidies during deferral periods if all consolidated loans were eligible for subsidies. Source: Various ABS offering documents and Salomon Smith Barney.
Lender Yield and Special Allowance Payments An FFELP loan has a borrower rate and a lender rate. The DOE makes up any difference between the two rates, in the form of quarterly special allowance payments made to lenders when lender yield exceeds borrower rate. SLS and PLUS loans pay special allowance only if the borrower rate was at its maximum rate at the most recent annual reset date for the loan, effectively capping SLS/PLUS lender yield at the borrower rate over most low and moderate interest-rate environments.
The quarterly special allowance payment on a loan generally equals the product of the daily average balance of the loan over the calendar quarter and a rate equal to: (index rate + margin - borrower rate)/4, where index rate generally equals the average of the bond equivalent yields on the 91-day Treasury bill at each weekly auction during the quarter for loans originated before January 1, 2000. For loans originated after January 1, 2000, the index rate is equal to the average of the bond equivalent rates of the quotes of 3-month financial commercial paper rate for the preceding quarter. Margin varies by loan program and disbursement date. Special allowance margins and borrower rates are summarized in Figures 27 and 28 below.
Special allowance payments are due to the lender 45 to 60 days after the close of each calendar quarter and are backed by the full faith and credit of the United States. Special allowance payments have been relatively small in recent years, but have been a significant program expense in high interest-rate environments.
Figure 27. Special Allowance Margins, 25 Jul 02 Loan Disbursement Date Subsidized Stafford (%) Unsubsidized Stafford (%) SLS a,b (%) PLUS b (%) Consolidation c (%)To 10/16/86 3.50 NA 3.50 3.50 NA10/17/86-9/30/92 3.25 NA 3.25 3.25 3.2510/01/92-6/30/95 3.10 3.10 3.10d 3.10 3.107/01/95-6/30/98 In-school, grace or deferral status 2.50 2.50 NA NA NAForbearance or repayment status 3.10 3.10 NA 3.10 3.10Post 7/01/98 In-school, grace or deferral status 2.20 2.20 NA NA NAForbearance or repayment status 2.80 2.80 NA 3.10 3.10Post 1/01/00 In-school, grace or deferral status 1.74 1.74 NA NA NAForbearance or repayment status 2.34 2.34 NA 2.64 2.64NA Not applicable. a The SLS program was eliminated on July 1, 1994. b SLS/PLUS loans pay special allowance only if the borrower rate on a loan is at its maximum rate. c Lender owes a 1.05% annualized rebate fee to the DOE on consolidation loans disbursed on or after 10/1/93. This fee generally is offset against quarterly special allowance and interest subsidy payments due to the lender. d The SLS margin was 280bp during the 1993-1994 school year for loans not in repayment status. SAP for Post 1/1/00 loans is indexed to 3-month financial CP. Source: Salomon Smith Barney and various ABS offering documents.
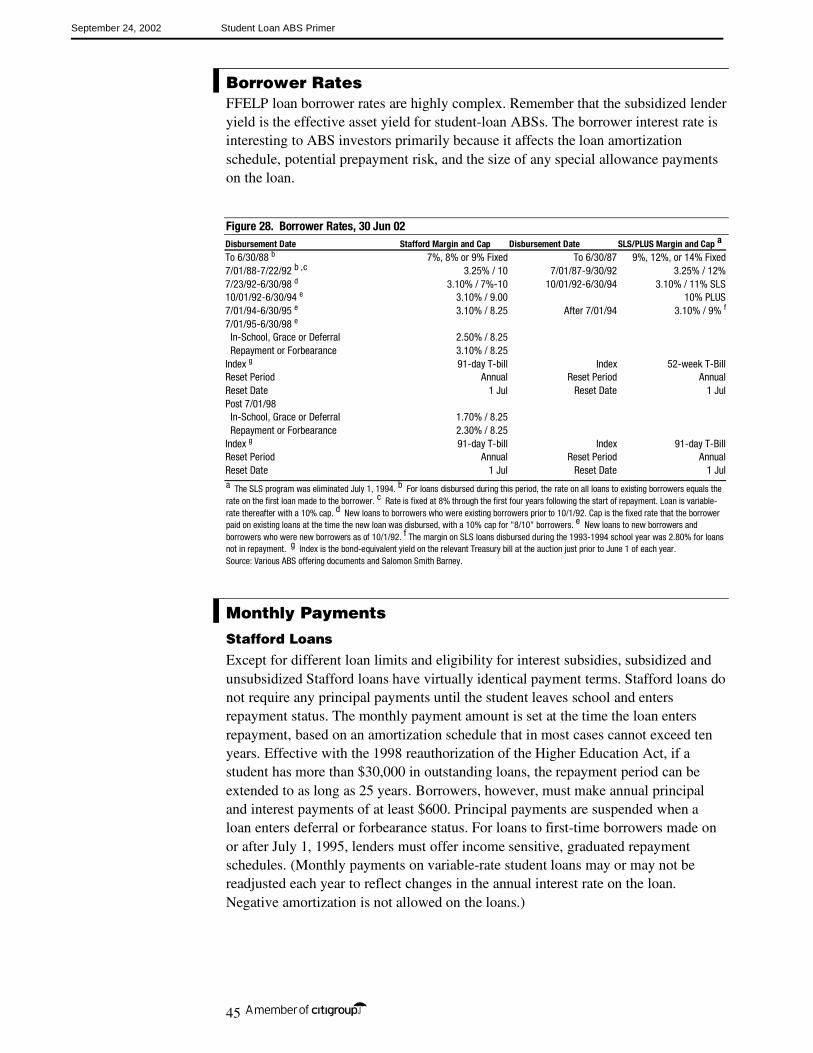
September 24, 2002 Student Loan ABS Primer
45
Borrower Rates FFELP loan borrower rates are highly complex. Remember that the subsidized lender yield is the effective asset yield for student-loan ABSs. The borrower interest rate is interesting to ABS investors primarily because it affects the loan amortization schedule, potential prepayment risk, and the size of any special allowance payments on the loan.
Figure 28. Borrower Rates, 30 Jun 02 Disbursement Date Stafford Margin and Cap Disbursement Date SLS/PLUS Margin and Cap a
To 6/30/88 b 7%, 8% or 9% Fixed To 6/30/87 9%, 12%, or 14% Fixed7/01/88-7/22/92 b ,c 3.25% / 10 7/01/87-9/30/92 3.25% / 12%7/23/92-6/30/98 d 3.10% / 7%-10 10/01/92-6/30/94 3.10% / 11% SLS 10/01/92-6/30/94 e 3.10% / 9.00 10% PLUS7/01/94-6/30/95 e 3.10% / 8.25 After 7/01/94 3.10% / 9% f
7/01/95-6/30/98 e In-School, Grace or Deferral 2.50% / 8.25 Repayment or Forbearance 3.10% / 8.25Index g 91-day T-bill Index 52-week T-BillReset Period Annual Reset Period AnnualReset Date 1 Jul Reset Date 1 JulPost 7/01/98 In-School, Grace or Deferral 1.70% / 8.25 Repayment or Forbearance 2.30% / 8.25Index g 91-day T-bill Index 91-day T-BillReset Period Annual Reset Period AnnualReset Date 1 Jul Reset Date 1 Jula The SLS program was eliminated July 1, 1994. b For loans disbursed during this period, the rate on all loans to existing borrowers equals the rate on the first loan made to the borrower. c Rate is fixed at 8% through the first four years following the start of repayment. Loan is variable-rate thereafter with a 10% cap. d New loans to borrowers who were existing borrowers prior to 10/1/92. Cap is the fixed rate that the borrower paid on existing loans at the time the new loan was disbursed, with a 10% cap for "8/10" borrowers. e New loans to new borrowers and borrowers who were new borrowers as of 10/1/92. f The margin on SLS loans disbursed during the 1993-1994 school year was 2.80% for loans not in repayment. g Index is the bond-equivalent yield on the relevant Treasury bill at the auction just prior to June 1 of each year. Source: Various ABS offering documents and Salomon Smith Barney.
Monthly Payments
Stafford Loans
Except for different loan limits and eligibility for interest subsidies, subsidized and unsubsidized Stafford loans have virtually identical payment terms. Stafford loans do not require any principal payments until the student leaves school and enters repayment status. The monthly payment amount is set at the time the loan enters repayment, based on an amortization schedule that in most cases cannot exceed ten years. Effective with the 1998 reauthorization of the Higher Education Act, if a student has more than $30,000 in outstanding loans, the repayment period can be extended to as long as 25 years. Borrowers, however, must make annual principal and interest payments of at least $600. Principal payments are suspended when a loan enters deferral or forbearance status. For loans to first-time borrowers made on or after July 1, 1995, lenders must offer income sensitive, graduated repayment schedules. (Monthly payments on variable-rate student loans may or may not be readjusted each year to reflect changes in the annual interest rate on the loan. Negative amortization is not allowed on the loans.)
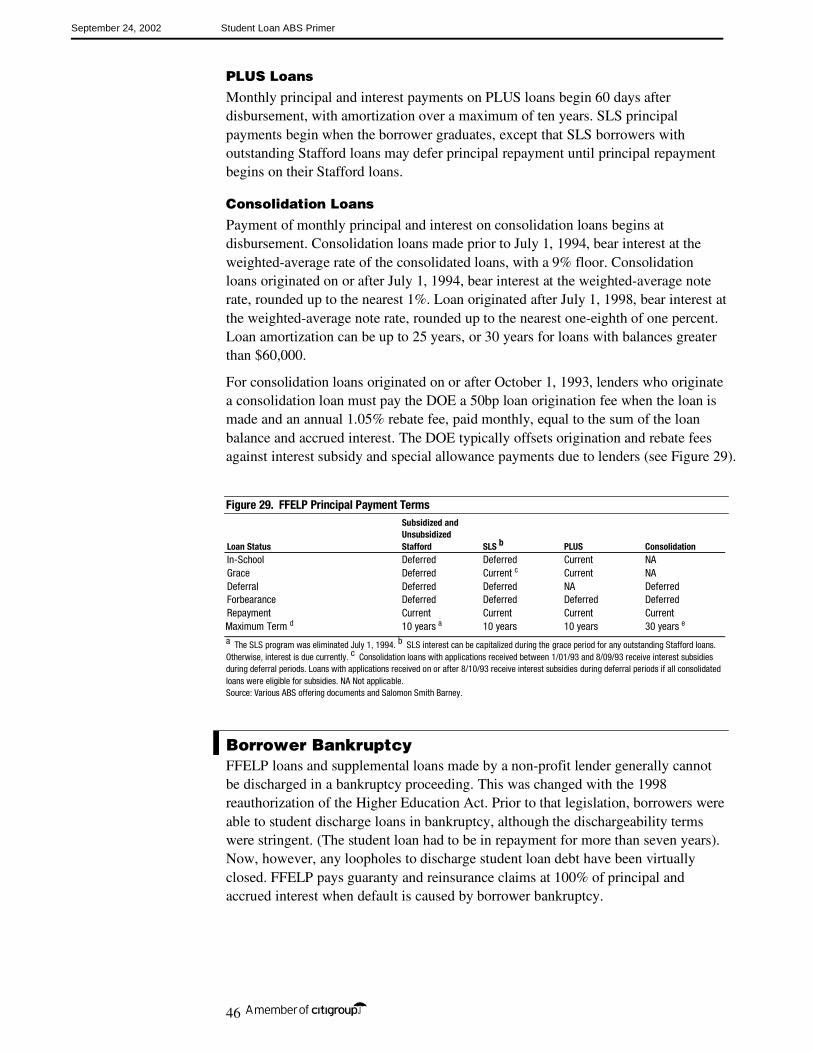
September 24, 2002 Student Loan ABS Primer
46
PLUS Loans
Monthly principal and interest payments on PLUS loans begin 60 days after disbursement, with amortization over a maximum of ten years. SLS principal payments begin when the borrower graduates, except that SLS borrowers with outstanding Stafford loans may defer principal repayment until principal repayment begins on their Stafford loans.
Consolidation Loans
Payment of monthly principal and interest on consolidation loans begins at disbursement. Consolidation loans made prior to July 1, 1994, bear interest at the weighted-average rate of the consolidated loans, with a 9% floor. Consolidation loans originated on or after July 1, 1994, bear interest at the weighted-average note rate, rounded up to the nearest 1%. Loan originated after July 1, 1998, bear interest at the weighted-average note rate, rounded up to the nearest one-eighth of one percent. Loan amortization can be up to 25 years, or 30 years for loans with balances greater than $60,000.
For consolidation loans originated on or after October 1, 1993, lenders who originate a consolidation loan must pay the DOE a 50bp loan origination fee when the loan is made and an annual 1.05% rebate fee, paid monthly, equal to the sum of the loan balance and accrued interest. The DOE typically offsets origination and rebate fees against interest subsidy and special allowance payments due to lenders (see Figure 29).
Figure 29. FFELP Principal Payment Terms Subsidized and Unsubsidized Loan Status Stafford SLS b PLUS Consolidation In-School Deferred Deferred Current NA Grace Deferred Current c Current NA Deferral Deferred Deferred NA Deferred Forbearance Deferred Deferred Deferred Deferred Repayment Current Current Current Current Maximum Term d 10 years a 10 years 10 years 30 years e a The SLS program was eliminated July 1, 1994. b SLS interest can be capitalized during the grace period for any outstanding Stafford loans. Otherwise, interest is due currently. c Consolidation loans with applications received between 1/01/93 and 8/09/93 receive interest subsidies during deferral periods. Loans with applications received on or after 8/10/93 receive interest subsidies during deferral periods if all consolidated loans were eligible for subsidies. NA Not applicable. Source: Various ABS offering documents and Salomon Smith Barney.
Borrower Bankruptcy FFELP loans and supplemental loans made by a non-profit lender generally cannot be discharged in a bankruptcy proceeding. This was changed with the 1998 reauthorization of the Higher Education Act. Prior to that legislation, borrowers were able to student discharge loans in bankruptcy, although the dischargeability terms were stringent. (The student loan had to be in repayment for more than seven years). Now, however, any loopholes to discharge student loan debt have been virtually closed. FFELP pays guaranty and reinsurance claims at 100% of principal and accrued interest when default is caused by borrower bankruptcy.

ADDITIONAL INFORMATION AVAILABLE UPON REQUEST I, Mary E. Kane, hereby certify that the views expressed in this research report accurately reflect my personal views about the subject issuer(s) and its (their) securities. I also certify that I have not been, am not, and will not be receiving direct or indirect compensation in exchange for expressing any specific recommendation(s) in this report.
Salomon Smith Barney ("SSB"), including its parent, subsidiaries and/or affiliates (the “Firm”), may make a market in the securities discussed in this report and may sell to or buy from customers, as principal, securities recommended in this report. The Firm may have a position in securities or options of any issuer recommended in this report. An employee of the Firm may be a director of an issuer recommended in this report. The Firm may perform or solicit investment banking or other services from any issuer recommended in this report.
Within the past three years, the Firm may have acted as manager or co-manager of a public offering of the securities of any issuer recommended in this report. Securities recommended, offered, or sold by the Firm: (i) are not insured by the Federal Deposit Insurance Corporation; (ii) are not deposits or other obligations of any insured depository institution (including Citibank); and (iii) are subject to investment risks, including the possible loss of the principal amount invested.
Although information has been obtained from and is based upon sources the Firm believes to be reliable, we do not guarantee its accuracy and it may be incomplete or condensed. All opinions and estimates constitute the Firm's judgement as of the date of the report and are subject to change without notice. This report is for informational purposes only and is not intended as an offer or solicitation for the purchase or sale of a security.
Investing in non-US securities by US persons may entail certain risks. Investors who have received this report from the Firm may be prohibited in certain US States from purchasing securities mentioned in this report from the Firm; please ask your Financial Consultant for additional details.
This report is distributed in the United Kingdom by Salomon Brothers International Limited, Citigroup Centre, 33 Canada Square, Canary Wharf, London E14 5LB, UK. This material is directed exclusively at market professional and institutional investor customers and is not for distribution to private customers, as defined by the rules of the Financial Services Authority, who should not rely on this material. Moreover, any investment or service to which the material may relate will not be made available to such private customers. This material may relate to investments or services of a person outside of the United Kingdom or to other matters which are not regulated by the Financial Services Authority and further details as to where this may be the case are available upon request in respect of this material. If this publication is being made available in certain provinces of Canada by Salomon Smith Barney Canada Inc. ("SSB Canada"), SSB Canada has approved this publication. This report was prepared by the Firm and, if distributed in Japan by Nikko Salomon Smith Barney Limited, is being so distributed under license. This report is made available in Australia through Salomon Smith Barney Australia Securities Pty Ltd (ABN 64 003 114 832), a Licensed Securities Dealer, and in New Zealand through Salomon Smith Barney New Zealand Limited, a member firm of the New Zealand Stock Exchange. This report does not take into account the investment objectives, financial situation or particular needs of any particular person. Investors should obtain advice based on their own individual circumstances before making an investment decision. Salomon Smith Barney Securities (Proprietary) Limited is incorporated in the Republic of South Africa (company registration number 2000/025866/07) and its registered office is at Citibank Plaza, 145 West Street (corner Maude Street), Sandown, Sandton, 2196, Republic of South Africa. The investments and services contained herein are not available to private customers in South Africa. This publication is made available in Singapore through Salomon Smith Barney Singapore Pte Ltd, a licensed Dealer and Investment Advisor.
Salomon Smith Barney is a registered service mark of Salomon Smith Barney Inc. Schroders is a trademark of Schroders Holdings plc and is used under license. Nikko is a service mark of Nikko Cordial Corporation. © Salomon Smith Barney Inc., 2002. All rights reserved. Any unauthorized use, duplication or disclosure is prohibited by law and may result in prosecution.
FI09C023
(ELECTRONIC)