Embed Size (px)
Citation preview

UNITED STATESSECURITIES AND EXCHANGE COMMISSION
WASHINGTON, D.C. 20549
FORM 8-K
CURRENT REPORT
Pursuant to Section 13 or 15(d) of the Securities Exchange Act of 1934Date of Report (Date of earliest event reported): March 5, 2019
POTLATCHDELTIC CORPORATION(Exact name of Registrant as Specified in Its Charter)
Delaware 001-32729 82-0156045(State or Other Jurisdiction
of Incorporation) (Commission File Number)(IRS Employer
Identification No.)
601 W. First Avenue, Suite 1600Spokane, WA
99201
(Address of Principal Executive Offices) (Zip Code)
Registrant’s Telephone Number, Including Area Code: (509) 835-1500
Not Applicable(Former Name or Former Address, if Changed Since Last Report)
Check the appropriate box below if the Form 8-K filing is intended to simultaneously satisfy the filing obligation of the registrant under any of thefollowing provisions (see General Instructions A.2. below):
☐ Written communications pursuant to Rule 425 under the Securities Act (17 CFR 230.425)
☐ Soliciting material pursuant to Rule 14a-12 under the Exchange Act (17 CFR 240.14a-12)
☐ Pre-commencement communications pursuant to Rule 14d-2(b) under the Exchange Act (17 CFR 240.14d-2(b))
☐ Pre-commencement communications pursuant to Rule 13e-4(c) under the Exchange Act (17 CFR 240.13e-4(c))
Indicate by check mark whether the registrant is an emerging growth company as defined in Rule 405 of the Securities Act of 1933 (§ 230.405 of thischapter) or Rule 12b-2 of the Securities Exchange Act of 1934 (§ 240.12b-2 of this chapter).
Emerging growth company ☐
If an emerging growth company, indicate by check mark if the registrant has elected not to use the extended transition period for complying with anynew or revised financial accounting standards provided pursuant to Section 13(a) of the Exchange Act. ☐
2

Items 7.01.
Regulation FD DisclosureOn March 5, 2019, Michael J. Covey, Chairman and Chief Executive Officer and Jerald W. Richards, Vice President and Chief Financial Officer willpresent at the Raymond James Roadshow Annual Institutional Investors Conference in Orlando, Florida. A copy of the presentation slides arefurnished as Exhibit 99.1 to this report. This exhibit is available on the Company’s website.
The information in this Form 8-K and the Exhibit attached hereto shall not be deemed “filed” for purposes of Section 18 of the Securities ExchangeAct of 1934, as amended, nor shall it be deemed incorporated by reference in any filing under the securities Act of 1933, except as shall beexpressly set forth by specific reference in such filing.
Item 9.01.
Financial Statements and Exhibits(d) Exhibits.
99.1 PotlatchDeltic Investor Presentation Slides, March 2019
3

SIGNATURE
Pursuant to the requirements of the Securities Exchange Act of 1934, the Registrant has duly caused this report to be signed on its behalf by theundersigned hereunto duly authorized.
Dated: March 4, 2019 POTLATCHDELTIC CORPORATION By: /s/ Lorrie D. Scott Lorrie D. Scott Vice President, General Counsel and
Corporate Secretary
4

EXHIBIT INDEX Exhibit Description
99.1 PotlatchDeltic Investor Presentation Slides, March 2019
5

Investor Presentation March 2019

Forward-Looking Statements & Non-GAAP Measures March 2019 FORWARD-LOOKING STATEMENTS This presentation contains certain forward-looking statements within the meaning of the Private Litigation Reform Act of 1995 as amended, including without limitation, statements about long-term economic fundamentals, lumber market dynamics, steady cash flows from real estate sales, 2019 housing starts, North American and U.S. lumber demand, Canadian softwood lumber production, decline of Canadian softwood lumber exports to U.S., future company performance, the company’s business model, opportunities to significantly increase CAD via merger synergies and operational improvements, flexibility to grow and return capital to shareholders, synergy opportunities in legacy Deltic harvest volumes, estimated 2019 and future harvest volumes, estimated Southern contribution to harvest volumes, effect of $10 change in Southern log prices on annual EBITDDA, lumber production, effect of $10 change in lumber prices on annual EBITTDA, southern manufacturing capacity expansions, real estate sales, expectations that high lumber demand and new capacity will tighten southern pine sawtimber stumpage and narrow the gap from trend pricing, opportunities to increase legacy Deltic lumber production and lower per unit costs, competitive mills to benefit from improving housing market and operational synergies, target run rate of legacy Deltic mills, land stratification values, lumber price volatility resulting from trade case regarding Canadian lumber imports, debt maturities, real estate business potential and land development potential, capital allocation, and similar matters. These forward-looking statements are based on current expectations, estimates, assumptions and projections that are subject to change, and actual results may differ materially from the forward-looking statements. Factors that could cause actual results to differ materially include, but are not limited to, changes in timberland values; changes in timber harvest levels on the company’s lands; changes in timber prices; changes in policy regarding governmental timber sales;changes in the United States and international economies; changes in U.S. job growth; changes in U.S. bank lending practices; changes in the level of domestic construction activity; changes in international tariffs, quotas and trade agreements involving wood products; changes in domestic and international demand for wood products; changes in production and production capacity in the forest products industry; competitive pricing pressures for the company’s products; unanticipated manufacturing disruptions; changes in general and industry-specific environmental laws and regulations; unforeseen environmental liabilities or expenditures; weather conditions; changes in fuel and energy costs; changes in raw material and other costs; the ability to satisfy complex rules in order to remain qualified as a REIT; changes in tax laws that could reduce the benefits associated with REIT status; and other risks and uncertainties described from time to time in the company’s public filings with the Securities and Exchange Commission. All forward-looking statements are made as of the date of this presentation, and the company does not undertake to update any forward-looking statements. NON-GAAP MEASURES This presentation presents non-U.S. GAAP financial information. A reconciliation of those numbers to U.S. GAAP is included in this presentation which is available on the company’s website at www.PotlatchDeltic.com.

Why PotlatchDeltic? March 2019 Best play on housing recovery – highest leverage to lumber among Timber REITs Nearly 2 million acres of geographically diverse, high quality, productive timberlands Timberlands uniquely positioned to leverage favorable lumber market conditions through indexed northern log prices; being a net log buyer in the South provides a natural hedge Favorable long-term lumber market dynamics Maximizing value by land stratification - steady cash flows from attractive Real Estate sales Significantly increased Cash Available for Distribution (CAD) via merger synergies and operational improvements Strong balance sheet provides capital flexibility to grow shareholder value Compelling investment opportunity given current public market value, strong industry fundamentals and an attractive dividend.

Overview of PotlatchDeltic Assets March 2019 Timberland Holdings Wood Products Manufacturing Top Ten US. Lumber Producer Nearly 2 Million Acres of Timberland Northern Region 754,000 Acres Southern Region 1,127,000 Acres Total 1,881,000 Acres Lumber 1,245 MMBF Plywood 160 MMSF 3/8" Legend:

Resource – Segment Overview March 2019 Planned 2019 harvest volume of 6.0 to 6.1 million tons with ~70% from Southern Region Northern Resource EBITDDA strength supported by significant portion of northern sawlog prices being indexed to lumber prices Opportunity to ramp up harvest on legacy Deltic timberlands is being realized Southern pine sawlog prices have not yet recovered due to increased forest productivity and deferred harvests in the region All of our timberlands are managed on a sustainable basis and are certified to either the Sustainable Forest Initiative® or Forest Stewardship Council® standards EBITDDA ($ millions) Non-GAAP measure. Definition and reconciliations to GAAP can be found in appendix Deltic included for 10 months in 2018 Does not include the effect of future acquisitions or dispositions (2) PCH EBITDDA History (1) Historical and Projected Sustainable Harvest 2016 2017 2018 2019- 2025- 2030- 2024 2029 2064 PCH ACTUAL ANNUAL HARVEST PROJECTED AVERAGE ANNUAL HARVEST RANGE (3) 4.2 4.0 5.6 6.8 5.6 6.8 5.6 7.4 5.7 7.8 6.3 Millions of Tons (2) Min Long-Term Potential 2065+

High Quality Productive Idaho Timberlands March 2019 PotlatchDeltic Idaho timberlands are the most productive Northwest timberlands east of the Cascade mountains Timberlands support several major species including Hem-Fir and valuable Douglas Fir/Larch and Cedar Significant portion of softwood sawlog prices are indexed to lumber and benefit from strong market conditions Diverse customer base with ~40% of sawlogs used internally at St. Maries plywood and lumber mills PotlatchDeltic Idaho Hem-Fir Sawlog vs. WWPA Inland Hem-Fir Lumber Index Strong EBITDDA Contribution from Idaho Timberlands $ EBITDDA/Acre (2018) $183 $181 PotlatchDeltic Idaho Timberlands EBITDDA / Acre Comparable to Western Oregon and Washington Idaho sawlogs are sold on a Scribner Eastside log scale basis which is significantly different than the Westside log scale used in Western Oregon and Washington. In general the price conversion factor is approximately Westside = Eastside X 1.25, so $600/MBF Eastside = ~$750/MBF Westside. (1)

High Quality Southern Timberlands Opportunity on Deltic Legacy Timberlands March 2019 Deltic timberlands add high quality southern pine timber base Deltic standing inventory is 56% high value pine grade 70,000 acres of pine plantations over age 30 and 51,000 acres of mature natural pine forests; conversion to plantations increases productivity Southern timber market ~ half of our sawlogs are used internally at PotlatchDeltic sawmills Other end-users nearby Southern Timberlands - Harvest Productivity Tons per Acre (2018) PotlatchDeltic estimate based on 2018-2019 harvest volumes At 2019 harvest volumes, a $10 change in southern sawlog prices is ~$22 million in annual EBITDDA. (1)

Southern Pine Sawlogs – Growing Demand and Capacity Expansion March 2019 Lumber Production, Billion Board Feet Pine Sawtimber Stumpage, $/ton (nominal) Trend Pricing Southern Pine Sawtimber Stumpage Price Source: USDA, WWPA, Timber Mart-South; 2018 Production number estimated based on 11 months of actuals. Higher lumber demand and new capacity in our wood baskets expected to tighten southern pine sawtimber stumpage and narrow the “gap” from trend pricing over time. Stumpage prices remain well below trend Selected Capacity Expansions PotlatchDeltic estimates in thousands of tons (1)

Wood Products – Segment Overview March 2019 6 sawmills: ~1.2 billion board feet of lumber capacity Industrial grade plywood mill: 160 million square feet of specialty grade panel capacity Sold legacy Deltic medium density fiberboard mill for $92 million Q1 2019 Plan to spend ~ $40 million of capital in mills in 2019 High return projects Increase grade yield and volume, lower costs PCH EBITDDA History (1) Deltic Lumber Volumes vs Target Run Rate Competitive mills will benefit from improving housing market and high return capital projects. MMBF Synergy opportunity Non-GAAP measure. Definition and reconciliations to GAAP can be found in the appendix Deltic included for 10 months in 2018 375 (2) EBITDDA ($ millions)

Best Timber Play on Housing Recovery March 2019 Direct Leverage to Lumber Prices Lumber manufacturing and indexed log prices in Idaho result in highest direct leverage to lumber prices. Sawlog harvest and sawmill consumption volumes provide natural hedge in U.S. South. Based on EBITDDA for trailing twelve months ended December 31, 2018 PotlatchDeltic Other amount consists of EBITDDA from non-indexed log sales, plywood, MDF and real estate Source: public filings (1) Natural Hedge in U.S. South PotlatchDeltic is a net southern sawlog buyer (consume 2.5 million tons vs. sell 2.1 million tons) This leads to high lumber margins as southern sawlog prices remain well below trend levels $10/MBF change in lumber prices represents ~$10 million annual EBITDDA 37% 27% 22% 64% direct leverage to lumber 0% 0% (1)(3) (1)(3) (2) (1) Southern yellow pine price comparison: westside lumber vs sawlog stumpage
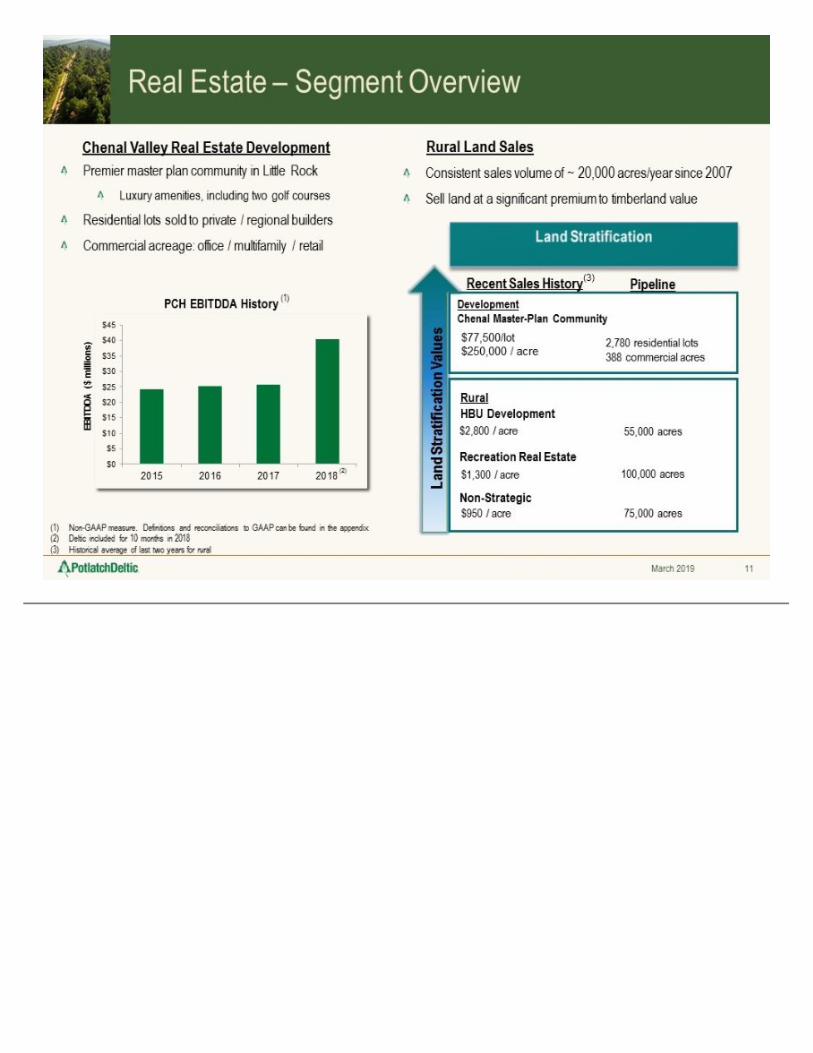
Real Estate – Segment Overview March 2019 $1,300 / acre $2,800 / acre 55,000 acres 100,000 acres PCH EBITDDA History (1) Non-GAAP measure. Definitions and reconciliations to GAAP can be found in the appendix Deltic included for 10 months in 2018 Historical average of last two years for rural Land Stratification Rural HBU Development Recreation Real Estate Development Chenal Master-Plan Community $77,500/lot $250,000 / acre 2,780 residential lots 388 commercial acres Land Stratification Values Pipeline Recent Sales History Non-Strategic $950 / acre 75,000 acres (2) (3) EBITDDA ($ millions) Premier master plan community in Little Rock Luxury amenities, including two golf courses Residential lots sold to private / regional builders Commercial acreage: office / multifamily / retail Consistent sales volume of ~ 20,000 acres/year since 2007 Sell land at a significant premium to timberland value Rural Land Sales Chenal Valley Real Estate Development

Capital Allocation March 2019 Category Mergers and Acquisitions Invest in Existing Businesses Maintain Strong Balance Sheet Return Cash to Shareholders Objective Retain investment grade rating Target debt to EBITDDA below 3x Grow the dividend sustainably over time Opportunistically repurchase shares Replant after harvest and promote sustainable, low risk forestry investments Maintain competitive sawmills through high return projects (> 20% IRR) Develop lots and commercial land in master plan community CAD accretive Priority is timberland adjacent to current ownership The goal of our capital allocation strategy is to create shareholder value

Favorable Capital Structure March 2019 Key Highlights: Undrawn $380 million revolver Maturity: April 2023 Accordion: $420 million Refinanced $150 million January 2019 Lowered interest rate ~3% Matures January 2029 Investment grade rated by Moody’s and S&P DEBT MATURITIES ($ in millions) Reflects refinance of $150 million Senior Notes and MDF mill sale Market capitalization based on closing stock price of $37.04 on February 22, 2019 (1) (3)Net Debt and EBITDDA leverage are non-GAAP measures. See appendix for definitions. (4)Weighted average cost of debt excludes amortization of deferred issuance costs and credit facility fees Pro Forma $ in millions 43465 Market capitalization(2) $2,503 Net debt (3) 641 Enterprise value $3,144 Net debt to enterprise value 20.399999999999999 % EBITDDA leverage(3) 2.2000000000000002 Weighted average cost of debt, after tax(4) 3.5 %

Growing Dividend March 2019 216% increase in dividend payout since 2012 Regular Dividend (1) ($ per share) Current dividend yield 4.3%(3) Payout ratio was 54% in 2018 excluding merger costs and accelerated pension contributions Earnings & profits purge of $222 million Q4 2018 $44.4 million paid in cash Issued 4.8 million shares of stock for remainder The regular annual dividend rate per share increased 13% Q4 2013, 7% Q4 2014 and 7% Q4 2017 The regular dividend payout increased from $50 million in 2012 to a run rate of $108 million in 2019 Based on the closing stock price of $37.04 per share on February 22, 2019 (2) $1.24 $1.28 $1.425 $1.50 $1.50 $1.525 $1.60 $1.60

Summary March 2019 High quality, well managed portfolio of assets Deltic merger was clearly CAD accretive in 2018; $50 million CAD synergies and operational efficiencies target achieved well ahead of schedule Q3 2018 Long-term industry fundamentals are favorable A strong balance sheet allows PotlatchDeltic to return capital to stockholders and pursue additional growth opportunities Strong cash flows result in significant CAD cushion vs historical payout ratio Compelling investment opportunity given current public market value, strong industry fundamentals and an attractive dividend.

Appendix

Single Family Housing – Favorable Fundamentals March 2019 Multifamily has been a key part of the recovery Single family starts remain well below historical averages Beginning to see shift away from multifamily rental by Millennials Low existing home inventory Lot supply remains a key constraint While interest rates have increased recently, homes remain affordable Recent decline in mortgage rates is favorable Expect approximately 1.3 million U.S. housing starts in 2019 Actual (1) Average Starts Since 1970: 1.5 million Source: U.S. Census Bureau. Freddie Mac Freddie Mac & Department of Housing and Urban Development U.S. Housing Starts (Thousands) Forecast (2) (Index) Housing Affordability Index & 30-year fixed Rate Mortgage (Fixed Rate Mortgage) (3)

Housing Recovery and US – Canada Trade Support U.S. Lumber Demand Growth March 2019 Actual Forecast ≈10 billion board feet Canada Softwood Lumber Production Canadian supply has declined almost 10 billion board feet due to mountain pine beetle and a reduction in allowable cut Canadian softwood lumber exports to the U.S. continue to decline 20% duties on Canadian lumber adds to market volatility U.S. lumber demand is expected to continue to grow with increased housing demand BBF BBF Forecast Source: Wood Markets Outlook, RISI Source: FEA North American Lumber Demand (1) (2)

PCH Stock Price Sources: Random Lengths, company analysis Changes in the price of PCH stock are highly correlated with changes in lumber prices. March 2019

EBITDDA & Segment EBITDDA Reconciliation ($ in millions) March 2019 Fiscal Year 2014 2015 2016 2017 2018 RESOURCE Northern Resource operating income $65 $59 $65 $94 $105 Depreciation, depletion and amortization 15 15 10 8 9 Northern Resource EBITDDA $80 $74 $75 $102 $114 Southern Resource operating income $20 $17 $17 $12 $16 Depreciation, depletion and amortization 3 14 14 13 40 Southern Resource EBITDDA $23 $31 $31 $25 $56 Resource Segment Adjusted EBITDDA $103 $105 $106 $127 $170 WOOD PRODUCTS Operating income (loss) (1) $53 ($5) $25 $73 $108 Depreciation and non-cash impairments & eliminations 6 8 7 7 23 Wood Products Segment Adjusted EBITDDA $59 $3 $32 $80 $131 REAL ESTATE Operating income (2) $27 $17 $19 $19 $23 Basis of real estate sold and depreciation 9 7 8 7 17 Real Estate Segment Adjusted EBITDDA $36 $24 $27 $26 $40 CORPORATE Corporate expense ($32) ($32) ($37) ($43) ($63) Depreciation and eliminations (3) 1 3 (3) (2) (5) Special items (4) - - - 8 24 Consolidated Adjusted EBITDDA $167 $103 $125 $196 $297 Excludes 2017 lumber price swap adjusted to exclude the change in unrealized (gain) loss and include cash settlements during the period Excludes the Q2 2016 central Idaho timberland sale Eliminations are primarily related to intersegment purchases of logs Special items include Deltic merger costs of $3 million and environmental charge of $5 million in 2017 and Deltic merger cost of $22 million and inventory purchase price adjustment of $2 million in 2018
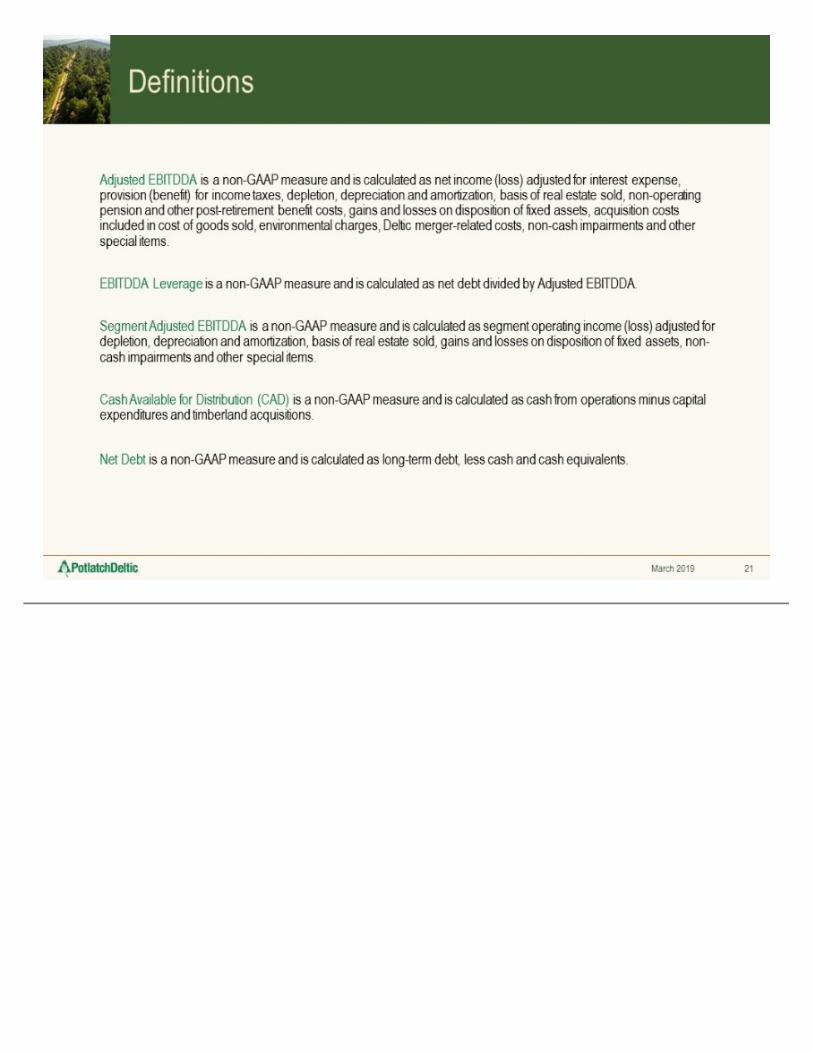
Definitions March 2019 Adjusted EBITDDA is a non-GAAP measure and is calculated as net income (loss) adjusted for interest expense, provision (benefit) for income taxes, depletion, depreciation and amortization, basis of real estate sold, non-operating pension and other post-retirement benefit costs, gains and losses on disposition of fixed assets, acquisition costs included in cost of goods sold, environmental charges, Deltic merger-related costs, non-cash impairments and other special items. EBITDDA Leverage is a non-GAAP measure and is calculated as net debt divided by Adjusted EBITDDA. Segment Adjusted EBITDDA is a non-GAAP measure and is calculated as segment operating income (loss) adjusted for depletion, depreciation and amortization, basis of real estate sold, gains and losses on disposition of fixed assets, non-cash impairments and other special items. Cash Available for Distribution (CAD) is a non-GAAP measure and is calculated as cash from operations minus capital expenditures and timberland acquisitions. Net Debt is a non-GAAP measure and is calculated as long-term debt, less cash and cash equivalents.

Jerry Richards Vice President & Chief Financial Officer 509-835-1521


![Index [d18rn0p25nwr6d.cloudfront.net]d18rn0p25nwr6d.cloudfront.net/CIK-0001389207/c7dbe8c4-bd...Corporate Taxpayer’s ID (CNPJ/MF) No. 01.545.826/0001-07 Corporate Registry (NIRE)](https://img.pdfslide.net/doc/110x75/5ed43574a9596d397405e1bb/index-corporate-taxpayeras-id-cnpjmf-no-015458260001-07-corporate.jpg)


![INDEX [d18rn0p25nwr6d.cloudfront.net]d18rn0p25nwr6d.cloudfront.net/CIK-0001275283/d97e... · Management’s Discussion and Analysis of Financial Condition and Results of Operations](https://img.pdfslide.net/doc/110x75/5eced2e27184df11a867c216/index-managementas-discussion-and-analysis-of-financial-condition-and-results.jpg)
![INDEX [d18rn0p25nwr6d.cloudfront.net]d18rn0p25nwr6d.cloudfront.net/CIK-0000012927/94553d8b... · 2019. 4. 24. · Net earnings $2,149 $2,477 Basic earnings per share $3.79 $4.19 Diluted](https://img.pdfslide.net/doc/110x75/60c72e870b3c3042e809ae50/index-2019-4-24-net-earnings-2149-2477-basic-earnings-per-share-379.jpg)