Embed Size (px)
Citation preview
I
UNITISED REGENERATIVE FUEL CELLS IN
SOLAR – HYDROGEN SYSTEMS FOR REMOTE
AREA POWER SUPPLY
A thesis submitted in fulfillment of the requirements for
the degree of Doctor of Philosophy
ARUN KUMAR DODDATHIMMAIAH
School of Aerospace, Mechanical and Manufacturing
Engineering
RMIT University
June 2008

II
ACKNOWLEDGEMENTS
First and foremost, I would like to thank Dr John Andrews from RMIT University and my
senior supervisor for his guidance, support, and advice throughout my thesis work. I have
learned so many invaluable things from him and I would like to grow in future with the help of
invaluable lessons that I have learnt during my research study. In particular I thank John for
his suggestion of using the Butler – Volmer equations in their reversible form, and a logistic-
type function in the theoretical modelling work conducted.
My sincere thanks to Professor Aliakbar Akbarzadeh, my second supervisor from RMIT
University for his help and guidance.
I would also like to thank my parents, Mr Doddathimmaiah and Mrs Gowramma, and other
members of my family for their unconditional love and affection. I like to extend my heart-felt
thanks to my dearest friends Karthik, Wilfred, Adrienne, Anoop, Conrad, Arun and many
more for having faith in my potential and helping me during my study.
Many thanks to Suhaib Ali for his help in modelling analysis during the course of this thesis,
Jimmy Leblanc for his support in Visual Basic that was very useful in the course of this study.
I am also grateful to my fellow researchers at RMIT University including Biddyut Paul,
Bahman Shabani, Randeep Singh, Akraphon Janon and Abhijit Date.
I would like to acknowledge the support and help from the School of Aerospace, Mechanical
and Manufacturing Engineering workshop staff at RMIT University.
The support of the CSIRO National Hydrogen Materials Alliance in the latter half of this
research program is gratefully acknowledged.
I would like to dedicate this thesis to my parents, and my aunt who passed away in 1998. They
have given all the love in this world and have been an inspiration for me to move on against all
odds on my way.
Finally, I would like to thank God for all His help.

III
DECLARATION
I, Arun Kumar Doddathimmaiah, hereby submit the thesis entitled “Unitised Regenerative
Fuel Cells in Solar-Hydrogen Systems for Remote Area Power Supply” for the degree of
Doctor of Philosophy and certify that except where due acknowledgement has been made, the
work is that of the author alone; the work has not been submitted previously, in whole or in
part, for any other academic award and that the content of the thesis is the result of work that
has been carried out since the official commencement of the program.
Arun Kumar Doddathimmaiah
30 June 2008
IV
TABLE OF CONTENTS
LIST OF ABBREVIATIONS viii
NOMENCLATURE x
LIST OF FIGURES xiii
LIST OF TABLES xvi
EXECUTIVE SUMMARY ................................................................................................................................ xvii
1. INTRODUCTION......................................................................................................................................... 1 1.1 BACKGROUND................................................................................................................................... 1 1.2 CURRENT STATUS OF UNITISED REGENERATIVE FUEL CELLS ...................................... 4 1.3 OBJECTIVES OF THIS PROJECT .................................................................................................. 5 1.4 RESEARCH QUESTIONS.................................................................................................................. 5 1.5 METHODOLOGY ............................................................................................................................... 6 1.6 SCOPE................................................................................................................................................... 7 1.7 OUTCOMES......................................................................................................................................... 7 1.8 STRUCTURE OF THESIS.................................................................................................................. 8
2. UNITISED REGENERATIVE FUEL CELLS .......................................................................................... 9 2.1 REGENERATIVE FUEL CELLS ...................................................................................................... 9 2.2 UNITISED REGENERATIVE FUEL CELLS ................................................................................ 11 2.3 BRIEF HISTORY OF URFCS.......................................................................................................... 13 2.4 FOCUS ON PROTON EXCHANGE MEMBRANES FOR URFCS............................................. 19 2.5 PROTON EXCHANGE MEMBRANE MATERIALS ................................................................... 20 2.6 BASIC TYPES OF URFC.................................................................................................................. 22
2.6.1 Oxygen and hydrogen electrodes constant............................................................................. 22 2.6.2 Oxygen and hydrogen electrodes interchange....................................................................... 24 2.6.3 Alternative water feed arrangements..................................................................................... 25 2.6.4 Functional separation of the membrane ................................................................................ 27 2.6.5 Emphasis in this thesis............................................................................................................. 27
2.7 ELECTROLYSER-MODE OPERATION OF A URFC ................................................................ 28 2.7.1 Cell potential in electrolyser mode ......................................................................................... 33
2.8 FUEL CELL MODE OPERATION OF A URFC........................................................................... 35 2.8.1 Energy analysis ........................................................................................................................ 35 2.8.2 Activation overpotential .......................................................................................................... 38 2.8.3 Ohmic overpotential ................................................................................................................ 38 2.8.4 Concentration overpotential ................................................................................................... 38
2.9 URFC COMPONENTS...................................................................................................................... 39 2.9.1 Structure ................................................................................................................................... 39 2.9.2 Membrane electrode assemblies ............................................................................................. 40
2.9.2.1 Overall structure.................................................................................................................... 40 2.9.2.2 Nafion .................................................................................................................................... 41 2.9.2.3 Catalyst layer ......................................................................................................................... 42 2.9.2.4 Electrocatalysts ...................................................................................................................... 43 2.9.2.5 Gas diffusion and water transport layers.............................................................................. 47 2.9.2.6 Flow channels, seals and endplates ...................................................................................... 50
2.10 EFFICIENCY OF URFCS................................................................................................................. 52 2.11 PERFORMANCE OF EXPERIMENTAL URFCS......................................................................... 54 2.12 URFC STACKS .................................................................................................................................. 60 2.13 URFC SYSTEMS ............................................................................................................................... 62
V
2.14 ECONOMICS OF CURRENT SYSTEMS ...................................................................................... 64 2.15 LIMITATIONS AND AREAS REQUIRING R & D ...................................................................... 65
3. USE OF URFCS IN SOLAR HYDROGEN RAPS SYSTEMS FOR REMOTE AREA POWER SUPPLY...................................................................................................................................................... 68
3.1 CONVENTIONAL REMOTE AREA POWER SUPPLY SYSTEMS .......................................... 68 3.2 SOLAR HYDROGEN SYSTEMS FOR REMOTE AREA POWER SUPPLY............................ 69 3.3 UNITISED REGENERATIVE FUEL CELL BASED SYSTEM FOR REMOTE AREA
POWER SUPPLY............................................................................................................................... 73 3.3.1 The use of URFCs instead of a separate electrolyser and fuel cell in solar-hydrogen
systems for remote area power supply ................................................................................... 73 3.3.2 Benefits of solar-hydrogen URFC systems for remote area power supply ......................... 78
3.3.2.1 Economic benefits ................................................................................................................. 78 3.3.2.2 Environmental benefits ......................................................................................................... 79 3.3.2.3 Social benefits........................................................................................................................ 80
3.4 CHALLENGES FACING SOLAR-HYDROGEN URFC SYSTEMS........................................... 81
4. A GENERAL THEORETICAL MODEL OF THE VOLTAGE-CURRENT CHARACTERISTIC OF A PEM CELL COVERING BOTH ELECTROLYSER AND FUEL CELL MODES ....................... 82
4.1 AIMS OF THEORETICAL WORK................................................................................................. 82 4.2 SIGN CONVENTIONS...................................................................................................................... 83 4.3 GENERAL EQUATIONS FOR CELL VOLTAGE AND CURRENT DENSITY....................... 84
4.3.1 Electrolyser mode..................................................................................................................... 84 4.3.1.1 Introduction........................................................................................................................... 84 4.3.1.2 Current flows and potential variation in E-mode................................................................. 84 4.3.1.3 Oxygen-side reaction in E-mode........................................................................................... 85 4.3.1.4 Hydrogen-side reaction in electrolyser mode ....................................................................... 86 4.3.1.5 Internal current in electrolyser mode ................................................................................... 87 4.3.1.6 Butler-Volmer equations in E-mode incorporating internal current .................................. 88 4.3.1.7 Potential variation in E- mode .............................................................................................. 89
4.3.2 Fuel cell mode........................................................................................................................... 90 4.3.2.1 Current flows and potential variation................................................................................... 90 4.3.2.2 Oxygen-side reaction in FC-mode ........................................................................................ 91 4.3.2.3 Hydrogen-side reaction in fuel cell mode ............................................................................. 91 4.3.2.4 Internal current in FC-mode ................................................................................................ 92 4.3.2.5 Butler Volmer equations in FC-mode incorporating internal current ................................ 93 4.3.2.6 Potential variation in FC- mode ........................................................................................... 94
4.3.3 Saturation effect for oxygen and hydrogen electrodes in E and FC modes ........................ 95 4.4 GENERAL MODEL FOR OVERALL CELL POTENTIAL AND CELL CURRENT DENSITY
.............................................................................................................................................................. 99 4.4.1 Electrolyser mode..................................................................................................................... 99 4.4.2 Fuel cell mode......................................................................................................................... 102 4.4.3 Limiting cases: low and medium current density values.................................................... 104
4.4.3.1 Low values of cell current density in E-mode..................................................................... 104 4.4.3.2 Low values of cell current density in FC mode .................................................................. 105
4.5 RELATIONSHIP BETWEEN O-SIDE AND H-SIDE OVERPOTENTIALS............................ 106 4.5.1 Analysis ................................................................................................................................... 106 4.5.2 Limiting cases......................................................................................................................... 110
4.5.2.1 Small values of cell current density .................................................................................... 110 4.5.2.2 Large values of cell current density .................................................................................... 111
4.6 COMPUTER MODEL OF A URFC OPERATION IN ELECTROLYSER AND FUEL CELL MODE BASED ON THEORY ........................................................................................................ 115
4.7 GENERATION OF POLARISATION CURVES ......................................................................... 117 4.8 USE OF MODEL TO INVESTIGATE INFLUENCE OF KEY PARAMETERS ON
POLARISATION CURVES ............................................................................................................ 120
VI
4.8.1 Charge transfer coefficients .................................................................................................. 120 4.8.2 Exchange current densities ................................................................................................... 124 4.8.3 Saturation currents................................................................................................................ 127 4.8.4 Internal current...................................................................................................................... 128
4.9 USE OF THEORETICAL MODEL TO OBTAIN BEST-FIT VALUES FOR ELECTRODE CHARACTERISTICS FROM AN EXPERIMENTALLY-MEASURED POLARISATION CURVE OF A URFC........................................................................................................................ 130
4.10 CONCLUSIONS............................................................................................................................... 136
5. EXPERIMENTAL INVESTIGATION OF URFCS.............................................................................. 138 5.1 DESIGN AIMS FOR EXPERIMENTAL URFCS ........................................................................ 138 5.2 DESIGN AND CONSTRUCTION OF EXPERIMENTAL URFCS............................................ 140
5.2.1 Overall design......................................................................................................................... 140 5.2.2 Membrane electrode assemblies ........................................................................................... 141 5.2.3 Gas diffusion backing ............................................................................................................ 142 5.2.4 Flow channels and end plates................................................................................................ 143 5.2.5 Seals......................................................................................................................................... 146 5.2.6 Gas flow meter description.................................................................................................... 146 5.2.7 Gas storage tank..................................................................................................................... 146 5.2.8 Gas driers................................................................................................................................ 147
5.3 EXPERIMENTAL SETUP.............................................................................................................. 148 5.4 EXPERIMENTAL PROCEDURE ................................................................................................. 151
5.4.1 Electrolyser mode of operation ............................................................................................. 151 5.4.2 Fuel cell mode of operation ................................................................................................... 152
5.5 EXPERIMENTAL RESULTS......................................................................................................... 153 5.6 PERFORMANCE EVALUATION OF URFCS ............................................................................ 163
5.6.1 Energy efficiencies ................................................................................................................. 163 5.6.2 Hydrogen production rates ................................................................................................... 165 5.6.3 Modal power ratios ................................................................................................................ 167
5.7 CONCLUSIONS............................................................................................................................... 168
6. USE OF THEORETICAL MODEL TO FIND BEST-FIT VALUES FOR ELECTRODE CHARACTERISTICS OF EXPERIMENTAL URFCS ...................................................................... 170
6.1 PROCEDURE USED ....................................................................................................................... 170 6.2 URFCS USED TO TEST THE VALIDITY OF THE THEORETICAL MODEL..................... 171 6.3 RESULTS FOR KEY ELECTRODE CHARACTERISTICS ..................................................... 173 6.4 VARIATION OF EXCHANGE CURRENT DENSITY VALUES FOR URFC ELECTRODES
............................................................................................................................................................ 176 6.5 VARIATION OF CHARGE TRANSFER COEFFICIENT VALUES FOR URFC
ELECTRODES................................................................................................................................. 179 6.6 VARIATION OF SATURATION CURRENT DENSITY VALUES FOR URFC ELECTRODES
............................................................................................................................................................ 182 6.7 CONCLUSION ................................................................................................................................. 185
7. CONCLUSIONS AND RECOMMENDATIONS .................................................................................. 186 7.1 THIS CHAPTER .............................................................................................................................. 186 7.2 RESPONSES TO RESEARCH QUESTIONS ............................................................................... 186
7.2.1 How does the technical performance of unitised regenerative fuel cells compare with that of separate electrolysers and fuel cells?................................................................................ 186
7.2.2 What advantages and disadvantages do unitised regenerative fuel cell systems have compared to separate electrolyser and fuel cell systems?................................................... 188
7.2.3 How can the energy efficiency and cost-effectiveness of unitised regenerative fuel cells be improved? ............................................................................................................................... 190

VII
7.2.4 To what extent can the use of unitised regenerative fuel cell systems improve the triple bottom line competitiveness of solar-hydrogen systems compared with conventional systems for remote area power supply? ............................................................................... 192
7.2.4.1 Economic evaluation........................................................................................................... 192 7.2.4.2 Environmental evaluation................................................................................................... 193 7.2.4.3 Social evaluation ................................................................................................................. 193
7.3 CONCLUSIONS............................................................................................................................... 195 7.4 RECOMMENDATIONS ................................................................................................................. 198 7.5 EPILOGUE ....................................................................................................................................... 200 REFERENCES 202
APPENDIX 216

VIII
LIST OF ABBREVIATIONS
A ampere
BAM3G Ballard Advanced Materials 3rd Generations
BMDO Ballistic Missile Defence Organization
BOS Balance of System
BV Butler-Volmer
cm centimetre
CO2 Carbon dioxide
DC Direct current
DOE Department of Energy
DRFC Discrete Regenerative Fuel Cell
E Electrolyser
ERAST Environmental Research Aircraft and Sensors Technology
FC Fuel Cell
GDB Gas Diffusion Backing
H2 Hydrogen
H2O Water
HALE High Altitude Long Endurance
HHV Higher Heating Value
HS Hamilton Standard
IMPRESS Integrated Modular Propulsion and Regenerative Electro-Energy
Storage System
kWe kilowatt electric
LLNL Lawrence Livermore National Laboratory
mA milliampere
mg milligram
MEA Membrane Electrode Assembly
NASA National Aeronautics and Space Administration
O2 Oxygen

IX
PBI Polybenzimidazole
PEEK Poly ether ether ketone
PEM Proton Exchange Membrane
PI Polymides
PP Polyphosphazine
PPO Polyphenylene oxide
PSFA Perflurosulfonic acid
PV Photovoltaic
PTFE Polytetrafluoroethylene
R & D Research and Development
RAPS Remote Area Power Supply
RFC Regenerative Fuel Cell
S siemens
SRA Solar Rechargeable Aircraft
STP Standard Temperature and Pressure
URFC Unitised Regenerative Fuel Cell
V voltage
W watt
WE-NET World Energy Network
ZEV Zero Emission Vehicles

X
NOMENCLATURE
H-side Hydrogen side
O-side Oxygen side
E-mode Electrolyser mode
FC-mode Fuel cell mode
∆H Enthalpy change
∆G Gibbs free energy change
∆S Entropy change
EO Reversible cell voltage
Etn Thermoneutral cell voltage
P Pressure
T Temperature
R Gas constant
F Faraday constant
N Avogadro number
E Cell voltage
EHHV Higher-heating-value voltage
( )OHC 2P Heat capacity of water
∆gf Gibbs free energy of formation per mole
J Current density
cellj Electrolyser or fuel cell current
HBVj Butler-Volmer current density on H-side
O
BVj Butler-Volmer current density on O-side
intj Internal current
HOj Exchange current density on hydrogen side
OOj Exchange current density on oxygen side
Hα Charge transfer co-efficient on hydrogen side
Oα Charge transfer co-efficient on oxygen side

XI
E
satj Saturation exchange current density in electrolyser mode
FCsatj Saturation exchange current density in fuel cell mode
η Over potential
Oη Over potential on oxygen side
Hη Over potential on hydrogen side
Vcell Electrolyser or fuel cell voltage
L MEA thickness
ρ Resistivity
σ Conductivity
A active membrane area
K kelvin
Ω ohms
t Time
I Stack current
∆EH Half cell reversible potential on hydrogen side
∆EO Half cell reversible potential on oxygen side
Hcellφ Electrode potential on hydrogen side
Ocellφ Electrode potential on oxygen side
Oeφ Reversible potential on oxygen side
Heφ
Reversible potential on hydrogen side
HeR
Ohmic resistance of hydrogen electrode
OeR
Ohmic resistance of oxygen electrode
−emR
Overall resistance of the membrane
+σHm
Conductivity of the membrane
−σem
Electrical conductivity of the membrane to electron current
−ρem
Resistivity of the membrane to electron current
mη Potential across the membrane
γe Total electrode resistance multiplied by the effective unit cell area
mE
Slope of the straight line in electrolyser mode

XII
CE Intercept of the straight line in electrolyser mode
mFC Slope of the straight line in fuel cell mode
CFC Intercept of the straight line in fuel cell mode
µE Faraday efficiency of the cell
Eη Energy efficiency of the cell in electrolyser mode
2
E
Hm•
Rate of hydrogen production per unit effective area of the cell
2HV Flow rate of hydrogen
FCη Energy efficiency of the cell in fuel cell mode
FC
H2m•
Rate of hydrogen consumption per unit effective area of cell
µFC Fuel utilisation coefficient of the cell in fuel cell mode
ηstorage Net energy efficiency of the hydrogen storage system
ηRT Roundtrip energy efficiency of an electrical energy storage system
Π Modal power ratio

XIII
LIST OF FIGURES
Figure 1: A schematic of a discrete regenerative fuel cell system (DRFC). .......................................................... 10 Figure 2: A schematic of a unitised regenerative fuel cell system (URFC) ........................................................... 11 Figure 3: Electrochemical reactions taking place in the electrolysis (lower half of diagram) and fuel cell modes (upper half) of a URFC. Note that the entire cell area is used in both modes. ...................................................... 12 Figure 4: The model solar-powered aircraft with a URFC-based energy storage system built in the High Altitude Long Endurance Solar Rechargeable Aircraft program in the USA in the mid 1990s. Top - on Rogers Dry Lake bed before flight; bottom – the aircraft in flight at an altitude of 60 m. Source: Energy and Technology Review, 1994........................................................................................................................................................................ 14 Figure 5: LLNL/Hamilton Standard URFC Demo unit (left), Proton URFC demo unit (right) Source: (Mitlitsky et al., 1999b)............................................................................................................................................................... 15 Figure 6: LLNL/Hamilton Standard URFC Demo unit. Source: (Mitlitsky et al., 1999b)..................................... 16 Figure 7: Unigen URFC systems developed for commercial sale by Proton Energy Systems (now Distributed Energy Systems): the complete unit (left) and the URFC stack (right). Source: Mitlitsky et al., 1999b; Smith, 2001........................................................................................................................................................................ 18 Figure 8: URFC design with oxygen and hydrogen electrodes remaining the same (but cathode and anode interchanging) on change between modes.............................................................................................................. 23 Figure 9: URFC design with oxygen and hydrogen electrodes switching (but cathode and anode remaining constant) on change between modes....................................................................................................................... 25 Figure 10: URFC design with water feed in E-mode to the hydrogen electrode (the cathode) ............................. 26 Figure 11: Schematic of a URFC in electrolyser mode (Smith, 2000)................................................................... 28 Figure 12: Theoretical water electrolysis voltages as a function of temperature (Richard, 2004) ....................... 32 Figure 13: A typical polarisation curve for a URFC operating in a E-mode (Richard, 2004).............................. 34 Figure 14: Schematic of a URFC in fuel cell mode (Smith, 2000)......................................................................... 35 Figure 15: A typical polarisation curve for a URFC operating in a FC-mode...................................................... 37 Figure 16: The main components of a PEM URFC. The bolts passing through the layers of the cell from endplate to endplate are not shown....................................................................................................................................... 39 Figure 17: Schematic of the layers of a typical MEA, together with a GDB, as used in a URFC. The second catalyst layer and GDB to the right of the membrane are not shown. The proton-conducting polymer membrane material is shown as extending into the catalyst layer. The catalyst layer also contains an electrically conducting medium (diagonal net) with catalyst particles in contact with it and the membrane material. The GDB is shown with two interpenetrating nets (dark and light shaded), one that is electrically conducting, the other for water transport, and the spaces in between for gas transport.......................................................................................... 40 Figure 18: A scanning electron micrograph of an MEA in cross section showing a catalyst layer and the membrane. Source: Ioroi et al. (2002) ................................................................................................................... 41 Figure 19: Diagrammatic representations of the various ways of achieving a mixture of two catalysts distributed throughout the oxygen-side catalyst layer: (a) sequential deposition creating concentrated regions of each material distributed randomly across the layer; (b) prior mixing of the two catalysts and then distribution of the mixture across the layer; and (c) formation of an allow or compound between the two materials and then distribution of this compound. ................................................................................................................................ 47 Figure 20: Schematic showing the basic functionality of the gas diffusion and water transport layers................ 48 Figure 21: Various patterns for the gas flow channels: (a) parallel channels with headers; (b) serpentine; (c) the mirrored flow field pattern patented by General Motors. ...................................................................................... 51 Figure 22: The input and output power densities of experimental URFCs (see Table 2), and lines of constant modal power ratio (Π). The shaded region indicates the desirable domain of operation ...................................... 58 Figure 23: Estimated roundtrip energy efficiencies at maximum power input and output of the experimental URFCs reviewed..................................................................................................................................................... 58 Figure 24: Typical arrangement of a URFC stack: (a) E-mode; (b) FC-mode ..................................................... 61 Figure 25: A schematic of a generalised URFC system......................................................................................... 62 Figure 26: A schematic of a solar-hydrogen system (Schatz Energy Research Centre, 2003) .............................. 70 Figure 27: Unit cost of power delivered by using URFCs, separate electrolyser and fuel cell combination for different storage costs when URFC efficiency is same as dedicated electrolyser and fuel cell efficiencies........... 76 Figure 28: Unit cost of power delivered for using URFCs, separate electrolyser and fuel cell combination for a unit storage cost of US$ 500/kg when URFC efficiency is lower than that of a dedicated electrolyser and fuel cell efficiency................................................................................................................................................................. 77
XIV
Figure 29: Current and electron flows during E-mode operation of a URFC....................................................... 85 Figure 30: Potential variation across a cell in E-mode operation of a URFC ...................................................... 89 Figure 31: Current and electron flows during FC-mode operation of a URFC .................................................... 90 Figure 32: Potential variation across a cell in FC-mode operation of a URFC ................................................... 94 Figure 33: Equivalent circuit for a URFC in E- mode .......................................................................................... 99 Figure 34: The equivalent circuit for a URFC in FC mode................................................................................. 103
Figure 35: The relationship between the overpotentials on the O and H-sides in the special case of Oα =
Hα =
0.5 and jcell << FCsatj and E
satj for oxygen side exchange current density of 1x10⁻⁹ A/cm2 and hydrogen side
exchange current density of 1x10⁻³ A/cm2............................................................................................................. 108
Figure 36: The relationship between the overpotentials on the O and H-sides in the special case of Oα =
Hα =
0.5 for oxygen side exchange current density of 1x10⁻⁹ A/cm2 and varying values of exchange current density in hydrogen side ....................................................................................................................................................... 109
Figure 37: The relationship between the overpotentials on the O and H-sides in the special case of Oα =
Hα =
0.5 for hydrogen side exchange current density of 1x10⁻³ A/cm2 and varying values of exchange current density in oxygen side ........................................................................................................................................................... 109 Figure 38: The relationship between the small values of overpotentials on the O and H-sides in the special case
of Oα = Hα = 0.5 for oxygen side exchange current density of 1x10⁻⁹ A/cm2 and hydrogen side exchange current
density of 1x10⁻³ A/cm2 ......................................................................................................................................... 111 Figure 39: The relationship between the large values of overpotentials on the O and H-sides in the special case
of Oα = Hα = 0.5 for oxygen side exchange current density of 1x10⁻⁹ A/cm2 and hydrogen side exchange current
density of 1x10⁻³ A/cm2 ......................................................................................................................................... 113 Figure 40: The relationship between the values of overpotentials for large values of current densities on the O
and H-sides in the special case of Oα = Hα = 0.5 for hydrogen side exchange current density of 1x10⁻³ A/cm2
and varying values of exchange current density on oxygen side and jcell << FCsatj and E
satj ............................... 113 Figure 41: The relationship between the values of overpotentials for large values of current densities on the O
and H-sides in the special case of Oα = Hα = 0.5 for oxygen side exchange current density of 1x10⁻⁹ A/cm2 and
varying values of exchange current density on hydrogen side and jcell << FCsatj and E
satj ................................... 114 Figure 42: Snapshot of Excel worksheet showing the the computer model developed based on theory.............. 116 Figure 43: Voltage – current density curves for a URFC in E-mode (jcell positive) and FC-mode (jcell negative) generated by the URFC model when saturation currents are infinite. The dotted curve plotted on the jcell positive side is the FC-mode curve plotted for jcellto show the symmetry properties of the two curves when both charge transfer coefficients are 0.5 .................................................................................................................................. 118 Figure 44: Voltage – current density curves for a URFC in E-mode and FC-mode generated by the URFC model showing the effects of saturation. The dotted curve plotted on the jcell positive side is the FC-mode curve plotted for jcellto show the asymmetry properties of the two curves when with different saturation current values. ... 119 Figure 45: O-side overpotential vs current density curves for a URFC in E-mode (jcell positive) and FC-mode (jcell negative) generated by the URFC model for the O-side charge transfer coefficient, αO= 0.5 . The dotted curve plotted on the jcell positive side is the FC-mode curve plotted for jcellto show the symmetry properties of the E and FC-mode curves about the current density axis ................................................................................... 120 Figure 46: O-side overpotential vs current density curves for a URFC in E-mode (jcell positive) and FC-mode (jcell negative) generated by the URFC model for the increasing values of O-side charge transfer coefficient, αO..... 121 Figure 47: O-side overpotential vs current density curves for a URFC in E-mode (jcell positive) and FC-mode (jcell negative) generated by the URFC model for progressively lower values than 0.5 of the O-side charge transfer coefficient, αO ....................................................................................................................................................... 122 Figure 48: H-side overpotential vs current density curves for a URFC in E-mode (jcell positive) and FC-mode (jcell negative) generated by the URFC model for the various values of H-side charge transfer coefficient, αH ......... 123 Figure 49: Current density and overpotential variations for increasing values of exchange current density on O side from the reference value (10-9 A/cm2), in a URFC while holding all other parameters in Table 11 constant.............................................................................................................................................................................. 124 Figure 50: Current density and overpotential variations for decreasing values of exchange current density on O side from the reference value (10-9 A/cm2) in a URFC while holding all other parameters constant .................. 125

XV
Figure 51: Current density and overpotential variations for different values of exchange current density on H-side in a URFC while holding all other parameters constant .............................................................................. 126 Figure 52: The influence of decreasing and increasing E
satj and FC
satj on the Vcell – jcell curves for a URFC ..... 127
Figure 53: Butler Volmer current density and net cell current density on oxygen side electrode in both FC and E modes.................................................................................................................................................................... 129 Figure 54: The mid-range of jcell values (dashed lines) over which the curve can be simplified to the forms shown in equations 60 and 61. ........................................................................................................................................ 131 Figure 55: Straight line fit for different values of lnjcell and V-E0 to find the slope.............................................. 131 Figure 56: Experimental Vcell-jcell curves for Yim et al. (2004)’s experimental URFC ....................................... 133 Figure 57: Vcell-EO plot used to find slope and intercept in E-mode for the V-I curve given in Figure 56 .......... 134 Figure 58: Vcell-EO plot to find slope and intercept in FC mode for the V-I curve given in Figure 56 ................ 134 Figure 59: Theoretical V-I curve fitted to a experimental curve (Yim et al., 2004) for an experimental URFC . 135 Figure 60: The design for a single-cell unitised regenerative fuel cell for use in experimental testing .............. 141 Figure 61: O-side flow-channel dimensions used for the experimental URFCs constructed. ............................. 144 Figure 62: H-side flow-channel dimensions used for the experimental URFCs constructed .............................. 145 Figure 63: Storage tanks for hydrogen and oxygen gases in the experimental URFC system ............................ 146 Figure 64: Drier for hydrogen and oxygen gases in the experimental URFC system ......................................... 147 Figure 65: Schematic of the experimental apparatus used to test the URFCs constructed ................................. 149 Figure 66: Experimental set up to measure the performance of the URFCs constructed.................................... 150 Figure 67: The hydrogen experimental cabinet at RMIT University, Bundoora East campus ............................ 150 Figure 68: Circuit diagram for E-mode operation .............................................................................................. 151 Figure 69: Circuit diagram for FC-mode operation............................................................................................ 152 Figure 70: Measured URFC polarisation curves for MEAs with 0.4 mg/cm2 Pt loading on H-side and 0.4 mg/cm2 and 1 mg/cm2 Pt loading on O-side...................................................................................................................... 154 Figure 71: Measured URFC polarisation curves for MEAs with 2 mg/cm2 Pt loading on both H sides and varying catalyst loading on O-side.................................................................................................................................... 155 Figure 72: Measured URFC polarisation curves for MEAs with 2 mg/cm2 Pt loading on both H sides and varying catalyst loading on O-side.................................................................................................................................... 156 Figure 73: Measured URFC polarisation curves for MEAs with 0.4 mg/cm2 Pt loading on O-side and 0.4 mg/cm2 and 2 mg/cm2 Pt loading on H-side...................................................................................................................... 157 Figure 74: Measured URFC polarisation curves for MEAs with 1 mg/cm2 Pt loading on O-side and varying Pt loading on H-side ................................................................................................................................................. 158 Figure 75: Measured URFC polarisation curves for MEAs with 2 mg/cm2 Pt loading on O-side and 2 and 4 mg/cm2 Pt loading on H-side................................................................................................................................ 158 Figure 76: Measured URFC polarisation curves for MEAs with various catalyst loadings on O-side and H-side.............................................................................................................................................................................. 159 Figure 77: Measured URFC polarisation curves for MEAs with 2 mg/cm2 Pt loading on both sides................. 160 Figure 78: Measured URFC polarisation curves for MEAs with 2-4 mg/cm2 Pt loading on H-side and various catalyst loading on O-side.................................................................................................................................... 161 Figure 79: Measured URFC polarisation curves for MEAs with 2 mg/cm2 Pt loading on H-side and 1 mg/cm2 IrO2 loading on O-side ......................................................................................................................................... 162 Figure 80: Theoretical V-I curve fitted to the experimental curve for a URFC with 0.4 mg/cm2 Pt black on both H and O-sides........................................................................................................................................................... 172 Figure 81: Theoretical V-I curve fitted to the experimental curve for a URFC with 4 mg/cm2 Pt black on H side and 4 mg/cm2 Pt black on O-side ......................................................................................................................... 172
Figure 82: Best-fit values for exchange current densities, OOj and
HOj , by catalyst loadings of the URFC
electrodes. The first term in each label indicates O-side catalyst type and loading while the second term indicates H-side catalyst type and loading. ......................................................................................................................... 178 Figure 83: Best-fit values for charge transfer coefficients, αO and αH, by catalyst loadings of the URFC electrodes. The first term in each label indicates O-side catalyst type and loading while the second term indicates H-side catalyst type and loading. ......................................................................................................................... 181
Figure 84: Best-fit values for saturation current densities, satEj and sat
FCj , by catalyst loadings of the URFC
electrodes.............................................................................................................................................................. 184

XVI
LIST OF TABLES
Table 1: Methodology followed in this research program ...................................................................................... 6 Table 2: Development of proton exchange membranes (Costamagna and Srinivasan, 2001) ............................... 20 Table 3: A selection from the literature of the catalyst materials and loadings that have been trialled in experimental URFCs .............................................................................................................................................. 45 Table 4: Measured performance data for experimental URFCs reported in the literature. The corresponding physical design characteristics of these cells is given in Table 3. Values for the modal and roundtrip energy efficiencies (shaded columns) are estimated (see text). .......................................................................................... 56 Table 5: The physical characteristics of the experimental URFCs for which performance data are given in Table 4.............................................................................................................................................................................. 57 Table 6: Typical prices on the international markets for the main metals used as catalysts in URFCs (October 2007). Sources: Los Alamos National Laboratory (2007); Kitco (2007); MiningMX (2007); Metalsplace (2007)64 Table 7: Capacities required and assumed unit capital costs and lifetime of solar-hydrogen system components to meet a daily demand of 5 kWh for a remote household in south eastern Australia (Ali, 2007).............................. 71 Table 8: Scenarios of URFC capital costs, efficiencies, hydrogen storage and balance of system costs used to model cost of unit power delivered......................................................................................................................... 74 Table 9: The required capacities, assumed unit costs, total costs and lifetimes in case 1 for a solar-hydrogen URFC system to meet a daily demand of 5 kWh for a remote household in south-eastern Australia .................... 75 Table 10: The unit cost of power delivered by a solar-hydrogen URFC system for the different cases given in Table 8, and compared with the corresponding cost for a solar-hydrogen system employing a separate electrolyser and fuel cell......................................................................................................................................... 76 Table 11: Values for key cell parameters assumed in the illustrative URFC model output presented in ............ 117 Table 12: Electrode characteristics of the URFC cell and corresponding V-I curve described in Yim et al. (2004).............................................................................................................................................................................. 135 Table 13: Catalyst loadings by electrode for the 18 single-cell URFCs tested experimentally ........................... 142 Table 14: Various measured energy efficiency values for the experimental URFCs. The ranking in the final column is in terms of roundtrip energy efficiency ................................................................................................ 163 Table 15: Various measured hydrogen production rates of the experimental URFCs. The ranking in the final column is in terns of hydrogen production rate, with the fastest producer having the lowest ranking ................ 166 Table 16: Maximum input power density, maximum output power density and modal power ratio values for the experimental URFCs tested. ................................................................................................................................. 168 Table 17: Input parameters used in the theoretical model................................................................................... 170 Table 18: Catalyst loadings and types selected to find the electrode characteristics using the model ................ 171 Table 19: Best-fit values for exchange current densities, O
Oj and HOj , charge transfer coefficients αO and αH,
saturation current densities, E
satj and FCsatj by catalyst loadings of the URFC electrodes examined together with
error range values ................................................................................................................................................ 174
Table 20: Best-fit values for exchange current densities, OOj and
HOj , by catalyst loadings of the URFC electrodes
together with error range values .......................................................................................................................... 176 Table 21: Best-fit values for charge transfer coefficients, αO and αH by catalyst loadings of the URFC electrodes together with error range values .......................................................................................................................... 179
Table 22: Best-fit values for saturation current densities, satEj and sat
FCj , by catalyst loadings of the URFC
electrodes together with error range values......................................................................................................... 182 Table 23: Typical energy efficiency ranges for dedicated electrolyser, fuel cell and URFCs along with their corresponding roundtrip energy efficiencies........................................................................................................ 187
Doctor of Philosophy EXECUTIVE SUMMARY
XVII
EXECUTIVE SUMMARY
Remote area power supply (RAPS) is a potential early market for renewable energy –
hydrogen systems because of the relatively high costs of conventional energy sources in
remote regions. Solar-hydrogen RAPS systems commonly employ photovoltaic panels, a
Proton Exchange Membrane (PEM) electrolyser, a storage for hydrogen gas, and a PEM fuel
cell. Unitised Regenerative Fuel Cells (URFCs) use the same hardware for both the
electrolyser and fuel cell functions. Since both of these functions are not required
simultaneously in a solar-hydrogen RAPS system, URFCs based on PEM technology provide
a promising opportunity for reducing the cost of the hydrogen subsystem used in renewable-
energy hydrogen systems for RAPS. A URFC based solar-hydrogen system is also an
exemplar of a sustainable energy system that has zero emissions, and is completely clean and
noiseless. It has a huge potential to reduce greenhouse emissions if it were to replace all diesel-
based RAPS systems with standalone renewable energy systems employing URFC hydrogen
storage. URFCs also have potential applications in the areas of aerospace, submarines, energy
storage for central grids, and hydrogen cars.
The overall goal of this thesis is to investigate and study the use of unitised regenerative fuel
cells in solar- hydrogen system for remote area power supply. The presented work seeks to
improve both theoretical and empirical understanding of URFCs, and hence make a significant
additional contribution to the current body of knowledge on URFCs and solar-hydrogen
systems.
The research questions addressed in this thesis are as follows:
• How does the technical performance of unitised regenerative fuel cells compare with
that of separate electrolysers and fuel cells?
• What advantages and disadvantages do unitised regenerative fuel cell systems have
compared to separate electrolyser and fuel cell systems?
• How can the energy efficiency and cost-effectiveness of unitised regenerative fuel cells
be improved?
Doctor of Philosophy EXECUTIVE SUMMARY
XVIII
• To what extent can the use of unitised regenerative fuel cell systems improve the triple
bottom line competitiveness of solar-hydrogen systems compared with conventional
systems for remote area power supply?
The outcomes of this thesis are:
• A design for a single-cell URFC, and a number of URFC constructed for experimental
testing based on this design
• A working experimental model of a URFC
• Experimental results on the performance of URFCs based on a standard procedure
• An advance in theoretical understanding of URFCs
• A computer model of single-cell URFCs based on this theoretical analysis, and with its
validity tested in a preliminary way by comparing model predictions with actual
experimental results
• A set of specific recommendations for future research to design and develop URFCs
with improved performance, durability and cost-competitiveness.
A review of previous work on URFCs is presented based on published papers, articles and
product literature. This review found that the best-performing experimental proton exchange
membrane based URFCs to date have roundtrip energy efficiencies in the range 30 – 38% at
maximum power inputs and outputs, compared to the around 50% roundtrip energy efficiency
achievable with a comparable dedicated PEM electrolyser and fuel cell system. However,
average roundtrip energy efficiency was much greater than these values if the cells are
operated for much of the time at power levels below these maxima. In order to make URFCs
competitive against separate electrolyser and fuel cells, the roundtrip energy efficiency of
URFCs at maximum power levels must thus ideally be raised to the 50% mark. The modal
power ratio for the URFCs reviewed – that is, the maximum input power divided by the
maximum output power – is in the range 2 to 10. For a URFC to perform well in both E and
FC modes, the modal power ratio should be as low as possible.
The use of URFCs in solar-hydrogen systems is compared to a solar-hydrogen RAPS system
employing a separate electrolyser and fuel cell using a computer-based system simulation and
Doctor of Philosophy EXECUTIVE SUMMARY
XIX
lifecycle costing model. The analysis indicates that for a remote household in south-eastern
Australia potential savings of up to 14% in the cost of unit power delivered (on a total system
cost basis) can be obtained by employing a URFC-based system instead of a conventional
solar-hydrogen system that uses a dedicated electrolyser and fuel cell. This cost reduction can
be achieved if the performance of a URFCs and lifetimes are maintained very close to those of
a separate electrolyser and fuel cell performances, while bringing down the balance of system
costs of the URFC-based system.
An improved theoretical model of a PEM URFC is developed by deriving a general theoretical
relationship between cell voltage and current density that is applicable in both E and FC-
modes. In addition the model incorporates the saturation behaviour in both modes by
modifying the standard Butler-Volmer equations using a logistic-type function. The model
also takes into account the proton and electron conductivities of the membrane, and the
electron conductivities of the gas diffusion backing layers and end plates. The model is used to
explore the influence of charge transfer coefficients, exchange current densities and saturation
current densities on URFC polarisation curves and hence overall cell performance.
A computer simulation model of URFCs using this theoretical relationship and solving
equations by iterative methods is developed and used to show the effect on cell performance in
both modes of varying exchange current densities and charge transfer coefficients at each
electrode, and varying the saturation current densities. The model is used to generate Vcell-jcell
curves that closely fit experimental curves for actual URFCs across the entire range of
operation of both modes. Thus, the model developed promises to be a useful tool in the design
of URFCs with improved performance in both modes.
The design and construction of experimental URFCs with an active membrane area of 5 cm2 is
described. Eighteen experimental URFCs are tested for their Vcell-jcell curves, hydrogen
production and consumption rates, and hence their energy efficiencies in E-mode, FC-mode
and roundtrip. In FC mode, URFCs with Pt black catalysts show the best performance in terms
of highest cell voltage at a given current density. The addition of other metals into the oxygen
electrode decreases the performance in the order: Pt black > PtIrO2 > PtIroRuOx > IrRu (with >

Doctor of Philosophy EXECUTIVE SUMMARY
XX
indicating better performance). However, in E-mode, the addition of IrO2, IrORuOx,
IrO2RuO2, IrRuOx and Ru into the oxygen electrode evidently enhanced the E-mode
performance, giving lower cell voltage compared to Pt black at a given current density.
Particularly, the addition of Ir catalysts, irrespective of their chemical forms, showed a very
positive effect on the URFC performance in E-mode. Consequently, in terms of E-mode
performance the best performing URFC had a PtIrO2 catalyst, with the following catalysts
progressively showing lower performance: PtIrORuOx > PtIrO2RuO2 > IrRu > IrRuOx >
PtIrRu > Pt black.
The measured roundtrip energy efficiencies varied between 41.5% for the cell with loadings
O: Pt/IrO2 4 mg/cm2, H: Pt 4 mg/cm2 and 27.5% for the cell with O: IrO2 1 mg/cm2; H: Pt 2
mg/cm2. Cells with a mixed catalyst on the O-side had superior roundtrip energy efficiencies
compared to a single catalyst layer of Pt. The cell with the highest roundtrip efficiency was a
URFC with O-side: Pt/IrO2 4 mg/cm2; H: Pt 4 mg/cm2 catalyst.
The URFC that contained O-side catalyst: IrO2 (loading 4 mg/cm2) and H-side catalyst: Pt
(loading 4 mg/cm2) had the highest rate of hydrogen production of about 6 x 10⁻⁹ kg/s. Other
cells produced hydrogen between 1.66 x 10⁻¹⁰ kg/s and 6 x 10⁻⁹ kg/s.
The modal power ratio of all URFCs measured experimentally in this thesis ranged from 8 to
20. URFCs with lower modal power ratios are always preferable in a solar-hydrogen system or
other application. Among the URFCs tested here, the URFC with O-side: Pt/IrO2 4 mg/cm2; H:
Pt 4 mg/cm2 catalyst type had the lowest modal power ratio of about 8.3.
Thus the experimental results obtained for the performance of URFCs with a range of different
catalyst types and loadings have allowed the best-performing combinations among this group
to be identified. Among the 18 URFCs chosen based on varying catalyst types and loading, the
URFC that had O-side catalyst as Pt/IrO2 (4 mg/cm2 loading) and H-side catalyst Pt (4 mg/cm2
loading) is clearly the best performer. Generally increasing the catalyst loading on a particular
cell tended to improve the cell performance in both E and FC-modes. Further experimental

Doctor of Philosophy EXECUTIVE SUMMARY
XXI
testing of URFCs with other catalyst types and loadings is, however, still required to identify
the best candidates for further development and eventual commercialisation
The theoretical approach and associated computer model are used to obtain best-fit values for
the key characteristics of the oxygen and hydrogen electrodes of ten of the experimental
URFCs with varying catalyst loadings from their experimentally measured Vcell-jcell curves.
The values found for exchange current densities and charge transfer coefficients conform well
to a priori expectations based on the catalyst loadings. For example, the exchange current
density on the O-side stays constant for cells with the same O-side catalyst loading while the
H-side loading increases and raises the H-side exchange current density. There is no in-built
mathematical necessity for this observed behaviour. Hence it provides a partial confirmation of
the validity of the modelling approach. By offering a means to obtain experimentally-based
values for the characteristics of each electrode, the model promises to be a useful tool in
identifying electrodes with materials and structures, together with optimal catalyst types and
loadings that will improve URFC performance.
However, the model in its present form will need to be extended to the case of mixed catalysts
on the O-side, rather than covering just single active catalysts on each side, since such
combinations of catalyst are likely to be essential to get high reversible performance in the
form of low overpotentials in both modes, an important further development, as the
experimental measurements of chapter 5 clearly indicated.
The main challenges facing solar-hydrogen URFC systems for RAPS and other standalone
applications are identified as the following:
• Achieving high-efficiency operation in both modes, very close to that achievable with a
discrete electrolyser and fuel cell, over a large number of modal switches and a long
lifetime for a URFC
• Attaining a quick transition between full-functioning in E and FC modes
• Keeping the capital cost of a URFC as low as, or only slightly above, that of a PEM
electrolyser of the same capacity.
Doctor of Philosophy EXECUTIVE SUMMARY
XXII
• Designing a balance of system that is as low cost as possible, lower than that for a separate
electrolyser and fuel cell, while maintaining high reversible performance.
Recommendations for future work are made and they include:
• Further experimental and theoretical work should be conducted with the aims of raising the
roundtrip energy efficiency of PEM URFCs, extending their practical lifetimes, and
lowering the unit costs of energy stored and delivered in solar-hydrogen power supply
systems, and other energy storage applications employing URFCs.
• The theoretical model of PEM URFCs developed in this thesis should be subjected to
additional detailed testing of its validity and general applicability by further comparison of
modelled polarisation curves with experimental curves. Best-fit values for exchange
current densities and charge transfer coefficients for both electrodes need to be compared
with values obtained for these parameters from other studies and methods.
• The current computer simulation model needs to be enhanced so that the procedure for
finding the best-fit values of the electrode characteristics for a given experimental V-I
curve for a URFC is done automatically using a linear or non-linear least squares method.
• The present theoretical model and associated computer model should be extended to cover
the more complex case of a mix of active catalysts on the O-side, since such a mix is likely
to be essential to get high performance in both E and FC modes. The use of the principle of
linear superposition of the separate effects of the two active catalysts is an approach worth
pursuing in the first instance to see if this can adequately represent actual performance.
• The design of the test PEM URFC cell used in the experimental work of this thesis should
be further developed and improved, with the following aims in mind:
o Improving the Faraday efficiency in both modes by reducing probable leakages of
hydrogen gas and gas crossover from one electrode to the other
o Investigating water management in both modes, including the degree to which the
O-side electrode needs to be directly in contact with liquid water in E-mode, and
the best means of clearing water from the O-side on switching from E to FC mode.
• A complete demonstration solar-hydrogen system employing a URFC should be designed
to allow full system testing under real-world operating conditions.

Doctor of Philosophy CHAPTER 1
1
1. INTRODUCTION
1.1 BACKGROUND
Most of the world’s energy consumption is greatly dependent on fossil fuels, which are
exhaustible. Fossil fuels are being used extensively due to continuous escalation in the world’s
population and development (Khan and Iqbal, 2005). We are in the exhaustion phase of oil
(Bockris and Veziroglu, 2007). According to the US Department of Energy, the peak in the
delivery rate of world oil will be reached in less than 15 years (2021), while others argue that
the maximum global rate of oil production has already been reached (The Oil Drum, 2008). In
any case, great pressure will be placed on remaining oil supplies and hence oil prices by the
increasing demands from the rapidly developing economies of China and India.
At the same time, there is now a strong consensus in the scientific community that global
warming and associated climate change are being caused by the increasing concentrations of
greenhouse gases in the Earth’s atmosphere as a direct result of human activities
(Intergovernmental Panel on Climate Change, 2007). Central among the activities producing
this increase in greenhouse gases is the burning of fossil fuels. Hence for this reason too a shift
away from fossil fuels over the coming decades is essential.
The use of renewable energy sources such as solar and wind energy, coupled with raising
energy efficiency to much nearer its technical limits, are the key planks in sustainable energy
strategies that can assist the world to make the transition away from fossil fuels and towards a
zero greenhouse gas emission economy (see, for example, Lovins et al., 2004). Yet solar and
wind energy are inherently variable, on both short-term diurnal cycles and longer-term
seasonal cycles (Richards and Conibeer, 2007). Hence use of renewable energy to produce
hydrogen by splitting water or other means at times of high supply, and storing this hydrogen
for reuse in a fuel cell or by combustion to supply energy when solar or wind energy is
insufficient to meet the demand, has been proposed (Bockris, 1975). Indeed hydrogen once
obtained from renewable resources can be used for all purposes from transport (cars,

Doctor of Philosophy CHAPTER 1
2
aeroplanes, ships and trains), to electricity and heart for industry, buildings and primary
industry, hence the concept of the ‘hydrogen economy’ (Bockris and Veziroglu, 1991;
Hoffman, 2001; Elam et al., 2003). Provided the hydrogen is produced using renewable energy
sources, it is a truly sustainable, zero greenhouse emission and pollution-free energy carrier
(MacQueen, 2002).
In addition to the concerns about depleting fossil fuel reserves and climate change, the World
Bank estimates that some 1.6 billion people (a quarter of humanity) live without access to
electricity and many more millions have limited, inadequate electricity (United Nations, 2003)
The final report of the G8 Renewable Energy Task Force (2001) concluded that ‘Modern
energy services are fundamental to economic, social, and political development and are
essential in sustaining human life and improving human welfare’. Populations living beyond
the reach of the electricity distribution systems from large power stations can only be supplied
by so-called remote area power supply (RAPS) systems. In many remote areas, the primary
means of generating electricity at present is the diesel generator. While the generators are
relatively cheap to purchase and install, they use expensive diesel fuel and emit significant
quantities of pollutants, including greenhouse gases (Moseley, 2006). The same is the case for
the substantial market for standalone power supplies in remote areas for households and
communities, for islands, and for remote applications such as telecommunications, mining,
agriculture, and water supply in both industrialised and developing countries.
In order to overcome greenhouse gas emissions in RAPS systems, renewable energy systems
employing solar energy and wind power have become an attractive option. In such systems,
the diurnal and weather variability can be met by short-term battery storage, but this is only
sufficient for up to several days of bad weather. In order to cope with longer-term seasonal
variations, an energy storage medium with greater longevity is required (Khan and Iqbal,
2005). One of the major requirements for an energy system is to ensure continuous power flow
by storing excess energy from the renewable source. Although, battery technology has reached
a relatively mature stage, size, cost and disposal remain the constraining factors for its use in
remote stand-alone applications.

Doctor of Philosophy CHAPTER 1
3
Hydrogen offers an attractive alternative to batteries as the energy storage medium in solar and
wind hydrogen systems since it allows the long-term storage of excess renewable energy over
demand, both from day to night and more importantly from season to season (Ali, 2007).
Indeed solar or wind hydrogen systems with their renewable energy source, decentralised on-
site hydrogen generation and storage, and reuse of the stored hydrogen in fuel cells offer a
completely autonomous RAPS system that enables uninterruptible power supply to the load
(Ali, 2007). Their lower environmental impact and higher reliability are among their
advantages over conventional battery or diesel-supported systems (Aurora, 2003). Importantly
solar-hydrogen RAPS systems also involve the same technologies on a small-scale that are
needed to make a renewable-energy hydrogen economy a reality on the large scale.
Several solar-hydrogen projects for stand-alone power supply have been conducted around the
world like WE-NET in Japan, PHEOBUS and HYSOLAR in Germany, and the Humboldt
University project in USA (Aurora, 2003). The main limitations of current solar-hydrogen
RAPS systems are the high costs of the photovoltaic panels, electrolyser, fuel cell and
hydrogen storage system (Dutton et al., 2000). An opportunity for cost reduction in solar-
hydrogen systems is the use of a Unitised Regenerative Fuel Cell (URFC) in place of a
separate electrolyser and fuel cell. This innovative reversible fuel cell system employs a single
piece of hardware to perform both the electrolyser and fuel cell functions. URFCs thus
promise to reduce significantly the capital costs of solar-hydrogen systems for remote
applications (Pettersson et al., 2006).
Therefore the focus of the present thesis is on the use of URFCs in solar-hydrogen systems for
RAPS and other standalone power supply applications. Potential benefits of the research
project include more cost-effective remote area energy systems with zero greenhouse gas
emissions, and a pioneering application of hydrogen technology in a niche market that might
assist in the move towards a sustainable hydrogen economy on the much larger scale.
Importantly, RAPS is a potential early market for renewable energy – hydrogen systems
because of the relatively high costs of conventional energy sources in remote regions.
Hydrogen storage systems employing URFCs also have potential applications for energy
storage in centralised grids as the inputs from variable solar and wind power sources increase,
Doctor of Philosophy CHAPTER 1
4
in space vehicles, submarines, and rechargeable hydrogen fuel cell cars (Mitlitsky et al., 1998a
and b; Andrews and Doddathimmaiah, 2008).
The study may further open up opportunities for local industry development in design,
manufacture and deployment of novel solar hydrogen systems in remote applications such as
stand-alone power supplies for remote communities, townships, islands and mining facilities in
Australia and overseas.
1.2 CURRENT STATUS OF UNITISED REGENERATIVE FUEL CELLS
There have already been early applications of URFCs in spacecraft, hydrogen–based
uninterrupted power supply systems (Mitlitsky et al., 1999a). Proton Energy Systems (now
called Distributed Energy Systems, a leading manufacturer of proton exchange membrane
(PEM) fuel cells, has addressed some of the key technical challenges relating to regenerative
fuel cells in terms of reversible cell structure, high-pressure gas generation and system
integration (Smith, 2000). This company is commercially offering an uninterruptible power
supply system employing a first-generation URFC based on a proton Exchange Membrane
(PEM) stack systems to serve as reliable back up energy supply, though few such systems
have yet been deployed and experience with their performance and usage is still very limited.
Lynntech Industries also offer MEAs for reversible PEM fuel cells based on required
specifications.
However, relatively little work to date has been done on testing of URFC performance under
standardised conditions, on comparing the performance of URFCs with different catalysts and
loadings, and other variations in design features, on theoretical modelling of URFCs, and on
investigation of the use of URFCs in solar-hydrogen based RAPS system.
Doctor of Philosophy CHAPTER 1
5
1.3 OBJECTIVES OF THIS PROJECT
The overall objectives of this project are thus to:
• Review previous work on the development and performance evaluation of URFCs.
• Develop an improved theoretical analysis of single-cell URFCs
• Develop a computer-based simulation model based on the theoretical anlaysis to
predict the performance of and assist in designing URFCs.
• Design, construct and measure the performance of a range of experimental URFCs
employing PEM electrode assemblies.
• Identify opportunities for developing URFCs with improved performance and cost-
effectiveness
• Evaluate the potential advantages of using a URFC rather than a separate electrolyser
and fuel cell in solar–hydrogen systems for RAPS.
1.4 RESEARCH QUESTIONS
The specific research questions to be addressed in this thesis are:
1. How does the technical performance of unitised regenerative fuel cells compare with
that of separate electrolysers and fuel cells?
2. What advantages and disadvantages do unitised regenerative fuel cell systems have
compared to separate electrolyser and fuel cell systems?
3. How can the energy efficiency and cost-effectiveness of unitised regenerative fuel cells
be improved?
4. To what extent can the use of unitised regenerative fuel cell systems improve the triple
bottom line competitiveness of solar-hydrogen systems compared with conventional
systems for remote area power supply?

Doctor of Philosophy CHAPTER 1
6
1.5 METHODOLOGY
The methodology that has been followed in order to meet the aims and address the research
questions in this thesis is given in Table 1:
Step No. Title of activity Activity description & relation to research questions
1 Literature
review
Analysis published literature on URFCs, solar-hydrogen
systems with a focus on PEM-based technology and RAPS,
and the use of URFCs in such systems (addresses research
questions 1 and 2)
2
Development of
theory and a
mathematical
model
Development of an improved theoretical anlaysis of URFCs,
and a mathematical simulation model of URFCs based on this
theory and the available data on characteristics of the main
components of URFCs (addresses research question 3)
3
Experimental
apparatus and
test cells
Design and construction of an experimental rig for testing
URFCs, and a number of URFCs to be tested. (addresses
research questions 1-3)
4 Performance
measurement
Measurement of the technical performance of URFCs
(addresses research question 1)
5 Model testing
Validation of model using experimental data. Comparison of
model predictions with experimentally measured performance.
Refinement of the model if necessary (addresses research
question 1 and 3)
6
System analysis
and evaluation
Analysis of the operation of URFCs for application in a solar-
hydrogen RAPS system. Evaluation of the system for triple
bottom line competitiveness with the usual PEM solar-
hydrogen systems employing a separate electrolyser and fuel
cell; and in turn with conventional RAPS systems using diesel
generators and/or photovoltaic cells and batteries
7 Performance
enhancement
Identification of URFC components or design features
requiring further research and development.
(addresses research question 4)
8 Thesis writing Preparing and writing the thesis
Table 1: Methodology followed in this research program

Doctor of Philosophy CHAPTER 1
7
1.6 SCOPE
The thesis will focus on unitised regenerative fuel cells (URFCs) that:
• use the same physical cell to operate both as electrolyser and fuel cell
• are based on the water splitting and reformation reaction
• are single cells, not stacks of cells
• have designs where the electrode from which hydrogen is evolved in electrolyser mode
and consumed in fuel cell mode in a URFC remains the same; and similarly the
electrode from which oxygen is evolved in electrolyser mode and consumed in fuel cell
mode remains the same
• employ a proton exchange membrane (PEM).
• operate at very near normal room temperature and atmospheric pressure.
In addition the main application for URFCs in mind throughout the thesis is in solar-hydrogen
systems for remote area power supply. Further explanation of the selected scope for the thesis
is provided later in chapter 2.
1.7 OUTCOMES
At the outset of this research work, the outcomes were expected to be the following:
• A design for a single-cell URFC, and a number of URFC constructed for experimental
testing based on this design
• A working experimental model of a URFC
• Experimental results on the performance of URFCs based on a standard procedure
• Advance in theoretical understanding of URFC
• A computer model of single cell URFC based on this theoretical analysis
• Testing of the validity of the model developed by comparing model predictions with
actual experimental results
• Directions for future research to design and develop URFCs with improved
performance.
Doctor of Philosophy CHAPTER 1
8
1.8 STRUCTURE OF THESIS
The concept of unitised regenerative fuel cells that is studied in this thesis is introduced and a
review of previous work on URFCs based on published papers and articles presented in
chapter 2.
Chapter 3 deals with the application of URFCs in solar-hydrogen systems and compares ta
URFC-based system to a solar-hydrogen system employing a separate electrolyser and fuel
cell. Computer simulation modelling of a solar-hydrogen system used to supply the annual
electricity demand of a remote household is used to compare the economics of a URFC-based
system with a system employing a separate fuel cell and electrolyser
An improved theoretical model of a PEM URFC is developed in chapter 4 by deriving a
general theoretical relationship between cell voltage and current density that is applicable in
both E and FC-modes. A computer simulation model of URFCs using this theoretical
relationship and solving equations by iterative methods is then developed and used to show the
effect on cell performance in both modes of varying key electrode parameters.
In chapter 5, the design and construction of experimental URFCs is described. Experimental
URFCs are tested for their Vcell-jcell curves, hydrogen production and consumption rates, and
hence their energy efficiencies in E-mode, FC-mode and roundtrip energy efficiency are
measured and reported.
The theoretical approach and associated computer model (developed earlier in chapter 4) is
used in chapter 6 to obtain best-fit values for the key characteristics of the oxygen and
hydrogen electrodes of URFCs in each mode from their experimentally measured Vcell-jcell
curves.
Conclusions and recommendations arising from the project as a whole are presented in
Chapter 7.
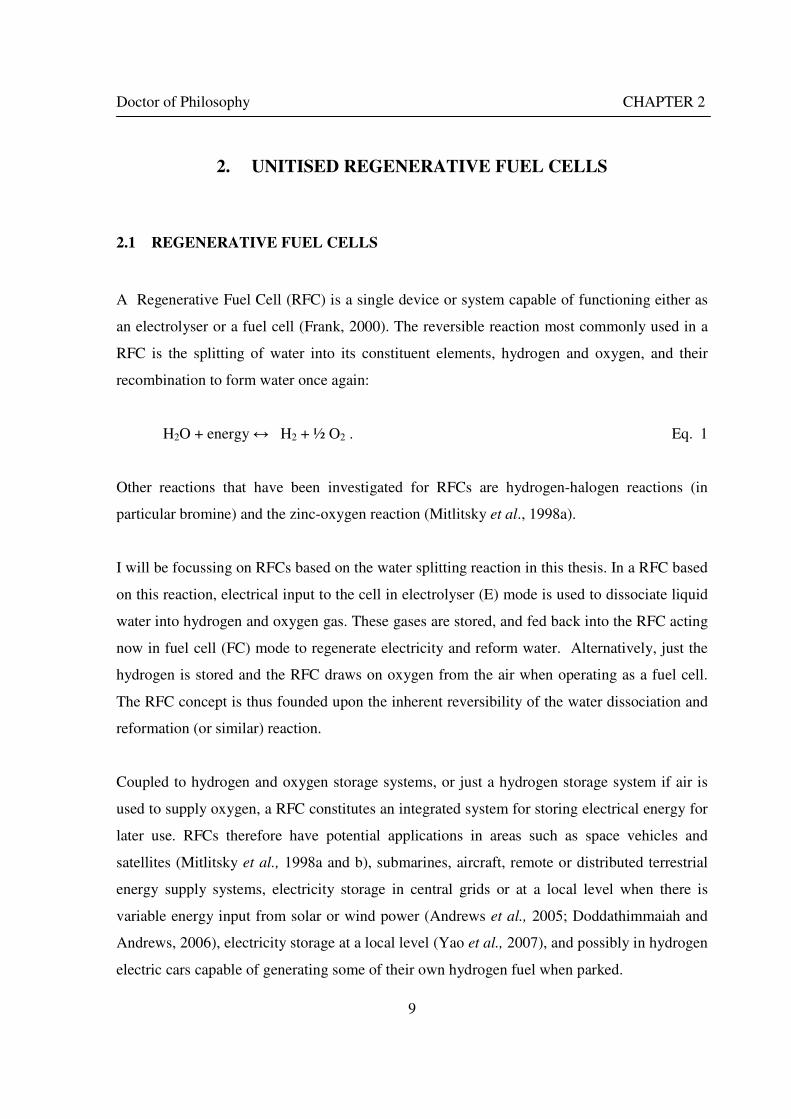
Doctor of Philosophy CHAPTER 2
9
2. UNITISED REGENERATIVE FUEL CELLS
2.1 REGENERATIVE FUEL CELLS
A Regenerative Fuel Cell (RFC) is a single device or system capable of functioning either as
an electrolyser or a fuel cell (Frank, 2000). The reversible reaction most commonly used in a
RFC is the splitting of water into its constituent elements, hydrogen and oxygen, and their
recombination to form water once again:
H2O + energy ↔ H2 + ½ O2 . Eq. 1
Other reactions that have been investigated for RFCs are hydrogen-halogen reactions (in
particular bromine) and the zinc-oxygen reaction (Mitlitsky et al., 1998a).
I will be focussing on RFCs based on the water splitting reaction in this thesis. In a RFC based
on this reaction, electrical input to the cell in electrolyser (E) mode is used to dissociate liquid
water into hydrogen and oxygen gas. These gases are stored, and fed back into the RFC acting
now in fuel cell (FC) mode to regenerate electricity and reform water. Alternatively, just the
hydrogen is stored and the RFC draws on oxygen from the air when operating as a fuel cell.
The RFC concept is thus founded upon the inherent reversibility of the water dissociation and
reformation (or similar) reaction.
Coupled to hydrogen and oxygen storage systems, or just a hydrogen storage system if air is
used to supply oxygen, a RFC constitutes an integrated system for storing electrical energy for
later use. RFCs therefore have potential applications in areas such as space vehicles and
satellites (Mitlitsky et al., 1998a and b), submarines, aircraft, remote or distributed terrestrial
energy supply systems, electricity storage in central grids or at a local level when there is
variable energy input from solar or wind power (Andrews et al., 2005; Doddathimmaiah and
Andrews, 2006), electricity storage at a local level (Yao et al., 2007), and possibly in hydrogen
electric cars capable of generating some of their own hydrogen fuel when parked.
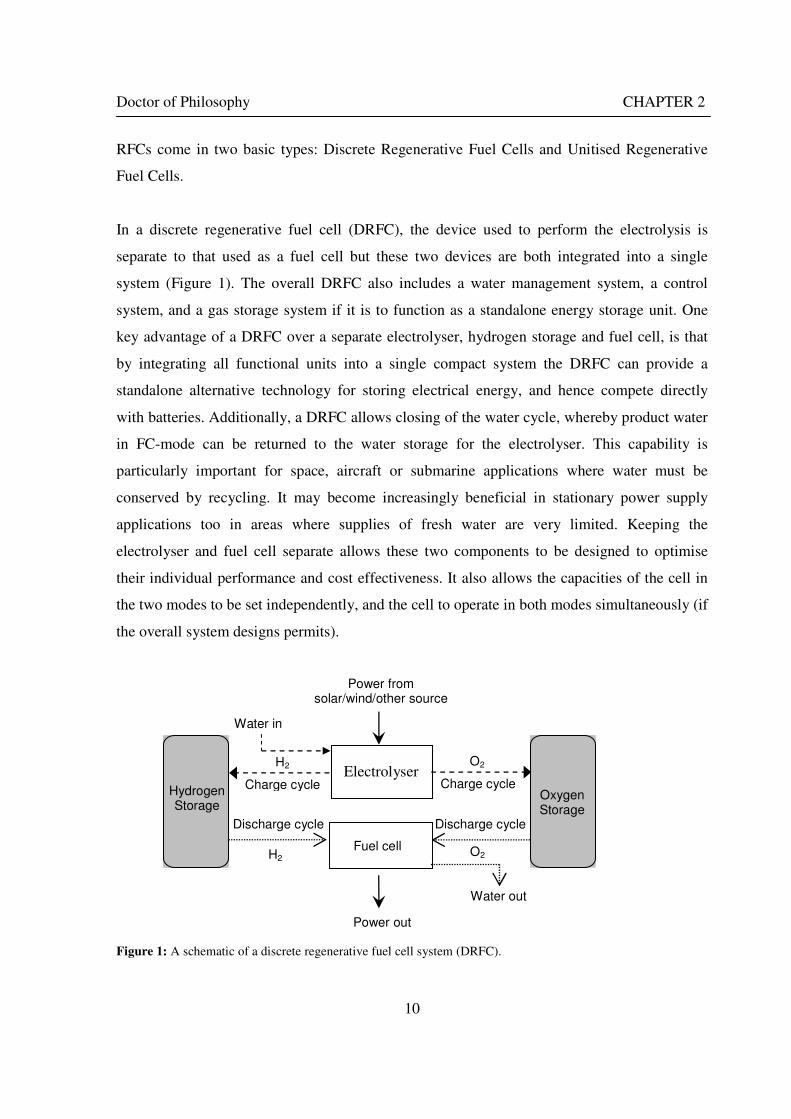
Doctor of Philosophy CHAPTER 2
10
RFCs come in two basic types: Discrete Regenerative Fuel Cells and Unitised Regenerative
Fuel Cells.
In a discrete regenerative fuel cell (DRFC), the device used to perform the electrolysis is
separate to that used as a fuel cell but these two devices are both integrated into a single
system (Figure 1). The overall DRFC also includes a water management system, a control
system, and a gas storage system if it is to function as a standalone energy storage unit. One
key advantage of a DRFC over a separate electrolyser, hydrogen storage and fuel cell, is that
by integrating all functional units into a single compact system the DRFC can provide a
standalone alternative technology for storing electrical energy, and hence compete directly
with batteries. Additionally, a DRFC allows closing of the water cycle, whereby product water
in FC-mode can be returned to the water storage for the electrolyser. This capability is
particularly important for space, aircraft or submarine applications where water must be
conserved by recycling. It may become increasingly beneficial in stationary power supply
applications too in areas where supplies of fresh water are very limited. Keeping the
electrolyser and fuel cell separate allows these two components to be designed to optimise
their individual performance and cost effectiveness. It also allows the capacities of the cell in
the two modes to be set independently, and the cell to operate in both modes simultaneously (if
the overall system designs permits).
Figure 1: A schematic of a discrete regenerative fuel cell system (DRFC).
Electrolyser Hydrogen Storage
Charge cycle
Power out
Charge cycle
Fuel cell
Power from solar/wind/other source
Oxygen Storage
Water in
Water out
H2 O2
H2 O2
Discharge cycle Discharge cycle

Doctor of Philosophy CHAPTER 2
11
2.2 UNITISED REGENERATIVE FUEL CELLS
A Unitised Regenerative Fuel Cell (URFC) is a single device that has dual capability of
functioning in either of two modes: E or FC. Its essential difference compared to a DRFC is
that in a URFC the same physical cell is used both as the electrolyser and fuel cell (Figure 2)
(Frank, 2000). Consequently this cell is truly a reversible bifunctional unit in which the basic
electrochemical reaction (equation 1) moves in the forward direction in E-mode and in the
reverse direction in FC-mode. In E-mode, a URFC electrochemically converts water into
gaseous hydrogen and oxygen and during FC-mode, hydrogen and oxygen gases
electrochemically combine to form water, with the generation of heat and electricity (Frank,
2000, Coalson R, 1998).
Figure 2: A schematic of a unitised regenerative fuel cell system (URFC)
Usually the URFC is first operated in E-mode to produce the hydrogen and oxygen. These
gases are stored and later supplied back to the same unit when desired, which then operates as
a FC (Pettersson et al., 2006).
During E-mode operation water decomposition (oxygen evolution) and proton reduction
(hydrogen evolution) takes place. Water is supplied to the anode of the electrolyser through the
anode flow field. The water contacts the electrode and at the electrocatalyst it releases two
protons, which conduct through the proton exchange membrane (PEM) to the cathode. The
Discharge cycle
Power from solar/wind/other source
Power out
Charge cycle Charge cycle Oxygen Storage
URFC Discharge cycle
Hydrogen Storage
Water in
Water out
H2
H2
O2
O2
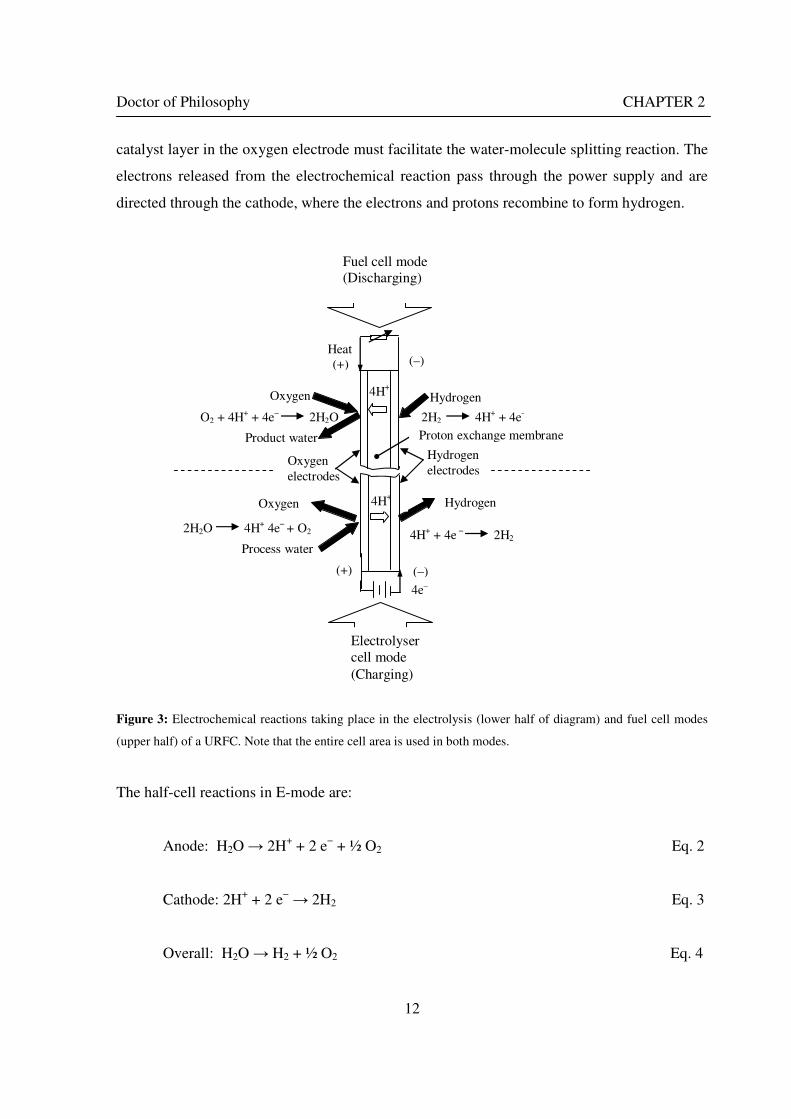
Doctor of Philosophy CHAPTER 2
12
catalyst layer in the oxygen electrode must facilitate the water-molecule splitting reaction. The
electrons released from the electrochemical reaction pass through the power supply and are
directed through the cathode, where the electrons and protons recombine to form hydrogen.
Figure 3: Electrochemical reactions taking place in the electrolysis (lower half of diagram) and fuel cell modes
(upper half) of a URFC. Note that the entire cell area is used in both modes.
The half-cell reactions in E-mode are:
Anode: H2O → 2H+ + 2 e− + ½ O2 Eq. 2
Cathode: 2H+ + 2 e− → 2H2 Eq. 3
Overall: H2O → H2 + ½ O2 Eq. 4
Oxygen Hydrogen
Process water
2H2O 4H+ 4e− + O2 4H+ + 4e − 2H2
(–)
4e–
4H+
(+)
Oxygen
O2 + 4H+ + 4e− 2H2O
Product water
Oxygen
electrodes
Hydrogen
electrodes
Hydrogen
2H2 4H+ + 4e-
Proton exchange membrane
4H+
(+) (–) Heat
H2
Electrolyser cell mode
(Charging)
Fuel cell mode (Discharging)
Doctor of Philosophy CHAPTER 2
13
During FC-mode operation oxygen reduction and hydrogen oxidation take place (Ioroi et al.,
2001):
Anode: H2 → 2 H+ + 2 e− Eq. 5
Cathode: ½ O2 + 2 e− +2 H+ → H2O Eq. 6
Overall: H2 + ½ O2 → H2O Eq. 7
The URFC can be operated similarly to a secondary battery where electrical energy is
transformed into chemical energy (stored in the form of hydrogen and oxygen gases) by the
electrolysis water in charge mode. In discharge mode, the URFC system is operated as a fuel
cell using up the stored reactants and is transformed back into electricity (Jorissen, 2006).
2.3 BRIEF HISTORY OF URFCS
Since William Grove demonstrated the first fuel cell in 1839, the reversibility of the water
splitting and recombination reaction has been well known. Interest in fuel cells grew rapidly
from the 1950s onwards particularly to generate electricity for spacecraft using safe, compact
and relatively lightweight technology. Early fuel cells used in the US and Soviet Union’s space
programs utilised hydrogen and oxygen stored on board. But it was soon recognised that a
reversible cell capable of both electrolysis and power generation could be the central
component of a closed-cycle regenerative energy storage and power supply system that used
solar energy to split the stored water into hydrogen and oxygen. These gases could then be
stored and used as required in a fuel cell to produce power, together with water once again that
could be returned to the water storage tank for reuse. The only external input to the system
would then be the solar energy.

Doctor of Philosophy CHAPTER 2
14
An early proof of the URFC concept was provided by General Electric in 1973 when a
lifecycle test of a single-cell PEM URFC showed that reversible operation was feasible
without significant degradation of the cell membrane (similar to DuPont's Nafion 120) and
catalyst (Mitlitsky et al., 1996a).
In 1992, The Lawrence Livermore National Laboratory (LLNL) working with AeroVironment
Inc., identified URFCs as the ideal energy storage solution for the High Altitude Long
Endurance Solar Rechargeable Aircraft (HALE SRA) program being funded by the Ballistic
Missile Defence Organization (BMDO). Electricity from solar panels located on the model
aircraft’s elongated wings was used to drive the propellers directly during the day, with the
surplus fed into a URFC in E-mode to produce hydrogen and oxygen for on-board storage in
transparent polycarbonate tanks (Figure 4). The hydrogen and oxygen gases were then fed
back into the URFC in FC-mode to generate power to keep the propellers turning and the
plane moving during the night (Mitlitsky et al., 1999a and b).
Figure 4: The model solar-powered aircraft with a URFC-based energy storage system built in the High Altitude
Long Endurance Solar Rechargeable Aircraft program in the USA in the mid 1990s. Top - on Rogers Dry Lake
bed before flight; bottom – the aircraft in flight at an altitude of 60 m. Source: Energy and Technology Review,
1994.
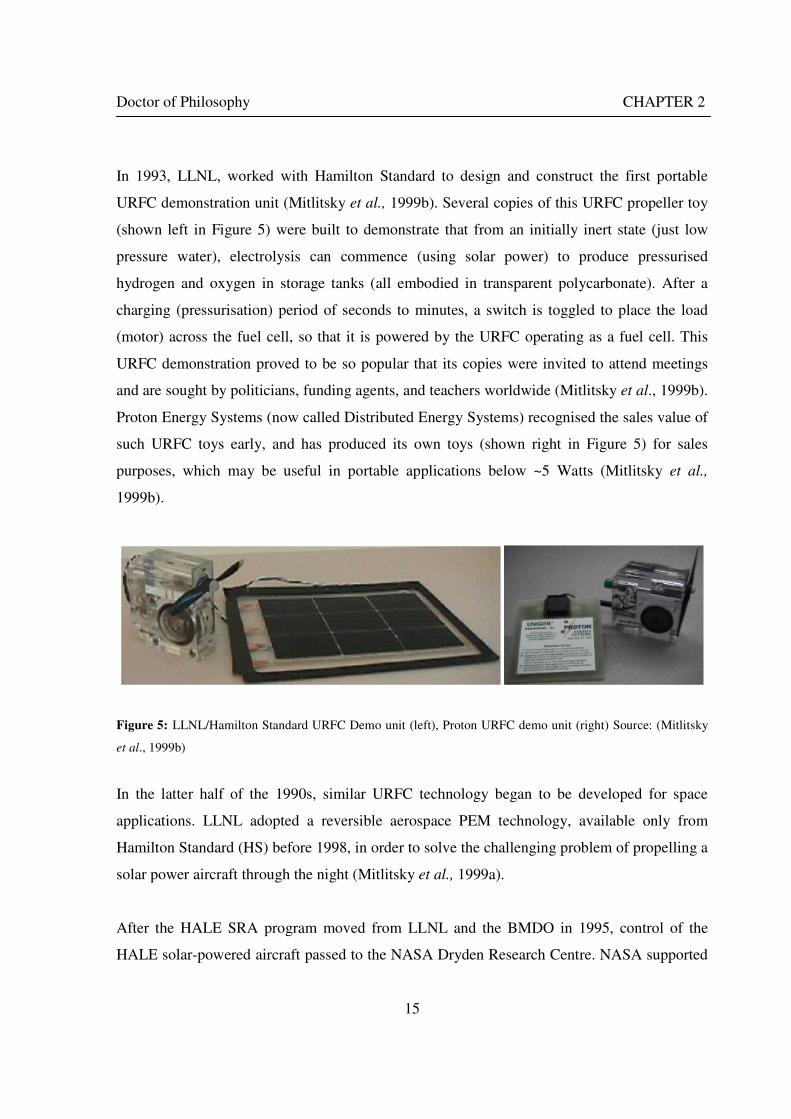
Doctor of Philosophy CHAPTER 2
15
In 1993, LLNL, worked with Hamilton Standard to design and construct the first portable
URFC demonstration unit (Mitlitsky et al., 1999b). Several copies of this URFC propeller toy
(shown left in Figure 5) were built to demonstrate that from an initially inert state (just low
pressure water), electrolysis can commence (using solar power) to produce pressurised
hydrogen and oxygen in storage tanks (all embodied in transparent polycarbonate). After a
charging (pressurisation) period of seconds to minutes, a switch is toggled to place the load
(motor) across the fuel cell, so that it is powered by the URFC operating as a fuel cell. This
URFC demonstration proved to be so popular that its copies were invited to attend meetings
and are sought by politicians, funding agents, and teachers worldwide (Mitlitsky et al., 1999b).
Proton Energy Systems (now called Distributed Energy Systems) recognised the sales value of
such URFC toys early, and has produced its own toys (shown right in Figure 5) for sales
purposes, which may be useful in portable applications below ~5 Watts (Mitlitsky et al.,
1999b).
Figure 5: LLNL/Hamilton Standard URFC Demo unit (left), Proton URFC demo unit (right) Source: (Mitlitsky
et al., 1999b)
In the latter half of the 1990s, similar URFC technology began to be developed for space
applications. LLNL adopted a reversible aerospace PEM technology, available only from
Hamilton Standard (HS) before 1998, in order to solve the challenging problem of propelling a
solar power aircraft through the night (Mitlitsky et al., 1999a).
After the HALE SRA program moved from LLNL and the BMDO in 1995, control of the
HALE solar-powered aircraft passed to the NASA Dryden Research Centre. NASA supported
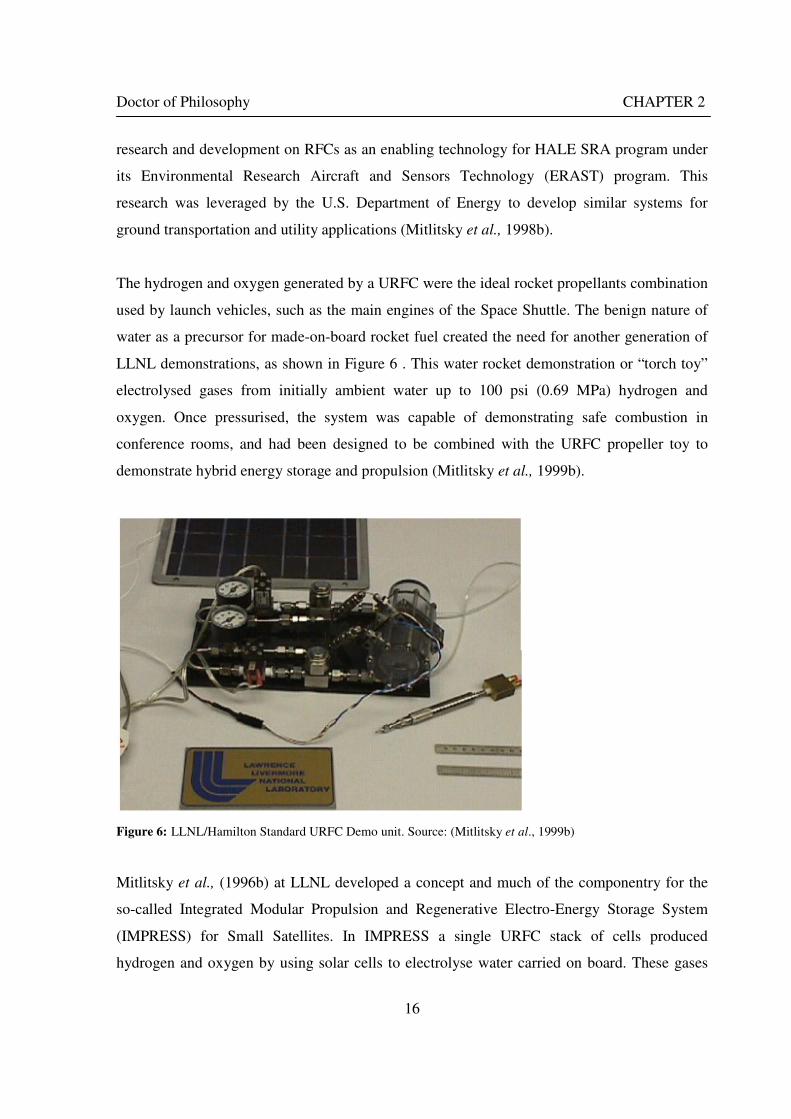
Doctor of Philosophy CHAPTER 2
16
research and development on RFCs as an enabling technology for HALE SRA program under
its Environmental Research Aircraft and Sensors Technology (ERAST) program. This
research was leveraged by the U.S. Department of Energy to develop similar systems for
ground transportation and utility applications (Mitlitsky et al., 1998b).
The hydrogen and oxygen generated by a URFC were the ideal rocket propellants combination
used by launch vehicles, such as the main engines of the Space Shuttle. The benign nature of
water as a precursor for made-on-board rocket fuel created the need for another generation of
LLNL demonstrations, as shown in Figure 6 . This water rocket demonstration or “torch toy”
electrolysed gases from initially ambient water up to 100 psi (0.69 MPa) hydrogen and
oxygen. Once pressurised, the system was capable of demonstrating safe combustion in
conference rooms, and had been designed to be combined with the URFC propeller toy to
demonstrate hybrid energy storage and propulsion (Mitlitsky et al., 1999b).
Figure 6: LLNL/Hamilton Standard URFC Demo unit. Source: (Mitlitsky et al., 1999b)
Mitlitsky et al., (1996b) at LLNL developed a concept and much of the componentry for the
so-called Integrated Modular Propulsion and Regenerative Electro-Energy Storage System
(IMPRESS) for Small Satellites. In IMPRESS a single URFC stack of cells produced
hydrogen and oxygen by using solar cells to electrolyse water carried on board. These gases
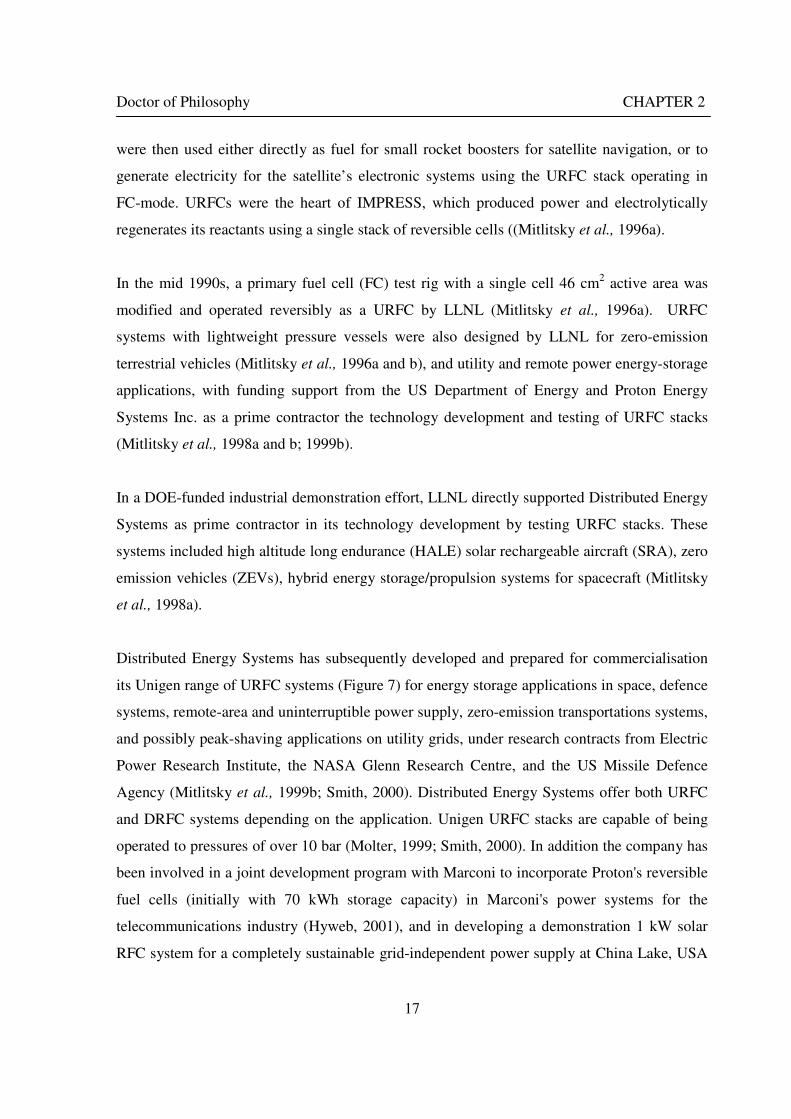
Doctor of Philosophy CHAPTER 2
17
were then used either directly as fuel for small rocket boosters for satellite navigation, or to
generate electricity for the satellite’s electronic systems using the URFC stack operating in
FC-mode. URFCs were the heart of IMPRESS, which produced power and electrolytically
regenerates its reactants using a single stack of reversible cells ((Mitlitsky et al., 1996a).
In the mid 1990s, a primary fuel cell (FC) test rig with a single cell 46 cm2 active area was
modified and operated reversibly as a URFC by LLNL (Mitlitsky et al., 1996a). URFC
systems with lightweight pressure vessels were also designed by LLNL for zero-emission
terrestrial vehicles (Mitlitsky et al., 1996a and b), and utility and remote power energy-storage
applications, with funding support from the US Department of Energy and Proton Energy
Systems Inc. as a prime contractor the technology development and testing of URFC stacks
(Mitlitsky et al., 1998a and b; 1999b).
In a DOE-funded industrial demonstration effort, LLNL directly supported Distributed Energy
Systems as prime contractor in its technology development by testing URFC stacks. These
systems included high altitude long endurance (HALE) solar rechargeable aircraft (SRA), zero
emission vehicles (ZEVs), hybrid energy storage/propulsion systems for spacecraft (Mitlitsky
et al., 1998a).
Distributed Energy Systems has subsequently developed and prepared for commercialisation
its Unigen range of URFC systems (Figure 7) for energy storage applications in space, defence
systems, remote-area and uninterruptible power supply, zero-emission transportations systems,
and possibly peak-shaving applications on utility grids, under research contracts from Electric
Power Research Institute, the NASA Glenn Research Centre, and the US Missile Defence
Agency (Mitlitsky et al., 1999b; Smith, 2000). Distributed Energy Systems offer both URFC
and DRFC systems depending on the application. Unigen URFC stacks are capable of being
operated to pressures of over 10 bar (Molter, 1999; Smith, 2000). In addition the company has
been involved in a joint development program with Marconi to incorporate Proton's reversible
fuel cells (initially with 70 kWh storage capacity) in Marconi's power systems for the
telecommunications industry (Hyweb, 2001), and in developing a demonstration 1 kW solar
RFC system for a completely sustainable grid-independent power supply at China Lake, USA
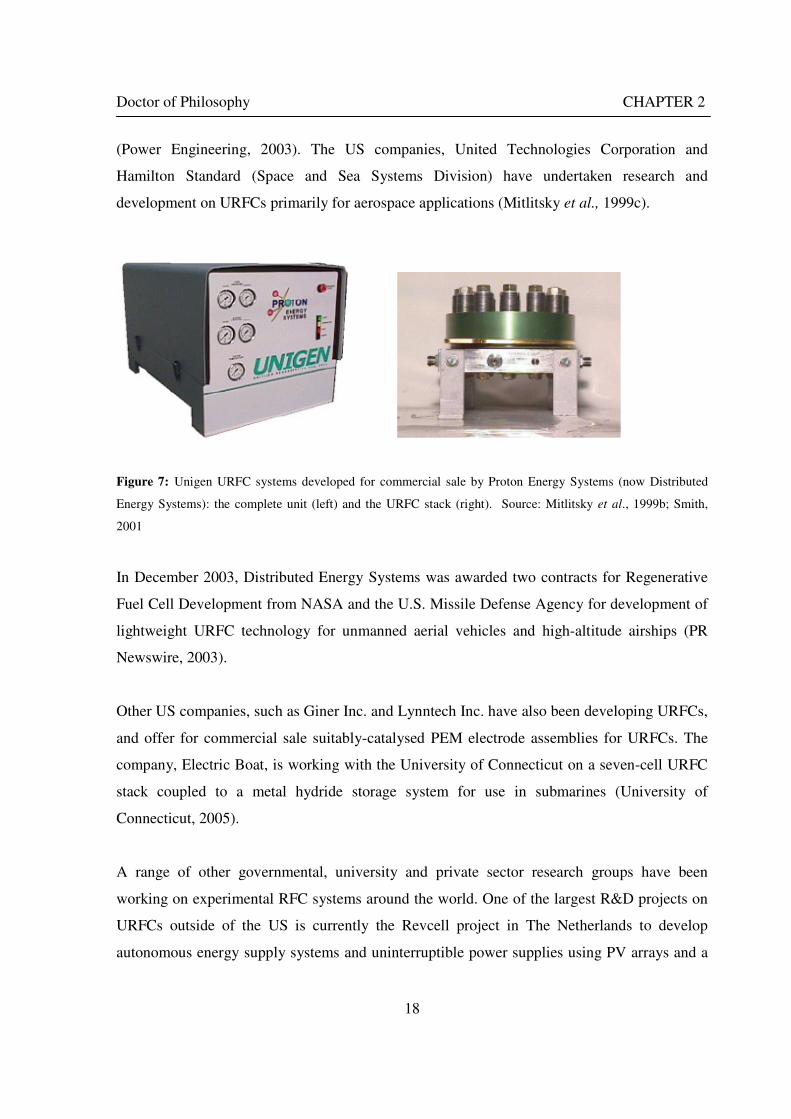
Doctor of Philosophy CHAPTER 2
18
(Power Engineering, 2003). The US companies, United Technologies Corporation and
Hamilton Standard (Space and Sea Systems Division) have undertaken research and
development on URFCs primarily for aerospace applications (Mitlitsky et al., 1999c).
Figure 7: Unigen URFC systems developed for commercial sale by Proton Energy Systems (now Distributed
Energy Systems): the complete unit (left) and the URFC stack (right). Source: Mitlitsky et al., 1999b; Smith,
2001
In December 2003, Distributed Energy Systems was awarded two contracts for Regenerative
Fuel Cell Development from NASA and the U.S. Missile Defense Agency for development of
lightweight URFC technology for unmanned aerial vehicles and high-altitude airships (PR
Newswire, 2003).
Other US companies, such as Giner Inc. and Lynntech Inc. have also been developing URFCs,
and offer for commercial sale suitably-catalysed PEM electrode assemblies for URFCs. The
company, Electric Boat, is working with the University of Connecticut on a seven-cell URFC
stack coupled to a metal hydride storage system for use in submarines (University of
Connecticut, 2005).
A range of other governmental, university and private sector research groups have been
working on experimental RFC systems around the world. One of the largest R&D projects on
URFCs outside of the US is currently the Revcell project in The Netherlands to develop
autonomous energy supply systems and uninterruptible power supplies using PV arrays and a
Doctor of Philosophy CHAPTER 2
19
URFC-hydrogen based system for long-term energy storage for PV stand-alone systems. This
project is being conducted by Hynergreen Technologies, Spain, Fraunhofer-Gesellschaft,
Germany, NedStack Fuel Cell Technology, and others (Nedstack, 2007).
2.4 FOCUS ON PROTON EXCHANGE MEMBRANES FOR URFCS
The vast majority of URFCs built to date have employed a Proton Exchange Membrane
(PEM) as a solid polymer electrolyte. The PEM was invented by Willard Thomas Grubb and
Lee Niedrach in early 1960 (Katukota, 2006). These membranes are solid fluoro polymers that
are chemically altered in part to contain sulphonic acid groups, which easily release hydrogen
as protons (Katukota, 2006):
SO3H → SO3- + H+. Eq. 8
This ionic structure allows water to penetrate into the membrane, but not the product gases,
hydrogen and oxygen. The resulting hydrated proton, H3O+ is free to move whereas SO3H
remain fixed to the polymer side chains. The hydrated protons are attracted to the negatively
charged electrode (which is the hydrogen side in E-mode) when an electric field is applied
across the membrane (Katukota, 2006). Thus the membrane acts as a conductor of electricity
in the form of proton movement, and is called a proton conductor.
A PEM URFC has the advantage of working at relatively low temperatures in the range 30 –
80ºC (Badwal et al., 2006; Tunold et al., 2006; Ali, 2007). On account of their being the
subject of more widespread study and use, I will concentrate on PEM URFCs in the present
thesis.
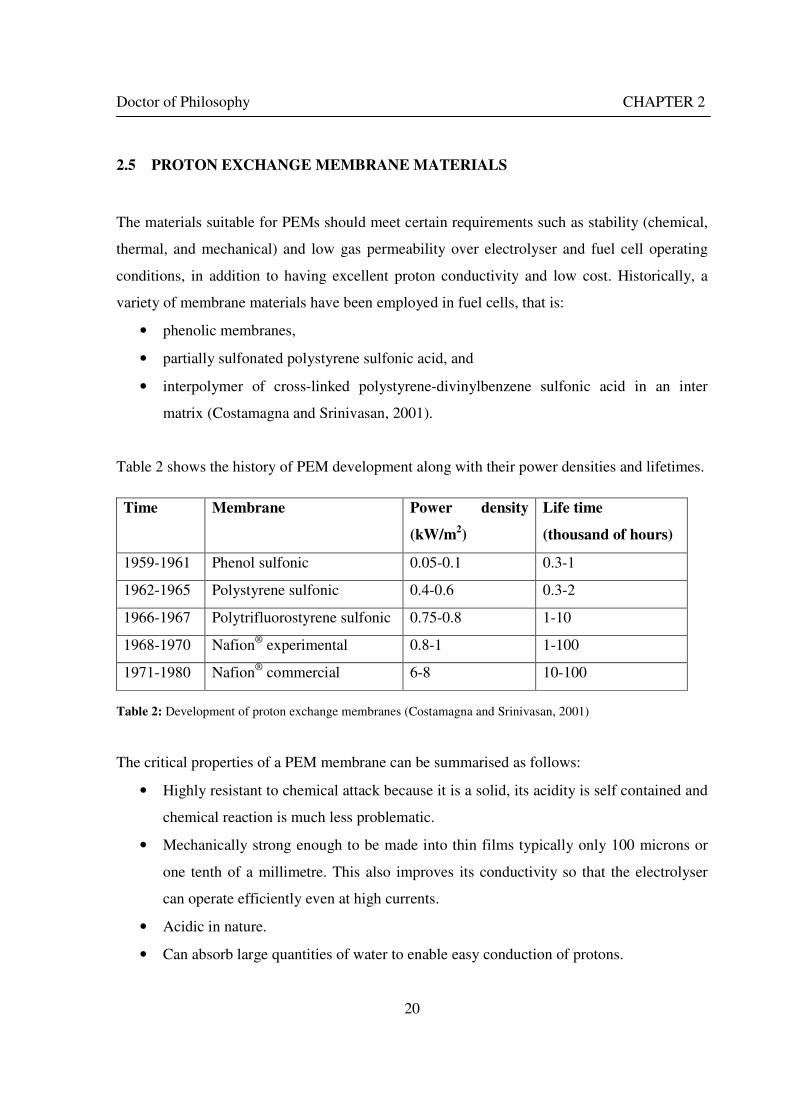
Doctor of Philosophy CHAPTER 2
20
2.5 PROTON EXCHANGE MEMBRANE MATERIALS
The materials suitable for PEMs should meet certain requirements such as stability (chemical,
thermal, and mechanical) and low gas permeability over electrolyser and fuel cell operating
conditions, in addition to having excellent proton conductivity and low cost. Historically, a
variety of membrane materials have been employed in fuel cells, that is:
• phenolic membranes,
• partially sulfonated polystyrene sulfonic acid, and
• interpolymer of cross-linked polystyrene-divinylbenzene sulfonic acid in an inter
matrix (Costamagna and Srinivasan, 2001).
Table 2 shows the history of PEM development along with their power densities and lifetimes.
Time Membrane Power density
(kW/m2)
Life time
(thousand of hours)
1959-1961 Phenol sulfonic 0.05-0.1 0.3-1
1962-1965 Polystyrene sulfonic 0.4-0.6 0.3-2
1966-1967 Polytrifluorostyrene sulfonic 0.75-0.8 1-10
1968-1970 Nafion® experimental 0.8-1 1-100
1971-1980 Nafion® commercial 6-8 10-100
Table 2: Development of proton exchange membranes (Costamagna and Srinivasan, 2001)
The critical properties of a PEM membrane can be summarised as follows:
• Highly resistant to chemical attack because it is a solid, its acidity is self contained and
chemical reaction is much less problematic.
• Mechanically strong enough to be made into thin films typically only 100 microns or
one tenth of a millimetre. This also improves its conductivity so that the electrolyser
can operate efficiently even at high currents.
• Acidic in nature.
• Can absorb large quantities of water to enable easy conduction of protons.

Doctor of Philosophy CHAPTER 2
21
• Has a very high resistance to electron flow.
• Does not allow oxygen or hydrogen gas molecules to diffuse through the membrane.
However, the membrane also has some disadvantages. Unlike conventional polymers which
are water-repellent, it must also be kept humidified constantly otherwise its conductivity
deteriorates. It is moreover a very expensive material. In addition to the high cost of
production, the membrane properties degrade at high temperature (>110ºC) and even release
toxic gases at temperature above 150° C (Choi, 2004). Since the perflurosulfonic acid (PSFA)
membrane should be kept hydrated to retain proton conductivity, the operating temperature
must be kept below the boiling point of water. Some increase in operating temperature, up to
120ºC, may be possible at the expense of operational efficiency under pressurised stream. This
practice will, however, shorten the life of the membranes (Choi, 2004).
The PEMs developed so far can be can be classified into three categories (Choi, 2004):
i. perfluorinated polymers, e.g., Nafion®, Flemion®, Gore-Select® and Dow membranes;
ii. partially fluorinated polymers, e.g., poly-α ,β ,β -trifluorostyrene and Ballard Advanced
Materials 3rd Generations (BAM3G) polymers; and
iii. hydrocarbon polymers, e.g., poly(phenylene oxide) PPO, poly(ether ether ketone)
PEEK, poly(phosphazine) PP, poly(imides) PI, poly(benzimidazole) PBI.
The material used most extensively for PEM URFCs is a Nafion®, a perfluorosulfonic acid
polymer made by Dupont. I will discuss the properties of Nafion further in subsection 2.9.1.2.

Doctor of Philosophy CHAPTER 2
22
2.6 BASIC TYPES OF URFC
2.6.1 Oxygen and hydrogen electrodes constant
In the most common type of URFC (Figure 8) the electrode from which hydrogen is evolved
in E-mode and consumed in FC-mode stays the same, so that this electrode can unambiguously
be called the ‘hydrogen electrode’. Similarly oxygen is evolved and consumed at the other
electrode, which can be named the ‘oxygen electrode’. The electrodes serving as cathode and
anode interchange between modes since the current flows in opposite directions in the two
modes. In the present thesis, the terminology, ‘oxygen and hydrogen electrodes’, rather than
‘cathode and anode’, will thus be used when talking about this type of URFC to avoid
confusion.
In E-mode the catalyst layer in the oxygen electrode must facilitate the water-molecule
splitting reaction (as given earlier in equation 4). In FC-mode it is the reverse water-formation
reaction that must be encouraged. So the catalyst layer must be bifunctional. The achievement
of bifunctionality is a significant design challenge in URFCs since most catalysts will
encourage the reaction in one direction but are not so effective in encouraging the reverse
reaction. For example, platinum in the oxygen electrode’s catalyst layer works well in
facilitating the water-formation reaction required in FC-mode, but performs poorly in
encouraging the water-splitting reaction in E-mode (see, for example, Murphy et al., 1995).
The catalyst layer in the hydrogen electrode must support the hydrogen formation reaction (as
given earlier in equation 3) in E-mode, and the reverse hydrogen-molecule splitting reaction in
FC-mode. Hence once again the catalyst layer has to be bifunctional, but fortunately platinum
functions well as a catalyst for both the hydrogen-molecule splitting and formation reactions.
The main design and material-section challenge therefore tends to be to achieve bifunctionality
of the oxygen electrode, both in terms of catalyst efficacy and reactant kinetics, rather than on
the hydrogen side. Moreover the water-splitting and formation reactions involve a number of
intermediate reactions (O’Hayre et al., 2005) and are far more complicated than the hydrogen-
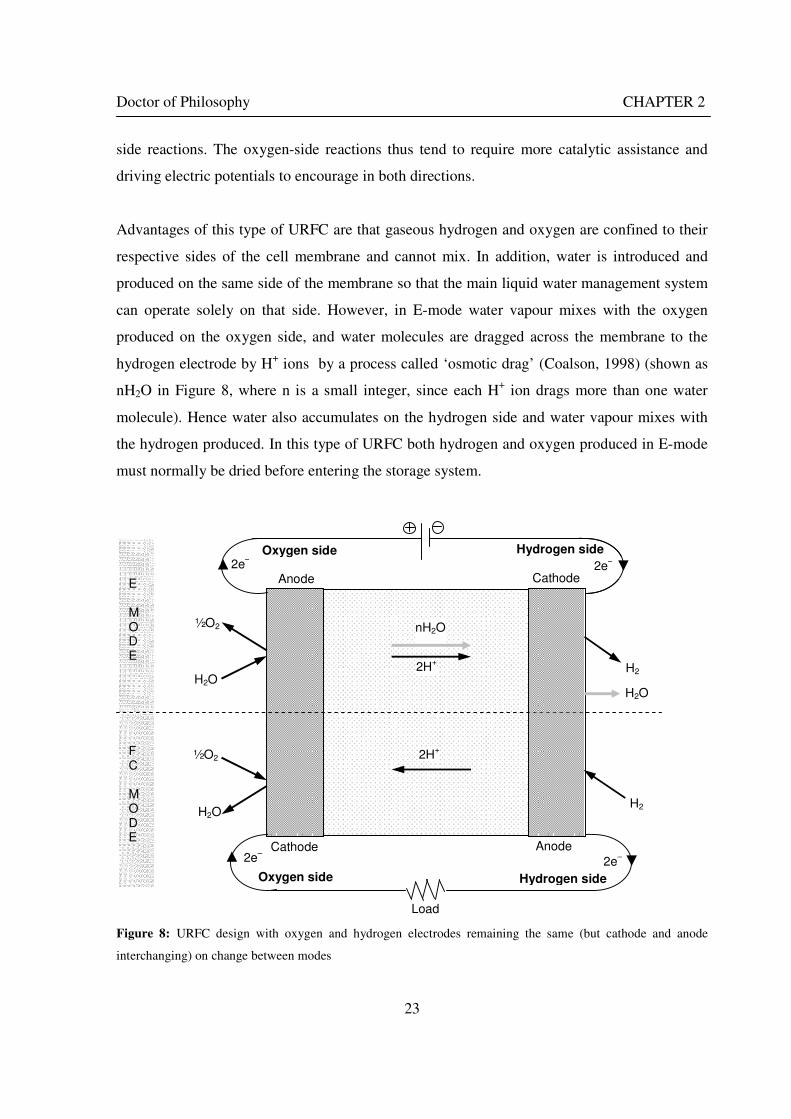
Doctor of Philosophy CHAPTER 2
23
side reactions. The oxygen-side reactions thus tend to require more catalytic assistance and
driving electric potentials to encourage in both directions.
Advantages of this type of URFC are that gaseous hydrogen and oxygen are confined to their
respective sides of the cell membrane and cannot mix. In addition, water is introduced and
produced on the same side of the membrane so that the main liquid water management system
can operate solely on that side. However, in E-mode water vapour mixes with the oxygen
produced on the oxygen side, and water molecules are dragged across the membrane to the
hydrogen electrode by H+ ions by a process called ‘osmotic drag’ (Coalson, 1998) (shown as
nH2O in Figure 8, where n is a small integer, since each H+ ion drags more than one water
molecule). Hence water also accumulates on the hydrogen side and water vapour mixes with
the hydrogen produced. In this type of URFC both hydrogen and oxygen produced in E-mode
must normally be dried before entering the storage system.
Figure 8: URFC design with oxygen and hydrogen electrodes remaining the same (but cathode and anode
interchanging) on change between modes
Cathode
Oxygen side
2e–
Load
Anode
Hydrogen side
2H+
2H+
nH2O ½O2
H2O
½O2
H2O
Anode Cathode
2e–
H2
Oxygen side
E MODE
Hydrogen side
F C MODE
H2
H2O
2e–
2e–
Doctor of Philosophy CHAPTER 2
24
2.6.2 Oxygen and hydrogen electrodes interchange
An alternative type of URFC switches the electrodes in contact with oxygen and hydrogen in
changing between modes, so that one electrode is the anode, and the other the cathode in both
modes (Figure 9). In this design type, the oxidation reactions in both modes (which consume
electrons) take place at the same electrode (the cathode), and the reduction reactions (which
yield electrons). It has been argued that, because the same basic form of reaction – oxidation
or reduction – is taking place at each electrode, it is easier to find suitable catalysts and
produce electrodes with a long lifetime than with the first type of URFC described in the
previous subsection (Murphy et al., 1995). Certainly if platinum is used in the catalyst layer on
both electrodes, this catalyst will perform well in facilitating the hydrogen-molecule
decomposition reaction in E-mode on one electrode, and the hydrogen formation reaction on
the other electrode in FC-mode. But it is likely that another catalyst material would need to be
added on both electrodes to support the water decomposition and formation reactions. Hence
both electrodes would have a mix of catalysts, rather than just one electrode in the case of the
first type of URFC.
A further disadvantage of the electrode-switching type is the potential for oxygen and
hydrogen to mix on both sides of the membrane, since alternatively hydrogen and oxygen are
present on each side as mode switching takes place. Such mixing would reduce cell
performance and potentially lead to safety concerns if the flammability limits of hydrogen-
oxygen mixtures were exceeded. To avoid these problems, flushing of the electrode
compartments with an inert gas such as nitrogen is usually required when changing between
modes (Jorissen, 2006).
With water being introduced on one electrode in E-mode and formed on the other in FC-mode,
the catalyst layers and associated gas diffusion backings on both electrodes must also be
resistant to and not degrade in the presence of this water and the water management system
must operate equally on both electrodes.
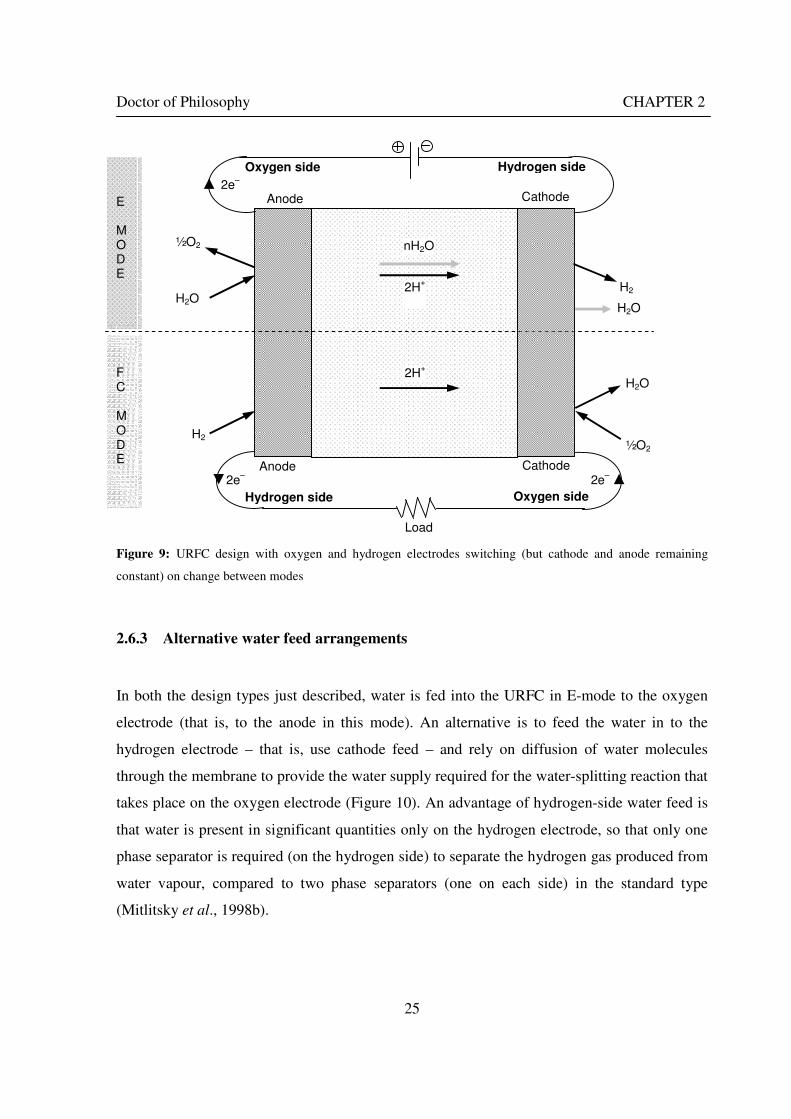
Doctor of Philosophy CHAPTER 2
25
Figure 9: URFC design with oxygen and hydrogen electrodes switching (but cathode and anode remaining
constant) on change between modes
2.6.3 Alternative water feed arrangements
In both the design types just described, water is fed into the URFC in E-mode to the oxygen
electrode (that is, to the anode in this mode). An alternative is to feed the water in to the
hydrogen electrode – that is, use cathode feed – and rely on diffusion of water molecules
through the membrane to provide the water supply required for the water-splitting reaction that
takes place on the oxygen electrode (Figure 10). An advantage of hydrogen-side water feed is
that water is present in significant quantities only on the hydrogen electrode, so that only one
phase separator is required (on the hydrogen side) to separate the hydrogen gas produced from
water vapour, compared to two phase separators (one on each side) in the standard type
(Mitlitsky et al., 1998b).
Load
2H+
2H+
nH2O
Cathode
Hydrogen side
2e–
2e
–
Hydrogen side Oxygen side
Anode Cathode
E MODE
F C MODE
2e–
Oxygen side
H2O
Anode
H2O
½O2
H2O
½O2
H2
H2
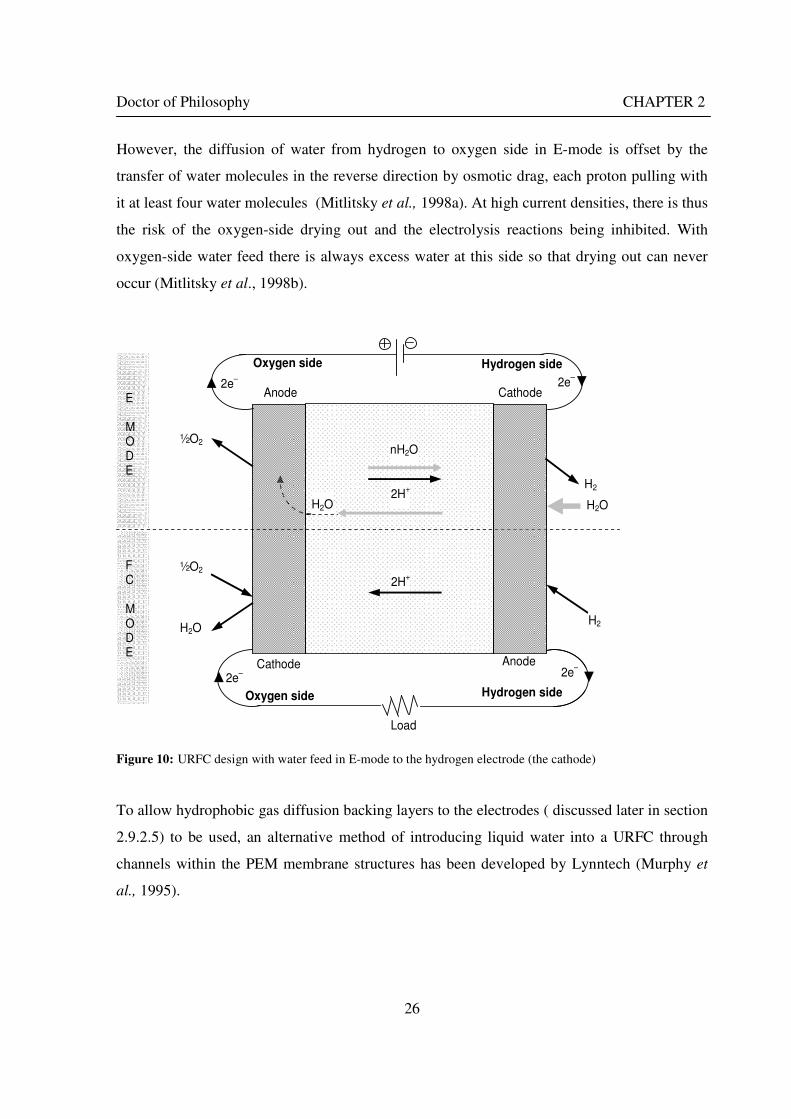
Doctor of Philosophy CHAPTER 2
26
However, the diffusion of water from hydrogen to oxygen side in E-mode is offset by the
transfer of water molecules in the reverse direction by osmotic drag, each proton pulling with
it at least four water molecules (Mitlitsky et al., 1998a). At high current densities, there is thus
the risk of the oxygen-side drying out and the electrolysis reactions being inhibited. With
oxygen-side water feed there is always excess water at this side so that drying out can never
occur (Mitlitsky et al., 1998b).
Figure 10: URFC design with water feed in E-mode to the hydrogen electrode (the cathode)
To allow hydrophobic gas diffusion backing layers to the electrodes ( discussed later in section
2.9.2.5) to be used, an alternative method of introducing liquid water into a URFC through
channels within the PEM membrane structures has been developed by Lynntech (Murphy et
al., 1995).
Load
Cathode
Oxygen side
H2O 2H
+
2H+
nH2O
2e–
Anode
Cathode Anode
½O2
½O2
H2O
H2
Oxygen side
E MODE
Hydrogen side
Hydrogen side
F C MODE
H2
H2O
2e–
2e–
2e–
Doctor of Philosophy CHAPTER 2
27
2.6.4 Functional separation of the membrane
Another type of URFC design has been proposed by Ito et al. (2005) that functionally
separates the plane of a single membrane into one portion for water electrolysis portion and the
other for FC-mode. Separate passages feed the two portions with gas and water respectively.
2.6.5 Emphasis in this thesis
The present thesis focuses on URFCs where oxygen and hydrogen electrodes remain constant
during both E and FC-modes. As described earlier in section 2.6.1, the electrode from which
hydrogen is evolved in E-mode and consumed in FC-mode stays the same, which is referred to
as the ‘hydrogen electrode’ in this thesis. Similarly oxygen is evolved and consumed at the
other electrode, which is called as the ‘oxygen electrode’.
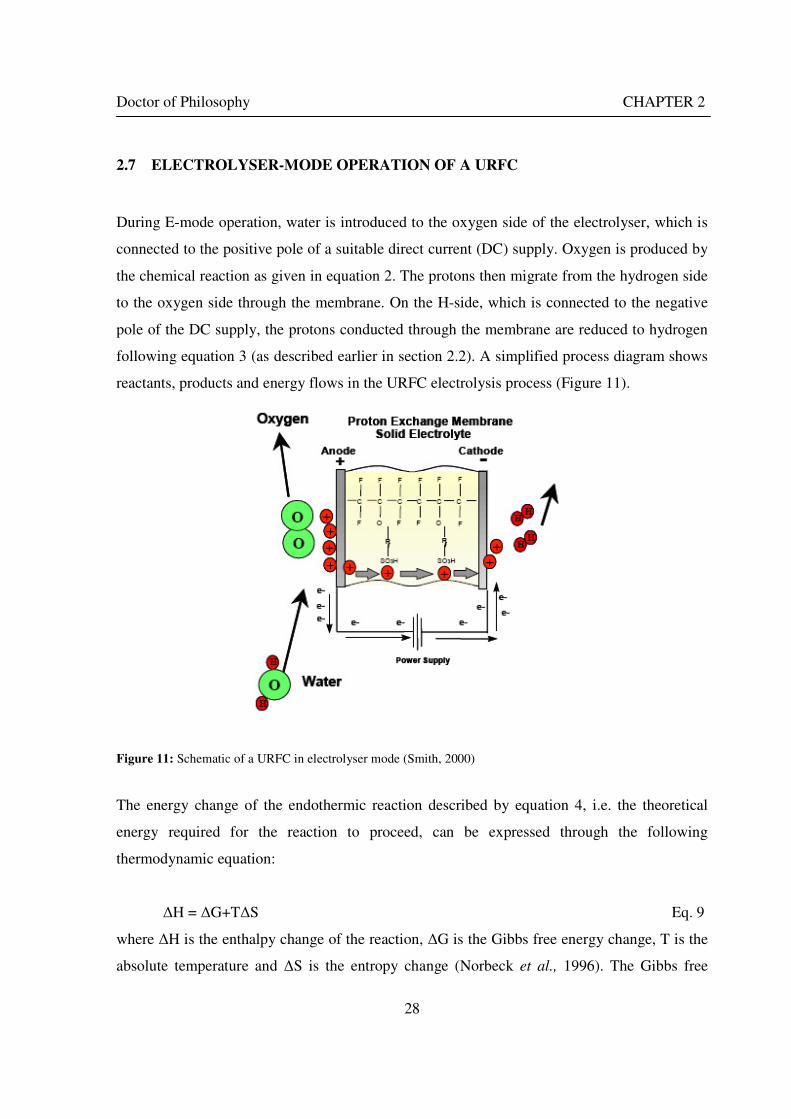
Doctor of Philosophy CHAPTER 2
28
2.7 ELECTROLYSER-MODE OPERATION OF A URFC
During E-mode operation, water is introduced to the oxygen side of the electrolyser, which is
connected to the positive pole of a suitable direct current (DC) supply. Oxygen is produced by
the chemical reaction as given in equation 2. The protons then migrate from the hydrogen side
to the oxygen side through the membrane. On the H-side, which is connected to the negative
pole of the DC supply, the protons conducted through the membrane are reduced to hydrogen
following equation 3 (as described earlier in section 2.2). A simplified process diagram shows
reactants, products and energy flows in the URFC electrolysis process (Figure 11).
Figure 11: Schematic of a URFC in electrolyser mode (Smith, 2000)
The energy change of the endothermic reaction described by equation 4, i.e. the theoretical
energy required for the reaction to proceed, can be expressed through the following
thermodynamic equation:
∆H = ∆G+T∆S Eq. 9
where ∆H is the enthalpy change of the reaction, ∆G is the Gibbs free energy change, T is the
absolute temperature and ∆S is the entropy change (Norbeck et al., 1996). The Gibbs free
Doctor of Philosophy CHAPTER 2
29
energy change ∆G corresponds to the portion of the total reaction energy that must be supplied
in the form of electricity, when water splitting is performed by electrolysis. The term “T∆S”
corresponds to the portion of the total reaction energy that could thermodynamically provided
by thermal energy.
Under standard temperature and pressure conditions (STP), the enthalpy change of the reaction
based on liquid water is, ∆H = 285.8 kJ/mol (Larminie and Dicks, 2003). This value also
corresponds to the so-called higher heating value (HHV) of hydrogen, which is the theoretical
maximum amount of energy released when pure hydrogen is combusted completely.
The corresponding change in Gibbs free energy at STP is (Larminie and Dicks, 2003):
∆G = 237.2 kJ/mol
In other words, 237.2 out of 285.8 kJ/mol, or 83% of the minimum energy required to
electrolyse liquid water under standard conditions must come from electricity. The other 17%
could theoretically be supplied by heat or by electricity as well.
In practice, electricity provides all of the energy theoretically required by a low-temperature
electrolysis cell (e.g. 80°C), and some more to overcome various losses (Richard, 2004). The
result of these inefficiencies is waste heat that must be dissipated. However, it is possible to
have heat provide part of the energy required by the electrolysis reaction at higher
temperatures (Noyes Data Corporation, 1978).
Two distinct cell voltages can be calculated from the change in Gibbs free energy ∆G and the
reaction enthalpy ∆H. The first one is called the reversible voltage, EO, and is given by:
F2
GEO
∆= Eq. 10
Doctor of Philosophy CHAPTER 2
30
where F is the Faraday constant. It corresponds to the minimum electrical potential needed to
drive the electrolysis reaction. At STP, EO has a value of 1.23 V (Richard, 2004).
The voltage associated with ∆H is commonly called the thermoneutral cell voltage, Etn
(Richard 2004):
F2
HE tn
∆= . Eq. 11
To summarise, if an electrolysis cell operates below the reversible voltage EO, no sustained
water splitting can occur. If it operates between EO and Etn, then the process is endothermic
and part of the energy required to split water comes from heat. If it operates above Etn, the
process is exothermic, meaning that excess heat must be dissipated, and all of the energy
required comes from electricity (Richard, 2004).
∆H and ∆G, and consequently Etn and EO, are functions of the temperature, pressure and
electrolyte composition.
Equations 10 and 11, which link energy and voltages, can be derived by considering the work
done on and potential energy changes of electrons as they pass round the circuit from one pole
of the external source of electric potential to the other. As indicated earlier, two electrons must
pass round the external circuit to split each water molecule. So, for one mole of hydrogen
produced, 2N electrons must pass round the external circuit (where N is Avogadro’s number).
If –e is the charge on one electron, the charge that flows is:
−2Ne = −2F Coulombs, Eq. 12
where F is a Faraday constant.
If E is the actual voltage of an electrolysis cell, then the electrical work done while moving
this charge round the circuit is:
Doctor of Philosophy CHAPTER 2
31
Electrical work done = charge × voltage = – 2F.E Joules Eq. 13
The work done by the electrolyser is a negative value because work actually has to be done on
the electrolyser by the externally applied potential for water electrolysis to take place. If the
system is reversible, then the electrical work done by the electrolyser will be equal, but of
opposite sign, to the change in Gibbs free energy ∆G resulting from the electrolysis reaction.
Thus, –2F·E = – ∆G Eq. 14
which brings us back to equation 10, F2
GEO
∆= .
Figure 12 shows the thermoneutral (Etn) and reversible (EO) voltages, as a function of
temperature, for a standard pressure of 1 bar. The portion of energy that could be covered by
heat, T∆S, can also be translated into a voltage (T∆S/2F); this curve appears at the bottom of
Figure 12. Consistent with equation 9, the sum of the reversible voltage and the voltage
associated with the heat portion is equal to the thermoneutral voltage:
F2
ST
F2
G
F2
H ∆+
∆=
∆ Eq. 15
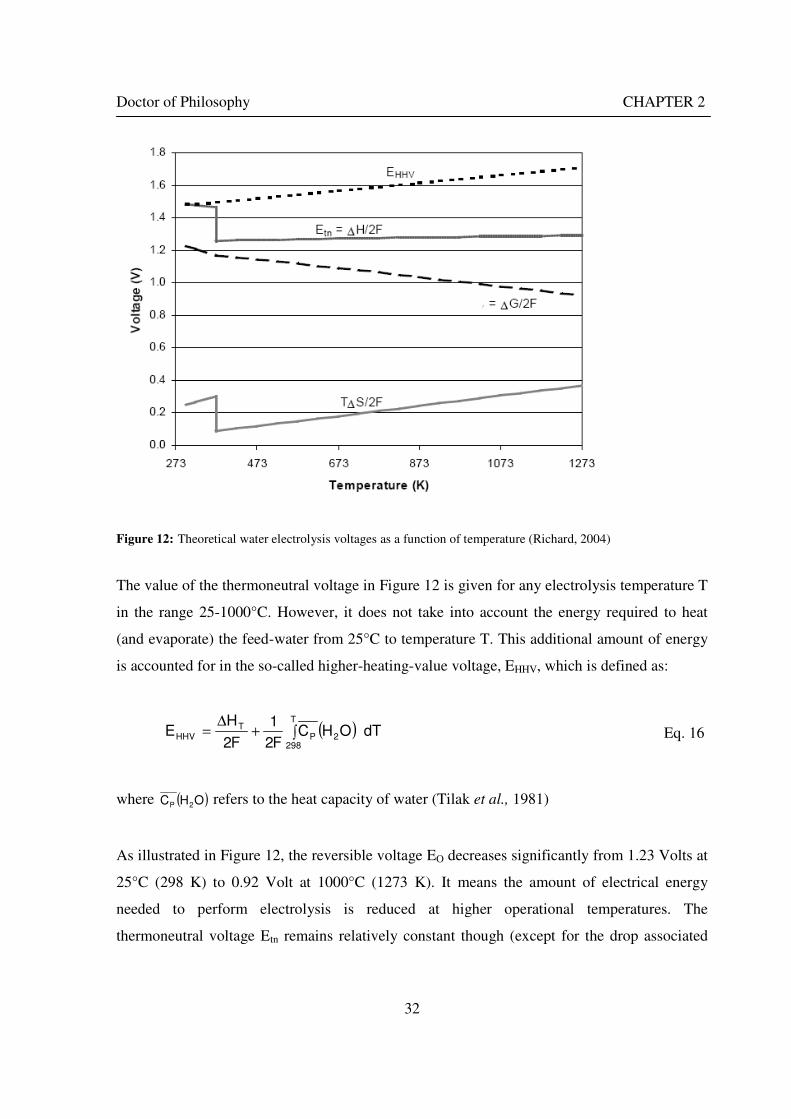
Doctor of Philosophy CHAPTER 2
32
Figure 12: Theoretical water electrolysis voltages as a function of temperature (Richard, 2004)
The value of the thermoneutral voltage in Figure 12 is given for any electrolysis temperature T
in the range 25-1000°C. However, it does not take into account the energy required to heat
(and evaporate) the feed-water from 25°C to temperature T. This additional amount of energy
is accounted for in the so-called higher-heating-value voltage, EHHV, which is defined as:
( ) dTOHCF2
1
F2
HE 2
T
298P
THHV ∫+
∆= Eq. 16
where ( )OHC 2P refers to the heat capacity of water (Tilak et al., 1981)
As illustrated in Figure 12, the reversible voltage EO decreases significantly from 1.23 Volts at
25°C (298 K) to 0.92 Volt at 1000°C (1273 K). It means the amount of electrical energy
needed to perform electrolysis is reduced at higher operational temperatures. The
thermoneutral voltage Etn remains relatively constant though (except for the drop associated
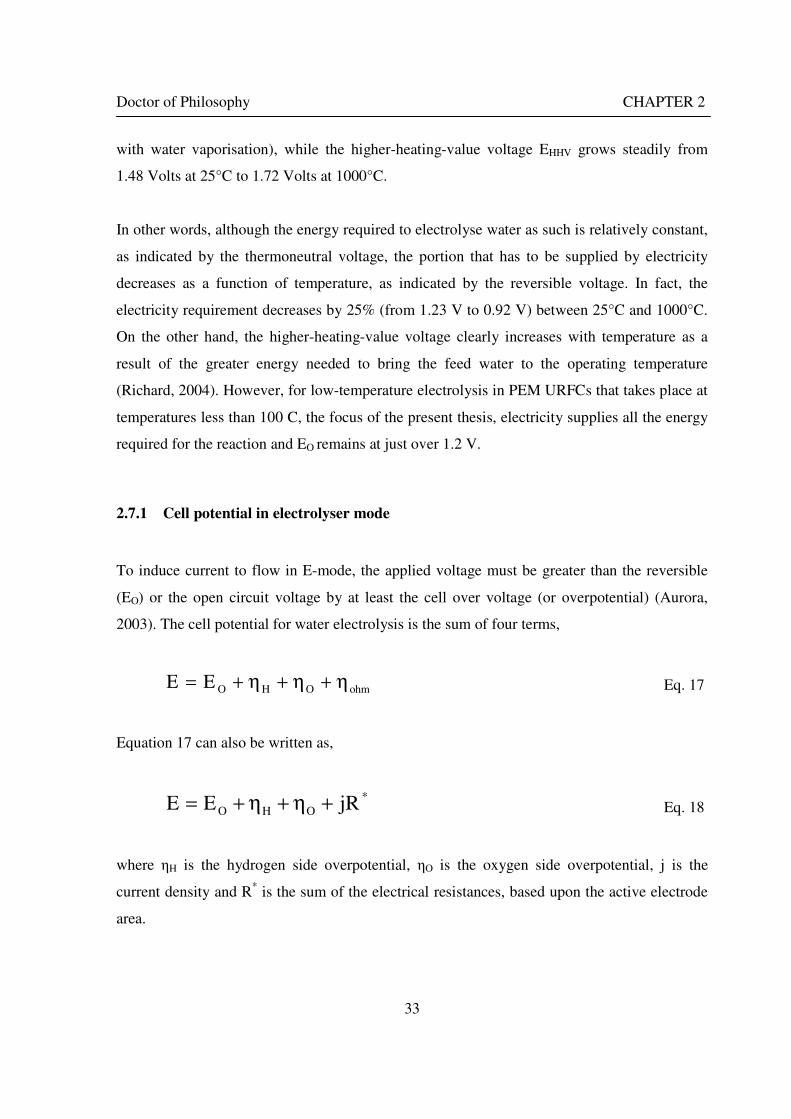
Doctor of Philosophy CHAPTER 2
33
with water vaporisation), while the higher-heating-value voltage EHHV grows steadily from
1.48 Volts at 25°C to 1.72 Volts at 1000°C.
In other words, although the energy required to electrolyse water as such is relatively constant,
as indicated by the thermoneutral voltage, the portion that has to be supplied by electricity
decreases as a function of temperature, as indicated by the reversible voltage. In fact, the
electricity requirement decreases by 25% (from 1.23 V to 0.92 V) between 25°C and 1000°C.
On the other hand, the higher-heating-value voltage clearly increases with temperature as a
result of the greater energy needed to bring the feed water to the operating temperature
(Richard, 2004). However, for low-temperature electrolysis in PEM URFCs that takes place at
temperatures less than 100 C, the focus of the present thesis, electricity supplies all the energy
required for the reaction and EO remains at just over 1.2 V.
2.7.1 Cell potential in electrolyser mode
To induce current to flow in E-mode, the applied voltage must be greater than the reversible
(EO) or the open circuit voltage by at least the cell over voltage (or overpotential) (Aurora,
2003). The cell potential for water electrolysis is the sum of four terms,
ohmOHOEE η+η+η+= Eq. 17
Equation 17 can also be written as,
*
OHO jREE +η+η+= Eq. 18
where ηH is the hydrogen side overpotential, ηO is the oxygen side overpotential, j is the
current density and R* is the sum of the electrical resistances, based upon the active electrode
area.
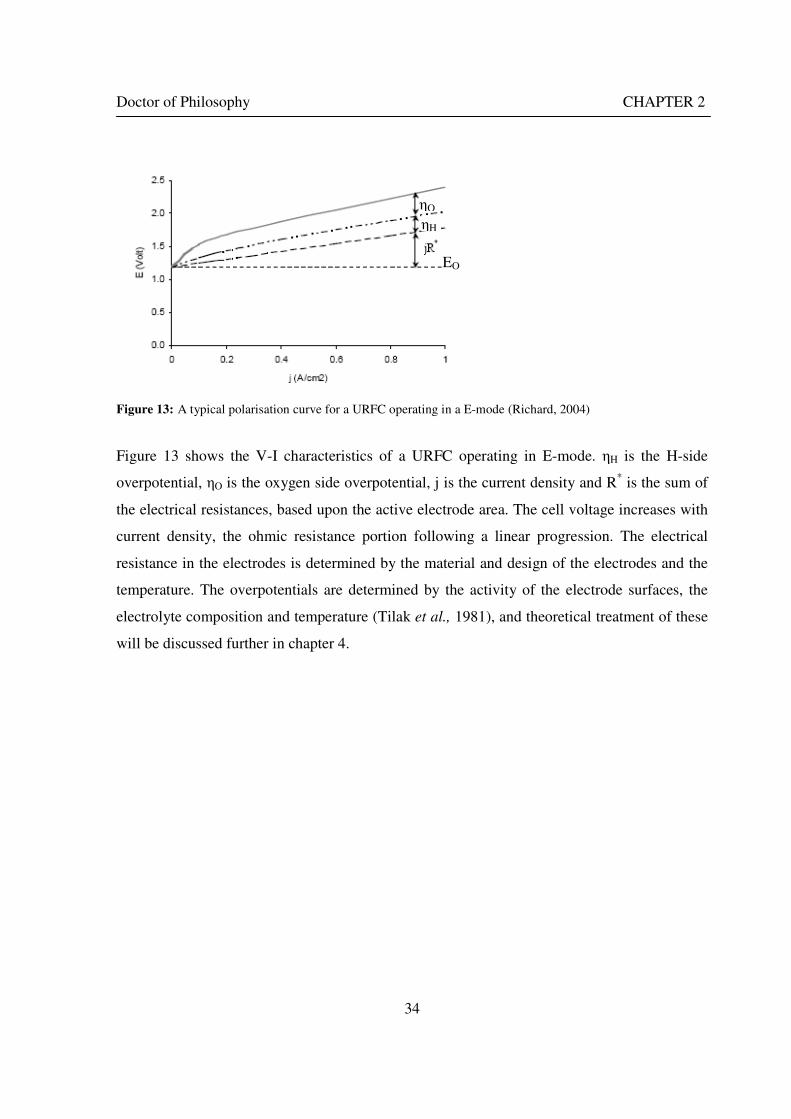
Doctor of Philosophy CHAPTER 2
34
Figure 13: A typical polarisation curve for a URFC operating in a E-mode (Richard, 2004)
Figure 13 shows the V-I characteristics of a URFC operating in E-mode. ηH is the H-side
overpotential, ηO is the oxygen side overpotential, j is the current density and R* is the sum of
the electrical resistances, based upon the active electrode area. The cell voltage increases with
current density, the ohmic resistance portion following a linear progression. The electrical
resistance in the electrodes is determined by the material and design of the electrodes and the
temperature. The overpotentials are determined by the activity of the electrode surfaces, the
electrolyte composition and temperature (Tilak et al., 1981), and theoretical treatment of these
will be discussed further in chapter 4.
EO
ηH
ηO
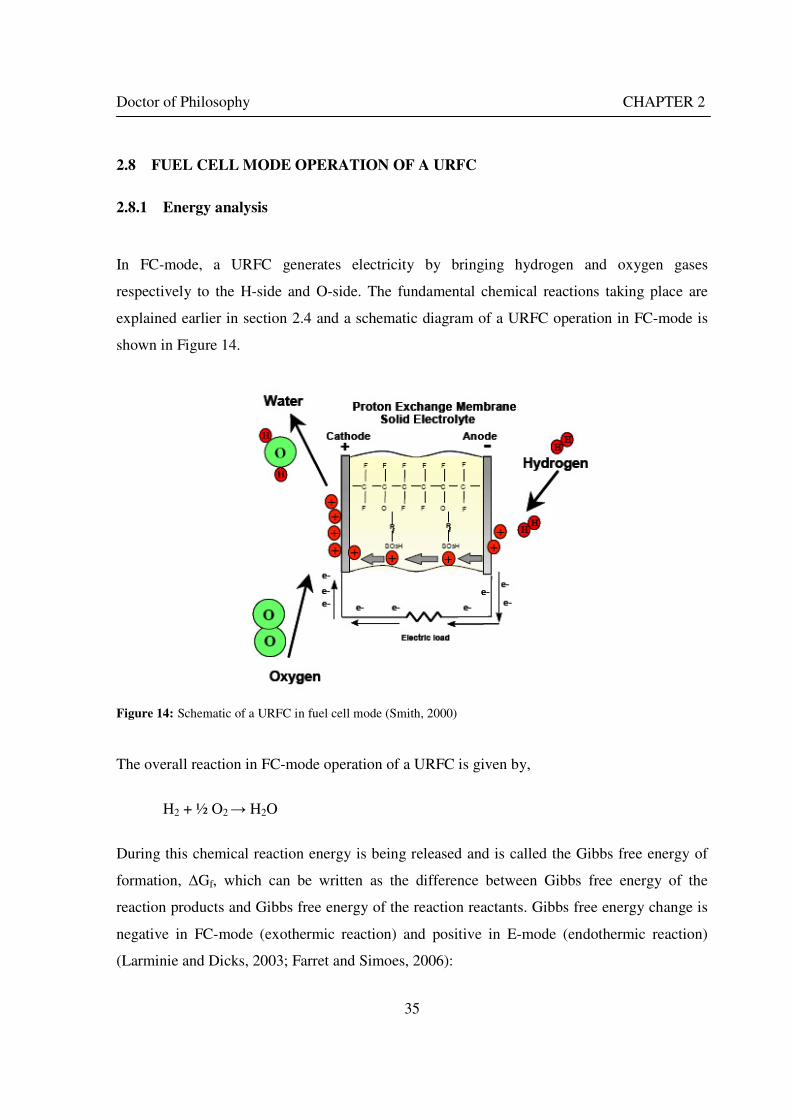
Doctor of Philosophy CHAPTER 2
35
2.8 FUEL CELL MODE OPERATION OF A URFC
2.8.1 Energy analysis
In FC-mode, a URFC generates electricity by bringing hydrogen and oxygen gases
respectively to the H-side and O-side. The fundamental chemical reactions taking place are
explained earlier in section 2.4 and a schematic diagram of a URFC operation in FC-mode is
shown in Figure 14.
Figure 14: Schematic of a URFC in fuel cell mode (Smith, 2000)
The overall reaction in FC-mode operation of a URFC is given by,
H2 + ½ O2 → H2O
During this chemical reaction energy is being released and is called the Gibbs free energy of
formation, ∆Gf, which can be written as the difference between Gibbs free energy of the
reaction products and Gibbs free energy of the reaction reactants. Gibbs free energy change is
negative in FC-mode (exothermic reaction) and positive in E-mode (endothermic reaction)
(Larminie and Dicks, 2003; Farret and Simoes, 2006):
Doctor of Philosophy CHAPTER 2
36
∆Gf = ∆Gf (products) – ∆Gf (reactants) Eq. 19
The Gibbs free energy is usually expressed in quantity per mol. Thus for the overall cell
reaction, substituting Gf by gf, we get (Larminie and Dicks, 2003):
( ) ( ) ( )22O2H OfHfff g
2
1ggg −−=∆ Eq. 20
The Gibbs free energy of formation as given in Eq. 19 is not constant; it changes with
temperature and state (liquid or gas). At 800 C it is (Larminie and Dicks, 2003):
∆g f = -228.2 kJ/mol Eq. 21
The negative sign indicates that the forward process of forming water is exothermic in nature.
It is this free energy that is used to generate electrical energy from the cell. It is evident that
during FC-mode (refer to overall reaction in FC-mode given in equation 7), two electrons pass
round the external circuit for each molecule of hydrogen used and for each water molecule
produced.
Therefore for one mole of hydrogen consumed, 2N electrons pass around the external circuit,
where N is Avagadro’s number. Consequently the charge that flows around the circuit is –
2NF Coulomb where ‘F’ is Faraday’s constant or the charge per mole of electrons (96 500
C/mol). The electrical work done in moving this charge round the circuit is −2FE joules,
where E is the voltage of the cell.
For an ideal system which has no losses, the electrical work done will be equivalent to the
Gibbs free energy of formation (Guha, 2007):
FE2g f −=∆ Eq. 22
F2
gE f∆
−= . Eq. 23
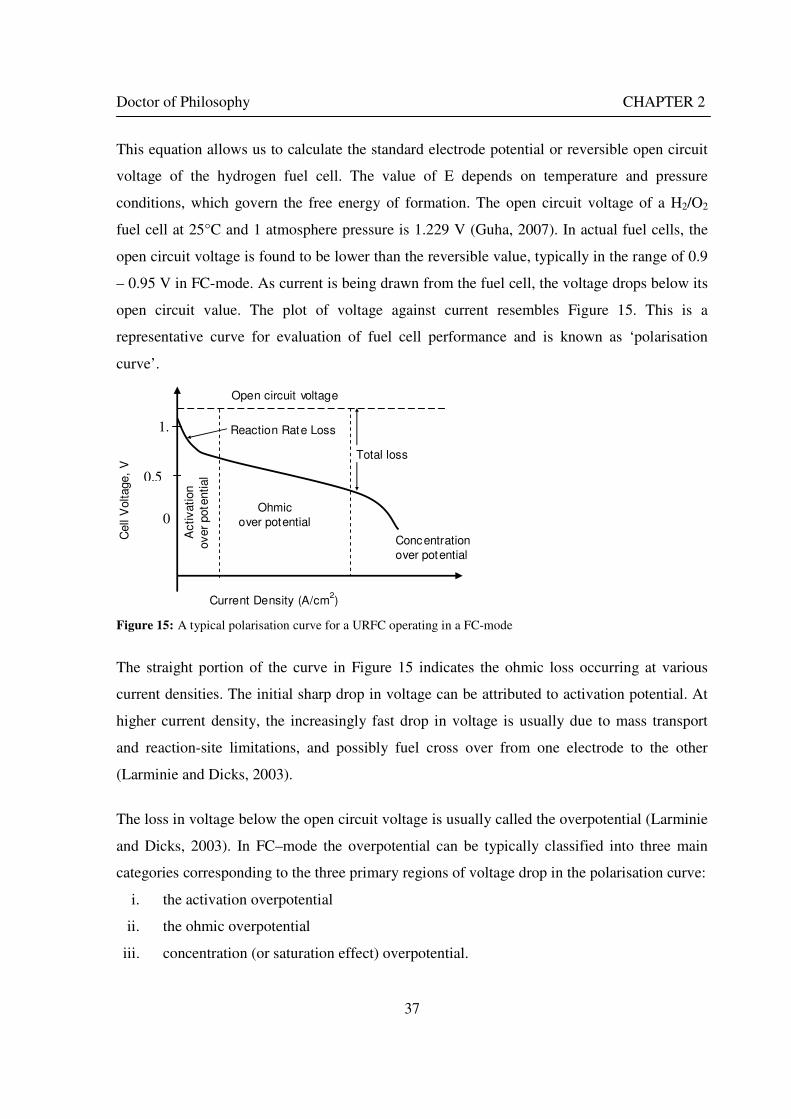
Doctor of Philosophy CHAPTER 2
37
This equation allows us to calculate the standard electrode potential or reversible open circuit
voltage of the hydrogen fuel cell. The value of E depends on temperature and pressure
conditions, which govern the free energy of formation. The open circuit voltage of a H2/O2
fuel cell at 25°C and 1 atmosphere pressure is 1.229 V (Guha, 2007). In actual fuel cells, the
open circuit voltage is found to be lower than the reversible value, typically in the range of 0.9
– 0.95 V in FC-mode. As current is being drawn from the fuel cell, the voltage drops below its
open circuit value. The plot of voltage against current resembles Figure 15. This is a
representative curve for evaluation of fuel cell performance and is known as ‘polarisation
curve’.
Figure 15: A typical polarisation curve for a URFC operating in a FC-mode
The straight portion of the curve in Figure 15 indicates the ohmic loss occurring at various
current densities. The initial sharp drop in voltage can be attributed to activation potential. At
higher current density, the increasingly fast drop in voltage is usually due to mass transport
and reaction-site limitations, and possibly fuel cross over from one electrode to the other
(Larminie and Dicks, 2003).
The loss in voltage below the open circuit voltage is usually called the overpotential (Larminie
and Dicks, 2003). In FC–mode the overpotential can be typically classified into three main
categories corresponding to the three primary regions of voltage drop in the polarisation curve:
i. the activation overpotential
ii. the ohmic overpotential
iii. concentration (or saturation effect) overpotential.
Cell
Voltage,
V
Open circuit voltage
Reaction Rate Loss
Total loss
Current Density (A/cm2)
0
0.5
1.
Concentration
over potential
Ohmic
over potential
Activation
over
pote
ntial
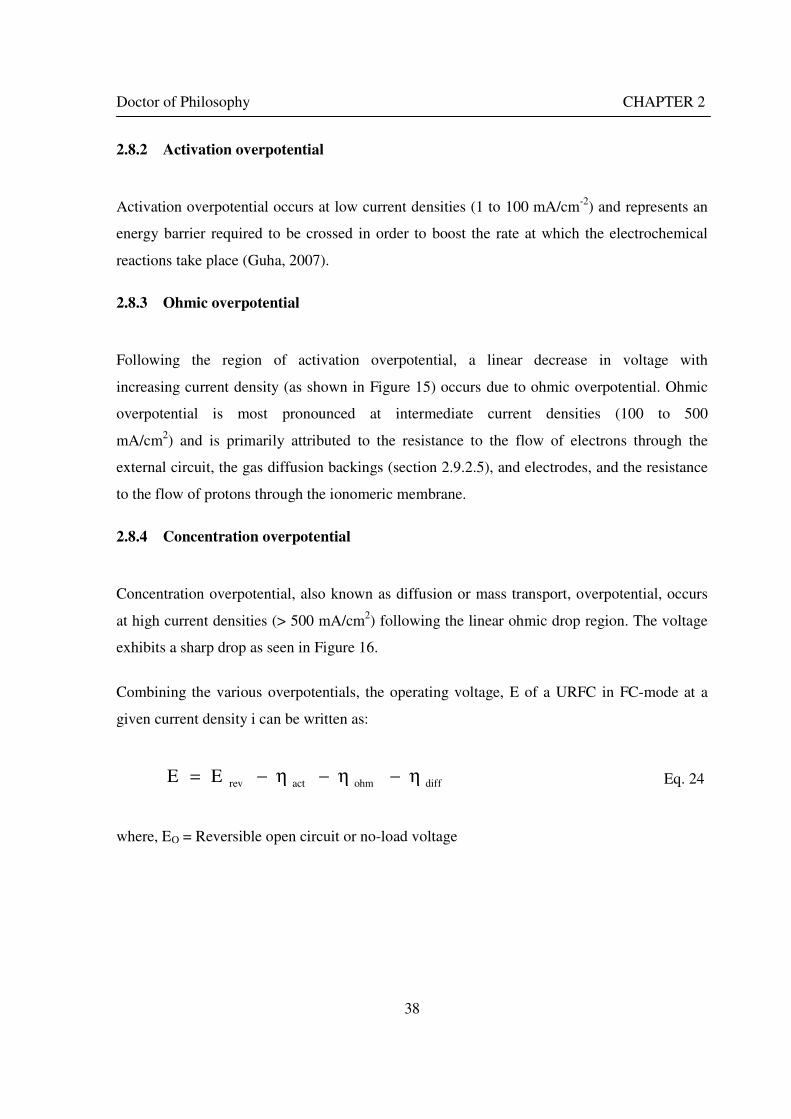
Doctor of Philosophy CHAPTER 2
38
2.8.2 Activation overpotential
Activation overpotential occurs at low current densities (1 to 100 mA/cm-2) and represents an
energy barrier required to be crossed in order to boost the rate at which the electrochemical
reactions take place (Guha, 2007).
2.8.3 Ohmic overpotential
Following the region of activation overpotential, a linear decrease in voltage with
increasing current density (as shown in Figure 15) occurs due to ohmic overpotential. Ohmic
overpotential is most pronounced at intermediate current densities (100 to 500
mA/cm2) and is primarily attributed to the resistance to the flow of electrons through the
external circuit, the gas diffusion backings (section 2.9.2.5), and electrodes, and the resistance
to the flow of protons through the ionomeric membrane.
2.8.4 Concentration overpotential
Concentration overpotential, also known as diffusion or mass transport, overpotential, occurs
at high current densities (> 500 mA/cm2) following the linear ohmic drop region. The voltage
exhibits a sharp drop as seen in Figure 16.
Combining the various overpotentials, the operating voltage, E of a URFC in FC-mode at a
given current density i can be written as:
diffohmactrevEE η−η−η−= Eq. 24
where, EO = Reversible open circuit or no-load voltage
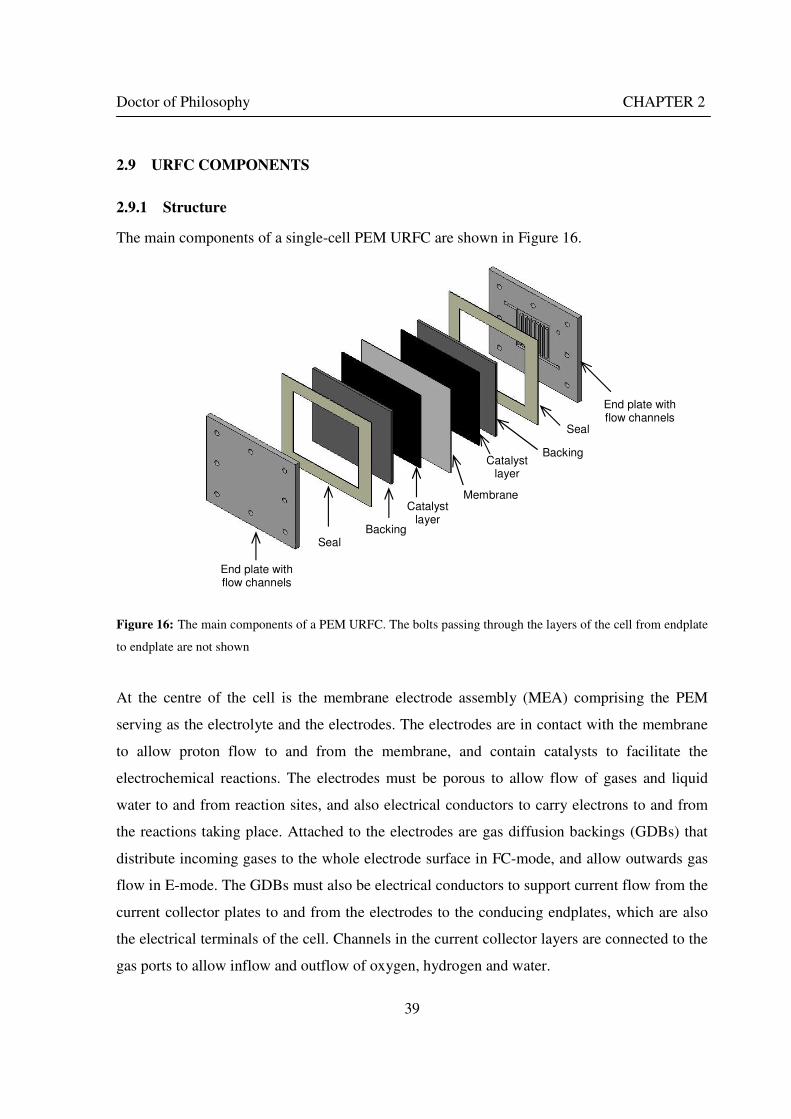
Doctor of Philosophy CHAPTER 2
39
2.9 URFC COMPONENTS
2.9.1 Structure
The main components of a single-cell PEM URFC are shown in Figure 16.
Figure 16: The main components of a PEM URFC. The bolts passing through the layers of the cell from endplate
to endplate are not shown
At the centre of the cell is the membrane electrode assembly (MEA) comprising the PEM
serving as the electrolyte and the electrodes. The electrodes are in contact with the membrane
to allow proton flow to and from the membrane, and contain catalysts to facilitate the
electrochemical reactions. The electrodes must be porous to allow flow of gases and liquid
water to and from reaction sites, and also electrical conductors to carry electrons to and from
the reactions taking place. Attached to the electrodes are gas diffusion backings (GDBs) that
distribute incoming gases to the whole electrode surface in FC-mode, and allow outwards gas
flow in E-mode. The GDBs must also be electrical conductors to support current flow from the
current collector plates to and from the electrodes to the conducing endplates, which are also
the electrical terminals of the cell. Channels in the current collector layers are connected to the
gas ports to allow inflow and outflow of oxygen, hydrogen and water.
End plate with flow channels
End plate with flow channels
Seal
Catalyst layer
Membrane
Backing
Seal
Backing Catalyst
layer
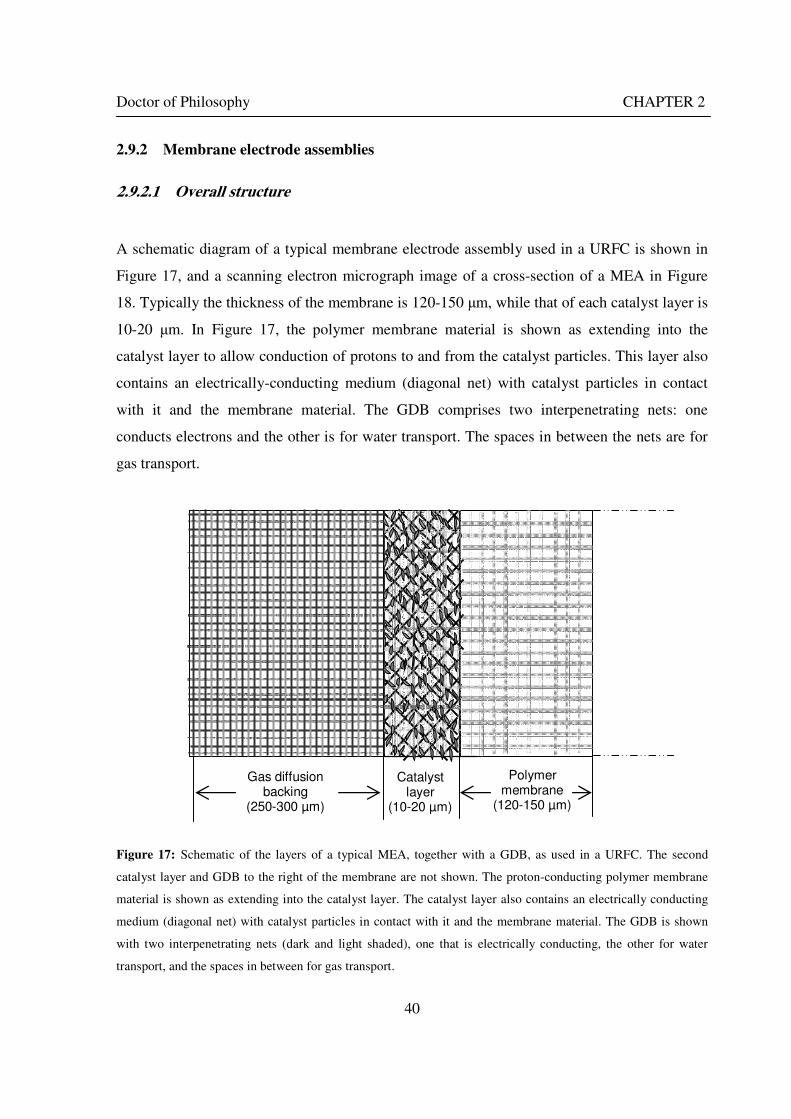
Doctor of Philosophy CHAPTER 2
40
2.9.2 Membrane electrode assemblies
2.9.2.1 Overall structure
A schematic diagram of a typical membrane electrode assembly used in a URFC is shown in
Figure 17, and a scanning electron micrograph image of a cross-section of a MEA in Figure
18. Typically the thickness of the membrane is 120-150 µm, while that of each catalyst layer is
10-20 µm. In Figure 17, the polymer membrane material is shown as extending into the
catalyst layer to allow conduction of protons to and from the catalyst particles. This layer also
contains an electrically-conducting medium (diagonal net) with catalyst particles in contact
with it and the membrane material. The GDB comprises two interpenetrating nets: one
conducts electrons and the other is for water transport. The spaces in between the nets are for
gas transport.
Figure 17: Schematic of the layers of a typical MEA, together with a GDB, as used in a URFC. The second
catalyst layer and GDB to the right of the membrane are not shown. The proton-conducting polymer membrane
material is shown as extending into the catalyst layer. The catalyst layer also contains an electrically conducting
medium (diagonal net) with catalyst particles in contact with it and the membrane material. The GDB is shown
with two interpenetrating nets (dark and light shaded), one that is electrically conducting, the other for water
transport, and the spaces in between for gas transport.
Catalyst layer
(10-20 µm)
Polymer membrane
(120-150 µm)
Gas diffusion backing
(250-300 µm)

Doctor of Philosophy CHAPTER 2
41
Figure 18: A scanning electron micrograph of an MEA in cross section showing a catalyst layer and the
membrane. Source: Ioroi et al. (2002)
2.9.2.2 Nafion
Nafion® made by Dupont is the most commercially successful of the PEM materials tried ( as
explained earlier in section 2.5) and is available as thin pre-formed membranes in various
thicknesses or as a 5% solution which may be deposited and evaporated to leave a polymer
layer of any desired shape (Katukota, 2006). Nafion® membranes are the state-of-the-art
PEMs because of their high proton conductivity and excellent chemical stability (Tang et al.,
2007).
Nafion comes in a number of different grades (for example, Nafion 112, 115 and 117) varying
according to thickness (0.051, 0.127 and 0.178 mm respectively), and hydration and
permeation properties (Sportsman et al., 2002). Nafion can be purchased commercially at
prices in the range $US(2007) 800 – 2000 /m2 (Zaidi et al., 2007).
Doctor of Philosophy CHAPTER 2
42
2.9.2.3 Catalyst layer
The catalyst layers on each face of the membrane are composite structures consisting of
proton-conducting polymer as in the membrane itself, and an electron-conducting medium,
usually carbon, on which a metal or metal oxide catalyst is deposited (as shown in Figure 17
and Figure 18.
The catalyst layers must fulfil multiple functions:
• Support for the catalyst particles that act as sites at which the electrochemical reactions
take place and are facilitated
• Conduction of protons to or from these sites (via the polymer material)
• Conduction of electrons to or from these sites (via the carbon or other porous medium)
• Allow movement of reactants (hydrogen, oxygen and water molecules) through the
porous structure of the layers to and from the sites.
Each catalyst particle should be in contact with at least one other particle in the medium that
serves as the conductor of electrons so that there is a continuous path for electron flow to and
from the current collector. The catalyst particle should also be linked to membrane material so
that H+ ions can access it (Cisar et al., 2005).
A number of methods have been developed to construct the catalyst layers of PEM fuel cells
and electrolysers, and these same methods can be used to construct URFC catalyst layers.
Some of the main methods specifically used for URFC catalyst layers are the following:
• The ‘Decal’ method: mix catalyst particles in a solution, allow the solution to diffuse
into carbon cloth or other porous medium, dry, spray with Nafion, and then hot press
the layer onto the membrane face, relying on the melted polymer to provide the
adhesion (Wittstadt et al., 2005, Yim et al., 2005; Jorissen, 2006).
• Nafion slurries: mix prepared catalyst materials in liquid Nafion to form a slurry, paste
onto the porous medium of the catalyst layer, dry and then hot press on to the
membrane (Yim et al., 2005).
Doctor of Philosophy CHAPTER 2
43
• Electrostatic deposition: deposit the metallic catalyst onto the membrane in an
electrostatic plating bath, by sputtering, or by electrodeposition (Wittstadt et al., 2005;
Sopian and Daud, 2006).
• Direct deposition of Pt catalysts on Nafion-impregnated polypyrrole (Lee et al., 2004).
• Chemical reduction: deposit the metal catalyst by chemical reduction of its anionic salt
with hydrazine directly on to the membrane (Ahn and Holze, 1992).
2.9.2.4 Electrocatalysts
In the case of the commonest type of URFC – oxygen and hydrogen electrodes remaining the
same in each mode – the catalyst used on the hydrogen side is generally platinum as Pt black.
The hydrogen-side layer must, however, be able to retain its physical integrity and resist
corrosion in the presence of the water molecules dragged over from the oxygen side by protons
during E-mode.
The oxygen-side catalyst layer in a URFC is typically more challenging to design and
construct, because of the difficulty in finding a catalyst material that functions equally well in
both E and FC-modes. As mentioned earlier, platinum, for example, in the oxygen-side layer
performs well in FC-mode (with a low overpotential) but poorly in E-mode (leading to a
relatively high overpotential). Hence a mixture of catalyst materials is usually employed on the
oxygen side. Platinum is commonly retained in the mixture for FC-mode functioning, while a
range of other noble metals and their oxides have been investigated as the additive to play the
lead role in E-mode. In addition, since water is usually introduced to the cell at the oxygen
electrode during E-mode, the catalyst layer on this side must be able to retain its structure and
functioning in the presence of liquid water, and its constituent materials must not corrode or
otherwise degrade in the presence of both this water and oxygen.
A selection from the literature of the catalyst materials and loadings that have been trialled in
experimental URFCs is provided in Table 3. Materials mixed with Pt in the oxygen-side
catalyst layer include the pure metals, iridium, ruthenium and (occasionally) rhodium and

Doctor of Philosophy CHAPTER 2
44
titanium, or oxides of these such as iridium oxide and ruthenium oxide. The metals may be
mixed as a powder (Ioroi et al., 2002) or sometimes an alloy is formed, for example, between
Pt and Ru. Alternatively a compound containing two or more of the active catalyst materials,
such as Pt Ir Ox and Pt Ru Ox can be formed.

Doct
or
of
Phil
oso
ph
y
C
HA
PT
ER
2
45
Hyd
rogen
sid
e ca
taly
st
Oxygen
sid
e ca
taly
st
Hyd
rogen
sid
e ca
taly
st
load
ing (
mg/c
m2)
Oxygen
si
de
cata
lyst
lo
ad
ing
(mg/c
m2)
Ref
eren
ce
1
1
Sw
ette
et
al.
(1994)
Pt
bla
ck
4
4
Yim
et
al.
(2004 &
2005)
2
2 (
50:5
0 m
ixtu
re)
Wit
tsta
dt
et a
l. (
2005)
Pt
bla
ck +
Ir
bla
ck
2-4
Io
roi
et a
l.(2
002)
0.5
(50:5
0)
Tsy
pkin
et
al.
(2000)
PtI
r 4
4 (
dif
fere
nt
rati
os
of
Pt
and I
r)
Yim
et
al,
(2005)
0.4
0.4
(50:5
0 m
ixtu
re)
Jo
riss
en (
2006)
Liu
et
al.
(2004)
Zhig
ang e
t al.
(1999)
Pt+
IrO
2
4
8-1
0
Ioro
i et
al.
(2000)
1
1 (
40:6
0 m
ixtu
re)
Sw
ette
et
al.
(1992)
PtI
rOx
4 (
dif
fere
nt
rati
os
of
Pt
and I
rOx)
Yim
et
al.
(2005)
PtR
u
4
4 (
dif
fere
nt
rati
os
of
Pt
and R
u)
Yim
et
al.
(2005)
PtR
uIr
4
4 (
dif
fere
nt
rati
os
of
Pt
Ru a
nd I
r)
Yim
et
al.
(2005)
4
4 (
dif
fere
nt
rati
os
of
Pt
and R
uO
x)
Yim
et
al.
(2005)
PtR
uO
x
1
1 (
40:6
0)
Sw
ette
et
al.
(1994)
RuO
2–
IrO
2/P
t 0.4
2 (
Pt:
IrO
2:
RuO
2 =
50:
25:
25)
Zhan
g e
t al.
(2007)
IrO
2 d
eposi
ted P
t bla
ck
Ioro
i et
al.
(2001)
Pt
bla
ck+
Na x
Pt 3
04
1
3 (
33:6
7)
Sw
ette
et
al.
(1994)
Na x
Pt 3
04
1
2
Sw
ette
et
al.
(1994)
RuO
-IrO
x
1
2 (
50:5
0)
Sw
ette
et
al.
(1994)
Pt
bla
ck
RhO
2
1
1
Sw
ette
et
al.
(1994)
C s
upport
ed P
t
Pt
bla
ck +
Ir
bla
ck
2
2 (
50:5
0)
Murp
hy e
t al.
(1995)
Pt/
C
Pt
bla
ck +
IrO
2
0.5
3 (
70:3
0 m
ixtu
re)
Song e
t al.
(2006)
Pt/
Ir –
on –
C
Pt+
Ir
1 (
Ir c
onte
nt
80
% o
f P
t)
1 (
Ir c
onte
nt
80
% o
f P
t)
Dhar
H P
(1993)
1
1
Ham
ilto
n
Sta
ndar
d
E5
(p
ropri
etar
y)
E5
4
4
Mit
lisk
y 1996,
1998
a &
b,
1999a,
b &
c.
Ta
ble
3:
A s
elec
tio
n f
rom
the
lite
ratu
re o
f th
e ca
taly
st m
ater
ials
and
lo
adin
gs
that
hav
e b
een t
rial
led
in e
xp
erim
enta
l U
RF
Cs
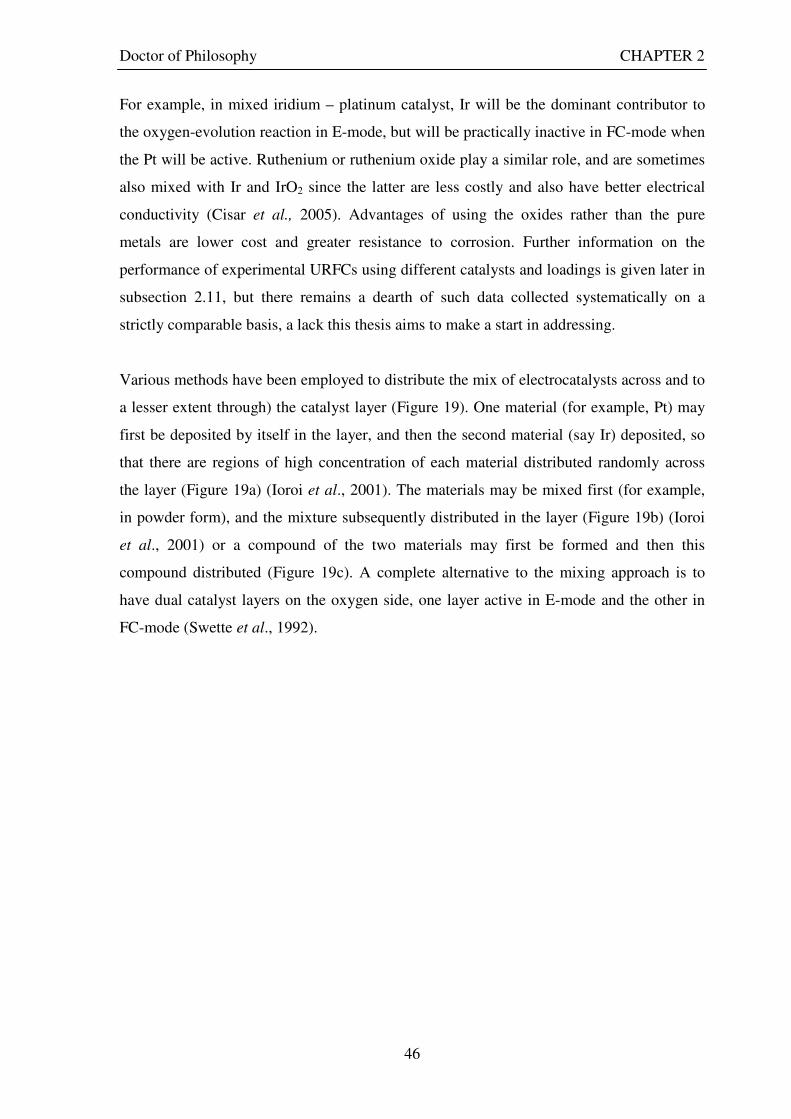
Doctor of Philosophy CHAPTER 2
46
For example, in mixed iridium – platinum catalyst, Ir will be the dominant contributor to
the oxygen-evolution reaction in E-mode, but will be practically inactive in FC-mode when
the Pt will be active. Ruthenium or ruthenium oxide play a similar role, and are sometimes
also mixed with Ir and IrO2 since the latter are less costly and also have better electrical
conductivity (Cisar et al., 2005). Advantages of using the oxides rather than the pure
metals are lower cost and greater resistance to corrosion. Further information on the
performance of experimental URFCs using different catalysts and loadings is given later in
subsection 2.11, but there remains a dearth of such data collected systematically on a
strictly comparable basis, a lack this thesis aims to make a start in addressing.
Various methods have been employed to distribute the mix of electrocatalysts across and to
a lesser extent through) the catalyst layer (Figure 19). One material (for example, Pt) may
first be deposited by itself in the layer, and then the second material (say Ir) deposited, so
that there are regions of high concentration of each material distributed randomly across
the layer (Figure 19a) (Ioroi et al., 2001). The materials may be mixed first (for example,
in powder form), and the mixture subsequently distributed in the layer (Figure 19b) (Ioroi
et al., 2001) or a compound of the two materials may first be formed and then this
compound distributed (Figure 19c). A complete alternative to the mixing approach is to
have dual catalyst layers on the oxygen side, one layer active in E-mode and the other in
FC-mode (Swette et al., 1992).

Doctor of Philosophy CHAPTER 2
47
Figure 19: Diagrammatic representations of the various ways of achieving a mixture of two catalysts
distributed throughout the oxygen-side catalyst layer: (a) sequential deposition creating concentrated regions
of each material distributed randomly across the layer; (b) prior mixing of the two catalysts and then
distribution of the mixture across the layer; and (c) formation of an allow or compound between the two
materials and then distribution of this compound.
2.9.2.5 Gas diffusion and water transport layers
The gas diffusion backing layer in a PEM URFC must not only provide a medium for the
transport and even distribution of oxygen and hydrogen to and from the catalyst layers, but
also transport water and electrons to and from these layers, and conduct heat away towards
the end plates (Figure 20).
Doctor of Philosophy CHAPTER 2
48
Figure 20: Schematic showing the basic functionality of the gas diffusion and water transport layers.
In a PEM fuel cell ‘water proofed’ carbon paper or carbon cloth is usually adopted as the
GDB, its porosity allowing passage of gases, and the carbon matrix serving as both an
electrical and thermal conductor. However, as Pettersson et al. (2006) point out, carbon-
based materials generally cannot be used as the GDB of a URFC because such materials
tend to corrode at high potentials on the oxygen electrode side during E-mode, and an
appropriate balance between hydrophobic and hydrophilic properties must be struck to
ensure proper functioning in both modes. In FC-mode the oxygen-side GDB must be
sufficiently hydrophobic to prevent water flooding, and in E-mode sufficiently hydrophilic
to maintain water supply for the electrolysis reaction. The hydrogen-side GDB must also
be able to cope with the influx of water due to osmotic drag across the membrane by the
moving protons in E-mode.
In place of carbon paper or cloth, a metal core is frequently used in the GDBs in URFCs
for conduction of electrons and heat. To furnish the porosity required for gas transport, the
metal core may be in the form of a woven metal cloth, mesh, perforated sheet, thin metal
felts, expanded metal sheet, or metal foam). Cores in these forms made from the following
metals have been investigated (Cisar et al., 2005):
• titanium, zirconium, hafnium, niobium, and tantalum
• aluminium, copper, nickel, protected from oxidation by appropriate coatings
• precious metals such as platinum, gold, ruthenium, iridium and palladium
• oxidation-resistant alloys, such as stainless steels, Inconels and Hastelloys.
Conducting
mesh (electrical
and thermal) Pores for gas
transport

Doctor of Philosophy CHAPTER 2
49
Cisar et al. (2005) report that titanium gold-plated woven titanium cloth mesh was found to
be the most effective. They further propose coating the metal core with a waterproofing
agent to ensure water-free channels for gas flow, and then binding an additional
electrically-conducting compound to the metal core using a polymeric binder –
polytetrafluoroethylene (that is, Teflon), perfluorosulphonic acids (for example, Nafion), or
combinations of these. While this compound must in itself be hydrophilic to transport
water to catalyst sites in E-mode, it must also be treated with small amounts of a
hydrophobic material to limit water ingress sufficiently to prevent channel flooding and
hence inhibition of gas flow in FC-mode. There thus need to be randomly distributed
hydrophilic and hydrophobic regions throughout the GDB, which may vary in dimension
between several microns and a few millimetres, or the alternating regions may be arranged
in an orderly pattern. Cisar et al. (2005) tested the following materials for use as the
additional conducting compound in the metal core:
• nitrides of tantalum, zirconium, niobium or titanium
• titanium boride or titanium carbide
• a mixture of ruthenium oxide and titanium-ruthenium oxide
• a solid solution of ruthenium oxide and titanium oxide.
The latter two materials were found to be among the best performers.
An alternative approach to oxygen-side GDB design is to employ an entirely metal core
and allow flooding in E-mode, but then clear the water by blowing in air under pressure on
switching to FC-mode. While this approach leads to a slightly longer time to switch
between full functioning in the two modes, it permits a much simpler and cheaper GDB to
be utilised.
While considerable useful work has already been done, the development of suitable long-
lasting and high-performance materials for GDBs for URFCs is an area requiring a lot of
further attention.
Doctor of Philosophy CHAPTER 2
50
2.9.2.6 Flow channels, seals and endplates
Reactant and product gases, and where necessary liquid water, are carried to and from the
gas diffusion layers in channels machined on the inner surfaces of plates (Figure 16). The
width and depth of the channels, as well as the pattern in which the machining is done,
affect the evenness of the distribution of reactants and collection of products across the
active area of the MEA (Das, 2002). Pressure losses in the gas manifold occur mainly on
the oxygen side, since the resistance to hydrogen is very low (Mikkola, 2000). The plates
must be very good electrical and thermal conductors, so are typically made from graphite
or metals (Rismanchi and Akbari, 2008). Song et al. (2006) suggest titanium materials are
the most suitable for these plates in URFCs. The plate containing the channels, or
sometimes an additional metal plate, also serves as the current collector on each side of the
cell, and the end plate that holds the whole cell together (Figure 16). It is in this plate (or
the separate end-plate) that, if required, coolant also flows to regulate the temperature of
the cell in FC-mode. Additional channels, completely separate to those for gas flow, are
used for the coolant stream.
A number of different patterns for the flow channels have been tried, as in dedicated PEM
fuel cells and electrolysers (Ito et al., 2005). Parallel channels with headers (Figure 21a) is
one of the simplest patterns, but may lead to pressure imbalances between adjacent
channels and gas blockages (Mennola, 2000). The serpentine pattern (Figure 21b) patented
by Ballard Power Systems overcomes these problems because the differential pressure
between inlet and outlet forces stagnant water out of the channels (Hoogers, 2003). The
mirrored flow field pattern (Figure 21c) has been patented by General Motors. Another
option is to use a metal mesh to provide the gas flow field (Hoogers, 2003).
It is important to have good electrical contact – that is, low contact resistance – between the
plate containing the gas flow channels and the GDB. Contact resistance is a function of the
contact pressure between the surfaces, and hence the torque on the clamping bolts holding
the layers of the overall cell together (Roshandel and Farhanieh, 2007) (Figure 16).
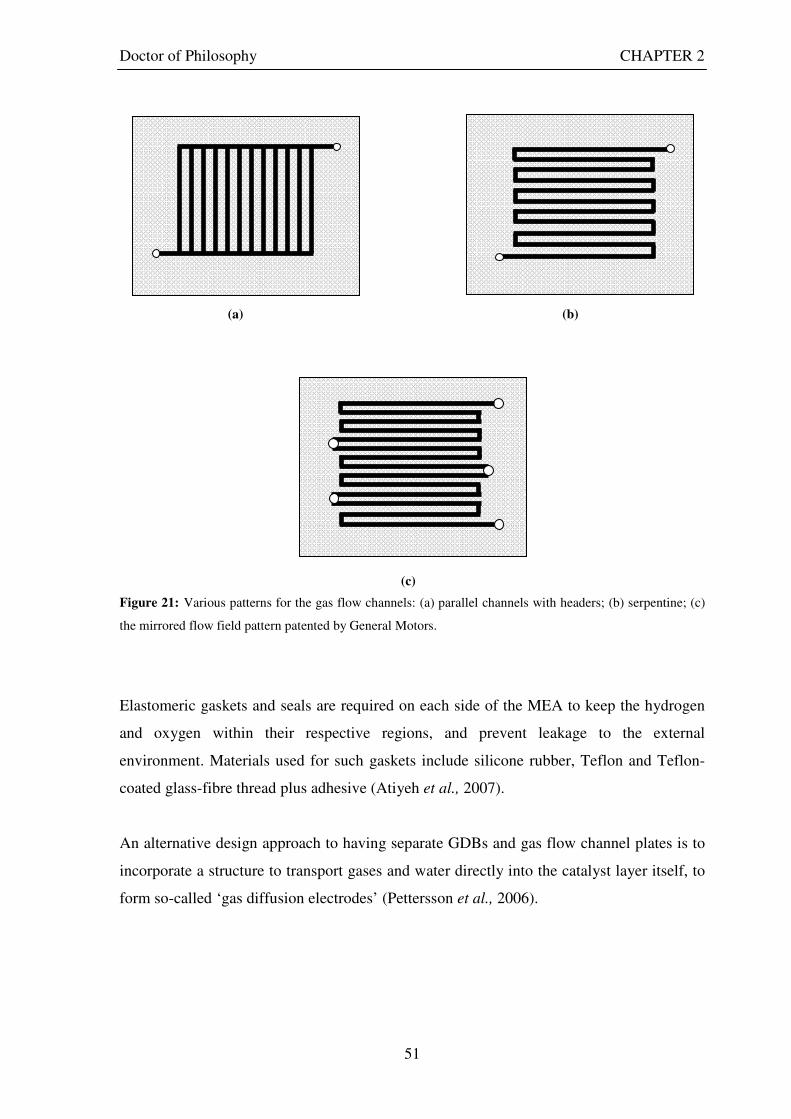
Doctor of Philosophy CHAPTER 2
51
Figure 21: Various patterns for the gas flow channels: (a) parallel channels with headers; (b) serpentine; (c)
the mirrored flow field pattern patented by General Motors.
Elastomeric gaskets and seals are required on each side of the MEA to keep the hydrogen
and oxygen within their respective regions, and prevent leakage to the external
environment. Materials used for such gaskets include silicone rubber, Teflon and Teflon-
coated glass-fibre thread plus adhesive (Atiyeh et al., 2007).
An alternative design approach to having separate GDBs and gas flow channel plates is to
incorporate a structure to transport gases and water directly into the catalyst layer itself, to
form so-called ‘gas diffusion electrodes’ (Pettersson et al., 2006).
(a) (b)
(c)

Doctor of Philosophy CHAPTER 2
52
2.10 EFFICIENCY OF URFCS
Key performance measures for a URFC are the energy efficiency in E-mode and FC-mode,
and the overall roundtrip energy efficiency.
On the basis of the high heating value of hydrogen (HHV = 142 MJ/kg at 25° C), the
energy efficiency in E-mode is given by:
densitypowerInput
HHVm 2
E
HE ∗=η
•
Eq. 25
t.I.V
HHV.V
E
E
E
E2H
electric
hydrogen
input
usefulE ===η
where 2
E
Hm•
is rate of production of hydrogen per unit effective area of cell in kg/s/cm2,
HHV is the higher heating value of hydrogen in J/s, the input power density is in W/cm2, I
is the electrolyser stack current in A, 2HV is the flow rate of hydrogen gas in mol, t is the
time taken in sec.
At standard temperature and pressure (STP) conditions for the electrolytic action, the
thermo-neutral voltage is 1.48 V and the minimum reversible voltage is 1.23 V. Since the
reaction is endothermic in nature, it draws heat from the surroundings when voltage
applied across the electrode terminal is in the range of 1.23 V to 1.48 V. At 1.48 V the
reaction becomes thermoneutral with the surroundings and any further increase in applied
voltage will result in rise in temperature (Ali, 2007) (see earlier section 2.7). If Vcell, is the
operating voltage for a single cell electrolyser then the energy efficiency of the electrolyser
is,
or cell
EE
V
48.1∗µ=η Eq. 26
where µE is the Faraday efficiency of the cell in E-mode (the actual rate of hydrogen
production expressed as a percentage of the theoretical maximum rate of hydrogen
production for the given current).
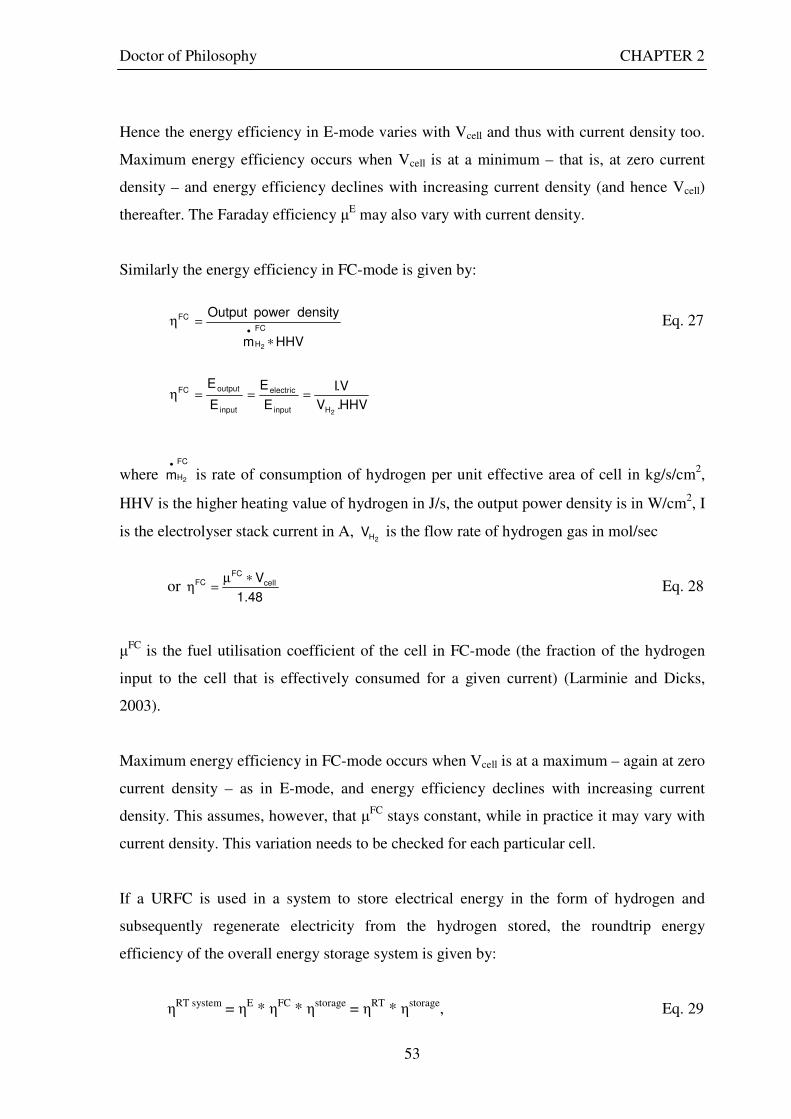
Doctor of Philosophy CHAPTER 2
53
Hence the energy efficiency in E-mode varies with Vcell and thus with current density too.
Maximum energy efficiency occurs when Vcell is at a minimum – that is, at zero current
density – and energy efficiency declines with increasing current density (and hence Vcell)
thereafter. The Faraday efficiency µE may also vary with current density.
Similarly the energy efficiency in FC-mode is given by:
HHVm
densitypowerOutputFC
H
FC
2 ∗
=η•
Eq. 27
HHV.V
V.I
E
E
E
E
2Hinput
electric
input
outputFC===η
where FC
H2m•
is rate of consumption of hydrogen per unit effective area of cell in kg/s/cm2,
HHV is the higher heating value of hydrogen in J/s, the output power density is in W/cm2, I
is the electrolyser stack current in A, 2HV is the flow rate of hydrogen gas in mol/sec
or 48.1
VcellFC
FC ∗µ=η Eq. 28
µFC is the fuel utilisation coefficient of the cell in FC-mode (the fraction of the hydrogen
input to the cell that is effectively consumed for a given current) (Larminie and Dicks,
2003).
Maximum energy efficiency in FC-mode occurs when Vcell is at a maximum – again at zero
current density – as in E-mode, and energy efficiency declines with increasing current
density. This assumes, however, that µFC stays constant, while in practice it may vary with
current density. This variation needs to be checked for each particular cell.
If a URFC is used in a system to store electrical energy in the form of hydrogen and
subsequently regenerate electricity from the hydrogen stored, the roundtrip energy
efficiency of the overall energy storage system is given by:
ηRT system = ηE * ηFC * ηstorage = ηRT * ηstorage, Eq. 29
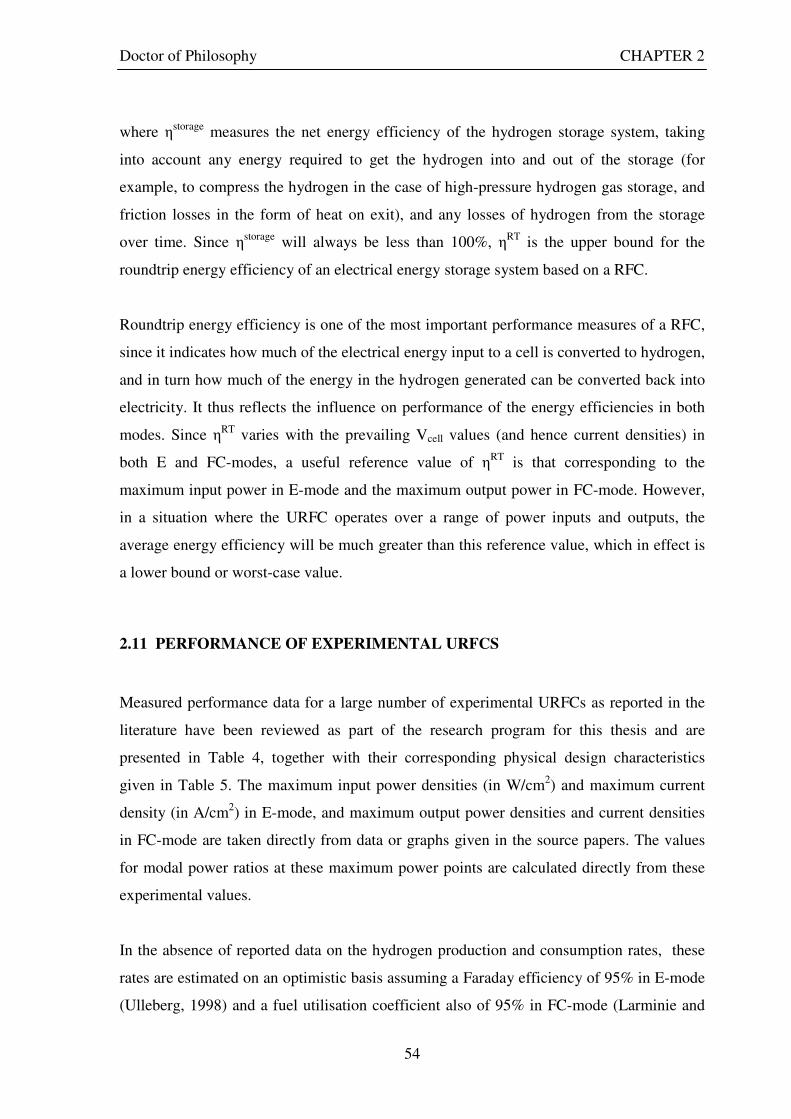
Doctor of Philosophy CHAPTER 2
54
where ηstorage measures the net energy efficiency of the hydrogen storage system, taking
into account any energy required to get the hydrogen into and out of the storage (for
example, to compress the hydrogen in the case of high-pressure hydrogen gas storage, and
friction losses in the form of heat on exit), and any losses of hydrogen from the storage
over time. Since ηstorage will always be less than 100%, ηRT is the upper bound for the
roundtrip energy efficiency of an electrical energy storage system based on a RFC.
Roundtrip energy efficiency is one of the most important performance measures of a RFC,
since it indicates how much of the electrical energy input to a cell is converted to hydrogen,
and in turn how much of the energy in the hydrogen generated can be converted back into
electricity. It thus reflects the influence on performance of the energy efficiencies in both
modes. Since ηRT varies with the prevailing Vcell values (and hence current densities) in
both E and FC-modes, a useful reference value of ηRT is that corresponding to the
maximum input power in E-mode and the maximum output power in FC-mode. However,
in a situation where the URFC operates over a range of power inputs and outputs, the
average energy efficiency will be much greater than this reference value, which in effect is
a lower bound or worst-case value.
2.11 PERFORMANCE OF EXPERIMENTAL URFCS
Measured performance data for a large number of experimental URFCs as reported in the
literature have been reviewed as part of the research program for this thesis and are
presented in Table 4, together with their corresponding physical design characteristics
given in Table 5. The maximum input power densities (in W/cm2) and maximum current
density (in A/cm2) in E-mode, and maximum output power densities and current densities
in FC-mode are taken directly from data or graphs given in the source papers. The values
for modal power ratios at these maximum power points are calculated directly from these
experimental values.
In the absence of reported data on the hydrogen production and consumption rates, these
rates are estimated on an optimistic basis assuming a Faraday efficiency of 95% in E-mode
(Ulleberg, 1998) and a fuel utilisation coefficient also of 95% in FC-mode (Larminie and
Doctor of Philosophy CHAPTER 2
55
Dicks, 2003). These estimated rates were then used to obtain indicative values for the
energy efficiencies in the two modes and the roundtrip energy efficiency (at maximum
power input and output), as shown in the shaded columns in Table 4. The estimates for
roundtrip energy efficiency also assume zero losses of hydrogen in the storage process.
These energy efficiencies should therefore be taken as indicative only (and as upper
bounds), since they rely on some exogenous assumptions and are not fully based on
measured experimental data. It is important in future URFC experimental studies that
hydrogen production and consumption rates are measured directly so that energy efficiency
data can be obtained entirely from the experimental data.
The input and output power densities of the experimental URFCs reviewed are plotted in
Figure 22, together with lines of constant modal power ratio between 1 and 5. As expected
all cells had a modal power ratio greater than 1. Generally a low modal power ratio is
advantageous, but in conjunction with a high value of FC-mode power density, as
illustrated by the shaded region in the Figure 22.
The estimated roundtrip energy efficiencies at maximum power input and output are shown
graphically in Figure 23. As pointed out earlier, if the URFC operates over a range of
power inputs and outputs, the average roundtrip energy efficiency will be much greater
than the reference value shown in this figure. Alongside roundtrip energy efficiency it is
also relevant to consider the maximum power outputs of the cells in FC-mode, since
together these two parameters give a good indication of a reversible cell’s overall
performance. The aim is to get both high roundtrip energy efficiency and high output
power density at the same time.

D
oct
or
of
Phil
oso
ph
y
C
HA
PT
ER
2
56
Cel
l R
efer
ence
Inp
ut
po
wer
d
ensi
ty
(W/c
m2)
E-m
od
e cu
rren
t d
ensi
ty
(A/c
m2)
E-m
od
e en
erg
y
effi
cien
cy
(%)
FC
-m
od
e o
utp
ut
po
wer
d
ensi
ty
(W/c
m2)
FC
-m
od
e cu
rren
t d
ensi
ty
(A/c
m2)
FC
-mo
de
ener
gy
ef
fici
ency
Ro
un
dtr
ip
ener
gy
ef
fici
ency
(%
)
Mo
da
l p
ow
er r
ati
o
BC
S T
echno
log
y
Dhar
(1
99
3)
0.7
5
0.1
5
28
.1
0.1
17
0
.39
1
7.2
4
.8
6.4
Gin
er,
Inc.
(F
C+
) S
wet
te e
t a
l (1
99
4)
2.1
5
1
65
.5
0.3
55
0
.5
40
.7
26
.7
6.1
Gin
er,
Inc.
(F
C a
nd
E +
) S
wet
te e
t a
l. (
19
94)
1.7
5
1
80
.4
0.5
1
2
8.7
2
3.1
3
.5
Gin
er,
Inc.
(F
C+
) S
wet
te e
t a
l. (
19
94)
1.8
5
1
76
.1
0.5
85
0
.9
37
.3
28
.4
3.2
Gin
er,
Inc.
S
wet
te e
t a
l.(1
99
4)
1.9
5
1
72
.2
0.4
1
2
3.0
1
6.6
4
.9
Fra
un
ho
fer-
Inst
itute
fo
r S
ola
r E
ner
gy
Syst
ems
Led
jeff
et
al.
(19
94
) 1
.65
1
8
5.3
0
.47
25
0
.67
5
40
.2
34
.3
3.5
LL
NL
IM
PR
ES
S
Mit
lits
ky e
t a
l.(1
99
6a)
0
.28
5
0.1
9
1
.5
LL
NL
01
(4
9 C
) M
itli
tsk
y e
t a
l. (
19
98
a)
0.9
25
0
.43
6
5.4
0
.13
2
0.2
3
7.9
2
4.8
7
.0
LL
NL
01
(8
2 C
) M
itli
tsk
y e
t a
l. (
19
98
a)
1.4
6
0.6
7
64
.6
0.1
9
0.3
3
6.3
2
3.5
7
.7
LL
NL
Cel
l 9
73
4A
M
itli
tsk
y e
t a
l. (
19
98
a)
2.2
1
1.0
76
6
8.5
0
.46
0
.86
3
0.7
2
1.0
4
.8
LL
NL
Cel
l 9
80
4A
M
itli
tsk
y e
t a
l.(1
99
8a)
2
.76
1
.29
6
5.8
0
.91
5
1.7
3
0.9
2
0.3
3
.0
Dal
ian I
nst
itute
of
Tec
hno
log
y
Zhig
ang e
t a
l.(1
99
9)
1.8
0
.9
70
.4
0.3
6
0.9
2
3.0
1
6.2
5
.0
Osa
ka
Nat
ional
Res
earc
h I
nst
itute
Io
roi
et a
l.(2
00
0)
1.7
1
8
2.8
0
.35
0
.7
28
.7
23
.8
4.9
Nat
ional
In
stit
ute
o
f A
dvan
ced
In
dust
rial
Sci
ence
and
Tec
hno
log
y
Ioro
i et
al.
(200
1)
1.7
1
8
2.8
0
.42
0
.7
34
.4
28
.5
4.0
Nat
ional
In
stit
ute
o
f A
dvan
ced
In
dust
rial
Sci
ence
and
Tec
hno
log
y –
A
Ioro
i et
al.
(200
2)
0.9
75
0
.5
72
.2
0.4
0
.5
45
.9
33
.1
2.4
Nat
ional
In
stit
ute
o
f A
dvan
ced
In
dust
rial
Sci
ence
and
Tec
hno
log
y –
B
Ioro
i et
al.
(200
2)
0.9
25
0
.5
76
.1
0.2
94
0
.42
4
0.2
3
0.6
3
.1
Zen
tru
m
fuer
S
onnen
ener
gie
u
nd
W
asse
rsto
ff-F
ors
chu
ng
B
aden
-W
uer
ttem
ber
g
Jori
ssen
(2
00
6)
1.7
1
0.4
3
2.9
0
.36
0
.9
23
.0
7.6
4
.8
Dal
ian I
nst
itute
of
Tec
hno
log
y
Yim
et
al.
(20
04
) 2
.7
1.3
5
70
.4
0.2
25
0
.75
1
7.2
1
2.1
1
2.0
Ko
rea
Inst
itu
te o
f E
ner
gy R
esea
rch
Yim
et
al.
(2
00
5)
0.8
0
.5
88
.0
0.7
1
.4
28
.7
25
.2
1.1
Fra
un
ho
fer
Inst
itute
fo
r S
ola
r E
ner
gy
S
yst
ems
Wit
tsta
dt
et a
l.(2
005
) 1
.15
0
.57
5
70
.4
0.1
96
0
.32
5
34
.6
24
.3
5.9
Dal
ian I
nst
itute
of
Tec
hno
log
y
So
ng e
t a
l. (
20
06
) 3
.6
2
78
.2
0.2
08
1
.22
5
9.7
7
.6
17
.3
Ta
ble
4:
Mea
sure
d p
erfo
rman
ce d
ata
for
exp
erim
enta
l U
RF
Cs
rep
ort
ed i
n t
he
lite
ratu
re.
The
corr
esp
ond
ing p
hysi
cal
des
ign
char
acte
rist
ics
of
thes
e ce
lls
is g
iven
in T
able
3.
Val
ues
for
the
mo
dal
and
ro
und
trip
en
erg
y e
ffic
ienci
es (
shad
ed c
olu
mn
s) a
re e
stim
ated
(se
e te
xt)
.

D
oct
or
of
Phil
oso
ph
y
C
HA
PT
ER
2
57
Ta
ble
5:
The
physi
cal
char
acte
rist
ics
of
the
exp
erim
enta
l U
RF
Cs
for
whic
h p
erfo
rman
ce d
ata
are
giv
en i
n T
able
4
Hy
dro
gen
sid
e O
xy
gen
sid
e C
ell
Ref
eren
ce
Mem
bra
ne
are
a (
cm2)
Ca
taly
st
ma
teri
al
Lo
ad
ing
(m
g/c
m2)
Ca
taly
st
ma
teri
al
Lo
ad
ing
(m
g/c
m2)
Oth
er f
eatu
res
BC
S T
echno
log
y
Dhar
(1
99
3)
5
Pt/
C
0.5
P
t +
IrO
2
3
Gin
er,
Inc.
(E
+)
Sw
ette
et
al.
(19
94)
40
P
t 1
P
t 4
O
pti
mis
ed f
or
FC
per
form
ance
Gin
er,
Inc.
(F
C a
nd
E +
) S
wet
te e
t a
l. (
19
94)
40
P
t
Pt/
IrO
2
1-3
(4
0:6
0 m
ix)
Op
tim
ised
fo
r b
oth
E a
nd
FC
mo
des
Gin
er,
Inc.
(F
C+
) S
wet
te e
t a
l. (
19
94)
40
P
t
Pt-
Na x
Pt 3
O4
1-3
(6
7:3
3 m
ix)
2 l
ayer
cat
alyst
str
uct
ure
bo
nd
ed t
o P
EM
Gin
er,
Inc.
S
wet
te e
t a
l.(1
99
4)
40
P
t
Pt-
Na x
Pt 3
O4
S
ingle
la
yer
o
f N
a xP
t 30
4
wit
h
10
%
iono
mer
bo
nd
ed t
o P
EM
Fra
un
ho
fer-
Inst
fo
r S
ol.
Ener
gy S
yst
. L
edje
ff e
t a
l.(1
99
4)
12
P
t 2
-4
Ir
2-4
LL
NL
IM
PR
ES
S
Mit
lits
ky e
t a
l. (
19
96
a)
10
5.2
E
-5
E
-5
LL
NL
01
(4
9 C
) M
itli
tsk
y e
t a
l.(1
99
8a)
4
6
E-5
4
E
-5
4
Per
form
ance
at
49
C
LL
NL
01
(8
2 C
) M
itli
tsk
y e
t a
l. (
19
98
a)
46
E
-5
4
E-5
4
P
erfo
rman
ce a
t 8
2C
LL
NL
Cel
l 9
74
3A
M
itli
tsk
y e
t a
l. (
19
98
a)
46
E
-5
4
E-5
4
P
erfo
rman
ce a
t 9
1C
LL
NL
Cel
l 9
80
4A
M
itli
tsk
y e
t a
l. (
19
98
a)
46
E
-5
1
E-5
1
P
erfo
rman
ce a
t 9
1C
Dal
ian I
nst
itute
of
Tec
hno
log
y
Zhig
ang e
t a
l.,(
19
99
) 5
P
t b
lack
0
P
t +
Ir
0.2
(50
:50
mix
)
Osa
ka
Nat
ional
Res
earc
h I
nst
itute
Io
roi
et a
l.(2
00
0)
10
PT
FE
b
ond
ed
po
rous
Pt
elec
tro
de
P
TF
E b
ond
ed
po
rous
Pt-
IrO
2
8-1
0
(5
0:5
0 m
ix)
Nat
ional
In
stit
ute
o
f A
dvan
ced
In
dust
rial
Sci
ence
and
Tec
hno
log
y
Ioro
i et
al.
(20
01)
10
P
t b
lack
Dep
osi
ted
Ir
O2/P
t
(
20
%/8
0%
)
Nat
ional
In
stit
ute
o
f A
dvan
ced
In
dust
rial
Sci
ence
and
Tec
hno
log
y -
A
Ioro
i et
al.
(20
02)
10
P
t b
lack
Pt
bla
ck
+
Ir
bla
ck
2-4
P
TF
E l
oad
ing 5
% -
7%
is
bes
t p
erfo
rmer
Nat
ional
In
stit
ute
o
f A
dvan
ced
In
dust
rial
Sci
ence
and
Tec
hno
log
y -
B
Ioro
i e
t a
l. (
20
02)
10
P
t b
lack
Pt
bla
ck
+
Ir
bla
ck
2-4
N
afio
n l
oad
ing 7
% -
9%
is
bes
t p
erfo
rmer
Zen
tru
m
fuer
S
onnen
ener
gie
u
nd
W
asse
rsto
ff-F
ors
chu
ng
B
aden
-W
uer
ttem
ber
g
Jori
ssen
(2
00
6)
P
t b
lack
0
.4
Pt
bla
ck
+
Ir
bla
ck
0.4
(5
0:5
0 m
ix)
Dal
ian I
nst
itute
of
Tec
hno
log
y
Yim
et
al.
(20
04
) 5
P
t 0
.4
Pt
+ I
rO2
0.2
(5
0:5
0 m
ix)
Ko
rea
Inst
itu
te o
f E
ner
gy R
esea
rch
Yim
et
al.
(20
05
) 1
0
Pt
bla
ck
4
PtI
r 4
Fra
un
ho
fer
Inst
. fo
r S
ola
r E
ner
gy
S
yst
ems
Wit
tsta
dt
et a
l. (
20
05
) 4
9
Pt
bla
ck
2
Pt
+ I
r b
lack
2
Dal
ian I
nst
itute
of
Tec
hno
log
y
So
ng e
t a
l.(2
00
6)
5
Pt/
C
0.5
P
t +
IrO
2
3

Doctor of Philosophy CHAPTER 2
58
Figure 22: The input and output power densities of experimental URFCs (see Table 2), and lines of constant
modal power ratio (Π). The shaded region indicates the desirable domain of operation
R ound trip energ y effic ienc y (%)
0
5
10
15
20
25
30
35
40
45
Dhar (19
93)
Swet
te e
t al (
1994
)
Swet
te e
t al (
1994
)
Swet
te e
t al (
1994
)
Swet
te e
t al (
1994
)
Ledje
ff et a
l (199
4)
Mitl
itsky
et a
l (19
98a)
Mitl
itsky
et a
l (19
98a)
Mitl
itsky
et a
l (19
98a)
Mitl
itsky
et a
l (19
98a)
Zhigang e
t al (
1999
)
Ioro
i et a
l (20
00)
Ioro
i et a
l (20
01)
Ioro
i et a
l (20
02)
Ioro
i et a
l (20
02)
Joris
sen (2
004)
Yim e
t al (
2004
)
Yim e
t al (
2005
)
Witt
stad
t et a
l (20
05)
Song et a
l (20
06)
Figure 23: Estimated roundtrip energy efficiencies at maximum power input and output of the experimental
URFCs reviewed
0
0.1
0.2
0.3
0.4
0.5
0.6
0.7
0.8
0.9
1
0 0.5 1 1.5 2 2.5 3 3.5 4
Input power density (W/cm2)
Outp
ut
pow
er
density (
W/c
m2)
π=1 π=2 π=3 π=4
Doctor of Philosophy CHAPTER 2
59
Among the URFCs reviewed here, Ledjeff et al.’s (1994) cell, constructed at the
Fraunhofer-Institute for Solar Energy Systems in Germany, has the highest estimated
roundtrip energy efficiency at 38.3% (E-mode 85.3%; FC-mode 44.9%). The maximum
output power density was 0.4725 W/cm2. This cell, with an active membrane area of 12
cm2, used an Ir catalyst (loading 2 mg/cm2) on the O-side, and Pt on the H-side.
Three cells constructed at the National Institute of Advanced Industrial Science and
Technology in Japan has the next highest estimated roundtrip energy efficiencies. Of these,
Ioroi et al.’s (2002) cell came out highest at 37.0% (E-mode 72.2%; FC-mode 51.3%), the
latter value being the highest FC-mode energy efficiency of all the URFCs reviewed here.
The maximum output power density was 0.4 W/cm2. A mixture of Pt black and Ir black (2-
4 mg/cm2) treated with PTFE was used as the O-side catalyst and placed on Nafion 115.
The PTFE content (5% -7%) was found to improve the fuel cell performance.
Swette et al.’s (1994 & 1992) cell made by Giner, Inc. also shows a relatively high
estimated roundtrip energy efficiency of 31.7% (E-mode 76.1%; FC-mode 41.7%),
together with an output power density 0.585 W/cm2. This cell employed a two-layer
catalyst structure on the O-side (subsection 9.3.3) consisting of very hydrophilic NaXPt304
(10% ionomer) and a less hydrophilic Pt transition layer bonded to the membrane.
To get an idea of the potential for improved performance of URFCs, if we combine the best
E-mode performance of all the cells reviewed here (an 88% energy efficiency, by the
Korea Institute of Energy Research reported by Yim et al. (2005)), with the best FC-mode
performance (51.3% by one of the National Institute of Advanced Industrial Science and
Technology cells reported by Ioroi et al. (2001)), the roundtrip energy efficiency obtained
would be just over 45%. This compares with a separate electrolyser and fuel cell system
maximum energy efficiency on the basis of current best performing cells (say 95% in E-
mode and 55% in FC mode) with a round trip energy efficiency of around 52%.
With respect to currently commercial systems, Proton Energy Systems claim a roundtrip
energy efficiency for their Unigen 119ºF system of just under 40% at 538 mA/cm2, just
over 50% at 323 mA/cm2, rising to a maximum of over 70% at near zero current density
The energy efficiency at maximum delivered power is about 40% for this system (Molter,
1999; Smith 2000).
Doctor of Philosophy CHAPTER 2
60
2.12 URFC STACKS
The design of URFC stacks – that is, multiple URFCs laid directly one upon the other –
involves similar considerations to those in designing a dedicated fuel cell stack, or a
dedicated electrolyser stack, yet there are some additional challenges stemming from the
required reversibility of the URFC stack. A typical arrangement for a PEM URFC stack is
shown in Figure 21, where the basic similarity to a PEM fuel cell stack is apparent. But key
differences are the following:
• The channel configuration in the bipolar plates must provide both efficient H2 and
O2 gas transfer to the GDB, and water vapour from the O-side GDBs, in FC- mode;
and gas flows in reverse direction, plus water inflow to O-side GDBs, in E-mode.
• Flooding of these channels and the passages in the GDBs must be prevented in FC-
mode, otherwise incoming gas flow will be inhibited.
• The bipolar plates must be made of a good electrically and thermally conducting
material that will not corrode in a wet oxygen-rich environment. Plates made from
graphite, as often used in fuel cell stacks, have been employed, but materials such
as nickel foam, titanium and stainless fibre-sintered plate is preferred (Ito et al.,
2005).
• Similar operating conditions in all cells within the stack in terms of gas flows, water
flows, pressure and temperature need to be maintained in both modes, so that each
cell output is around the same value.
• The water management system must in E-mode ensure sufficient water is available
on the O-side electrodes of each cell in the stack, and remove water that gathers on
the H-side electrodes due to osmotic drag of water molecules by H+ ion across the
membrane. On switching to FC-mode, this system must remove any excess water in
O-side GDBs and flow channels, remove water vapour produced by the overall
electrochemical reaction, and ensure the membrane remains hydrated.
• The flow of heat transfer fluid (usually water) through separate channels in the
bipolar plates (or sometimes a separate plate) must provide cooling of the stack in
FC-mode, while providing heat from the environment in E-mode.
Accordingly, water and gas flow management pose special challenges in URFC stack
design. Various design and material selection features have been proposed to address these
challenges (Kirk et al., 2003) but no standardised solution has yet evolved.

Doctor of Philosophy CHAPTER 2
61
Figure 24: Typical arrangement of a URFC stack: (a) E-mode; (b) FC-mode
The design, modelling and experimental testing of URFC stacks has been beyond the
resources and hence outside the scope of the present thesis.
(b)
Oxygen
Hydrogen
Oxygen
Hydrogen
Water
Water
Oxygen
Hydrogen
Water
(a)
Water
Hydrogen
Oxygen
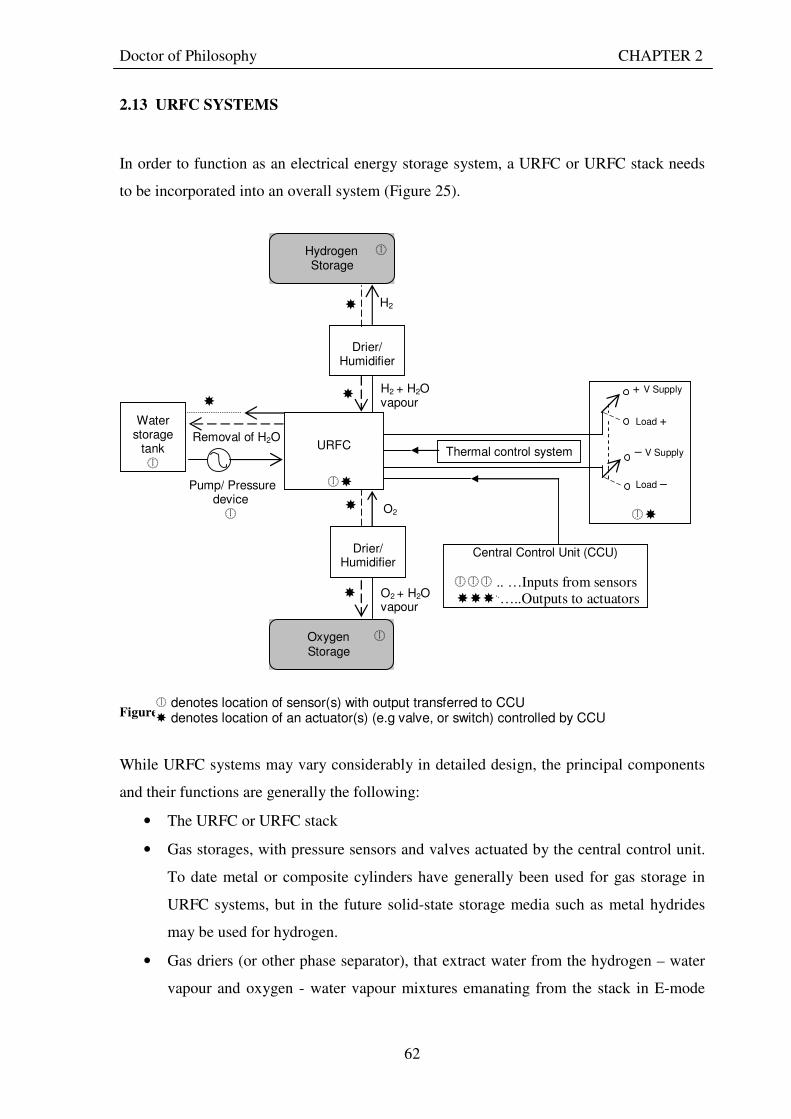
Doctor of Philosophy CHAPTER 2
62
2.13 URFC SYSTEMS
In order to function as an electrical energy storage system, a URFC or URFC stack needs
to be incorporated into an overall system (Figure 25).
Figure 25: A schematic of a generalised URFC system.
While URFC systems may vary considerably in detailed design, the principal components
and their functions are generally the following:
• The URFC or URFC stack
• Gas storages, with pressure sensors and valves actuated by the central control unit.
To date metal or composite cylinders have generally been used for gas storage in
URFC systems, but in the future solid-state storage media such as metal hydrides
may be used for hydrogen.
• Gas driers (or other phase separator), that extract water from the hydrogen – water
vapour and oxygen - water vapour mixtures emanating from the stack in E-mode
Central Control Unit (CCU)
.. …Inputs from sensors
..…..Outputs to actuators
Pump/ Pressure device
Removal of H2O
Water storage
tank
URFC
Hydrogen Storage
Oxygen Storage
Drier/ Humidifier
H2
H2 + H2O vapour
Thermal control system
O2
O2 + H2O vapour
+ V Supply
– V Supply
Load +
Load –
Drier/ Humidifier
denotes location of sensor(s) with output transferred to CCU denotes location of an actuator(s) (e.g valve, or switch) controlled by CCU
Doctor of Philosophy CHAPTER 2
63
prior the gases entering the storage cylinders; and gas humidifiers that add water
vapour to the hydrogen and oxygen flowing from the storages before they enter the
stack in FC-mode to prevent drying out of the membrane. In some systems, a
‘regenerative drier’ is used that performs the drying function in E-mode and the
humidification function in FC-mode by employing a reversible cooling/water
condensation and heating/water evaporation process in the same apparatus (Burke,
2003).
• A deionised water supply and return system. A pump may be employed to
introduce water into the stack during E-mode, or the pressure in the water storage
tank maintained at above that in the stack so that water is drawn in passively.
Liquid water accumulates on the hydrogen-sides of each cell in E-mode due to
osmotic drag, which must be removed either continuously, or before switching to
FC-mode. Ideally this water is returned to the water supply tank, though care must
be taken to ensure the small quantity of hydrogen dissolved in it does not allow any
undesirable mixtures of hydrogen and oxygen to form. Any excess water in O-side
channels or GDBs must be removed on switching from E to FC-mode, and is
preferably returned to the water storage tank.
• A thermal regulation system that controls flow of a heat transfer fluid (usually
water) through the bipolar or separate cooling plates in the URFC stack to provide
cooling in FC-mode. In E-mode this flow is either stopped or maintained to supply
additional heat if operation well above ambient temperature is desired.
• An overall system control unit, based on a programmable microprocessor. This unit
uses real-time information about conditions in the various components from sensors
(for example, pressure, temperature, gas detection, flow and level sensors) to
regulate all operations automatically via actuators, log data on performance, detect
any problems that arise, and if necessary set off alarms and shut down the system.
To date, relatively few URFC systems have been designed, built and operated. Some
examples are Mitlitsky et al.’s (1996b) “Integrated Modular Propulsion and Regenerative
Electro-energy Storage System” (IMPRESS) for small satellites, Burke and Jakupca
(2005)’s URFC design employing heat pipes for cooling in space applications, and Proton
Energy Systems’ Unigen system (Figure 7).
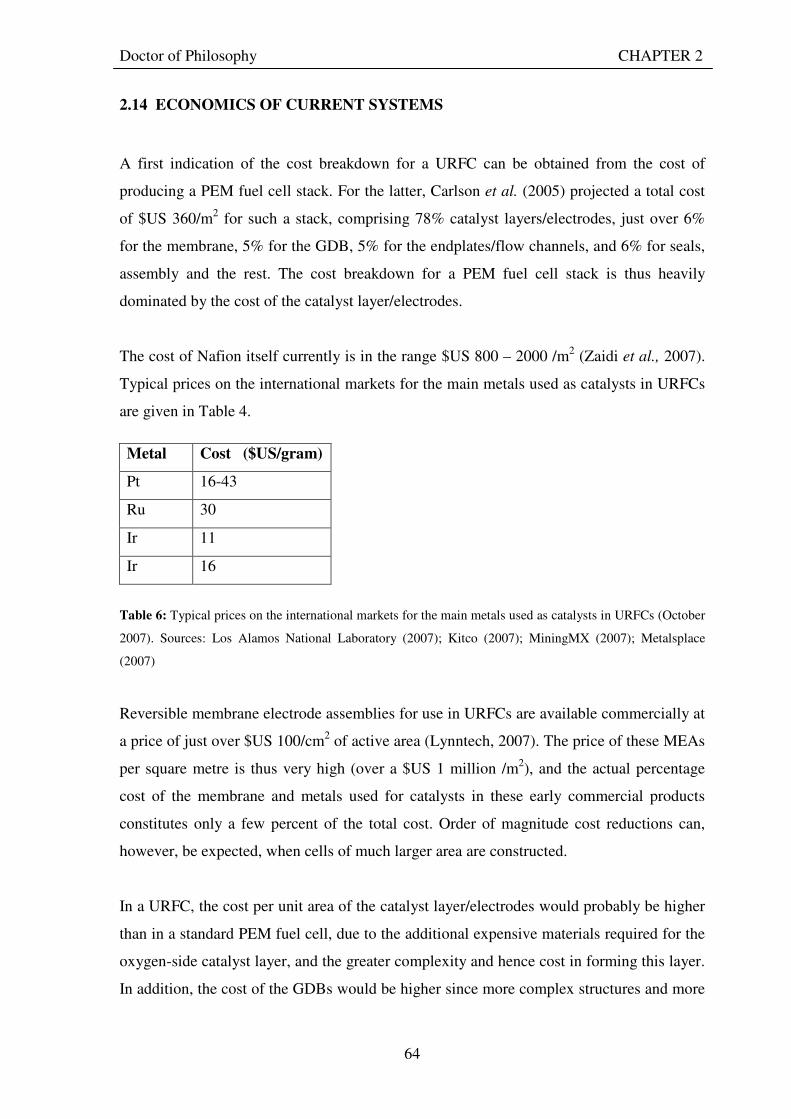
Doctor of Philosophy CHAPTER 2
64
2.14 ECONOMICS OF CURRENT SYSTEMS
A first indication of the cost breakdown for a URFC can be obtained from the cost of
producing a PEM fuel cell stack. For the latter, Carlson et al. (2005) projected a total cost
of $US 360/m2 for such a stack, comprising 78% catalyst layers/electrodes, just over 6%
for the membrane, 5% for the GDB, 5% for the endplates/flow channels, and 6% for seals,
assembly and the rest. The cost breakdown for a PEM fuel cell stack is thus heavily
dominated by the cost of the catalyst layer/electrodes.
The cost of Nafion itself currently is in the range $US 800 – 2000 /m2 (Zaidi et al., 2007).
Typical prices on the international markets for the main metals used as catalysts in URFCs
are given in Table 4.
Metal Cost ($US/gram)
Pt 16-43
Ru 30
Ir 11
Ir 16
Table 6: Typical prices on the international markets for the main metals used as catalysts in URFCs (October
2007). Sources: Los Alamos National Laboratory (2007); Kitco (2007); MiningMX (2007); Metalsplace
(2007)
Reversible membrane electrode assemblies for use in URFCs are available commercially at
a price of just over $US 100/cm2 of active area (Lynntech, 2007). The price of these MEAs
per square metre is thus very high (over a $US 1 million /m2), and the actual percentage
cost of the membrane and metals used for catalysts in these early commercial products
constitutes only a few percent of the total cost. Order of magnitude cost reductions can,
however, be expected, when cells of much larger area are constructed.
In a URFC, the cost per unit area of the catalyst layer/electrodes would probably be higher
than in a standard PEM fuel cell, due to the additional expensive materials required for the
oxygen-side catalyst layer, and the greater complexity and hence cost in forming this layer.
In addition, the cost of the GDBs would be higher since more complex structures and more
Doctor of Philosophy CHAPTER 2
65
expensive materials than carbon cloth or paper must be used. On the other hand a URFC
system will yield cost savings compared to an equivalent DRFC system that has to have
two PEM cells, one as the electrolyser and the other the fuel cell, rather than just the one
required by the URFC. Overall significant net cost savings through using a URFC rather
than a DRFC can be expected, but at this stage the magnitude of these savings is uncertain.
The cost per unit energy stored and delivered of a URFC-based energy storage system can
only be worked out with a detailed knowledge of the profile over time of the energy input
and the energy supplied. Molter (1999) of Proton Energy Systems estimated that a URFC-
based energy storage system with a capacity of 200 kWh would have a lifecycle cost of
$US 20000 compared to $US 120000 for an equivalent lead-acid battery system. The
incremental lifecycle cost of adding an extra kWh of storage capacity was found to be $US
30 for the URFC system, only one fifth to a tenth that for the battery system.
Further analysis of the lifecycle costs of power supplied to a remote household using a
solar hydrogen system employing a URFC will be provided in Chapter 3.
2.15 LIMITATIONS AND AREAS REQUIRING R & D
URFCs employing the same cell in both E and FC-modes have a wide range of potential
applications for storing electrical energy over relatively long periods and supplying it again
when required. They have an economic, volumetric and mass advantage over a dedicated
electrolyser and fuel cell systems provided the performance of the bifunctional cell in each
mode can be maintained close to that of the corresponding performance of a separate
electrolyser and fuel cell.
The best-performing experimental PEM URFCs to date have roundtrip energy efficiencies
in the range 30 – 38% at maximum power inputs and outputs, compared to a system of
roundtrip energy efficiency of just over 50% which employs a very energy-efficient
electrolyser and fuel cell. URFCs with roundtrip energy efficiencies of up to 45% should
soon be technically achievable. Raising the roundtrip energy efficiency above the 50%
mark – arguably a necessary goal – will require advances in PEM (or other) cell design
itself, and not just improvements in URFC designs. Given that the energy efficiency in FC-
Doctor of Philosophy CHAPTER 2
66
mode is invariably much lower than in E-mode, another approach to raising overall URFC
system energy efficiency is to use heat generated by the cell when it is producing electricity
for water or air heating. The URFC system would then provide combined heat and power,
assuming, of course, that there is a suitable application nearby requiring low-temperature
heat.
URFCs, with their lower total capital cost than dedicated electrolyser and fuel cell systems
of comparable capacity, promise to enhance the economic competitiveness of hydrogen
storage systems compared to alternatives such as batteries. While batteries have higher
roundtrip energy efficiency than hydrogen-based systems over the short term (up to 75%),
their energy efficiency generally declines relatively fast as a result of self-discharge with
the duration over which energy is stored. The URFC-based system is thus most likely to be
advantageous in applications where energy has to be stored for a relatively long period
(that is, several months or more), and the ratio of energy stored to power input (and output)
is high (Andrews and Doddathimmaiah, 2008). The advantages of the URFC system over a
battery bank may then come in terms of both lower total volume and mass, as well as lower
lifecycle costs.
Currently the main technical challenges the development of PEM URFC systems face are:
• The combined optimisation of performance in both fuel cell and electrolyser modes,
so that higher roundtrip energy efficiencies can be realised. In particular, on the
oxygen side, catalyst layers that have low overpotentials in both modes, and
improved gas diffusion and water transport layers, are required, which can also be
manufactured at low cost.
• The maintenance of the stability of the oxygen electrode, both in terms of resistance
to corrosion or other degradation, and retention of structural integrity and strength
after repeated cycling.
• The achievement of sustained, reliable and high-efficiency operation in both modes
over a large number of modal switches and a long lifetime.
• For RAPS applications, a quick transition between full-functioning in E and FC-
modes.
• Operation in E-mode at higher pressures, up to 10 or 20 bar, so that hydrogen and
preferably oxygen too can be stored as compressed gas in vessels of practical size.
Doctor of Philosophy CHAPTER 2
67
• Designing a balance of system that is as low cost as possible but maintains high
reversible performance of the URFC.
• Mass production of URFCs and other system components to lower total costs.
There is a need for improved theoretical and computer simulation models of URFCs and
URFC systems. Many more experimental studies to measure the performance of URFCs,
under controlled and standardised conditions, using different catalysts and loadings,
alternative gas diffusion and water transport layers, and alternative reversible cell designs,
are required to find out which designs and materials are truly preferable. It is essential that
these experimental studies measure hydrogen production and consumption rates as well as
V-I polarisation curves so that modal and roundtrip energy efficiencies can be found
directly from the experimental data.
Further experimental studies are also required into performance degradation of URFCs,
operated according to a number of standard cycles over specified periods, to establish
benchmarks for comparing URFCs of different designs, and assess their practical lifetimes.
Accordingly in the present thesis, the emphasis is on developing and validating an
improved theoretical and computer simulation model of PEM URFCs, and on conducting
and analysing the results from experimental studies to measure the performance of a
number of single-cell URFCs, under controlled and standardised conditions, using different
catalysts and loadings.

Doctor of Philosophy CHAPTER 3
68
3. USE OF URFCS IN SOLAR HYDROGEN RAPS SYSTEMS FOR
REMOTE AREA POWER SUPPLY
3.1 CONVENTIONAL REMOTE AREA POWER SUPPLY SYSTEMS
A remote area power supply (RAPS) system is an autonomous energy-generating system at
a location not connected to mains electricity or gas distribution network. RAPS systems
are attractive in situations where connecting to the main electricity grid is not economical.
Applications for RAPS systems thus include:
• remote households, villages, islands, communities
• telecommunications, meteorological or the satellite facilities
• mining operations.
Current RAPS systems may include any one of the following options below:
• Diesel generator, battery storage
• Photovoltaic panels, diesel generator, battery storage
• Aerogenerator, diesel generator, battery storage
• Photovoltaic panels/aerogenerator + battery storage.
Depending on the location, it is common to have combinations of petrol generators, wind
turbines and solar power systems together. Most RAPS systems require an energy storage
mechanism such as battery banks due to the intermittent nature of the load, wind and solar
energy. Irregular powers demands will cause generators to operate below their rated power;
which will increase the systems cost and decrease the systems lifetime and efficiency
(Akbarzadeh, 1992). Batteries typically lose 1-5% of their energy content per hour and
thus can only store energy for only short periods of time (Agbossou et al., 2001).
An alternative to chemical batteries is storing energy in the form of hydrogen, the best fuel
for fuel cells. Hydrogen for electrical energy produced by renewable energy sources such
as solar power and wind is considered suitable for RAPS applications.
Doctor of Philosophy CHAPTER 3
69
3.2 SOLAR HYDROGEN SYSTEMS FOR REMOTE AREA POWER SUPPLY
Solar-hydrogen systems with their renewable energy source, decentralised on-site
hydrogen generation and storage, and reuse of the stored hydrogen in fuel cells offer a
completely autonomous RAPS system that enables uninterruptible power supply to the
load (Ali, 2007). Solar-hydrogen systems are one of the emerging sustainable energy
technologies with the potential of replacing fossil fuels and minimising global warming
effects (Elam et al., 2003). Solar-hydrogen systems’ ability to be completely independent
of an electricity grid or any form of fossil-fuel based back-up makes then highly suitable to
supply the power for remote area applications. Their lower environmental impact and
higher reliability are among their advantages over conventional battery or diesel-supported
systems (Aurora, 2003).
There are approximately 2 billion people without access to electricity in the world (Brook
and Besant, 2000). Therefore, solar-hydrogen systems for RAPS systems present an early
market opportunity for renewable-energy hydrogen systems because of the high cost of
transporting fossil fuels, the high costs of connecting to the main electricity grid and
unrestricted hydrogen storage area (Andrews et al., 2005) and the technology can be very
beneficial for off-grid applications. The National Hydrogen Study (Department of
Resources, Energy and Tourism, 2003) recommended Australia position itself as a leader
in the international move to a hydrogen-based economy, although many steps still need to
be taken if this goal is ever to become a reality.
Hydrogen may be produced by a variety of primary resource and technological routes,
including coal gasification, natural gas reforming, and nuclear-powered water electrolysis.
However, the production of hydrogen from renewable energy sources has strong
sustainability advantages because of low net greenhouse emissions, the long-term
availability and security of supply (Barbir, 2005).
RAPS applications vary according to the location and power and energy demands of the
user. The concept of application of a renewable energy hydrogen system for remote area
power supply is illustrated in Figure 26. In this system, a conventional stand-alone energy
system is integrated with other systems such as a hydrogen generator, storage and fuel
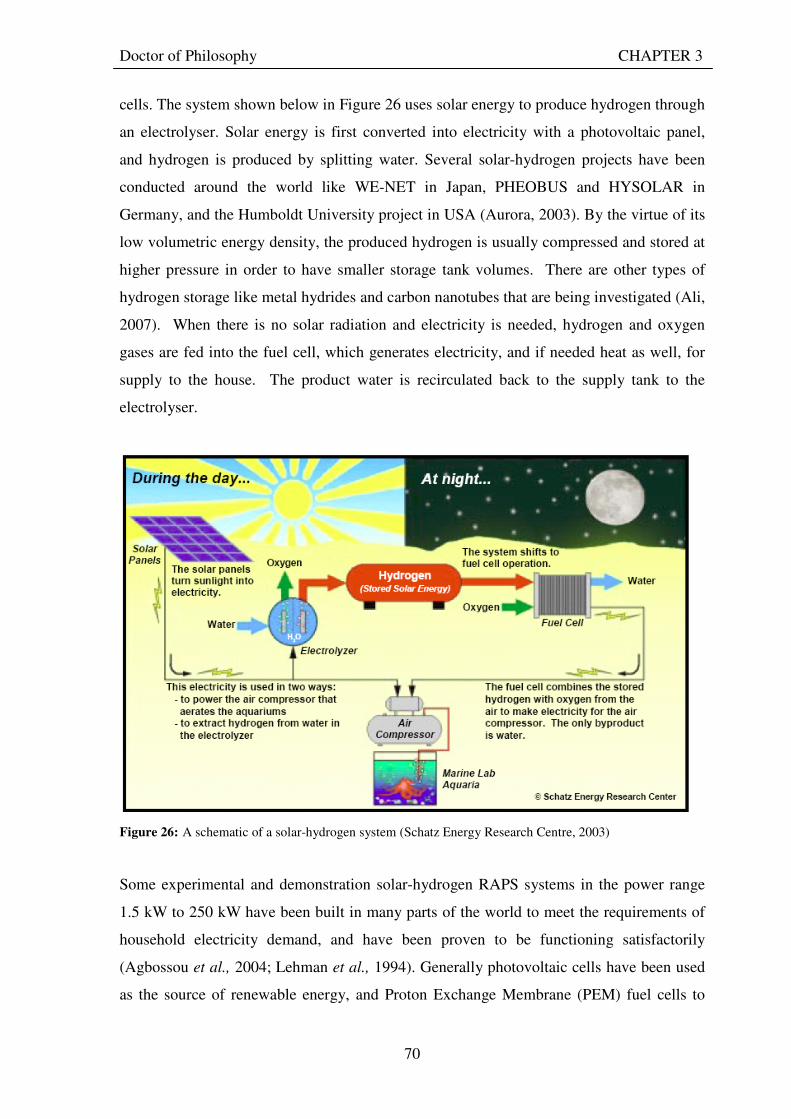
Doctor of Philosophy CHAPTER 3
70
cells. The system shown below in Figure 26 uses solar energy to produce hydrogen through
an electrolyser. Solar energy is first converted into electricity with a photovoltaic panel,
and hydrogen is produced by splitting water. Several solar-hydrogen projects have been
conducted around the world like WE-NET in Japan, PHEOBUS and HYSOLAR in
Germany, and the Humboldt University project in USA (Aurora, 2003). By the virtue of its
low volumetric energy density, the produced hydrogen is usually compressed and stored at
higher pressure in order to have smaller storage tank volumes. There are other types of
hydrogen storage like metal hydrides and carbon nanotubes that are being investigated (Ali,
2007). When there is no solar radiation and electricity is needed, hydrogen and oxygen
gases are fed into the fuel cell, which generates electricity, and if needed heat as well, for
supply to the house. The product water is recirculated back to the supply tank to the
electrolyser.
Figure 26: A schematic of a solar-hydrogen system (Schatz Energy Research Centre, 2003)
Some experimental and demonstration solar-hydrogen RAPS systems in the power range
1.5 kW to 250 kW have been built in many parts of the world to meet the requirements of
household electricity demand, and have been proven to be functioning satisfactorily
(Agbossou et al., 2004; Lehman et al., 1994). Generally photovoltaic cells have been used
as the source of renewable energy, and Proton Exchange Membrane (PEM) fuel cells to
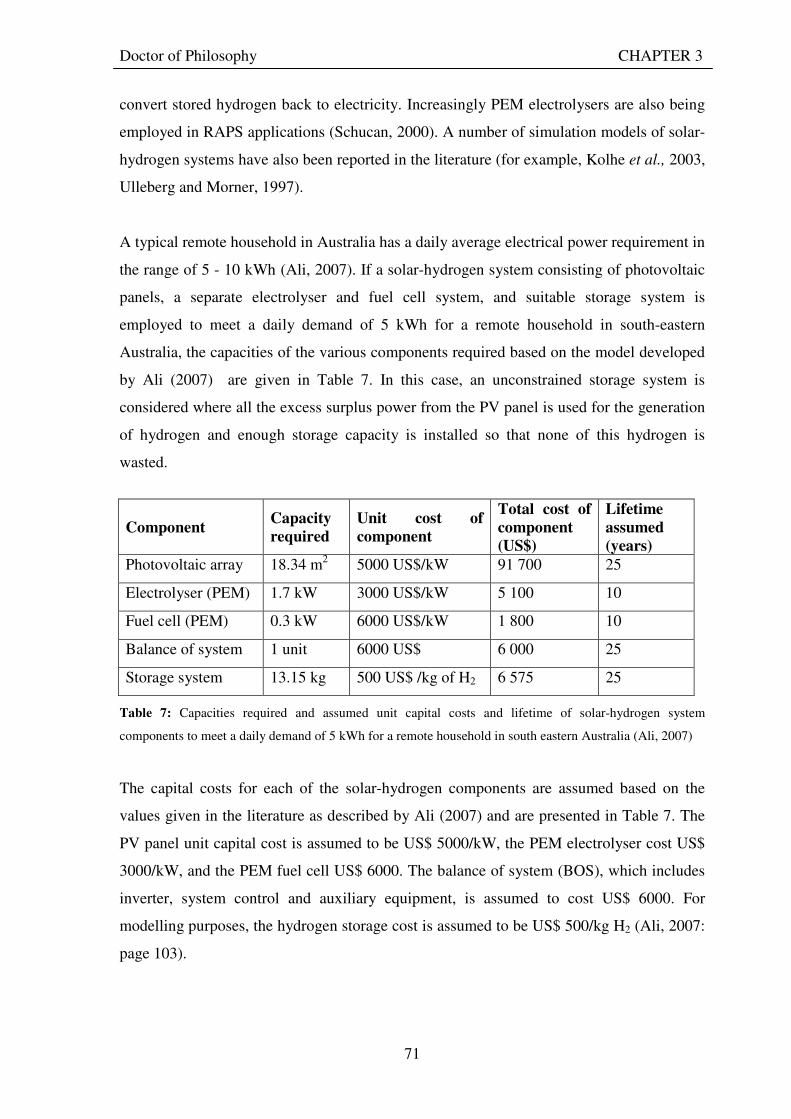
Doctor of Philosophy CHAPTER 3
71
convert stored hydrogen back to electricity. Increasingly PEM electrolysers are also being
employed in RAPS applications (Schucan, 2000). A number of simulation models of solar-
hydrogen systems have also been reported in the literature (for example, Kolhe et al., 2003,
Ulleberg and Morner, 1997).
A typical remote household in Australia has a daily average electrical power requirement in
the range of 5 - 10 kWh (Ali, 2007). If a solar-hydrogen system consisting of photovoltaic
panels, a separate electrolyser and fuel cell system, and suitable storage system is
employed to meet a daily demand of 5 kWh for a remote household in south-eastern
Australia, the capacities of the various components required based on the model developed
by Ali (2007) are given in Table 7. In this case, an unconstrained storage system is
considered where all the excess surplus power from the PV panel is used for the generation
of hydrogen and enough storage capacity is installed so that none of this hydrogen is
wasted.
Component Capacity required
Unit cost of component
Total cost of component (US$)
Lifetime assumed (years)
Photovoltaic array 18.34 m2 5000 US$/kW 91 700 25
Electrolyser (PEM) 1.7 kW 3000 US$/kW 5 100 10
Fuel cell (PEM) 0.3 kW 6000 US$/kW 1 800 10
Balance of system 1 unit 6000 US$ 6 000 25
Storage system 13.15 kg 500 US$ /kg of H2 6 575 25
Table 7: Capacities required and assumed unit capital costs and lifetime of solar-hydrogen system
components to meet a daily demand of 5 kWh for a remote household in south eastern Australia (Ali, 2007)
The capital costs for each of the solar-hydrogen components are assumed based on the
values given in the literature as described by Ali (2007) and are presented in Table 7. The
PV panel unit capital cost is assumed to be US$ 5000/kW, the PEM electrolyser cost US$
3000/kW, and the PEM fuel cell US$ 6000. The balance of system (BOS), which includes
inverter, system control and auxiliary equipment, is assumed to cost US$ 6000. For
modelling purposes, the hydrogen storage cost is assumed to be US$ 500/kg H2 (Ali, 2007:
page 103).
Doctor of Philosophy CHAPTER 3
72
With these assumptions, and using the cost model developed by Ali (2007) under
unconstrained storage conditions, the unit cost of power supplied by the solar-hydrogen
system on a lifecycle basis and at a 5% real discount rate is US$ 1.62/kWh. While arriving
at cost per kWh delivered, the Faraday efficiency of the electrolyser and the fuel utilisation
coefficient of the fuel cell are assumed as 95%. The lifetime for the electrolyser and fuel
cell is taken as 10 years. On the same assumptions, if the cost of storage is as high as US$
2000/kg H2, then the cost of unit power delivered by the solar hydrogen system rises to
US$ 2.60/kWh.
For a remote power system comprising of a diesel generator and battery, supplying exactly
the same daily load profile and annual electricity demand, the unit cost of power is in the
range of US$ 1.69-1.9/kWh (Ali, 2007). The fuel transportation cost is taken as US$
1.30/litre and a power output of 1kWh per litre of the fuel, a capital cost of US$ 980/kW.
Hence a solar-hydrogen system with the assumed unit component costs and lifetimes as
above would be competitive with a diesel-battery system already at the lower storage cost,
but still considerably more expensive at the higher assumed storage cost.
The main limitations of current solar-hydrogen RAPS systems are thus the high costs of the
photovoltaic panels, PEM electrolyser and fuel cell. There is also a lack of system
optimisation, and proven, safe and low-cost systems for storage of hydrogen as compressed
gas are still unavailable commercially. There is also little information comparing solar-
hydrogen RAPS systems with battery and diesel systems from a triple bottom line
perspective. Consequently there remains a need for considerable cost reductions for
solar/wind – hydrogen systems to enable them become economically competitive in RAPS
and other standalone applications, and design development and system testing before
commercial products can be made and sold (Dutton et al., 2000).
With the expected reduction in the component cost and gain in the system performance,
attention towards renewable energy alternatives for stand-alone applications is gaining
momentum all over the world. An opportunity for cost reduction in solar-hydrogen
systems being explored in this thesis is the use of URFC systems based on PEM
technology in place of a separate elecrolyser and fuel cell.
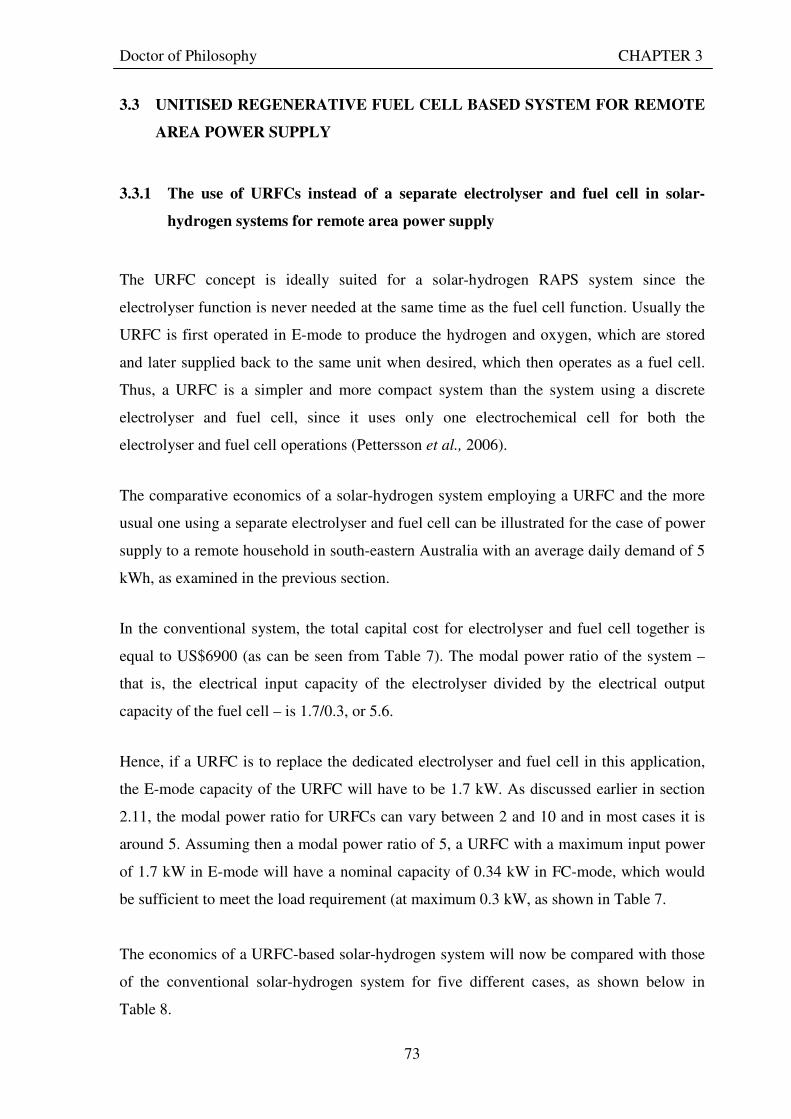
Doctor of Philosophy CHAPTER 3
73
3.3 UNITISED REGENERATIVE FUEL CELL BASED SYSTEM FOR REMOTE
AREA POWER SUPPLY
3.3.1 The use of URFCs instead of a separate electrolyser and fuel cell in solar-
hydrogen systems for remote area power supply
The URFC concept is ideally suited for a solar-hydrogen RAPS system since the
electrolyser function is never needed at the same time as the fuel cell function. Usually the
URFC is first operated in E-mode to produce the hydrogen and oxygen, which are stored
and later supplied back to the same unit when desired, which then operates as a fuel cell.
Thus, a URFC is a simpler and more compact system than the system using a discrete
electrolyser and fuel cell, since it uses only one electrochemical cell for both the
electrolyser and fuel cell operations (Pettersson et al., 2006).
The comparative economics of a solar-hydrogen system employing a URFC and the more
usual one using a separate electrolyser and fuel cell can be illustrated for the case of power
supply to a remote household in south-eastern Australia with an average daily demand of 5
kWh, as examined in the previous section.
In the conventional system, the total capital cost for electrolyser and fuel cell together is
equal to US$6900 (as can be seen from Table 7). The modal power ratio of the system –
that is, the electrical input capacity of the electrolyser divided by the electrical output
capacity of the fuel cell – is 1.7/0.3, or 5.6.
Hence, if a URFC is to replace the dedicated electrolyser and fuel cell in this application,
the E-mode capacity of the URFC will have to be 1.7 kW. As discussed earlier in section
2.11, the modal power ratio for URFCs can vary between 2 and 10 and in most cases it is
around 5. Assuming then a modal power ratio of 5, a URFC with a maximum input power
of 1.7 kW in E-mode will have a nominal capacity of 0.34 kW in FC-mode, which would
be sufficient to meet the load requirement (at maximum 0.3 kW, as shown in Table 7.
The economics of a URFC-based solar-hydrogen system will now be compared with those
of the conventional solar-hydrogen system for five different cases, as shown below in
Table 8.
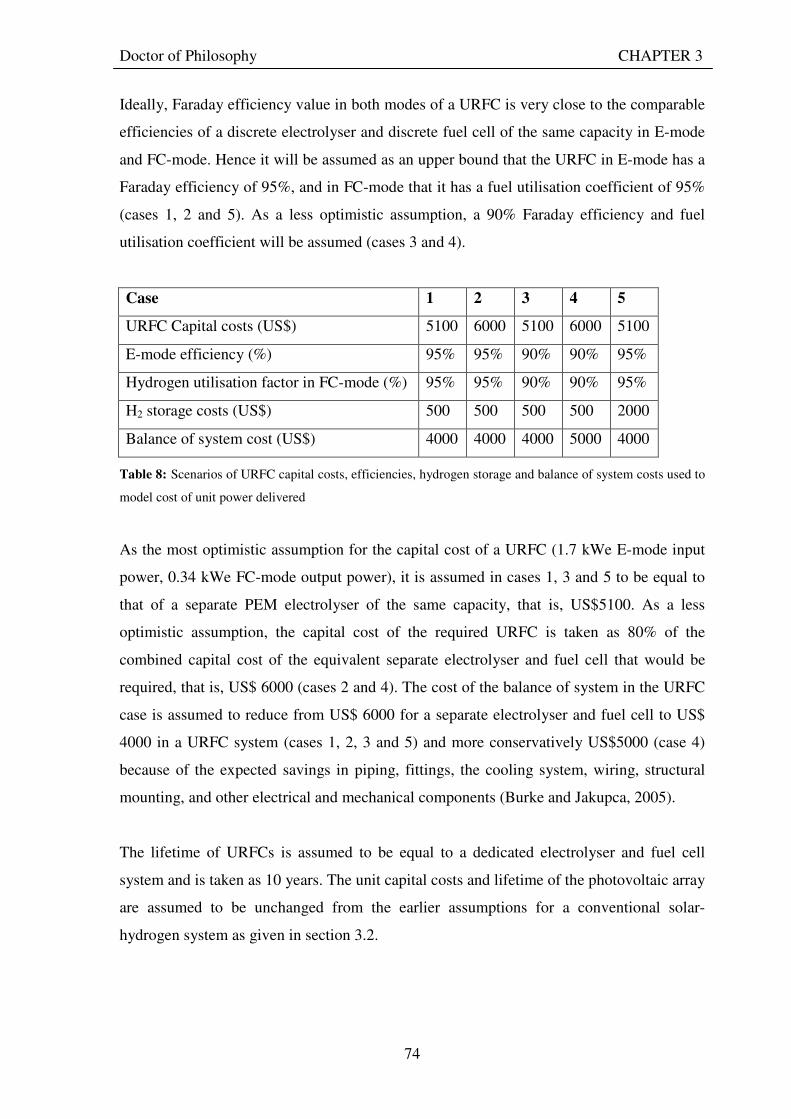
Doctor of Philosophy CHAPTER 3
74
Ideally, Faraday efficiency value in both modes of a URFC is very close to the comparable
efficiencies of a discrete electrolyser and discrete fuel cell of the same capacity in E-mode
and FC-mode. Hence it will be assumed as an upper bound that the URFC in E-mode has a
Faraday efficiency of 95%, and in FC-mode that it has a fuel utilisation coefficient of 95%
(cases 1, 2 and 5). As a less optimistic assumption, a 90% Faraday efficiency and fuel
utilisation coefficient will be assumed (cases 3 and 4).
Case 1 2 3 4 5
URFC Capital costs (US$) 5100 6000 5100 6000 5100
E-mode efficiency (%) 95% 95% 90% 90% 95%
Hydrogen utilisation factor in FC-mode (%) 95% 95% 90% 90% 95%
H2 storage costs (US$) 500 500 500 500 2000
Balance of system cost (US$) 4000 4000 4000 5000 4000
Table 8: Scenarios of URFC capital costs, efficiencies, hydrogen storage and balance of system costs used to
model cost of unit power delivered
As the most optimistic assumption for the capital cost of a URFC (1.7 kWe E-mode input
power, 0.34 kWe FC-mode output power), it is assumed in cases 1, 3 and 5 to be equal to
that of a separate PEM electrolyser of the same capacity, that is, US$5100. As a less
optimistic assumption, the capital cost of the required URFC is taken as 80% of the
combined capital cost of the equivalent separate electrolyser and fuel cell that would be
required, that is, US$ 6000 (cases 2 and 4). The cost of the balance of system in the URFC
case is assumed to reduce from US$ 6000 for a separate electrolyser and fuel cell to US$
4000 in a URFC system (cases 1, 2, 3 and 5) and more conservatively US$5000 (case 4)
because of the expected savings in piping, fittings, the cooling system, wiring, structural
mounting, and other electrical and mechanical components (Burke and Jakupca, 2005).
The lifetime of URFCs is assumed to be equal to a dedicated electrolyser and fuel cell
system and is taken as 10 years. The unit capital costs and lifetime of the photovoltaic array
are assumed to be unchanged from the earlier assumptions for a conventional solar-
hydrogen system as given in section 3.2.
Doctor of Philosophy CHAPTER 3
75
Among the first four cases where the storage cost is US$500/kg, case 1 is the best case for
a solar-hydrogen system employing a URFC and case 4 the worst case from an economic
perspective. Case 5 is the same as case 1 except that the storage cost is increased to
US$2000 to examine the impact of this factor alone.
Rerunning Ali (2007)’s model for the solar-hydrogen URFC system on the basis of case 1
assumptions gives the required capacities of the system components to meet the daily load
of 5 kWh throughout the year as presented in Table 9. The size of photovoltaic panel area
and the hydrogen storage system required remains the same as in case of a solar-hydrogen
system with dedicated electrolyser and fuel cell. Once again, an unconstrained storage
scenario is assumed wherein all of the hydrogen produced by the excess surplus power
from the PV panel is stored for later use.
Component Capacity required
Unit cost of component
Total cost of component (US $)
Lifetimes expected
Photovoltaic 18.34 m2 5000 US$/kW 91 700 25
URFC 1.7 kW 3000 US$/kW 5 100 10
Balance of system 1 4000 US$ 4 000 25
Storage system 13.15 kg 500 US$ /kg of H2 6 575 25
Table 9: The required capacities, assumed unit costs, total costs and lifetimes in case 1 for a solar-hydrogen
URFC system to meet a daily demand of 5 kWh for a remote household in south-eastern Australia
On the basis of these performance and cost assumptions, cost modelling has been
conducted to find the unit cost of electricity delivered on a full life cycle basis at a real
annual discount rate of 5%. The results are presented and compared with the unit costs of
power from a solar-hydrogen system with a separate electrolyser and fuel cell in Table 10
and Figure 27.
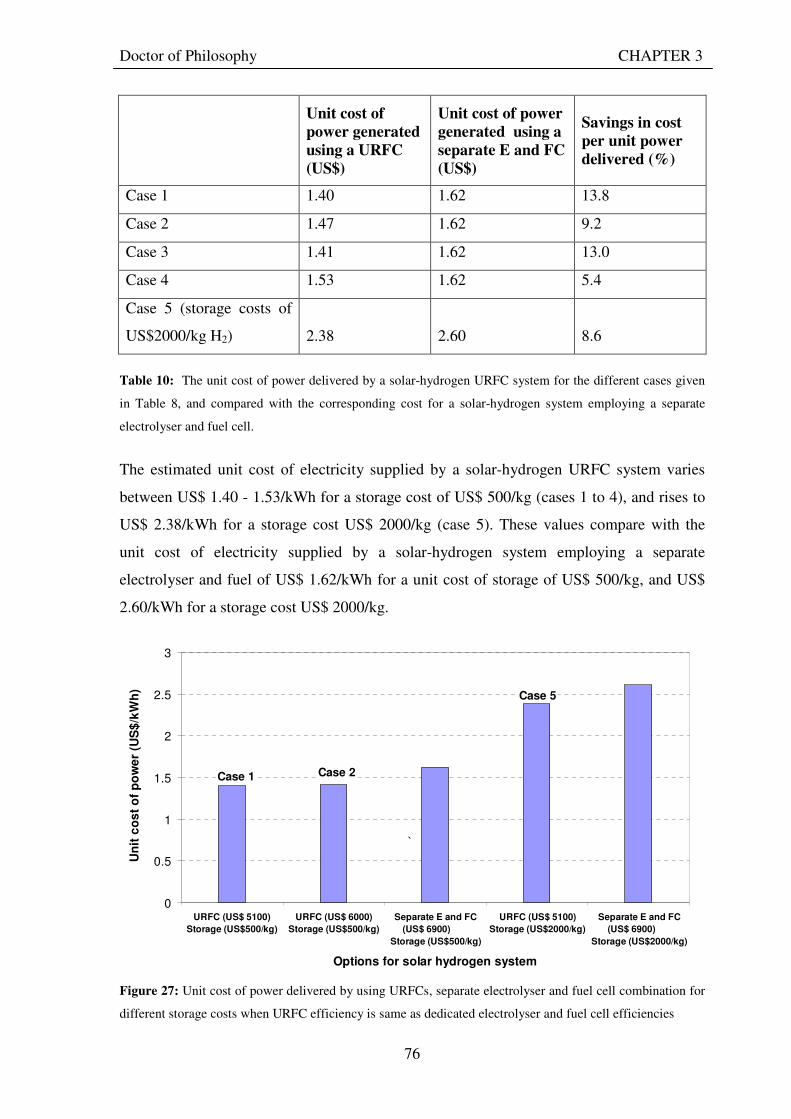
Doctor of Philosophy CHAPTER 3
76
Unit cost of power generated using a URFC (US$)
Unit cost of power generated using a separate E and FC (US$)
Savings in cost per unit power delivered (%)
Case 1 1.40 1.62 13.8
Case 2 1.47 1.62 9.2
Case 3 1.41 1.62 13.0
Case 4 1.53 1.62 5.4
Case 5 (storage costs of
US$2000/kg H2) 2.38 2.60 8.6
Table 10: The unit cost of power delivered by a solar-hydrogen URFC system for the different cases given
in Table 8, and compared with the corresponding cost for a solar-hydrogen system employing a separate
electrolyser and fuel cell.
The estimated unit cost of electricity supplied by a solar-hydrogen URFC system varies
between US$ 1.40 - 1.53/kWh for a storage cost of US$ 500/kg (cases 1 to 4), and rises to
US$ 2.38/kWh for a storage cost US$ 2000/kg (case 5). These values compare with the
unit cost of electricity supplied by a solar-hydrogen system employing a separate
electrolyser and fuel of US$ 1.62/kWh for a unit cost of storage of US$ 500/kg, and US$
2.60/kWh for a storage cost US$ 2000/kg.
Figure 27: Unit cost of power delivered by using URFCs, separate electrolyser and fuel cell combination for
different storage costs when URFC efficiency is same as dedicated electrolyser and fuel cell efficiencies
0
0.5
1
1.5
2
2.5
3
URFC (US$ 5100)
Storage (US$500/kg)
URFC (US$ 6000)
Storage (US$500/kg)
Separate E and FC
(US$ 6900)
Storage (US$500/kg)
URFC (US$ 5100)
Storage (US$2000/kg)
Separate E and FC
(US$ 6900)
Storage (US$2000/kg)
Options for solar hydrogen system
Un
it c
os
t o
f p
ow
er
(US
$/k
Wh
)
`
Case 1 Case 2
Case 5
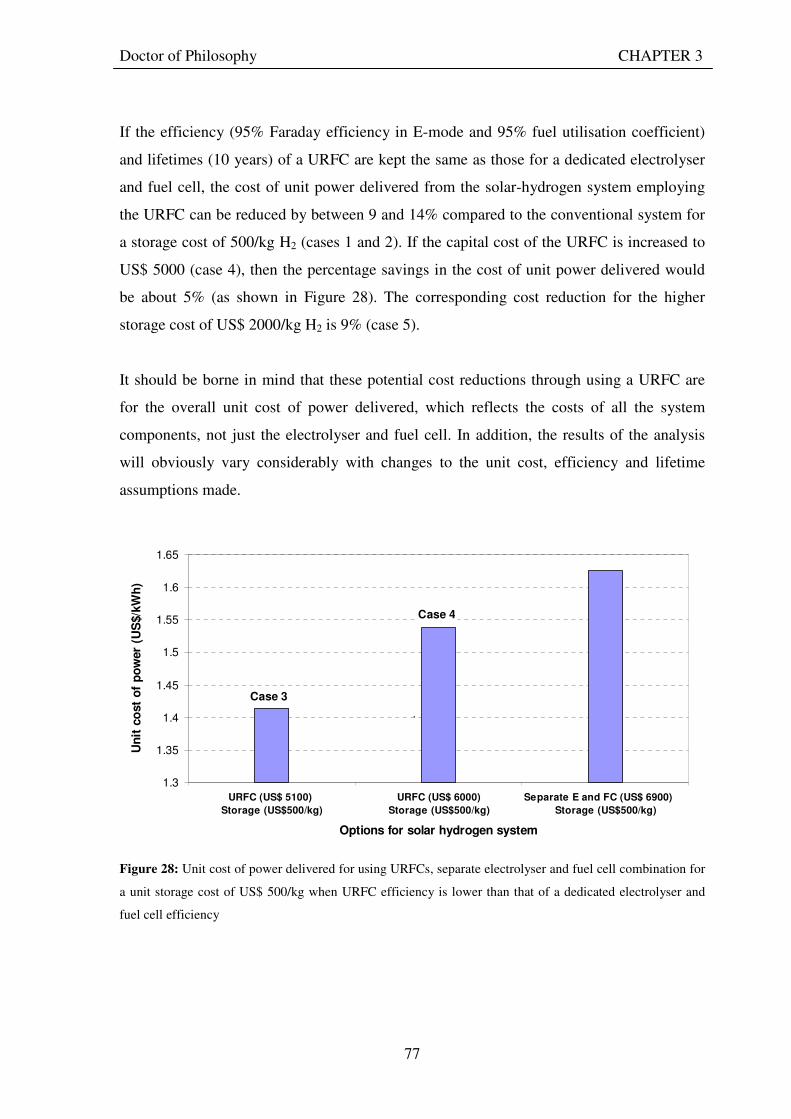
Doctor of Philosophy CHAPTER 3
77
If the efficiency (95% Faraday efficiency in E-mode and 95% fuel utilisation coefficient)
and lifetimes (10 years) of a URFC are kept the same as those for a dedicated electrolyser
and fuel cell, the cost of unit power delivered from the solar-hydrogen system employing
the URFC can be reduced by between 9 and 14% compared to the conventional system for
a storage cost of 500/kg H2 (cases 1 and 2). If the capital cost of the URFC is increased to
US$ 5000 (case 4), then the percentage savings in the cost of unit power delivered would
be about 5% (as shown in Figure 28). The corresponding cost reduction for the higher
storage cost of US$ 2000/kg H2 is 9% (case 5).
It should be borne in mind that these potential cost reductions through using a URFC are
for the overall unit cost of power delivered, which reflects the costs of all the system
components, not just the electrolyser and fuel cell. In addition, the results of the analysis
will obviously vary considerably with changes to the unit cost, efficiency and lifetime
assumptions made.
Figure 28: Unit cost of power delivered for using URFCs, separate electrolyser and fuel cell combination for
a unit storage cost of US$ 500/kg when URFC efficiency is lower than that of a dedicated electrolyser and
fuel cell efficiency
1.3
1.35
1.4
1.45
1.5
1.55
1.6
1.65
URFC (US$ 5100)
Storage (US$500/kg)
URFC (US$ 6000)
Storage (US$500/kg)
Separate E and FC (US$ 6900)
Storage (US$500/kg)
Options for solar hydrogen system
Un
it c
ost
of
po
wer
(US
$/k
Wh
)
`
Case 3
Case 4
Doctor of Philosophy CHAPTER 3
78
3.3.2 Benefits of solar-hydrogen URFC systems for remote area power supply
3.3.2.1 Economic benefits
A critical cost penalty for current solar - hydrogen systems is the high combined capital
costs of the electrolyser, fuel cell, and the storage system for hydrogen as compressed gas,
compared to a battery bank where just the batteries are required. Because a URFC is a
single device capable of functioning in either the electrolyser mode or the fuel cell mode,
the URFC concept is ideally suited for renewable energy - hydrogen RAPS systems (and a
storage system for household PV) since in such applications the electrolyser function is
never needed at the same time as the fuel cell function.
Hence, if the capital cost of a URFC can be kept much lower than the combined cost of a
separate electrolyser and fuel cell, and its efficiencies in both modes are close to those in
separate units, then the economic competitiveness of a solar hydrogen system against
alternatives such as batteries can be significantly improved by employing URFCs, instead
of a dedicated electrolyser and fuel cell of comparable capacity.
The analysis in this chapter indicates that potential savings of up to 14% in the cost of unit
power delivered by a solar hydrogen system employing URFCs can be obtained against
conventional solar hydrogen systems that use dedicated electrolyser and fuel cell. This can
be achieved if the performance of a URFCs and lifetimes are maintained (greater than or
equal to separate electrolyser and fuel cell performances), while bringing down the BOS
costs. Such systems would thus lead to economic benefits in the form of lower-cost
electricity supply for remote households, communities, farms, mining and other
enterprises.
A properly designed URFC-based solar-hydrogen system should also be able to meet the
end-use demand over a full year without requiring regular maintenance – a further cost
saving – though further field testing and proving of the technology is still required.
There is also an excellent opportunity for further economic benefits through the growth of
firms producing and installing URFC hydrogen storage systems, and renewable energy
hydrogen systems as a whole, in Australia and overseas.
Doctor of Philosophy CHAPTER 3
79
Hydrogen power systems generally, which URFCs would help to make more competitive,
provide unique opportunities for increasing the diversity of supply in the more general
electricity market. Currently the penetrations of renewables like wind and solar into the
main electricity markets are limited by grid stability and intermittency issues. By
combining these generation technologies with hydrogen production and storage, facilitated
by URFCs, intermittent renewables could potentially capture a larger share of the power
production market without major upgrades to the existing grid.
3.3.2.2 Environmental benefits
It is estimated that there were about 10 000 households off-grid in Australia in 1999
(Swinburne University, 2007). Of these, about 5000 are known to be remote rural
properties that rely on diesel RAPS systems. The total installed diesel generation capacity
on remote farms in Australia is around 25-30 MW. A typical requirement per farm is a 6
kW generator. In addition, it is estimated that the total installed generation capacity of
diesel systems for remote communities in Australia is around 450 MW (Department of
Climate Change, 2008). Hence the total installed diesel generator capacity for RAPS in
farms and remote communities is around 480 MW.
If it is assumed that on average each remote household consumed 4000 kWh of electricity,
and the average fuel use of the diesel generators is taken as 1 litre/kWh (Akbarzadeh,
1992), the total diesel use for RAPS systems in Australia would be in the order of 20
Megalitres/year. Hence using a greenhouse emission coefficient for diesel of 3.0 tonnes/kl
(Department of Climate Change, 2008), the potential reduction in greenhouse emissions by
replacing all diesel RAPS systems with standalone renewable energy systems employing
URFC hydrogen storage would be in the order of 60 000 tonnes/y CO2-e.
A URFC-based solar hydrogen system can be termed an exemplar of a sustainable energy
system that has zero emissions, and is clean and noiseless.
Doctor of Philosophy CHAPTER 3
80
3.3.2.3 Social benefits
Although URFCs as an integral part of a solar-hydrogen system can be used extensively in
the future, a key social issue that needs attention is the safety of hydrogen storage. In
particular, in the event of extreme conditions such as lightning strikes, bushfires, and high
winds which are very common in Australia’s geography and climate conditions. In a solar-
hydrogen system, risks of fires caused from the stored hydrogen can be minimised and
controlled by having a proper storage tank in an open area, with a suitable dyke, and with
the installation of proper fire protection equipment (Ali, 2007). In addition the ease of
operation and maintenance of the system is also an important factor that needs to be
investigated.
Although solar-hydrogen systems have been demonstrated in practical applications, they
are still very much at a research and development stage. The construction of a URFC-based
solar-hydrogen RAPS pilot project should involve relevant social groups at different stages
of the design and construction in order to provide a more suitable system. The relevant
social groups can be involved through discussion forums, interviews and questionaries.
Social benefits of a pilot project would consist of educational knowledge, research
developments and the contribution to the development of the sustainable energy industry.
Hydrogen power systems generally, which URFCs would help to make more competitive,
provide unique opportunities for increasing the diversity of supply in the more general
electricity market. Currently the penetrations of renewables like wind and solar into the
main electricity markets are limited by grid stability and intermittency issues. By
combining these generation technologies with hydrogen production and storage, facilitated
by URFCs, intermittent renewables could potentially capture a larger share of the power
production market without major upgrades to the existing grid.
Doctor of Philosophy CHAPTER 3
81
3.4 CHALLENGES FACING SOLAR-HYDROGEN URFC SYSTEMS
From the analysis done in this chapter, the main challenges facing solar-hydrogen URFC
systems for RAPS and other standalone applications are the following:
• Achieving high-efficiency operation in both modes, very close to that achievable
with a discrete electrolyser and fuel cell, over a large number of modal switches and
a long lifetime for a URFC
• Attaining a quick transition between full-functioning in E and FC
• Keeping the capital cost of a URFC as low as, or only slightly above, that of a PEM
electrolyser of the same capacity.
• Designing a balance of system that is as low cost as possible, lower than that for a
separate electrolyser and fuel cell, while maintaining high reversible performance.
As I have identified in this chapter, one of the most critical challenges is to design URFCs
with cell characteristics which will enable high-efficiency performance in both E and FC
modes together with improved lifetimes. Hence the next chapter is devoted to developing a
theoretical model for a URFC that can be applied to designing URFCs with optimal
electrode characteristics to achieve reversible performance.

Doctor of Philosophy CHAPTER 4
82
4. A GENERAL THEORETICAL MODEL OF THE VOLTAGE-
CURRENT CHARACTERISTIC OF A PEM CELL COVERING
BOTH ELECTROLYSER AND FUEL CELL MODES
4.1 AIMS OF THEORETICAL WORK
The aims of the theoretical component of this thesis are as follows:
• To develop a single integrated and general theoretical relationship between cell
voltage and cell current density for a PEM cell that covers both fuel cell (FC) mode
and electrolyser (E) mode operation.
• To apply this model to the operation of the cell as a URFC.
• To incorporate into the model the impact of internal current through the membrane,
that is, electron flow as well as proton flow.
• To ensure the model is applicable in a continuous manner across the entire range of
operational current densities of the cell, from flow in one direction in E-mode,
through zero current, to flow in the other direction in FC-mode, including mass-
transport constraints and tendency towards a ‘saturation’ or maximum current
density in both modes.

Doctor of Philosophy CHAPTER 4
83
4.2 SIGN CONVENTIONS
The objective of this study is to develop a theoretical model to explain the current-potential
characteristics of a PEM URFC cell based on the involved charge transfer as well as
Butler-Volmer kinetics on the electrode surfaces. In developing a general relationship
between the cell voltage and cell current for a single PEM cell that applies in both E and
FC-modes, a sign convention for the various currents and voltages involved at both
electrodes that can be consistently applied in the two modes must be defined. The two
electrodes will here be termed the ‘oxygen-side’ electrode and the ‘hydrogen-side’
electrode, since under the usual definition of anode and cathode, each electrode is in turn a
cathode and an anode depending on whether it is operating in E or FC-mode.
The sign convention to be adopted here is consistent with that usually used for anodic and
cathodic currents (Pletcher and Walsh, 1990) and is as follows. A conventional current that
flows in to an electrode – usually termed anodic – is taken as positive. A conventional
current that flows out from an electrode – usually termed cathodic – is negative. Hence a
cell current, jcell, is positive if it flows in to an electrode and negative if it flows outwards.
Correspondingly a Butler-Volmer current (jBV) is positive if it consumes conventional
current that flows in to an electrode; and negative if it generates conventional current that
flows out from an electrode.
Overpotential will be defined on both electrodes and in both E and FC-modes as the actual
electrode potential minus the reversible potential of the electrode. Hence on O-side, the
overpotential will be positive in E-mode and negative in FC-mode. On the H-side,
however, this definition means that the overpotential is negative in E-mode and positive in
FC-mode, that is, the opposite signs to the O-side.
Doctor of Philosophy CHAPTER 4
84
4.3 GENERAL EQUATIONS FOR CELL VOLTAGE AND CURRENT DENSITY
4.3.1 Electrolyser mode
4.3.1.1 Introduction
In principle, E and FC mode operation of a URFC involve the same reaction basically
working in opposite directions (Bockris and Reddy, 2000). Although there are many
studies on the theoretical analysis of fuel cells, there are not many published reports on the
kinetics and polarisation characteristics of the electrolyser (Choi, 2004). In order to design
and use URFCs effectively, analytical models for the device are necessary so that the
system can be optimised. Millet (1994) suggested that the potential distribution across a
cell during E-mode is a function of cell voltage, the anodic and cathodic kinetic
parameters, membrane resistivity and the operating temperature. Onda et al. (2002)
provided a voltage-current relation wherein the cell voltage is described as the sum of
Nernst voltage, resistive overpotential, and anode and cathode overpotentials. However,
empirical rather than theoretically-derived equations were utilised for the anode and
cathode overpotentials as a function of temperature of the electrolytes and current density
of the cell. Choi et al. (2004) analysed the E-mode in a PEM cell by a model based on
Butler–Volmer kinetics for electrodes and transport resistance. This model employs a
relationship between applied terminal voltage of the electrolysis cell and current density in
terms of the Nernst potential, exchange current densities, and proton conductivity of
polymer electrolyte. Choi et al. (2004)’s model is used in the present work as a starting
point for the development of a single model covering both E and FC mode operation of a
URFC.
4.3.1.2 Current flows and potential variation in E-mode
The various currents flowing in the cell during E-mode are shown in Figure 29. cellj is the
cell current density (that is, current per unit effective cell area) in the external circuit. HBVj
and O
BVj are the Butler-Volmer current densities in the H-side and O-side electrodes
respectively. intj is the internal current density flowing across the cell, These currents are
explained in turn in the following subsections.
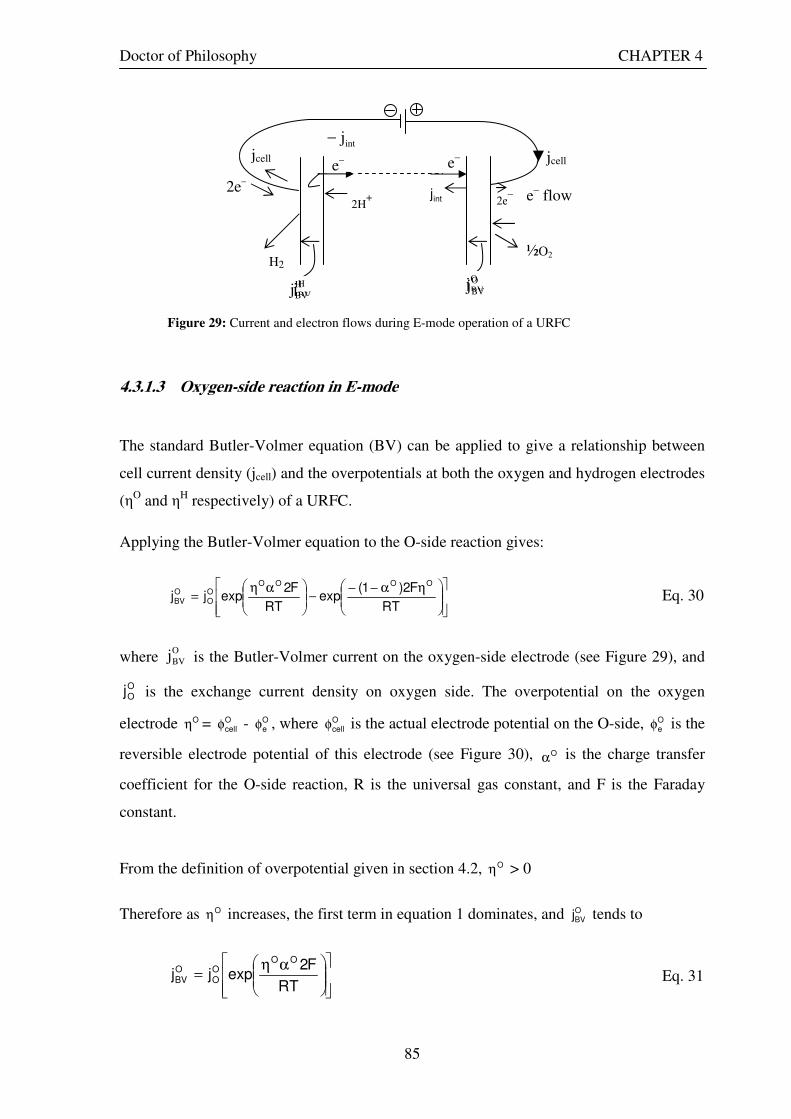
Doctor of Philosophy CHAPTER 4
85
Figure 29: Current and electron flows during E-mode operation of a URFC
4.3.1.3 Oxygen-side reaction in E-mode
The standard Butler-Volmer equation (BV) can be applied to give a relationship between
cell current density (jcell) and the overpotentials at both the oxygen and hydrogen electrodes
(ηO and ηH respectively) of a URFC.
Applying the Butler-Volmer equation to the O-side reaction gives:
ηα−−−
αη=
RT
F2)1(exp
RT
F2expjj
OOOOOO
OBV Eq. 30
where O
BVj is the Butler-Volmer current on the oxygen-side electrode (see Figure 29), and
OOj is the exchange current density on oxygen side. The overpotential on the oxygen
electrode Oη = Ocellφ - O
eφ , where Ocellφ is the actual electrode potential on the O-side, O
eφ is the
reversible electrode potential of this electrode (see Figure 30), Oα is the charge transfer
coefficient for the O-side reaction, R is the universal gas constant, and F is the Faraday
constant.
From the definition of overpotential given in section 4.2, Oη > 0
Therefore as Oη increases, the first term in equation 1 dominates, and OBVj tends to
αη=
RT
F2expjj
OOOO
OBV Eq. 31
2e– 2e
– intj
intj−
jcell
2H+
½O2
e– e–
e– flow
H2
jcell
O
BVjH
BVjO
BVj
H
BVj

Doctor of Philosophy CHAPTER 4
86
Also, OBVj is positive, because the dominant reaction consumes conventional current that
flows in to the O-electrode, that is, generates electrons that flow out from the electrode.
Note that as Oα increases performance in E-mode increases, since cell current density
increases at a faster rate with increase in applied overpotential on the O-electrode.
Consequently for good E-mode performance it is advantageous to get as high a value of Oα
as possible (up to 1, the maximum permitted value). Similarly lowering the value of Oα
decreases E-mode performance.
4.3.1.4 Hydrogen-side reaction in electrolyser mode
Similarly applying the Butler-Volmer equation to the hydrogen-side reactions gives:
α−η+
αη−−=
RT
F2)1(exp
RT
F2expjj
HHHHHO
HBV Eq. 32
where H
BVj is Butler-Volmer current on hydrogen-side electrode (see Figure 29), and H
Oj is
the exchange current density on hydrogen side.
The overpotential on the hydrogen electrode, He
Hcell
H φ−φ=η , where Hcellφ is the actual electrode
potential on the H-side, Heφ is the reversible potential of the hydrogen electrode (see Figure
29), and Hα is the charge transfer coefficient for the H-side reaction.
The first term in equation 32 relates to the forward reaction in E-mode, so that is why Hα
rather than (1 - Hα ) appears in the exponent. This definition of Hα ensures consistency of
interpretation of Hα and Oα .
Unlike on the O-side, the overpotential is negative in E-mode, 0He
Hcell
H <φ−φ=η.
Therefore as Hη increases, the first term in equation 32 dominates, and HBVj tends to:
αη−−=
RT
F2expjj
HHHO
HBV Eq. 33
HBVj is negative because conventional current flows out from the hydrogen electrode.

Doctor of Philosophy CHAPTER 4
87
Now as Hα increases, E-mode performance increases, since H
BVj = cellj increases at a faster
rate as the H-side overpotential becomes more negative. Hence on the basis of equations 30
and 31, E-mode performance is enhanced as both Hα and Oα increase.
4.3.1.5 Internal current in electrolyser mode
The PEM is designed to only let hydrogen ions (H+) pass from the one electrode to another
and the electrons are supposed to pass through an external circuit in order to provide
electricity as discussed earlier in section 2.5 of chapter 2. Nevertheless, some electrons
pass through membrane causing current losses in a URFC. Internal current losses generally
have a very small effect on the operating voltage; these losses are most visible at the open
circuit voltage (Voc) of low temperature fuel cells (Larminie and Dicks, 2003; Molter and
Dalton, 2005).
The reviewed literature does not include internal current losses in voltage/current models;
but it is clearly better analyse the effect of internal current explicitly to have a more
realistic model.
In E-mode, some of the electrons reaching the H-side electrode may be attracted into and
across the membrane towards the O-side electrode, which is at a higher positive potential.
Hence, there is likely to be an internal current constituted by an electron ‘leakage’ across
the membrane from H-side to O-side, and thereby amounting to a conventional current
flowing from O-side to H-side (Figure 29). This internal current is likely to be small, due to
the very high resistance of the Nafion membrane to electron current. The electrons crossing
the membrane do not take part in the reaction, 2H+ + 2e- ↔ H2.
Therefore at the H-side electrode, the internal current must be added to the H-side Butler-
Volmer current to calculate the total cell current density value:
H
BVj + intj = cellj .
HVBj − > 0 and cellj
> 0.
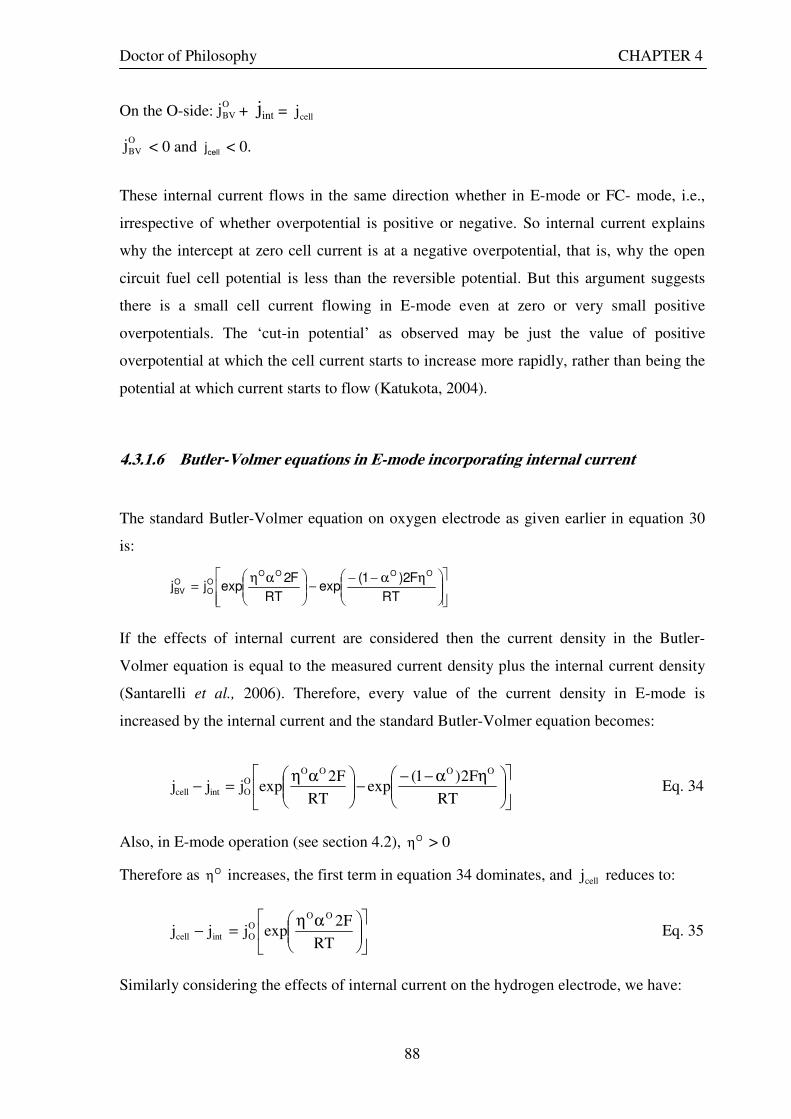
Doctor of Philosophy CHAPTER 4
88
On the O-side:O
BVj + intj = cellj
O
BVj < 0 and cellj < 0.
These internal current flows in the same direction whether in E-mode or FC- mode, i.e.,
irrespective of whether overpotential is positive or negative. So internal current explains
why the intercept at zero cell current is at a negative overpotential, that is, why the open
circuit fuel cell potential is less than the reversible potential. But this argument suggests
there is a small cell current flowing in E-mode even at zero or very small positive
overpotentials. The ‘cut-in potential’ as observed may be just the value of positive
overpotential at which the cell current starts to increase more rapidly, rather than being the
potential at which current starts to flow (Katukota, 2004).
4.3.1.6 Butler-Volmer equations in E-mode incorporating internal current
The standard Butler-Volmer equation on oxygen electrode as given earlier in equation 30
is:
ηα−−−
αη=
RT
F2)1(exp
RT
F2expjj
OOOOOO
OBV
If the effects of internal current are considered then the current density in the Butler-
Volmer equation is equal to the measured current density plus the internal current density
(Santarelli et al., 2006). Therefore, every value of the current density in E-mode is
increased by the internal current and the standard Butler-Volmer equation becomes:
ηα−−−
αη=−
RT
F2)1(exp
RT
F2expjjj
OOOOO
Ointcell Eq. 34
Also, in E-mode operation (see section 4.2), Oη > 0
Therefore as Oη increases, the first term in equation 34 dominates, and cellj reduces to:
αη=−
RT
F2expjjj
OOO
Ointcell Eq. 35
Similarly considering the effects of internal current on the hydrogen electrode, we have:
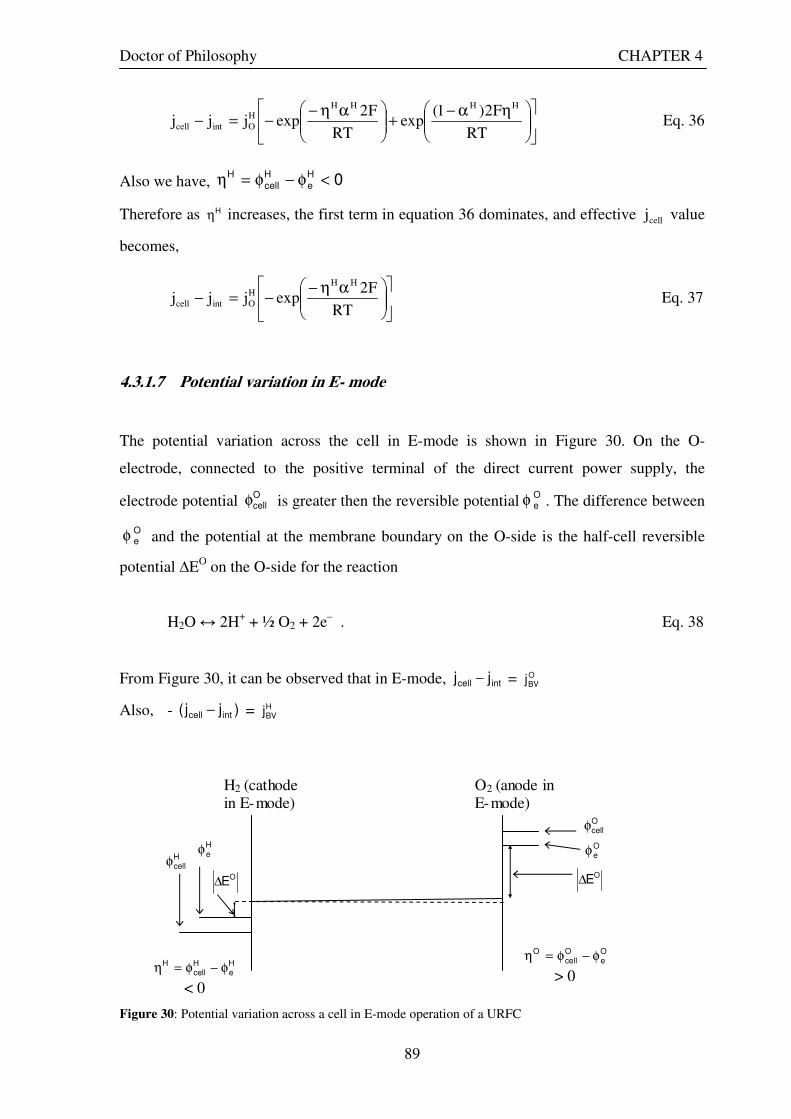
Doctor of Philosophy CHAPTER 4
89
ηα−+
αη−−=−
RT
F2)1(exp
RT
F2expjjj
HHHHH
Ointcell Eq. 36
Also we have, 0He
Hcell
H <φ−φ=η
Therefore as Hη increases, the first term in equation 36 dominates, and effective cellj value
becomes,
αη−−=−
RT
F2expjjj
HHH
Ointcell Eq. 37
4.3.1.7 Potential variation in E- mode
The potential variation across the cell in E-mode is shown in Figure 30. On the O-
electrode, connected to the positive terminal of the direct current power supply, the
electrode potential Ocellφ is greater then the reversible potential
Oeφ . The difference between
Oeφ and the potential at the membrane boundary on the O-side is the half-cell reversible
potential ∆EO on the O-side for the reaction
H2O ↔ 2H+ + ½ O2 + 2e– . Eq. 38
From Figure 30, it can be observed that in E-mode, intcell jj − = OBVj
Also, - )jj( intcell − = HBVj
Figure 30: Potential variation across a cell in E-mode operation of a URFC
O2 (anode in E-mode)
H2 (cathode in E-mode)
OE∆
Oeφ
Ocellφ
OE∆
Oe
Ocell
O φ−φ=η
> 0
He
Hcell
H φ−φ=η
< 0
Hcellφ
Heφ
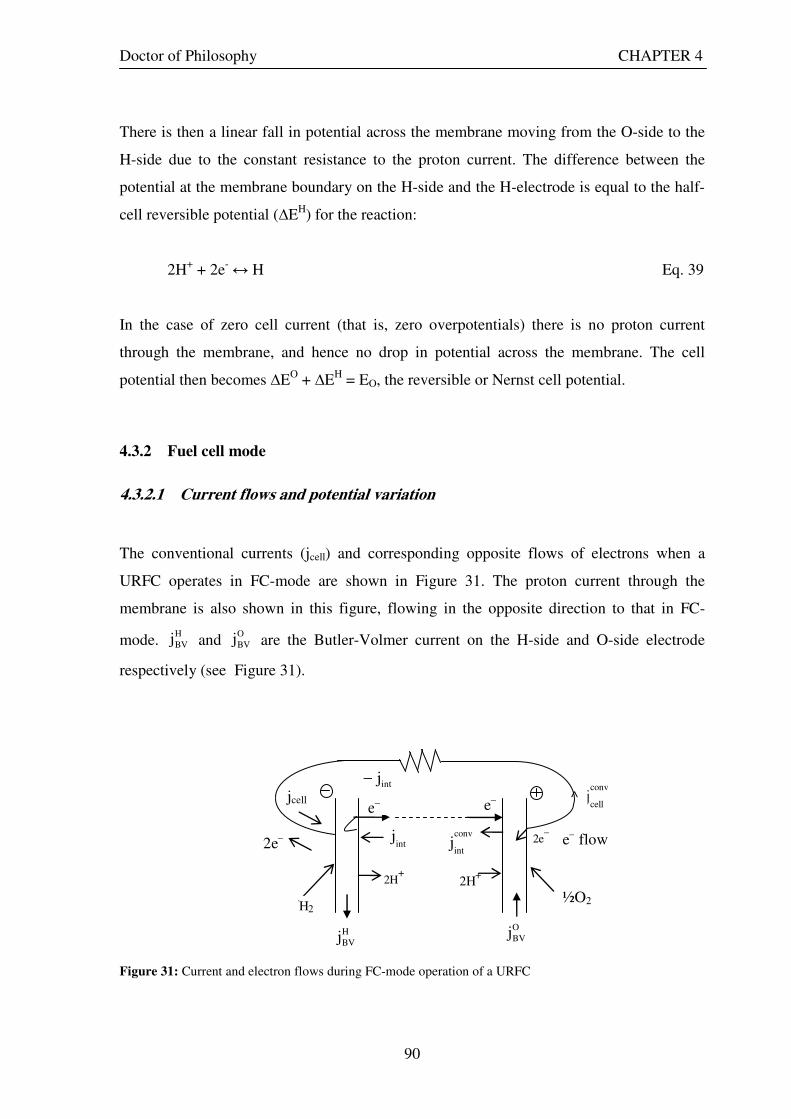
Doctor of Philosophy CHAPTER 4
90
There is then a linear fall in potential across the membrane moving from the O-side to the
H-side due to the constant resistance to the proton current. The difference between the
potential at the membrane boundary on the H-side and the H-electrode is equal to the half-
cell reversible potential (∆EH) for the reaction:
2H+ + 2e- ↔ H Eq. 39
In the case of zero cell current (that is, zero overpotentials) there is no proton current
through the membrane, and hence no drop in potential across the membrane. The cell
potential then becomes ∆EO + ∆EH = EO, the reversible or Nernst cell potential.
4.3.2 Fuel cell mode
4.3.2.1 Current flows and potential variation
The conventional currents (jcell) and corresponding opposite flows of electrons when a
URFC operates in FC-mode are shown in Figure 31. The proton current through the
membrane is also shown in this figure, flowing in the opposite direction to that in FC-
mode. H
BVj and O
BVj are the Butler-Volmer current on the H-side and O-side electrode
respectively (see Figure 31).
Figure 31: Current and electron flows during FC-mode operation of a URFC
jcell
intj
2e–
2H+ 2H
+
conv
intj
intj−
½O2
e– e–
2e–
conv
cellj^
e– flow
H2
O
BVj H
BVj

Doctor of Philosophy CHAPTER 4
91
4.3.2.2 Oxygen-side reaction in FC-mode
The Butler-Volmer equation for the O-side reaction is again Eq. 30, the same as in E-mode:
ηα−−−
αη=
RT
F2)1(exp
RT
F2expjj
OOOOOO
OBV
But now in FC-mode, Oη < 0
Therefore as Oη increases, the second term in equation 30 dominates, and OBVj tends to
ηα−−=
RT
F2)1(expjj
OOOO
OBV Eq. 40
OBVj is negative, consistent with the dominant electrochemical reaction at the O-electrode
generating conventional current that flows out from electrode, that is, consuming electrons
that flow in to the electrode.
It can be noted that as Oα increases, FC-mode performance decreases, and conversely as
Oα decreases, FC-mode performance increases.
4.3.2.3 Hydrogen-side reaction in fuel cell mode
The Butler-Volmer equation for the hydrogen-side reaction in FC mode is once again given
by Eq. 32:
α−η+
αη−−=
RT
F2)1(exp
RT
F2expjj
HHHHHO
HBV
In FC mode, the overpotential Hη is positive (Figure 32), therefore 0He
Hcell
H >φ−φ=η
Therefore as Hη increases in FC-mode, the second term in equation 32 dominates, and
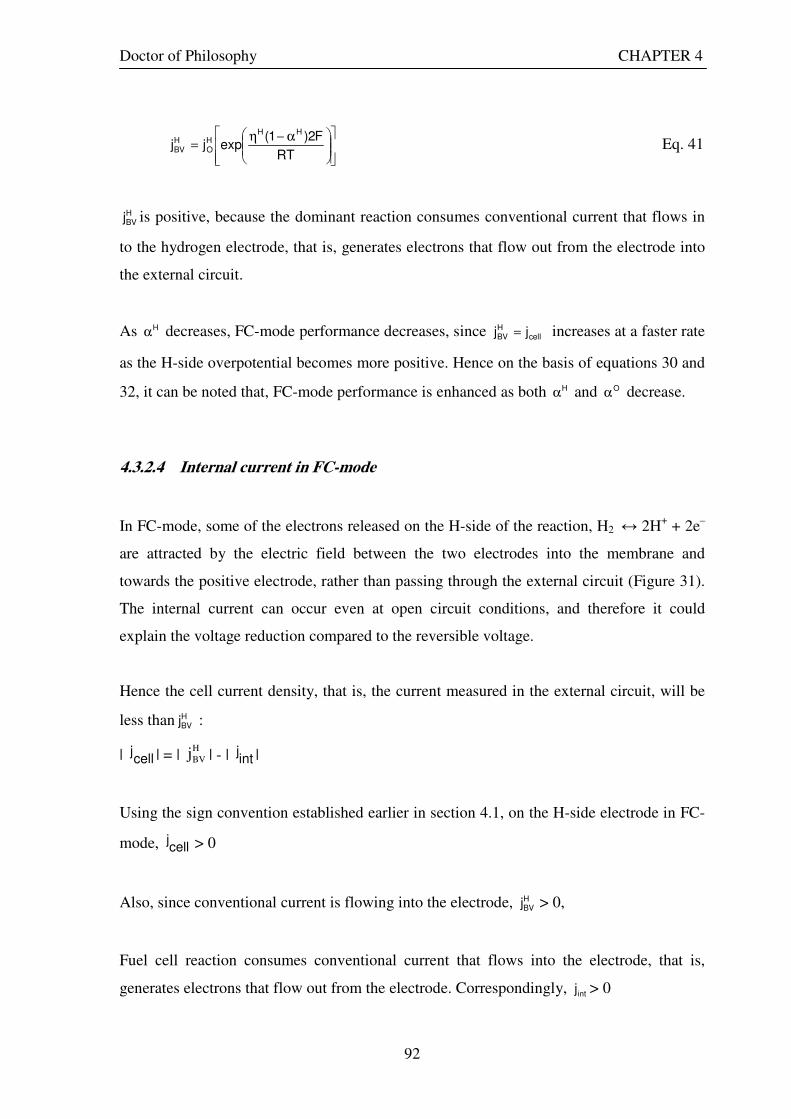
Doctor of Philosophy CHAPTER 4
92
α−η=
RT
F2)1(expjj
HHHO
HBV Eq. 41
HBVj is positive, because the dominant reaction consumes conventional current that flows in
to the hydrogen electrode, that is, generates electrons that flow out from the electrode into
the external circuit.
As Hα decreases, FC-mode performance decreases, since cellHBV jj = increases at a faster rate
as the H-side overpotential becomes more positive. Hence on the basis of equations 30 and
32, it can be noted that, FC-mode performance is enhanced as both Hα and Oα decrease.
4.3.2.4 Internal current in FC-mode
In FC-mode, some of the electrons released on the H-side of the reaction, H2 ↔ 2H+ + 2e–
are attracted by the electric field between the two electrodes into the membrane and
towards the positive electrode, rather than passing through the external circuit (Figure 31).
The internal current can occur even at open circuit conditions, and therefore it could
explain the voltage reduction compared to the reversible voltage.
Hence the cell current density, that is, the current measured in the external circuit, will be
less than HBVj :
| cellj | = |
H
BVj | - | intj |
Using the sign convention established earlier in section 4.1, on the H-side electrode in FC-
mode, cellj
> 0
Also, since conventional current is flowing into the electrode, HBVj > 0,
Fuel cell reaction consumes conventional current that flows into the electrode, that is,
generates electrons that flow out from the electrode. Correspondingly, intj > 0

Doctor of Philosophy CHAPTER 4
93
The conventional current flows in to the electrode and is given by,
cellj = HBVj - intj
On the O-side in FC mode, again
| cellj | =| O
BVj | - | intj |
The electrons taking part in the O-side reaction, 2H+ + ½ O2 + 2e- ↔ H2O are supplied by
both the electron fluxes through the external circuit and across the membrane.
Using the sign convention, on the O-side in FC mode:
cellj < 0,
O
BVj < 0 and intj < 0
Hence, cellj =
O
BVj - intj
4.3.2.5 Butler Volmer equations in FC-mode incorporating internal current
If the effect of internal current is considered then the Butler-Volmer equation is written as,
ηα−−−
αη=−
RT
F2)1(exp
RT
F2expjjj
OOOOO
Ointcell
Eq. 42
The over potential on O-side in FC-mode, Oη < 0 (see Figure 32).
Therefore as Oη increases, the second term in equation 42 dominates, and cellj tends to
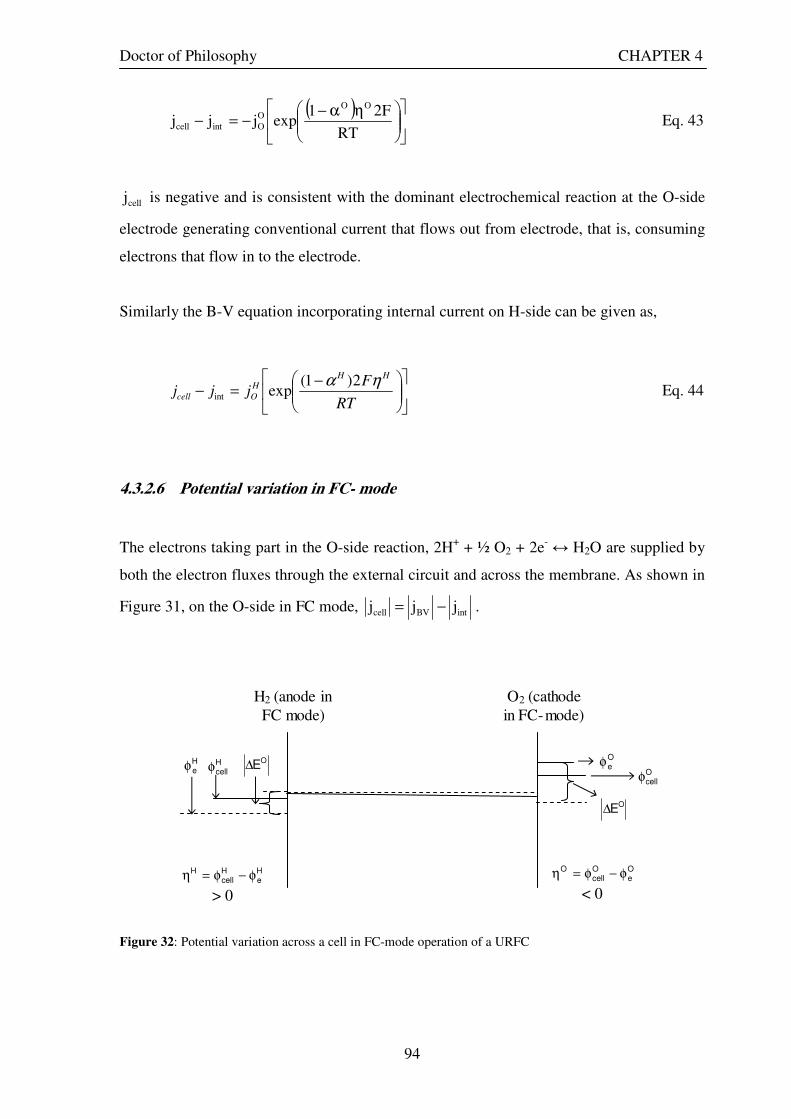
Doctor of Philosophy CHAPTER 4
94
( )
ηα−−=−
RT
F21expjjj
OOOOintcell Eq. 43
cellj is negative and is consistent with the dominant electrochemical reaction at the O-side
electrode generating conventional current that flows out from electrode, that is, consuming
electrons that flow in to the electrode.
Similarly the B-V equation incorporating internal current on H-side can be given as,
−=−
RT
Fjjj
HHH
Ocell
ηα 2)1(expint Eq. 44
4.3.2.6 Potential variation in FC- mode
The electrons taking part in the O-side reaction, 2H+ + ½ O2 + 2e- ↔ H2O are supplied by
both the electron fluxes through the external circuit and across the membrane. As shown in
Figure 31, on the O-side in FC mode, intBVcell jjj −= .
Figure 32: Potential variation across a cell in FC-mode operation of a URFC
H2 (anode in
FC mode)
O2 (cathode
in FC-mode)
Oeφ
OE∆
Ocellφ
Oe
Ocell
O φ−φ=η
< 0
Heφ H
cellφ OE∆
He
Hcell
H φ−φ=η
> 0
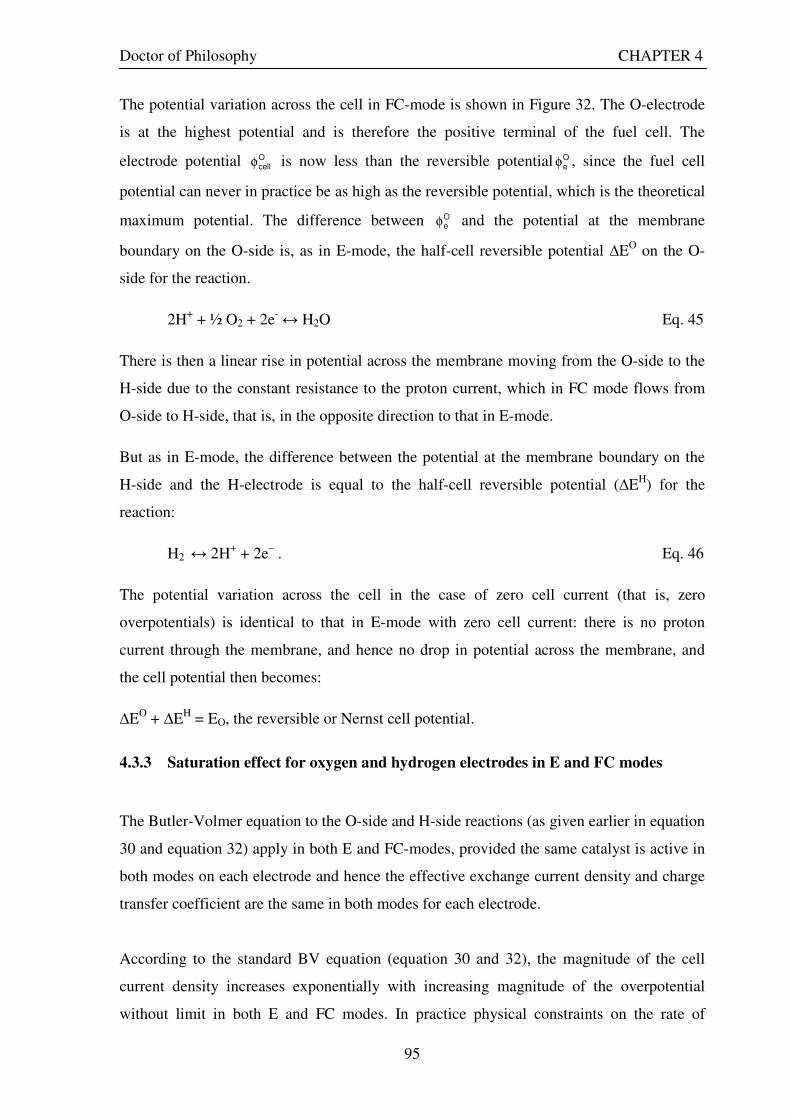
Doctor of Philosophy CHAPTER 4
95
The potential variation across the cell in FC-mode is shown in Figure 32. The O-electrode
is at the highest potential and is therefore the positive terminal of the fuel cell. The
electrode potential Ocellφ is now less than the reversible potential O
eφ , since the fuel cell
potential can never in practice be as high as the reversible potential, which is the theoretical
maximum potential. The difference between Oeφ and the potential at the membrane
boundary on the O-side is, as in E-mode, the half-cell reversible potential ∆EO on the O-
side for the reaction.
2H+ + ½ O2 + 2e- ↔ H2O Eq. 45
There is then a linear rise in potential across the membrane moving from the O-side to the
H-side due to the constant resistance to the proton current, which in FC mode flows from
O-side to H-side, that is, in the opposite direction to that in E-mode.
But as in E-mode, the difference between the potential at the membrane boundary on the
H-side and the H-electrode is equal to the half-cell reversible potential (∆EH) for the
reaction:
H2 ↔ 2H+ + 2e– . Eq. 46
The potential variation across the cell in the case of zero cell current (that is, zero
overpotentials) is identical to that in E-mode with zero cell current: there is no proton
current through the membrane, and hence no drop in potential across the membrane, and
the cell potential then becomes:
∆EO + ∆EH = EO, the reversible or Nernst cell potential.
4.3.3 Saturation effect for oxygen and hydrogen electrodes in E and FC modes
The Butler-Volmer equation to the O-side and H-side reactions (as given earlier in equation
30 and equation 32) apply in both E and FC-modes, provided the same catalyst is active in
both modes on each electrode and hence the effective exchange current density and charge
transfer coefficient are the same in both modes for each electrode.
According to the standard BV equation (equation 30 and 32), the magnitude of the cell
current density increases exponentially with increasing magnitude of the overpotential
without limit in both E and FC modes. In practice physical constraints on the rate of
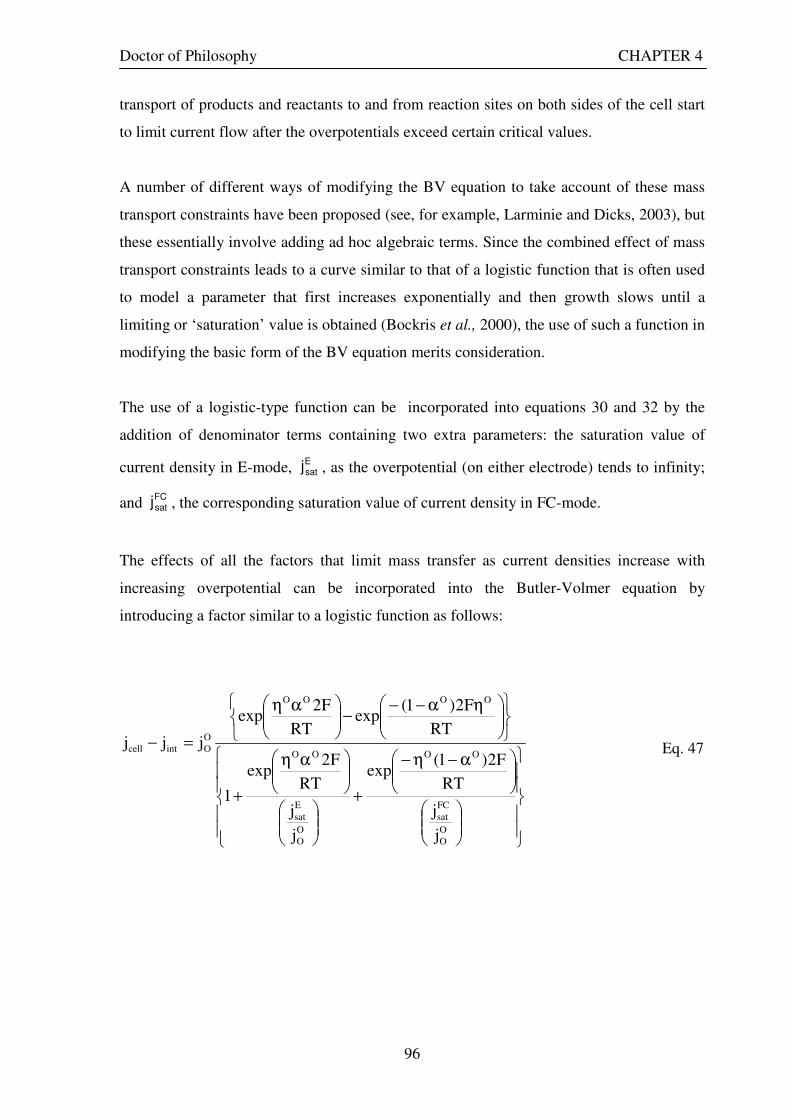
Doctor of Philosophy CHAPTER 4
96
transport of products and reactants to and from reaction sites on both sides of the cell start
to limit current flow after the overpotentials exceed certain critical values.
A number of different ways of modifying the BV equation to take account of these mass
transport constraints have been proposed (see, for example, Larminie and Dicks, 2003), but
these essentially involve adding ad hoc algebraic terms. Since the combined effect of mass
transport constraints leads to a curve similar to that of a logistic function that is often used
to model a parameter that first increases exponentially and then growth slows until a
limiting or ‘saturation’ value is obtained (Bockris et al., 2000), the use of such a function in
modifying the basic form of the BV equation merits consideration.
The use of a logistic-type function can be incorporated into equations 30 and 32 by the
addition of denominator terms containing two extra parameters: the saturation value of
current density in E-mode, Esatj , as the overpotential (on either electrode) tends to infinity;
and FCsatj , the corresponding saturation value of current density in FC-mode.
The effects of all the factors that limit mass transfer as current densities increase with
increasing overpotential can be incorporated into the Butler-Volmer equation by
introducing a factor similar to a logistic function as follows:
α−η−
+
αη
+
ηα−−−
αη
=−
O
O
FC
sat
OO
O
O
E
sat
OO
OOOO
O
Ointcell
j
j
RT
F2)1(exp
j
j
RT
F2exp
1
RT
F2)1(exp
RT
F2exp
jjj Eq. 47
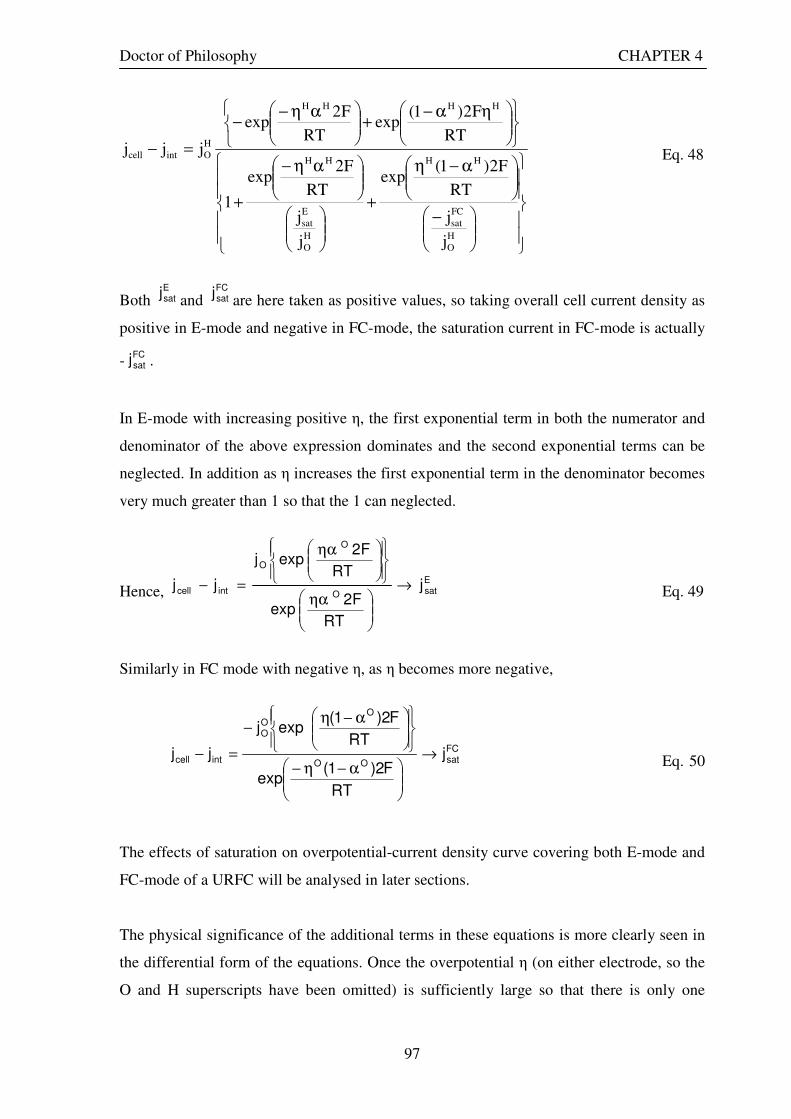
Doctor of Philosophy CHAPTER 4
97
−
α−η
+
αη−
+
ηα−+
αη−−
=−
H
O
FC
sat
HH
H
O
E
sat
HH
HHHH
H
Ointcell
j
j
RT
F2)1(exp
j
j
RT
F2exp
1
RT
F2)1(exp
RT
F2exp
jjj Eq. 48
Both Esatj
and FCsatj
are here taken as positive values, so taking overall cell current density as
positive in E-mode and negative in FC-mode, the saturation current in FC-mode is actually
-FCsatj .
In E-mode with increasing positive η, the first exponential term in both the numerator and
denominator of the above expression dominates and the second exponential terms can be
neglected. In addition as η increases the first exponential term in the denominator becomes
very much greater than 1 so that the 1 can neglected.
Hence, EsatO
O
O
intcell j
RT
F2exp
RT
F2expj
jj →
ηα
ηα
=− Eq. 49
Similarly in FC mode with negative η, as η becomes more negative,
FCsatOO
OOO
intcell j
RT
F2)1(exp
RT
F2)1(expj
jj →
α−η−
α−η−
=− Eq. 50
The effects of saturation on overpotential-current density curve covering both E-mode and
FC-mode of a URFC will be analysed in later sections.
The physical significance of the additional terms in these equations is more clearly seen in
the differential form of the equations. Once the overpotential η (on either electrode, so the
O and H superscripts have been omitted) is sufficiently large so that there is only one
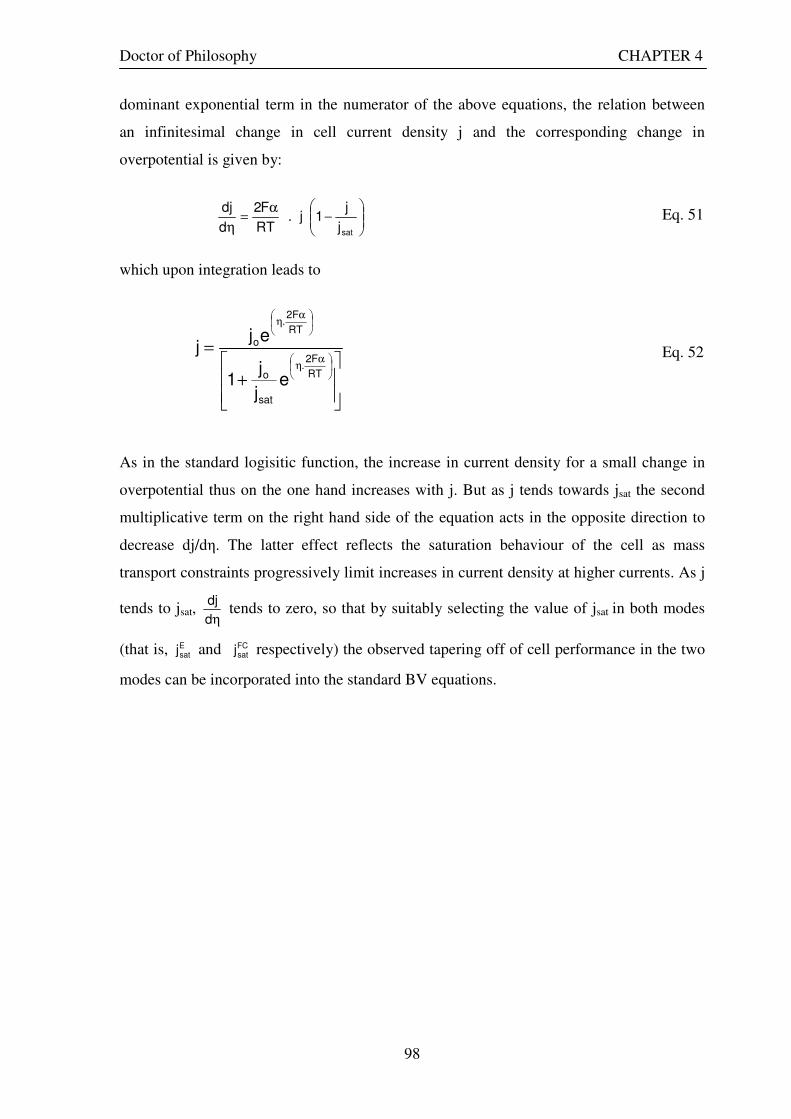
Doctor of Philosophy CHAPTER 4
98
dominant exponential term in the numerator of the above equations, the relation between
an infinitesimal change in cell current density j and the corresponding change in
overpotential is given by:
Eq. 51
which upon integration leads to
Eq. 52
As in the standard logisitic function, the increase in current density for a small change in
overpotential thus on the one hand increases with j. But as j tends towards jsat the second
multiplicative term on the right hand side of the equation acts in the opposite direction to
decrease dj/dη. The latter effect reflects the saturation behaviour of the cell as mass
transport constraints progressively limit increases in current density at higher currents. As j
tends to jsat, ηd
dj tends to zero, so that by suitably selecting the value of jsat in both modes
(that is, Esatj and FC
satj respectively) the observed tapering off of cell performance in the two
modes can be incorporated into the standard BV equations.
−
α=
η satj
j1j.
RT
F2
d
dj
+
=
αη
αη
RT
F2.
sat
o
RT
F2.
o
ej
j1
ejj
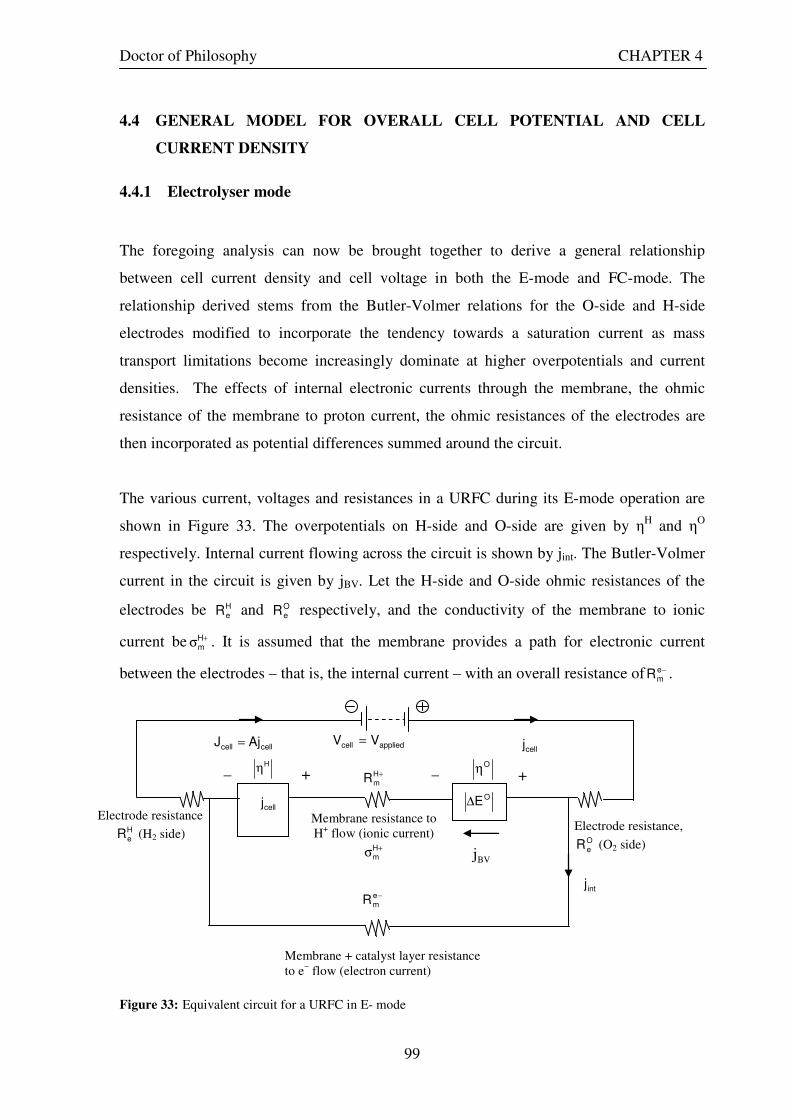
Doctor of Philosophy CHAPTER 4
99
4.4 GENERAL MODEL FOR OVERALL CELL POTENTIAL AND CELL
CURRENT DENSITY
4.4.1 Electrolyser mode
The foregoing analysis can now be brought together to derive a general relationship
between cell current density and cell voltage in both the E-mode and FC-mode. The
relationship derived stems from the Butler-Volmer relations for the O-side and H-side
electrodes modified to incorporate the tendency towards a saturation current as mass
transport limitations become increasingly dominate at higher overpotentials and current
densities. The effects of internal electronic currents through the membrane, the ohmic
resistance of the membrane to proton current, the ohmic resistances of the electrodes are
then incorporated as potential differences summed around the circuit.
The various current, voltages and resistances in a URFC during its E-mode operation are
shown in Figure 33. The overpotentials on H-side and O-side are given by ηH and ηO
respectively. Internal current flowing across the circuit is shown by jint. The Butler-Volmer
current in the circuit is given by jBV. Let the H-side and O-side ohmic resistances of the
electrodes be HeR and O
eR respectively, and the conductivity of the membrane to ionic
current be +σHm . It is assumed that the membrane provides a path for electronic current
between the electrodes – that is, the internal current – with an overall resistance of −emR .
Figure 33: Equivalent circuit for a URFC in E- mode
cellj
+HmR
−emR
Hη
OE∆
Membrane + catalyst layer resistance to e− flow (electron current)
Membrane resistance to H+ flow (ionic current)
+σ
Hm
cellcell AjJ = cellj appliedcell VV =
+ + – –
Electrode resistance HeR (H2 side)
Electrode resistance, OeR (O2 side)
intj
BVj
Oη

Doctor of Philosophy CHAPTER 4
100
As a result of the parallel paths for current of the two kinds through the cell, it is clear that
the relationship between the absolute values of the currents is:
intBVcell jjj +=
If A is the effective cell area, then intBVcell jAjAjA +=
intBVcell jjj +=∴
Assume, +<<+ Hm
He
Oe RRR so that the potential drop across the electrode can be neglected in
calculating jint from the applied potential, Vcell.
Hence, −
==e
m
cellintint
R
Vj.Aj
If −σem is the electrical conductivity of the membrane to electron current,
−
−
ρ=σ
em
em
1
where, −ρem is the resistivity of the membrane, that is, the resistance per unit area per unit
length.
and −−ρ⋅=
em
em
A
LR where L is the thickness of the membrane.
Thus, −−⋅=ρ
em
em R
L
A
and −
− ⋅=σem
em
R
1
A
L
Therefore cell
em
int VL
j ⋅σ
=−
Eq. 53
Further, A
Jj BVBV =

Doctor of Philosophy CHAPTER 4
101
and the potential across the membrane, +σ
=ηHm
BVm
Lj
Summing the potentials around the circuit,
( ) ( ) OO
O
Hm
intcellHO
HOe
Hecellcell E
LjjERRjAV ∆+η+
σ−+∆+η++=
+ Eq. 54
From our earlier analysis in section 4.3.3,
−
α−η−
+
αη
+
ηα−−−
αη
=
OO
FCsat
OO
OO
Esat
OO
OOOO
OO
OBV
j
j
RT
F2)1(exp
j
j
RT
F2exp
1
RT
F2)1(exp
RT
F2exp
jj Eq. 55
and intcellOBV jjj −=
Hence,
−
α−η−
+
αη
+
ηα−−−
αη
=−
OO
FCsat
OO
OO
Esat
OO
OOOO
OOintcell
j
j
RT
F2)1(exp
j
j
RT
F2exp
1
RT
F2)1(exp
RT
F2exp
jjj Eq. 56
This can be written as )T,,(fj
jj OO
O
O
intcell αη=−
Thus, a correction for saturation effects into the definition of the function f has been
incorporated.
Hence, 1f − can be defined such that
α
−=η − T,,
j
jjf O
OO
intcell1O Eq. 57

Doctor of Philosophy CHAPTER 4
102
Similarly,
α
−=η − T,,
j
jjf H
HO
intcell1H
Eq. 58
Also, OO
HOO EEE ∆+∆=
Hence, equation 54 can be rewritten as follows –
( ) ( ) OO
OO
intcell1
Hm
intcellH
HO
intcell1Oe
Hecellcell ET,,
j
jjf
LjjT,,
j
jjfRRjAV +
α
−+
σ−+
α
−++= −
+
− Eq. 59
But substituting for intj in terms of cellV from equation 53 and writing, ( )Oe
Hee RR.A +=γ i.e.,
the total electrode resistance multiplied by the effective unit cell area, the general
relationship between jcell and Vcell in E-mode is:
+
−
−
−
−
−
σ
⋅σ−+
α
⋅σ−
+
α
⋅σ−
+γ⋅+=H
m
cell
e
mcell
O
O
O
cell
e
mcell
1H
H
O
cell
e
mcell
1
ecellOcell
L
L
VjT,,
j
L
Vj
fT,,j
L
Vj
fjEV Eq. 60
4.4.2 Fuel cell mode
The conventional currents, electron flows, and membrane proton current when the PEM
cell operates in FC-mode are shown in Figure 34. The applied resistance across the cell in
FC-mode is also shown. The cell current in the circuit is given by jcell. The H-side and O-
side ohmic resistances of the electrodes are given by HeR and O
eR respectively. +σHm is the
conductivity of the membrane to ionic current. The overpotentials on H-side and O-side
are given by ηH and ηO respectively. Internal current flowing across the circuit is shown by
jint. The Butler-Volmer current in the circuit is given by jBV. It is assumed that the
membrane provides a path for electronic current between the electrodes – that is, the
internal current – with an overall resistance of −emR similar to E-mode.
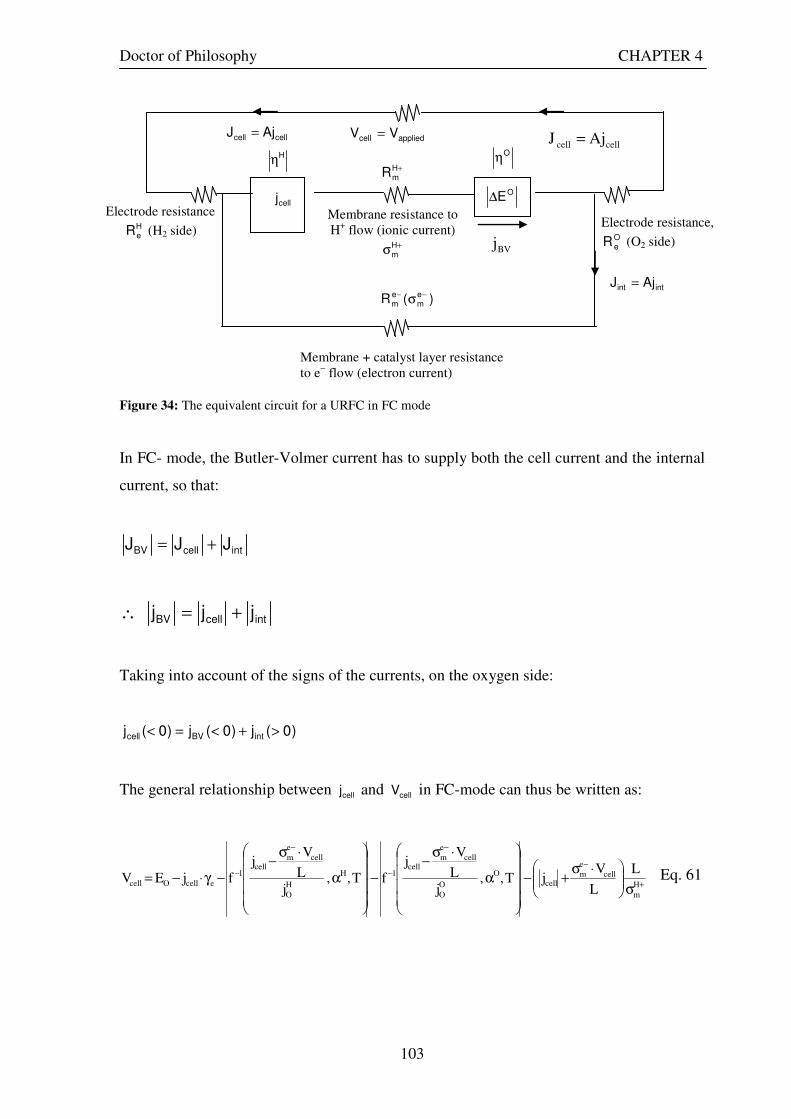
Doctor of Philosophy CHAPTER 4
103
Figure 34: The equivalent circuit for a URFC in FC mode
In FC- mode, the Butler-Volmer current has to supply both the cell current and the internal
current, so that:
intcellBV JJJ +=
intcellBV jjj +=∴
Taking into account of the signs of the currents, on the oxygen side:
)0(j)0(j)0(j intBVcell >+<=<
The general relationship between cellj and cellV in FC-mode can thus be written as:
+
−
−
−
−
−
σ
⋅σ+−
α
⋅σ−
−
α
⋅σ−
−γ⋅−=H
m
cell
e
mcell
O
O
O
cell
e
mcell
1H
H
O
cell
e
mcell
1
ecellOcell
L
L
VjT,,
jL
Vj
fT,,j
L
Vj
fjEV Eq. 61
cellj
+HmR
)(R em
em
−− σ
OE∆
Membrane + catalyst layer resistance to e− flow (electron current)
Membrane resistance to H+ flow (ionic current)
+σHm
cellcell AjJ = cellcell AjJ = appliedcell VV =
Electrode resistance HeR (H2 side)
Electrode resistance, OeR (O2 side)
intint AjJ =
Oη H
η
BVj
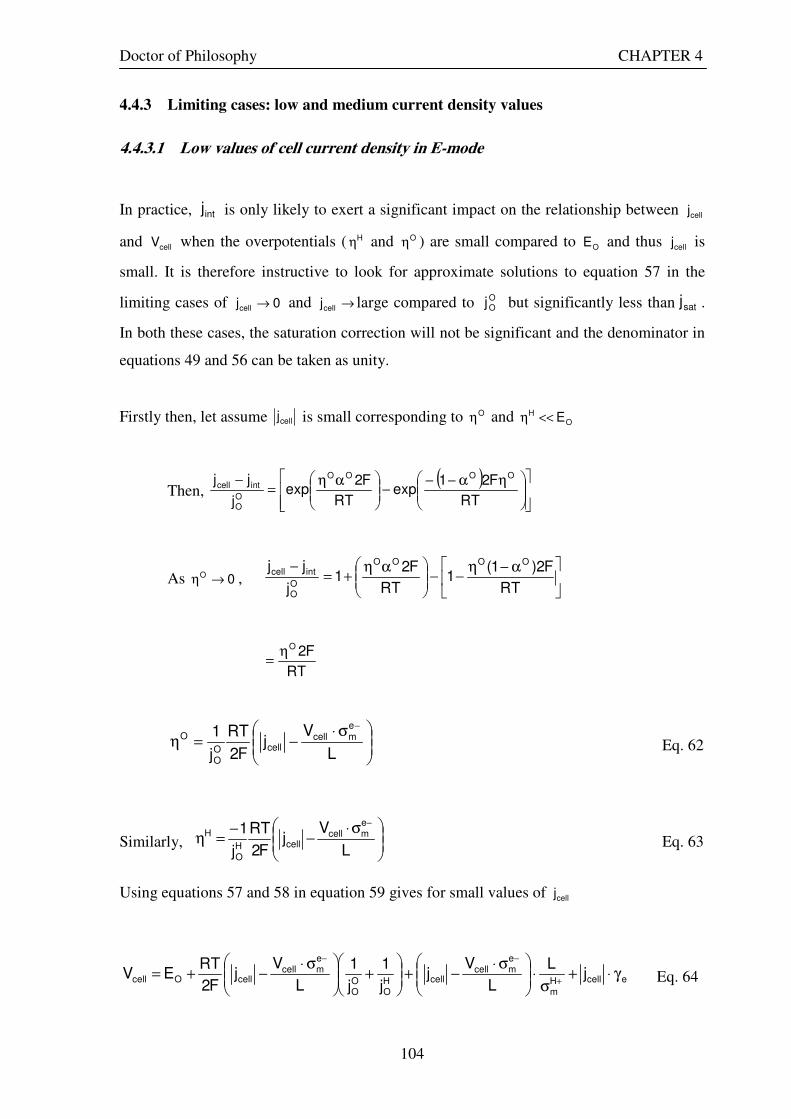
Doctor of Philosophy CHAPTER 4
104
4.4.3 Limiting cases: low and medium current density values
4.4.3.1 Low values of cell current density in E-mode
In practice, intj is only likely to exert a significant impact on the relationship between cellj
and cellV when the overpotentials ( Hη and Oη ) are small compared to OE and thus cellj is
small. It is therefore instructive to look for approximate solutions to equation 57 in the
limiting cases of 0jcell → and →cellj large compared to OOj but significantly less than satj .
In both these cases, the saturation correction will not be significant and the denominator in
equations 49 and 56 can be taken as unity.
Firstly then, let assume cellj is small corresponding to Oη and OH E<<η
Then, ( )
ηα−−−
αη=
−
RT
F21exp
RT
F2exp
j
jj OOOO
OO
intcell
As 0O →η ,
α−η−−
αη+=
−
RT
F2)1(1
RT
F21
j
jj OOOO
OO
intcell
RT
F2Oη=
σ⋅−=η
−
L
Vj
F2
RT
j
1 emcell
cellOO
O Eq. 62
Similarly,
σ⋅−
−=η
−
L
Vj
F2
RT
j
1emcell
cellHO
H Eq. 63
Using equations 57 and 58 in equation 59 gives for small values of cellj
ecellHm
emcell
cellHO
OO
emcell
cellOcell jL
L
Vj
j
1
j
1
L
Vj
F2
RTEV γ⋅+
σ⋅
σ⋅−+
+
σ⋅−+=
+
−−
Eq. 64

Doctor of Philosophy CHAPTER 4
105
γ+
σ+
++=
σ
σ+
+
σ⋅+
++
−−
eHm
HO
OO
cellOHm
em
HO
OO
em
cell
L
j
1
j
1
F2
RTjE
j
1
j
1
LF2
RT1V Eq. 65
Therefore for the limiting case of small values for cellj and correspondingly low
overpotentials, the relationship between jcell and Vcell in E-mode is given by:
σ
σ+
+
σ⋅+
γ+
σ+
+⋅+
=
+
−−
+
Hm
em
HO
OO
em
eHm
HO
OO
cellO
cell
j
1
j
1
LF2
RT1
L
j
1
j
1
F2
RTjE
V Eq. 66
4.4.3.2 Low values of cell current density in FC mode
Along the similar lines of discussion as outlined in section 4.4.3.1, for limiting cases of
0,,j OHcell →ηη in FC-mode,
ηα−−−
αη=
⋅σ−
−
RT
F2)1(exp
RT
F2expj
L
Vj
OOOOOO
cellem
cell Eq. 67
,OO →η RT
F2j
L
Vj OO
Ocell
em
cell η=
⋅σ−
−
Eq. 68
σ⋅−=η
−
L
Vj
F2
RT
j
1 emcell
cellOO
O Eq. 69
σ⋅+=η=
−−
L
Vj
F2
RT
j
1f
emcell
cellOO
O1 Eq. 70

Doctor of Philosophy CHAPTER 4
106
σ⋅+=η
−
L
Vj
F2
RT
j
1 emcell
cellHO
H Eq. 71
Using equations 62 and 63 in equation 61 gives for small values of cellj ,
ecellH
m
e
mcellcellH
O
O
O
e
mcellcellOcell j
L
L
Vj
j
1
j
1
L
Vj
F2
RTEV γ⋅−
σ⋅
σ⋅−−
+
σ⋅+−=
+
−−
Eq. 72
γ+
σ+
+−=
σ
σ+
+
σ⋅+∴
++
−−
eHm
HO
OO
cellOHm
em
HO
OO
mcell
L
j
1
j
1
F2
RTjE
j
1
j
1
LF2
RT1V
e
Eq. 73
σ
σ+
+
σ⋅+
γ+
σ+
+⋅−
=∴
+
−−
+
Hm
em
HO
OO
em
eHm
HO
OO
cellO
cell
j
1
j
1
LF2
RT1
L
j
1
j
1
F2
RTjE
V Eq. 74
When 0jcell = ,
σ
σ+
+
σ⋅+
=
+
−−
Hm
em
HO
OO
m
Ocell
j
1
j
1
LF2
RT1
EV
e Eq. 75
4.5 RELATIONSHIP BETWEEN O-SIDE AND H-SIDE OVERPOTENTIALS
4.5.1 Analysis
The relationships between over potentials on the H-side and O-sides in E and FC modes are
investigated in this section. The following discussion is in relation to operating a URFC
within the intermediate current density range and hence the effects of saturation current are
not considered. The starting point again will be the Butler-Volmer relationship as given
earlier in equations 30 and 32.

Doctor of Philosophy CHAPTER 4
107
ηα−−−
αη=
RT
F2)1(exp
RT
F2expjj
OOOOOO
OBV
α−η+
αη−−=
RT
F2)1(exp
RT
F2expjj
HHHHHO
HBV
A general relationship between Hη and Oη , which involves no approximation as long as
internal current can be neglected, flows from the fact that OBVj must be equal to
HBVj ,
since both are equal to cellj . This relationship can be seen directly from the current flows in
Figure 29 and Figure 31.
Since jcell changes sign between the O and H sides, jBV also behaves in the same way and
the relationship between the two Butler-Volmer current densities is:
OBVj = - H
BVj , that is, for the intermediate range of current densities, ie cellj << jEsat and jFC
sat
so that the saturation terms can be neglected:
α−η+
αη−−−=
ηα−−−
αη
RT
F2)1(exp
RT
F2expj
RT
F2)1(exp
RT
F2expj
HHHHHO
OOOOOO Eq. 76
For the general case of any value of Oα and Hα , equation 76 can be solved for Oη given
Hη . If Hη is known, the right hand side of this equation simply becomes a number.
Let RT
F2K = , then
RHS = ( )K)1(K
OO
Ho
HHHH
eej
j α−ηαη− +−−
= A( Hη ) say
Therefore equation 76 becomes,
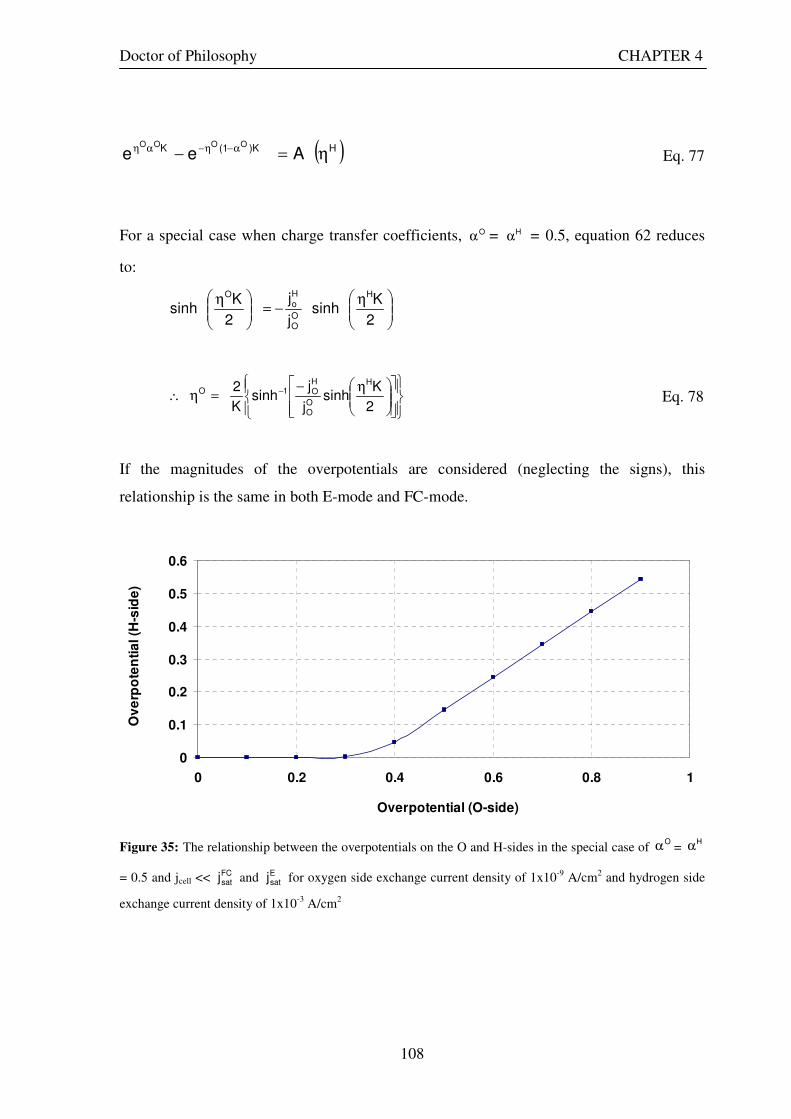
Doctor of Philosophy CHAPTER 4
108
( )HK)1(K AeeOOOO
η=− α−η−αη Eq. 77
For a special case when charge transfer coefficients, Oα = Hα = 0.5, equation 62 reduces
to:
η−=
η
2
Ksinh
j
j
2
Ksinh
H
OO
Ho
O
η−=η∴ −
2
Ksinh
j
jsinh
K
2 H
OO
HO1O
Eq. 78
If the magnitudes of the overpotentials are considered (neglecting the signs), this
relationship is the same in both E-mode and FC-mode.
0
0.1
0.2
0.3
0.4
0.5
0.6
0 0.2 0.4 0.6 0.8 1
Overpotential (O-side)
Ov
erp
ote
nti
al (H
-sid
e)
Figure 35: The relationship between the overpotentials on the O and H-sides in the special case of Oα =
Hα
= 0.5 and jcell << FCsatj and E
satj for oxygen side exchange current density of 1x10⁻⁹ A/cm2 and hydrogen side
exchange current density of 1x10⁻³ A/cm2
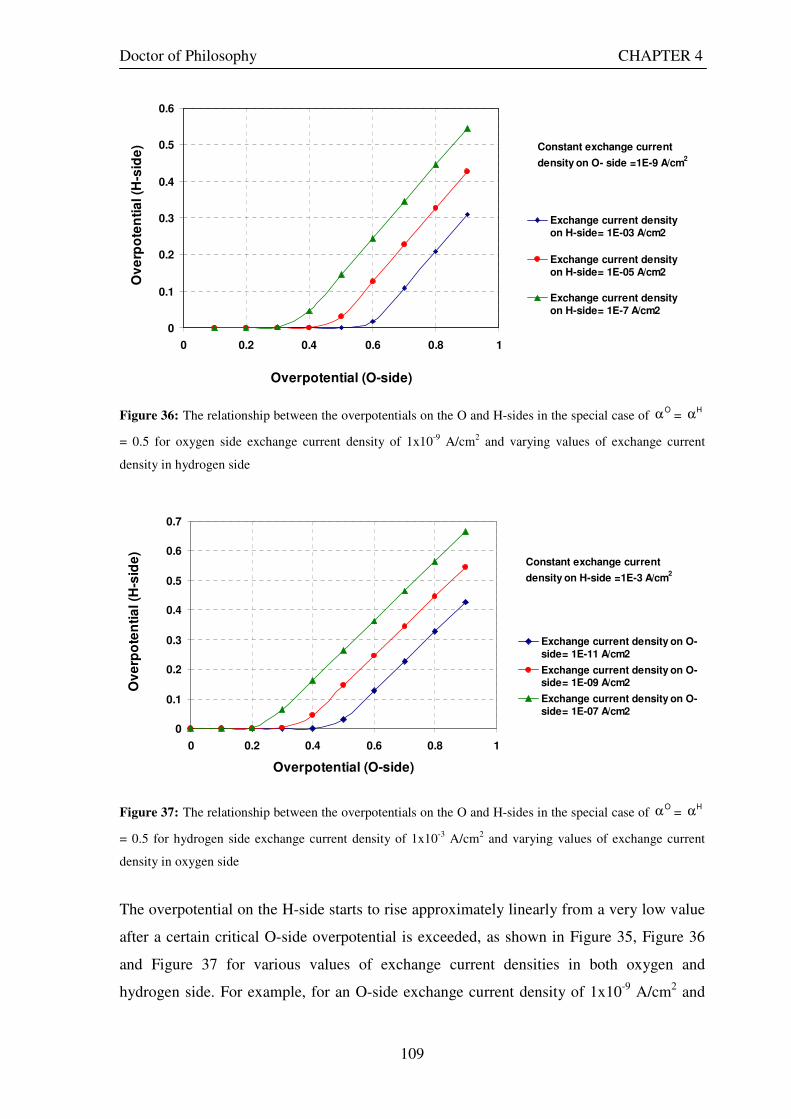
Doctor of Philosophy CHAPTER 4
109
0
0.1
0.2
0.3
0.4
0.5
0.6
0 0.2 0.4 0.6 0.8 1
Overpotential (O-side)
Ov
erp
ote
nti
al (H
-sid
e)
Exchange current densityon H-side= 1E-03 A/cm2
Exchange current densityon H-side= 1E-05 A/cm2
Exchange current densityon H-side= 1E-7 A/cm2
Constant exchange current
density on O- side =1E-9 A/cm2
Figure 36: The relationship between the overpotentials on the O and H-sides in the special case of Oα =
Hα
= 0.5 for oxygen side exchange current density of 1x10⁻⁹ A/cm2 and varying values of exchange current
density in hydrogen side
0
0.1
0.2
0.3
0.4
0.5
0.6
0.7
0 0.2 0.4 0.6 0.8 1
Overpotential (O-side)
Ov
erp
ote
nti
al (H
-sid
e)
Exchange current density on O-side= 1E-11 A/cm2
Exchange current density on O-side= 1E-09 A/cm2
Exchange current density on O-side= 1E-07 A/cm2
Constant exchange current
density on H-side =1E-3 A/cm2
Figure 37: The relationship between the overpotentials on the O and H-sides in the special case of Oα =
Hα
= 0.5 for hydrogen side exchange current density of 1x10⁻³ A/cm2 and varying values of exchange current
density in oxygen side
The overpotential on the H-side starts to rise approximately linearly from a very low value
after a certain critical O-side overpotential is exceeded, as shown in Figure 35, Figure 36
and Figure 37 for various values of exchange current densities in both oxygen and
hydrogen side. For example, for an O-side exchange current density of 1x10⁻⁹ A/cm2 and

Doctor of Philosophy CHAPTER 4
110
H-side exchange current density of 1x10⁻³ A/cm2, the H-side overpotential remains very
small until the O-side overpotential reaches 0.4 V, after which point it starts to rise linearly.
So that when the O-side overpotential is 0.8 V the H-side overpotential has risen to 0.4 V.
Interestingly the latter is still only half the O-side overpotential but is not a negligible
quantity.
4.5.2 Limiting cases
4.5.2.1 Small values of cell current density
For very small values of Oη and Hη , however, a simple relationship exists between Oη and
Hη that also holds in both modes. Expanding the exponentials on both sides of equation 76
to terms that are first order in the overpotentials gives:
α−η
−−αη
+−=
α−η
−−αη
+RT
F2)1(1
RT
F21j
RT
F2)1(1
RT
F21j
HHHHHO
OOOOOO Eq. 79
α−η++
αη−−−=η
RT
F2)1(1
RT
F21j
RT
F2j
HHHHHO
OOO Eq. 80
RT
F2j
RT
F2j
HHO
OOO
η−=η Eq. 81
OO
HO
H
O
j
j−=
η
η∴ Eq. 82
i.e., 1j
jOO
HO
H
O
>>=η
η
Also, HO
OO jj << and hence,
Hη < < Oη in accordance with experimental measurement.
The relationship between the small values of overpotentials on the O and H-sides in the
special case of Oα and
Hα both equal to 0.5 is as shown in Figure 38. The magnitude of
the overpotential on H-side is very small compared to the overpotential on O-side.
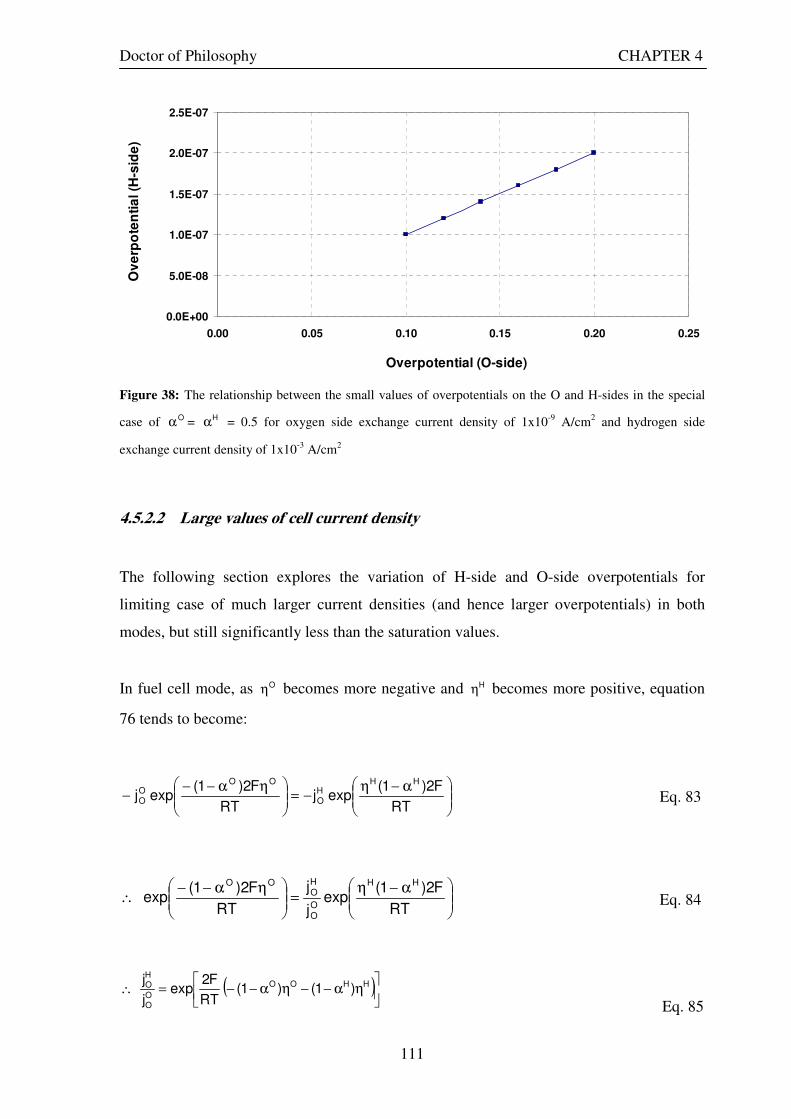
Doctor of Philosophy CHAPTER 4
111
0.0E+00
5.0E-08
1.0E-07
1.5E-07
2.0E-07
2.5E-07
0.00 0.05 0.10 0.15 0.20 0.25
Overpotential (O-side)
Ov
erp
ote
nti
al (H
-sid
e)
Figure 38: The relationship between the small values of overpotentials on the O and H-sides in the special
case of Oα = Hα = 0.5 for oxygen side exchange current density of 1x10⁻⁹ A/cm2 and hydrogen side
exchange current density of 1x10⁻³ A/cm2
4.5.2.2 Large values of cell current density
The following section explores the variation of H-side and O-side overpotentials for
limiting case of much larger current densities (and hence larger overpotentials) in both
modes, but still significantly less than the saturation values.
In fuel cell mode, as Oη becomes more negative and Hη becomes more positive, equation
76 tends to become:
α−η−=
ηα−−−
RT
F2)1(expj
RT
F2)1(expj
HHHO
OOOO Eq. 83
α−η=
ηα−−∴
RT
F2)1(exp
j
j
RT
F2)1(exp
HH
OO
HO
OO
Eq. 84
( )
ηα−−ηα−−=∴ HHOO
OO
HO )1()1(
RT
F2exp
j
j
Eq. 85

Doctor of Philosophy CHAPTER 4
112
=ηα−−ηα−−∴
OO
HOHHOO
j
jln
F2
RT)1()1( Eq. 86
−=ηα−+ηα−∴
OO
HOHHOO
j
jln
F2
RT)1()1( Eq. 87
HH
OO
HOOO )1(j
jln
F2
RT)1( ηα−−
−=ηα−∴ Eq. 88
For 0O <η , 0H >η , 1, HO <αα and 0j
jln
OO
HO >
( ) HH
OO
HOOO )1(j
jln
F2
RT)1( ηα−−
−=η−α−∴ Eq. 89
ηα−+
α−=η∴
HH
O
H
O
O )1(j
jln
F2
RT
)1(
1 Eq. 90
Similarly, )1(
j
jln
F2
RT)1(
H
O
O
H
OOO
H
α−
−ηα−
=η Eq. 91
The relationship between the values of overpotentials on the O and H-sides for large values
of cell current densities (0.8 -1A/cm2) in the special case of Oα and
Hα both equal to 0.5
is as shown in Figure 39. The magnitude of the overpotential on H-side tends to become
significant compared to the overpotential on O-side for large values of current densities.
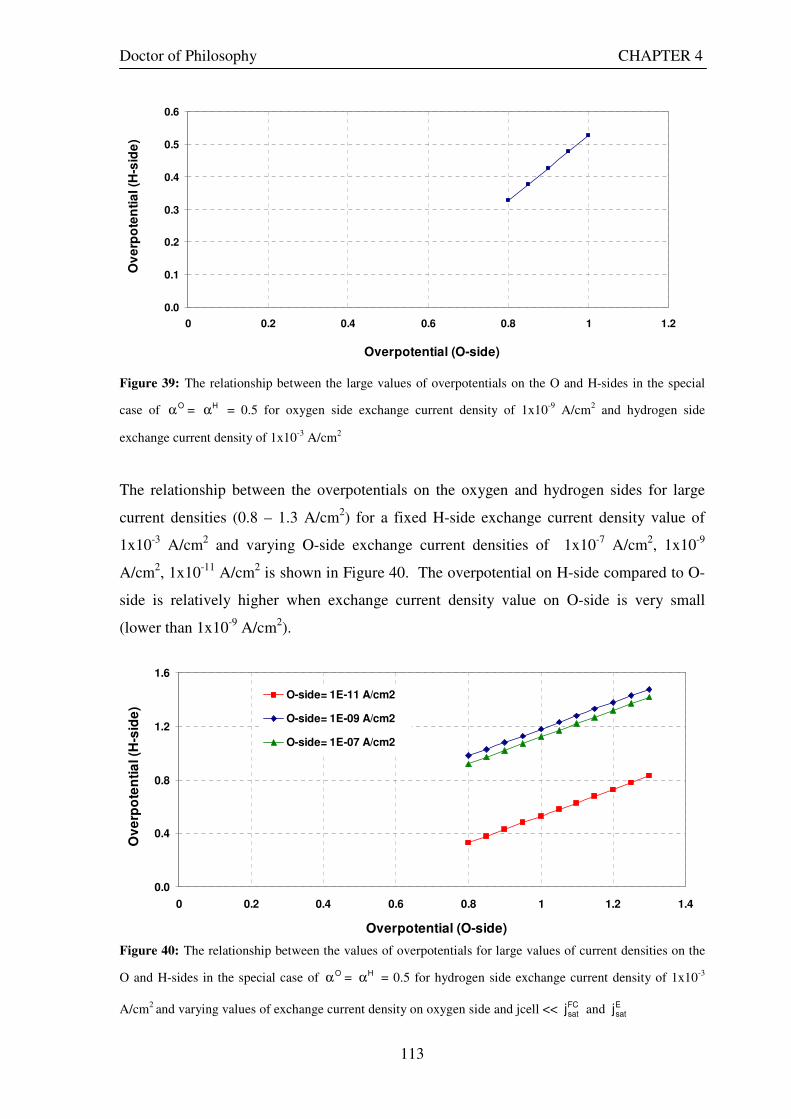
Doctor of Philosophy CHAPTER 4
113
0.0
0.1
0.2
0.3
0.4
0.5
0.6
0 0.2 0.4 0.6 0.8 1 1.2
Overpotential (O-side)
Ov
erp
ote
nti
al (H
-sid
e)
Figure 39: The relationship between the large values of overpotentials on the O and H-sides in the special
case of Oα = Hα = 0.5 for oxygen side exchange current density of 1x10⁻⁹ A/cm2 and hydrogen side
exchange current density of 1x10⁻³ A/cm2
The relationship between the overpotentials on the oxygen and hydrogen sides for large
current densities (0.8 – 1.3 A/cm2) for a fixed H-side exchange current density value of
1x10⁻³ A/cm2 and varying O-side exchange current densities of 1x10⁻⁷ A/cm2, 1x10⁻⁹
A/cm2, 1x10-11 A/cm2 is shown in Figure 40. The overpotential on H-side compared to O-
side is relatively higher when exchange current density value on O-side is very small
(lower than 1x10⁻⁹ A/cm2).
0.0
0.4
0.8
1.2
1.6
0 0.2 0.4 0.6 0.8 1 1.2 1.4
Overpotential (O-side)
Ov
erp
ote
nti
al (H
-sid
e)
O-side= 1E-11 A/cm2
O-side= 1E-09 A/cm2
O-side= 1E-07 A/cm2
Figure 40: The relationship between the values of overpotentials for large values of current densities on the
O and H-sides in the special case of Oα = Hα = 0.5 for hydrogen side exchange current density of 1x10⁻³
A/cm2 and varying values of exchange current density on oxygen side and jcell << FCsatj and E
satj
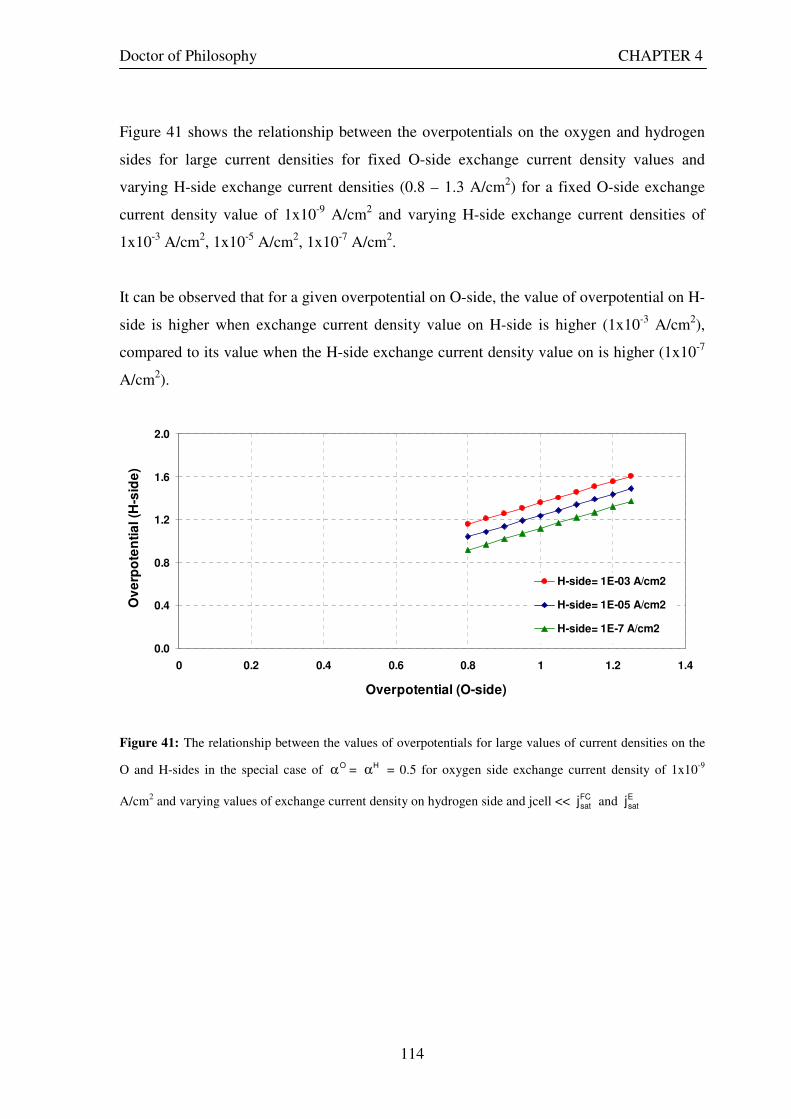
Doctor of Philosophy CHAPTER 4
114
Figure 41 shows the relationship between the overpotentials on the oxygen and hydrogen
sides for large current densities for fixed O-side exchange current density values and
varying H-side exchange current densities (0.8 – 1.3 A/cm2) for a fixed O-side exchange
current density value of 1x10⁻⁹ A/cm2 and varying H-side exchange current densities of
1x10⁻³ A/cm2, 1x10⁻⁵ A/cm2, 1x10⁻⁷ A/cm2.
It can be observed that for a given overpotential on O-side, the value of overpotential on H-
side is higher when exchange current density value on H-side is higher (1x10⁻³ A/cm2),
compared to its value when the H-side exchange current density value on is higher (1x10⁻⁷
A/cm2).
0.0
0.4
0.8
1.2
1.6
2.0
0 0.2 0.4 0.6 0.8 1 1.2 1.4
Overpotential (O-side)
Ov
erp
ote
nti
al (H
-sid
e)
H-side= 1E-03 A/cm2
H-side= 1E-05 A/cm2
H-side= 1E-7 A/cm2
Figure 41: The relationship between the values of overpotentials for large values of current densities on the
O and H-sides in the special case of Oα = Hα = 0.5 for oxygen side exchange current density of 1x10⁻⁹
A/cm2 and varying values of exchange current density on hydrogen side and jcell << FCsatj and E
satj
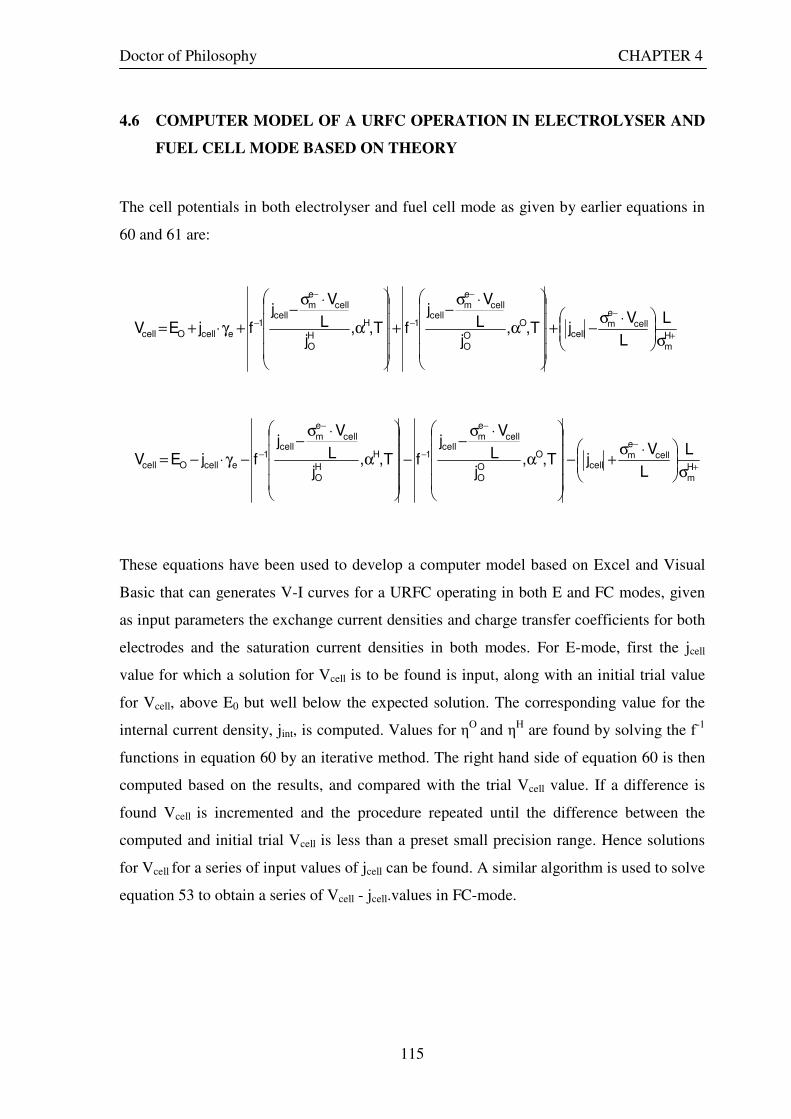
Doctor of Philosophy CHAPTER 4
115
4.6 COMPUTER MODEL OF A URFC OPERATION IN ELECTROLYSER AND
FUEL CELL MODE BASED ON THEORY
The cell potentials in both electrolyser and fuel cell mode as given by earlier equations in
60 and 61 are:
These equations have been used to develop a computer model based on Excel and Visual
Basic that can generates V-I curves for a URFC operating in both E and FC modes, given
as input parameters the exchange current densities and charge transfer coefficients for both
electrodes and the saturation current densities in both modes. For E-mode, first the jcell
value for which a solution for Vcell is to be found is input, along with an initial trial value
for Vcell, above E0 but well below the expected solution. The corresponding value for the
internal current density, jint, is computed. Values for ηO and ηH are found by solving the f-1
functions in equation 60 by an iterative method. The right hand side of equation 60 is then
computed based on the results, and compared with the trial Vcell value. If a difference is
found Vcell is incremented and the procedure repeated until the difference between the
computed and initial trial Vcell is less than a preset small precision range. Hence solutions
for Vcell for a series of input values of jcell can be found. A similar algorithm is used to solve
equation 53 to obtain a series of Vcell - jcell.values in FC-mode.
+
−
−
−
−
−
σ
⋅σ+−
α
⋅σ−
−
α
⋅σ−
−γ⋅−=Hm
cellem
cellO
OO
cellem
cell1H
HO
cellem
cell1
ecellOcell
L
L
VjT,,
jL
Vj
fT,,j
L
Vj
fjEV
+
−
−
−
−
−
σ
⋅σ−+
α
⋅σ−
+
α
⋅σ−
+γ⋅+=Hm
cellem
cellO
OO
cellem
cell1H
HO
cellem
cell1
ecellOcell
L
L
VjT,,
jL
Vj
fT,,j
L
Vj
fjEV
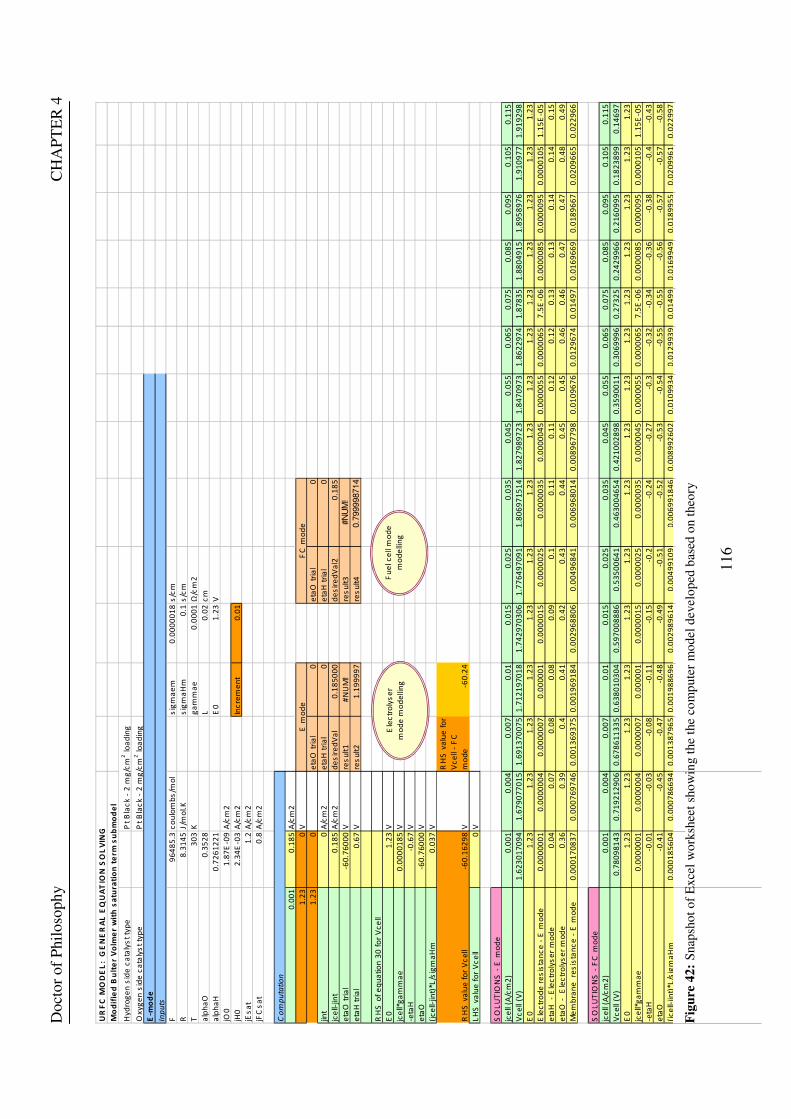
Doct
or
of
Phil
oso
ph
y
C
HA
PT
ER
4
116
UR
FC
MO
DE
L:
GE
NE
RA
L E
QU
AT
ION
SO
LV
ING
Mo
dif
ied
Bu
lte
r V
olm
er
wit
h s
atu
rati
on
te
rm s
ub
mo
de
l
Hy
dro
ge
n s
ide
ca
taly
st
typ
eP
t B
lac
k -
2 m
g/c
m2 l
oa
din
g
Ox
yg
en
sid
e c
ata
lys
t ty
pe
Pt
Bla
ck
- 2
mg
/cm
2 l
oa
din
g
E-m
od
e
Inputs
F9
64
85
.3c
ou
lom
bs
/mo
ls
igm
ae
m0
.00
00
01
8s
/cm
R8
.31
45
J/m
ol.
Ks
igm
aH
m0
.1s
/cm
T3
03
Kg
am
ma
e0
.00
01
Ω/c
m2
alp
ha
O0
.35
28
L0
.02
cm
alp
ha
H0
.72
61
22
1E
01
.23
V
jO0
1.8
7E
-09
A/c
m2
jH0
2.3
4E
-03
A/c
m2
Inc
rem
en
t0
.01
jEs
at
1.2
A/c
m2
jFC
sa
t0
.8A
/cm
2
Computation
0.0
01
0.1
85
A/c
m2
1.2
30
V
1.2
30
eta
O t
ria
l0
eta
O t
ria
l0
jint
0A
/cm
2e
taH
tri
al
0e
taH
tri
al
0
jce
ll-jin
t0
.18
5A
/cm
2d
es
ire
dV
al
0.1
85
00
0d
es
ire
dV
al2
0.1
85
eta
O t
ria
l-6
0.7
60
00
Vre
su
lt1
#N
UM
!re
su
lt3
#N
UM
!
eta
H t
ria
l0
.67
Vre
su
lt2
1.1
99
99
7re
su
lt4
0.7
99998714
RH
S o
f e
qu
ati
on
30
fo
r V
ce
ll
E0
1.2
3V
jce
ll*g
am
ma
e0
.00
00
18
5V
-eta
H-0
.67
V
eta
O-6
0.7
60
00
V
(jc
ell-
jint)
*L/s
igm
aH
m0
.03
7V
RH
S v
alu
e f
or
Vc
ell
-60
.16
29
8V
RH
S v
alu
e f
or
Vc
ell
- F
C
mo
de
-60
.24
LH
S v
alu
e f
or
Vc
ell
0V
SO
LU
TIO
NS
- E
mo
de
jce
ll (A
/cm
2)
0.0
01
0.0
04
0.0
07
0.0
10
.01
50
.02
50
.03
50
.04
50
.05
50
.06
50
.07
50
.08
50
.09
50
.10
50
.11
5
Vc
ell
(V)
1.6
23
01
70
94
1.6
79
07
70
15
1.6
91
37
00
75
1.7
12
19
70
18
1.7
42
97
03
06
1.7
76
49
70
91
1.8
06
97
15
14
1.8
27
98
97
23
1.8
47
09
73
1.8
62
29
74
1.8
78
35
1.8
80
49
15
1.8
95
89
76
1.9
10
97
71
.91
92
98
E0
1.2
31
.23
1.2
31
.23
1.2
31
.23
1.2
31
.23
1.2
31
.23
1.2
31
.23
1.2
31
.23
1.2
3
Ele
ctr
od
e r
es
ista
nc
e -
E m
od
e0
.00
00
00
10
.00
00
00
40
.00
00
00
70
.00
00
01
0.0
00
00
15
0.0
00
00
25
0.0
00
00
35
0.0
00
00
45
0.0
00
00
55
0.0
00
00
65
7.5
E-0
60
.00
00
08
50
.00
00
09
50
.00
00
10
51
.15
E-0
5
eta
H
- E
lec
tro
lys
er
mo
de
0.0
40
.07
0.0
80
.08
0.0
90
.10
.11
0.1
10
.12
0.1
20
.13
0.1
30
.14
0.1
40
.15
eta
O -
E
lec
tro
lys
er
mo
de
0.3
60
.39
0.4
0.4
10
.42
0.4
30
.44
0.4
50
.45
0.4
60
.46
0.4
70
.47
0.4
80
.49
Me
mb
ran
e
res
ista
nc
e -
E m
od
e0
.00
01
70
83
70
.00
07
69
74
60
.00
13
69
37
50
.00
19
69
18
40
.00
29
68
80
60
.00
49
68
41
0.0
06
96
80
14
0.0
08
96
77
98
0.0
10
96
76
0.0
12
96
74
0.0
14
97
0.0
16
96
69
0.0
18
96
67
0.0
20
96
65
0.0
22
96
6
SO
LU
TIO
NS
- F
C m
od
e
jce
ll (A
/cm
2)
0.0
01
0.0
04
0.0
07
0.0
10
.01
50
.02
50
.03
50
.04
50
.05
50
.06
50
.07
50
.08
50
.09
50
.10
50
.11
5
Vc
ell
(V)
0.7
80
98
14
30
.71
92
12
90
60
.67
86
11
33
50
.63
80
10
30
40
.59
70
08
88
60
.53
50
06
41
0.4
63
00
46
54
0.4
21
00
28
98
0.3
59
00
11
0.3
06
99
96
0.2
73
25
0.2
42
99
66
0.2
16
09
95
0.1
82
38
99
0.1
46
97
E0
1.2
31
.23
1.2
31
.23
1.2
31
.23
1.2
31
.23
1.2
31
.23
1.2
31
.23
1.2
31
.23
1.2
3
jce
ll*g
am
ma
e0
.00
00
00
10
.00
00
00
40
.00
00
00
70
.00
00
01
0.0
00
00
15
0.0
00
00
25
0.0
00
00
35
0.0
00
00
45
0.0
00
00
55
0.0
00
00
65
7.5
E-0
60
.00
00
08
50
.00
00
09
50
.00
00
10
51
.15
E-0
5
-eta
H-0
.01
-0.0
3-0
.08
-0.1
1-0
.15
-0.2
-0.2
4-0
.27
-0.3
-0.3
2-0
.34
-0.3
6-0
.38
-0.4
-0.4
3
eta
O-0
.41
-0.4
5-0
.47
-0.4
8-0
.49
-0.5
1-0
.52
-0.5
3-0
.54
-0.5
5-0
.55
-0.5
6-0
.57
-0.5
7-0
.58
(jc
ell-
jint)
*L/s
igm
aH
m0
.00
01
85
60
40
.00
07
86
69
40
.00
13
87
96
50
.00
19
88
69
60
.00
29
89
61
40
.00
49
91
09
0.0
06
99
18
46
0.0
08
99
26
02
0.0
10
99
34
0.0
12
99
39
0.0
14
99
0.0
16
99
49
0.0
18
99
55
0.0
20
99
61
0.0
22
99
7
E m
od
eF
C m
od
e
Ele
ctr
oly
se
r
mo
de
mo
de
llin
g
Fu
el
ce
ll m
od
e
mo
de
llin
g
Fig
ure
42
: S
nap
sho
t o
f E
xce
l w
ork
shee
t sh
ow
ing t
he
the
com
pute
r m
od
el d
evel
op
ed b
ased
on t
heo
ry
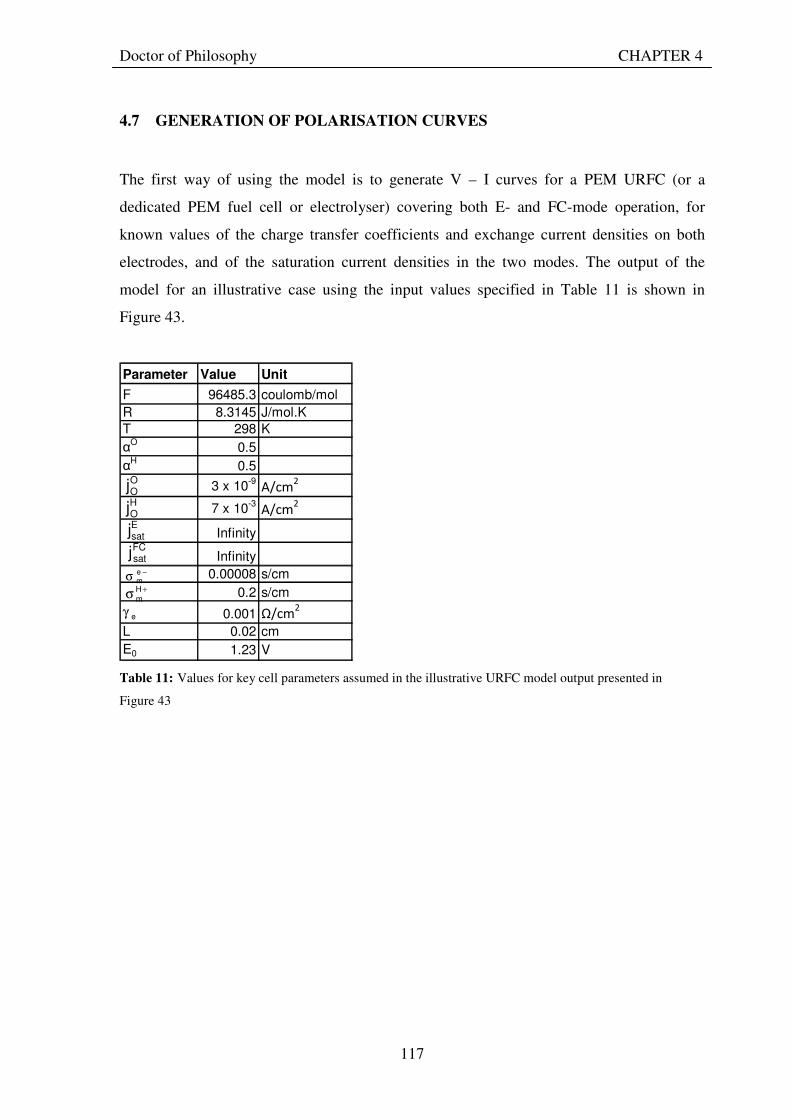
Doctor of Philosophy CHAPTER 4
117
4.7 GENERATION OF POLARISATION CURVES
The first way of using the model is to generate V – I curves for a PEM URFC (or a
dedicated PEM fuel cell or electrolyser) covering both E- and FC-mode operation, for
known values of the charge transfer coefficients and exchange current densities on both
electrodes, and of the saturation current densities in the two modes. The output of the
model for an illustrative case using the input values specified in Table 11 is shown in
Figure 43.
Parameter Value Unit
F 96485.3 coulomb/mol
R 8.3145 J/mol.K
T 298 K
αO
0.5
αH
0.5
3 x 10⁻⁹
A/cm2
7 x 10⁻³
A/cm2
Infinity
Infinity
0.00008 s/cm
0.2 s/cm
0.001 Ω/cm2
L 0.02 cm
E0 1.23 V
−σ
em
+σ Hm
eγ
OOjHOj
FCsatj
Esatj
Table 11: Values for key cell parameters assumed in the illustrative URFC model output presented in
Figure 43
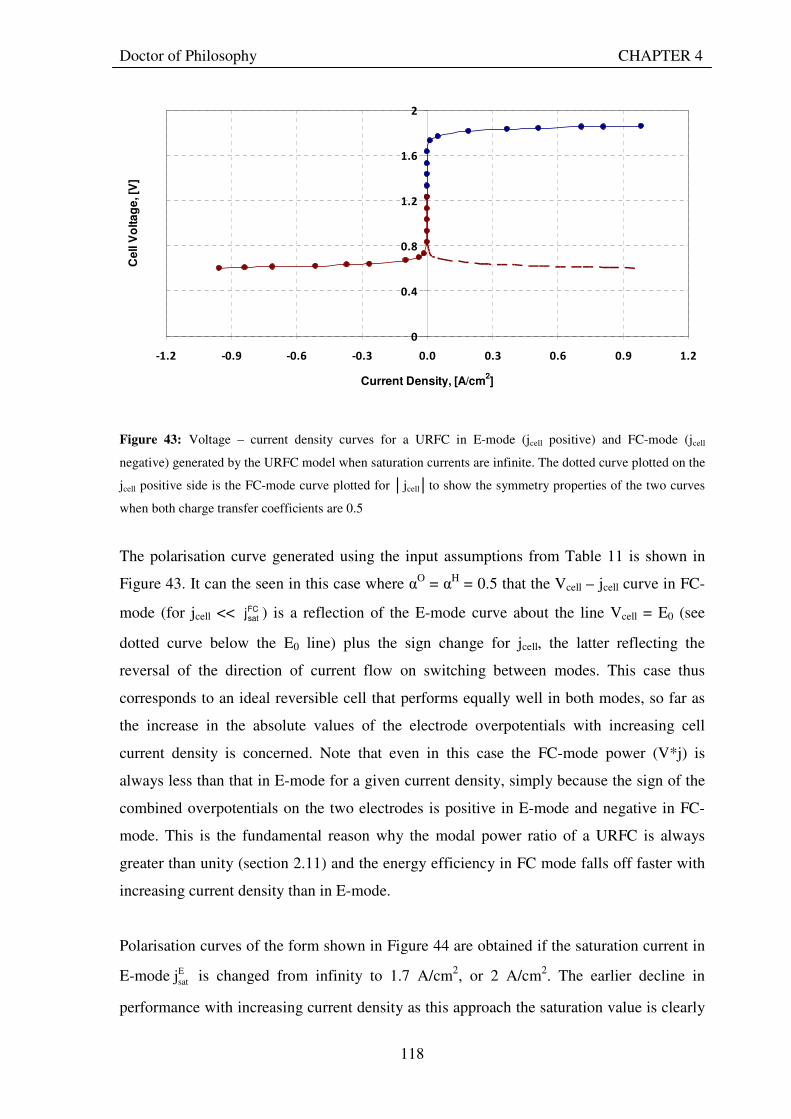
Doctor of Philosophy CHAPTER 4
118
0
0.4
0.8
1.2
1.6
2
-1.2 -0.9 -0.6 -0.3 0.0 0.3 0.6 0.9 1.2
Current Density, [A/cm2]
Ce
ll V
olt
ag
e, [V
]
Figure 43: Voltage – current density curves for a URFC in E-mode (jcell positive) and FC-mode (jcell
negative) generated by the URFC model when saturation currents are infinite. The dotted curve plotted on the
jcell positive side is the FC-mode curve plotted for jcellto show the symmetry properties of the two curves
when both charge transfer coefficients are 0.5
The polarisation curve generated using the input assumptions from Table 11 is shown in
Figure 43. It can the seen in this case where αO = αH = 0.5 that the Vcell – jcell curve in FC-
mode (for jcell << FCsatj ) is a reflection of the E-mode curve about the line Vcell = E0 (see
dotted curve below the E0 line) plus the sign change for jcell, the latter reflecting the
reversal of the direction of current flow on switching between modes. This case thus
corresponds to an ideal reversible cell that performs equally well in both modes, so far as
the increase in the absolute values of the electrode overpotentials with increasing cell
current density is concerned. Note that even in this case the FC-mode power (V*j) is
always less than that in E-mode for a given current density, simply because the sign of the
combined overpotentials on the two electrodes is positive in E-mode and negative in FC-
mode. This is the fundamental reason why the modal power ratio of a URFC is always
greater than unity (section 2.11) and the energy efficiency in FC mode falls off faster with
increasing current density than in E-mode.
Polarisation curves of the form shown in Figure 44 are obtained if the saturation current in
E-mode E
satj is changed from infinity to 1.7 A/cm2, or 2 A/cm2. The earlier decline in
performance with increasing current density as this approach the saturation value is clearly
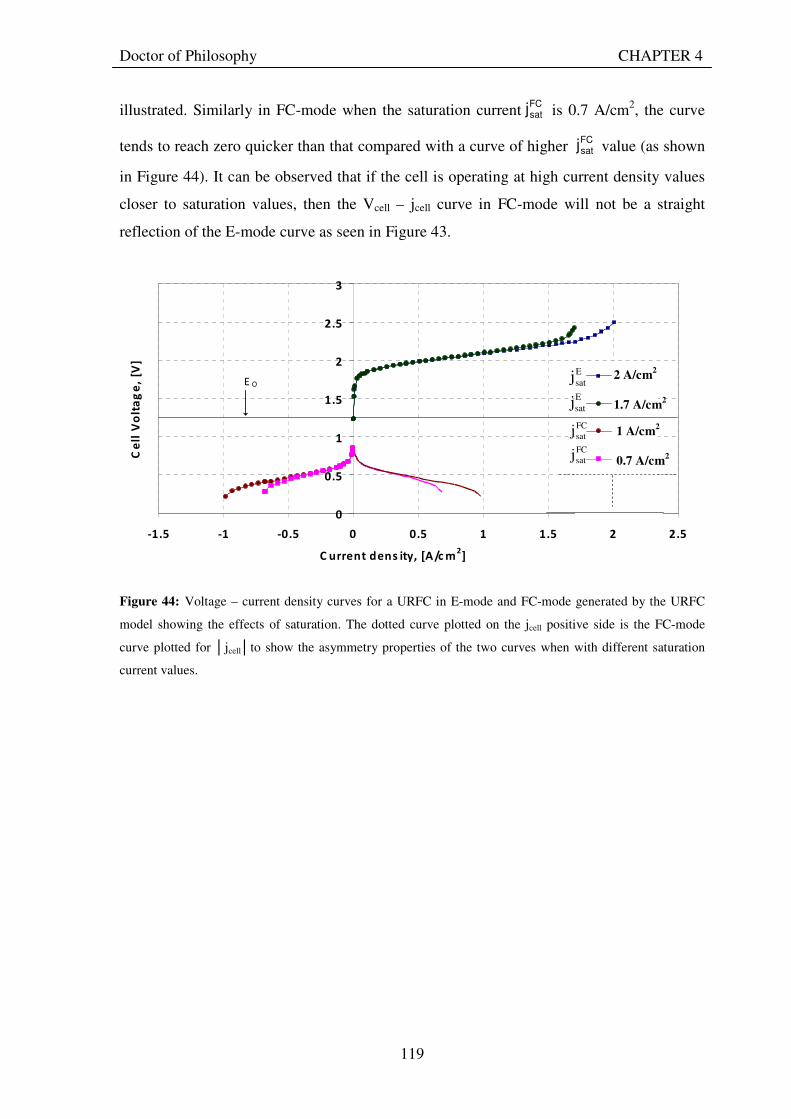
Doctor of Philosophy CHAPTER 4
119
illustrated. Similarly in FC-mode when the saturation currentFCsatj is 0.7 A/cm2, the curve
tends to reach zero quicker than that compared with a curve of higher FCsatj value (as shown
in Figure 44). It can be observed that if the cell is operating at high current density values
closer to saturation values, then the Vcell – jcell curve in FC-mode will not be a straight
reflection of the E-mode curve as seen in Figure 43.
Figure 44: Voltage – current density curves for a URFC in E-mode and FC-mode generated by the URFC
model showing the effects of saturation. The dotted curve plotted on the jcell positive side is the FC-mode
curve plotted for jcellto show the asymmetry properties of the two curves when with different saturation
current values.
0
0.5
1
1.5
2
2.5
3
-1.5 -1 -0.5 0 0.5 1 1.5 2 2.5
C urrent dens ity, [A/c m2]
Ce
ll V
olt
ag
e,
[V]
Series3
Series6
E O
E
satj
E
satj
FC
satj
FC
satj
2 A/cm2
1.7 A/cm2
1 A/cm2
0.7 A/cm2
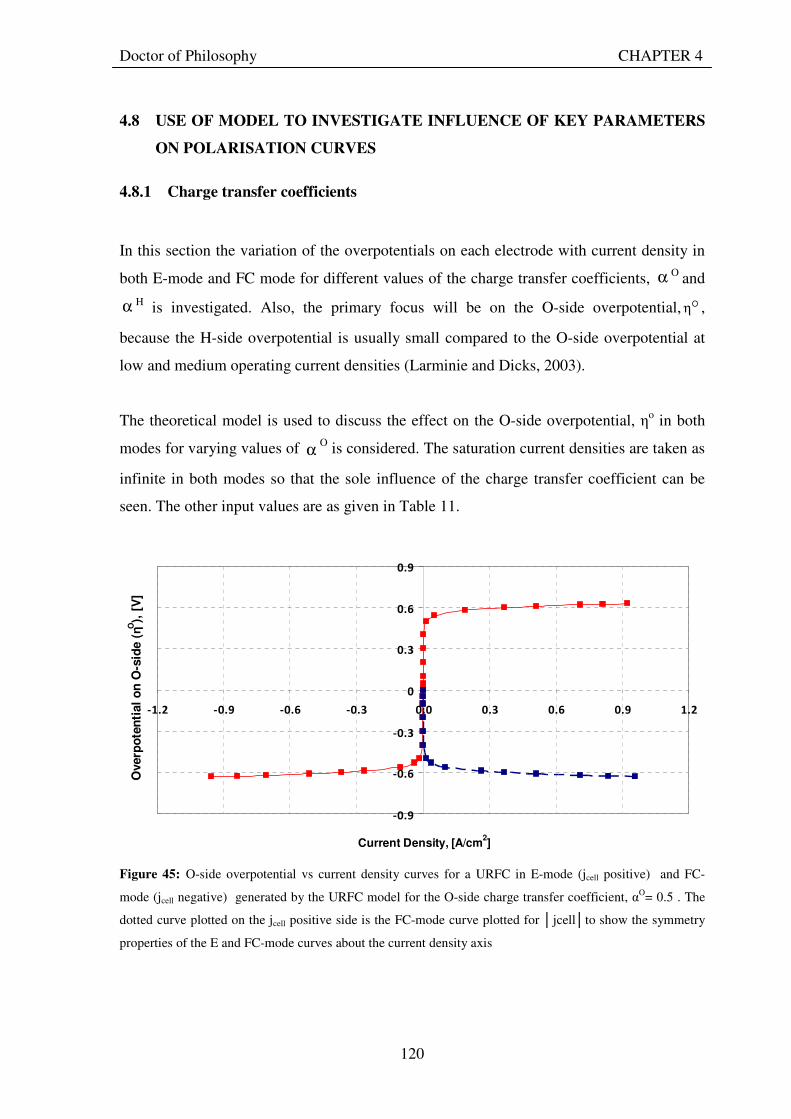
Doctor of Philosophy CHAPTER 4
120
4.8 USE OF MODEL TO INVESTIGATE INFLUENCE OF KEY PARAMETERS
ON POLARISATION CURVES
4.8.1 Charge transfer coefficients
In this section the variation of the overpotentials on each electrode with current density in
both E-mode and FC mode for different values of the charge transfer coefficients, α O and
α H is investigated. Also, the primary focus will be on the O-side overpotential, Oη ,
because the H-side overpotential is usually small compared to the O-side overpotential at
low and medium operating current densities (Larminie and Dicks, 2003).
The theoretical model is used to discuss the effect on the O-side overpotential, ηo in both
modes for varying values of αO is considered. The saturation current densities are taken as
infinite in both modes so that the sole influence of the charge transfer coefficient can be
seen. The other input values are as given in Table 11.
-0.9
-0.6
-0.3
0
0.3
0.6
0.9
-1.2 -0.9 -0.6 -0.3 0.0 0.3 0.6 0.9 1.2
Current Density, [A/cm2]
Overp
ote
nti
al
on
O-s
ide (ηO
), [
V]
Figure 45: O-side overpotential vs current density curves for a URFC in E-mode (jcell positive) and FC-
mode (jcell negative) generated by the URFC model for the O-side charge transfer coefficient, αO= 0.5 . The
dotted curve plotted on the jcell positive side is the FC-mode curve plotted for jcellto show the symmetry
properties of the E and FC-mode curves about the current density axis
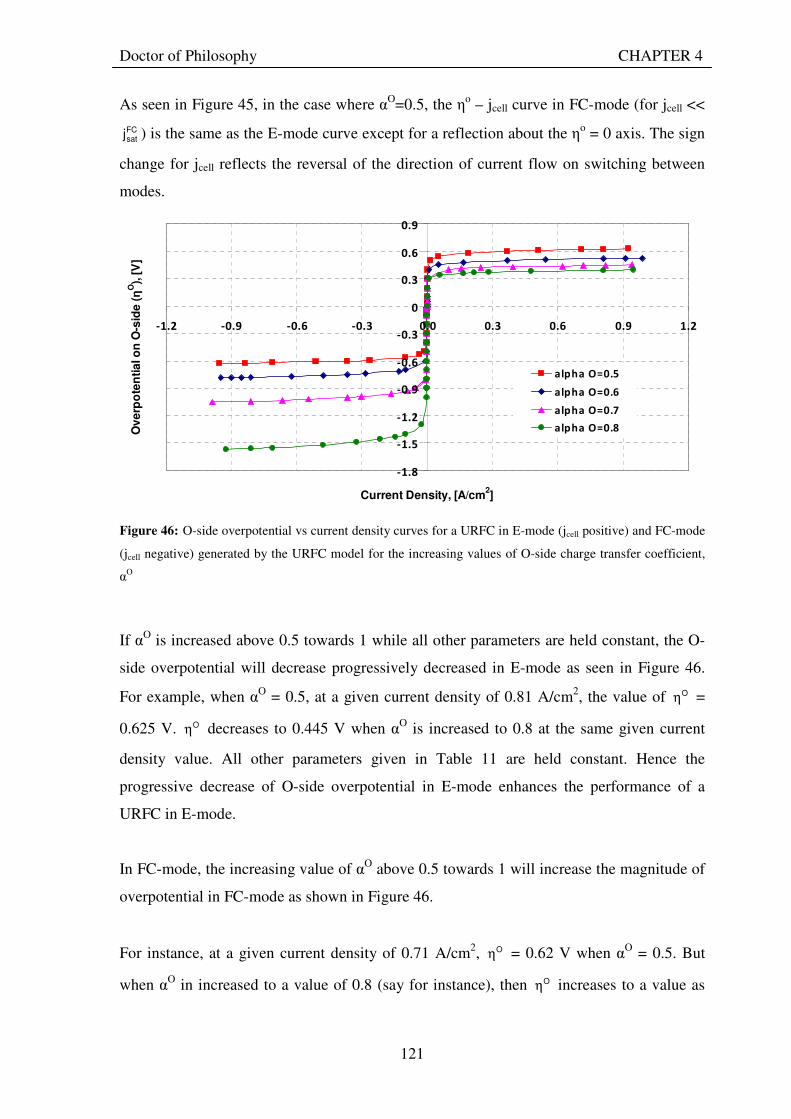
Doctor of Philosophy CHAPTER 4
121
As seen in Figure 45, in the case where αO=0.5, the ηo – jcell curve in FC-mode (for jcell <<
FCsatj ) is the same as the E-mode curve except for a reflection about the ηo = 0 axis. The sign
change for jcell reflects the reversal of the direction of current flow on switching between
modes.
-1.8
-1.5
-1.2
-0.9
-0.6
-0.3
0
0.3
0.6
0.9
-1.2 -0.9 -0.6 -0.3 0.0 0.3 0.6 0.9 1.2
Current Density, [A/cm2]
Ov
erp
ote
nti
al o
n O
-sid
e (η
O),
[V
]
alpha O=0.5
alpha O=0.6
alpha O=0.7
alpha O=0.8
Figure 46: O-side overpotential vs current density curves for a URFC in E-mode (jcell positive) and FC-mode
(jcell negative) generated by the URFC model for the increasing values of O-side charge transfer coefficient,
αO
If αO is increased above 0.5 towards 1 while all other parameters are held constant, the O-
side overpotential will decrease progressively decreased in E-mode as seen in Figure 46.
For example, when αO = 0.5, at a given current density of 0.81 A/cm2, the value of Oη =
0.625 V. Oη decreases to 0.445 V when αO is increased to 0.8 at the same given current
density value. All other parameters given in Table 11 are held constant. Hence the
progressive decrease of O-side overpotential in E-mode enhances the performance of a
URFC in E-mode.
In FC-mode, the increasing value of αO above 0.5 towards 1 will increase the magnitude of
overpotential in FC-mode as shown in Figure 46.
For instance, at a given current density of 0.71 A/cm2, Oη = 0.62 V when αO = 0.5. But
when αO in increased to a value of 0.8 (say for instance), then Oη increases to a value as
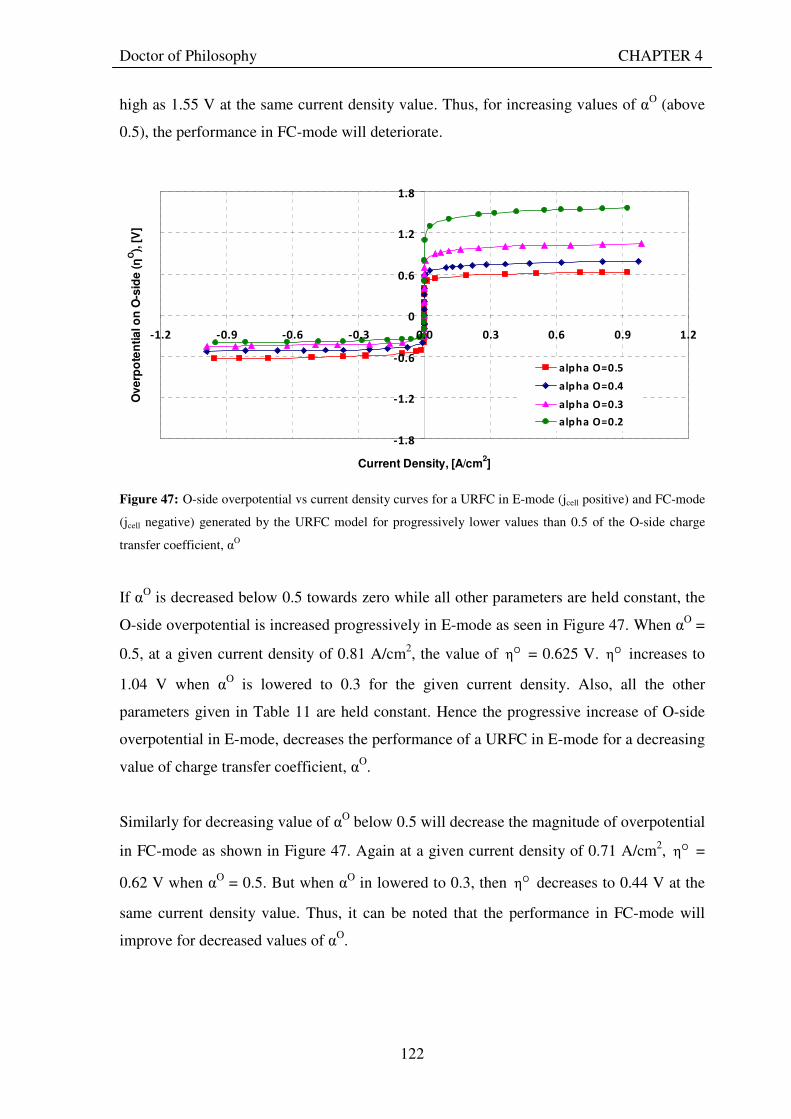
Doctor of Philosophy CHAPTER 4
122
high as 1.55 V at the same current density value. Thus, for increasing values of αO (above
0.5), the performance in FC-mode will deteriorate.
-1.8
-1.2
-0.6
0
0.6
1.2
1.8
-1.2 -0.9 -0.6 -0.3 0.0 0.3 0.6 0.9 1.2
Current Density, [A/cm2]
Ov
erp
ote
nti
al o
n O
-sid
e (η
O),
[V
]
alpha O=0.5
alpha O=0.4
alpha O=0.3
alpha O=0.2
Figure 47: O-side overpotential vs current density curves for a URFC in E-mode (jcell positive) and FC-mode
(jcell negative) generated by the URFC model for progressively lower values than 0.5 of the O-side charge
transfer coefficient, αO
If αO is decreased below 0.5 towards zero while all other parameters are held constant, the
O-side overpotential is increased progressively in E-mode as seen in Figure 47. When αO =
0.5, at a given current density of 0.81 A/cm2, the value of Oη = 0.625 V. Oη increases to
1.04 V when αO is lowered to 0.3 for the given current density. Also, all the other
parameters given in Table 11 are held constant. Hence the progressive increase of O-side
overpotential in E-mode, decreases the performance of a URFC in E-mode for a decreasing
value of charge transfer coefficient, αO.
Similarly for decreasing value of αO below 0.5 will decrease the magnitude of overpotential
in FC-mode as shown in Figure 47. Again at a given current density of 0.71 A/cm2, Oη =
0.62 V when αO = 0.5. But when αO in lowered to 0.3, then Oη decreases to 0.44 V at the
same current density value. Thus, it can be noted that the performance in FC-mode will
improve for decreased values of αO.
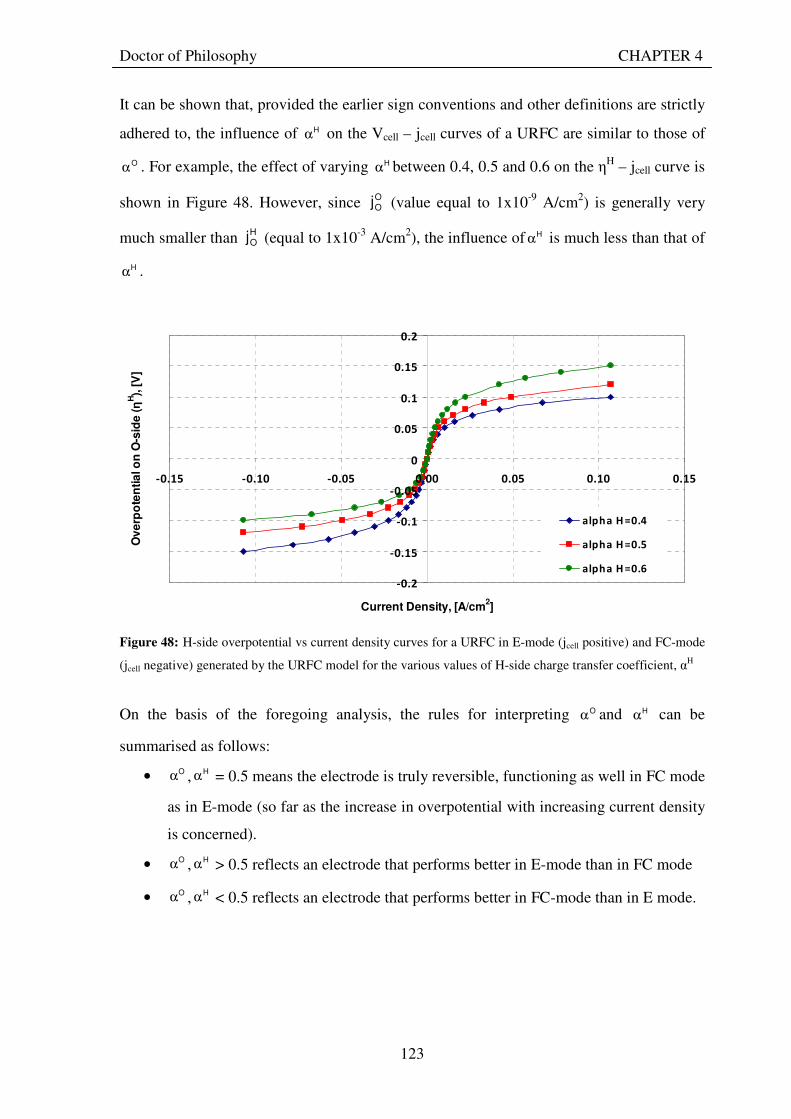
Doctor of Philosophy CHAPTER 4
123
It can be shown that, provided the earlier sign conventions and other definitions are strictly
adhered to, the influence of Hα on the Vcell – jcell curves of a URFC are similar to those of
Oα . For example, the effect of varying Hα between 0.4, 0.5 and 0.6 on the ηH – jcell curve is
shown in Figure 48. However, since OOj (value equal to 1x10⁻⁹ A/cm2) is generally very
much smaller than HOj (equal to 1x10⁻³ A/cm2), the influence of Hα is much less than that of
Hα .
-0.2
-0.15
-0.1
-0.05
0
0.05
0.1
0.15
0.2
-0.15 -0.10 -0.05 0.00 0.05 0.10 0.15
Current Density, [A/cm2]
Ov
erp
ote
nti
al o
n O
-sid
e (η
H),
[V
]
alpha H =0.4
alpha H =0.5
alpha H =0.6
Figure 48: H-side overpotential vs current density curves for a URFC in E-mode (jcell positive) and FC-mode
(jcell negative) generated by the URFC model for the various values of H-side charge transfer coefficient, αH
On the basis of the foregoing analysis, the rules for interpreting Oα and Hα can be
summarised as follows:
• Oα , Hα = 0.5 means the electrode is truly reversible, functioning as well in FC mode
as in E-mode (so far as the increase in overpotential with increasing current density
is concerned).
• Oα , Hα > 0.5 reflects an electrode that performs better in E-mode than in FC mode
• Oα , Hα < 0.5 reflects an electrode that performs better in FC-mode than in E mode.
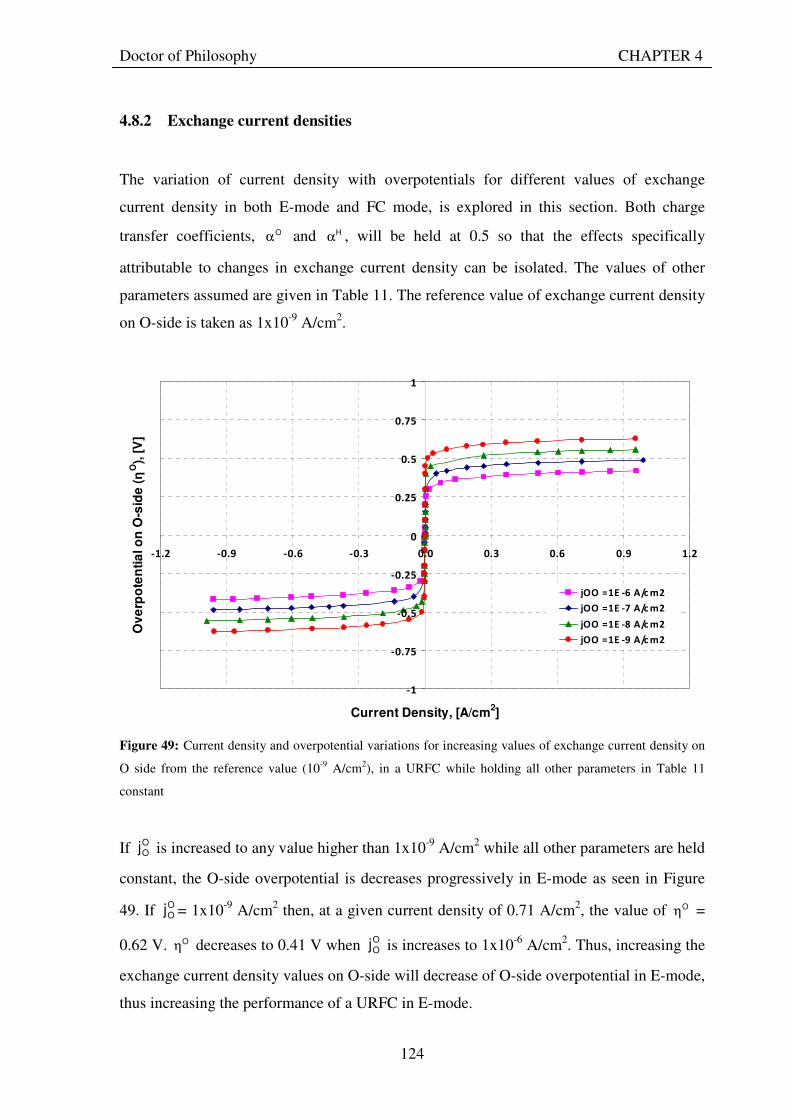
Doctor of Philosophy CHAPTER 4
124
4.8.2 Exchange current densities
The variation of current density with overpotentials for different values of exchange
current density in both E-mode and FC mode, is explored in this section. Both charge
transfer coefficients, Oα and Hα , will be held at 0.5 so that the effects specifically
attributable to changes in exchange current density can be isolated. The values of other
parameters assumed are given in Table 11. The reference value of exchange current density
on O-side is taken as 1x10⁻⁹ A/cm2.
-1
-0.75
-0.5
-0.25
0
0.25
0.5
0.75
1
-1.2 -0.9 -0.6 -0.3 0.0 0.3 0.6 0.9 1.2
Current Density, [A/cm2]
Ov
erp
ote
nti
al o
n O
-sid
e (η
O),
[V
]
jOO =1E -6 A/c m2
jOO =1E -7 A/c m2
jOO =1E -8 A/c m2
jOO =1E -9 A/c m2
Figure 49: Current density and overpotential variations for increasing values of exchange current density on
O side from the reference value (10-9 A/cm2), in a URFC while holding all other parameters in Table 11
constant
If OOj is increased to any value higher than 1x10⁻⁹ A/cm2 while all other parameters are held
constant, the O-side overpotential is decreases progressively in E-mode as seen in Figure
49. If OOj = 1x10⁻⁹ A/cm2 then, at a given current density of 0.71 A/cm2, the value of Oη =
0.62 V. Oη decreases to 0.41 V when OOj is increases to 1x10⁻⁶ A/cm2. Thus, increasing the
exchange current density values on O-side will decrease of O-side overpotential in E-mode,
thus increasing the performance of a URFC in E-mode.
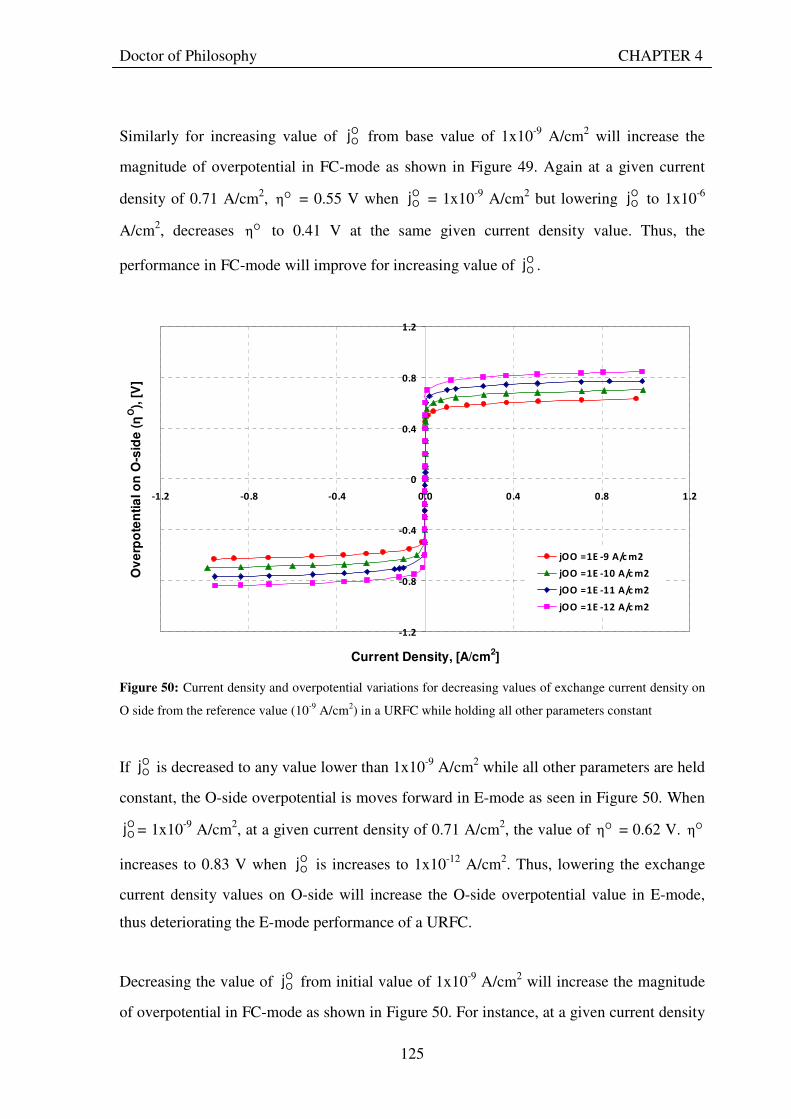
Doctor of Philosophy CHAPTER 4
125
Similarly for increasing value of OOj from base value of 1x10⁻⁹ A/cm2 will increase the
magnitude of overpotential in FC-mode as shown in Figure 49. Again at a given current
density of 0.71 A/cm2, Oη = 0.55 V when OOj = 1x10⁻⁹ A/cm2 but lowering O
Oj to 1x10⁻⁶
A/cm2, decreases Oη to 0.41 V at the same given current density value. Thus, the
performance in FC-mode will improve for increasing value of OOj .
-1.2
-0.8
-0.4
0
0.4
0.8
1.2
-1.2 -0.8 -0.4 0.0 0.4 0.8 1.2
Current Density, [A/cm2]
Ov
erp
ote
nti
al o
n O
-sid
e (η
O),
[V
]
jOO =1E -9 A/c m2
jOO =1E -10 A/c m2
jOO =1E -11 A/c m2
jOO =1E -12 A/c m2
Figure 50: Current density and overpotential variations for decreasing values of exchange current density on
O side from the reference value (10-9 A/cm2) in a URFC while holding all other parameters constant
If OOj is decreased to any value lower than 1x10⁻⁹ A/cm2 while all other parameters are held
constant, the O-side overpotential is moves forward in E-mode as seen in Figure 50. When
OOj = 1x10⁻⁹ A/cm2, at a given current density of 0.71 A/cm2, the value of Oη = 0.62 V. Oη
increases to 0.83 V when OOj is increases to 1x10-12 A/cm2. Thus, lowering the exchange
current density values on O-side will increase the O-side overpotential value in E-mode,
thus deteriorating the E-mode performance of a URFC.
Decreasing the value of OOj from initial value of 1x10⁻⁹ A/cm2 will increase the magnitude
of overpotential in FC-mode as shown in Figure 50. For instance, at a given current density
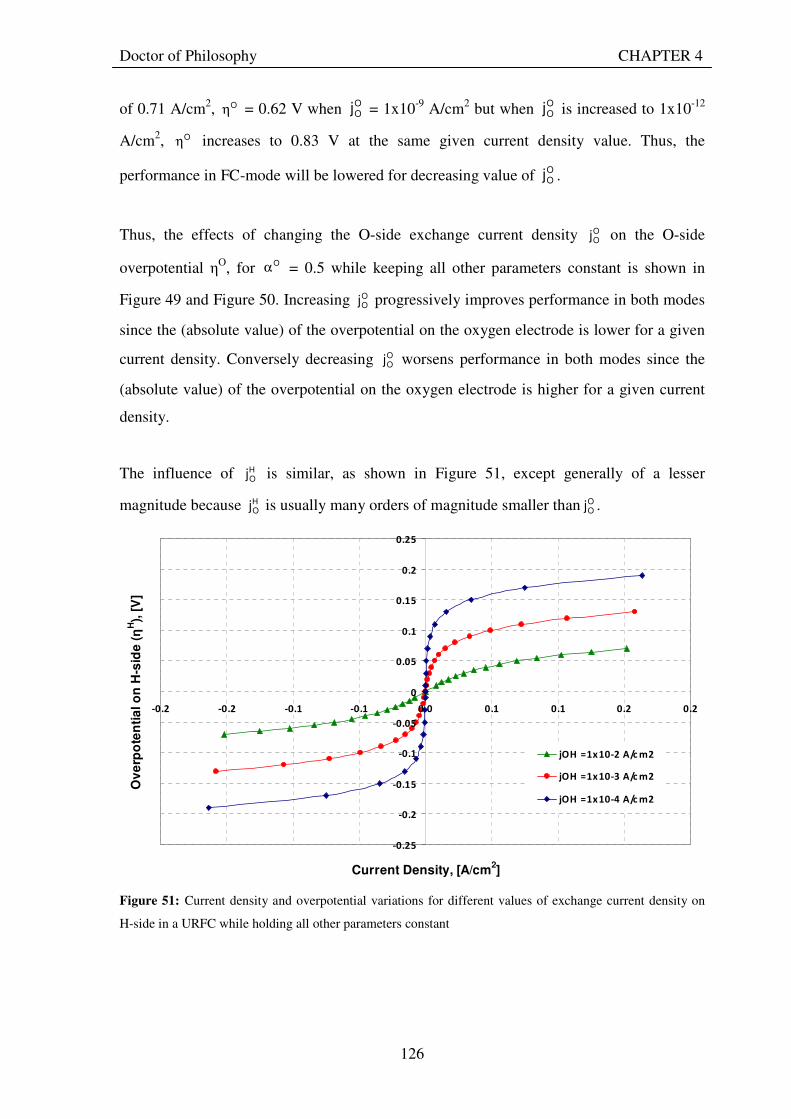
Doctor of Philosophy CHAPTER 4
126
of 0.71 A/cm2, Oη = 0.62 V when OOj = 1x10⁻⁹ A/cm2 but when O
Oj is increased to 1x10-12
A/cm2, Oη increases to 0.83 V at the same given current density value. Thus, the
performance in FC-mode will be lowered for decreasing value of OOj .
Thus, the effects of changing the O-side exchange current density OOj on the O-side
overpotential ηO, for Oα = 0.5 while keeping all other parameters constant is shown in
Figure 49 and Figure 50. Increasing OOj progressively improves performance in both modes
since the (absolute value) of the overpotential on the oxygen electrode is lower for a given
current density. Conversely decreasing OOj worsens performance in both modes since the
(absolute value) of the overpotential on the oxygen electrode is higher for a given current
density.
The influence of HOj is similar, as shown in Figure 51, except generally of a lesser
magnitude because HOj is usually many orders of magnitude smaller than O
Oj .
-0.25
-0.2
-0.15
-0.1
-0.05
0
0.05
0.1
0.15
0.2
0.25
-0.2 -0.2 -0.1 -0.1 0.0 0.1 0.1 0.2 0.2
Current Density, [A/cm2]
Ov
erp
ote
nti
al o
n H
-sid
e (η
H),
[V
]
jOH =1x10⁻² A/c m2
jOH =1x10⁻³ A/c m2
jOH =1x10⁻⁴ A/c m2
Figure 51: Current density and overpotential variations for different values of exchange current density on
H-side in a URFC while holding all other parameters constant
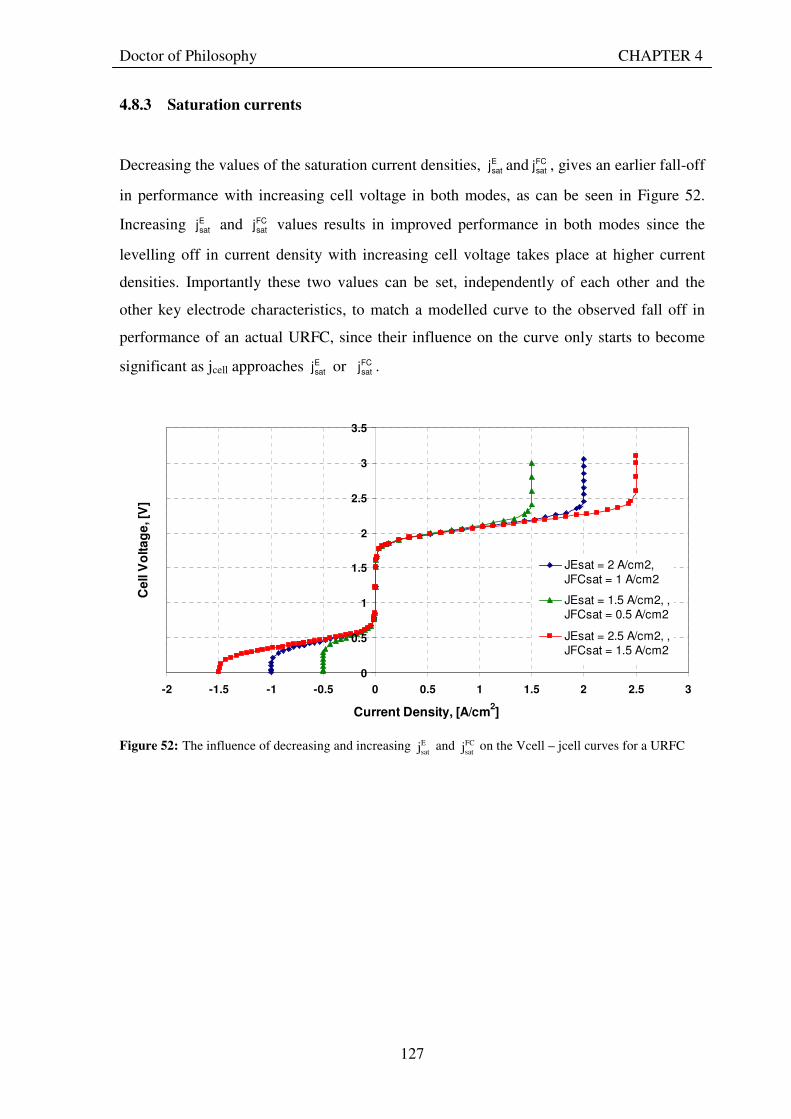
Doctor of Philosophy CHAPTER 4
127
4.8.3 Saturation currents
Decreasing the values of the saturation current densities, Esatj and FC
satj , gives an earlier fall-off
in performance with increasing cell voltage in both modes, as can be seen in Figure 52.
Increasing Esatj and FC
satj values results in improved performance in both modes since the
levelling off in current density with increasing cell voltage takes place at higher current
densities. Importantly these two values can be set, independently of each other and the
other key electrode characteristics, to match a modelled curve to the observed fall off in
performance of an actual URFC, since their influence on the curve only starts to become
significant as jcell approaches Esatj or FC
satj .
0
0.5
1
1.5
2
2.5
3
3.5
-2 -1.5 -1 -0.5 0 0.5 1 1.5 2 2.5 3
Current Density, [A/cm2]
Ce
ll V
olt
ag
e, [V
]
JEsat = 2 A/cm2,
JFCsat = 1 A/cm2
JEsat = 1.5 A/cm2, ,JFCsat = 0.5 A/cm2
JEsat = 2.5 A/cm2, ,JFCsat = 1.5 A/cm2
Figure 52: The influence of decreasing and increasing Esatj and FC
satj on the Vcell – jcell curves for a URFC

Doctor of Philosophy CHAPTER 4
128
4.8.4 Internal current
As discussed earlier in section 4.3.1.5, internal current can have a very notable effect on the
open-circuit voltage when operating in low-temperatures and small current density values
(Farret and Simoes, 2006). In this section the effect of the internal current on cell voltage is
discussed.
The modified Butler-Volmer equations including internal current based on earlier
equations 47 and 48 is given again here:
−
α−η−
+
αη
+
α−η−−
αη
=−
O
0
FC
sat
OO
O
0
E
sat
OO
OOOO
O
0int
j
j
RT
F2)1(exp
j
j
RT
F2exp
1
RT
F2)1(exp
RT
F2exp
jjjcell
−
α−η
+
αη−
+
α−η−
αη−
=−
H
0
FC
sat
HH
H
0
E
sat
HH
HHHH
H
0int
j
j
RT
F2)1(exp
j
j
RT
F2exp
1
RT
F2)1(exp
RT
F2exp
jjjcell
The effect of internal current in E and FC mode operation of a URFC is as shown in Figure
53. The shift of the potential axis a little to the left due to an internal current means that the
intercept of the curve on the overpotential axis at zero cell current density is at a small
negative overpotential. There is an internal current even at zero external current since there
remains a potential difference between the two electrodes – the reversible potential - and
this creates a small flow of electrons through the membrane. Even at open circuit, the curve
shows that the reversible voltage is not reached by the cell (Figure 53).
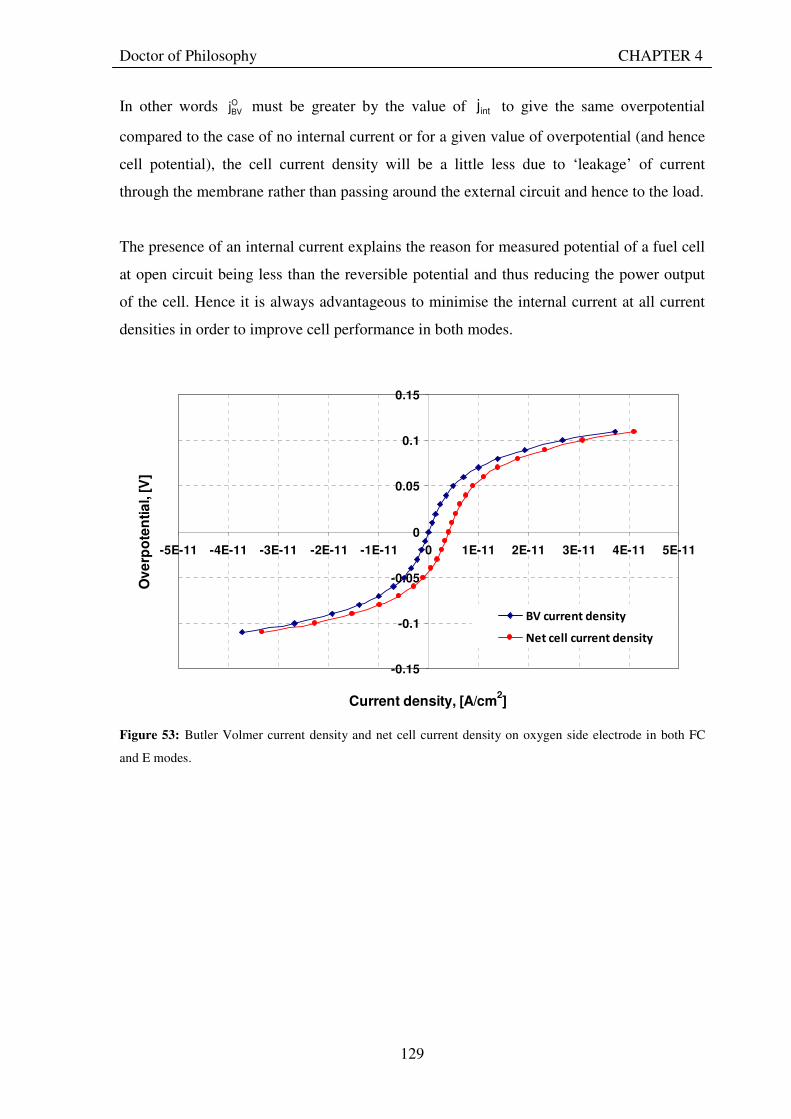
Doctor of Philosophy CHAPTER 4
129
In other words OBVj must be greater by the value of intj to give the same overpotential
compared to the case of no internal current or for a given value of overpotential (and hence
cell potential), the cell current density will be a little less due to ‘leakage’ of current
through the membrane rather than passing around the external circuit and hence to the load.
The presence of an internal current explains the reason for measured potential of a fuel cell
at open circuit being less than the reversible potential and thus reducing the power output
of the cell. Hence it is always advantageous to minimise the internal current at all current
densities in order to improve cell performance in both modes.
-0.15
-0.1
-0.05
0
0.05
0.1
0.15
-5E-11 -4E-11 -3E-11 -2E-11 -1E-11 0 1E-11 2E-11 3E-11 4E-11 5E-11
Current density, [A/cm2]
Ov
erp
ote
nti
al, [
V]
BV current density
Net cell current density
Figure 53: Butler Volmer current density and net cell current density on oxygen side electrode in both FC
and E modes.
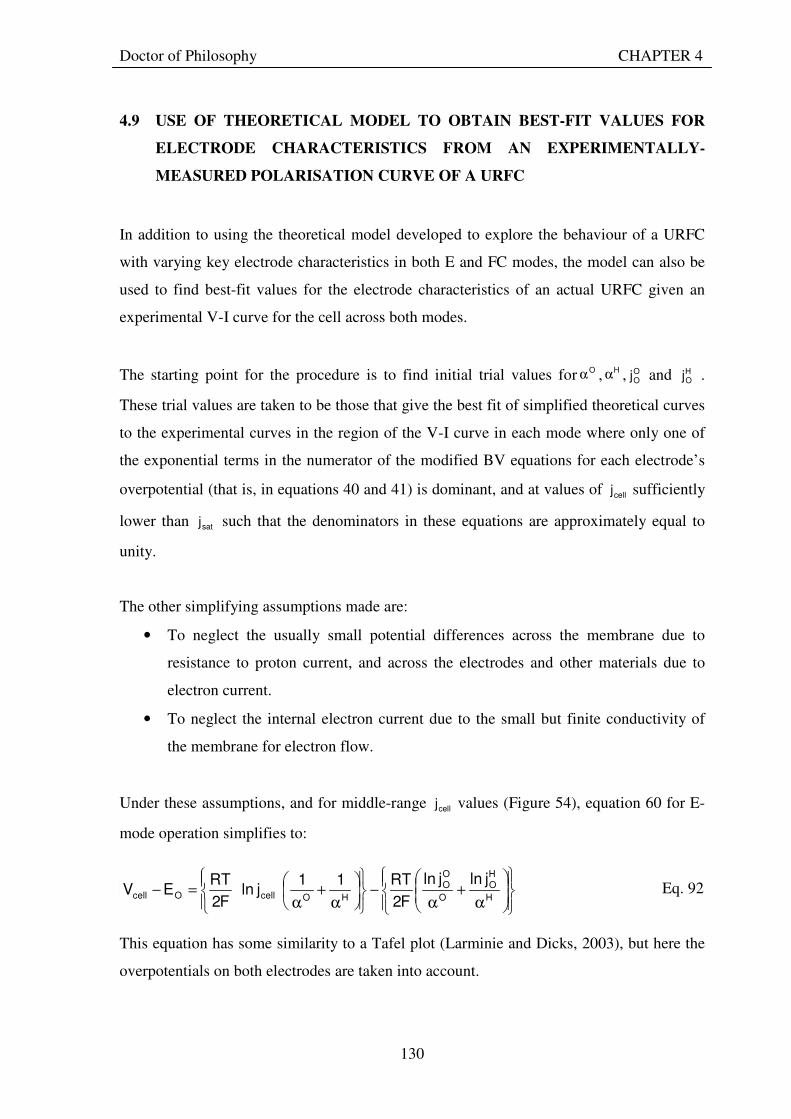
Doctor of Philosophy CHAPTER 4
130
4.9 USE OF THEORETICAL MODEL TO OBTAIN BEST-FIT VALUES FOR
ELECTRODE CHARACTERISTICS FROM AN EXPERIMENTALLY-
MEASURED POLARISATION CURVE OF A URFC
In addition to using the theoretical model developed to explore the behaviour of a URFC
with varying key electrode characteristics in both E and FC modes, the model can also be
used to find best-fit values for the electrode characteristics of an actual URFC given an
experimental V-I curve for the cell across both modes.
The starting point for the procedure is to find initial trial values for Oα , Hα , OOj and H
Oj .
These trial values are taken to be those that give the best fit of simplified theoretical curves
to the experimental curves in the region of the V-I curve in each mode where only one of
the exponential terms in the numerator of the modified BV equations for each electrode’s
overpotential (that is, in equations 40 and 41) is dominant, and at values of cellj sufficiently
lower than satj such that the denominators in these equations are approximately equal to
unity.
The other simplifying assumptions made are:
• To neglect the usually small potential differences across the membrane due to
resistance to proton current, and across the electrodes and other materials due to
electron current.
• To neglect the internal electron current due to the small but finite conductivity of
the membrane for electron flow.
Under these assumptions, and for middle-range cellj values (Figure 54), equation 60 for E-
mode operation simplifies to:
Eq 4.38 Eq. 92
This equation has some similarity to a Tafel plot (Larminie and Dicks, 2003), but here the
overpotentials on both electrodes are taken into account.
α+
α−
α+
α=−
H
HO
O
OO
HOcellOcell
jlnjln
F2
RT11jln
F2
RTEV
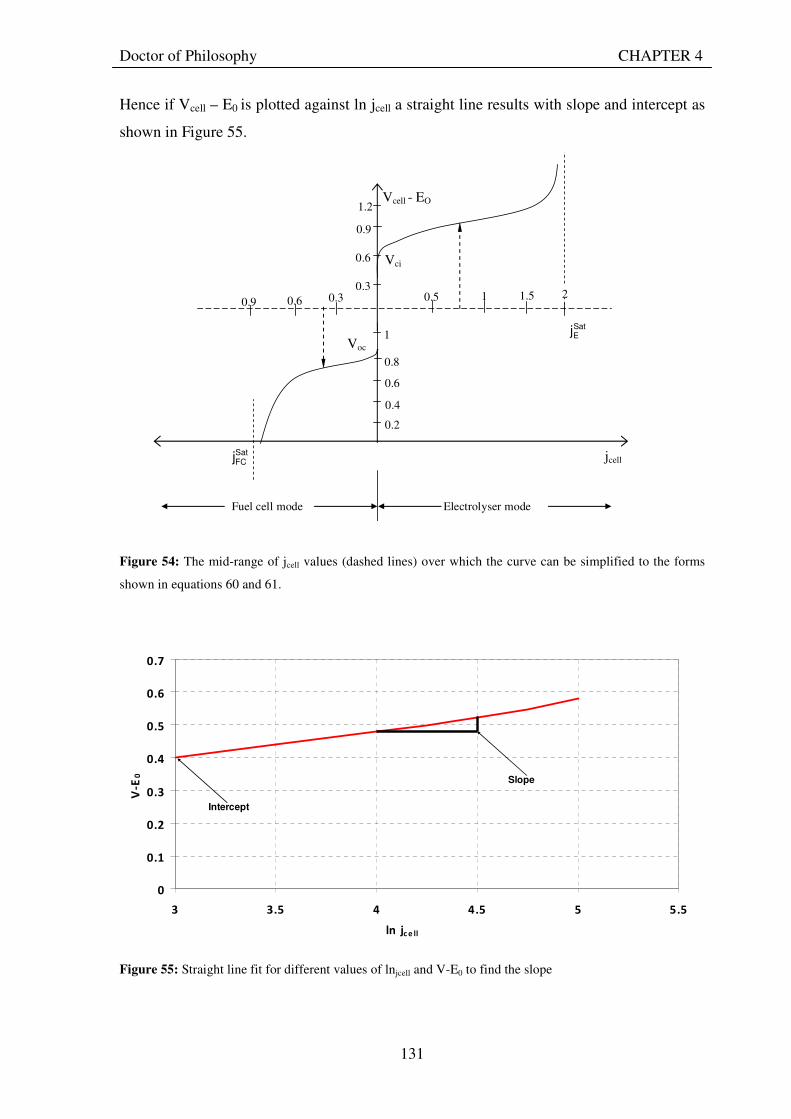
Doctor of Philosophy CHAPTER 4
131
Hence if Vcell – E0 is plotted against ln jcell a straight line results with slope and intercept as
shown in Figure 55.
Figure 54: The mid-range of jcell values (dashed lines) over which the curve can be simplified to the forms
shown in equations 60 and 61.
0
0.1
0.2
0.3
0.4
0.5
0.6
0.7
3 3.5 4 4.5 5 5.5
ln jc e ll
V-E
0
Intercept
Slope
Figure 55: Straight line fit for different values of lnjcell and V-E0 to find the slope
Vcell - EO
Voc
Vci
SatEj
SatFCj jcell
Fuel cell mode Electrolyser mode
0.9
0.6
0.3
1.2
0.3 0.6 0.9 2 1 1.5 0.5
0.6
0.2
1
0.4
0.8

Doctor of Philosophy CHAPTER 4
132
The slope of the straight line is, Eq. 93
and the intercept on the Vcell – E0: axis: Eq. 94
Under the same assumptions, and for middle-range jcell values, equation 61 for FC-mode
operation simplifies to:
Eq. 95
Plotting |Vcell – E0| against ln |jcell| yields a straight line (similar to curve in Figure 55)
results with slope:
Eq. 96
Intercept on the |Vcell – E0| axis is,
Eq. 97
Once again this curve is similar to a Tafel plot for a PEM fuel cell, but with the
overpotentials on both electrodes separately taken into account.
Estimated values for mE , cE , mFC , and cFC corresponding to the experimentally measured
Vcell-jcell curve for a URFC can be found by plotting the experimental Vcell – E0 values
against celljln for the E-mode results, and the experimental |Vcell – E0| values against ln|jcell |
for the FC-mode results, for mid-range jcell values (as indicated in Figure 54). Regression
analysis with a 95% confidence level which is an inbuilt function in Microsoft Excel is
then used to find the best-fit values for the slopes and intercepts.
α+
α=
HO
E 11
F2
RTm
α+
α
−=
H
HO
O
OOE jlnjln
F2
RTC
( ) ( ) ( ) ( )
α−+
α−−
α−+
α−=−
H
HO
O
OO
HOcellOcell1
jln
1
jln
F2
RT
1
1
1
1jln
F2
RTEV
α−+
α−=
HO
FC
1
1
1
1
F2
RTm
α−+
α−
−=
H
HO
O
OOFC
1
jln
1
jln
F2
RTC
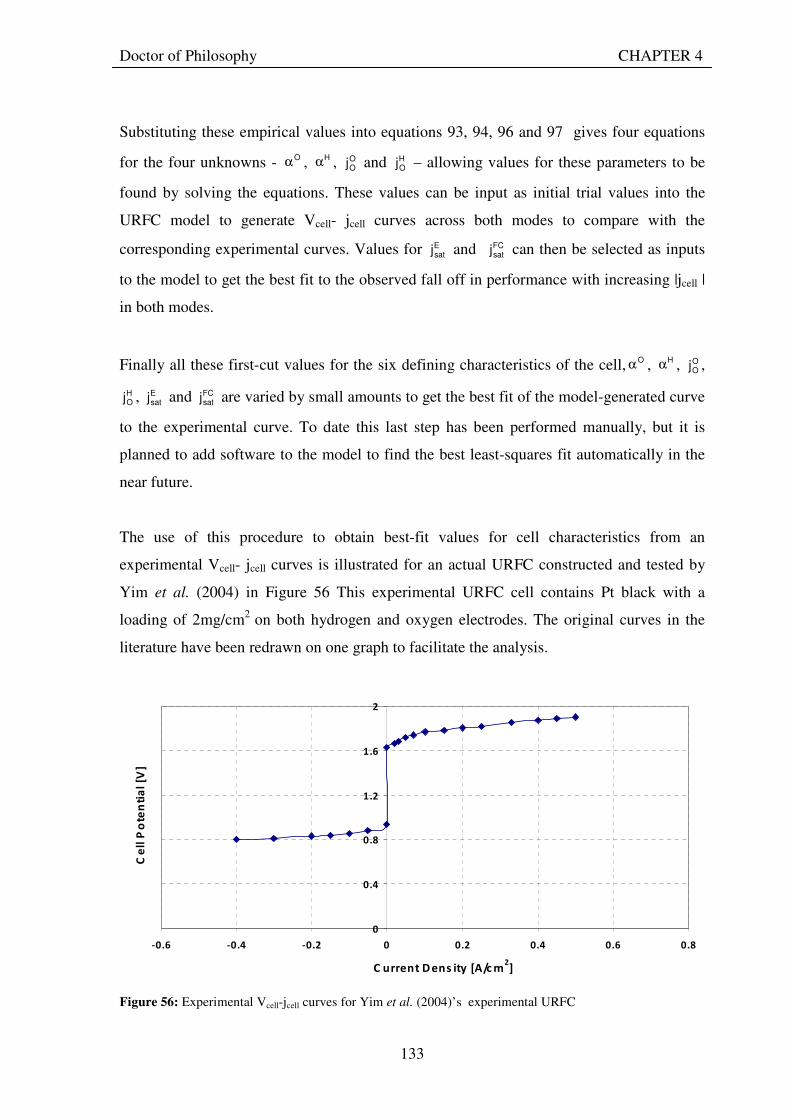
Doctor of Philosophy CHAPTER 4
133
Substituting these empirical values into equations 93, 94, 96 and 97 gives four equations
for the four unknowns - Oα , Hα , OOj and H
Oj – allowing values for these parameters to be
found by solving the equations. These values can be input as initial trial values into the
URFC model to generate Vcell- jcell curves across both modes to compare with the
corresponding experimental curves. Values for Esatj and FC
satj can then be selected as inputs
to the model to get the best fit to the observed fall off in performance with increasing |jcell |
in both modes.
Finally all these first-cut values for the six defining characteristics of the cell, Oα , Hα , OOj ,
HOj , E
satj and FCsatj are varied by small amounts to get the best fit of the model-generated curve
to the experimental curve. To date this last step has been performed manually, but it is
planned to add software to the model to find the best least-squares fit automatically in the
near future.
The use of this procedure to obtain best-fit values for cell characteristics from an
experimental Vcell- jcell curves is illustrated for an actual URFC constructed and tested by
Yim et al. (2004) in Figure 56 This experimental URFC cell contains Pt black with a
loading of 2mg/cm2 on both hydrogen and oxygen electrodes. The original curves in the
literature have been redrawn on one graph to facilitate the analysis.
0
0.4
0.8
1.2
1.6
2
-0.6 -0.4 -0.2 0 0.2 0.4 0.6 0.8
C urrent D ens ity [A/c m2]
Ce
ll P
ote
nti
al
[V]
Figure 56: Experimental Vcell-jcell curves for Yim et al. (2004)’s experimental URFC
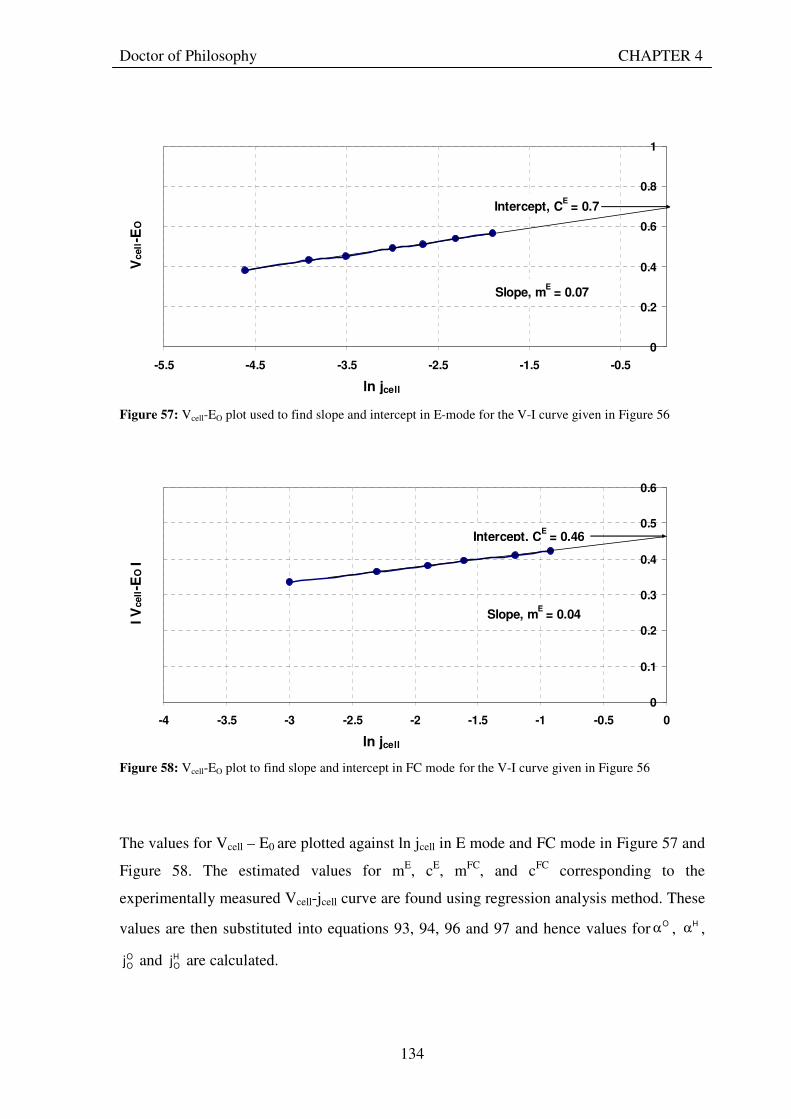
Doctor of Philosophy CHAPTER 4
134
Figure 57: Vcell-EO plot used to find slope and intercept in E-mode for the V-I curve given in Figure 56
Figure 58: Vcell-EO plot to find slope and intercept in FC mode for the V-I curve given in Figure 56
The values for Vcell – E0 are plotted against ln jcell in E mode and FC mode in Figure 57 and
Figure 58. The estimated values for mE, cE, mFC, and cFC corresponding to the
experimentally measured Vcell-jcell curve are found using regression analysis method. These
values are then substituted into equations 93, 94, 96 and 97 and hence values for Oα , Hα ,
OOj and H
Oj are calculated.
0
0.2
0.4
0.6
0.8
1
-5.5 -4.5 -3.5 -2.5 -1.5 -0.5
ln jcell
Vcell-E
O
Intercept, CE = 0.7
Slope, mE = 0.07
0
0.1
0.2
0.3
0.4
0.5
0.6
-4 -3.5 -3 -2.5 -2 -1.5 -1 -0.5 0
ln jcell
І V
cell-E
O І
Intercept, CE = 0.46
Slope, mE = 0.04
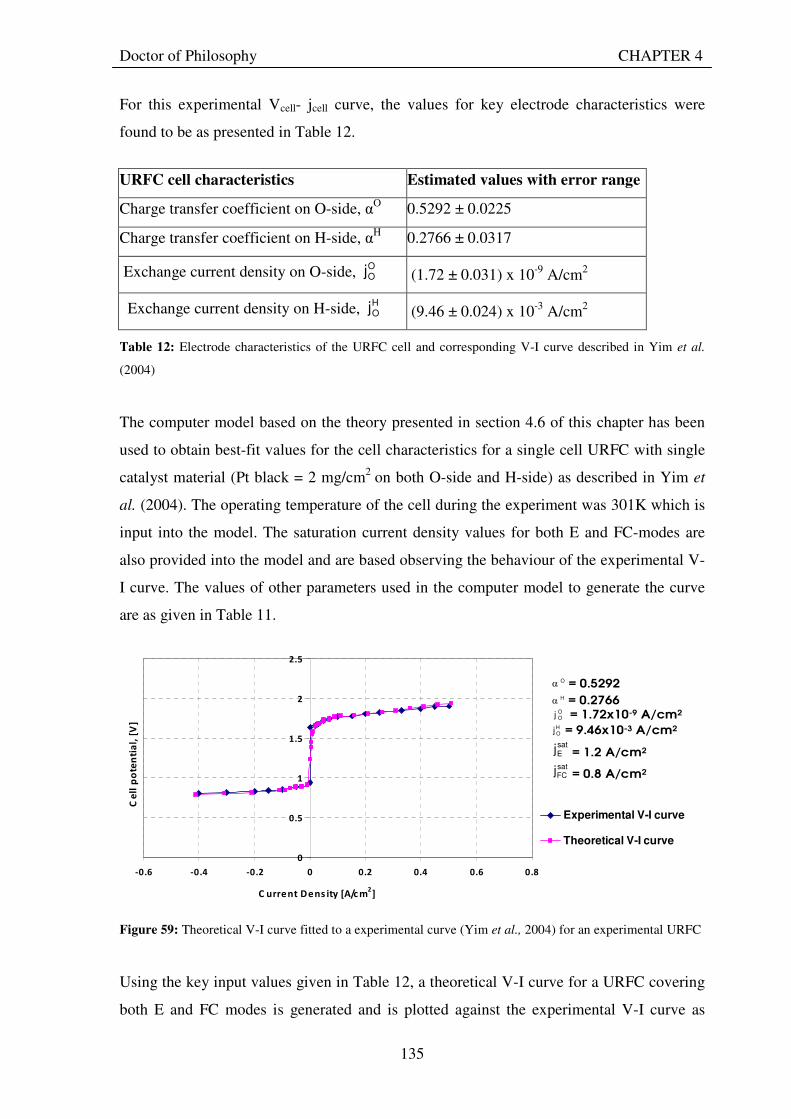
Doctor of Philosophy CHAPTER 4
135
For this experimental Vcell- jcell curve, the values for key electrode characteristics were
found to be as presented in Table 12.
URFC cell characteristics Estimated values with error range
Charge transfer coefficient on O-side, αO 0.5292 ± 0.0225
Charge transfer coefficient on H-side, αH 0.2766 ± 0.0317
Exchange current density on O-side, OOj (1.72 ± 0.031) x 10-9 A/cm2
Exchange current density on H-side, HOj (9.46 ± 0.024) x 10-3 A/cm2
Table 12: Electrode characteristics of the URFC cell and corresponding V-I curve described in Yim et al.
(2004)
The computer model based on the theory presented in section 4.6 of this chapter has been
used to obtain best-fit values for the cell characteristics for a single cell URFC with single
catalyst material (Pt black = 2 mg/cm2 on both O-side and H-side) as described in Yim et
al. (2004). The operating temperature of the cell during the experiment was 301K which is
input into the model. The saturation current density values for both E and FC-modes are
also provided into the model and are based observing the behaviour of the experimental V-
I curve. The values of other parameters used in the computer model to generate the curve
are as given in Table 11.
Figure 59: Theoretical V-I curve fitted to a experimental curve (Yim et al., 2004) for an experimental URFC
Using the key input values given in Table 12, a theoretical V-I curve for a URFC covering
both E and FC modes is generated and is plotted against the experimental V-I curve as
0
0.5
1
1.5
2
2.5
-0.6 -0.4 -0.2 0 0.2 0.4 0.6 0.8
C urrent Dens ity [A/c m2]
Ce
ll p
ote
nti
al,
[V
]
Experimental V-I curve
Theoretical V-I curve
Oα = 0.5292 Hα = 0.2766
OOj = 1.72x10⁻⁹ A/cm2
HOj = 9.46x10⁻³ A/cm2
satEj = 1.2 A/cm2 satFCj = 0.8 A/cm2
Doctor of Philosophy CHAPTER 4
136
shown in Figure 59. It can be observed that there is a very close fit between the empirical
and theoretically-generated curves for the cell characteristics calculated using the curve fit
method as described in earlier in this section.
In this chapter, a general theoretical relationship between cell voltage and current density
in both E and FC-modes of a PEM URFC are derived by modifying the standard Butler-
Volmer equations. From the analysis that’s been conducted, it can be shown that a truly
reversible electrode functioning equally well in FC and E-modes has a charge transfer
coefficient of 0.5. If the charge transfer coefficient of a particular electrode is greater than
0.5, the electrode performs better in E-mode than in FC-mode. Conversely, if the
coefficient is less than 0.5, FC-mode performance is superior. These findings apply to both
the hydrogen and oxygen electrodes.
The theoretical relationship also shows that a larger value for exchange current density
always improves an electrode’s performance in both E-mode and FC-mode. Similarly,
higher values of saturation current density in both E and FC modes will favour the
performance in both modes of a URFC.
4.10 CONCLUSIONS
A general theoretical relationship between cell voltage and current density for a PEM
URFC operating in both E and FC mode operation has been developed in this chapter, by
modifying the Butler-Volmer equations for each electrode to incorporate the effects of
saturation behaviour, and taking into account the effects of internal current, membrane
proton and electron conductivities, and the resistances to electron current of electrodes and
GDBs. The model has been used to explore the separate effects of charge densities,
exchange current densities, and saturation current densities on the URFC polarisation
curve, and identify clear directions for improving dual mode URFC performance.
Based on the modified Butler-Volmer equations developed in this chapter, a computer
model of URFC operation in both modes has been developed using Excel and Visual Basic.
This model can be used to obtain the best-fit values for the electrode characteristics for
URFCs wit single catalyst materials active in each mode on each electrode. The model can

Doctor of Philosophy CHAPTER 4
137
generate V-I curve for a URFC operating in both E and FC modes, given as input
parameters the exchange current densities and charge transfer coefficients for both
electrodes and the saturation current densities in both modes. The computer model has
been tested for an URFC polarisation curve available from literature and the model gives a
good fit.
An experimental program to design, construct and measure the performance of single cell
URFCs with various catalyst types and loadings is described in the next chapter. The
experimental results obtained from his program are then used in Chapter 6 to test the use
and validity of the computer model developed, and in turn the theoretical approach on
which the model is based.
CHAPTER 5
138
5. EXPERIMENTAL INVESTIGATION OF URFCS
5.1 DESIGN AIMS FOR EXPERIMENTAL URFCS
Drawing upon the theoretical analysis in chapter 4 and the general work on URFCs done to
date as reviewed in chapters 2 and 3, a number of key design aims for URFCs suitable for
RAPS applications can be identified.
Firstly the performance of a URFC in E-mode and FC-mode in terms of energy efficiency
needs to be equal to or only slightly lower than that of a comparable dedicated PEM
electrolyser and dedicated PEM fuel cell (section 3.4 of chapter 3). To achieve this goal, a
major technical challenge is to develop a stable and highly active bifunctional oxygen
electrode. The choice of electrocatalysts to use is critical in this endeavour (Song et al.,
2006). Platinum in its reduced form has been found to be the best electrocatalyst for
oxygen reduction (reaction with H+ ions and electrons to form water) but is not the best
catalyst for water splitting (to form oxygen gas, H+ ions and electrons) (Song et al., 2006;
Yao et al., 2007).
Besides the development of reversible electrodes, proper and reliable reactant management
is very important to achieve better URFC performance (Mitlitsky et al., 1998b). The
management of reactants inside the URFC cell is greatly dependent on the material and
construction of the cell or stack. Maintaining sufficient water flow to the catalyst layer in
the oxygen electrode during electrolysis mode, while avoiding flooding of gas diffusion
channels in the backing layer of this electrode on switching to electrolysis mode, is vital for
reliable functioning of URFC. Avoidance of flooding requires keeping the quantity of
water in and around the oxygen electrode to the minimum that is needed to allow
electrolysis to take place unhindered by water shortage, and effective removal of water
(liquid and vapour) that is produced in fuel cell operation. This requirement is usually
accomplished by using a gas diffusion backing (GDB) that has a mixture of hydrophilic
and hydrophobic regions. The hydrophilic regions ensure sufficient delivery of water to the
catalyst so that the membrane is hydrated during electrolyser operation. The hydrophobic
CHAPTER 5
139
regions ensure sufficient delivery of oxygen to the electrocatalyst for oxygen reduction
reaction to take place during fuel cell reaction.
In conventional PEM fuel cells, the GDB is generally made of a porous carbon material
such as carbon cloth or paper. These are not suitable for a URFC because oxidation of
material surfaces in the oxygen electrode and backing layers due to the combined presence
of water and oxygen must be avoided. Ioroi et al. (2002) investigated a variety of titanium
GDBs coated with different amounts of polytetrafluoroethylene (PTFE) loadings for the
oxygen electrode of a URFC. It was found that the URFC performance significantly
depended on the amount of PTFE loading in the backing layer on the oxygen electrode,
with increasing loadings beyond a certain amount leading to poorer performance. But
URFCs with no PTFE-coated backing layer performed very poorly. However, the PTFE
coating on the GDB of the H-electrode did not affect the cell performance.
A second key design aim is to achieve a total system cost for a URFC that is well below the
total cost for a system comprising a comparable separate PEM electrolyser and PEM fuel
cell (as discussed earlier in chapter 3). For URFC to be attractive instead of a dedicated
electrolyser and fuel cell in a solar/wind hydrogen RAPS system, the delivered power of
about 1.7 kWe in E-mode is necessary to meet a daily average electrical power requirement
of 5 kWh in a typical remote household in Australia (Table 7 of this thesis).
The analysis of solar-hydrogen URFC systems for RAPS applications indicated that a key
design goal is for the capital costs of a URFC to be as little above those of a separate PEM
electrolyser of the same capacity as possible (section 3.4). Hence substantial reductions in
the current capital costs URFCs – which are in any case for experimental or small-scale
units – will be required (section 3.3.1). As just mentioned, achieving this goal requires
keeping the costs of materials and construction of a URFC close to those for a PEM
electrolyser of the same membrane area and current density. It will also be essential to keep
the balance of system costs for the URFC – that is, for water management, thermal
regulation, and gas supply and extraction – lower than the balance of system costs for a
separate PEM electrolyser and fuel cell with equivalent performance.
CHAPTER 5
140
5.2 DESIGN AND CONSTRUCTION OF EXPERIMENTAL URFCS
5.2.1 Overall design
In order to begin to address the design aims as outlined in section 5.1, several experimental
single cell URFCs with different catalyst types and loadings have been designed and
constructed at the RMIT Renewable Energy Laboratory as part of the present project. To
hold costs low, the design of the cells has been kept as simple as possible. The design
further allows easy assembly and disassembly of URFCs so that the same components can
be used for different membrane electrode assemblies. The design of the URFCs developed
is schematically shown in Figure 60.
A key feature of this design is the provision of a single water reservoir in the lowest
horizontal channel in the end plate in contact with the oxygen electrode. The water level in
this reservoir is maintained at a constant level throughout E-mode and FC-mode operation
by adding or removing water from an external water supply. The water wets a strip of the
porous backing layer along its lower edge and continually rises through this layer, which is
hydrophilic, by capillary action and diffusion through polymer material. Hence a
continuous supply of water to the catalyst sites during electrolysis is provided. The
membrane itself is hydrated by using humidified hydrogen and oxygen gas inputs from
storage.

CHAPTER 5
141
Figure 60: The design for a single-cell unitised regenerative fuel cell for use in experimental testing
5.2.2 Membrane electrode assemblies
The functionality and structure of Membrane Electrode Assemblies (MEAs) have been
described earlier in section 2.9.2.1. Unlike fuel cell MEAs, URFC membrane electrode
assemblies are not widely available commercially (Frank, 2000). The MEAs used in the
experiments discussed in this chapter were purchased from Lynntech, Inc., USA and
employ a Nafion® 115 membrane with an active area of 5 cm2.
Several single-cell URFCs were constructed and tested using the purchased MEAs of
different catalyst types and loadings as detailed in Table 13. Ten out of the total of 18
MEAs tested had a single active catalyst material on both electrodes. These 10 MEAs with
single catalyst type active in each mode were selected in order to use the computer-based
theoretical model described in detail in chapter 4, section 4.6 to determine the key
electrode characteristics such as charge transfer coefficients, exchange current densities,
Tension bolts
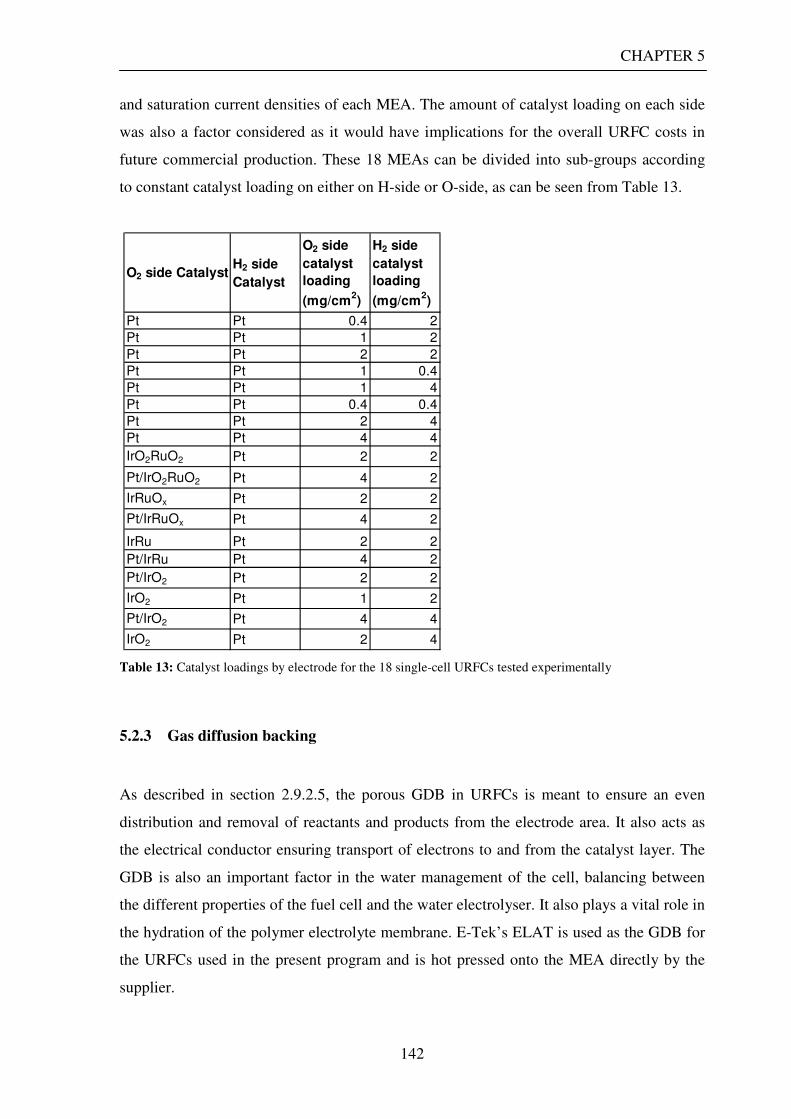
CHAPTER 5
142
and saturation current densities of each MEA. The amount of catalyst loading on each side
was also a factor considered as it would have implications for the overall URFC costs in
future commercial production. These 18 MEAs can be divided into sub-groups according
to constant catalyst loading on either on H-side or O-side, as can be seen from Table 13.
O2 side CatalystH2 side
Catalyst
O2 side
catalyst
loading
(mg/cm2)
H2 side
catalyst
loading
(mg/cm2)
Pt Pt 0.4 2
Pt Pt 1 2
Pt Pt 2 2
Pt Pt 1 0.4
Pt Pt 1 4
Pt Pt 0.4 0.4
Pt Pt 2 4
Pt Pt 4 4
IrO2RuO2 Pt 2 2
Pt/IrO2RuO2 Pt 4 2
IrRuOx Pt 2 2
Pt/IrRuOx Pt 4 2
IrRu Pt 2 2
Pt/IrRu Pt 4 2
Pt/IrO2 Pt 2 2
IrO2 Pt 1 2
Pt/IrO2 Pt 4 4
IrO2 Pt 2 4
Table 13: Catalyst loadings by electrode for the 18 single-cell URFCs tested experimentally
5.2.3 Gas diffusion backing
As described in section 2.9.2.5, the porous GDB in URFCs is meant to ensure an even
distribution and removal of reactants and products from the electrode area. It also acts as
the electrical conductor ensuring transport of electrons to and from the catalyst layer. The
GDB is also an important factor in the water management of the cell, balancing between
the different properties of the fuel cell and the water electrolyser. It also plays a vital role in
the hydration of the polymer electrolyte membrane. E-Tek’s ELAT is used as the GDB for
the URFCs used in the present program and is hot pressed onto the MEA directly by the
supplier.
CHAPTER 5
143
The ELAT is essentially a carbon cloth flow field that maximises gas transport to the
reaction zone while enabling water vapor and unreacted gases to move away from the zone.
When ELAT is attached to the gas diffusion layer, it maximises the transfer of hydrogen
and oxygen gases as well as water vapor, which maximises power output and it provides an
optimised interface for proton transport. It also provides superior reliability and durability.
There may, however, be concerns about using ELAT for longer-term operation, since the
carbon material may be subject to oxidation or other corrosion. These concerns, although
potentially important in designing future URFCs, have been beyond the scope of the
present thesis to address.
5.2.4 Flow channels and end plates
The end plates in a URFC must be rigid throughout their length and height so that when the
screws are tightened on each of the corners, the plates provide even pressure throughout the
surface. In the present design 316-grade stainless steel has been selected for the end plates
because of its favourable characteristics such as good electrical conductance, easy
machinability. The flow channels were also cut using a router on a CNC machine by lab
technicians using the mechanical drawings provided in one side of the end plate as shown
in Figure 61 and Figure 62.
A simple single serpentine channel (Figure 61 and Figure 62) is chosen in this URFC
design. In this channel type, only one path exists for the gas across a flow field plate, and
any liquid water accumulating in the channels is therefore quickly pushed out of the cell.
Watkins et al., (1991) claim that the preferred ranges are 1.14 to 1.4 mm for the channel
width, 0.89 to 1.4 mm for the land width and 1.02 to 2.04 mm for the channel depth. Other
studies in the literature, including Dutta et al. (2001), Li and Sabir (2005) and
Sivasubramanian et al. (2007) report using flow channel dimensions of similar magnitude.
The dimensions of flow channels on H-side and O-side used in the current experimental
studies are detailed in Figure 61 and Figure 62.
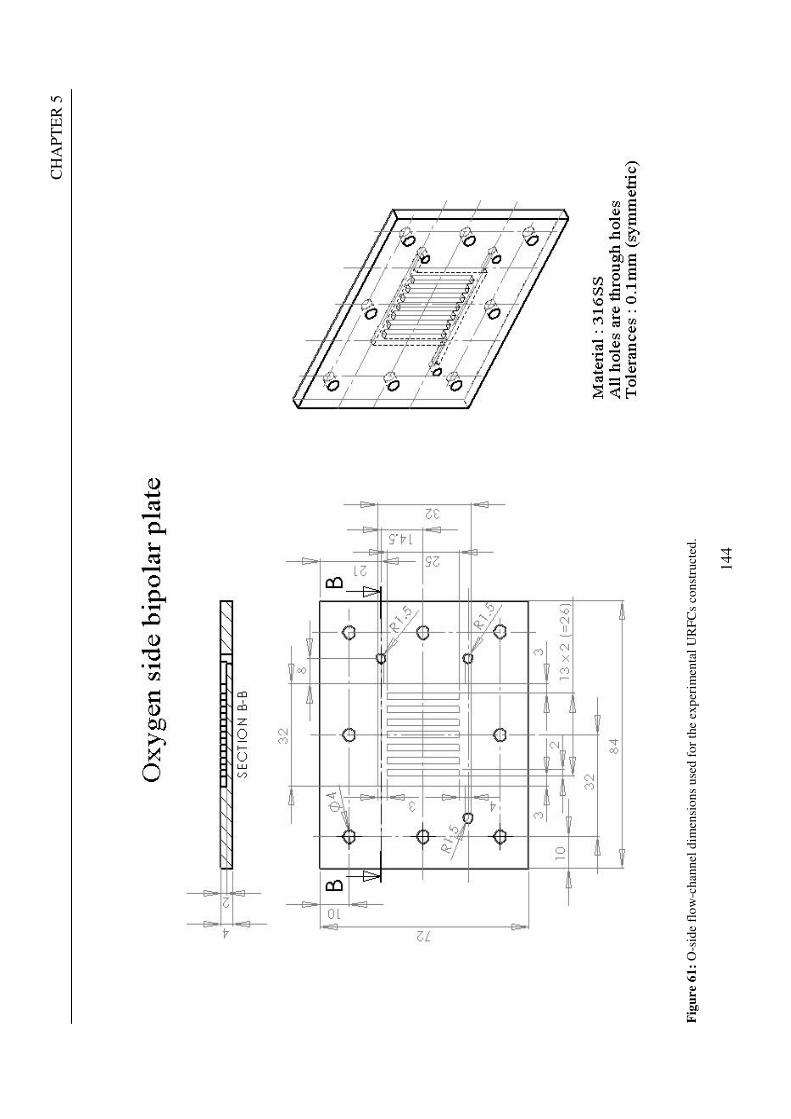
CH
AP
TE
R 5
144
Fig
ure
61
: O
-sid
e fl
ow
-chan
nel
dim
ensi
on
s u
sed
fo
r th
e ex
per
imen
tal
UR
FC
s co
nst
ruct
ed.
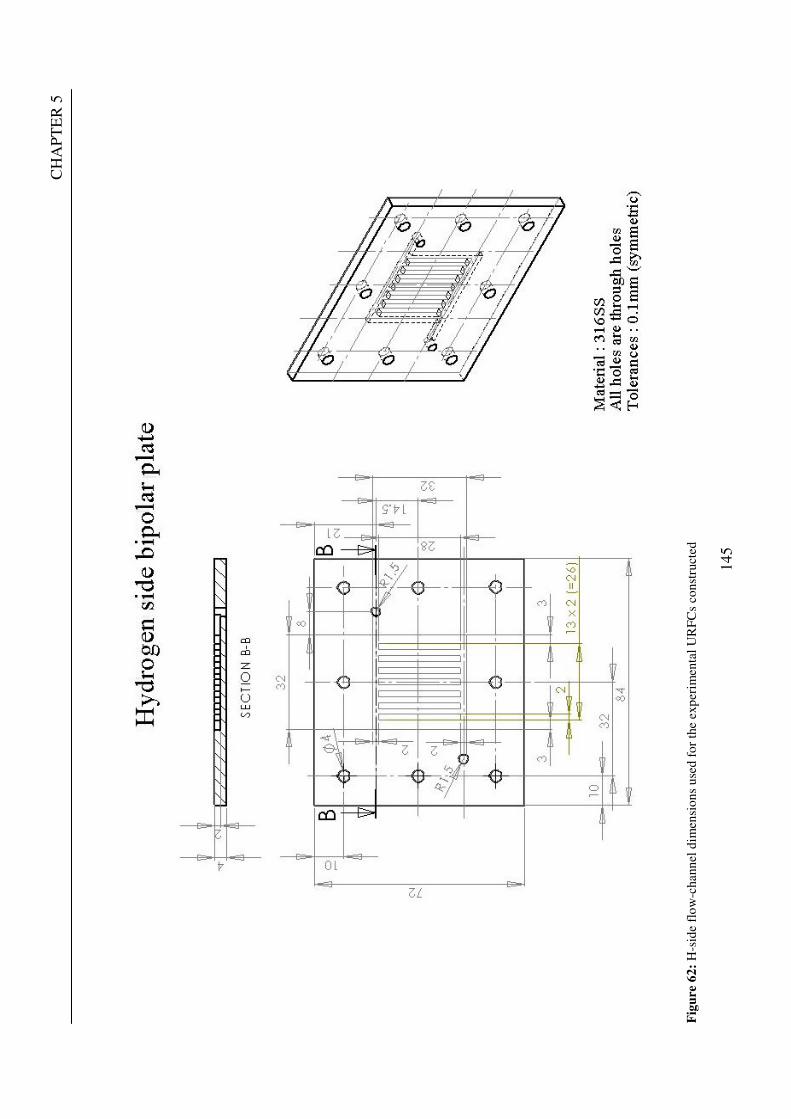
CH
AP
TE
R 5
145
Fig
ure
62
: H
-sid
e fl
ow
-chan
nel
dim
ensi
on
s u
sed
fo
r th
e ex
per
imen
tal
UR
FC
s co
nst
ruct
ed
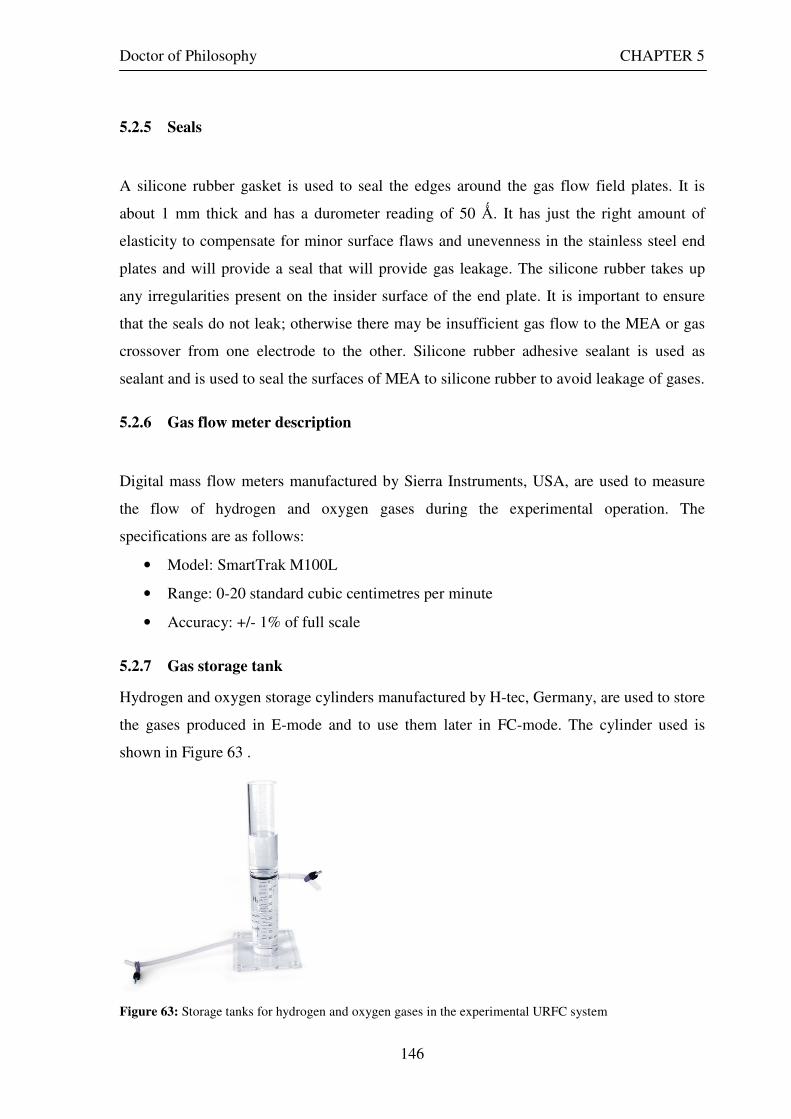
Doctor of Philosophy CHAPTER 5
146
5.2.5 Seals
A silicone rubber gasket is used to seal the edges around the gas flow field plates. It is
about 1 mm thick and has a durometer reading of 50 Ǻ. It has just the right amount of
elasticity to compensate for minor surface flaws and unevenness in the stainless steel end
plates and will provide a seal that will provide gas leakage. The silicone rubber takes up
any irregularities present on the insider surface of the end plate. It is important to ensure
that the seals do not leak; otherwise there may be insufficient gas flow to the MEA or gas
crossover from one electrode to the other. Silicone rubber adhesive sealant is used as
sealant and is used to seal the surfaces of MEA to silicone rubber to avoid leakage of gases.
5.2.6 Gas flow meter description
Digital mass flow meters manufactured by Sierra Instruments, USA, are used to measure
the flow of hydrogen and oxygen gases during the experimental operation. The
specifications are as follows:
• Model: SmartTrak M100L
• Range: 0-20 standard cubic centimetres per minute
• Accuracy: +/- 1% of full scale
5.2.7 Gas storage tank
Hydrogen and oxygen storage cylinders manufactured by H-tec, Germany, are used to store
the gases produced in E-mode and to use them later in FC-mode. The cylinder used is
shown in Figure 63 .
Figure 63: Storage tanks for hydrogen and oxygen gases in the experimental URFC system
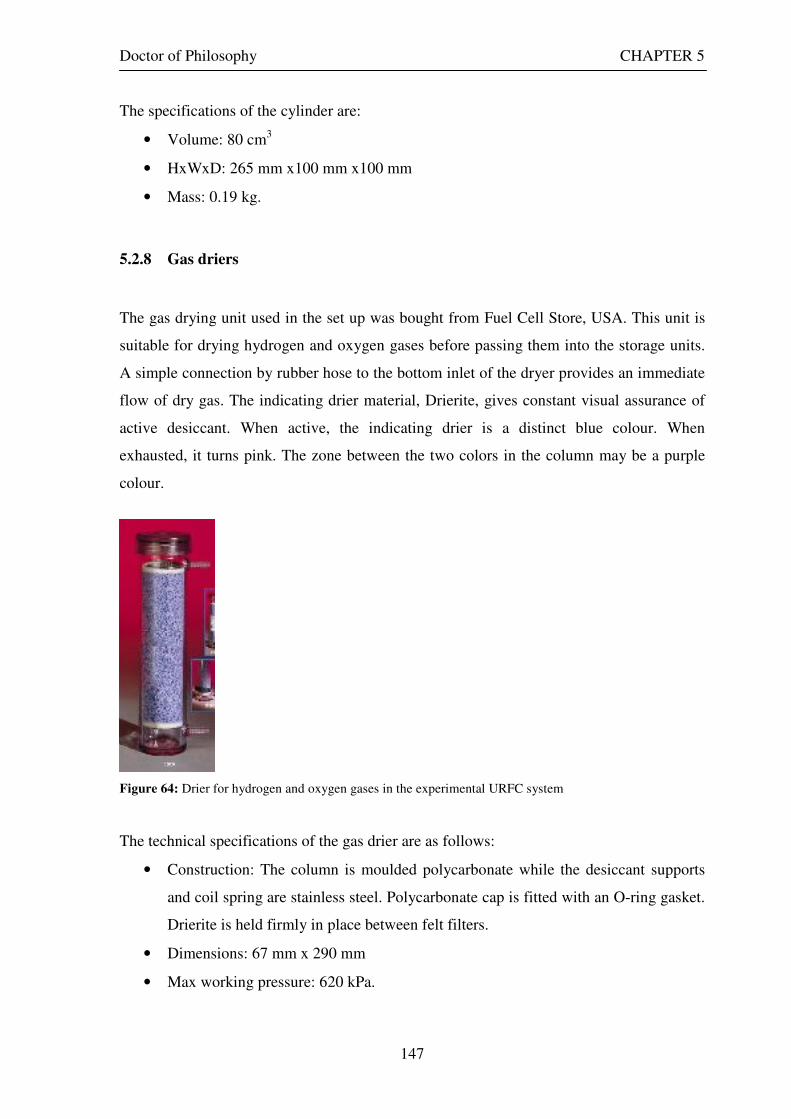
Doctor of Philosophy CHAPTER 5
147
The specifications of the cylinder are:
• Volume: 80 cm3
• HxWxD: 265 mm x100 mm x100 mm
• Mass: 0.19 kg.
5.2.8 Gas driers
The gas drying unit used in the set up was bought from Fuel Cell Store, USA. This unit is
suitable for drying hydrogen and oxygen gases before passing them into the storage units.
A simple connection by rubber hose to the bottom inlet of the dryer provides an immediate
flow of dry gas. The indicating drier material, Drierite, gives constant visual assurance of
active desiccant. When active, the indicating drier is a distinct blue colour. When
exhausted, it turns pink. The zone between the two colors in the column may be a purple
colour.
Figure 64: Drier for hydrogen and oxygen gases in the experimental URFC system
The technical specifications of the gas drier are as follows:
• Construction: The column is moulded polycarbonate while the desiccant supports
and coil spring are stainless steel. Polycarbonate cap is fitted with an O-ring gasket.
Drierite is held firmly in place between felt filters.
• Dimensions: 67 mm x 290 mm
• Max working pressure: 620 kPa.
Doctor of Philosophy CHAPTER 5
148
5.3 EXPERIMENTAL SETUP
The experimental set up used to evaluate the performance of the URFCs in both E and FC
modes within the permissible input voltage range and obtain cell characteristics for use in
the computer modelling component of the study is shown schematically in Figure 65 and a
photograph of the actual apparatus is presented in Figure 66.
The experimental setup as shown in Figure 66 consists of a single-cell URFC, hydrogen
and oxygen gas flow meters, gas driers, hydrogen gas storage tank, water supply tank, DC
power supply input, resistive load, and several multimeters to measure the input and output
current and voltage values. In E-mode operation, the URFC produces hydrogen and oxygen
gases. These gases are then passed through separate gas driers to dry the gases before they
enter the mass flow meters. The exit gases from the flow meters are then collected in
separate storage tanks over water.
In each set of experiments, the cell was operated in E mode initially, followed by a period
of FC-mode operation.
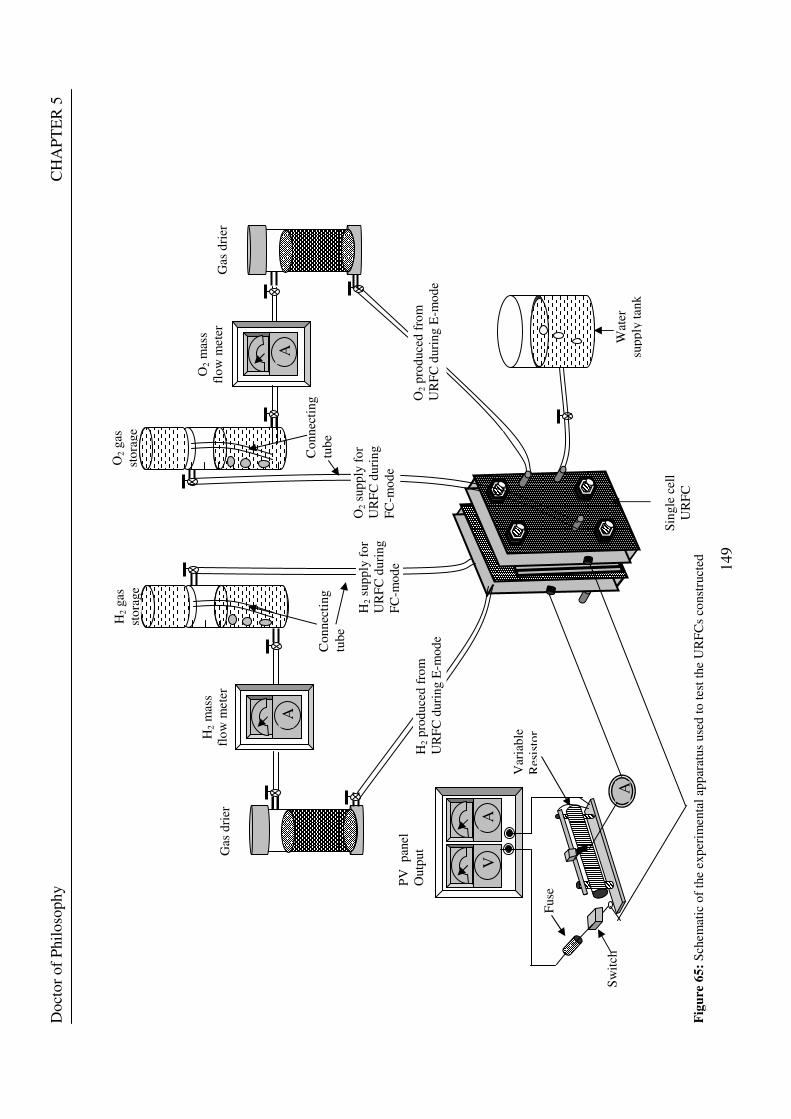
Doct
or
of
Phil
oso
ph
y
C
HA
PT
ER
5
149
Fig
ure
65
: S
chem
atic
of
the
exp
erim
enta
l ap
par
atus
use
d t
o t
est
the
UR
FC
s co
nst
ruct
ed
Co
nn
ecti
ng
tub
e
A
A
Sin
gle
cel
l U
RF
C
A
V
A
Sw
itch
Fuse
PV
p
anel
O
utp
ut
Var
iab
le
Res
isto
r
Gas
dri
er
H2 m
ass
flo
w m
eter
G
as d
rier
O2 m
ass
flo
w m
eter
H2 g
as
sto
rage
O2 g
as
sto
rage
Co
nn
ecti
ng
tub
e
Wat
er
sup
ply
tan
k
H2 p
rod
uce
d f
rom
U
RF
C d
uri
ng E
-mo
de
O2 s
up
ply
fo
r U
RF
C d
uri
ng
FC
-mo
de
H2 s
up
ply
fo
r U
RF
C d
uri
ng
FC
-mo
de
O
2 p
rod
uce
d f
rom
U
RF
C d
uri
ng E
-mo
de
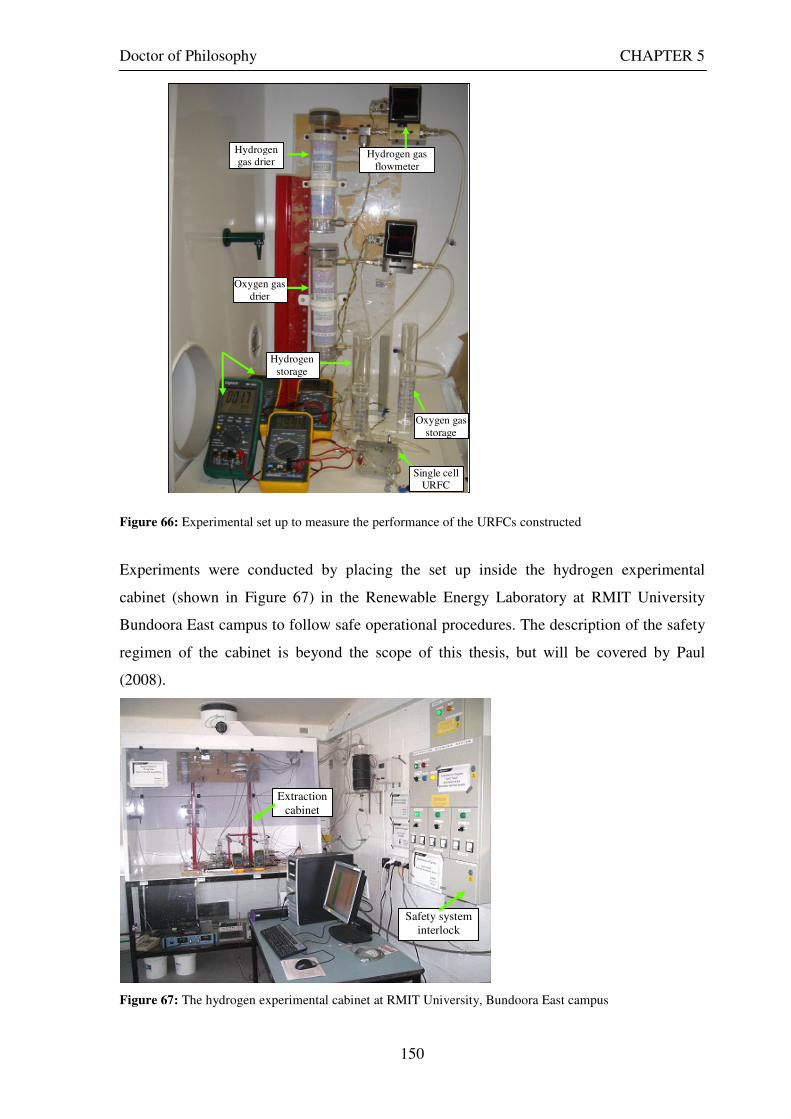
Doctor of Philosophy CHAPTER 5
150
Figure 66: Experimental set up to measure the performance of the URFCs constructed
Experiments were conducted by placing the set up inside the hydrogen experimental
cabinet (shown in Figure 67) in the Renewable Energy Laboratory at RMIT University
Bundoora East campus to follow safe operational procedures. The description of the safety
regimen of the cabinet is beyond the scope of this thesis, but will be covered by Paul
(2008).
Figure 67: The hydrogen experimental cabinet at RMIT University, Bundoora East campus
Extraction cabinet
Safety system interlock
Hydrogen gas flowmeter
Hydrogen gas drier
Oxygen gas drier
Single cell URFC
Oxygen gas storage
Hydrogen storage
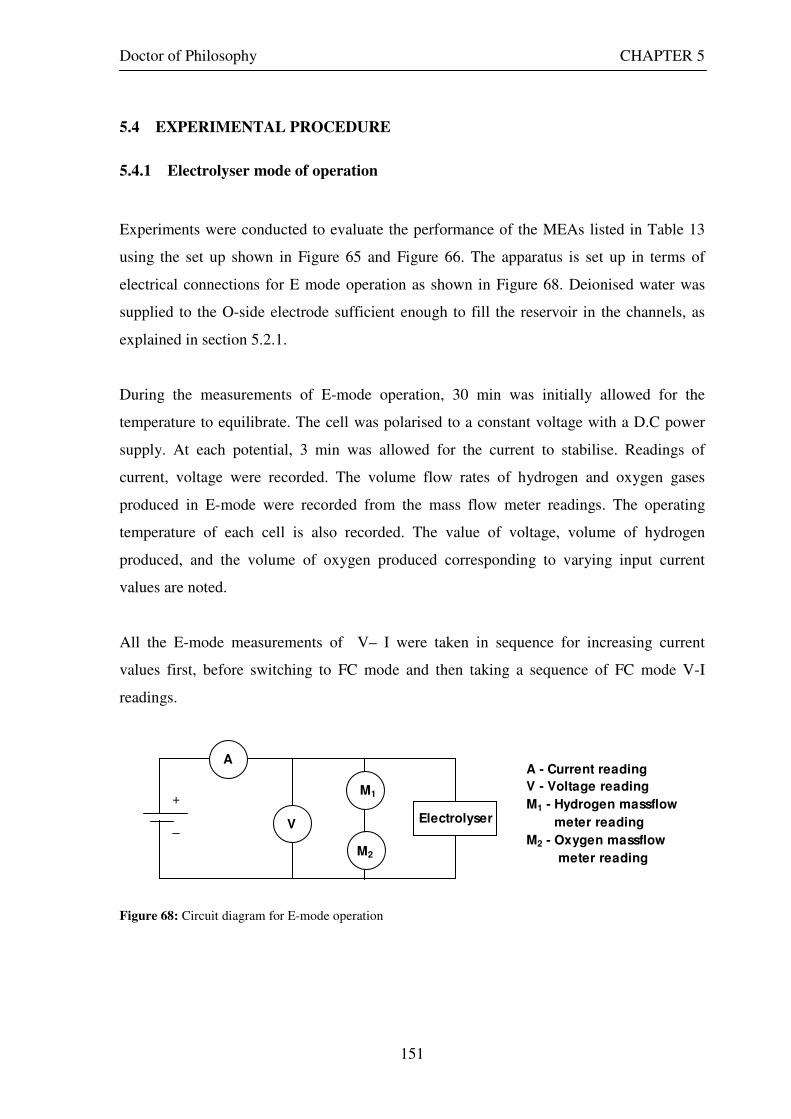
Doctor of Philosophy CHAPTER 5
151
5.4 EXPERIMENTAL PROCEDURE
5.4.1 Electrolyser mode of operation
Experiments were conducted to evaluate the performance of the MEAs listed in Table 13
using the set up shown in Figure 65 and Figure 66. The apparatus is set up in terms of
electrical connections for E mode operation as shown in Figure 68. Deionised water was
supplied to the O-side electrode sufficient enough to fill the reservoir in the channels, as
explained in section 5.2.1.
During the measurements of E-mode operation, 30 min was initially allowed for the
temperature to equilibrate. The cell was polarised to a constant voltage with a D.C power
supply. At each potential, 3 min was allowed for the current to stabilise. Readings of
current, voltage were recorded. The volume flow rates of hydrogen and oxygen gases
produced in E-mode were recorded from the mass flow meter readings. The operating
temperature of each cell is also recorded. The value of voltage, volume of hydrogen
produced, and the volume of oxygen produced corresponding to varying input current
values are noted.
All the E-mode measurements of V– I were taken in sequence for increasing current
values first, before switching to FC mode and then taking a sequence of FC mode V-I
readings.
Figure 68: Circuit diagram for E-mode operation
Electrolyser V
A
+
–
M1
M2
A - Current reading
V - Voltage reading
M1 - Hydrogen massflow
meter reading
M2 - Oxygen massflow
meter reading
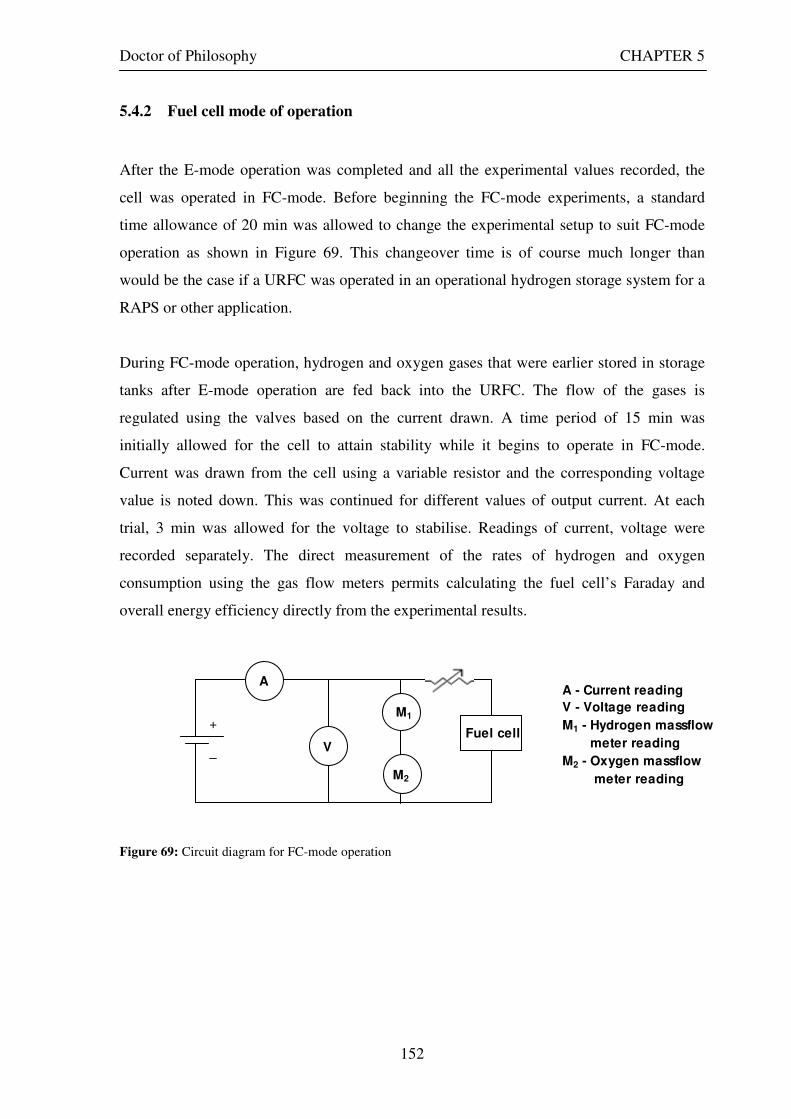
Doctor of Philosophy CHAPTER 5
152
5.4.2 Fuel cell mode of operation
After the E-mode operation was completed and all the experimental values recorded, the
cell was operated in FC-mode. Before beginning the FC-mode experiments, a standard
time allowance of 20 min was allowed to change the experimental setup to suit FC-mode
operation as shown in Figure 69. This changeover time is of course much longer than
would be the case if a URFC was operated in an operational hydrogen storage system for a
RAPS or other application.
During FC-mode operation, hydrogen and oxygen gases that were earlier stored in storage
tanks after E-mode operation are fed back into the URFC. The flow of the gases is
regulated using the valves based on the current drawn. A time period of 15 min was
initially allowed for the cell to attain stability while it begins to operate in FC-mode.
Current was drawn from the cell using a variable resistor and the corresponding voltage
value is noted down. This was continued for different values of output current. At each
trial, 3 min was allowed for the voltage to stabilise. Readings of current, voltage were
recorded separately. The direct measurement of the rates of hydrogen and oxygen
consumption using the gas flow meters permits calculating the fuel cell’s Faraday and
overall energy efficiency directly from the experimental results.
Figure 69: Circuit diagram for FC-mode operation
V
A
+
–
M1
M2
A - Current reading
V - Voltage reading
M1 - Hydrogen massflow
meter reading
M2 - Oxygen massflow
meter reading
Fuel cell
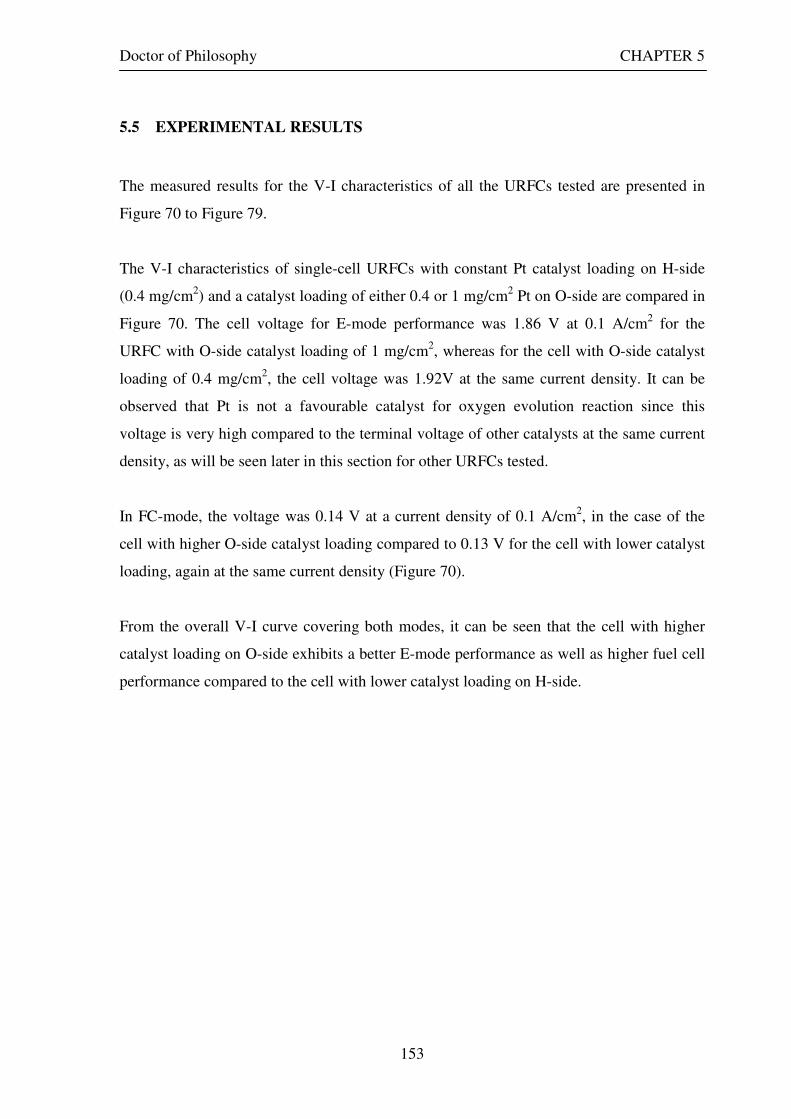
Doctor of Philosophy CHAPTER 5
153
5.5 EXPERIMENTAL RESULTS
The measured results for the V-I characteristics of all the URFCs tested are presented in
Figure 70 to Figure 79.
The V-I characteristics of single-cell URFCs with constant Pt catalyst loading on H-side
(0.4 mg/cm2) and a catalyst loading of either 0.4 or 1 mg/cm2 Pt on O-side are compared in
Figure 70. The cell voltage for E-mode performance was 1.86 V at 0.1 A/cm2 for the
URFC with O-side catalyst loading of 1 mg/cm2, whereas for the cell with O-side catalyst
loading of 0.4 mg/cm2, the cell voltage was 1.92V at the same current density. It can be
observed that Pt is not a favourable catalyst for oxygen evolution reaction since this
voltage is very high compared to the terminal voltage of other catalysts at the same current
density, as will be seen later in this section for other URFCs tested.
In FC-mode, the voltage was 0.14 V at a current density of 0.1 A/cm2, in the case of the
cell with higher O-side catalyst loading compared to 0.13 V for the cell with lower catalyst
loading, again at the same current density (Figure 70).
From the overall V-I curve covering both modes, it can be seen that the cell with higher
catalyst loading on O-side exhibits a better E-mode performance as well as higher fuel cell
performance compared to the cell with lower catalyst loading on H-side.

Doctor of Philosophy CHAPTER 5
154
0
0.5
1
1.5
2
-0.15 -0.1 -0.05 0 0.05 0.1 0.15 0.2
Current density, [A/cm2]
Vo
lta
ge
, [V
]
H2 side: Pt - 0.4 mg/cm2 O2 side: Pt - 0.4 mg/cm2
H2 side: Pt - 0.4 mg/cm2 O2 side: Pt - 1 mg/cm2
Figure 70: Measured URFC polarisation curves for MEAs with 0.4 mg/cm2 Pt loading on H-side and 0.4
mg/cm2 and 1 mg/cm2 Pt loading on O-side
The effect of catalyst loading on water electrolysis and fuel cell performance in a URFC
when a constant Pt loading of 2 mg/cm2 on H-side is maintained while varying O-side Pt
catalyst loading between 0.4 and 2 mg/cm2 can be observed in the measured polarisation
curves as shown in Figure 71.
In E-mode operation, the cell voltage was 1.89 V at 0.1 A/cm2 when O-side catalyst
loading was 0.4 mg/cm2, and this decreased to 1.86 A/cm2 when the O-side catalyst loading
was increased to 1 mg/cm2. The cell voltage further decreased, but only by a small amount,
to 1.85 V at the same current density when the catalyst loading was raised to 2 mg/cm2 on
O-side.
During FC-mode operation, at a current density of 0.1 A/cm2 the voltage was 0.193 V
when the cell had 2 mg/cm2 Pt loading on O-side. This reduced to 0.178 V when the
loading was reduced to 1 mg/cm2 and was much lower again (0.17 V) for 0.4 mg/cm2 Pt
loading.
Thus, it can be noted that when the H-side catalyst loading is maintained constant and the
catalyst loading on O-side is varied up to 2mg/cm2, the fuel cell and water electrolysis
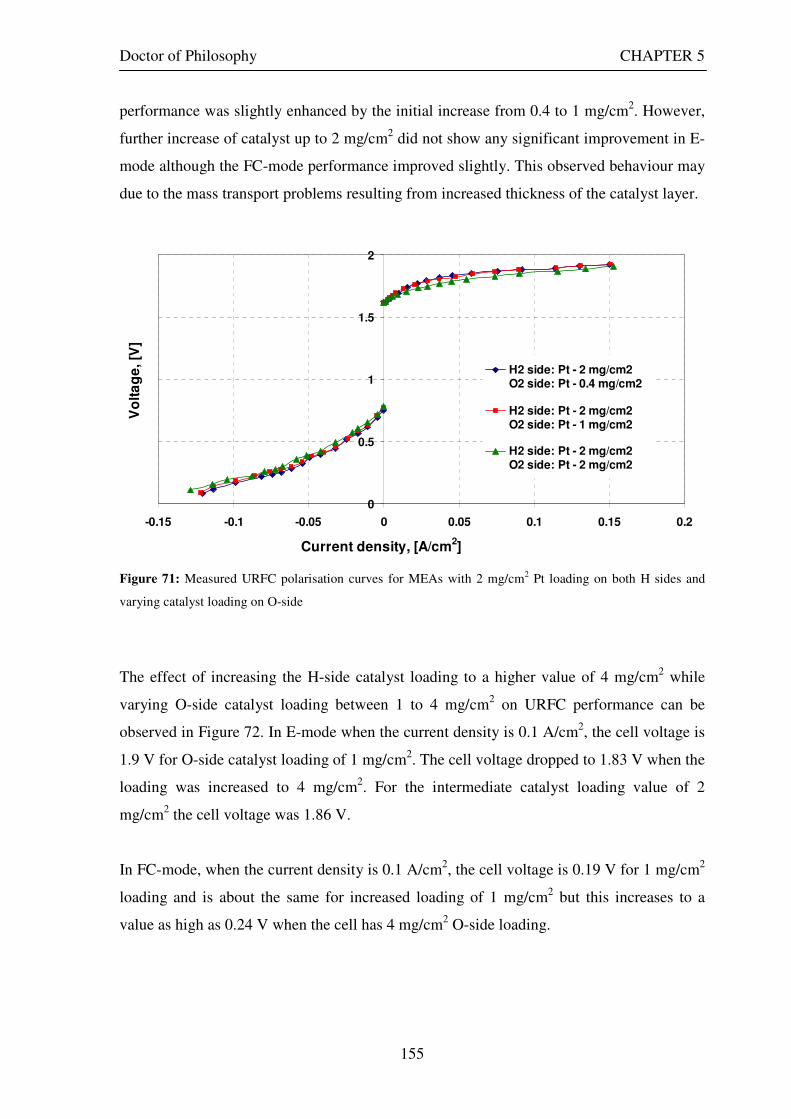
Doctor of Philosophy CHAPTER 5
155
performance was slightly enhanced by the initial increase from 0.4 to 1 mg/cm2. However,
further increase of catalyst up to 2 mg/cm2 did not show any significant improvement in E-
mode although the FC-mode performance improved slightly. This observed behaviour may
due to the mass transport problems resulting from increased thickness of the catalyst layer.
0
0.5
1
1.5
2
-0.15 -0.1 -0.05 0 0.05 0.1 0.15 0.2
Current density, [A/cm2]
Vo
lta
ge
, [V
]
H2 side: Pt - 2 mg/cm2 O2 side: Pt - 0.4 mg/cm2
H2 side: Pt - 2 mg/cm2 O2 side: Pt - 1 mg/cm2
H2 side: Pt - 2 mg/cm2 O2 side: Pt - 2 mg/cm2
Figure 71: Measured URFC polarisation curves for MEAs with 2 mg/cm2 Pt loading on both H sides and
varying catalyst loading on O-side
The effect of increasing the H-side catalyst loading to a higher value of 4 mg/cm2 while
varying O-side catalyst loading between 1 to 4 mg/cm2 on URFC performance can be
observed in Figure 72. In E-mode when the current density is 0.1 A/cm2, the cell voltage is
1.9 V for O-side catalyst loading of 1 mg/cm2. The cell voltage dropped to 1.83 V when the
loading was increased to 4 mg/cm2. For the intermediate catalyst loading value of 2
mg/cm2 the cell voltage was 1.86 V.
In FC-mode, when the current density is 0.1 A/cm2, the cell voltage is 0.19 V for 1 mg/cm2
loading and is about the same for increased loading of 1 mg/cm2 but this increases to a
value as high as 0.24 V when the cell has 4 mg/cm2 O-side loading.

Doctor of Philosophy CHAPTER 5
156
Hence, from the V-I curve given in Figure 72 we can observe that both E-mode and FC-
mode performance is improved by increasing Pt loading on O-side while maintaining a
constant Pt loading of 4 mg/cm2 on H-side.
0
0.5
1
1.5
2
-0.2 -0.15 -0.1 -0.05 0 0.05 0.1 0.15 0.2
Current density, [A/cm2]
Vo
lta
ge
, [V
]
H2 side: Pt - 4 mg/cm2 O2 side: Pt - 1 mg/cm2
H2 side: Pt - 4 mg/cm2 O2 side: Pt - 2 mg/cm2
H2 side: Pt - 4 mg/cm2 O2 side: Pt - 4 mg/cm2
Figure 72: Measured URFC polarisation curves for MEAs with 2 mg/cm2 Pt loading on both H sides and
varying catalyst loading on O-side
Figure 73 shows the URFC performance for a constant O-side Pt catalyst loading of 0.4
mg/cm2 and H-side Pt catalyst loadings of 0.4 mg/cm2 and 2 mg/cm2. There is a small
improvement in E-mode by increasing the H-side catalyst loading. However, varying the
catalyst loading on H-side does not make any notable differences in FC-mode performance
when the O-side catalyst is constant.
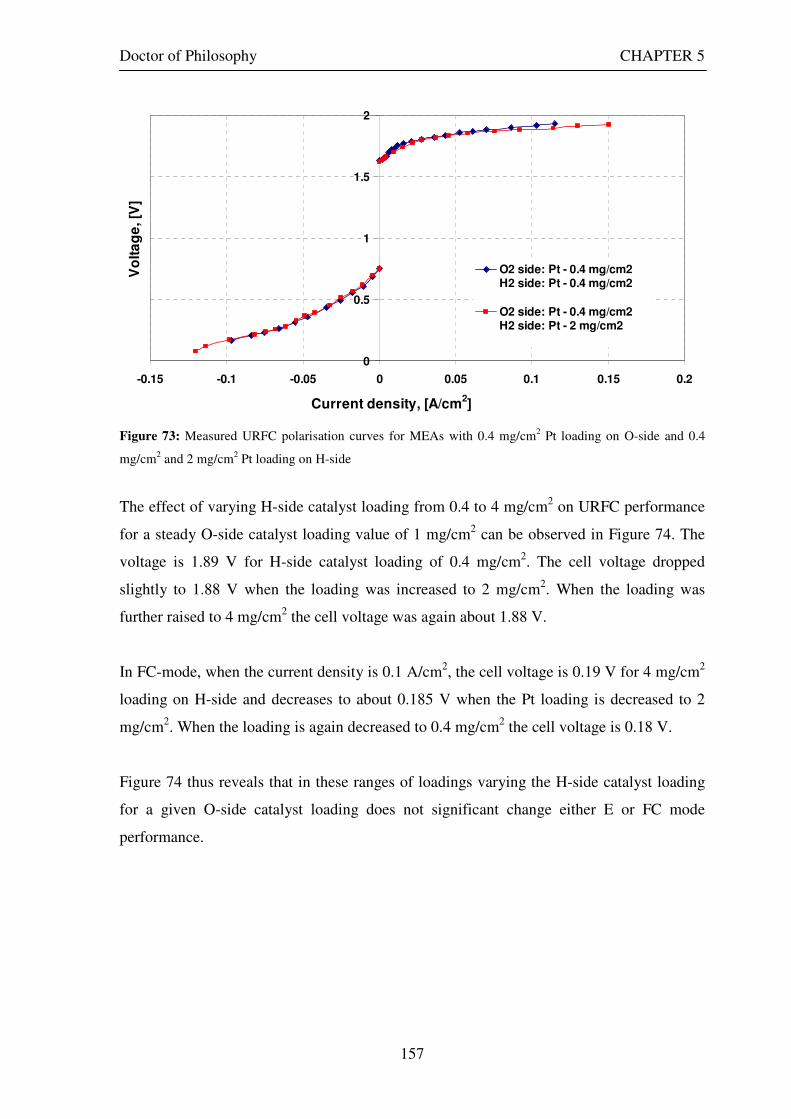
Doctor of Philosophy CHAPTER 5
157
0
0.5
1
1.5
2
-0.15 -0.1 -0.05 0 0.05 0.1 0.15 0.2
Current density, [A/cm2]
Vo
lta
ge
, [V
]
O2 side: Pt - 0.4 mg/cm2 H2 side: Pt - 0.4 mg/cm2
O2 side: Pt - 0.4 mg/cm2 H2 side: Pt - 2 mg/cm2
Figure 73: Measured URFC polarisation curves for MEAs with 0.4 mg/cm2 Pt loading on O-side and 0.4
mg/cm2 and 2 mg/cm2 Pt loading on H-side
The effect of varying H-side catalyst loading from 0.4 to 4 mg/cm2 on URFC performance
for a steady O-side catalyst loading value of 1 mg/cm2 can be observed in Figure 74. The
voltage is 1.89 V for H-side catalyst loading of 0.4 mg/cm2. The cell voltage dropped
slightly to 1.88 V when the loading was increased to 2 mg/cm2. When the loading was
further raised to 4 mg/cm2 the cell voltage was again about 1.88 V.
In FC-mode, when the current density is 0.1 A/cm2, the cell voltage is 0.19 V for 4 mg/cm2
loading on H-side and decreases to about 0.185 V when the Pt loading is decreased to 2
mg/cm2. When the loading is again decreased to 0.4 mg/cm2 the cell voltage is 0.18 V.
Figure 74 thus reveals that in these ranges of loadings varying the H-side catalyst loading
for a given O-side catalyst loading does not significant change either E or FC mode
performance.
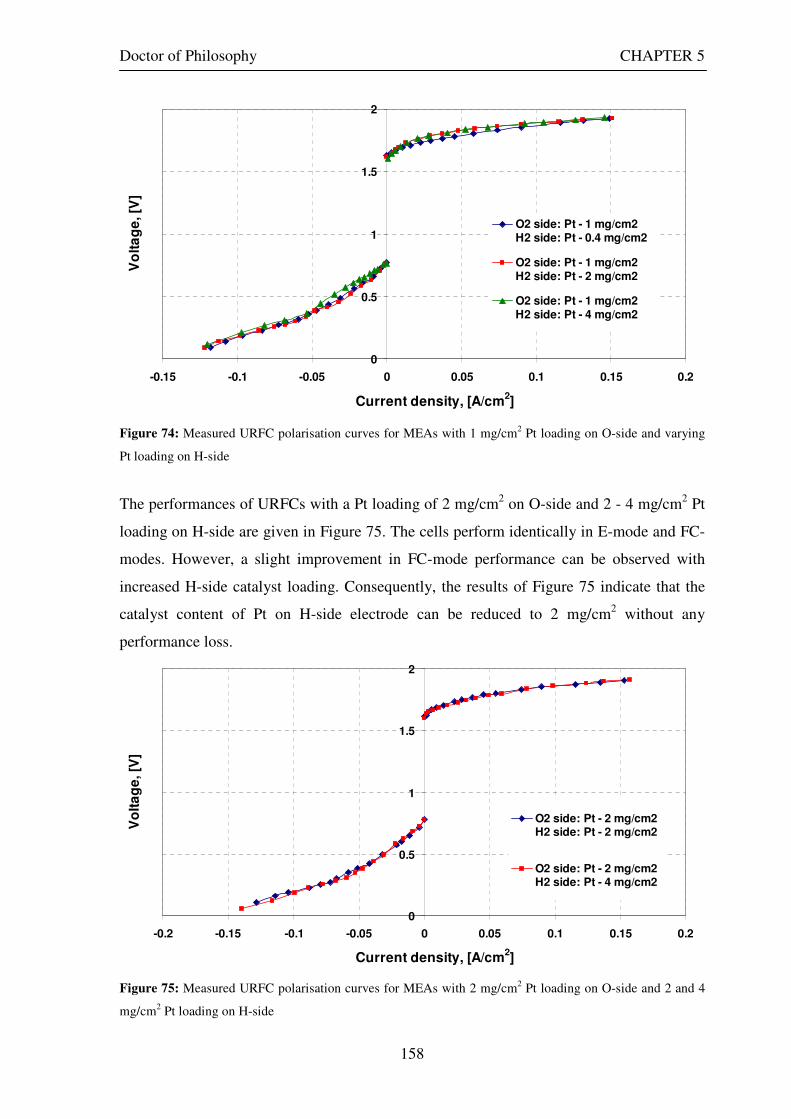
Doctor of Philosophy CHAPTER 5
158
0
0.5
1
1.5
2
-0.15 -0.1 -0.05 0 0.05 0.1 0.15 0.2
Current density, [A/cm2]
Vo
lta
ge
, [V
]
O2 side: Pt - 1 mg/cm2 H2 side: Pt - 0.4 mg/cm2
O2 side: Pt - 1 mg/cm2 H2 side: Pt - 2 mg/cm2
O2 side: Pt - 1 mg/cm2 H2 side: Pt - 4 mg/cm2
Figure 74: Measured URFC polarisation curves for MEAs with 1 mg/cm2 Pt loading on O-side and varying
Pt loading on H-side
The performances of URFCs with a Pt loading of 2 mg/cm2 on O-side and 2 - 4 mg/cm2 Pt
loading on H-side are given in Figure 75. The cells perform identically in E-mode and FC-
modes. However, a slight improvement in FC-mode performance can be observed with
increased H-side catalyst loading. Consequently, the results of Figure 75 indicate that the
catalyst content of Pt on H-side electrode can be reduced to 2 mg/cm2 without any
performance loss.
0
0.5
1
1.5
2
-0.2 -0.15 -0.1 -0.05 0 0.05 0.1 0.15 0.2
Current density, [A/cm2]
Vo
lta
ge
, [V
]
O2 side: Pt - 2 mg/cm2 H2 side: Pt - 2 mg/cm2
O2 side: Pt - 2 mg/cm2 H2 side: Pt - 4 mg/cm2
Figure 75: Measured URFC polarisation curves for MEAs with 2 mg/cm2 Pt loading on O-side and 2 and 4
mg/cm2 Pt loading on H-side
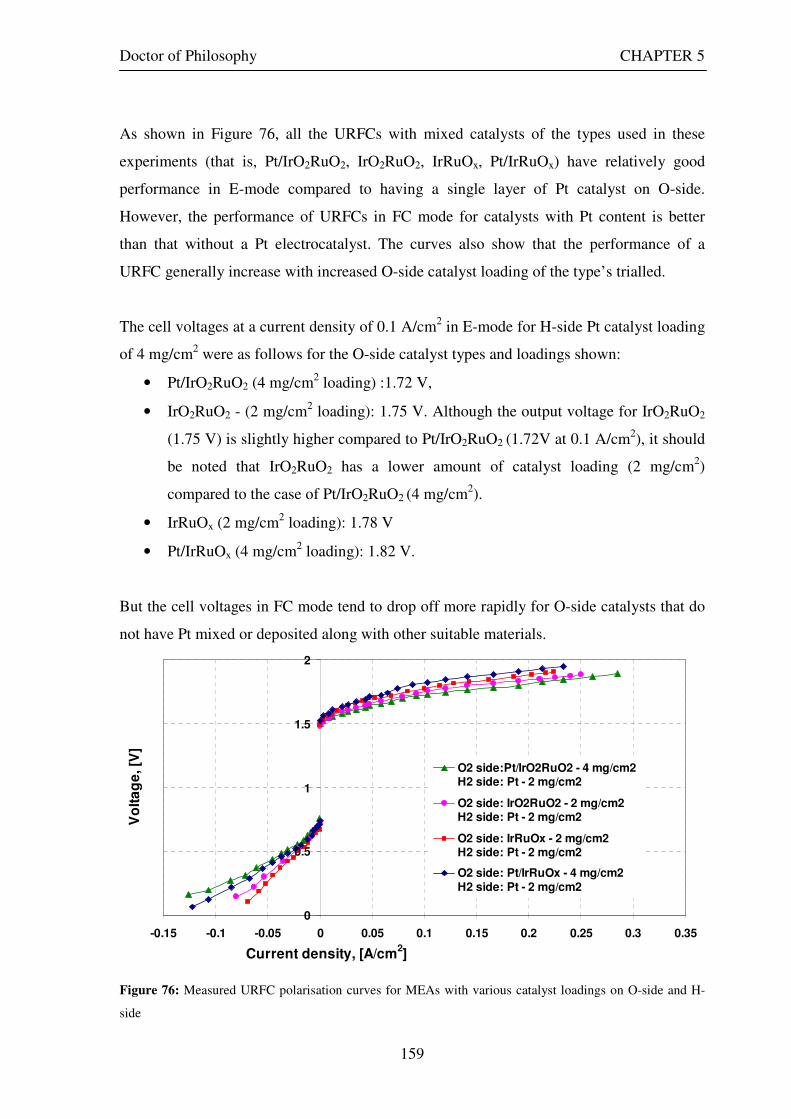
Doctor of Philosophy CHAPTER 5
159
As shown in Figure 76, all the URFCs with mixed catalysts of the types used in these
experiments (that is, Pt/IrO2RuO2, IrO2RuO2, IrRuOx, Pt/IrRuOx) have relatively good
performance in E-mode compared to having a single layer of Pt catalyst on O-side.
However, the performance of URFCs in FC mode for catalysts with Pt content is better
than that without a Pt electrocatalyst. The curves also show that the performance of a
URFC generally increase with increased O-side catalyst loading of the type’s trialled.
The cell voltages at a current density of 0.1 A/cm2 in E-mode for H-side Pt catalyst loading
of 4 mg/cm2 were as follows for the O-side catalyst types and loadings shown:
• Pt/IrO2RuO2 (4 mg/cm2 loading) :1.72 V,
• IrO2RuO2 - (2 mg/cm2 loading): 1.75 V. Although the output voltage for IrO2RuO2
(1.75 V) is slightly higher compared to Pt/IrO2RuO2 (1.72V at 0.1 A/cm2), it should
be noted that IrO2RuO2 has a lower amount of catalyst loading (2 mg/cm2)
compared to the case of Pt/IrO2RuO2 (4 mg/cm2).
• IrRuOx (2 mg/cm2 loading): 1.78 V
• Pt/IrRuOx (4 mg/cm2 loading): 1.82 V.
But the cell voltages in FC mode tend to drop off more rapidly for O-side catalysts that do
not have Pt mixed or deposited along with other suitable materials.
0
0.5
1
1.5
2
-0.15 -0.1 -0.05 0 0.05 0.1 0.15 0.2 0.25 0.3 0.35
Current density, [A/cm2]
Vo
lta
ge
, [V
]
O2 side:Pt/IrO2RuO2 - 4 mg/cm2 H2 side: Pt - 2 mg/cm2
O2 side: IrO2RuO2 - 2 mg/cm2 H2 side: Pt - 2 mg/cm2
O2 side: IrRuOx - 2 mg/cm2 H2 side: Pt - 2 mg/cm2
O2 side: Pt/IrRuOx - 4 mg/cm2H2 side: Pt - 2 mg/cm2
Figure 76: Measured URFC polarisation curves for MEAs with various catalyst loadings on O-side and H-
side
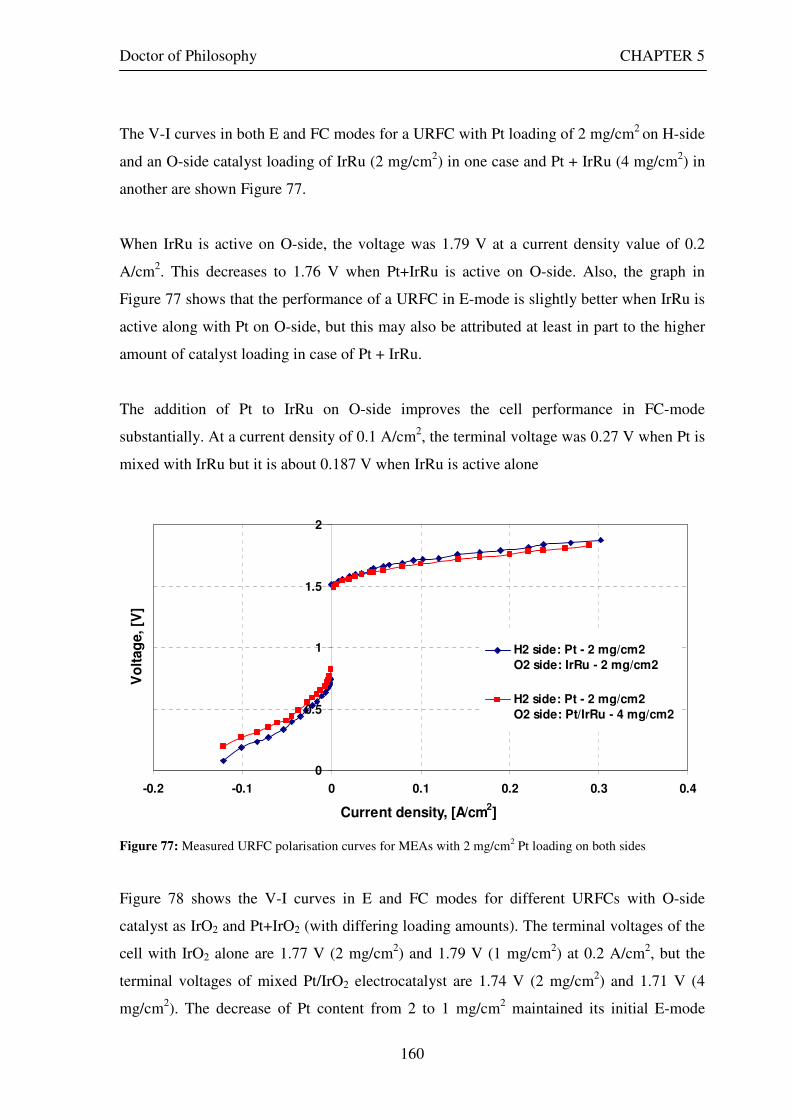
Doctor of Philosophy CHAPTER 5
160
The V-I curves in both E and FC modes for a URFC with Pt loading of 2 mg/cm2 on H-side
and an O-side catalyst loading of IrRu (2 mg/cm2) in one case and Pt + IrRu (4 mg/cm2) in
another are shown Figure 77.
When IrRu is active on O-side, the voltage was 1.79 V at a current density value of 0.2
A/cm2. This decreases to 1.76 V when Pt+IrRu is active on O-side. Also, the graph in
Figure 77 shows that the performance of a URFC in E-mode is slightly better when IrRu is
active along with Pt on O-side, but this may also be attributed at least in part to the higher
amount of catalyst loading in case of Pt + IrRu.
The addition of Pt to IrRu on O-side improves the cell performance in FC-mode
substantially. At a current density of 0.1 A/cm2, the terminal voltage was 0.27 V when Pt is
mixed with IrRu but it is about 0.187 V when IrRu is active alone
0
0.5
1
1.5
2
-0.2 -0.1 0 0.1 0.2 0.3 0.4
Current density, [A/cm2]
Vo
ltag
e, [V
]
H2 side: Pt - 2 mg/cm2
O2 side: IrRu - 2 mg/cm2
H2 side: Pt - 2 mg/cm2
O2 side: Pt/IrRu - 4 mg/cm2
Figure 77: Measured URFC polarisation curves for MEAs with 2 mg/cm2 Pt loading on both sides
Figure 78 shows the V-I curves in E and FC modes for different URFCs with O-side
catalyst as IrO2 and Pt+IrO2 (with differing loading amounts). The terminal voltages of the
cell with IrO2 alone are 1.77 V (2 mg/cm2) and 1.79 V (1 mg/cm2) at 0.2 A/cm2, but the
terminal voltages of mixed Pt/IrO2 electrocatalyst are 1.74 V (2 mg/cm2) and 1.71 V (4
mg/cm2). The decrease of Pt content from 2 to 1 mg/cm2 maintained its initial E-mode

Doctor of Philosophy CHAPTER 5
161
performance. However, at higher operating current densities, it can be observed that
decrease of catalyst content results in the decrease of the performance.
As shown in Figure 78, URFCs have good performance in E-mode when IrO2 is active on
O-side electrode. However, the improvement in performance of the cell in E-mode is
accomplished together with high catalyst loading values. The cell with on the O-side:
Pt/IrO2 (4 mg/cm2) and on the H side Pt (4 mg/cm2) is the best performer among the E-
mode curves in Figure 78.
On the other hand, FC-mode performance for the IrO2 catalyst on O-side improved
significantly when this catalyst was mixed with Pt, and is best with higher loading values.
The cell performed poorly with just IrO2 on O-side (1 mg/cm2 loading). Increasing IrO2
content to 2 mg/cm2 did not make any improvement in FC-mode performance. However,
addition of Pt (1 mg/cm2 addition) to IrO2 improved the FC-mode performance and the cell
voltage was raised significantly at any given current density value. This performance was
further improved with increased Pt loading (2 mg/cm2 addition).
Consequently, the results in Figure 78 indicate that the addition of Pt to IrO2 favours the
URFC performance in FC-mode.
0
0.5
1
1.5
2
-0.2 -0.15 -0.1 -0.05 0 0.05 0.1 0.15 0.2 0.25 0.3 0.35
Current density, [A/cm2]
Vo
lta
ge
, [V
] O2 side: IrO2 - 1 mg/cm2 H2 side: Pt - 2 mg/cm2
O2 side: IrO2 - 2 mg/cm2 H2 side: Pt - 2 mg/cm2
O2 side: Pt/IrO2 - 2 mg/cm2 H2 side: Pt - 2 mg/cm2
O2 side: Pt/IrO2 - 4 mg/cm2 H2 side: Pt - 4 mg/cm2
Figure 78: Measured URFC polarisation curves for MEAs with 2-4 mg/cm2 Pt loading on H-side and various
catalyst loading on O-side
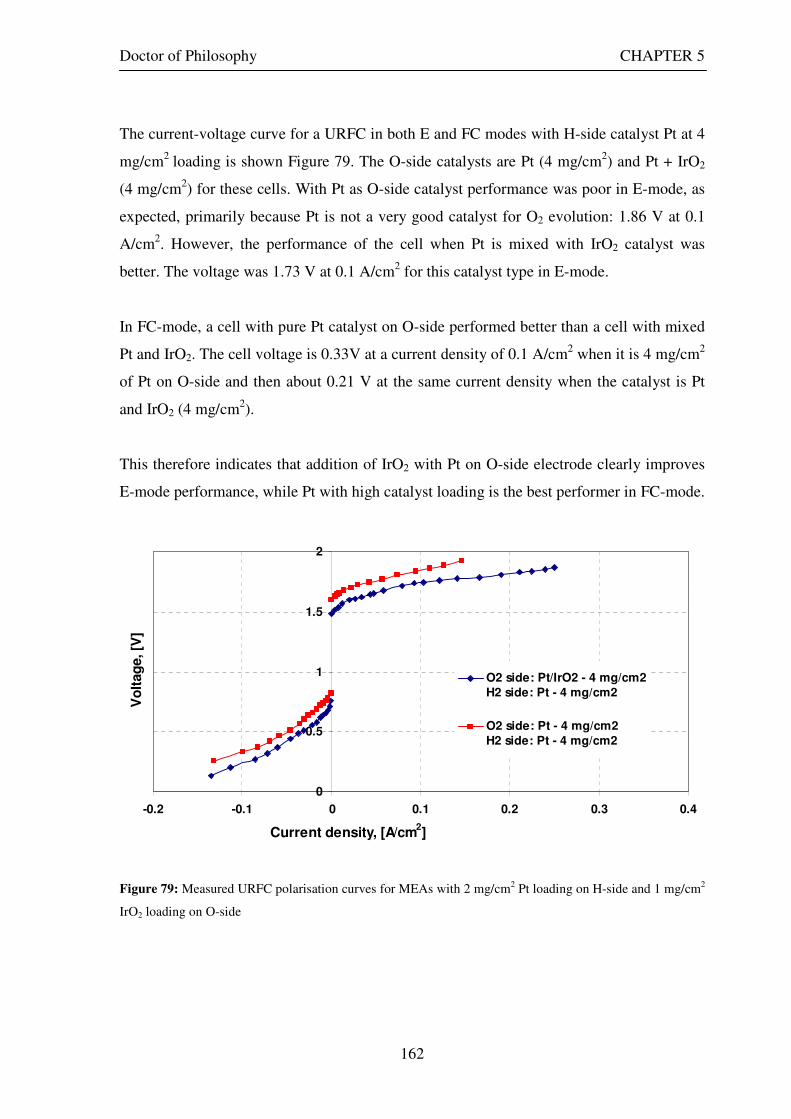
Doctor of Philosophy CHAPTER 5
162
The current-voltage curve for a URFC in both E and FC modes with H-side catalyst Pt at 4
mg/cm2 loading is shown Figure 79. The O-side catalysts are Pt (4 mg/cm2) and Pt + IrO2
(4 mg/cm2) for these cells. With Pt as O-side catalyst performance was poor in E-mode, as
expected, primarily because Pt is not a very good catalyst for O2 evolution: 1.86 V at 0.1
A/cm2. However, the performance of the cell when Pt is mixed with IrO2 catalyst was
better. The voltage was 1.73 V at 0.1 A/cm2 for this catalyst type in E-mode.
In FC-mode, a cell with pure Pt catalyst on O-side performed better than a cell with mixed
Pt and IrO2. The cell voltage is 0.33V at a current density of 0.1 A/cm2 when it is 4 mg/cm2
of Pt on O-side and then about 0.21 V at the same current density when the catalyst is Pt
and IrO2 (4 mg/cm2).
This therefore indicates that addition of IrO2 with Pt on O-side electrode clearly improves
E-mode performance, while Pt with high catalyst loading is the best performer in FC-mode.
0
0.5
1
1.5
2
-0.2 -0.1 0 0.1 0.2 0.3 0.4
Current density, [A/cm2]
Vo
ltag
e, [V
]
O2 side: Pt/IrO2 - 4 mg/cm2
H2 side: Pt - 4 mg/cm2
O2 side: Pt - 4 mg/cm2
H2 side: Pt - 4 mg/cm2
Figure 79: Measured URFC polarisation curves for MEAs with 2 mg/cm2 Pt loading on H-side and 1 mg/cm2
IrO2 loading on O-side
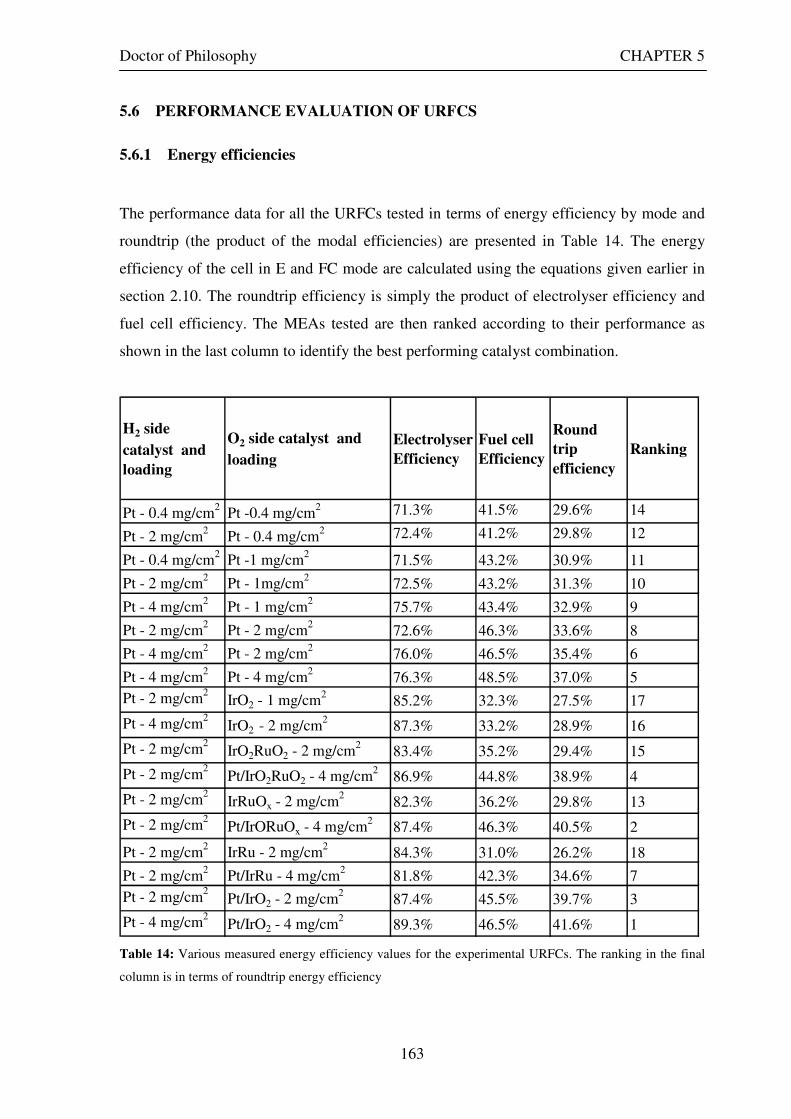
Doctor of Philosophy CHAPTER 5
163
5.6 PERFORMANCE EVALUATION OF URFCS
5.6.1 Energy efficiencies
The performance data for all the URFCs tested in terms of energy efficiency by mode and
roundtrip (the product of the modal efficiencies) are presented in Table 14. The energy
efficiency of the cell in E and FC mode are calculated using the equations given earlier in
section 2.10. The roundtrip efficiency is simply the product of electrolyser efficiency and
fuel cell efficiency. The MEAs tested are then ranked according to their performance as
shown in the last column to identify the best performing catalyst combination.
H2 side
catalyst and
loading
O2 side catalyst and
loading
Electrolyser
Efficiency
Fuel cell
Efficiency
Round
trip
efficiency
Ranking
Pt - 0.4 mg/cm2
Pt -0.4 mg/cm2 71.3% 41.5% 29.6% 14
Pt - 2 mg/cm2
Pt - 0.4 mg/cm2 72.4% 41.2% 29.8% 12
Pt - 0.4 mg/cm2
Pt -1 mg/cm2
71.5% 43.2% 30.9% 11
Pt - 2 mg/cm2
Pt - 1mg/cm2
72.5% 43.2% 31.3% 10
Pt - 4 mg/cm2
Pt - 1 mg/cm2
75.7% 43.4% 32.9% 9
Pt - 2 mg/cm2
Pt - 2 mg/cm2
72.6% 46.3% 33.6% 8
Pt - 4 mg/cm2
Pt - 2 mg/cm2
76.0% 46.5% 35.4% 6
Pt - 4 mg/cm2
Pt - 4 mg/cm2
76.3% 48.5% 37.0% 5
Pt - 2 mg/cm2
IrO2 - 1 mg/cm2
85.2% 32.3% 27.5% 17
Pt - 4 mg/cm2
IrO2 - 2 mg/cm2
87.3% 33.2% 28.9% 16
Pt - 2 mg/cm2
IrO2RuO2 - 2 mg/cm2
83.4% 35.2% 29.4% 15
Pt - 2 mg/cm2
Pt/IrO2RuO2 - 4 mg/cm2
86.9% 44.8% 38.9% 4
Pt - 2 mg/cm2
IrRuOx - 2 mg/cm2
82.3% 36.2% 29.8% 13
Pt - 2 mg/cm2
Pt/IrORuOx - 4 mg/cm2
87.4% 46.3% 40.5% 2
Pt - 2 mg/cm2
IrRu - 2 mg/cm2
84.3% 31.0% 26.2% 18
Pt - 2 mg/cm2
Pt/IrRu - 4 mg/cm2
81.8% 42.3% 34.6% 7
Pt - 2 mg/cm2
Pt/IrO2 - 2 mg/cm2
87.4% 45.5% 39.7% 3
Pt - 4 mg/cm2
Pt/IrO2 - 4 mg/cm2
89.3% 46.5% 41.6% 1
Table 14: Various measured energy efficiency values for the experimental URFCs. The ranking in the final
column is in terms of roundtrip energy efficiency
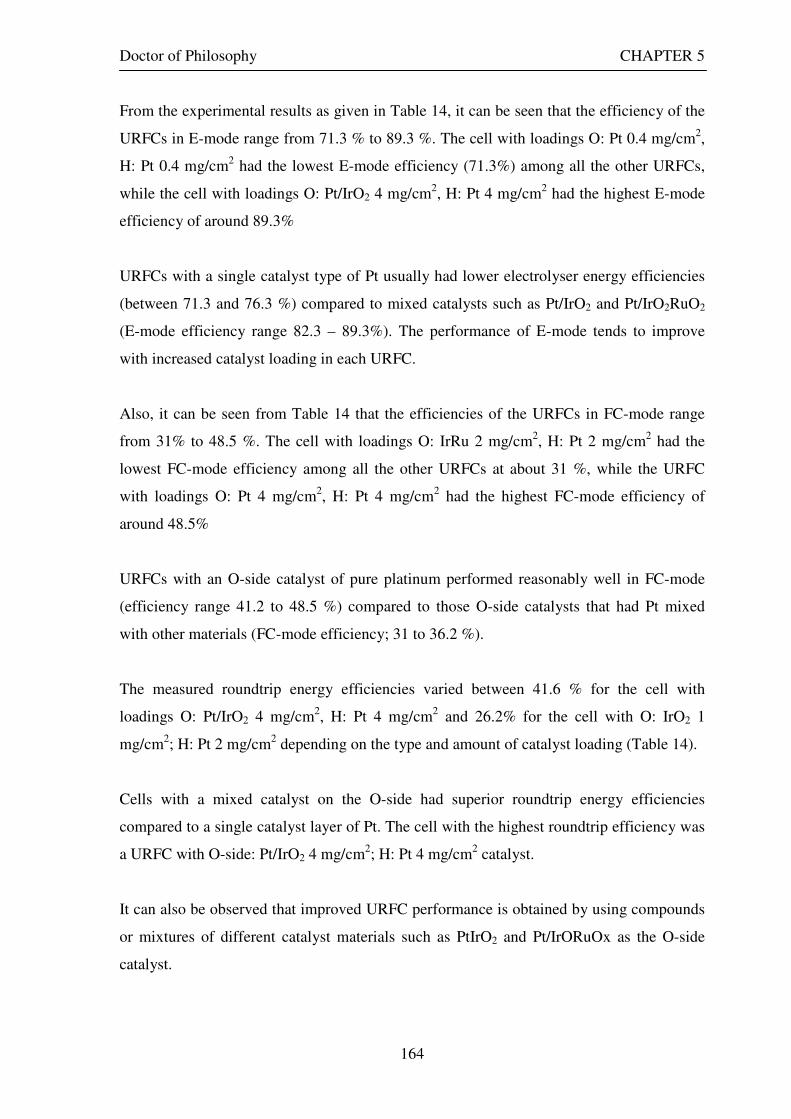
Doctor of Philosophy CHAPTER 5
164
From the experimental results as given in Table 14, it can be seen that the efficiency of the
URFCs in E-mode range from 71.3 % to 89.3 %. The cell with loadings O: Pt 0.4 mg/cm2,
H: Pt 0.4 mg/cm2 had the lowest E-mode efficiency (71.3%) among all the other URFCs,
while the cell with loadings O: Pt/IrO2 4 mg/cm2, H: Pt 4 mg/cm2 had the highest E-mode
efficiency of around 89.3%
URFCs with a single catalyst type of Pt usually had lower electrolyser energy efficiencies
(between 71.3 and 76.3 %) compared to mixed catalysts such as Pt/IrO2 and Pt/IrO2RuO2
(E-mode efficiency range 82.3 – 89.3%). The performance of E-mode tends to improve
with increased catalyst loading in each URFC.
Also, it can be seen from Table 14 that the efficiencies of the URFCs in FC-mode range
from 31% to 48.5 %. The cell with loadings O: IrRu 2 mg/cm2, H: Pt 2 mg/cm2 had the
lowest FC-mode efficiency among all the other URFCs at about 31 %, while the URFC
with loadings O: Pt 4 mg/cm2, H: Pt 4 mg/cm2 had the highest FC-mode efficiency of
around 48.5%
URFCs with an O-side catalyst of pure platinum performed reasonably well in FC-mode
(efficiency range 41.2 to 48.5 %) compared to those O-side catalysts that had Pt mixed
with other materials (FC-mode efficiency; 31 to 36.2 %).
The measured roundtrip energy efficiencies varied between 41.6 % for the cell with
loadings O: Pt/IrO2 4 mg/cm2, H: Pt 4 mg/cm2 and 26.2% for the cell with O: IrO2 1
mg/cm2; H: Pt 2 mg/cm2 depending on the type and amount of catalyst loading (Table 14).
Cells with a mixed catalyst on the O-side had superior roundtrip energy efficiencies
compared to a single catalyst layer of Pt. The cell with the highest roundtrip efficiency was
a URFC with O-side: Pt/IrO2 4 mg/cm2; H: Pt 4 mg/cm2 catalyst.
It can also be observed that improved URFC performance is obtained by using compounds
or mixtures of different catalyst materials such as PtIrO2 and Pt/IrORuOx as the O-side
catalyst.

Doctor of Philosophy CHAPTER 5
165
These values for the energy efficiency of URFCs with various catalyst materials on the
electrodes provide a starting point or benchmark for a more comprehensive program of
testing URFCs with further variations in catalyst materials and loadings, as well as GDB
materials and cell designs, with the overall aim of identifying designs that give the best
overall performance.
5.6.2 Hydrogen production rates
The rates of production of hydrogen by the URFCs trialled in E-mode are presented in
Table 15 and are in the range of 1.66 x 10⁻¹⁰ kg/s to 6.1 x 10⁻⁹ kg/s. It can be seen that
URFCs with mixed catalysts on O-side (resulting in higher E-mode efficiency as given in
the previous sub-section) produced more hydrogen compared to URFCs with a single
catalyst layer of Pt on O-side. Mixed O-side catalysts including Pt/IrO2RuO2, IrO2RuO2,
IrRuOx, Pt/IrRuOx had a hydrogen production range of 1 x 10⁻⁹ - 6.1 x 10⁻⁹ kg/s. When Pt
was the catalyst on O-side the rate of hydrogen produced was an order of magnitude lower,
at between 1.7 x 10⁻¹⁰ kg/s to 6.4 x 10⁻¹⁰ kg/s.
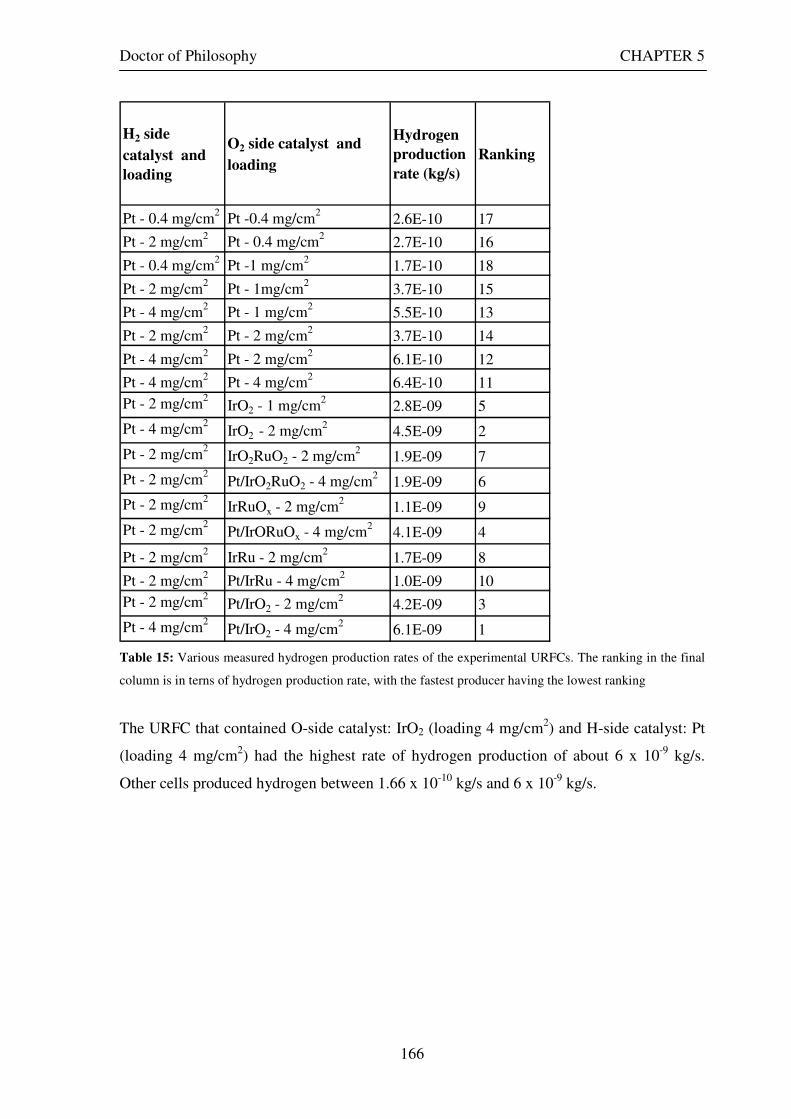
Doctor of Philosophy CHAPTER 5
166
H2 side
catalyst and
loading
O2 side catalyst and
loading
Hydrogen
production
rate (kg/s)
Ranking
Pt - 0.4 mg/cm2
Pt -0.4 mg/cm2
2.6E-10 17
Pt - 2 mg/cm2
Pt - 0.4 mg/cm2
2.7E-10 16
Pt - 0.4 mg/cm2
Pt -1 mg/cm2
1.7E-10 18
Pt - 2 mg/cm2
Pt - 1mg/cm2
3.7E-10 15
Pt - 4 mg/cm2
Pt - 1 mg/cm2
5.5E-10 13
Pt - 2 mg/cm2
Pt - 2 mg/cm2
3.7E-10 14
Pt - 4 mg/cm2
Pt - 2 mg/cm2
6.1E-10 12
Pt - 4 mg/cm2
Pt - 4 mg/cm2
6.4E-10 11
Pt - 2 mg/cm2
IrO2 - 1 mg/cm2
2.8E-09 5
Pt - 4 mg/cm2
IrO2 - 2 mg/cm2
4.5E-09 2
Pt - 2 mg/cm2
IrO2RuO2 - 2 mg/cm2
1.9E-09 7
Pt - 2 mg/cm2
Pt/IrO2RuO2 - 4 mg/cm2
1.9E-09 6
Pt - 2 mg/cm2
IrRuOx - 2 mg/cm2
1.1E-09 9
Pt - 2 mg/cm2
Pt/IrORuOx - 4 mg/cm2
4.1E-09 4
Pt - 2 mg/cm2
IrRu - 2 mg/cm2
1.7E-09 8
Pt - 2 mg/cm2
Pt/IrRu - 4 mg/cm2
1.0E-09 10
Pt - 2 mg/cm2
Pt/IrO2 - 2 mg/cm2
4.2E-09 3
Pt - 4 mg/cm2
Pt/IrO2 - 4 mg/cm2
6.1E-09 1
Table 15: Various measured hydrogen production rates of the experimental URFCs. The ranking in the final
column is in terns of hydrogen production rate, with the fastest producer having the lowest ranking
The URFC that contained O-side catalyst: IrO2 (loading 4 mg/cm2) and H-side catalyst: Pt
(loading 4 mg/cm2) had the highest rate of hydrogen production of about 6 x 10⁻⁹ kg/s.
Other cells produced hydrogen between 1.66 x 10⁻¹⁰ kg/s and 6 x 10⁻⁹ kg/s.
Doctor of Philosophy CHAPTER 5
167
5.6.3 Modal power ratios
The performance data for the experimental URFCs in terms of their maximum power
density values in both E and FC-modes, and thus their calculated modal power ratios, are
given below in Table 16.
The maximum power density in E-mode ranges from 0.22 to 0.51 W/cm2 for all the
URFCs I have experimented upon. Again, the URFCs with mixed catalysts performed
better in terms of their output power density ratios with a maximum value of 0.51 W/cm2
compared to cells with a single catalyst loading of Pt where the highest value was 0.3
W/cm2.
Similarly, URFCs with of mixed catalyst (which included Pt/IrO2RuO2, IrO2RuO2, IrRuOx,
Pt/IrRuOx) on O-side had higher maximum power density values (range 0.021 to 0.056) in
FC-mode compared to varying amounts of Pt on O-side. URFCs with Pt on O-side
produced a maximum output power density between 0.011 and 0.0024 W/cm2.
The modal power ratio of all URFCs measured experimentally in this thesis ranged from 8
to 20 (Table 16). Among the URFCs tested here, the URFC with O-side: Pt/IrO2 4 mg/cm2;
H: Pt 4 mg/cm2 catalyst type had the lowest modal power ratio about 8.3. URFCs with
single catalyst layer of Pt on O-side had very high modal power ratio’s thus making them
unsuitable for URFCs in solar-hydrogen systems. The implications of high modal power
ratio are again discussed in chapter 7.
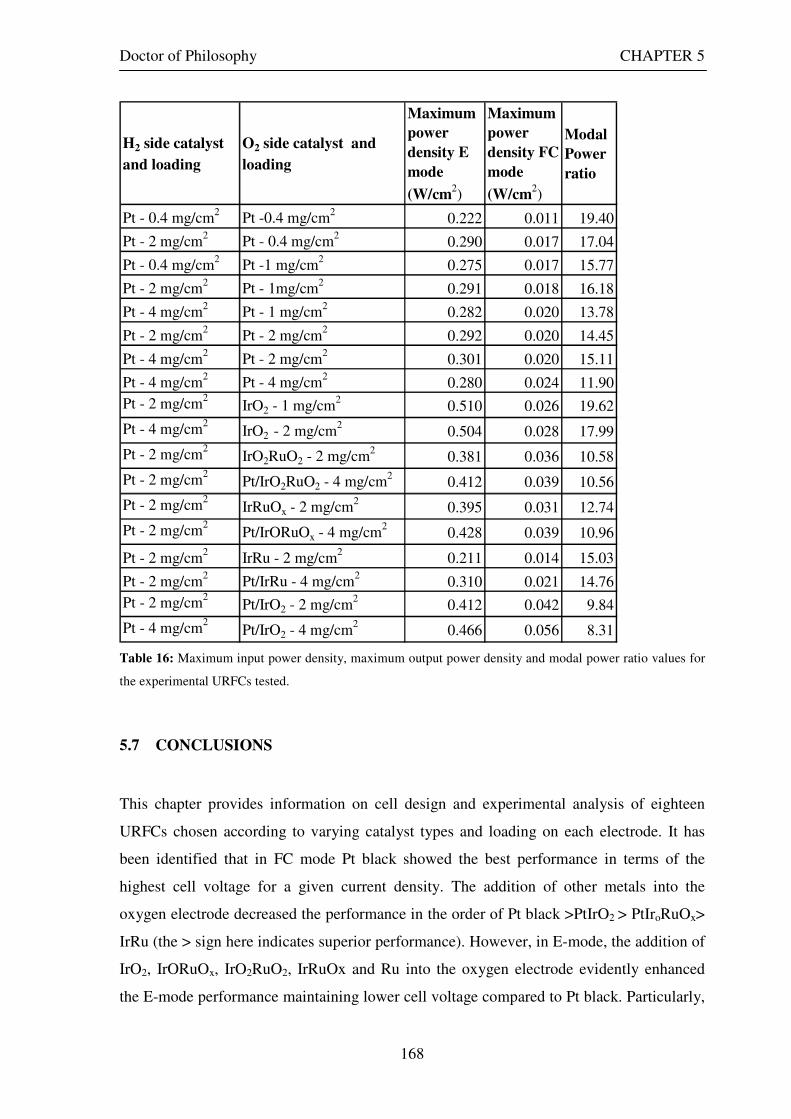
Doctor of Philosophy CHAPTER 5
168
H2 side catalyst
and loading
O2 side catalyst and
loading
Maximum
power
density E
mode
(W/cm2)
Maximum
power
density FC
mode
(W/cm2)
Modal
Power
ratio
Pt - 0.4 mg/cm2
Pt -0.4 mg/cm2
0.222 0.011 19.40
Pt - 2 mg/cm2
Pt - 0.4 mg/cm2
0.290 0.017 17.04
Pt - 0.4 mg/cm2
Pt -1 mg/cm2
0.275 0.017 15.77
Pt - 2 mg/cm2
Pt - 1mg/cm2
0.291 0.018 16.18
Pt - 4 mg/cm2
Pt - 1 mg/cm2
0.282 0.020 13.78
Pt - 2 mg/cm2
Pt - 2 mg/cm2
0.292 0.020 14.45
Pt - 4 mg/cm2
Pt - 2 mg/cm2
0.301 0.020 15.11
Pt - 4 mg/cm2
Pt - 4 mg/cm2
0.280 0.024 11.90
Pt - 2 mg/cm2
IrO2 - 1 mg/cm2
0.510 0.026 19.62
Pt - 4 mg/cm2
IrO2 - 2 mg/cm2
0.504 0.028 17.99
Pt - 2 mg/cm2
IrO2RuO2 - 2 mg/cm2
0.381 0.036 10.58
Pt - 2 mg/cm2
Pt/IrO2RuO2 - 4 mg/cm2
0.412 0.039 10.56
Pt - 2 mg/cm2
IrRuOx - 2 mg/cm2
0.395 0.031 12.74
Pt - 2 mg/cm2
Pt/IrORuOx - 4 mg/cm2
0.428 0.039 10.96
Pt - 2 mg/cm2
IrRu - 2 mg/cm2
0.211 0.014 15.03
Pt - 2 mg/cm2
Pt/IrRu - 4 mg/cm2
0.310 0.021 14.76
Pt - 2 mg/cm2
Pt/IrO2 - 2 mg/cm2
0.412 0.042 9.84
Pt - 4 mg/cm2
Pt/IrO2 - 4 mg/cm2
0.466 0.056 8.31
Table 16: Maximum input power density, maximum output power density and modal power ratio values for
the experimental URFCs tested.
5.7 CONCLUSIONS
This chapter provides information on cell design and experimental analysis of eighteen
URFCs chosen according to varying catalyst types and loading on each electrode. It has
been identified that in FC mode Pt black showed the best performance in terms of the
highest cell voltage for a given current density. The addition of other metals into the
oxygen electrode decreased the performance in the order of Pt black >PtIrO2 > PtIroRuOx>
IrRu (the > sign here indicates superior performance). However, in E-mode, the addition of
IrO2, IrORuOx, IrO2RuO2, IrRuOx and Ru into the oxygen electrode evidently enhanced
the E-mode performance maintaining lower cell voltage compared to Pt black. Particularly,
Doctor of Philosophy CHAPTER 5
169
the addition of Ir catalysts, irrespective of their chemical phases, showed a very positive
effect on the URFC performance in E-mode. Consequently, the water electrolysis
performance was revealed in the order of PtIrO2 > PtIrORuOx > PtIrO2RuO2 > IrRu >
IrRuOx > PtIrRu> Pt black.
Thus the experimental results obtained for the performance of URFCs with a range of
different catalyst types and loadings have allowed the best-performing combinations
among this group based on energy efficiencies, rate of hydrogen production, modal power
ratio to be identified.
Among the 18 URFCs chosen based on varying catalyst types and loading, the URFC that
had O-side catalyst as Pt/IrO2 (4 mg/cm2 loading) and H-side catalyst Pt (4 mg/cm2
loading) is clearly the best performer in terms of higher roundtrip energy efficiency (about
41.6 %), rate of hydrogen production (about 6 x 10⁻⁹ kg/s) and modal power ratio (equal to
8.3).
The performance measures for URFCs with various catalyst materials on the electrodes,
but with a common structural design and the same GDBs, measured here under
standardised conditions provide a benchmark for a more comprehensive program of testing
URFCs with further variations in catalyst materials and loadings, as well as GDB materials
and cell designs, so that designs that yield the best overall performance, durability and
cost-effectiveness can be identified.
The polarisation curves of some of the URFCs whose performance indicators have been
measured in this chapter are used in the next chapter as inputs to the URFC model
developed in Chapter 4 to obtain values for the key characteristics of both the oxygen and
hydrogen electrodes, and hence throw further light on the relationships between catalyst
loading and type and cell performance.
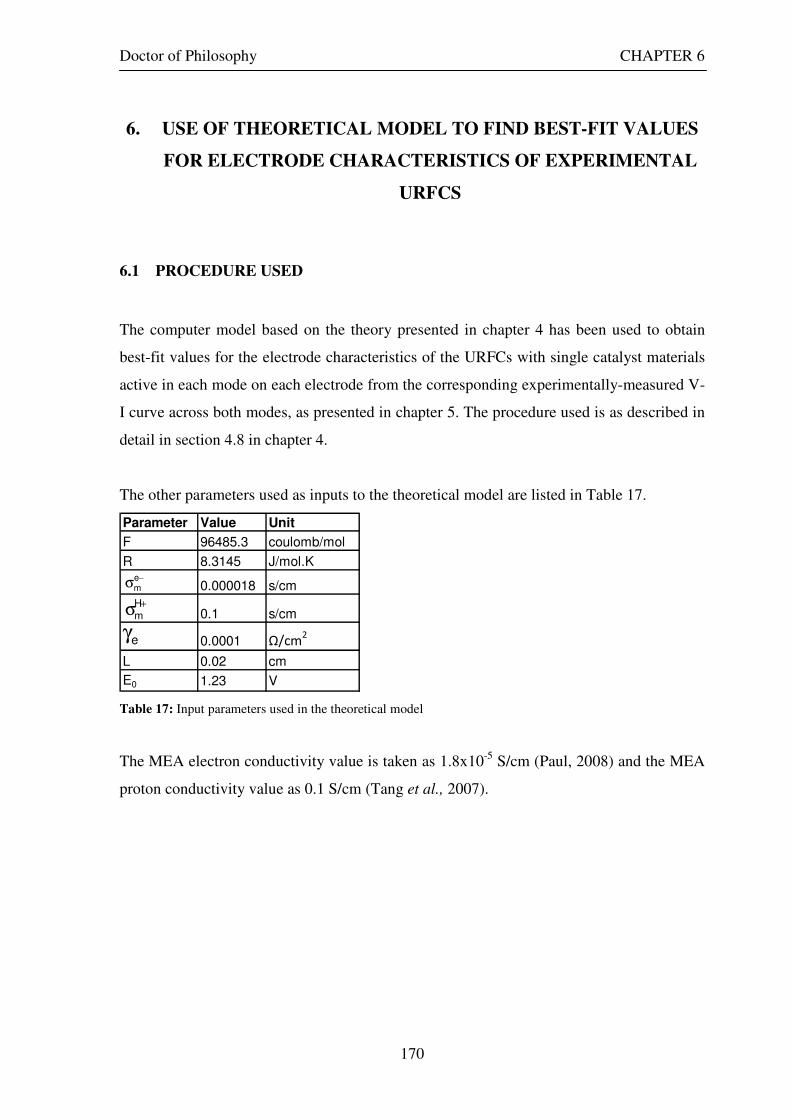
Doctor of Philosophy CHAPTER 6
170
6. USE OF THEORETICAL MODEL TO FIND BEST-FIT VALUES
FOR ELECTRODE CHARACTERISTICS OF EXPERIMENTAL
URFCS
6.1 PROCEDURE USED
The computer model based on the theory presented in chapter 4 has been used to obtain
best-fit values for the electrode characteristics of the URFCs with single catalyst materials
active in each mode on each electrode from the corresponding experimentally-measured V-
I curve across both modes, as presented in chapter 5. The procedure used is as described in
detail in section 4.8 in chapter 4.
The other parameters used as inputs to the theoretical model are listed in Table 17.
Parameter Value Unit
F 96485.3 coulomb/mol
R 8.3145 J/mol.K
0.000018 s/cm
0.1 s/cm
0.0001 Ω/cm2
L 0.02 cm
E0 1.23 V
−σem
+σHm
eγ
Table 17: Input parameters used in the theoretical model
The MEA electron conductivity value is taken as 1.8x10⁻⁵ S/cm (Paul, 2008) and the MEA
proton conductivity value as 0.1 S/cm (Tang et al., 2007).
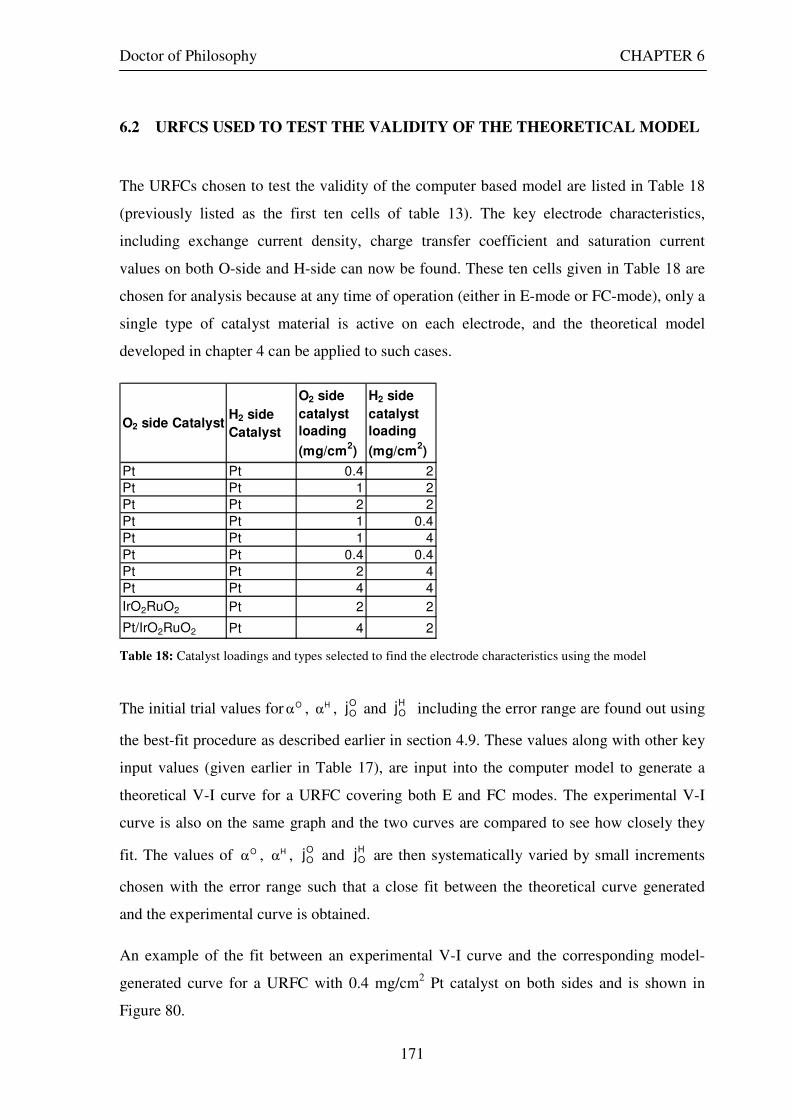
Doctor of Philosophy CHAPTER 6
171
6.2 URFCS USED TO TEST THE VALIDITY OF THE THEORETICAL MODEL
The URFCs chosen to test the validity of the computer based model are listed in Table 18
(previously listed as the first ten cells of table 13). The key electrode characteristics,
including exchange current density, charge transfer coefficient and saturation current
values on both O-side and H-side can now be found. These ten cells given in Table 18 are
chosen for analysis because at any time of operation (either in E-mode or FC-mode), only a
single type of catalyst material is active on each electrode, and the theoretical model
developed in chapter 4 can be applied to such cases.
O2 side CatalystH2 side
Catalyst
O2 side
catalyst
loading
(mg/cm2)
H2 side
catalyst
loading
(mg/cm2)
Pt Pt 0.4 2
Pt Pt 1 2
Pt Pt 2 2
Pt Pt 1 0.4
Pt Pt 1 4
Pt Pt 0.4 0.4
Pt Pt 2 4
Pt Pt 4 4
IrO2RuO2 Pt 2 2
Pt/IrO2RuO2 Pt 4 2
Table 18: Catalyst loadings and types selected to find the electrode characteristics using the model
The initial trial values for Oα , Hα , OOj and
HOj including the error range are found out using
the best-fit procedure as described earlier in section 4.9. These values along with other key
input values (given earlier in Table 17), are input into the computer model to generate a
theoretical V-I curve for a URFC covering both E and FC modes. The experimental V-I
curve is also on the same graph and the two curves are compared to see how closely they
fit. The values of Oα , Hα , OOj and
HOj are then systematically varied by small increments
chosen with the error range such that a close fit between the theoretical curve generated
and the experimental curve is obtained.
An example of the fit between an experimental V-I curve and the corresponding model-
generated curve for a URFC with 0.4 mg/cm2 Pt catalyst on both sides and is shown in
Figure 80.

Doctor of Philosophy CHAPTER 6
172
Figure 80: Theoretical V-I curve fitted to the experimental curve for a URFC with 0.4 mg/cm2 Pt black on
both H and O-sides
It can be observed in Figure 80 that there is a very close fit between the empirical and
theoretically-generated curves for the calculated cell characteristics. The values for Oα and
Hα for this URFC are found to be 0.3515 and 0.7158 respectively. OOj was 1.91 x 10⁻⁹
A/cm2 and HOj was found to be 1.12 x 10⁻³ A/cm2. The saturation current density value in
E-mode is 0.145 A/cm2 and in FC-mode it is 0.105 A/cm2.
Figure 81: Theoretical V-I curve fitted to the experimental curve for a URFC with 4 mg/cm2 Pt black on H
side and 4 mg/cm2 Pt black on O-side
0
0.5
1
1.5
2
2.5
-0.15 -0.10 -0.05 0.00 0.05 0.10 0.15
C urrent Dens ity, [A/c m2]
Vo
lta
ge
, [V
]
E - mode - T heoretic al model c urv e
F C - mode - T heoretic al model c urve
E - mode - E x perimental c urv e
F C - mode - E xperimental c urv e
Oα = 0.3515 Hα = 0.7158
OOj = 1.91x10⁻⁹ A/cm2
HOj = 1.12x10⁻³ A/cm2
satEj = 0.145 A/cm2 satFCj = 0.105 A/cm2
0
0.5
1
1.5
2
2.5
-0.15 -0.10 -0.05 0.00 0.05 0.10 0.15 0.20
C urrent Dens ity , [A/c m2]
Vo
lta
ge
, [V
]
E - mode - T heoretic al model c urv e
F C - mode - T heoretic al model c urv e
E - mode - E x perimental c urv e
F C - mode - E x perimental c urv e
Oα = 0.4400 Hα = 0.8174
OOj = 4.77x10⁻⁹ A/cm2
HOj = 7.02x10⁻⁴ A/cm2
satEj = 0.2 A/cm2
satFCj = 0.165 A/cm2

Doctor of Philosophy CHAPTER 6
173
The theoretical curve fitted against the experimental V-I curve for a URFC with 4 mg/cm2
Pt catalyst loading on both sides shown in Figure 81. For this case, Oα =0.44, Hα =0.8174,
OOj = 4.77 x 10⁻⁹ A/cm2,
HOj = 7.02 x 10⁻⁴ A/cm2,
E
satj = 0.145 A/cm2 and FCsatj = 0.165
A/cm2 give a very good fit between the experimental and theoretical curves.
A similar curve-fitting procedure was adopted to find the electrode characteristics of all the
10 given in Table 18 catalytic combinations. The experimental and theoretical curves for
all MEA combinations are given in Appendix at the end of the thesis.
6.3 RESULTS FOR KEY ELECTRODE CHARACTERISTICS
The best fit values obtained for charge transfer coefficients αO and αH, exchange current
densities OOj and
HOj , saturation current densities
E
satj and FCsatj together with error ranges for
all the different catalyst loadings of the URFC electrodes to which the procedure has been
applied are given in Table 19.
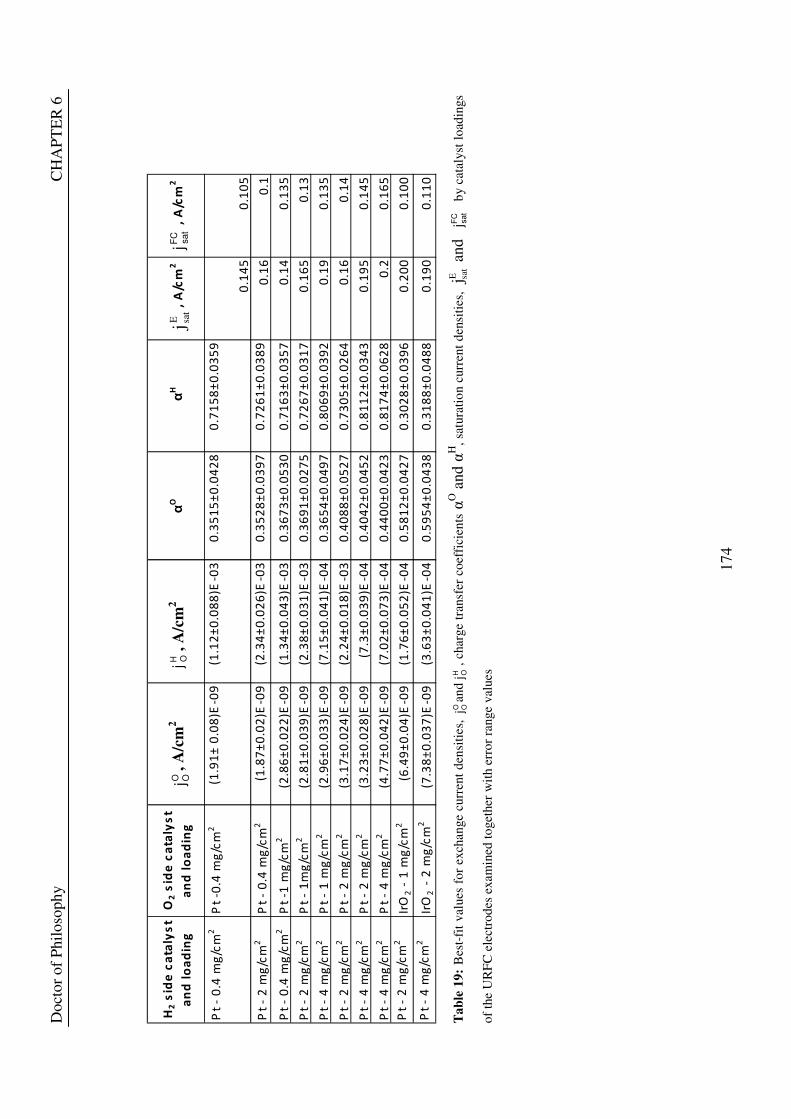
Doct
or
of
Phil
oso
ph
y
C
HA
PT
ER
6
174
H2 s
ide
ca
taly
st
an
d l
oa
din
g
O2 s
ide
ca
taly
st
an
d l
oa
din
g ,
A/c
m2
, A
/cm
2α
O α
H
, A
/cm
2
, A
/cm
2
Pt
- 0
.4 m
g/c
m2
Pt
-0.4
mg
/cm
2(1
.91
± 0
.08
)E-0
9(1
.12
±0
.08
8)E
-03
0.3
51
5±
0.0
42
80
.71
58
±0
.03
59
0.1
45
0.1
05
Pt
- 2
mg
/cm
2P
t -
0.4
mg
/cm
2(1
.87
±0
.02
)E-0
9(2
.34
±0
.02
6)E
-03
0.3
52
8±
0.0
39
70
.72
61
±0
.03
89
0.1
60
.1
Pt
- 0
.4 m
g/c
m2
Pt
-1 m
g/c
m2
(2.8
6±
0.0
22
)E-0
9(1
.34
±0
.04
3)E
-03
0.3
67
3±
0.0
53
00
.71
63
±0
.03
57
0.1
40
.13
5
Pt
- 2
mg
/cm
2P
t -
1m
g/c
m2
(2.8
1±
0.0
39
)E-0
9(2
.38
±0
.03
1)E
-03
0.3
69
1±
0.0
27
50
.72
67
±0
.03
17
0.1
65
0.1
3
Pt
- 4
mg
/cm
2P
t -
1 m
g/c
m2
(2.9
6±
0.0
33
)E-0
9(7
.15
±0
.04
1)E
-04
0.3
65
4±
0.0
49
70
.80
69
±0
.03
92
0.1
90
.13
5
Pt
- 2
mg
/cm
2P
t -
2 m
g/c
m2
(3.1
7±
0.0
24
)E-0
9(2
.24
±0
.01
8)E
-03
0.4
08
8±
0.0
52
70
.73
05
±0
.02
64
0.1
60
.14
Pt
- 4
mg
/cm
2P
t -
2 m
g/c
m2
(3.2
3±
0.0
28
)E-0
9(7
.3±
0.0
39
)E-0
40
.40
42
±0
.04
52
0.8
11
2±
0.0
34
30
.19
50
.14
5
Pt
- 4
mg
/cm
2P
t -
4 m
g/c
m2
(4.7
7±
0.0
42
)E-0
9(7
.02
±0
.07
3)E
-04
0.4
40
0±
0.0
42
30
.81
74
±0
.06
28
0.2
0.1
65
Pt
- 2
mg
/cm
2Ir
O2 -
1 m
g/c
m2
(6.4
9±
0.0
4)E
-09
(1.7
6±
0.0
52
)E-0
40
.58
12
±0
.04
27
0.3
02
8±
0.0
39
60
.20
00
.10
0
Pt
- 4
mg
/cm
2Ir
O2
-
2 m
g/c
m2
(7.3
8±
0.0
37
)E-0
9(3
.63
±0
.04
1)E
-04
0.5
95
4±
0.0
43
80
.31
88
±0
.04
88
0.1
90
0.1
10
H OjF
Csa
tj
E sat
jO Oj
Ta
ble
19
: B
est-
fit
val
ues
fo
r ex
chan
ge
curr
ent
den
siti
es,
O Ojan
dH Oj
, ch
arge
tran
sfer
co
effi
cien
ts α
O a
nd α
H,
satu
rati
on c
urr
ent
den
siti
es,
E sat
j a
nd
FC
sat
j
by c
atal
yst
lo
adin
gs
of
the
UR
FC
ele
ctro
des
exam
ined
to
get
her
wit
h e
rro
r ra
nge
val
ues
, A
/cm
2
, A
/cm
2
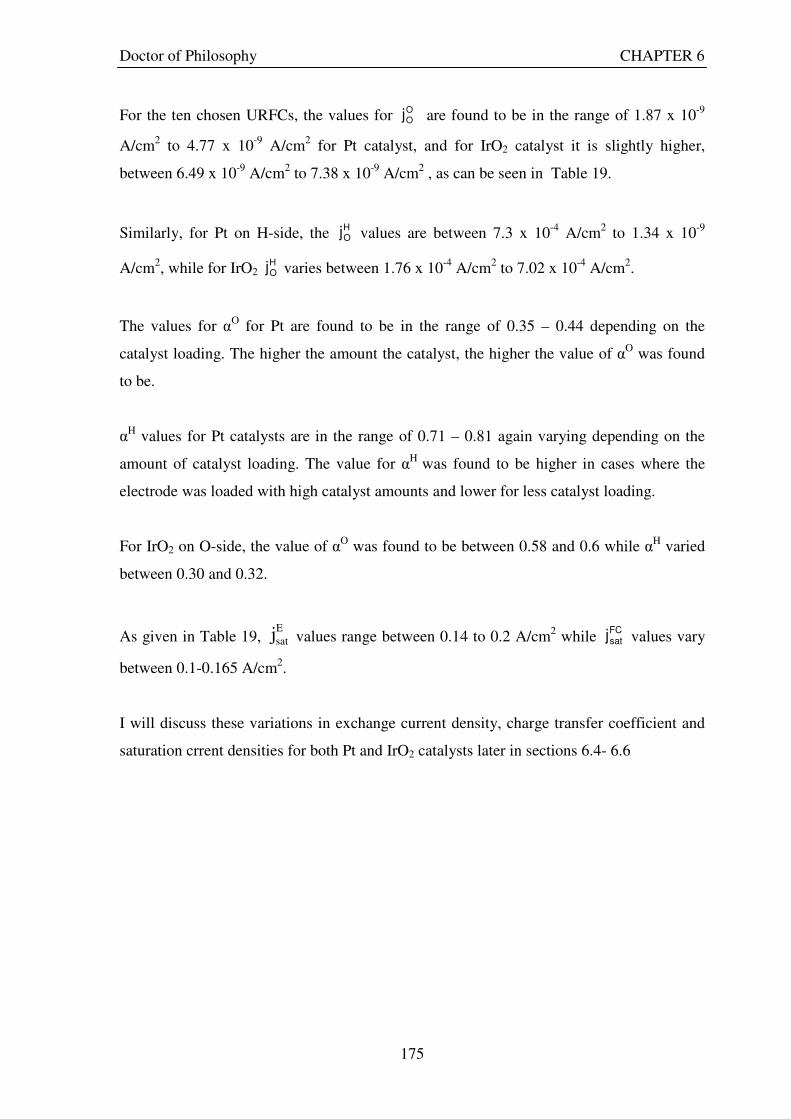
Doctor of Philosophy CHAPTER 6
175
For the ten chosen URFCs, the values for OOj are found to be in the range of 1.87 x 10⁻⁹
A/cm2 to 4.77 x 10⁻⁹ A/cm2 for Pt catalyst, and for IrO2 catalyst it is slightly higher,
between 6.49 x 10⁻⁹ A/cm2 to 7.38 x 10⁻⁹ A/cm2 , as can be seen in Table 19.
Similarly, for Pt on H-side, the HOj values are between 7.3 x 10⁻⁴ A/cm2 to 1.34 x 10⁻⁹
A/cm2, while for IrO2 HOj varies between 1.76 x 10⁻⁴ A/cm2 to 7.02 x 10⁻⁴ A/cm2.
The values for αO for Pt are found to be in the range of 0.35 – 0.44 depending on the
catalyst loading. The higher the amount the catalyst, the higher the value of αO was found
to be.
αH values for Pt catalysts are in the range of 0.71 – 0.81 again varying depending on the
amount of catalyst loading. The value for αH was found to be higher in cases where the
electrode was loaded with high catalyst amounts and lower for less catalyst loading.
For IrO2 on O-side, the value of αO was found to be between 0.58 and 0.6 while αH varied
between 0.30 and 0.32.
As given in Table 19, E
satj values range between 0.14 to 0.2 A/cm2 while FCsatj values vary
between 0.1-0.165 A/cm2.
I will discuss these variations in exchange current density, charge transfer coefficient and
saturation crrent densities for both Pt and IrO2 catalysts later in sections 6.4- 6.6
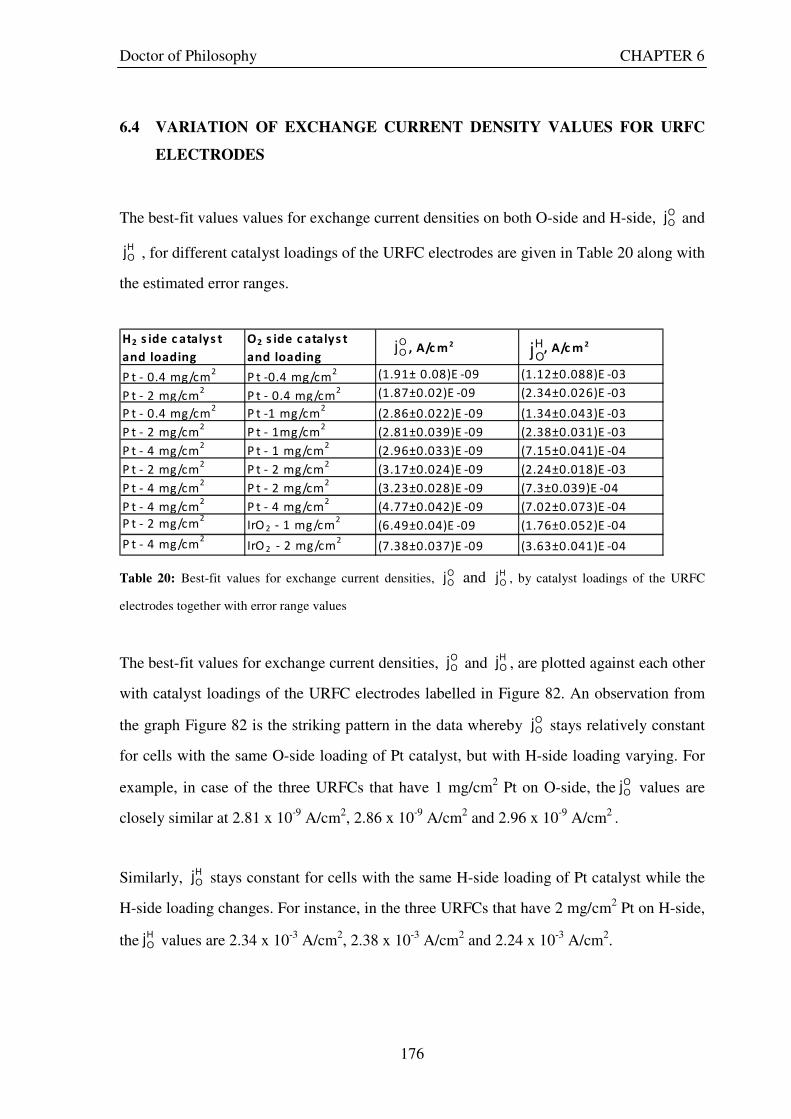
Doctor of Philosophy CHAPTER 6
176
6.4 VARIATION OF EXCHANGE CURRENT DENSITY VALUES FOR URFC
ELECTRODES
The best-fit values values for exchange current densities on both O-side and H-side, OOj and
HOj , for different catalyst loadings of the URFC electrodes are given in Table 20 along with
the estimated error ranges.
H2 s ide c atalys t
and loading
O2 s ide c atalys t
and loading , A/c m 2 , A/c m 2
P t - 0.4 mg/cm2
P t -0.4 mg/cm2 (1.91± 0.08)E -09 (1.12±0.088)E -03
P t - 2 mg/cm2
P t - 0.4 mg/cm2 (1.87±0.02)E -09 (2.34±0.026)E -03
P t - 0.4 mg/cm2
P t -1 mg/cm2
(2.86±0.022)E -09 (1.34±0.043)E -03
P t - 2 mg/cm2
P t - 1mg/cm2
(2.81±0.039)E -09 (2.38±0.031)E -03
P t - 4 mg/cm2
P t - 1 mg/cm2
(2.96±0.033)E -09 (7.15±0.041)E -04
P t - 2 mg/cm2
P t - 2 mg/cm2
(3.17±0.024)E -09 (2.24±0.018)E -03
P t - 4 mg/cm2
P t - 2 mg/cm2
(3.23±0.028)E -09 (7.3±0.039)E -04
P t - 4 mg/cm2
P t - 4 mg/cm2
(4.77±0.042)E -09 (7.02±0.073)E -04
P t - 2 mg/cm2
IrO 2 - 1 mg/cm2
(6.49±0.04)E -09 (1.76±0.052)E -04
P t - 4 mg/cm2
IrO 2 - 2 mg/cm2
(7.38±0.037)E -09 (3.63±0.041)E -04
HOj
OOj
Table 20: Best-fit values for exchange current densities, OOj and H
Oj , by catalyst loadings of the URFC
electrodes together with error range values
The best-fit values for exchange current densities, OOj and
HOj , are plotted against each other
with catalyst loadings of the URFC electrodes labelled in Figure 82. An observation from
the graph Figure 82 is the striking pattern in the data whereby OOj stays relatively constant
for cells with the same O-side loading of Pt catalyst, but with H-side loading varying. For
example, in case of the three URFCs that have 1 mg/cm2 Pt on O-side, the OOj values are
closely similar at 2.81 x 10⁻⁹ A/cm2, 2.86 x 10⁻⁹ A/cm2 and 2.96 x 10⁻⁹ A/cm2 .
Similarly, HOj stays constant for cells with the same H-side loading of Pt catalyst while the
H-side loading changes. For instance, in the three URFCs that have 2 mg/cm2 Pt on H-side,
theHOj values are 2.34 x 10⁻³ A/cm2, 2.38 x 10⁻³ A/cm2 and 2.24 x 10⁻³ A/cm2.

Doctor of Philosophy CHAPTER 6
177
These results are as would be expected a priori since the electrochemical performance of a
given electrode would be expected to stay the same if its composition remained constant,
even though changes are made on the other electrode. This pattern, however, is not
mathematically inherent in the equations used to develop the theoretical model upon which
the computer model is based, but rather has been found independently from the exercise of
fitting the best theoretical curve to experimental data. Hence this observed pattern
contributes positively towards a validation of the theoretical model of the URFC developed
in this thesis.
As the Pt catalyst loading on the H-side increases with constant loading on the O-side, HOj
increases, so the overpotential on this electrode decreases in absolute value in both modes,
thus improving overall URFC performance. Again in the case of the three URFCs that have
1 mg/cm2 Pt on O-side, the OOj values remain almost the same (2.81 x 10⁻⁹ A/cm2, 2.86 x
10-9 A/cm2 and 2.96 x 10⁻⁹ A/cm2) but their HOj values changed significantly with catalyst
loading, from 1.34 x 10⁻³ A/cm2, 2.38 x 10⁻³ A/cm2, to 7.15 x 10⁻⁴ A/cm2).
Moreover, increasing the catalyst loading on the O-side, while keeping the H-side loading
the same, increases OOj , decreasing the corresponding overpotential in both modes and
improving dual mode performance. This can be seen in the case of two URFCs that have 2
mg/cm2 Pt on H-side whose HOj values are about the same (2.34 x 10⁻³ A/cm2, 2.38 x 10⁻³
A/cm2) while their OOj values 2.81 x 10⁻⁹ A/cm2 and 3.17 x 10⁻⁹ A/cm2 respectively differ
substantially.
Again, other things being equal, increasing the catalyst loading on one electrode would be
expected to improve URFC performance in both modes, so the observed behaviour found
using the model is consistent with expectations.

Doct
or
of
Phil
oso
ph
y
C
HA
PT
ER
6
178
Fig
ure
82
: B
est-
fit
val
ues
fo
r ex
chan
ge
curr
ent
den
siti
es,
O Oj a
nd
H Oj,
by c
atal
yst
lo
adin
gs
of
the
UR
FC
ele
ctro
des
. T
he
firs
t te
rm i
n e
ach l
abel
ind
icat
es O
-sid
e ca
taly
st t
yp
e
and
lo
adin
g w
hil
e th
e se
cond
ter
m i
nd
icat
es H
-sid
e ca
taly
st t
yp
e an
d l
oad
ing.
0.0
0E
+0
0
5.0
0E
-09
1.0
0E
-08
1.5
0E
-08
2.0
0E
-08
2.5
0E
-08
3.0
0E
-08
3.5
0E
-08
4.0
0E
-08
4.5
0E
-08
5.0
0E
-08
5.5
0E
-08
6.0
0E
-08
6.5
0E
-08
7.0
0E
-08
7.5
0E
-08
8.0
0E
-08
0.0
0E
+0
01
.00
E-0
32
.00
E-0
33
.00
E-0
34
.00
E-0
35
.00
E-0
36
.00
E-0
37
.00
E-0
38
.00
E-0
3
Ex
ch
an
ge
Cu
rre
nt
de
ns
ity
on
H-s
ide
, j O
H [A
/cm
2]
Exchange Current density on O-side, j OO
, [A/cm2]
O:
Pt
0.4
mg
/cm
2
O:
Pt
1 m
g/c
m2
O:
Pt
2 m
g/c
m2
O:
Pt
4 m
g/c
m2
O:
IrO
2 1
mg
/cm
2
O:
IrO
2
2 m
g/c
m2
Pt
0.4
: P
t 2
Pt
0.4
: P
t 0
.4
Pt
2 :
Pt
2
Pt
1:
Pt
2P
t 1
: P
t 0
.4P
t 1
: P
t 4
Pt
2:
Pt
4
Pt
4 :
Pt
4
IrO
2 2
: P
t 2
IrO
2 2
: P
t 4
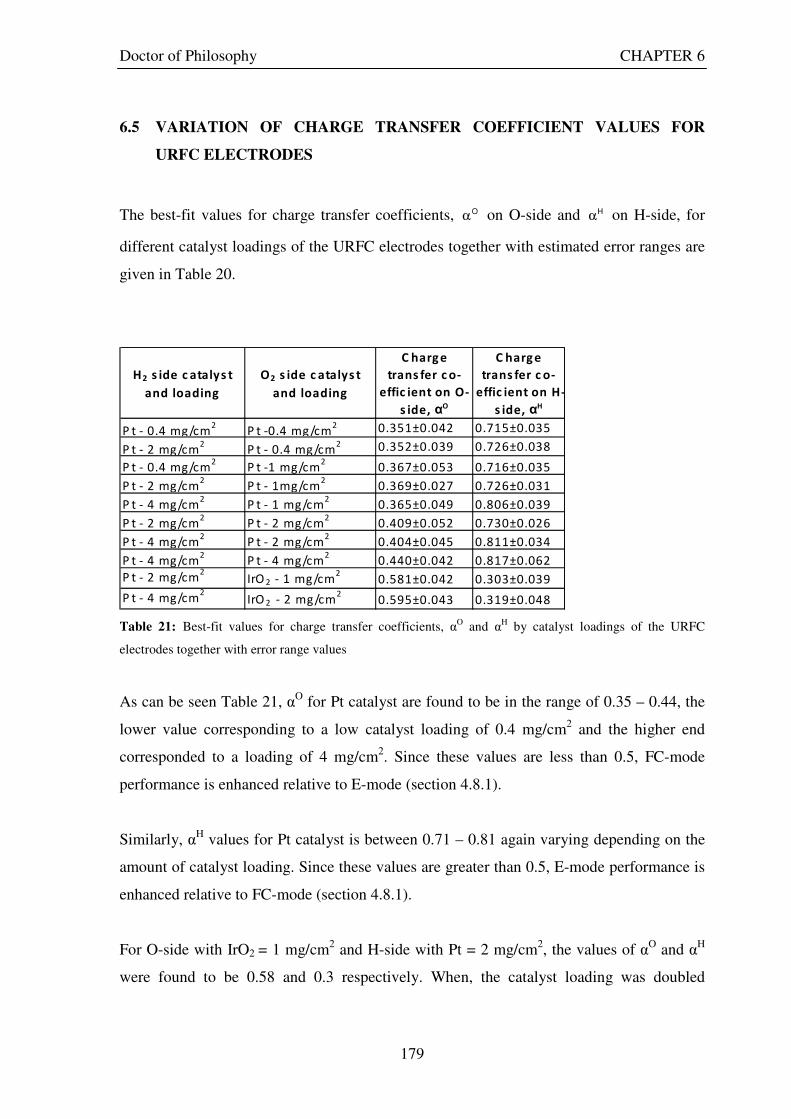
Doctor of Philosophy CHAPTER 6
179
6.5 VARIATION OF CHARGE TRANSFER COEFFICIENT VALUES FOR
URFC ELECTRODES
The best-fit values for charge transfer coefficients, Oα on O-side and Hα on H-side, for
different catalyst loadings of the URFC electrodes together with estimated error ranges are
given in Table 20.
H2 s ide c atalys t
and loading
O2 s ide c atalys t
and loading
C harg e
trans fer c o-
effic ient on O-
s ide, αO
C harg e
trans fer c o-
effic ient on H-
s ide, αH
P t - 0.4 mg/cm2
P t -0.4 mg/cm2 0.351±0.042 0.715±0.035
P t - 2 mg/cm2
P t - 0.4 mg/cm2 0.352±0.039 0.726±0.038
P t - 0.4 mg/cm2
P t -1 mg/cm2
0.367±0.053 0.716±0.035
P t - 2 mg/cm2
P t - 1mg/cm2
0.369±0.027 0.726±0.031
P t - 4 mg/cm2
P t - 1 mg/cm2
0.365±0.049 0.806±0.039
P t - 2 mg/cm2
P t - 2 mg/cm2
0.409±0.052 0.730±0.026
P t - 4 mg/cm2
P t - 2 mg/cm2
0.404±0.045 0.811±0.034
P t - 4 mg/cm2
P t - 4 mg/cm2
0.440±0.042 0.817±0.062
P t - 2 mg/cm2
IrO 2 - 1 mg/cm2
0.581±0.042 0.303±0.039
P t - 4 mg/cm2
IrO 2 - 2 mg/cm2
0.595±0.043 0.319±0.048
Table 21: Best-fit values for charge transfer coefficients, αO and αH by catalyst loadings of the URFC
electrodes together with error range values
As can be seen Table 21, αO for Pt catalyst are found to be in the range of 0.35 – 0.44, the
lower value corresponding to a low catalyst loading of 0.4 mg/cm2 and the higher end
corresponded to a loading of 4 mg/cm2. Since these values are less than 0.5, FC-mode
performance is enhanced relative to E-mode (section 4.8.1).
Similarly, αH values for Pt catalyst is between 0.71 – 0.81 again varying depending on the
amount of catalyst loading. Since these values are greater than 0.5, E-mode performance is
enhanced relative to FC-mode (section 4.8.1).
For O-side with IrO2 = 1 mg/cm2 and H-side with Pt = 2 mg/cm2, the values of αO and αH
were found to be 0.58 and 0.3 respectively. When, the catalyst loading was doubled

Doctor of Philosophy CHAPTER 6
180
(retaining the same catalyst type though), αO and αH also increased to 0.59 and 0.32
respectively. Thus use of IrO2 on O-side in place of Pt improves E-mode performance.
The values for αO and αH from Table 21 are plotted against each other for various catalyst
loadings of the URFC electrodes in Figure 83 to look for patterns in the data.
Firstly, it can be observed that cells with the same Pt loading on the O-side have
approximately the same O-side charge transfer coefficient, αO, as would be expected. For
example, in the case of the three URFCs that have 1 mg/cm2 Pt on O-side, the αO values
vary by only a small amount: 0.367, 0.369 and 0.365. The same holds for αH staying near
constant for cells with the same H-side Pt loading. This is evident in all the cases; for
instance, in the two URFCs that have 2 mg/cm2 Pt on H-side, αH values are 0.726, 0.726
and 0.730, that is, all very close, a would be expected a priori.
As the O-side Pt loading increases, αO increases slightly, resulting in a small improvement
in FC-mode performance and a shift to a more reversible electrode. As the H-side Pt
loading increases αH increases and E-mode performance is enhanced. Again this behaviour
is as would be expected from the known catalyst loadings on the electrodes.
The values for charge transfer coefficients obtained from the curve-fitting exercise are thus
again confirmatory of the validity of the theoretical model developed.
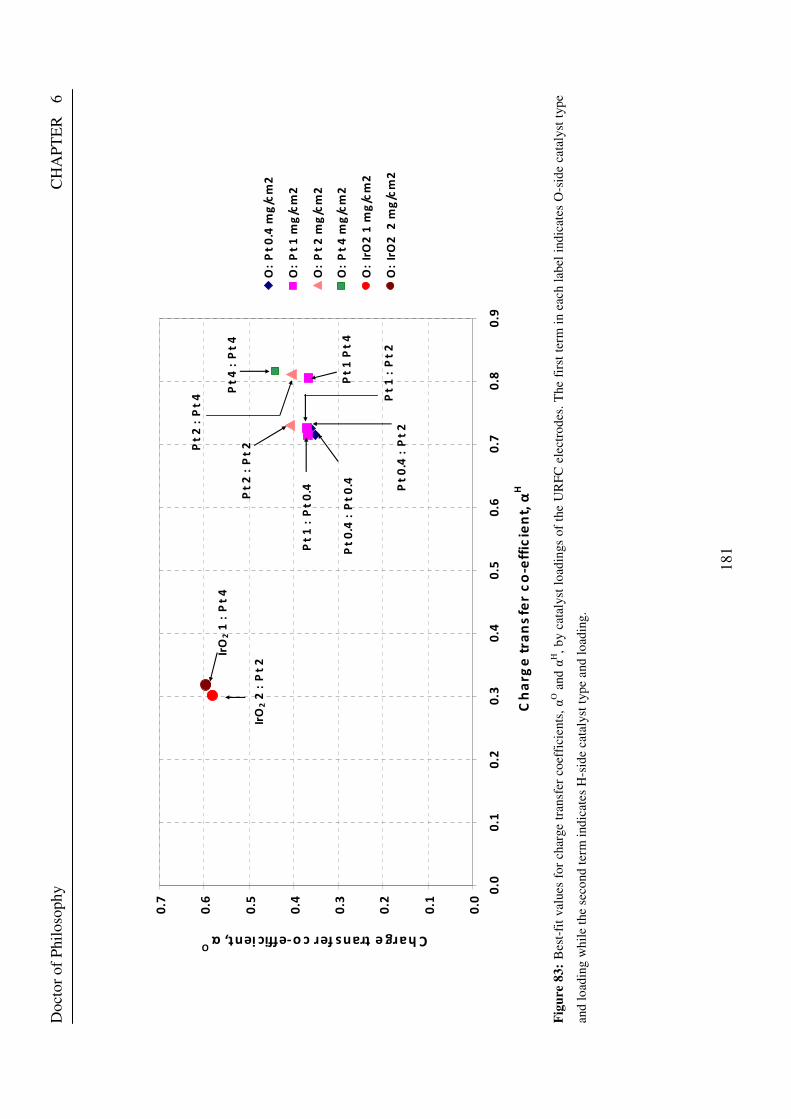
Doct
or
of
Phil
oso
ph
y
C
HA
PT
ER
6
181
Fig
ure
83
: B
est-
fit
val
ues
fo
r ch
arge
tran
sfer
co
effi
cien
ts, αO
and
αH,
by c
atal
yst
lo
adin
gs
of
the
UR
FC
ele
ctro
des
. T
he
firs
t te
rm i
n e
ach l
abel
ind
icat
es O
-sid
e ca
taly
st t
yp
e
and
lo
adin
g w
hil
e th
e se
cond
ter
m i
nd
icat
es H
-sid
e ca
taly
st t
yp
e an
d l
oad
ing.
0.0
0.1
0.2
0.3
0.4
0.5
0.6
0.7
0.0
0.1
0.2
0.3
0.4
0.5
0.6
0.7
0.8
0.9
Ch
arg
e t
ran
sfe
r c
o-e
ffic
ien
t, α
H
Charge transfer co-efficient, αO
O:
Pt
0.4
mg
/cm
2
O:
Pt
1 m
g/c
m2
O:
Pt
2 m
g/c
m2
O:
Pt
4 m
g/c
m2
O:
IrO
2 1
mg
/cm
2
O:
IrO
2
2 m
g/c
m2
Pt
4 :
Pt
4
IrO
2 2
: P
t 2
IrO
2 1
: P
t 4
Pt
0.4
: P
t 2
Pt
2 :
Pt
2Pt
2 :
Pt
4
Pt
1 :
Pt
0.4
Pt
1 :
Pt
2
Pt
1 P
t 4
Pt
0.4
: P
t 0
.4

Doctor of Philosophy CHAPTER 6
182
6.6 VARIATION OF SATURATION CURRENT DENSITY VALUES FOR URFC
ELECTRODES
The variation of the best-fit saturation current densities, Esatj and
FCsatj , with catalyst
loadings on the URFCs tested is shown in Table 22.
H2 s ide c atalys t
and loading
O2 s ide c atalys t
and loading , A/cm2
, A/cm2
P t - 0.4 mg/cm2
P t -0.4 mg/cm2
0.145 0.105
P t - 2 mg/cm2
P t - 0.4 mg/cm2
0.16 0.1
P t - 0.4 mg/cm2
P t -1 mg/cm2
0.14 0.135
P t - 2 mg/cm2
P t - 1 mg/cm2
0.165 0.13
P t - 4 mg/cm2
P t - 1 mg/cm2
0.19 0.135
P t - 2 mg/cm2
P t - 2 mg/cm2
0.16 0.14
P t - 4 mg/cm2
P t - 2 mg/cm2
0.195 0.145
P t - 4 mg/cm2
P t - 4 mg/cm2
0.2 0.165
P t - 2 mg/cm2
IrO 2 - 1 mg/cm2
0.2 0.1
P t - 4 mg/cm2
IrO 2 - 2 mg/cm2
0.190 0.110
FCsatj
Esatj
Table 22: Best-fit values for saturation current densities, satEj and sat
FCj , by catalyst loadings of the URFC
electrodes together with error range values
As can be seen from Table 22, E
satj values vary between 0.14 A/cm2 and 0.2 A/cm2 for all
the URFCs tested. As would be expected, E
satj values for electrodes are always higher than
the corresponding FCsatj values.
The values forFCsatj varied between 0.1-0.165 A/cm2 for different URFC electrodes. A high
value of FCsatj corresponds to a better operation in FC-mode which is the case for URFCs
with catalysts containing higher Pt loading. The latter generally have a better performance
in FC-modes, but worse performance in E-mode, compared to electrodes with IrO2, as
shown before in the energy efficiency analysis presented in Table 14 in the chapter 5.

Doctor of Philosophy CHAPTER 6
183
As seen in Figure 84 , increasing the Pt catalyst loading on the O-side steadily increases
FCsatj and thus FC-mode performance without having much effect on
Esatj and E-mode
performance. When a URFC had O-side catalyst loading of 1 mg/cm2, FCsatj was 0.135
A/cm2, which increased to 0.145 A/cm2 when the catalyst loading was also increased to 2
mg/cm2. However, the value of FCsatj reached a maximum of 0.165 A/cm2 when the O-side
catalyst loading was highest at 4 mg/cm2. The H-side catalyst was kept constant at Pt 4
mg/cm2.
Increasing the Pt loading on the H-side had the inverse impact: Esatj increases and E-mode
performance is enhanced while FCsatj and FC-mode performance stays about the same. In the
case of the URFC with H-side catalyst loading of 0.4 mg/cm2, E
satj was about 0.14 A/cm2.
This increased to 0.165 A/cm2 when the H-side catalyst loading was increased to 2
mg/cm2. When the H-side catalyst loading was highest at 4 mg/cm2, the E
satj value was 0.4
A/cm2. These relationships suggest that for the URFCs tested here FC-mode performance
is limited at high current densities by reaction constraints on the O-side electrode, and E-
mode performance by constraints on the H-side.

Doct
or
of
Phil
oso
ph
y
C
HA
PT
ER
6
184
Fig
ure
84
: B
est-
fit
val
ues
fo
r sa
tura
tio
n c
urr
ent
den
siti
es,
sat
Ej a
nd
sat
FC
j,
by c
atal
yst
lo
adin
gs
of
the
UR
FC
ele
ctro
des
.
0.0
0
0.0
4
0.0
8
0.1
2
0.1
6
0.2
0
0.2
4 0.0
00
0.0
50
0.1
00
0.1
50
0.2
00
0.2
50
JE
sat ,
[A/c
m2]
JsatFC
, [A/cm2]
JF
Csat
O:
Pt
0.4
mg
/cm
2
JF
Csat
O:
Pt
1 m
g/c
m2
JF
Csat
O:
Pt
2 m
g/c
m2
JF
Csat
O:
Pt
4 m
g/c
m2
JF
Csat
O:
IrO
2 1
mg
/cm
2
JF
Csat
O:
IrO
2
2 m
g/c
m2
Pt
0.4
: P
t 0
.4P
t 0
.4:
Pt
2
Pt
4 :
Pt
4
Pt
1:
Pt
0.4
Pt
1:
Pt
2P
t 1
: P
t
Pt
2 :
Pt
2P
t 2
: P
t 4
IrO
2 1
: P
t 2
IrO
2 2
: P
t 4
Doctor of Philosophy CHAPTER 7
185
6.7 CONCLUSION
The theoretical approach and associated computer model developed in this thesis has been
used in this chapter to obtain best-fit values for the electrode characteristics for the URFCs
with single catalyst materials active in each mode on each electrode for the corresponding
experimentally measured V-I curve across both modes. Importantly the variations found
using this combined experimental-theoretical approach in the exchange current densities
and charge transfer coefficients on each electrode with catalyst loadings conform to a
priori expectations. When catalyst loading on a given electrode is held constant, the
corresponding characteristics for this electrode also stay relatively constant, even though
the loading and characteristics of the other electrode vary. Since this pattern, is not
mathematically inherent in the equations used to develop the theoretical model of URFCs,
this observed pattern is partial confirmation of the validity of the model developed in this
thesis.
Thus the theoretical approach and associated computer model promises to be a useful tool
in the design of URFCs with superior electrode characteristics and hence performance in
both E-mode and FC-mode. However, an important further development of the model that
has still to be carried out will need to be its extension to the case of mixed catalysts on the
O-side, which is likely to be essential to get high reversible performance in the form of low
overpotentials in both modes.
Doctor of Philosophy CHAPTER 7
186
7. CONCLUSIONS AND RECOMMENDATIONS
7.1 THIS CHAPTER
In this final chapter, the responses to the research questions set for this thesis in chapter 1,
on the basis of all the theoretical and experimental investigations conducted, will be
summarised. Some overall conclusions will then be drawn, and recommendations relating
to the future development of URFCs will be made. The thesis concludes with a short
epilogue.
7.2 RESPONSES TO RESEARCH QUESTIONS
7.2.1 How does the technical performance of unitised regenerative fuel cells
compare with that of separate electrolysers and fuel cells?
The overall energy efficiency based on HHV for a 50W h-tec STAXX7 PEM electrolyser
stack has been measured to be about 89%, and the maximum current density was about 1.6
A/cm2 (Ali, 2007). Other values in literature suggest an energy efficiency of over 90% for a
PEM electrolyser (Tunold et al., 2006; Marshall et al., 2007). The maximum hydrogen
production rate for this type of electrolyser is 2.22x10⁻⁷ kg/s (Ali, 2007). The energy
efficiency of a 10 W BCS fuel cell based on the manufacturer’s predicted performance is
about 57% (BCS, 2005) and the maximum power output density for a PEM fuel cell
operating at STP is around 0.35 W/cm2 (Genevey, 2001; Al-Baghdadi, 2005). If roundtrip
energy efficiency is considered for a solar-hydrogen system employing a separate
electrolyser and fuel cell of these types, then it would be about 89% x 57% = 51%
Based on the literature review carried out of published studies on URFCs in the present
work, the best-performing experimental PEM URFCs to date have energy efficiency in E-
mode in the range 80 – 88% at maximum power inputs and outputs. The corresponding
energy efficiencies in FC mode were 42 – 52%. Correspondingly, the roundtrip energy
efficiencies were in the range of 32 – 38%, as described in section 2.10. If the URFC
operates over a range of power inputs and outputs, the average roundtrip energy efficiency
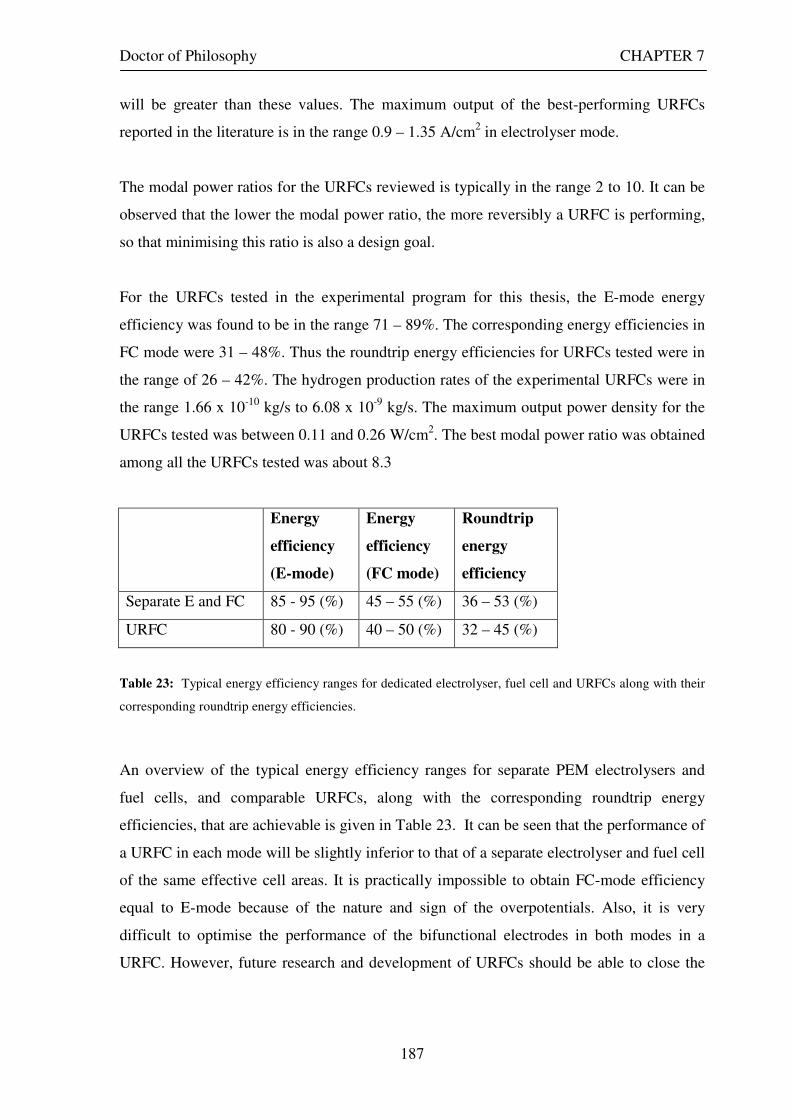
Doctor of Philosophy CHAPTER 7
187
will be greater than these values. The maximum output of the best-performing URFCs
reported in the literature is in the range 0.9 – 1.35 A/cm2 in electrolyser mode.
The modal power ratios for the URFCs reviewed is typically in the range 2 to 10. It can be
observed that the lower the modal power ratio, the more reversibly a URFC is performing,
so that minimising this ratio is also a design goal.
For the URFCs tested in the experimental program for this thesis, the E-mode energy
efficiency was found to be in the range 71 – 89%. The corresponding energy efficiencies in
FC mode were 31 – 48%. Thus the roundtrip energy efficiencies for URFCs tested were in
the range of 26 – 42%. The hydrogen production rates of the experimental URFCs were in
the range 1.66 x 10⁻¹⁰ kg/s to 6.08 x 10⁻⁹ kg/s. The maximum output power density for the
URFCs tested was between 0.11 and 0.26 W/cm2. The best modal power ratio was obtained
among all the URFCs tested was about 8.3
Energy
efficiency
(E-mode)
Energy
efficiency
(FC mode)
Roundtrip
energy
efficiency
Separate E and FC 85 - 95 (%) 45 – 55 (%) 36 – 53 (%)
URFC 80 - 90 (%) 40 – 50 (%) 32 – 45 (%)
Table 23: Typical energy efficiency ranges for dedicated electrolyser, fuel cell and URFCs along with their
corresponding roundtrip energy efficiencies.
An overview of the typical energy efficiency ranges for separate PEM electrolysers and
fuel cells, and comparable URFCs, along with the corresponding roundtrip energy
efficiencies, that are achievable is given in Table 23. It can be seen that the performance of
a URFC in each mode will be slightly inferior to that of a separate electrolyser and fuel cell
of the same effective cell areas. It is practically impossible to obtain FC-mode efficiency
equal to E-mode because of the nature and sign of the overpotentials. Also, it is very
difficult to optimise the performance of the bifunctional electrodes in both modes in a
URFC. However, future research and development of URFCs should be able to close the
Doctor of Philosophy CHAPTER 7
188
gap between the roundtrip energy efficiences of a separate electrolyser and fuel, and a
URFC to within a few percentage points.
The modal power ratio for existing URFCs is around 2 to10 (chapter 2, section 2.11). This
means the maximum power density in E-mode is at least five times greater than the
maximum power density in FC-mode. Ali (2007)’s model suggest that an electrolyser of
1.7 kW capacity and a fuel cell of about 0.3 kW capacity is required in a solar-hydrogen
RAPS system to meet a the typical electrical power requirement of 5 kWh in a remote
household in Australia. The modal power ratio of this system – that is, the electrical input
capacity of the electrolyser divided by the electrical output capacity of the fuel cell – is
1.7/0.3, or 5.6. Thus, a URFC with a modal power ratio of about 5 or 6 can be beneficial in
a solar-hydrogen RAPS, where a larger electrolyser capacity than fuel cell capacity is
usually required.
7.2.2 What advantages and disadvantages do unitised regenerative fuel cell systems
have compared to separate electrolyser and fuel cell systems?
With respect to RAPS applications, the focus of the present study, a critical cost penalty for
current solar - hydrogen systems is the high combined capital costs of the PEM
electrolyser, the PEM fuel cell, and the storage system for hydrogen as compressed gas,
compared to a battery bank where just the batteries are required. Because a URFC is a
single device capable of functioning in either the electrolyser mode or the fuel cell mode,
the URFC concept is ideally suited for renewable energy - hydrogen RAPS systems (and a
storage system for household photovoltaic) since in such applications the electrolyser
function is never needed at the same time as the fuel cell function. Hence if the capital cost
of a URFC can be kept much lower than the combined cost of a separate electrolyser and
fuel cell, and its efficiencies in both modes are close to those in separate units, then its use
could lead to economically competitive renewable energy -hydrogen systems. The present
study has shown that the prospects are good for developing PEM URFCs with roundtrip
energy efficiencies very close to those of discrete PEM electrolyser – fuel cell
combinations, without URFC capital costs significantly lower than the combined system.
However, further research, development, demonstration and field testing are required to
turn this prospect into a reality.
Doctor of Philosophy CHAPTER 7
189
In a broader context, because a URFC system would require only one electrochemical cell
rather than two – that is, one for the electrolyser and another for the fuel cell – it offers
savings in total volume, mass, potential overall system cost, space, and lifecycle costs.
Hence URFCs potentially have important advantages in applications such as aerospace and
fuel-cell powered vehicles where the system mass and volume are critical. Since only one
cell stack is needed instead of both an electrolysis cell stack and a fuel cell stack, a
substantial amount of mass is saved because the cell stacks are major mass components of
electrolyser and fuel cells. Depending on the operating current density of the
electrochemical cell stacks, the mass associated with either the water electrolysis cell stack
or the fuel cell stack is typically 0.5 to 1 kg stack mass per W (Burke and Jakupca, 2005).
Therefore, as an example, for a 10 kW system, the electrolysis cell stack and fuel cell stack
would each have approximately a 10 to 20 kg mass (a total of 20 to 40 kg), whereas the
URFCS would have only a single 10 to 20 kg cell stack. Besides saving the mass of one
cell stack, the plumbing, wiring, structural mounting, and ancillary equipment for one cell
stack is also eliminated.
The use of a URFC in hydrogen-powered vehicular applications would permit the
refuelling of the vehicle by producing hydrogen fuel on-board the vehicle by coupling the
vehicle to an external supply of electricity and water. The advantage would be that the
reliance on very costly direct hydrogen-refuelling infrastructure would be reduced (Donis
and Roberto, 2003).
From the analysis done in chapter 3, the main challenges facing solar-hydrogen URFC
systems for RAPS and other standalone applications are the following:
• Achieving high-efficiency operation in both modes, very close to that achievable
with a discrete electrolyser and fuel cell, over a large number of modal switches and
a long lifetime for a URFC
• Attaining a quick transition between full-functioning in E and FC modes
• Keeping the capital cost of a URFC as low as, or only slightly above, that of a PEM
electrolyser of the same capacity.
• Designing a balance of system that is as low cost as possible, lower than that for a
separate electrolyser and fuel cell, while maintaining high reversible performance.
Doctor of Philosophy CHAPTER 7
190
7.2.3 How can the energy efficiency and cost-effectiveness of unitised regenerative
fuel cells be improved?
The energy efficiency and cost-effectiveness of URFCs can be improved by optimising the
performance of a URFC in both fuel cell and electrolyser modes, so that higher roundtrip
energy efficiencies can be realised. In particular, on the oxygen side, catalyst layers that
have low overpotentials in both modes, and improved gas diffusion and water transport
layers, are required, and these also need to be manufactured at low cost.
Based on the equations from the theoretical model that has been developed in chapter 4 of
this thesis, it has been shown that a truly reversible electrode functioning equally well in
FC and E-modes has a charge transfer coefficient of 0.5. If the charge transfer coefficient
of a particular electrode is greater than 0.5, the electrode performs better in E-mode than in
FC-mode. Conversely if the coefficient is less than 0.5, FC-mode performance is superior.
These findings apply to both the hydrogen and oxygen electrodes.
Possible avenues for developing improved URFCs are thus to aim for charge transfer
coefficients as close to 0.5 as possible, or go for a mixed catalyst with one material having
a high transfer coefficient in E-mode and the other high in FC-mode. The theoretical
relationship also shows that a larger value for exchange current density always improves an
electrode’s performance in both E-mode and FC-mode. Hence an aim in URFC design is
always to find catalyst materials and layer structures that have as high exchange current
densities as possible in both modes and on both sides of the cell.
The computer model based on theoretical work developed in this research work can be
used to obtain the best-fit values for the electrode characteristics for URFCs with single
catalyst materials active in each mode on each electrode. The model thus promises to be a
useful tool in identifying the catalyst types and loadings that give best roundtrip energy
efficiencies and thus lowest unit costs per unit of electrical energy stored for various URFC
types.
In the case of the URFCs with single catalyst layer active in each mode at any time of
operation that I have tested, the O-side exchange current density values were found be in
Doctor of Philosophy CHAPTER 7
191
the range of 1.91 x 10⁻⁹ A/cm2 to 7.38 x 10⁻⁹ A/cm2. Also, the H-side exchange current
density values were between 1.76 x 10⁻⁴ A/cm2 to 2.38 x 10⁻³ A/cm2. Charge transfer
coefficient values were between 0.351 to 0.440 on O-side and 0.715 to 0.817 on H-side for
cells that perform well in FC mode. Similar values are 0.581 and 0.595 for O-side; 0.303
and 0.319 on H-side for cells performing well in E-mode. Saturation current densities for
E-mode varied between 0.14 and 0.2 A/cm2, and for FC-mode between 0.1-0.165 A/cm2.
The roundtrip energy efficiencies of all the URFC tested were in the range of 26 – 42%
depending on catalyst type and loading. These figures provide a benchmark for improving
the performance of future URFCs. From the experimental results as given in section 5.6, it
can also be observed that improved URFC performance is obtained by using compounds or
mixtures of different catalyst materials such as PtIrO2 and Pt/IrORuOx as the O-side
catalyst.
What is needed now is to apply in a systematic and more comprehensive way the model
and method developed here for finding the characteristics of both the oxygen and hydrogen
electrodes to a wide range of URFCs, not only with varying catalyst composition and
loadings, but also with varying gas diffusion backing materials, flow channel
configurations, gas pressures, and water management approaches.
Furthermore, if URFCs are to be competitive with discrete electrolyser and fuel cell
systems, it is essential that the operational lifetime of the URFC, particularly the MEA and
GDBs, is comparable to that of corresponding components in the combined system, that is,
the electrolyser and fuel cell. It has been beyond the scope of the present study to
investigate the degradation of performance of URFCs overall, and of their MEAs in
particular, with extended usage in each mode, and with repeated switching between modes.
Developing reversible MEAs that are able to maintain the stability of the oxygen electrode,
both in terms of resistance to corrosion or other degradation, and retention of structural
integrity and strength after repeated cycling is thus a priority in future research and
development. Sustained, reliable and high-efficiency operation in both modes over a large
number of modal switches and a long lifetime needs to be demonstrated. Further
experimental studies are thus required into performance degradation of URFCs, operated
according to a number of standard cycles over specified periods, to establish benchmarks
for comparing URFCs of different designs, and assess their practical lifetimes.

Doctor of Philosophy CHAPTER 7
192
Another opportunity for improving URFC performance and cost-effectiveness is to conduct
further work on ensuring sufficient water is supplied to the O-side electrode in E-mode and
the water (liquid and vapour) removal rate is optimal in FC-mode. The relationship
between water management and the degradation of catalysts, membranes and GDBs is also
worthy of additional study. In practical applications such as solar hydrogen RAPS systems,
achieving a quick transition between full-functioning in E and FC modes for RAPS
applications is desired, and optimal water management during this transition is critical to
achieve this goal.
With respect to improving the cost effectiveness of URFC-based energy storage systems,
operating in E-mode at higher pressures, up to 10 or 20 bar, so that hydrogen and
preferably oxygen too can be stored as compressed gas in vessels of practical size, would
be a great advantage. In addition, designing a balance of system that is as low cost as
possible while maintaining high reversible performance of the URFC is clearly desirable.
More generally, as with any new technology currently at the early developmental stage,
mass production of URFCs and other system components would certainly lead to radically
in lower total costs that that of current units.
7.2.4 To what extent can the use of unitised regenerative fuel cell systems improve
the triple bottom line competitiveness of solar-hydrogen systems compared
with conventional systems for remote area power supply?
7.2.4.1 Economic evaluation
The estimated unit cost of electricity supplied by a solar-hydrogen URFC system to meet a
electrical requirement of 5 kWh/d in a south eastern Australian location has been found to
be between US$ 1.40 - 1.53/kWh for a storage cost of US$ 500/kg (depending on the
assumed capital costs of URFC and their efficiencies in E and FC modes), and rising to
US$ 2.38/kWh for a storage cost US$ 2000/kg. These values compare with the unit cost of
electricity supplied by a solar-hydrogen system employing a separate electrolyser and fuel
of US$ 1.62/kWh for a unit cost of storage of US$ 500/kg, and US$ 2.60/kWh for a storage
cost US$ 2000/kg.
Doctor of Philosophy CHAPTER 7
193
Hence, if the target URFC costs of US $3900/kW (together with efficiency targets, 95%
Faraday efficiency in E-mode and 95% fuel utilisation coefficient), and lifetimes (10 years)
of a URFC are kept the same as those for a dedicated electrolyser and fuel cell, the cost of
unit power delivered from the solar-hydrogen system employing the URFC can be reduced
by between 9 and 14% compared to the conventional system for a storage cost of 500/kg
H2. A properly designed URFC based solar-hydrogen system should also be able to meet
the end-use demand over a full year without requiring regular maintenance - a further cost
saving on a lifecyle basis.
There is also an excellent opportunity for further economic benefits through the growth of
firms producing and installing URFC hydrogen storage systems, and renewable energy
hydrogen systems as a whole, in Australia and overseas.
7.2.4.2 Environmental evaluation
A URFC based solar hydrogen system is an exemplar of a sustainable energy system that
has zero emissions, and is completely clean and noiseless. It has a huge potential to reduce
greenhouse emissions if it were to replace all diesel based RAPS systems with standalone
renewable energy systems employing URFC hydrogen storage. The potential reduction in
greenhouse emissions by replacing all diesel RAPS systems with standalone renewable
energy systems employing URFC hydrogen storage would be in the order of 60 000
tonnes/y CO2-e (section 3.3.2.2)
7.2.4.3 Social evaluation
The safety of hydrogen production, storage and usage is a key social issue when using
solar-hydrogen systems (either conventional or URFC bases) for RAPS applications. In
particular, in the event of extreme conditions such as lightning strikes, bushfires, and high
winds, which are very common in Australia by virtue of its geography and climatic
conditions.
Doctor of Philosophy CHAPTER 7
194
Although solar-hydrogen systems have been demonstrated in some practical applications,
they are still very much at a research and development stage. The construction of a URFC-
based solar-hydrogen RAPS pilot project should involve relevant social groups at different
stages of the design and construction in order to provide a more suitable system. The
relevant social groups can be involved through discussion forums, interviews and
questionaries. Social benefits of a pilot project would consist of educational knowledge,
research developments and the contribution to the development of the sustainable energy
industry.
Hydrogen power systems generally, which URFCs would help to make more competitive,
provide unique opportunities for increasing the diversity of supply in the more general
electricity market. Currently the penetrations of renewables like wind and solar into the
main electricity markets are limited by grid stability and intermittency issues. By
combining these generation technologies with hydrogen production and storage, facilitated
by URFCs, intermittent renewables could potentially capture a larger share of the power
production market without major upgrades to the existing grid.
Some of the principal impacts of URFC based solar hydrogen systems on society are the
following:
• A first step towards a truly sustainable energy economy based on hydrogen as a
dominant energy carrier.
• A tangible demonstration to society generally that the intermittency of renewable
energy sources of supply can be overcome and that such sources can provide a
continuous and secure energy supply into the long term future.
• Job creation in a developing industry in Australia based on a critical technology in
the new hydrogen economy.
Doctor of Philosophy CHAPTER 7
195
7.3 CONCLUSIONS
The overall goal of this thesis has been to investigate and study the use of unitised
regenerative fuel cells in solar- hydrogen system for remote area power supply. The
presented work helps to better understand URFCs and makes significant additional
contribution to the current body of knowledge on URFCs and solar-hydrogen systems.
A review of previous work on URFCs has been presented in chapter 2 based on published
papers and articles. This review found that the best-performing experimental proton
exchange membrane based URFCs to date have roundtrip energy efficiencies in the range
30 – 38% at maximum power inputs and outputs, compared to the around 50% roundtrip
energy efficiency achievable with a comparable dedicated PEM electrolyser and fuel cell
system. In order to make URFCs competitive against separate electrolyser and fuel cells,
the roundtrip energy efficiency of URFCs must ideally be raised to the 50% mark. The
modal power ratio for the URFCs reviewed was in the range 2 to 10. For a URFC to
perform well in both E and FC modes, the modal power ratio should be as low as possible.
Chapter 3 detailed the application of URFCs for solar-hydrogen systems and compared a
URFC-based system to a solar-hydrogen system employing a separate electrolyser and fuel
cell. The analysis indicates that potential savings of up to 14% in the cost of unit power
delivered (on a total system cost basis) can be obtained by employing URFCs against
conventional solar-hydrogen systems that use dedicated electrolyser and fuel cell. This cost
reduction can be achieved if the performance of a URFCs and lifetimes are maintained
very close to those of a separate electrolyser and fuel cell performances, while bringing
down the balance of system costs of the URFC-based system.
A new theoretical model of a PEM URFC has been developed in chapter 4 by deriving a
general theoretical relationship between cell voltage and current density that is applicable
in both E and FC-modes. In addition the model incorporates the saturation behaviour in
both modes by modifying the standard Butler-Volmer equations using a logistic-type
function. The model also takes into account the proton and electron conductivities of the
membrane, and the electron conductivities of the GDBs and backing plates. The model has
been used to explore the influence of charge transfer coefficients, exchange current
Doctor of Philosophy CHAPTER 7
196
densities and saturation current densities on URFC polarisation curves and hence overall
cell performance.
A computer simulation model of URFCs using this theoretical relationship and solving
equations by iterative methods has been developed and used to show the effect on cell
performance in both modes of varying exchange current densities and charge transfer
coefficients at each electrode, and varying the saturation current densities. The model can
generate Vcell-jcell curves that closely fit experimental curves for actual URFCs across the
entire range of operation of both modes. Thus, the model developed promises to be a useful
tool in the design of URFCs with improved performance in both modes.
In chapter 5, the design and construction of experimental URFCs is described.
Experimental URFCs are tested for their Vcell-jcell curves, hydrogen production and
consumption rates, and hence their energy efficiencies in E-mode, FC-mode and roundtrip.
In FC mode, URFCs with Pt black catalyst showed the best performance in terms of
highest cell voltage at a given current density. The addition of other metals into the oxygen
electrode decreased the performance in the order: Pt black >PtIrO2 > PtIroRuOx > IrRu.
However, in E-mode, the addition of IrO2, IrORuOx, IrO2RuO2, IrRuOx and Ru into the
oxygen electrode evidently enhanced the E-mode performance maintaining lower cell
voltage compared to Pt black. Particularly, the addition of Ir catalysts, irrespective of their
chemical phases, showed a very positive effect on the URFC performance in E-mode.
Consequently, in terms of E-mode performance the best performing URFC had a PtIrO2
catalyst, with the following catalysts progressively showing lower performance:
PtIrORuOx > PtIrO2RuO2 > IrRu > IrRuOx > PtIrRu > Pt black.
The measured roundtrip energy efficiencies varied between 41.6% for the cell with
loadings O: Pt/IrO2 4 mg/cm2, H: Pt 4 mg/cm2 and 26.2% for the cell with O: IrRu 2
mg/cm2; H: Pt 2 mg/cm2. Cells with a mixed catalyst on the O-side had superior roundtrip
energy efficiencies compared to a single catalyst layer of Pt. The cell with the highest
roundtrip efficiency was a URFC with O-side: Pt/IrO2 4 mg/cm2; H: Pt 4 mg/cm2 catalyst.
The URFC that contained O-side catalyst: IrO2 (loading 4 mg/cm2) and H-side catalyst: Pt
(loading 4 mg/cm2) had the highest rate of hydrogen production of about 6.1 x 10⁻⁹ kg/s.
Other cells produced hydrogen between 1.7 x 10⁻¹⁰ kg/s and 6.1 x 10⁻⁹ kg/s.
Doctor of Philosophy CHAPTER 7
197
The modal power ratio of all URFCs measured experimentally in this thesis ranged from 8
to 20. URFCs with lower modal power ratios are always preferable in a solar-hydrogen
system or other application. Among the URFCs tested here, the URFC with O-side: Pt/IrO2
4 mg/cm2; H: Pt 4 mg/cm2 catalyst type had the lowest modal power ratio about 8.3.
Thus the experimental results obtained for the performance of URFCs with a range of
different catalyst types and loadings have allowed the best-performing combinations
among this group to be identified. Among the 18 URFCs chosen based on varying catalyst
types and loading, the URFC which had O-side catalyst as Pt/IrO2 (4 mg/cm2 loading) and
H-side catalyst Pt (4 mg/cm2 loading) is clearly the best performer. Generally increasing
the catalyst loading on a particular cell tended to improve the cell performance in both E
and FC-modes. Further experimental testing of URFCs with other catalyst types and
loadings is, however, still required to identify the best candidate for further development
and eventual commercialisation.
In chapter 6, the theoretical approach and associated computer model (developed earlier in
chapter 4) has been used to obtain best-fit values for the key characteristics of the oxygen
and hydrogen electrodes of ten cells with varying catalyst loadings from their
experimentally measured Vcell-jcell curves. The values found for exchange current densities
and charge transfer coefficients conform well to a priori expectations based on the catalyst
loadings; for example, the exchange current density on the O-side stays constant for cells
with the same O-side catalyst loading while the H-side loading increases and raises the H-
side exchange current density. There is no in-built mathematical necessity for this observed
behaviour. Hence it provides a partial confirmation of the validity of the modelling
approach. By providing a means to obtain experimentally-based values for the
characteristics of each electrode the model promises to be a useful tool in identifying
electrodes with materials and structures, together with optimal catalyst types and loadings
that will improve URFC performance. However, the model in its present form will need to
be extended to the case of mixed catalysts on the O-side, rather than covering just single
active catalyst on each side, since such combinations of catalyst are likely to be essential to
get high reversible performance in the form of low overpotentials in both modes, an
important further development, as the experimental measurements of chapter 5 clearly
indicated.
Doctor of Philosophy CHAPTER 7
198
7.4 RECOMMENDATIONS
The following recommendations are made relating to the further development of URFCs,
for utilisation in solar-hydrogen systems and other applications.
Further experimental and theoretical work should be conducted with the aims of raising the
roundtrip energy efficiency of PEM URFCs, extending their practical lifetimes, and
lowering the unit costs of energy stored and delivered in solar-hydrogen power supply
systems, and other energy storage applications employing URFCs.
The theoretical model of PEM URFCs developed in this thesis should be subjected to
additional detailed testing of its validity and general applicability by further comparison of
modelled polarisation curves with experimental curves. Best-fit values for exchange
current densities and charge transfer coefficients for both electrodes need to be compared
with values obtained for these parameters from other studies and methods.
The current computer simulation model needs to be enhanced so that the procedure for
finding the best-fit values of the electrode characteristics for a given experimental V-I
curve for a URFC is done automatically using a linear or non-linear least squares method.
The present theoretical model should be extended to cover the more complex case of a mix
of active catalysts on the O-side, since such a mix is likely to be essential to get high
performance in both E and FC modes. The use of the principle of linear superposition of
the separate effects of the two active catalysts is an approach worth pursuing in the first
instance to see if this can adequately represent actual performance.
The design of the test PEM URFC cell used in the experimental work of this thesis should
be further developed and improved, with the following aims in mind:
• Improving the Faraday efficiency in both modes by reducing probable leakages of
hydrogen gas and gas crossover from one electrode to the other.
• Investigating water management in both modes, including the degree to which the
O-side electrode needs to be directly in contact with liquid water in E-mode, and
the best means of clearing water from the O-side on switching from E to FC mode.

Doctor of Philosophy CHAPTER 7
199
• A complete demonstration solar-hydrogen system employing a URFC should be
designed to allow full system testing under real-world operating conditions.
Further experimental testing of URFCs should be carried out to:
• measure performance over an extended period, and investigate the effects of
degradation of the membrane, catalysts, electrode media, and gas diffusion
backings
• Investigate the effect of temperature, pressure and gas flow (dead end, open end or
cycling) on URFC performance.
• Investigate the effect of repeated switching between modes on cell durability and
performance.
The relative merits of using air instead of pure oxygen in a URFC energy storage system
should be evaluated.
Further research and development into URFC stacks and development of associated
computer models are required, based on the findings from the work done on single URFCs.
Research and development into a suitable balance of system for the overall URFC system,
including an operational control system, should be conducted, covering:
• Automated shift between electrolyser and fuel cell modes
• Control of the electrolyser and fuel cell subsystem.
A key aim in this research and development should be reducing the cost of the balance of
system for the URFC to below that of a comparable system for a separate electrolyser and
fuel cell.
Doctor of Philosophy CHAPTER 7
200
7.5 EPILOGUE
Currently in the face of the pressing need on the one hand to reduce environmental
pollution and global warming and on the other to reduce our reliability on oil and fossil
fuels generally, radical changes will undoubtedly have to be made to satisfy our energy
requirements over the both the short and long terms. The issues of intermittency associated
with renewable energy can be overcome by storing surplus renewable energy in the form of
hydrogen. URFCs are a promising technology that could play an important role in
hydrogen energy-storage systems integrated with variable renewable energy sources of
many kinds. In particular, URFCs promise to enhance the economic competitiveness of
solar-hydrogen systems for RAPS applications compared to alternatives such as diesel-
battery or PV-battery systems. There are technical challenges to improve energy efficiency,
extend lifetimes, and lower unit costs of URFCs still to be surmounted. Provided these
challenges can be met, numerous applications of URFCs are ready and waiting, stretching
from remote area power supply, telecommunications, autonomous back-up and
uninterruptible power supplies, and rechargeable hydrogen fuel cell vehicles, to
submarines, and to aerospace. However, I believe it is not overambitious to foresee that
URFCs will play an important role in the energy panorama within a few decades.
Doctor of Philosophy REFERENCES
201
PUBLICATIONS DURING THE RESEARCH PROGRAM
Andrews J, Doddathimmaiah A K, Ali, S M, Akbarzadeh A, 2005, ‘Solar hydrogen
systems for remote area power supply from a triple bottom line perspective’, Proceedings
of the Solar World Congress, Orlando, Florida, USA, August 6-12, 2005.
Doddathimmaiah A K, Andrews, J and Akbarzadeh, A, 2005, Performance analysis of a
proton exchange membrane unitised regenerative fuel cell in solar hydrogen systems for
remote area power supply, Proceedings of the ANZSES conference, New Zealand,
November 28-30, 2005.
Doddathimmaiah A K and Andrews J, 2006, ‘The use of PEM unitised regenerative fuel
cells in solar- hydrogen systems for remote area power supply’, Proceedings of 16th World
Hydrogen Energy Conference, Lyon, France, 12-14 June 2006.
Doddathimmaiah A K and Andrews J, 2008, ‘Modelling and Performance Measurement
of Unitised Regenerative Fuel Cells’, Proceedings of the 17th World Hydrogen Energy
Conference, Brisbane, Australia, 15-19 June 2008.
Andrews, J and Doddathimmaiah A K, 2008, 'Regenerative fuel cells’, in Materials for
fuel cells, (Book in publication), Woodhead Publishing, Cambridge, UK.

Doctor of Philosophy REFERENCES
202
REFERENCES
Agbossou K, Chahine R, Hamelin J, Laurencelle F, Anouar A, St-Arnaud JM & Bose TK,
2001, ’Renewable Energy Systems Based on Hydrogen for Remote Applications’, Journal
of Power Sources, 96, 168-172.
Agbossou K, Kolhe M, Hamelin J, Bernier, E and Bose T K, 2004, ‘Electrolytic Hydrogen
Based Renewable Energy System with Oxygen Recovery and Re-utilization’, Renewable
Energy, 29 (8), 1305-318.
Ahn J and Holze R, 1992, ‘Bifunctional electrodes for an integrated water-electrolysis and
hydrogen-oxygen fuel cell with a solid polymer electrolyte’, Journal of Applied
Electrochemistry, 22, 1167-1174.
Akbarzadeh, A, 1992, ‘Fundamentals of Remote Area Power Supply Systems’, Energy
Victoria, Melbourne, Australia.
Ali S M, 2007, ‘Solar-Hydrogen Systems For Remote Area Power Supply’, Master of
Engineering thesis, RMIT University.
Al-Baghdadi M A R S, 2005, ‘Modelling of proton exchange membrane fuel cell
performance based on semi-empirical equations’, Renewable Energy, 30(10), 1587–1599.
Andrews J, 2005, ‘The Transition to Hydrogen Energy (Renewable-Energy Hydrogen
Systems for Remote Area Power Supply), Melbourne, RMIT University,
Andrews J, Doddathimmaiah A K, Ali, S M, Akbarzadeh A, 2005, ‘Solar hydrogen
systems for remote area power supply from a triple bottom line perspective’, Proceedings
of the Solar World Congress, Orlando, Florida, USA., August 6-12, 2005.
Andrews J and Doddathimmaiah A K, 2008, 'Regenerative fuel cells’, in Materials for fuel
cells, (Book in publication), Woodhead Publishing, Cambridge, UK.

Doctor of Philosophy REFERENCES
203
Andolfato F, Durand R, Michas A, Millet P and Stevens P, 1994, ‘Solid Polymer
Electrolyte Water Electrolysis: Electrocatalysis and Long-Term Stability’, International
Journal of Hydrogen Energy, 19 (5), 421-427.
Atiyeh H K, Karan K, Peppley B, Phoenix A, Halliop E and Pharoah J, 2007,
‘Experimental investigation of the role of a microporous layer on the water transport and
performance of a PEM fuel cell’, Journal of Power Sources, 170, 111–121.
Aurora P H, 2003, ‘Modelling & Control of a Solar Hydrogen Fuel Cell System for
Remote Applications’, Master of Science thesis, University of Massachusetts.
Badwal S P S, Giddey S, Ciacchi F T, 2006, ‘Hydrogen and oxygen generation with
polymer electrolyte membrane (PEM)-based electrolytic technology’, Ionics, 12, 7-14.
Barbir F, 2005, ‘PEM electrolysis for production of hydrogen from renewable energy
sources’, Solar Energy, 78, 661-669.
BCS, 2005, Fuel cell manual for 10 cell 10 W stacks.
Bockris J O M, 1975, ‘Energy: The Solar Hydrogen Alternative’, John Wiley and Sons,
New York, USA.
Bockris J O M and Veziroglu T N, 1991, ‘Solar Hydrogen Energy’, MacDonald Optima,
London, U K.
Bockris, J O’M, Reddy A K N, 2000, ‘Modern Electrochemistry’, Kluwer Academic/
Plenum Publishers, New York, USA.
Bockris J O M and Veziroglu T N, 2007, ‘Estimates of the price of hydrogen as a medium
for wind and solar sources’, International Journal of Hydrogen Energy, 32, 1605 – 1610.
Brook P and Besant J, 2000, ‘World Bank Energy Sector Management Assistance Program
(ESMAP). Energy and Development Report 2000: Energy Services for the World's Poor:
The International Bank for Reconstruction and Development / The World Bank’,
http://www.worldbank.org/html/fpd/esmap/energy_report2000/front.pdf viewed 16 June
2008.

Doctor of Philosophy REFERENCES
204
Burke K A, 2003, ‘Unitized Regenerative Fuel Cell System Development’, First
International Energy Conversion Engineering Conference, (American Institute of
Aeronautics and Astronautics), Portsmouth, Virginia, 17–21 August, 2003.
Burke K A and Jakupca I, 2005, ‘Unitized Regenerative Fuel Cell System Gas Storage-
Radiator Development’, Proceedings of Power Systems Conference, Reno, Nevada, 2–4
November 2004.
Choi P, 2004, ‘Investigation of thermodynamic and transport properties of proton-exhange
membranes in fuel cell applications’, Doctor of Philosophy Thesis, Worcester Polytechnic
Institute.
Choi P, Bessarabov D G, Datta R, 2004, ‘A simple model for solid polymer electrolyte
(SPE) water electrolysis’, Solid State Ionics, 175(1-4), 535-539.
Cisar A, Murphy O J, Eric C, 2005, Lynntech, Inc., Bifunctional catalytic electrode,
United States Patent 6,838,205, 4 January, 2005.
Coalson Jr R R, 1998, ‘Unitized Regenerative Fuel Cells (URFC); Opportunities and
Limitations in the Fields of Space Propulsion and Energy Storage’, Master of Engineering
Thesis, University of Colorado.
Costamagna P and Srinivasan S, 2001, ‘Quantum jumps in the PEMFC science and
technology from the 1960s to the year 2000 Part I. Fundamental scientific aspect’, Journal
of Power Sources, 102, 242-252.
Das A, 2002, ‘Modelling, heat transfer and system integration for a 4 kW regenerative
PEM fuel cell system’, Master of Solar Energy Engineering Thesis, University of
Massachusetts.
Department of Climate Change, 2008, http://www.greenhouse.gov.au/ viewed 21 May
2008.

Doctor of Philosophy REFERENCES
205
Department of Resources, Energy and Tourism, 2003, ‘National Hydrogen Study’,
http://www.ret.gov.au/Documents/Hydrogen_StudyOct200320031021120716.pdf
Dhar H P, 1993, ‘A unitized approach to regenerative solid polymer electrolyte fuel cells’,
Journal of Applied Electrochemistry, 23, 32-37.
Doddathimmaiah A K and Andrews J, 2006, ‘The use of PEM unitised regenerative fuel
cells in solar- hydrogen systems for remote area power supply’, Proceedings of the 16th
World Hydrogen Energy Conference, Lyon, France, 12-14 June 2006.
Donis M and Roberto W, 2003, ‘Apparatus for integrated water deionization, electrolytic
hydrogen production, and electrochemical power generation’, United States Patent
6,569,298, 27 May, 2003.
Dutta S, Shimpalee S, Zee J W V, 2001, ‘Numerical prediction of mass-exchange between
cathode and anode channels in a PEM fuel cell’, International Journal of Heat and Mass
Transfer, 44, 2029 – 2042.
Dutton AG, Bleijs J A M, Dienhart H, Falchetta M, Hug W, Prischich D and Ruddell A J,
2000, ‘Experience in the design, sizing, economics, and implementation of autonomous
wind-powered hydrogen production systems’, International Journal of Hydrogen Energy,
25 (8), 705–722.
Elam C C, Padr, C E G, Sandrock G, Luzzi A, Lindblad P and Hagene E F, 2003,
‘Realizing the hydrogen future: the International Energy Agency’s efforts to advance
hydrogen energy technologies’, International Journal of Hydrogen Energy, 28, 601 – 607.
Energy and Technology Review, 1994, ‘Pathfinder and the Development of Solar
Rechargeable Aircraft’, July 1994.
Farret F A and Simoes M G, 2006, ‘Power plants with fuel cells’ in Integration of
Alternate Sources of Energy, John Wiley & sons, England.
Doctor of Philosophy REFERENCES
206
Frank D G, 2000, 'The effects of cell design and materials of construction on the
electrolysis performance of a Proton Exchange Membrane Unitized Regenerative Fuel
Cell', Master of Applied Science thesis, University of Toronto.
G8 Information Centre, 2001, ‘G8 Renewable Energy Task Force, Final Report, July
2001’, http://www.g7.utoronto.ca/meetings-official/g8renewables_annex.pdf accessed on
14 June 2008.
Genevey D B, 2001, ‘Transient Model of Heat, Mass, and Charge Transfer as well as
Electrochemistry in the Cathode Catalyst Layer of a PEMFC’, Master of Science thesis,
Virginia Polytechnic Institute and State University.
Grigoriev S A, Porembsky V I, Fateev V N, 2006, ‘Pure hydrogen production by PEM
electrolysis for hydrogen energy’, International Journal of Hydrogen Energy, 31, 171 –
175.
Grigoriev S A, Lyutikovaa E K, SMartemianovb, Fateeva VN, 2007, ‘On the possibility of
replacement of Pt by Pd in a hydrogen electrode of PEM fuel cells, International Journal
of Hydrogen Energy, 32 (17), 4438-4442.
Guha, 2007, ‘Materials development for PEM fuel cells’, Doctor of Philosophy thesis,
Case Western Reserve University.
Hoogers G, 2003, ‘Fuel Cell Technology Handbook, 1st edition, CRC press, FL, USA.
HyWeb - Gazette, 2001, ‘Proton Energy Systems cooperates with Marconi on reverse fuel
cells for telecommunication systems’, viewed 8 October 2007,
http://www.hyweb.de/News/arcv201e.html#proton
Intergovernmental Panel on Climate Change, 2007, Working Group III Report
"Mitigation of Climate Change", http://www.ipcc.ch/ipccreports/ar4-wg3.htm viewed 25
June 2008.
Doctor of Philosophy REFERENCES
207
Ioroi T, Kitazawa N, Yasuda K, Yamamoto Y, Takenaka H, 2000, ' Iridium Oxide-
Platinum Electrocatalysts for Unitized Regenerative Polymer Electrolyte Fuel Cells ',
Journal of Electrochemical Society, 147, 2018–2022.
Ioroi T, Kitazawa N, Yasuda K, Yamamoto Y, Takenaka H, 2001, ' IrO2 deposited Pt
electrocatalysts for unitized regenerative polymer electrolyte fuel cells ', Journal of Applied
Electrochemistry, 31, 1179-1183.
Ioroi T, Yasuda K, Siroma, Fujiwara N and Miyazaki Y, 2002, 'Thin film electrocatalyst
layer for unitized regenerative polymer electrolyte fuel cells', Journal of Power Sources,
112, 583–587.
Ito Y, Takai Y and Ishikawa T, Suzuki Motor Corporation, ‘Fuel cell’, United States Patent
6,926,982, 9 August 2005.
Ivy, J, 2004, ‘Summary of electrolytic hydrogen production’, Milestone Completion
Report, NREL/MP-560-36734, National Renewable Energy Laboratory, September,
http://www.nrel.gov/hydrogen/pdfs/36734.pdf visited on 26 June 2008.
Jorissen L, 2006, ‘Bifunctional oxygen/air electrodes’, Journal of Power Sources, 155, 23-
32.
Katukota S, 2006, ‘Computational modeling of proton exchange membrane electrolysis
cell for hydrogen production’, Master of Science thesis, University of Nevada.
Khan M J, Iqbal M T, 2005, ‘Pre-feasibility study of stand-alone hybrid energy systems for
applications in Newfoundland’, Renewable Energy, 30, 835–854.
Kirk D W, Graydon J W and Thorpe S J, 2003, ‘Electrochemical cell stacks’, United
States Patent 6,527,921, 4 March, 2003.
Kitco, 2007, “24 hour spot platinum (bid)”, viewed on 2 October 2007,
<http://www.kitco.com/charts/liveplatinum.html>
Doctor of Philosophy REFERENCES
208
Kolhe M K, Agbossou M, Hamelin J and Bose T K, 2003, ‘Analytical Model for predicting
the performance of photovoltaic array coupled with a wind turbine in a Stand-alone
Renewable Energy System based on Hydrogen’, Renewable Energy, 28 (5), 727–742.
Larminie, J and Dicks, A, 2003, ‘Fuel cells systems explained, 2nd edition, John Wiley &
sons, England.
Ledjeff K, Mahlendorf F, Peinecke V and Heinzel A, 1994, ‘Development of
Electrode/Membrane Units for the Reversible Solid Polymer Fuel Cell (RSPFC)’,
Electrochimica Acta, 40(3), 315-319.
Lee H, Kim J, Park J, Joe Y, Lee T, 2004, ‘Performance of Polypyrrole-impregnated
composite electrode for Unitized Regenerative Fuel Cell’, Journal of Power Sources, 131,
188–193.
Lehman P A, Chamberlin C E, Pauletto G and Rocheleau M A, 1994, ‘Operating
experience with a Photovoltaic-hydrogen Energy System’, Hydrogen '94: The 10th World
Hydrogen Energy Conference, Cocoa Beach, Florida, 20-24 June 1994.
Li X and Sabir I, 2005, ‘Review of bipolar plates in PEM fuel cells: Flow-field designs’,
International Journal of Hydrogen Energy, 30, 359 – 371.
Liu H, Yi B, Hou M, Wu J, Hou Z, and Zhang H, 2004, ‘Composite Electrode for Unitized
Regenerative Proton Exchange Membrane Fuel Cell with Improved Cycle Life’,
Electrochemical and Solid-State Letters, 7(3) A56-A59.
Los Alamos National Laboratory, 2007, viewed on 2 October 2007:
“Platinum”, http://periodic.lanl.gov/elements/78.html,
“Ruthenium”, http://periodic.lanl.gov/elements/44.html and
“Iridium“, http://periodic.lanl.gov/elements/77.html
Lovins A, Datta E K, Bustnes O E, Koomey J G and Glasgow N J, 2004, Winning the Oil
End Game: Innovation for Profits, Jobs and Security, Rocky Mount Institute, Colorado,
USA.
Doctor of Philosophy REFERENCES
209
Lund P D, 1991, ‘Optimization of standalone photovoltaic systems with hydrogen storage
for total energy self-sufficiency’, International Journal of Hydrogen Energy, 16, 735–740.
Lynntech Inc., 2007, M. Nelson, personal communication, Sept, 2007, College Station,
Texas, USA.
Marshall A, Borresen B, Hagen G, Tsypkin M, Tunold R, ‘Hydrogen production by
advanced proton exchange membrane (PEM) water electrolysers - Reduced energy
consumption by improved electrocatalysis’, Energy, 32, 431–436.
Mennola T, 2000, ‘Design and Experimental Characterization of Polymer Electrolyte
Membrane Fuel Cells’, Degree of Licentiate of Technology Thesis, Helsinki University of
Technology.
Metalspace, 2007, viewed on 2 October 2007, < http://metalsplace.com/news/?a=4700>
Millet P, 1994, ‘Water electrolysis using eme technology - electric potential distribution
inside a nafion membrane during electrolysis’, Electrochimica Acta, 39 (17), 2501-2506.
Mikkola T, 2000, ‘Design and Experimental Characterization of Polymer Electrolyte
Membrane Fuel Cells’, Licentiate of Technology degree thesis, Helsinki University of
Technology.
MiningMX, 2007, viewed on 2 October 2007,
<http://www.miningmx.com/platinum/700747.htm>
Mitlitsky F, Myers B and Weisberg A H, 1996a, 'Lightweight Pressure Vessels and
Unitized Regenerative Fuel Cells', Prodeedings of the Fuel Cell Seminar, Kissimmee, FL,
November 17-20 1996.
Mitlitsky F, Groot W, Butler L and McElroy J, 1996b ' Integrated Modular Propulsion And
Regenerative Electro-Energy Storage System (IMPRESS) For Small Satellites', 10th

Doctor of Philosophy REFERENCES
210
Annual American Institute of Aeronautics and Astronautics/Utah State University
Conference, Logan, Utah, 16-20 September, 1996.
Mitlitsky F, Myers B and Weisberg A H, 1998a, 'Regenerative Fuel Systems R & D',
Proceedings of the U. S. DOE Hydrogen Program Review, Arlington, VA, 28-30 April
1998.
Mitlitsky F, Myers B and Weisberg A H, 1998b 'Regenerative Fuel Cell Systems', Energy
& Fuels, 12, 56-71.
Mitlitsky F, Myers B, Weisberg A H and Leonida A, 1999a, 'Applications and
Development of High Pressure PEM Systems', Portable Fuel Cells Conference, Lucerne,
Switzerland, June 21-24 1999.
Mitlitsky F, Myers B, Weisberg A H, Molter T M and Smith W F, 1999b, 'Reversible
(Unitized) PEM Fuel Cell Devices', Portable Fuel Cells Conference, Lucerne, Switzerland,
June 21-24, 1999.
Mitlitsky F, Weisberg A H, Carter P H, Dittman M D, Myers B, Humble R W and Kare J
T, 1999c, 'Water Rocket - Electrolysis Propulsion and Fuel Cell Power', American Institute
of Aeronautics and Astronautics Space Technology Conference and Exposition,
Albuquerque, NM, 28-30 September, 1999.
Molter T, 1999, ‘Regenerative Fuel Cell Technology and Applications’, Proton Energy
Systems, NETL publications, Conference Proceedings, Joint fuel cell technology review
conference, http://www.netl.doe.gov/publications/proceedings/99/99fuelcell/fc3-9.pdf
accessed 19 Oct 2007.
Molter T and Dalton L, 2005, ‘Regenerative Fuel Cells for Energy Storage: Efficiency and
Weight Trade-offs’, IEEE A&E Systems Magazine.
Moseley, P T, 2006, ‘Energy storage in remote area power supply (RAPS) systems,
Journal of Power Sources, 155, 83-87.

Doctor of Philosophy REFERENCES
211
Murphy O J, Cisar A J and Gonzalez-Martin A, Salinas, C E. Simpson, S F,1995, ‘A Novel
Unitized Regenerative Proton Exchange Membrane Fuel Cell’, Space Electrochemical
Research and Technology, NASA Conference Publication, 3337, 83-99.
NedStack fuel cell technology, 2007, NedStack Projects Pending and concluded,
http://www.nedstack.com/content/NedStackProjects_100407.pdf viewed 8 October 2007.
Norbeck J M, Heffel J W, Durbin T D, Tabbara B, Bowden J M and Montano M, 1996,
‘Hydrogen Production’ in Hydrogen Fuel for Surface Transportation, Society of
Automotive Engineers, Inc., Warrendale, USA.
Noyes Data Corporation, 1978, ‘Hydrogen Manufacture by Electrolysis, Thermal
Decomposition and Unusual Techniques. Edited by Casper M S, Park Ridge, NJ, USA.
O'Hayre R, Cha S W, Colella W, Prinz F B, 2005, ‘Fuel Cell Fundamentals’, Wiley &
Sons, New York, USA.
Onda K, Murakami T, Hikosaka T, Kobayashi M, Notu R, and Ito K, 2002, ‘Performance
Analysis of Polymer Electrolyte Water Electrolysis Cell at a Small-Unit Test Cell and
Performance Prediction of Large Stacked Cell’ Journal of Electrochemical Society, 149,
A1069-A1078.
Paul B, 2008, ‘Optimising the Electrolysis function in a solar hydrogen system for remote
area power supply’, PhD thesis in progress, RMIT University.
Peter Hoffmann, 2001, Tomorrow’s energy, MIT Press, Cambridge Press, Mass., London.
Pettersson J, Ramsey B and Harrison D, 2006, ‘A review of the latest developments in
electrodes for unitised regenerative polymer electrolyte fuel cells’, Journal of Power
Sources, 157, 28–34.
Pletcher D and Walsh F C, 1990, Industrial Electrochemistry, 2nd edition, Chapman and
Hill, New York.

Doctor of Philosophy REFERENCES
212
Power Engineering, 2003, Proton Energy Systems awarded solar/PEM fuel cell power
system project at China Lake, viewed 8 October 2007,
http://pepei.pennnet.com/display_article/167627/6/ARCHI/none/none/Proton-Energy-
Systems-awarded-solar/PEM-fuel-cell-power-system-project-at-China-Lake/
PR Newswire, 2003, Proton Energy Systems Awarded Two Contracts for Regenerative
Fuel Cell Development with NASA and the U.S. Missile Defense Agency,
http://www.prnewswire.com/cgi-bin/stories.pl?ACCT=104&STORY=/www/story/12-18-
2003/0002078238&EDATE, viewed 26 June 2008.
Richard S P, 2004, ‘A Techno-Economic Analysis of Decentralized Electrolytic Hydrogen
Production for Fuel Cell Vehicles’, Master of Applied Science thesis, University of
Victoria.
Richards B S, Conibeer G J, 2007, ‘A comparison of hydrogen storage technologies for
solar-powered stand-alone power supplies: A photovoltaic system sizing approach’,
International Journal of Hydrogen Energy, 32, 2712 – 2718.
Rismanchi B and Akbari M H, 2008, 'Performance prediction of proton exchange
membrane fuel cells using a three-dimensional model', International Journal of Hydrogen
Energy, 33(1), 439-448.
Roshandel R and Farhanieh B, 2007, 'The effects of non-uniform distribution of catalyst
loading on polymer electrolyte membrane fuel cell performance', International Journal of
Hydrogen Energy, 32 (17), 4424-4437.
Santarelli MG, Torchio M F, Cochis P, 2006, ‘Parameters estimation of a PEM fuel cell
polarization curve and analysis of their behavior with temperature’, Journal of Power
Sources, 159, 824–835.
Schatz Energy Research Centre, 2003, http://www.humboldt.edu/~serc/pr.html visited on
10 May 2008.

Doctor of Philosophy REFERENCES
213
Schucan T, 2000, ‘International energy agency hydrogen implementing agreement task 11:
Integrated systems – Final report of subtask A: Case studies of Integrated Hydrogen energy
systems, www.ieahia.org/pdfs/Final%20Report%20-%20Schucan%20Annex%2011%20Su
btask%20A.pdf, viewed 10 May 2008.
Simmons M R, 2005, Twilight in the desert, Wiley and Sons, New York, USA.
Sivasubramanian P K, Ramasamya R P, Freire F J, Holland C E, Weidner J W, 2007,
‘Electrochemical hydrogen production from thermochemical cycles using a proton
exchange membrane electrolyzer’, International Journal of Hydrogen Energy, 32 (4), 463-
468.
Smith W, 2000, ‘The role of fuel cells in energy storage', Journal of Power Sources, 86,
74-83.
Smith, 2001, ‘The role of regenerative fuel cells in advanced power solutions’,
Presentation at the Power Technology Conference, 10-13 September 2001, Portugal.
Song S, Zhang H, Ma X, Shao Z G, Zhang Y and Baolian Yi, 2006,’Bifunctional oxygen
electrode with corrosion-resistive gas diffusion layer for unitized regenerative fuel cell',
Electrochemistry Communications, 8 (3) 399-405.
Sopian K and Daud W R W, 2006, ‘Challenges and future developments in proton
exchange membrane fuel cells’, Renewable Energy, 31, 719–727.
Sportsman S, Way D and Pez G, 2002 ‘Microstructural Diffences Among Nafion
Perfluorosulfonate Membranes’, The 13th Annual Meeting of the North American
Membrane Society (NAMS), Long Beach, California, 11-15 May, 2002.
Swette L L, Kackley N D and LaConti A B, 1992, ‘Regenerative Fuel Cells’, Proceedings
of the 27th Intersociety Energy Conversion Engineering Conference, Warrendale,
Pennsylvania, USA.
Swette L L, Laconti A B and McCatty S A, 1994, ‘Proton-exchange membrane
regenerative fuel cells’ Journal of Power Sources, 47, 343-351.
Doctor of Philosophy REFERENCES
214
Swinburne University of Technology, 2007, ‘Green Energy Solutions’,
http://www.swin.edu.au/iris/pdf/profiles/green.pdf viewed 10 May 2008.
Tang H, Peikang S, Jiang S P, Wang F and Pana M, 2007, ‘A degradation study of Nafion
proton exchange membrane of PEM fuel cells’, Journal of Power Sources, 170, 85–92.
The Oil drum, 2008, http://www.theoildrum.com/node/3226, viewed 25 June 2008
Tilak B V, Lu P W T, Colman J E and Srinivasan S , 1981, ‘Electrolytic Production of
Hydrogen’, in Comprehensive Treatise of Electrochemistry, Vol. 2, Electrochemical
Processing, J. Bockris, B. E. Conway, E. Yeager and R. E. White eds. Plenum Press, New
York, 1981.
Tunold R, Marshall A, Tsypkin, Borresen B, Rasten E and Hagen G, 2006,
‘Electrocatalysts for water electrolysis using Polymer electrolyte membranes’, Lecture at
FUNMAT – meeting, 5-6 January 2006, Trondheim, Norway.
Tsypkin M A, Lyutikova E K, Fateev, V N and Rusanov, 2000, ‘Catalytic Layers in a
Reversible System Comprising an Electrolyzing Cell and a Fuel Cell Based on Solid
Polymer Electrolyte’, Russian Journal of Electrochemistry, 36(5), 545-549
Ulleberg O and Morner S O, 1997, ‘TRNSYS Simulation Models for Solar-hydrogen
System’, Journal of Solar Energy, 59 (4-6), 271-279.
Ulleberg O, 1998, ‘Stand Alone power systems for the future - Optimal design, Operation
and Control of solar energy Hydrogen systems’, Doctor of Philosophy thesis, Norwegian
Institute of Science and Technology.
United Nations, 2003, http://www.un.org/ visited 20 June 2008.
University of Connecticut, 2005, viewed on 9 October 2007,
http://www.engr.uconn.edu/me/pdf/Brochure05.pdf
Doctor of Philosophy REFERENCES
215
U S Department of Energy, 1999, ‘Report to Congress on the Status and Progress of the
DOE Hydrogen Program’, www.hydrogen.energy.gov/pdfs/bk28423.pdf.
Watkins D S, Dircks K W and Epp D G, 1991, Novel fuel cell fluid flow field plate, United
States Patent 4,988,583, 29 January 1991.
Wittstadt U, Wagner E and Jungmann T, 2005, ‘Membrane electrode assemblies for
unitised regenerative polymer electrolyte fuel cells’, Journal of Power Sources, 145, 555–
562.
Yao W, Yang J, Wang J and Nuli Y, 2007, ‘Chemical deposition of Platinum nanoparticles
on Iridium oxide for Oxygen Electrode of Unitized Regenerative Fuel Cell’,
Electrochemistry Communications, 9, 1029–1034.
Yim S D, Park Lee W Y, Yoon Y G, Sohn Y J, Park G G, Yang T H, and Kim C S, 2004,
‘Optimization of Bifunctional Electrocatalyst for PEM Unitized Regenerative Fuel Cell’,
Electrochimica Acta, 50, 713–718.
Yim S D, G G, Sohn Y J, Lee W Y, Yoon Y G,Yang T H, Um S, Yu S P and Kim C S,
2005, ‘Optimization of PtIr electrocatalyst for PEM URFC’, International Journal of
Hydrogen Energy, 30, 1345 – 1350.
Zaidi S M J, Rahmana S U and Zaidia H H, 2007, 'R&D activities of fuel cell Research at
KFUPM, Desalination, 209, 1 (3), 319-327.
Zawodzinski Jr T A, Springer T E, Uribe, F, Gottesfeld S, 1993, ‘Characterization of
polymer electrolytes for fuel cell applications’, Solid state Ionics, 60 (1-3), 199 – 211.
Zhang Y, Wang C, Wan N, Mao Z, 2007, ‘Deposited RuO2–IrO2/Pt electrocatalyst for the
Regenerative Fuel Cell’, International Journal of Hydrogen Energy, 32, 400 – 404.
Zhigang S, Baolian Y and Ming H, 1999, 'Bifunctional electrodes with a thin catalyst layer
for ‘unitized’ proton exchange membrane regenerative fuel cell', Journal of Power
Sources, 79, 82–85.
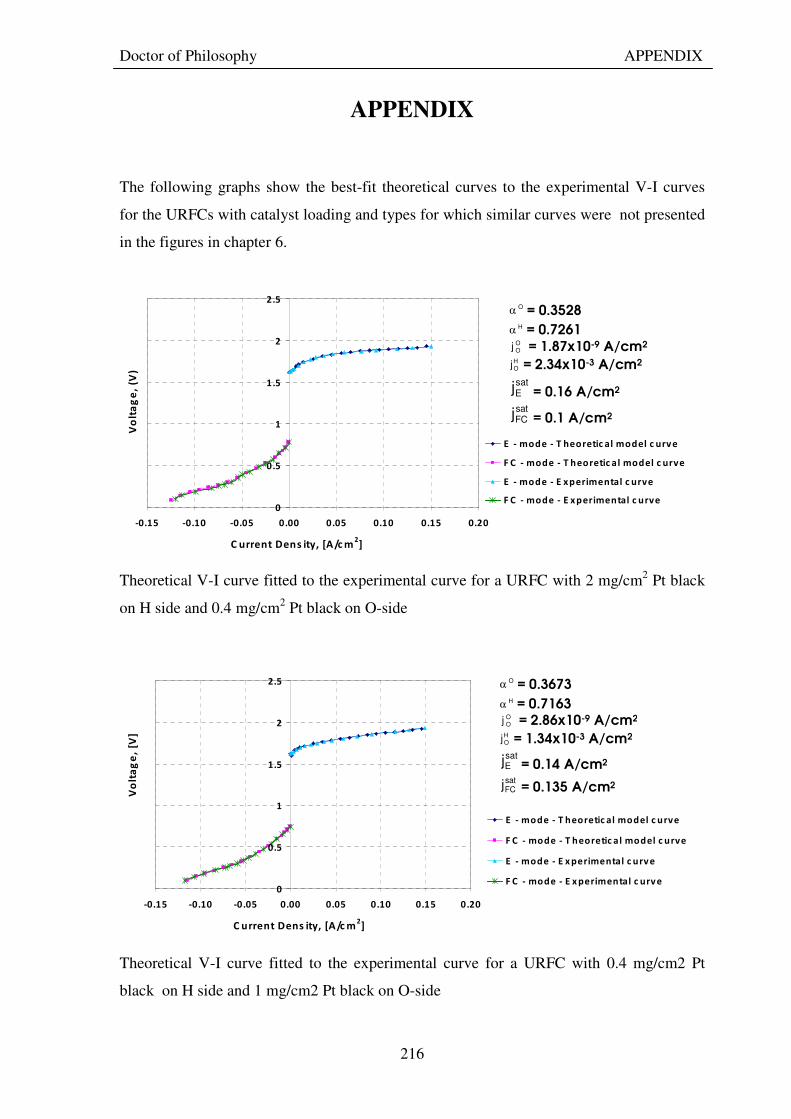
Doctor of Philosophy APPENDIX
216
APPENDIX
The following graphs show the best-fit theoretical curves to the experimental V-I curves
for the URFCs with catalyst loading and types for which similar curves were not presented
in the figures in chapter 6.
Theoretical V-I curve fitted to the experimental curve for a URFC with 2 mg/cm2 Pt black
on H side and 0.4 mg/cm2 Pt black on O-side
Theoretical V-I curve fitted to the experimental curve for a URFC with 0.4 mg/cm2 Pt
black on H side and 1 mg/cm2 Pt black on O-side
0
0.5
1
1.5
2
2.5
-0.15 -0.10 -0.05 0.00 0.05 0.10 0.15 0.20
C urrent Dens ity, [A/c m2]
Vo
lta
ge
, [V
]
E - mode - T heoretic al model c urve
F C - mode - T heoretic al model c urve
E - mode - E x perimental c urv e
F C - mode - E x perimental c urv e
Oα = 0.3673
Hα = 0.7163 OOj = 2.86x10⁻⁹ A/cm2
HOj = 1.34x10⁻³ A/cm2
satEj = 0.14 A/cm2 satFCj = 0.135 A/cm2
0
0.5
1
1.5
2
2.5
-0.15 -0.10 -0.05 0.00 0.05 0.10 0.15 0.20
C urrent Dens ity, [A/c m2]
Vo
lta
ge
, (V
)
E - mode - T heoretic al model c urv e
F C - mode - T heoretic al model c urve
E - mode - E x perimental c urve
F C - mode - E x perimental c urve
Oα = 0.3528
Hα = 0.7261 OOj = 1.87x10⁻⁹ A/cm2
HOj = 2.34x10⁻³ A/cm2
satEj = 0.16 A/cm2
satFCj = 0.1 A/cm2

Doctor of Philosophy APPENDIX
217
0
0.5
1
1.5
2
2.5
-0.15 -0.10 -0.05 0.00 0.05 0.10 0.15 0.20
C urrent Dens ity, [A/c m2]
Vo
lta
ge
, [V
]
E - mode - T heoretic al model c urve
F C - mode - T heoretic al model c urve
E - mode - E x perimental c urve
F C - mode - E x perimental c urve
Oα = 0.3691
Hα = 0.7267 OOj = 2.81x10⁻⁹ A/cm2
HOj = 2.38x10⁻³ A/cm2
satEj = 0.165 A/cm2 satFCj = 0.13 A/cm2
Theoretical V-I curve fitted to the experimental curve for a URFC with 2 mg/cm2 Pt black
on H side and 1 mg/cm2 Pt black on O-side
Theoretical V-I curve fitted to the experimental curve for a URFC with 4 mg/cm2 Pt black
on H side and 1 mg/cm2 Pt black on O-side
0
0.5
1
1.5
2
2.5
-0.15 -0.10 -0.05 0.00 0.05 0.10 0.15 0.20
C urrent Dens ity, [A/c m2]
Vo
lta
ge
, [V
]
E - mode - T heoretic al model c urve
F C - mode - T heoretic al model c urve
E - mode - E x perimental c urve
F C - mode - E x perimental c urve
Oα = 0.3654 Hα = 0.8069
OOj = 2.96x10⁻⁹ A/cm2
HOj = 7.15x10⁻⁴ A/cm2
satEj = 0.19 A/cm2
satFCj = 0.135 A/cm2
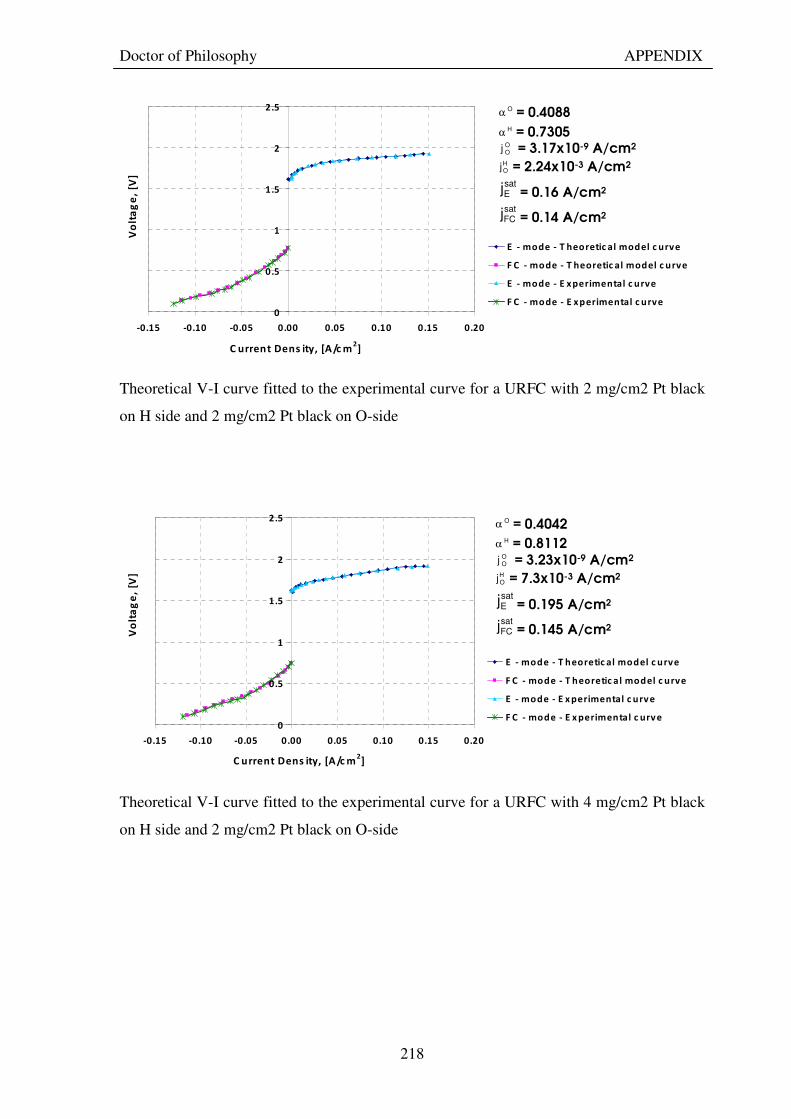
Doctor of Philosophy APPENDIX
218
Theoretical V-I curve fitted to the experimental curve for a URFC with 2 mg/cm2 Pt black
on H side and 2 mg/cm2 Pt black on O-side
Theoretical V-I curve fitted to the experimental curve for a URFC with 4 mg/cm2 Pt black
on H side and 2 mg/cm2 Pt black on O-side
0
0.5
1
1.5
2
2.5
-0.15 -0.10 -0.05 0.00 0.05 0.10 0.15 0.20
C urrent Dens ity, [A/c m2]
Vo
lta
ge
, [V
]
E - mode - T heoretic al model c urve
F C - mode - T heoretic al model c urve
E - mode - E x perimental c urve
F C - mode - E x perimental c urve
Oα = 0.4088
Hα = 0.7305 OOj = 3.17x10⁻⁹ A/cm2
HOj = 2.24x10⁻³ A/cm2
satEj = 0.16 A/cm2 satFCj = 0.14 A/cm2
0
0.5
1
1.5
2
2.5
-0.15 -0.10 -0.05 0.00 0.05 0.10 0.15 0.20
C urrent Dens ity, [A/c m2]
Vo
lta
ge
, [V
]
E - mode - T heoretic al model c urve
F C - mode - T heoretic al model c urve
E - mode - E x perimental c urv e
F C - mode - E x perimental c urv e
Oα = 0.4042 Hα = 0.8112
OOj = 3.23x10⁻⁹ A/cm2
HOj = 7.3x10⁻³ A/cm2
satEj = 0.195 A/cm2 satFCj = 0.145 A/cm2


![REGENERATIVE BRAKING SYSTEM IN ELECTRIC VEHICLES · REGENERATIVE BRAKING SYSTEM IN ELECTRIC VEHICLES ... REGENERATIVE BRAKING SYSTEM ... Regenerative action during braking[9]](https://img.pdfslide.net/doc/110x75/5adccef67f8b9a1a088c7cf0/regenerative-braking-system-in-electric-vehicles-braking-system-in-electric-vehicles.jpg)


![Solar Regenerative Hydrogen Fuel Cell Charging Systemwind to split water into hydrogen and oxygen via an electrolyzer.[5] The produced hydrogen is then stored to be used at a later](https://img.pdfslide.net/doc/110x75/60a027a7dca97a27c9217e08/solar-regenerative-hydrogen-fuel-cell-charging-system-wind-to-split-water-into-hydrogen.jpg)