Embed Size (px)
Citation preview
RESEARCH ARTICLE
Universal numerical calculation method for the Berrycurvature and Chern numbers of typical
topological photonic crystals
Chenyang WANG, Hongyu ZHANG, Hongyi YUAN, Jinrui ZHONG, Cuicui LU (✉)
Beijing Key Laboratory of Nanophotonics and Ultrafine Optoelectronic Systems, School of Physics,Beijing Institute of Technology, Beijing 100081, China
© Higher Education Press and Springer-Verlag GmbH Germany, part of Springer Nature 2019
Abstract Chern number is one of the most importantcriteria by which the existence of a topological photonicstate among various photonic crystals can be judged;however, few reports have presented a universal numericalcalculation method to directly calculate the Chern numbersof different topological photonic crystals and have denotedthe influence of different structural parameters. Herein, wedemonstrate a direct and universal method based on thefinite element method to calculate the Chern number of thetypical topological photonic crystals by dividing theBrillouin zone into small zones, establishing new proper-ties to obtain the discrete Chern number, and simulta-neously drawing the Berry curvature of the first Brillouinzone. We also explore the manner in which the topologicalproperties are influenced by the different structure types,air duty ratios, and rotating operations of the unit cells;meanwhile, we obtain large Chern numbers from – 2 to 4.Furthermore, we can tune the topological phase change viadifferent rotation operations of triangular dielectric pillars.This study provides a highly efficient and simple methodfor calculating the Chern numbers and plays a major role inthe prediction of novel topological photonic states.
Keywords Chern number, topological photonic crystal,finite element method, symmetry
1 Introduction
In the previous decade, topological photonics has becomea rapidly emerging research field in which geometrical andtopological concepts are utilized to design and control the
behavior of light. Topology was once a geometricalconcept; however, it is currently being used in periodicreciprocal space [1]. Currently, the topological photonicstates are generally applied in case of photonic crystalsbecause they have robust features and facilitate theunidirectional transmission of the light waves. Thetopological photonic states can exist at the interface oftwo crystals having different topological invariants,allowing the photons of the bandgap to be conductedwith negligible dissipation. The topological photonic statescan be applied in various photonic device applicationsowing to their unique properties, including the unidir-ectionally propagating edge states and robustness againstimpurities or defects without backscattering [2].As a topological invariant of the two-dimensional (2D)
dispersion band of the photonic crystal, the Chern numberis defined based on the Berry curvature within the firstBrillouin zone. It is one of the most important criteria usedto judge the existence of a topological photonic state. In anelectronic system, Thouless et al. showed that the Hallconductance of the 2D systems is proportional to the Chernnumber, which expresses an integer quantum Hall state onthe edge of a topological nontrivial crystal cell, causingwave propagation along the edge [3]. However, until now,few reports have presented a direct method for calculatingthe Chern number. In majority of the cases, researchersseem to have avoided the calculation of Chern numbersbecause of their complexity; however, they have oftenidentified the phase transition boundaries of the system viathe topological phase diagram to identify the nonzeroChern numbers for evaluating the topological properties[4]. At times, the Chern numbers are directly given,including those for some particular topological photoniccrystals, such as valley photonic crystals, whose Chernnumber is 0.5 of half the Brillouin zone for a special band[5–7]. The lack of a direct numerical calculation method
Received September 11, 2019; accepted December 10, 2019
E-mail: [email protected]
Front. Optoelectron. 2020, 13(1): 73–88https://doi.org/10.1007/s12200-019-0963-9

for the Chern number restricts the development oftopological photonics and hampers the prediction ofnovel topological photonic structures.Herein, we propose a direct and universal numerical
method for calculating the Chern number of typicalphotonic crystals based on the finite element method(FEM). Several difficulties that are associated with thenumerical calculation process, including gauge fixing,rhombus Brillouin zone deformation, and discretization,are overcome. Furthermore, the influences on topologicalproperties are studied with respect to different structuretypes, air duty ratios, and rotating operations of unit cells.Simultaneously, an effective methodology for tuning thetopological phase change is developed by constructingdifferent hetero-topological photonic crystals via rotationoperations on dielectric triangular columns. This study notonly provides a highly efficient and universal method forcalculating the Chern number, but also exhibits potentialapplications in novel topological nanophotonic structuresand the design of topological nanophotonic devices.
2 Calculation
2.1 Introduction to basic physical concepts
The topological invariants are defined to exhibit similarintrinsic properties between two isomorphic topologicalspaces. According to the Gauss-Bonnet theorem [4], theintegral of the Gaussian curvature K over the wholemanifold is a topological invariant, which can be defined inEq. (1).
1
2π!
surfaceKdA ¼ 2 1 – gð Þ: (1)
The genus g is a typical topological invariant anddenotes the number of holes on the surface. For example,coffee cups can become donuts by continuous deformationusing the same genus g. They remain identical untilcontinuous transformation occurs. The topology of aphotonic system is defined on the dispersion band in thereciprocal (wave vector) space. The topological invariantof a 2D dispersion band is the Chern number, whichcharacterizes the topological properties of the photonicbands [4]. Due to the periodicity, a torus is formed by thecurling along the edge of a 2D lattice surface. Analogous tothe Gaussian curvature, Berry curvature is defined [8], andthe integral of the Berry curvature over the entire latticesurface is a constant called the Chern number, which isdefined in Eq. (2).
cn ¼1
2πi!
T2d2kF12ðkÞ, (2)
where F12ðkÞ is the Berry curvature defined in Eq. (3).
F12ðkÞ ¼ ∂1A2ðkÞ – ∂2A1ðkÞ: (3)
A�ðkÞ is the Berry connection [8,9] and is defined inEq. (4).
A�ðkÞ ¼ hnðkÞj∂�jnðkÞi, (4)
where jnðkÞi denotes the nth normalized eigenstate of thephotonic crystal using the Bloch wave vector k. Forelectromagnetic systems, the eigenstates are expressedusing the six-component vector field uðrÞ, which is definedin Eq. (5).
uðrÞ ¼�ExðrÞ,EyðrÞ,EzðrÞ,HxðrÞ,HyðrÞ,HzðrÞ
�T, (5)
where Ex,Ey,Ez,Hx,Hy,Hz represent the components of theelectromagnetic eigenmode normalized by their norms,which are defined by the inner product in Eq. (6) [1].
huðrÞ,vðrÞi � ∬unit cell
dr2uyðrÞ⋅MðrÞ⋅vðrÞ, (6)
where MðrÞ ¼εrðrÞ i�ðrÞ– i�ðrÞ �rðrÞ
" #is the 6� 6 electro-
magnetic susceptibility tensor. Here, εrðrÞ denotes thepermittivity, �rðrÞ denotes the permeability, �ðrÞ describesthe electromagnetic coupling [10], and uyðrÞ denotes theHermitian conjugate of uðrÞ. In case of the all-dielectricstructure where � ¼ 0, the formulas can be simplified.From Eqs. (4) and (6), Berry connection can be expressedas Eq. (7) when � ¼ 0.
A�ðkÞ ¼
∬dr2EyðrÞ⋅εrðrÞ⋅∂�ðrÞEðrÞþ∬dr2H yðrÞ⋅�rðrÞ⋅∂�HðrÞ∬dr2EyðrÞ⋅εrðrÞ⋅EðrÞþ∬dr2H yðrÞ⋅�rðrÞ⋅HðrÞ :
(7)
Furthermore, when � ¼ 0, the electric and magneticparts of the Berry connection exhibit the relation presentedin Eq. (8) [10].
∬dr2EyðrÞ⋅εrðrÞ⋅∂�EðrÞ∬dr2EyðrÞ⋅εrðrÞ⋅EðrÞ
¼ ∬dr2HyðrÞ⋅�rðrÞ⋅∂�HðrÞ∬dr2H yðrÞ⋅�rðrÞ⋅HðrÞ : (8)
Therefore, the Berry curvature can be calculated usingits magnetic part or its electric part (Eq. (9)).
A�ðkÞ ¼∬dr2EyðrÞ⋅εrðrÞ⋅∂�EðrÞ∬dr2EyðrÞ⋅εrðrÞ⋅EðrÞ
¼ ∬dr2H yðrÞ⋅�rðrÞ⋅∂�HðrÞ∬dr2H yðrÞ⋅�rðrÞ⋅HðrÞ : (9)
The topological properties of the photonic bandgap can
74 Front. Optoelectron. 2020, 13(1): 73–88

be indicated using the gap Chern number Cg, which can bedefined as the sum of the Chern numbers of all the bandsbelow the bandgap. The gap Chern numbers are useful topredict the existence of robust unidirectional edge states. Inelectronic systems, according to the bulk-edge correspon-dence [11], the number of unidirectional edge states thatemerge at the interface is equal to the difference betweenthe gap Chern numbers of two photonic crystals when twoelectronic systems that have overlapped bandgaps withdifferent gap Chern numbers interface with each other. Insome photonic systems, such as the magneto–opticalsystems, the bulk-edge correspondence theory is applic-able [12–15].
2.2 Calculations for the Chern number
In practical calculation, the electromagnetic field distribu-tion in periodic structures can be conveniently obtainedthrough FEM, where we used the COMSOL Multiphysicssoftware. However, some questions have to be inevitablyanswered before calculating the Chern number. First, theChern number expression contains an integral process. Thedata during the calculation were discrete, which is inconflict with the calculation of the Chern number. Thegeneral method is to use summation for replacing theintegral. To obtain highly precise results, dense pointsshould be selected even though it will result in a hugecomputational consumption. Second, the phase of thewave function was uncertain and denoted an arbitraryvalue after the Maxwell equations were solved using theCOMSOL Multiphysics software. Therefore, a methodwas required to eliminate the effect of phase uncertainty.Third, for the partial derivative of a wave function in theChern number expression, a function should be con-structed to connect the wave function n and thecorresponding wave vector k because they were discreteand independent computer data.Here, we developed a direct and universal numerical
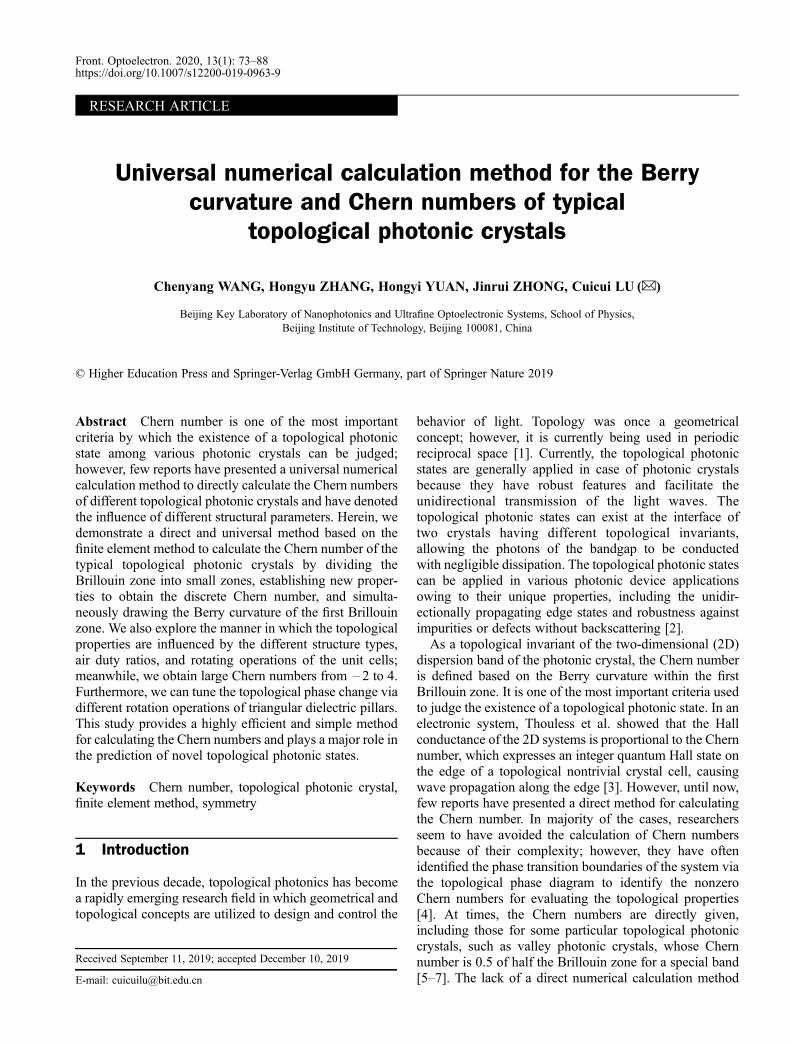
method for calculating the discretized Chern number usingCOMSOL Multiphysics software, which is a commercialFEM software. FEM exhibits a high level of flexibility andreliable error control, enabling numerical calculations forconsiderably complex structures. The eigenstates werecalculated in a discretized Brillouin zone using thenumerical method. We discretized the Brillouin zoneusing straight lines parallel to the reciprocal lattice vectors(Fig. 1). When the Brillouin zone was discretized, theintegrals and derivatives could be replaced by finite sumsand differences for as long as the mesh of the discretizedBrillouin zone was sufficiently fine. Therefore, the latticeBerry curvature could be calculated using Eq. (10).
F12ðklÞδk1δk2 ¼�∂1A2ðklÞ – ∂2A1ðklÞ
�δk1δk2
� ðΔ1A2Þδk2 – ðΔ2A1Þδk1: (10)
where δklðl ¼ 1,2Þ denotes the length of the smalldisplacement in the k space, δk1δk2 denotes the area ofthe parallelogram formed by the vectors δk1 and δk2, andðΔ�AlÞδkl is defined in Eq. (11).
ðΔ�AlÞδkl ¼ Alðkl þ δk�Þδkl –AlðklÞδkl,
ðl,� ¼ 1,2Þ, (11)
which is the finite difference of Al that can be representedby the finite difference of the eigenstate jnðkÞi, which isdefined in Eq. (12).
AlðklÞδkl � hnðklÞjnðkl þ δklÞ – nðklÞi¼ hnðklÞjnðkl þ δklÞi – 1: (12)
Because the Berry curvature is defined in a discretizedBrillouin zone, the Chern number can be calculated usingEq. (13).
cn ¼1
2πi
XF12ðklÞδk1δk2: (13)
Subsequently, we present the difficulties and challengesassociated with the calculations as well as the solutions toovercome these problems. First, there was a problem calledthe U(1) gauge ambiguity of the Berry connection. Here,the problem lies in the fact that if the eigenstates aremultiplied by a phase factor eiχðkÞ (U(1) gauge transforma-tion), they will remain physically similar; however, theBerry connection A will transform into Aþ irχðkÞ.Therefore, for a similar physics scenario, there is morethan one Berry connection distribution. This problem isreferred to as the U(1) gauge ambiguity [1]. As for theBerry curvature F12ðkÞ, it remains unchanged under theU(1) gauge transformation. However, it will also beinfluenced by multiple values of the eigenstates. In thedefinition of Berry curvature, the partial derivatives of theBloch vector k require the eigenstates to be smoothfunctions of the Bloch vector k, but a global smoothfunction jnðkÞi of k may not exist. To solve this problem,we obtained a locally smooth patch for each point in theBrillouin zone and calculated the Berry curvature on eachof them, making a gauge transformation between twopatches at their intersection [16].In numerical calculations, we cannot ensure that the
eigenstate calculated using the eigenvalue solver was asmooth function of the Bloch vector k. There are two waysto solve the problem. The first method is to fix a smoothbranch by assigning the phase factor eiχðkÞ to eacheigenstate. Using this method, we could ensure that acomponent of the eigen electromagnetic field at a point inreal space (similar to the x component of the eigen electricfield at the origin Exð0,0Þ) has a fixed phase angle (forexample, to make them positive real numbers) for theentire Bloch vector k in an open set of momentum space
Chenyang WANG et al. Universal numerical calculation method for Chern numbers 75
[5]. If this process cannot continue, for example, Exð0,0Þ =0 for some Bloch wave vector k, then another point in realspace should be selected along with a new open set in themomentum space until the Brillouin zone is covered by allthe open sets. The second method is to avoid the gaugevariants [16]. In Ref. [12], the Berry curvature of eachlattice was calculated using the “U(1) link variable” U�kl,which is expressed as Eq. (14).
F12ðklÞδk1δk2 ¼ lnU 1ðklÞU 2ðkl þ δk1ÞU 1ðkl þ δk2ÞU 2ðklÞ
� �, (14)
where U�ðklÞ is the U(1) link variable, which is defined inEq. (15).
U�ðklÞ �hnðklÞjnðkl þ δk�ÞjijhnðklÞjnðkl þ δk�Þij
: (15)
Further, from Eq. (16), we can observe that U�ðklÞ is thenormalization of the exponential of A�ðklÞδk� when δk� issufficiently small.
eA�ðklÞδkμ ¼ ehnðklÞjnðklþδklÞi – 1
� 1þ hnðklÞjnðkl þ δklÞi – 1¼ hnðklÞjnðkl þ δklÞi: (16)
Thus, Eq. (14) is equivalent to Eq. (10).The second problem is associated with the traversal of
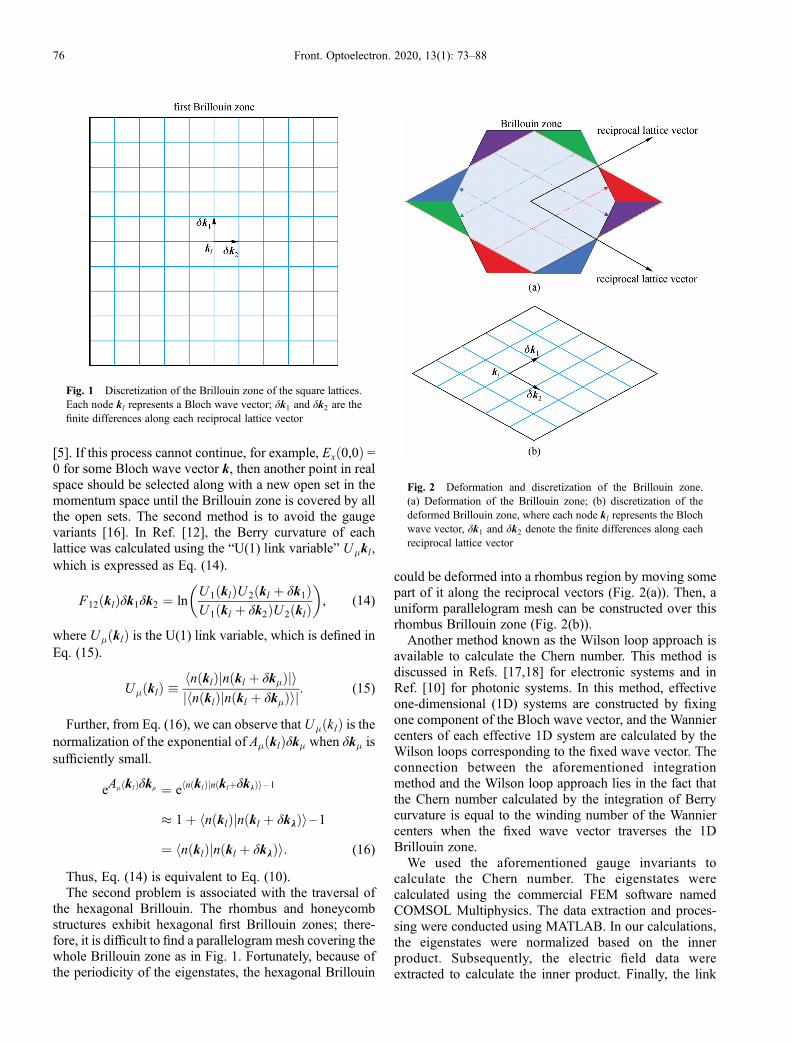
the hexagonal Brillouin. The rhombus and honeycombstructures exhibit hexagonal first Brillouin zones; there-fore, it is difficult to find a parallelogram mesh covering thewhole Brillouin zone as in Fig. 1. Fortunately, because ofthe periodicity of the eigenstates, the hexagonal Brillouin
could be deformed into a rhombus region by moving somepart of it along the reciprocal vectors (Fig. 2(a)). Then, auniform parallelogram mesh can be constructed over thisrhombus Brillouin zone (Fig. 2(b)).Another method known as the Wilson loop approach is
available to calculate the Chern number. This method isdiscussed in Refs. [17,18] for electronic systems and inRef. [10] for photonic systems. In this method, effectiveone-dimensional (1D) systems are constructed by fixingone component of the Bloch wave vector, and the Wanniercenters of each effective 1D system are calculated by theWilson loops corresponding to the fixed wave vector. Theconnection between the aforementioned integrationmethod and the Wilson loop approach lies in the fact thatthe Chern number calculated by the integration of Berrycurvature is equal to the winding number of the Wanniercenters when the fixed wave vector traverses the 1DBrillouin zone.We used the aforementioned gauge invariants to
calculate the Chern number. The eigenstates werecalculated using the commercial FEM software namedCOMSOL Multiphysics. The data extraction and proces-sing were conducted using MATLAB. In our calculations,the eigenstates were normalized based on the innerproduct. Subsequently, the electric field data wereextracted to calculate the inner product. Finally, the link
Fig. 1 Discretization of the Brillouin zone of the square lattices.Each node kl represents a Bloch wave vector; δk1 and δk2 are thefinite differences along each reciprocal lattice vector
Fig. 2 Deformation and discretization of the Brillouin zone.(a) Deformation of the Brillouin zone; (b) discretization of thedeformed Brillouin zone, where each node kl represents the Blochwave vector, δk1 and δk2 denote the finite differences along eachreciprocal lattice vector
76 Front. Optoelectron. 2020, 13(1): 73–88

variables and lattice Berry curvature were calculated usingMATLAB. In Section 2.3, we show the numerical resultsof some typical topological photonic crystals.
2.3 Calculation results for the typical topological photoniccrystals
The nontrivial topological states are always attributed tobroken symmetries. Two main types of symmetries, i.e.,space inversion and time-reversal symmetries, are asso-ciated with the Berry curvature distribution. Time-reversalsymmetries will lead to the relation F12ð – kÞ ¼ –F12ðkÞ,whereas inversion symmetries will lead to the relationF12ð – kÞ ¼ F12ðkÞ [1]. A corollary of these relations isthat the Chern number is zero when the time-reversalsymmetries are preserved.Therefore, there are two main methods to develop
nontrivial topological structures. One is to break the time-reversal symmetries to obtain nonzero Chern numbers,similar to that observed in the Chern insulators inelectronic systems. These structures can be fabricatedusing special materials such as the gyromagnetic materials[12]. The second method is to break the inversionsymmetries by changing the shape or the dielectricconstant. An important nontrivial topological structure isthe valley topological structure, which has a Chern numberof zero but nontrivial topological properties of differentpseudospin modes. The commonly observed valleytopological structures are honeycombs [19–23] or rhombuslattices [16,24,25]. In this section, we will present somenumerical results for the broken and preserved time-reversal symmetry structures. In our calculations, 32� 32Bloch wave vectors are evenly distributed across theBrillouin zone. The relative tolerance of the eigenstatesolver is 10 – 6.As for the structures with broken time-reversal symme-
tries, we used common gyromagnetic materials that havean anisotropic permeability
μ ¼1 iκ 0
– iκ 1 0
0 0 1
264
375,
where κ describes the gyromagnetic properties of thematerial. Large κ indicates a strong gyromagnetic effect inthe material. First, we presented a structure of gyromag-netic cylinders in a square lattice (Fig. 3(a)). The radius ofthe cylinder was 0.13a0, where a0 is the lattice constant.The relative permittivity of the gyromagnetic cylinders isε ¼ 13, the diagonal elements of permeability are 1, andthe off-diagonal element is iκ ¼ 0:4i. The ambient mediumwas air, whose permittivity is 1. Figure 3(b) shows thedispersion band of the TM modes of the structure and theChern number of each band. Figures 3(c)–3(f) show theBerry curvature distributions in the first Brillouin zone of
the first four bands of the TM modes. The colormapdenotes the value of the Berry curvature with the unita0
2=4π2. Here, a0 is the lattice constant. The red dashedline around the square marks the first Brillouin zone andthe irreducible Brillouin zone. This photonic structure hasa trivial bandgap between bands 1 and 2 (Cg ¼ 0), anontrivial topological bandgap between bands 2 and 3(Cg ¼ – 1), and a degenerate point between bands 3 and 4at the X point. Because the structure preserves inversionsymmetry and C4v symmetry, the Berry curvature distribu-tions of the photonic bands show both inversion and C4vsymmetries. Apart from symmetries, the Berry curvaturedenotes other details. For band 1 (Fig. 3(c)), the peaks canbe observed at the X points. However, due to the negativevalue at the G and M points, the Chern number of band 1 iszero. For band 2 (Fig. 3(d)), negative valleys emerge at theM points, corresponding to the peak of the dispersion bandat the M point in Fig. 3(b). For bands 3 and 4 (Figs. 3(e)and 3(f)), sharp peaks and valleys emerge at the X points.This is because bands 3 and 4 degenerate with each other atthe X points and result in singular points at the X points inthe Berry curvature distributions [1]. It is interesting thatalthough band 4 has four sharp negative valleys at the Xpoints, it still has a positive Chern number becausemajority of the Brillouin zone is positive and theintegration over the positive part exceeds the impactcaused by the four valleys.Subsequently, we changed the gyromagnetic cylinders
from circular columns to square columns using the samematerial (Fig. 4(a)). The side length of the square is l =0.26a0. The TM modes were investigated. Figure 4(b)shows the dispersion relation, Chern numbers, and gapChern numbers of the first four TM bands, and the Berrycurvature distributions are shown in Figs. 4(c)–4(f). FromFig. 4(b), we can see that the Chern number of each bandremains unchanged when compared with that of thestructure in Fig. 3 but that the degeneracy at the X pointbetween bands 3 and 4 is lifted.Therefore, in the Berry curvature distributions, the
singular points at the X points of bands 3 and 4 become thebroadened Berry curvature extrema. The singular points ofband 3 become peaks that are not considerably sharp, andthe peaks at the M points become more evident because theBerry curvature at the X points drastically decreases. Thesingular points of band 4 become negative valleyssurrounded by two positive peaks, corresponding to thefrequency extrema of the dispersion band (Fig. 4(b),orange dotted line). However, the Berry curvaturedistributions of bands 1 and 2 are less influenced by thestructural change. As for symmetries, the Berry curvaturedistributions show identical symmetries because thestructure does not break either the inversion symmetry orthe C4v symmetry.Next, we changed the square lattice into a honeycomb
lattice with the same material (Fig. 5). The structure
Chenyang WANG et al. Universal numerical calculation method for Chern numbers 77

comprised gyromagnetic cylinders with k = 0.4, ε = 13, andradius r = 0.13a0, where a0 is the lattice constant of thehoneycomb lattice, i.e.,
ffiffiffi3
ptimes the side length of the
hexagonal unit cell. The dispersion relations, Chernnumbers, gap Chern numbers (Fig. 5(b)), and Berrycurvature distributions of the first four bands of the TMmodes (Figs. 5(c)–5(f)) are shown in the figures. The firstBrillouin zones were plotted using the red dashed lines toclearly illustrate the special points (G,M, K) in the k space.From Fig. 5(b), we can observe that this structure has atrivial bandgap between bands 1 and 2, a Cg ¼ – 1bandgap between bands 2 and 3, and a Cg ¼ 1 bandgapbetween bands 3 and 4. From the Berry curvaturedistribution of band 1 (Fig. 5(c)), positive peaks andnegative valleys can be observed at the M and K points,respectively, causing the Chern number to become zero.From the Berry curvature distribution of band 2 (Fig. 5(d)),six significant valleys emerge at the K points, correspond-ing to the frequency extremum of its dispersion band(Fig. 5(b), red dash–dot line). From the Berry curvature ofband 3 (Fig. 5(e)), the Berry curvature distribution shows
positive peaks at the M and K points, corresponding to theextrema of the dispersion band (Fig. 5(b), orange dottedline). Figure 5(f) illustrates the Berry curvature of band 4,which shows gentle positive peaks at the K points andrelatively sharp negative valleys at the M points. Althoughthe positive peaks are not as evident as the negative peaks,the Chern number of band 4 is still positive.As for symmetries, this structure preserves both
inversion symmetry and C6v symmetry. The Berrycurvature distributions preserve these symmetries as well.As shown above, the structures with broken time-
reversal symmetries always have nonzero chern numbers.however, this does not indicate that the berry curvature ismeaningless for the all-dielectric structures that preservethe time-reversal symmetries. an important type of all-dielectric photonic structure is the valley photonicstructure, which has a pair of frequency extrema for thedispersion bands at the high-symmetry points (K/K′) andexhibits opposite berry curvatures at the K and K′ points[5]. The valley photonic crystals support the robust edgestates but the direction of each edge state relies on the
Fig. 3 A gyromagnetic cylinder model denoting the dispersion relation of the TM mode, band Chern numbers, and Berry curvature.(a) Geometry of a unit cell. The blue part represents the gyromagnetic cylinder with r = 0.13a0, ε = 13, and k = 0.4. The gray partsymbolizes pure air; (b) first four bands of the TM modes. The Chern numbers are shown at the bottom, whereas the gap Chern numbersare marked at the bandgaps; (c)–(f) Calculated Berry curvature within the first Brillouin zone of the first four bands of the TM modes:(c) for band 1; (d) for band 2; (e) for band 3; and (f) for band 4. The square red dashed line represents the first Brillouin zone, and thetriangular red dashed line represents the irreducible Brillouin zone
78 Front. Optoelectron. 2020, 13(1): 73–88

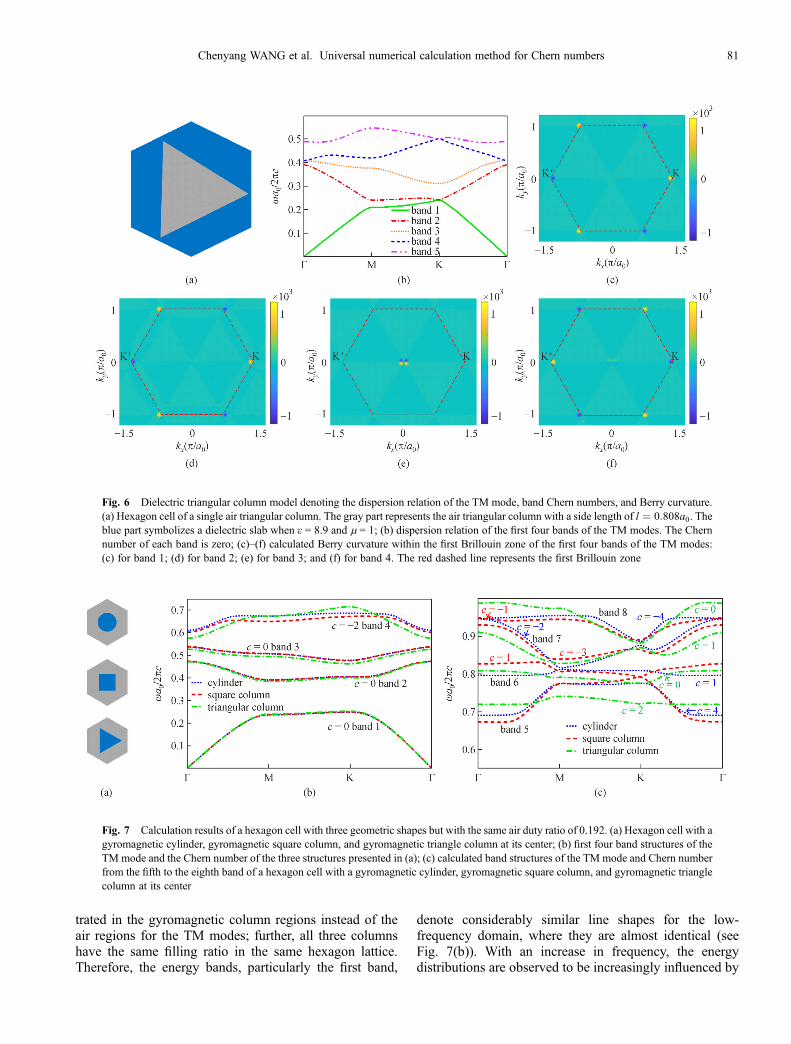
chiral mode of the source. we will present an all-dielectricmodel in this section with further discussion beingpresented in Section 3.3.The all-dielectric model comprises triangular holes in a
dielectric slab with a permittivity of ε = 8.9 and apermeability of m = 1 (Fig. 6(a)). The dielectric holes arealigned in a honeycomb lattice. The side length of thetriangle is l ¼ 0:808a0. The TM modes of this structurewere investigated. The dispersion relation is shown in Fig.6(b), and the Berry curvature distributions are shown inFigs. 6(c)–6(f). The Chern numbers of all the bands arezero. In this structure, inversion symmetry is no longerpreserved; therefore, the high-symmetry points K and K′are no longer equivalent, and the irreducible Brillouin zoneis no longer the one bounded by polyline G–M–K–G butthe one bounded by G–K–K'–G. However, as far as thedispersion relation is concerned, the K and K′ points showthe same eigenfrequencies. Therefore, in Fig. 6(b), wechoose the polyline G–M–K–G. From Fig. 6(b), we canobserve a degeneracy between bands 1 and 2 at the Kpoint, a degeneracy between bands 3 and 4 at the G point,
and a degeneracy between bands 4 and 5 at the K point.These degenerate points correlate with the singular pointsin the Berry curvature distributions.In Figs. 6(c) and 6(d), there are singular points at the K
and K′ points; for each pair of K and K′ points, the Berrycurvature has the opposite sign. Furthermore, the integra-tions of the Berry curvature for bands 1 or 2 over the twohalves of the Brillouin zone containing K and K′ are 0.5and – 0.5, respectively. In Fig. 6(e), there are singularpoints near the G point, corresponding to the degeneraciesat the G point in the dispersion band (Fig. 6(b)). In Fig. 6(f),the singular points emerge at the G and K/K′ points becausethe fourth band degenerates with the fifth band at the K/K′point and with the third band at the G point. As forsymmetries, because of the preservation of the time-reversal symmetry, the Berry curvature shows an antisym-metric distribution F12ð – kÞ ¼ –F12ðkÞ.Based on the aforementioned numerical results, we can
conclude that the symmetries of the structure and thedegeneracy of the bands affect the Berry curvaturedistributions. First, when the structures have some types
Fig. 4 A gyromagnetic square column model denoting the dispersion relation of the TM mode, band Chern numbers, and Berrycurvature. (a) Geometry of a unit cell. The blue part represents the gyromagnetic square column when l = 0.26a0, ε = 13, and k = 0.4. Thegray part symbolizes pure air; (b) first four bands of the TM modes. The Chern numbers are shown at the bottom, whereas the gap Chernnumbers are marked at the bandgaps; (c)–(f) Calculated Berry curvature within the first Brillouin zone of the first four bands of the TMmodes: (c) for band 1; (d) for band 2; (e) for band 3; and (f) for band 4. The red dashed line represents the first Brillouin zone, and thetriangular red dashed line represents the irreducible Brillouin zone
Chenyang WANG et al. Universal numerical calculation method for Chern numbers 79

of symmetries, their Berry curvature distributions willexhibit corresponding symmetries. The two most signifi-cant symmetries are the time-reversal symmetries andinversion symmetries, which will lead to antisymmetryF12ð – kÞ ¼ –F12ðkÞ and inversion symmetry F12ð – kÞ ¼F12ðkÞ in Berry curvature distributions, respectively, apartfrom some critical points. Second, we illustrate that thesingular points in the Berry curvature distributions arealways correlated with the degeneracies in the dispersionbands. When a small perturbation is added to the structureand the degeneracies are lifted, the singular points in theBerry curvature distributions will transform into less sharpBerry curvature extrema.
3 Discussion
3.1 Different structure types
In the previous section, we presented our calculationresults for the all-dielectric photonic crystals as well as thegyromagnetic photonic crystals and verified the validity ofour calculation method. Apart from these aforementionedstructures, our method is applicable to all types of photonic
crystals, including those with anisotropic permittivity andpermeability. It is also applicable to photonic crystals withdifferent lattices, including rhombus lattices. In thissection, we explore the manner in which the Berrycurvature is influenced by the changes in a photoniccrystal lattice.Thus, we transformed the gyromagnetic column in a
hexagon lattice to denote cylindrical, square, and triangularshapes, while ensuring an identical filling ratio to thedetails presented in the upper, middle, and lower parts ofFig. 7(a), respectively. The photonic energy bands of theTM mode for three types of photonic crystals are drawnalong with various lines in Figs. 7(b) and 7(c). Figure 7(b)shows the first four bands, whereas Fig. 7(c) shows bands5–8. This shows that the first three energy bands exhibitvery similar line shapes for three different structures andthat differences can be observed from the fourth band. Ifrotation causes the photonic system to become invariant,the rotated mode itself becomes an allowed mode with asimilar frequency. It is obvious that the columns in ahexagon lattice exhibiting cylinder, square, and triangleconfigurations exhibit different rotation symmetries; there-fore, their photonic energy bands will be different [26]. Inthe low-frequency domain, the energy is mainly concen-
Fig. 5 Gyromagnetic cylinder model denoting the dispersion relation of the TM mode, band Chern numbers, and Berry curvature.(a) Hexagon cell of a single gyromagnetic cylinder. The blue part represents the gyromagnetic cylinder when r = 0.13a0, ε = 13, and k =0.4. The gray part symbolizes pure air; (b) first four bands of the TMmodes. The Chern numbers are shown at the bottom, whereas the gapChern numbers are marked at the bandgaps; (c)–(f) calculated Berry curvature within the first Brillouin zone of the first four bands of theTM modes: (c) for band 1; (d) for band 2; (e) for band 3; and (f) for band 4. The red dashed line represents the first Brillouin zone, and thetriangular red dashed line represents the irreducible Brillouin zone
80 Front. Optoelectron. 2020, 13(1): 73–88
trated in the gyromagnetic column regions instead of theair regions for the TM modes; further, all three columnshave the same filling ratio in the same hexagon lattice.Therefore, the energy bands, particularly the first band,
denote considerably similar line shapes for the low-frequency domain, where they are almost identical (seeFig. 7(b)). With an increase in frequency, the energydistributions are observed to be increasingly influenced by
Fig. 6 Dielectric triangular column model denoting the dispersion relation of the TM mode, band Chern numbers, and Berry curvature.(a) Hexagon cell of a single air triangular column. The gray part represents the air triangular column with a side length of l ¼ 0:808a0. Theblue part symbolizes a dielectric slab when ε = 8.9 and m = 1; (b) dispersion relation of the first four bands of the TM modes. The Chernnumber of each band is zero; (c)–(f) calculated Berry curvature within the first Brillouin zone of the first four bands of the TM modes:(c) for band 1; (d) for band 2; (e) for band 3; and (f) for band 4. The red dashed line represents the first Brillouin zone
Fig. 7 Calculation results of a hexagon cell with three geometric shapes but with the same air duty ratio of 0.192. (a) Hexagon cell with agyromagnetic cylinder, gyromagnetic square column, and gyromagnetic triangle column at its center; (b) first four band structures of theTM mode and the Chern number of the three structures presented in (a); (c) calculated band structures of the TM mode and Chern numberfrom the fifth to the eighth band of a hexagon cell with a gyromagnetic cylinder, gyromagnetic square column, and gyromagnetic trianglecolumn at its center
Chenyang WANG et al. Universal numerical calculation method for Chern numbers 81

different structures and the energy bands exhibit increas-ingly different line shapes, especially from bands 4 to 8, ascan be observed from Figs. 7(b) and 7(c). The energybands are considerably different for different columnshapes from a normalized frequency from 0.57 in thefourth band, and the Chern numbers demonstrate largedifferences from the fifth band. In the high-frequencydomain (such as from bands 5 to 8), the interactions can beenhanced and more modes are involved owing to therelatively dense distributions of the energy bands; there-fore, different structures will generate different Chernnumbers in the high-frequency domain [13].
3.2 Different air duty ratio
Further, we enlarged the gyromagnetic cylinder in the samehexagon lattice by increasing the radius. The calculatedChern numbers and photonic energy bands are shown inFig. 8.According to the calculated results, drastic changes can
be observed with respect to the topological property whenthe radius is changed. As we can see, with an increase inthe radius of the gyromagnetic cylinders, the frequency ofeach band will decrease in different structures. Thenormalized frequency of the fourth band is approximately0.8 when r = 0.13a0, as shown in Fig. 8(a), decreases toapproximately 0.65 when r = 0.23a0, as shown in Fig. 8(b),and finally decreases to become less than 0.5 when r =0.33a0, as shown in Fig. 8(c). The third band is initiallybetween 0.6 and 0.8 for r = 0.13a0 and becomes less than0.4 for r = 0.33a0. The second band’s behavior is alsosimilar. The ground state beneath the bandgap decreases.The ground state’s decrease is small, which reduces thebandgap. This phenomenon can be explained based on theelectromagnetic variational theorem mentioned in Ref.[26], which indicates that low-frequency modes concen-trate their energy in high-ε regions and that high-frequencymodes exhibit a larger energy concentration in low-εregions. Thus, when we increase the radius of a central
cylinder that has higher ε than that of the surrounding air,more energy from each mode is pushed into the cylinderand the frequency of each corresponding mode naturallydecreases. Additionally, along with the evolution of theparameter, the ground state maintains its shape and theother bands above the gap randomly change theirappearance. We attribute this to the various energies ofdifferent bands. The ground state has the least energy;therefore, it is more likely to maintain a constant energydistribution in case of a structural change, whereas theopposite is true in case of higher bands. Furthermore, theChern number of the ground state, i.e., the first band,maintains a value of zero for different air duty ratios;however, the states above the bandgap behave consider-ably differently. The Chern numbers of the higher orderbands change in a nonlinear manner. For example, in band4, the Chern number c = 1 when r = 0.13a0 (Fig. 8(a))becomes – 2 when r = 0.23a0 (Fig. 8(b)) and finally zerowhen r = 0.33a0 (Fig. 8(c)). Similar to Fig. 7(c), wheredifferent energy bands correspond to different Chernnumbers, this can be explained by the theorem aboutlarge Chern numbers provided in Refs. [13,27], whichillustrates that the Chern number is directly influenced bythe band structure.
3.3 Different rotation operations
Here, we explore the manner in which the band structuresand Berry curvature change in case of different rotationoperations (Fig. 9).The structure is formed by the triangular columns in a
honeycomb lattice. The side length of the triangle isl ¼ 0:808a0. The band structures and Berry curvature thathave been discussed in other sections are in the TM mode.To better understand the distinct change in band structuresand the energy-density distribution of the unidirectionalpropagation edge state after the rotation operations, wecalculated the band structures and Berry curvature of ahexagon cell with a silicon triangular column inside the TE
Fig. 8 Gyromagnetic cylinders with different radii in the center of a hexagon cell, maintaining the hexagon unchanged. (a) Bandstructures of the TMmode and the corresponding Chern numbers of a gyromagnetic cylinder with a radius of 0.13a0; (b) band structures ofthe TM mode and corresponding Chern numbers of a gyromagnetic cylinder with a radius of 0.23a0; (c) band structures of the TM modeand the corresponding Chern numbers of a gyromagnetic cylinder with a radius of 0.33a0
82 Front. Optoelectron. 2020, 13(1): 73–88

mode because majority of the energy is concentrated in thegyromagnetic columns in the TM mode. The energy-density distribution barely changed because the shape ofthe silicon triangular column did not alter after the rotationoperation. There was no obvious difference between theband structures and the energy-density distribution of theunidirectional propagation edge state in the TM mode.However, in the TE mode, the energy was mainly locatedin the air column. The energy-density distributiondrastically changed as the shape of the air column alteredconsiderably after the rotation operation. The bandstructure and energy-density distribution of the unidirec-tional propagation edge state were considerably differentafter the rotation operation in the TE mode.To investigate the manner in which the band structures
changed in the TE modes, we rotated the silicon triangularcolumn in the hexagon cell by 15° anticlockwise eachtime. The band diagram of a hexagon cell with a silicontriangular column inside without considering any rotationis shown in Fig. 9(a). Two degenerate points are shown.Next, we rotated the silicon triangular column in thehexagon cell by 15°, the band diagram of which is shownin Fig. 9(b). Two degenerate points were obtained as webroke the parity symmetry [28]. When the rotation anglewas increased to 30°, the size of the bandgap became larger
as shown in Fig. 9(c) because we deepened the destructionof symmetry.In addition, we also explored the manner in which the
Berry curvature changed with varying degree of rotation.The calculated Berry curvature for the second band of thesilicon triangular column in the hexagon cell withoutrotation is shown in Fig. 9(d). There are six peaks in thefirst Brillouin zone that are not exactly identical becausethe Berry curvature has a C3v symmetry, with one negativepeak and positive peak being observed at the K and K′points, respectively [28]. Interestingly, Fig. 9(e) reveals theBerry curvature pattern with 18 nodes in the first Brillouinzone as a silicon triangular column in the hexagon cell thatwas rotated 15° anticlockwise. The C3v symmetry shownin Fig. 9(e) did not change compared with that in Fig. 9(d).However, the negative peak at the K point in the examplewithout rotation shown in Fig. 9(d) became a positive peakin case of a rotation of 15° shown in Fig. 9(e) by simplyincreasing the rotation angle from 0° to 15°. The Berrycurvature pattern when the rotation angle was increased to30° is shown in Fig. 9(f) with 18 nodes appearing in thefirst Brillouin zone. The C3v symmetry shown in Fig. 9(f)did not change compared with those in Figs. 9(d) and 9(e),and there was no swap of the K and K′ points (i.e., thenegative peak is at the K point) shown in Fig. 9(f) in case
Fig. 9 Band structures of the TE mode and Berry curvature of the hexagon cell after the anticlockwise rotation operation. (a) Bandstructure of the TE mode of the hexagon cell in which the inside triangle is in the state of origin location; (b) band structure of the TE modeof the hexagon cell in which the inside triangle is rotated 15° anticlockwise; (c) band structure of the TE mode of the hexagon cell in whichthe inside triangle is rotated 30° anticlockwise; (d) calculated Berry curvature of the second band corresponding to the structures withoutrotation; (e)–(f) calculated Berry curvature of the second band corresponding to the structures that are rotated by 15° and 30°, respectively:(e) for the hexagon cell in which the inside triangle is rotated 15° anticlockwise and (f) for the hexagon cell in which the inside triangle isrotated 30° anticlockwise
Chenyang WANG et al. Universal numerical calculation method for Chern numbers 83

of a rotation of 30° when compared with the K and K′points shown in Fig. 9(d) in case of no rotation. This showsthat the rotation angle determines whether the K point is anegative or positive peak. The signs of the peaks in the Kpoints will remain identical when the rotation angle is aninteger multiple of 30°.
3.4 Berry curvature and boundary states
Berry curvature can provide us important information thatcannot be obtained from the dispersion bands. Consider therotating triangular column model presented in Section 3.3as an example. Consider three models with anticlockwiserotation angles of – 15°, 15°, and 45° (Fig. 10). Wecalculated their dispersion bands (Figs. 10(a)–10(c)) andthe Berry curvature distributions of their second bands(Figs. 10(d)–10(f)). From Figs. 10(a)–10(c), we can seethat the dispersion relations of the three models are similar,whereas the Berry curvature distributions of their secondbands (Figs. 10(d)–10(f)) are different. The Berrycurvature distributions of the models rotated by 15° and45° are identical, whereas the Berry curvatures of themodels rotated by – 15° and 15° are opposite to each other.The differences in their Berry curvatures can be attributedto different mirror transformations. Consider the mirrortransformation along the x-axis as an example. For the 2DTE modes, the Maxwell equation can be simplified as
presented in Eq. (17).
r2rHz þ ε
∂∂x
1
ε
� �∂∂xHz þ ε
∂∂y
1
ε
� �∂∂yHz
¼ – εωc
� �2Hz, (17)
where Hz is the z component of magnetic intensity and εdenotes the permittivity. Substituting the coordinate ðx, – yÞfor ðx,yÞ and using the chain rule for partial derivatives,Eq. (17) becomes Eq. (18).
1
εðx, – yÞr2rHzðx, – yÞ þ
∂∂x
1
εðx, – yÞ� �
∂∂xHzðx, – yÞ
þ ∂∂y
1
εðx, – yÞ� �
∂∂yHzðx, – yÞ
¼ –ωc
� �2Hzðx, – yÞ: (18)
This means that Hzðx – yÞ satisfies the Maxwell equationif we substitute εðx,yÞ with εðx, – yÞ. Therefore, if thegeometry is transformed under a mirror transformation, theeigenstates of the new structure will transform under thesame transformation, i.e., they will become a mirror of theoriginal eigenstates about the x-axis. However, under thistransformation, the parity changes and the Berry curvature
Fig. 10 Band structures of the TE mode and Berry curvature of the hexagon cell after various rotation operations. (a) Band structure ofthe TE mode of the hexagon cell in which the inside triangle is rotated 15° clockwise; (b) band structure of the TE mode of the hexagoncell in which the inside triangle is rotated 15° anticlockwise; (c) band structure of the TE mode of the hexagon cell in which the insidetriangle is rotated 45° anticlockwise; (d)–(f) calculated Berry curvature corresponding to the structures rotated by –15°, 15°, and 45°,respectively: (d) for the hexagon cell in which the inside triangle is rotated 15° clockwise; (e) for the hexagon cell in which the insidetriangle is rotated 15° anticlockwise; and (f) for the hexagon cell in which the inside triangle is rotated 45° anticlockwise
84 Front. Optoelectron. 2020, 13(1): 73–88
takes the opposite sign. Therefore, the result is that undermirror transformation, the Berry curvature distribution is amirror of the original distribution that takes the oppositesign. With respect to our example, for constructing astructure with an angle of – 15°, the structure with an angleof 15° can be used as the mirror along the x-axis, whichwill transport the K(K′) points to the K(K′) points andchange the sign of the Berry curvature. Due to the C3symmetry of the Berry curvature of the C3 symmetricstructures, different K(K′) points exhibit the same Berrycurvature. Thus, this mirror transformation will eventuallychange the sign of the Berry curvature. However, forconstructing a structure with an angle of 45°, the structurewith an angle of 15° along the y-axis can be mirrored,which will transport the K(K′) points to the K′(K) pointsand change the sign of the Berry curvature. Due to theantisymmetry of the Berry curvature distribution of thetime-reversal symmetric structures, the sign of the Berry
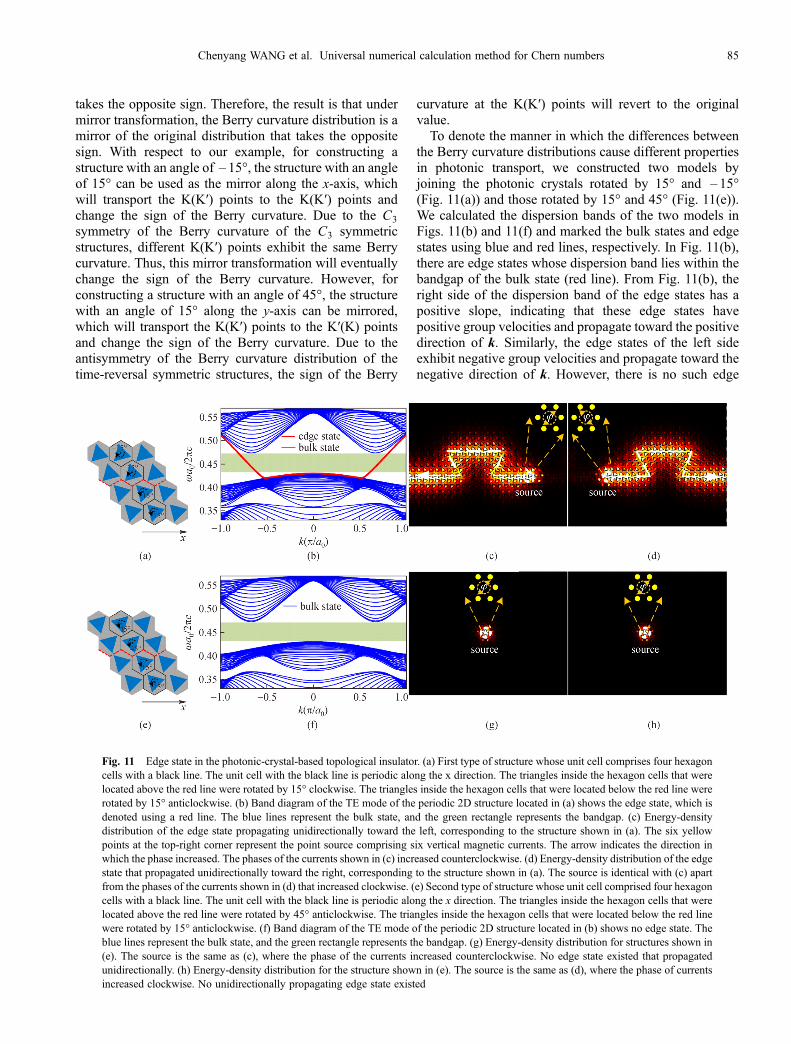
curvature at the K(K′) points will revert to the originalvalue.To denote the manner in which the differences between
the Berry curvature distributions cause different propertiesin photonic transport, we constructed two models byjoining the photonic crystals rotated by 15° and – 15°(Fig. 11(a)) and those rotated by 15° and 45° (Fig. 11(e)).We calculated the dispersion bands of the two models inFigs. 11(b) and 11(f) and marked the bulk states and edgestates using blue and red lines, respectively. In Fig. 11(b),there are edge states whose dispersion band lies within thebandgap of the bulk state (red line). From Fig. 11(b), theright side of the dispersion band of the edge states has apositive slope, indicating that these edge states havepositive group velocities and propagate toward the positivedirection of k. Similarly, the edge states of the left sideexhibit negative group velocities and propagate toward thenegative direction of k. However, there is no such edge
Fig. 11 Edge state in the photonic-crystal-based topological insulator. (a) First type of structure whose unit cell comprises four hexagoncells with a black line. The unit cell with the black line is periodic along the x direction. The triangles inside the hexagon cells that werelocated above the red line were rotated by 15° clockwise. The triangles inside the hexagon cells that were located below the red line wererotated by 15° anticlockwise. (b) Band diagram of the TE mode of the periodic 2D structure located in (a) shows the edge state, which isdenoted using a red line. The blue lines represent the bulk state, and the green rectangle represents the bandgap. (c) Energy-densitydistribution of the edge state propagating unidirectionally toward the left, corresponding to the structure shown in (a). The six yellowpoints at the top-right corner represent the point source comprising six vertical magnetic currents. The arrow indicates the direction inwhich the phase increased. The phases of the currents shown in (c) increased counterclockwise. (d) Energy-density distribution of the edgestate that propagated unidirectionally toward the right, corresponding to the structure shown in (a). The source is identical with (c) apartfrom the phases of the currents shown in (d) that increased clockwise. (e) Second type of structure whose unit cell comprised four hexagoncells with a black line. The unit cell with the black line is periodic along the x direction. The triangles inside the hexagon cells that werelocated above the red line were rotated by 45° anticlockwise. The triangles inside the hexagon cells that were located below the red linewere rotated by 15° anticlockwise. (f) Band diagram of the TE mode of the periodic 2D structure located in (b) shows no edge state. Theblue lines represent the bulk state, and the green rectangle represents the bandgap. (g) Energy-density distribution for structures shown in(e). The source is the same as (c), where the phase of the currents increased counterclockwise. No edge state existed that propagatedunidirectionally. (h) Energy-density distribution for the structure shown in (e). The source is the same as (d), where the phase of currentsincreased clockwise. No unidirectionally propagating edge state existed
Chenyang WANG et al. Universal numerical calculation method for Chern numbers 85

state in Fig. 11(f). Next, we constructed structures in whichthe two photonic crystals were bounded by a zigzaginterface, shown in Figs. 11(c) and 11(d), to show thechiral and robust properties of the edge states. We placed asource in the middle of the interface in each structure. Thesource comprised six vertical magnetic currents oscillatingat a frequency of 0:45c=a0, where a0 is the lattice constantand c is the speed of light. The magnetic currents werealigned to the vertices of a hexagon with a side length of0:1a0=
ffiffiffi3
p, and each pair of adjacent currents exhibited the
same phase difference. For a model comprising photoniccrystals with triangles rotated by 15° and -15°, we excitedthe edge states of different chirality in Figs. 11(c) and 11(d), respectively.As shown in Fig. 11(c), the phases of the currents
increased anticlockwise and the edge states propagatedunidirectionally toward the left, corresponding to the edgestates with negative velocities. In Fig. 11(d), the phases ofthe currents increased clockwise and the unidirectionaledge state emerged but propagated in the oppositedirection, corresponding to the edge states with positivegroup velocities. This phenomenon shows that the edgestates with different group velocities exhibit different chiralproperties. Therefore, the edge states with differentchiralities can travel unidirectionally along differentdirections. Moreover, the edge states were robust againstthe sharp twisting angles. Figures 11(c) and 11(d) illustratethat little electromagnetic wave is leaked or scattered at thetwisting angles. The reason is that the bandgap of the bulkstate prevents the leaking of the wave and that theunidirectionality of the edge state restrains the scattering.For a model comprising photonic crystal with trianglesrotated by 15 and 45° (Fig. 11(e)), neither the sourceshown in Fig. 11(c) nor that shown in Fig. 11(d) couldexcite any of the edge states because from Fig. 11(f), wecan observe that this structure had no edge states. Thedifference between the two modes lies in the Berrycurvature of the bulk states. For the structure shown in Fig.11(a), the bulk states of the two sides exhibited oppositeBerry curvatures, as shown in Figs. 10(d) and 10(e).Therefore, similar to the quantum valley Hall effect [23],edge states emerged at the interface of the two photoniccrystals. However, the bulk states of the structure shown inFig. 11(e) exhibited the same Berry curvature, as shown inFigs. 10(e) and 10(f). Therefore, there was no edge state atthe interface. Thus, we have proved our algorithm issuitable for the calculation of the Berry curvature andChern number, which can enable us to obtain the accuratetopological invariant of some typical photonic crystals.
4 Conclusions
Herein, we proposed a universal method for calculating theBerry curvature and Chern numbers. Our method was
based on FEM, exhibiting considerable flexibility andcontrolled accuracy. Using this method, we calculated theChern numbers and Berry curvature distributions ofdifferent types of trivial and topological photonic crystals.To denote the flexibility of our numerical method, wepresented the results of the photonic crystals usinggyromagnetic materials and all-dielectric materials.Furthermore, using different structures, we analyzed themanner in which the Berry curvature and Chern numbersare correlated with the geometrical structures and disper-sion relations. Next, we discussed the impact of thedifferent shapes of columns, air duty ratios, and rotationangles on the Berry curvature and Chern numbers of thephotonic crystals and illustrated the interesting phenomenaarising from the novel topological states, including robustunidirectional edge states. In conclusion, our method isvery useful to search novel topological structures and findintriguing properties of considerably complicated struc-tures. Further, our method can be easily combined with theintelligent computation and optimization methods, makingit helpful for automatically searching topological struc-tures.
Acknowledgements This paper was supported by the National NaturalScience Foundation of China (Grant Nos. 11604378, 91850117, and11654003), Beijing Institute of Technology Research Fund Program forYoung Scholars, and Double First Class University Plan. We would like tothank Prof. Xiangdong Zhang, Dr. Lu He, Dr. Yujing Wang, and Dr.Changyin Ji from the Beijing Institute of Technology for the usefuldiscussion.
References
1. Raghu S, Haldane F D M. Analogs of quantum-Hall-effect edge
states in photonic crystals. Physical Review A, 2008, 78(3): 033834
2. Wu Y, Li C, Hu X, Ao Y, Zhao Y, Gong Q. Applications of
topological photonics in integrated photonic devices. Advanced
Optical Materials, 2017, 5(18): 1700357
3. Den N, Quantized M. Hall conductance in a two dimensional
periodic potential. Physica A, 1984, 124(1): 199–210
4. Lu L, Joannopoulos J D, Soljačić M. Topological photonics. Nature
Photonics, 2014, 8(11): 821–829
5. Chen X D, Zhao F L, Chen M, Dong J W. Valley-contrasting
physics in all-dielectric photonic crystals: Orbital angular momen-
tum and topological propagation. Physical Review B, 2017, 96(2):
020202
6. Gao Z, Yang Z J, Gao F, Xue H R, Yang Y H, Dong J W, Zhang B L.
Valley surface-wave photonic crystal and its bulk/edge transport.
Physical Review B, 2017, 96(20): 201402
7. Kang Y, Ni X, Cheng X, Khanikaev A B, Genack A Z. Pseudo-spin-
valley coupled edge states in a photonic topological insulator.
Nature Communications, 2018, 9(1): 3029
8. Berry M V. Quantal phase factors accompanying adiabatic changes.
Proceedings of the Royal Society of London, Series A, 1802, 1984
(392): 45–57
86 Front. Optoelectron. 2020, 13(1): 73–88
9. Tomita A, Chiao R Y. Observation of Berry’s topological phase by
use of an optical fiber. Physical Review Letters, 1986, 57(8): 937–
940
10. Wang H X, Guo G Y, Jiang J H. Band topology in classical waves:
Wilson-loop approach to topological numbers and fragile topology.
New Journal of Physics, 2019, 21(9): 093029
11. Hatsugai Y. Chern number and edge states in the integer quantum
Hall effect. Physical Review Letters, 1993, 71(22): 3697–3700
12. Wang Z, Chong Y D, Joannopoulos J D, SoljacićM. Reflection-free
one-way edge modes in a gyromagnetic photonic crystal. Physical
Review Letters, 2008, 100(1): 013905
13. Skirlo S A, Lu L, Soljačić M. Multimode one-way waveguides of
large Chern numbers. Physical Review Letters, 2014, 113(11):
113904
14. Yang B, Zhang H F, Wu T, Dong R, Yan X, Zhang X. Topological
states in amorphous magnetic photonic lattices. Physical Review B,
2019, 99(4): 045307
15. Ochiai T, Onoda M. Photonic analog of graphene model and its
extension: Dirac cone, symmetry, and edge states. Physical Review
B, 2009, 80(15): 155103
16. Fukui T, Hatsugai Y, Suzuki H. Chern numbers in discretized
Brillouin Zone: efficient method of computing (spin) hall con-
ductances. Journal of the Physical Society of Japan, 2005, 74(6):
1674–1677
17. Ringel Z, Kraus Y E. Determining topological order from a local
ground-state correlation function. Physical Review B, 2011, 83(24):
245115
18. Yu R, Qi X L, Bernevig A, Fang Z, Dai X. Equivalent expression of
Z(2) topological invariant for band insulators using the non-Abelian
Berry connection. Physical Review B, 2011, 84(7): 075119
19. Ma T, Shvets G. All-Si valley-Hall photonic topological insulator.
New Journal of Physics, 2016, 18(2): 025012
20. Ma T, Shvets G. Scattering-free edge states between heterogeneous
photonic topological insulators. Physical Review B, 2017, 95(16):
165102
21. Ye L, Yang Y T, Hang Z H, Qiu C Y, Liu Z Y. Observation of
valley-selective microwave transport in photonic crystals. Applied
Physics Letters, 2017, 111(25): 251107
22. Gao F, Xue H R, Yang Z J, Lai K, Yu Y, Lin X, Chong Y, Shvets G,
Zhang B. Topologically protected refraction of robust kink states in
valley photonic crystals. Nature Physics, 2018, 14(2): 140–144
23. Xiao D, Yao W, Niu Q. Valley-contrasting physics in graphene:
magnetic moment and topological transport. Physical Review
Letters, 2007, 99(23): 236809
24. Shalaev M I, Walasik W, Tsukernik A, Xu Y, Litchinitser N M.
Robust topologically protected transport in photonic crystals at
telecommunication wavelengths. Nature Nanotechnology, 2019, 14
(1): 31–34
25. He X T, Liang E T, Yuan J J, Qiu H Y, Chen X D, Zhao F L, Dong J
W. A silicon-on-insulator slab for topological valley transport.
Nature Communications, 2019, 10(1): 872
26. Joannopoulos J D, Johnson S G, Winn J N, Meade R D. Photonic
Crystals Molding the Flow of Light. 2nd ed. America: Princeton
University Press, 2008, 1–283
27. Yang B, Wu T, Zhang X. Engineering topological edge states in two
dimensional magnetic photonic crystal. Applied Physics Letters,
2017, 110(2): 021109
28. Chan H C, Guo G Y. Tuning topological phase transitions in
hexagonal photonic lattices made of triangular rods. Physical
Review B, 2018, 97(4): 045422
Mr. Chenyang Wang is an undergraduatestudent majoring in Applied Physics at theBeijing Institute of Technology, China. Hisresearch interests include nanophotonics andtopological photonic crystals. He success-fully applied for one national inventionpatent as the co-inventor. Furthermore, hereceived the excellent poster award duringthe 2019 CPS Fall Meeting as well as aNational Scholarship.
Email: [email protected]
Dr. Hongyu Zhang received her bachelor’sdegree from the Hebei Normal University in2018. She is currently a graduate student atthe Beijing Institute of Technology andstudies the interaction between light andmatter in nanostructures, including the metalnanoparticles and photonic crystal cavities.She successfully applied for two nationalinvention patents as the second inventor and
received a National Scholarship during her first year in graduateschool. Currently, she is focused on researching topologicalphotonics and hybrid cavity systems.
Email: [email protected]
Mr. Hongyi Yuan is currently an under-graduate in the Physics Department at theBeijing Institute of Technology. His researchis focused on the design, calculation andsimulation of nanophotonic devices. He iscurrently focused on general designingusing algorithms. He successfully appliedfor two national invention patents as the co-inventor.Email: [email protected]
Mr. Jinrui Zhong is an undergraduatestudent at the Beijing Institute of Technol-ogy. He has been awarded a scholarshipevery semester and received an A – in theastrophysics course during the summerschool program at the University of Cali-fornia, Berkeley. His major research inter-ests include the theory of topological fields,Weyl semimetal, chiral anomaly, and axion
electric dynamics in condensed matter physics. As a big fan ofRichard Feynman, he is independently pursuing Ph.D. whileconducting quantum transport experiments.
Email: [email protected]
Chenyang WANG et al. Universal numerical calculation method for Chern numbers 87
Prof. Cuicui Lu received her Ph.D. degreefrom the Peking University in 2015 and iscurrently an associate research scientist atthe Beijing Institute of Technology. Herresearch interests include nanophotonicdevices based on algorithm, topologicalphotonics, photonic crystal cavity andapplications, and plasmonics. She has pub-lished 30 papers in several journals, includ-
ing Light: Science & Applications, Optica, Nano Letters, Laser &Photonics Reviews, and Advanced Optical Materials. She has led sixscientific research projects, including three projects of NationalNatural Science Foundations of China, two projects of the BeijingInstitute of Technology, and one independent innovation project ofthe Qian Xuesen Space Technology Laboratory. She received theSPIE Optics and Photonics Education Scholarship and WorldQuantitative and Science Scholarship in 2014.
Email: [email protected]
88 Front. Optoelectron. 2020, 13(1): 73–88