Embed Size (px)
Citation preview
Universalistic Rules-Particularistic Implementation: The EU’s Single Market for
Government Purchases
Mihály Fazekas, Department of Sociology, University of Cambridge, Cambridge, United
Kingdom / Government Transparency Institute, Budapest, Hungary
& Jiri Skuhrovec, Institute of Economic Studies, Charles University, Prague, Czech
Republic

The opinions expressed and arguments employed herein are solely those of the authors and do not
necessarily reflect the official views of the OECD or of its member countries.
This document and any map included herein are without prejudice to the status of or sovereignty over
any territory, to the delimitation of international frontiers and boundaries and to the name of any
territory, city or area.
This paper was submitted as part of a competitive call for papers on integrity, anti-corruption and trade
in the context of the 2016 OECD Integrity Forum.
1
Abstract
Open and fair access to government contracts has been a long-standing principle in many international
trade agreements including the one on the EU’s single public procurement market which is probably
the most extensive among them with its long standing common regulatory and enforcement
framework. However, the ostensibly low prevalence of cross-border trade in European public
procurement represents a troubling puzzle: only about 5% of procurement contracts are awarded to
non-domestic suppliers. This is in strike contrast with overall trade openness among these countries
which surpasses 50% of GDP. The analysis uses country-level statistics as well as contract-level
administrative data to investigate to what degree this gap results from governments’ particularistic
protectionism and what are its drivers. We found that much of it can be attributed to public bodies
using particularistic means to favour domestic firms both when looking at it from a country-level or a
market-level perspective. Using contract-level data, we estimate that about 17% of public
procurement spending takes place on markets characterised by particularistic protectionism. While
most countries resorting to particularistic means are among the least-well governed countries in
Europe at least according to perception surveys, there are a number of surprising outliers: Denmark
and Finland and to a lesser degree Norway and Sweden appear to close their domestic markets to
foreign competition considerably more than their corruption-levels would suggest. Conversely,
Romania and Poland close their domestic markets much less than expected based on their corruption
levels. Taking the example of EU institutions, which have arguably much less reason to prefer
domestic companies in whichever member state they are located, suggests that procurement openness
could increase up to 10-times approximating member states’ total trade openness. In order to foster
greater cross-border procurement, the implementation of regulations should be monitored using Big
Data analytical techniques and remedies systems should be improved.
Keywords
European Union, public procurement, single market, corruption, trade
2
1. INTRODUCTION
Open and fair access to government contracts has been a long-term principle in many international
trade agreements including the World Trade Organisation’s so-called plurilateral Agreement on
Government Procurement (GPA)1. Among these agreements, the one regulating the European single
public procurement market2 is probably the most extensive with its long standing common regulatory
and enforcement framework preceding the GPA. Notably, it has a strong institutional backing both for
punishing lack of rule transposition and inadequate implementation (e.g. Court of Justice of the
European Union). Even in such a well-governed part of the world with strong safeguards for cross-
border trade, qualitative evidence is ample about how universalistic rules of open and fair trade in
government contracts are bent by national governments to favour companies with particularistic links
(e.g. owned by political office-holders or donators to electoral campaigns). If the suspected market
entry restrictions are systematic, the resulting efficiency losses are likely to be considerable as public
procurement amounts to roughly 13% of GDP in the European Union (EU) (European Commission,
2016). Moreover, if the EU single market in public procurement fails to foster trade among EU and
European Economic Area (EEA) members3 due to particularistic motives, we can reasonably assume
that other trade agreements will fail to do so even more.
In spite of such salient economic role of procurement markets in Europe and globally as well as long
standing regulatory action, no systematic study exists which would assess the effect of any such trade
agreement on procurement markets and the potential links to particularism. In order to address this
gap in the literature, this paper sets out to
1) measure the degree of particularistic protectionism in public procurement in the EU and EEA;
2) identify its drivers in terms of tender-level corrupt practices to separate particularistic
favouritism from its other forms; and
3) explore its distribution across countries and time.
1 https://www.wto.org/english/tratop_e/gproc_e/overview_e.htm
2 http://ec.europa.eu/growth/single-market/public-procurement/index_en.htm
3 http://www.efta.int/eea/policy-areas/goods/competition-aid-procurement-ipr/procurement (annex XVI)
3
Particularistic protectionism in public procurement trade refers to the deliberate bending of
universalistic rules of open and fair access to government contracts in order to benefit domestic
companies with particularistic links established through friendship, kinship or the purchase of
influence4 (throughout this paper particularism and corruption are used interchangeably).
In subsequent sections a number of key contributions are made: first, we identify a large gap in public
procurement trade in Europe which persists in spite of the strong institutional framework. We estimate
that at least 17% of total procurement spending happens on markets which are protected from foreign
competition by corrupt means. Second, this gap is attributed mainly to national governments
manipulating the way open and fair rules of public procurement are applied to particular tenders in
order to favour their domestic firms. The degree and forms of such particularistic protectionism varies
by country, but it is present all across the EU and EEA. Surprisingly, some well-governed countries
such as Denmark and Finland appear to protect their procurement markets to a comparatively high
degree; while some traditionally considered as more corrupt such as Poland and Romania protect their
procurement markets from foreign competition relatively less. Third, using institutions of the
European Union as a set of possibly least protectionist institutions regardless of the country they
reside in, we suggest that intra-EU public procurement trade could increase tenfold, that is from 5%
currently to roughly 50% approximating total trade openness in Europe.
1.1 The puzzle
The subsequent analysis tries to explain two striking features of European public procurement trade:
its absence and its lack of responsiveness to the EU institutional framework. First, while most if not
all EU and EEA countries are highly open economies when it comes to private to private trade, they
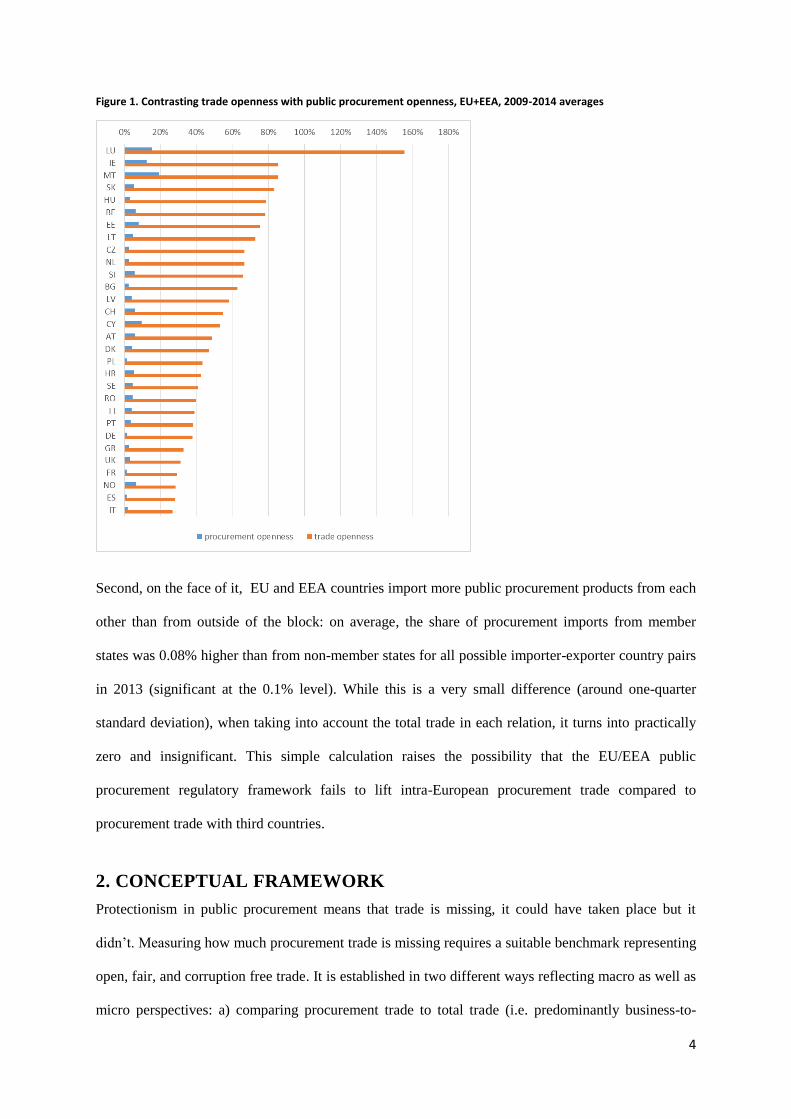
are extremely closed when it comes to government contracts (Figure 1). On average, member states’
trade openness is roughly 10-times their procurement openness (56.6% and 5.9% respectively).
Furthermore, trade and procurement openness are by far not following the same patterns for each
country.
4 For a wide-ranging discussion of conceptualizing corruption as particularism or partiality see: (Mungiu-
Pippidi, 2015; North, Wallis, & Weingast, 2009; Rothstein & Teorell, 2008)
4
Figure 1. Contrasting trade openness with public procurement openness, EU+EEA, 2009-2014 averages
Second, on the face of it, EU and EEA countries import more public procurement products from each
other than from outside of the block: on average, the share of procurement imports from member
states was 0.08% higher than from non-member states for all possible importer-exporter country pairs
in 2013 (significant at the 0.1% level). While this is a very small difference (around one-quarter
standard deviation), when taking into account the total trade in each relation, it turns into practically
zero and insignificant. This simple calculation raises the possibility that the EU/EEA public
procurement regulatory framework fails to lift intra-European procurement trade compared to
procurement trade with third countries.
2. CONCEPTUAL FRAMEWORK
Protectionism in public procurement means that trade is missing, it could have taken place but it
didn’t. Measuring how much procurement trade is missing requires a suitable benchmark representing
open, fair, and corruption free trade. It is established in two different ways reflecting macro as well as
micro perspectives: a) comparing procurement trade to total trade (i.e. predominantly business-to-
5
business trade) and b) comparing member state’ procurement markets to the most open member
state’s markets. The so-identified missing procurement trade is attributed to particularism in public
procurement as long as more corrupt countries have bigger such trade gap (macro view) and
corruption risks in the tendering process accompany missing procurement trade (micro view). Each of
these identification strategies are unpacked briefly below.
Identifying particularistic public procurement from a macro perspective rests on three presumptions:
First, within the EU and EEA, total trade is not or only marginally susceptible for government
manipulation due to strict EU single market regulations, effective oversight, and the predominantly
business-to-business nature of contracting. Second, within the EU and the EEA public procurement
trade is susceptible for government manipulation (i.e. by central govt., municipalities, State-owned
enterprises, etc.) as the implementation and monitoring of the Public Procurement Directives are
largely controlled by member states and they are also the main buyers. Third, some public
procurement sectors are inherently more open to trade than others as typically goods are more easily
transported to other countries than services or construction works. These three arguments together
suggest that public procurement trade openness is determined by total trade openness and
procurement spending structure under a corruption free scenario, in short public procurement trade is
like any other trade if governments follow universalistic rules. By implication,
H1: Public procurement openness’ deviation from total trade openness and public procurement
spending structure is likely to be due to particularistic protectionism.
However, the deviation of public procurement openness from what total trade openness and public
procurement spending structure predicts can not only be due to particularism, but also the associated
higher administrative costs of contracting a foreign supplier such as obtaining translations, working
across greater distances. Furthermore, governments as buyers may have such specific requirements
which make it hard for foreign companies to successfully bid even in the absence of particularistic
motivations. Hence, the natural counter-hypothesis is:
6
H2: Public procurement openness’ deviation from total trade openness and public procurement
spending structure is likely to be due to administrative costs and product specificity.
Identifying particularistic public procurement from a micro perspective follows a similar logic to that
of the macro approach while also complementing it by offering more precise theoretical backing for
identifying product specificities and particularistic motivations. The macro view evoked the average
relationship between procurement trade, total trade, and procurement spending structure; the micro
view, instead, hypothesizes that at least one member state for each product market approximates the
optimal openness, hence can serve as a benchmark. Then member state markets’ deviations from this
benchmark if also associated with micro-level corruption risks can be attributed to particularistic
protectionism. Deviations are defined along the two cardinal dimensions: difference in the given
market’s openness from the benchmark and the difference in contract-level corruption risks compared
to the benchmark for each product market (i.e. comparisons are made between member states on the
level of product markets). These two dimensions allow for identifying 4 market-types5 (Table 1). Two
types represent the two extremes of the most interest to us - universalistic procurement trade and
particularistic protectionism:
1. Member state markets open to procurement trade are characterised by no to very little
deviation from the benchmark both in terms of procurement trade openness and corruption
risks. This is where procurement trade takes place as we would expect in a corruption-free
world.
2. Particularistic protectionism is identified in member state markets where the deviation from
the benchmark is high both in terms of procurement trade openness and corruption risks.
These are the markets where not only a lot more trade could have taken place, but they are
also ripe with signals of corruption which are typically used to restrict market access of non-
connected firms.
The remaining two types represent mixed combinations of openness and corruption risks:
5 Markets where no member state has any foreign suppliers are most likely closed to procurement trade by
nature, hence they are excluded from the analysis.
7
3. Product specificity characterises those member state markets where there is a high degree of
missing procurement trade compared to the benchmark while micro-level corruption risks are
low. In these member state markets, it is possible that predominantly country-specific
products are purchased, hence the high degree of missing foreign suppliers compared to the
benchmark. The lack of micro-level corruption risks suggest that it is not government
manipulation of the procurement process which is causing the trade gap.
4. Particularistic trade characterises those member state markets where there is a low degree of
missing procurement trade compared to the benchmark while micro-level corruption risks are
widespread. These member state markets are close to being as open as the benchmark, but
they are of considerably higher corruption risks which suggest that there are mixed dynamics
going on in them: on the one hand foreign companies are granted access, on the other hand
they are most likely accommodated to a high corruption risk environment.
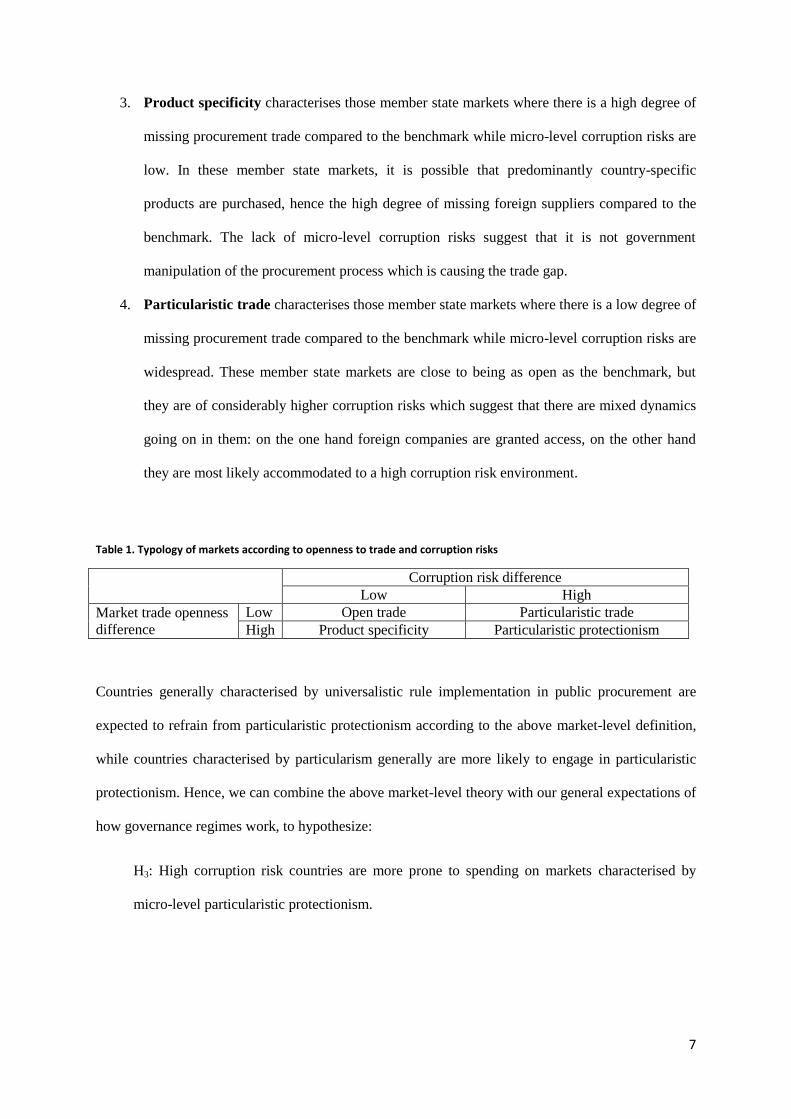
Table 1. Typology of markets according to openness to trade and corruption risks
Corruption risk difference
Low High
Market trade openness
difference
Low Open trade Particularistic trade
High Product specificity Particularistic protectionism
Countries generally characterised by universalistic rule implementation in public procurement are
expected to refrain from particularistic protectionism according to the above market-level definition,
while countries characterised by particularism generally are more likely to engage in particularistic
protectionism. Hence, we can combine the above market-level theory with our general expectations of
how governance regimes work, to hypothesize:
H3: High corruption risk countries are more prone to spending on markets characterised by
micro-level particularistic protectionism.
8
3. DATA AND METHODS, INCLUDING INDICATORS
3.1 Data and indicators
The analysis makes use of country-level statistical data as well as contract-level administrative data
serving the macro and micro analyses. On the country-level, international trade as well as corruption-
perceptions data are drawn from the World Bank Databank6
. On the contract-level, public
procurement data derives from public procurement announcements in 2009-2015 in the EU
and EEA. Announcements appear in the so-called Tenders Electronic Daily (TED), which is
the online version of the 'Supplement to the Official Journal of the EU’, dedicated to
European public procurement (DG GROWTH, 2015). The data represent a complete database
of all public procurement procedures conducted under the EU Public Procurement Directive
in the EU and EEA regardless of the funding source (e.g. national, EU funded). The database
was released by the European Commission - DG GROWTH7 which also has conducted some
data quality checks and enhancements. TED contains variables appearing in 1) calls for
tenders, and 2) contract award notices. All the countries’ public procurement legislation is
within the framework of the EU Public Procurement Directives, hence the national datasets
are therefore directly comparable (European Commission, 2014). The source TED database
contains over 3 million contracts, while contracts below mandatory reporting thresholds8
were dropped. This database directly reflects the policy goal of opening up domestic public
procurement markets as it intentionally contains all those tenders which are of interest for
exporter companies. The database used in this analysis, including corruption risk indicators
can be downloaded from http://digiwhist.eu/resources/data/.
Unfortunately, some data errors necessitate data corrections and careful use of some variables. The
distribution of price data is suspect, with some outliers ranging from zero to values surpassing
6 http://data.worldbank.org/
7 Source data can be downloaded from: https://open-data.europa.eu/en/data/dataset/ted-csv
8 http://www.ojec.com/threshholds.aspx
9
countries full GDP, which might potentially cause flaws in our results. We thus more typically use
contract counts rather than value sums of tenders. If sums are used, these follow from prices
Winsorised at 99.5th percentile, that is with prices effectively capped by value of 23.3 mil. EUR.
Moreover, country identifiers were subject to corrections such as re-labelling French dependent
territories Réunion and Martinique as parts of France.
Key indicators used in the analysis were the following:
Procurement openess is calculated from procurement data for its part where country of both
contracting authority and supplier is identified. For those, the openess is simply calculated as
share of tenders with non-domestic suppliers on the total count of tenders.
Total trade openness is calculated from from World Bank macro-data taking the indicator
„Imports of goods and services (% of GDP)“ directly.
Procurement spending structure is measured using the TED database, by classifying main
sectors9 into low, medium, and high openness prourement sectors according to their Europe-
wide average procurement openness score. In order to get 3 groups with equal number of
sectors, we applied two thresholds: 1.75% and 4.5%.
Corruption-perceptions indicator is also drawn from World Bank data, where indicator
„Control of Corruption: Estimate“ is directly used.
Contract-level corruption risks are calculated using the TED database taking the so-called
Corruption Risk Index (CRI) as the best proxy available at such a micro level (Fazekas &
Kocsis, 2015). CRI directly reflects the techniques of potentially deliberate restrictions of
competition such as single bid submitted on otherwies competitive markets and excessively
short advertisement periods makig it hard for bidders to prepare their bids unless they were
informed informally ahead of the official publication.
9 Sectors are defined using 2-digit CPV categories, see: http://simap.ted.europa.eu/en/web/simap/cpv
10
3.2 Methodology
Two types of analyses have been carried out: country-level panel regressions and market-level
hierarchical clustering. Each are introduced briefly without extensive discussion of the technical
details.
In the country-panel analysis, the following regression equation was estimated (using fixed as well as
random effects specifications):
𝑃𝑟𝑜𝑐𝑢𝑟𝑒𝑚𝑒𝑛𝑡 𝑜𝑝𝑒𝑛𝑛𝑒𝑠𝑠𝑖,𝑡
= 𝛼𝑖 + 𝛽1𝑇𝑟𝑎𝑑𝑒 𝑜𝑝𝑒𝑛𝑛𝑒𝑠𝑠𝑖,𝑡 + 𝛽2𝑃𝑟𝑜𝑐𝑢𝑟𝑒𝑚𝑒𝑛𝑡 𝑠𝑝𝑒𝑛𝑑𝑖𝑛𝑔 𝑠𝑡𝑟𝑢𝑐𝑡𝑢𝑟𝑒𝑖,𝑡 + 𝜀𝑖,𝑡
The country and period-specific residual 𝜀𝑖,𝑡 represents the amount of procurement trade which is
unexplained by total trade openness and procurement spending structure. In as much as it is correlated
with corruption perceptions and objective corruption proxies it is identified as the estimate of
particularistic protectionism.
For the market-level hierarchical cluster analysis, markets were identified by three categorical
variables characterising each market: i) product market (3-digit CPV code10
), ii) border region
(NUTS-2 region11
bordering with another member state or not);and iii) contract size (above or below
product market average). This approach lead to 1634 different markets, some of which are present
(i.e. actually spending taking place) in all member states some are only in a handful of them. Most
open member state markets were simply identified by selecting the member state with highest
procurement openness in each of the 1634 markets. Hierarchical clustering12
was carried out using
two dimensions: member state market’s deviation from the benchmark in terms of procurement
openness and Corruption Risk Index. Member state markets identified as ridden with particularistic
protectionism are then verified using country-level corruption indicators reflecting our expectation
that more corrupt countries would spend more on particularistic protectionist markets.
10
For full description of the Common Procurement Vocabulary (CPV) nomenclature, see: http://simap.ted.europa.eu/en/web/simap/cpv 11
For more information on the Nomenclature of Territorial Units for Statistics (NUTS), see: http://epp.eurostat.ec.europa.eu/portal/page/portal/nuts_nomenclature/introduction 12
We used Stata 13.1 cluster algorithm with average linkage method and Euclidian distance measure.
11
While combining a macro and micro analysis with different benchmarks and different data sources
provide a robust analytical framework for identifying particularistic protectionism, there are three sets
of limitations to our approach. First, there is no guarantee that either the European average or the
European best performer benchmarks truly approximate optimal procurement openness. It cannot be
rejected that even the most open country is applying a degree of particularistic protectionism. In
addition, governments typically procure final goods, while most of private-to-private trade takes place
in raw and intermediary goods making the total trade openness benchmark potentially problematic.
Second, some of the key variables are almost certainly prone to measurement error. Proxying
corruption with contract-level red flags such as single bidding most likely underestimates corruption
risks as many complex strategies of evading detection go undetected (which may be more widely used
in well-governed countries with stronger oversight bodies). This would lead to over-estimating the
prevalence of markets characterised by product specificity as ‘true’ corruption risks are
underestimated. Moreover, procurement openness is defined as cross-border procurement contracts;
however, many companies may find it beneficial to establish foreign subsidiaries for doing
procurement trade given the ease of setting up companies across the EU and EEA. While this can
certainly lead to an underestimation of procurement trade, the policy goal enshrined in the Public
Procurement Directives is to increase cross-border procurement rather than encourage companies to
establish foreign subsidiaries. Third, it is also conceivable that governments have truly unique
requirements when they procure, making the comparison with private-to-private trade misleading.
Taken together the biases could go upwards or downwards, leaving us with no clear conclusion other
than the need for further work and the strong sense of caution when using the results presented in this
paper.
12
4. Results
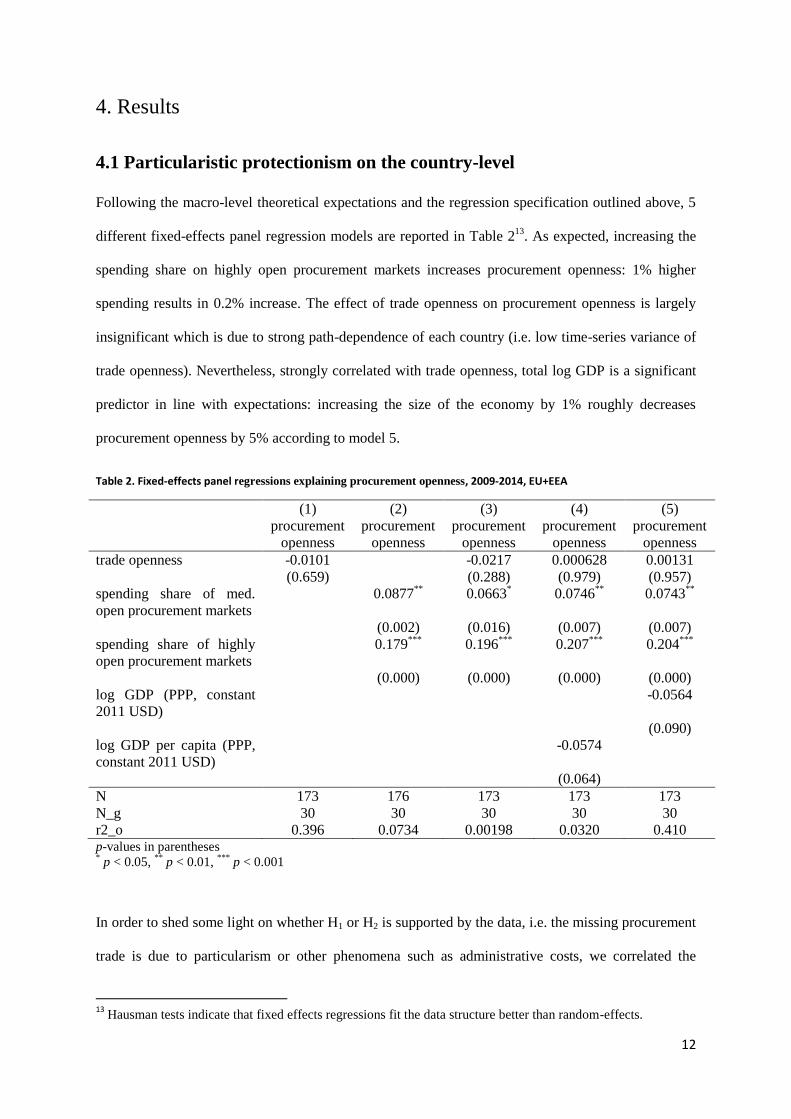
4.1 Particularistic protectionism on the country-level
Following the macro-level theoretical expectations and the regression specification outlined above, 5
different fixed-effects panel regression models are reported in Table 213
. As expected, increasing the
spending share on highly open procurement markets increases procurement openness: 1% higher
spending results in 0.2% increase. The effect of trade openness on procurement openness is largely
insignificant which is due to strong path-dependence of each country (i.e. low time-series variance of
trade openness). Nevertheless, strongly correlated with trade openness, total log GDP is a significant
predictor in line with expectations: increasing the size of the economy by 1% roughly decreases
procurement openness by 5% according to model 5.
Table 2. Fixed-effects panel regressions explaining procurement openness, 2009-2014, EU+EEA
(1) (2) (3) (4) (5)
procurement
openness
procurement
openness
procurement
openness
procurement
openness
procurement
openness
trade openness -0.0101 -0.0217 0.000628 0.00131
(0.659) (0.288) (0.979) (0.957)
spending share of med.
open procurement markets
0.0877**
0.0663* 0.0746
** 0.0743
**
(0.002) (0.016) (0.007) (0.007)
spending share of highly
open procurement markets
0.179***
0.196***
0.207***
0.204***
(0.000) (0.000) (0.000) (0.000)
log GDP (PPP, constant
2011 USD)
-0.0564
(0.090)
log GDP per capita (PPP,
constant 2011 USD)
-0.0574
(0.064)
N 173 176 173 173 173
N_g 30 30 30 30 30
r2_o 0.396 0.0734 0.00198 0.0320 0.410 p-values in parentheses * p < 0.05,
** p < 0.01,
*** p < 0.001
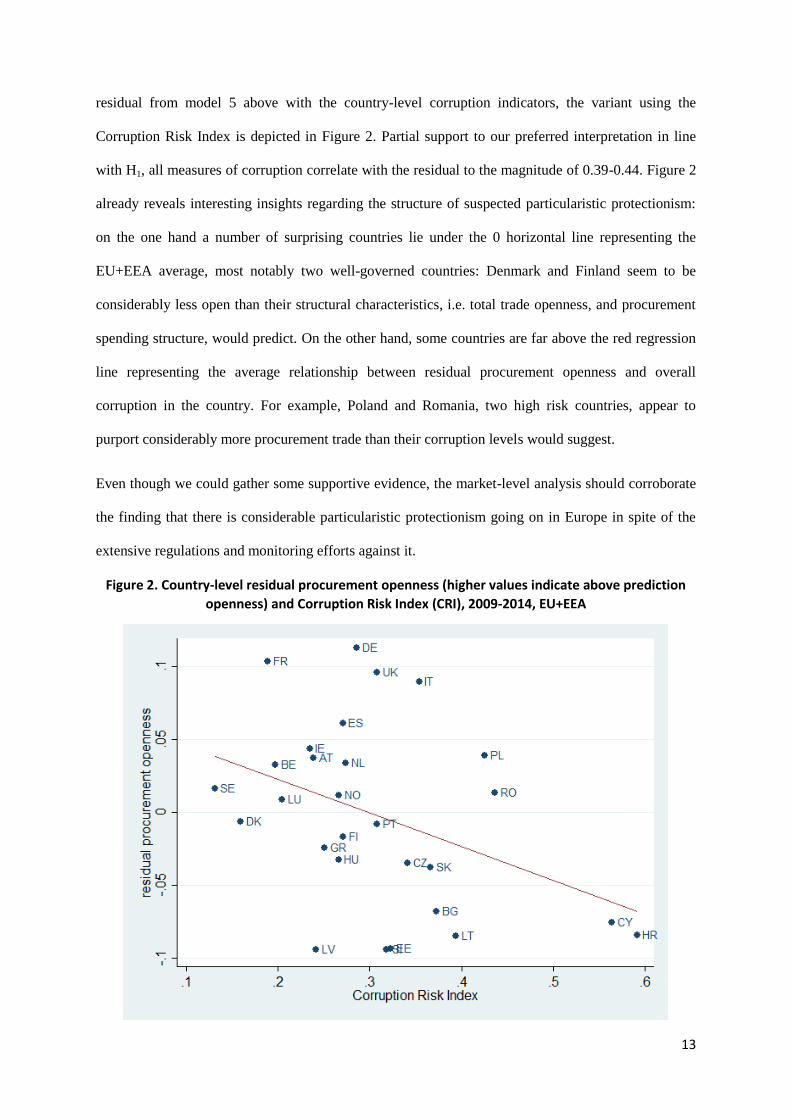
In order to shed some light on whether H1 or H2 is supported by the data, i.e. the missing procurement
trade is due to particularism or other phenomena such as administrative costs, we correlated the
13
Hausman tests indicate that fixed effects regressions fit the data structure better than random-effects.
13
residual from model 5 above with the country-level corruption indicators, the variant using the
Corruption Risk Index is depicted in Figure 2. Partial support to our preferred interpretation in line
with H1, all measures of corruption correlate with the residual to the magnitude of 0.39-0.44. Figure 2
already reveals interesting insights regarding the structure of suspected particularistic protectionism:
on the one hand a number of surprising countries lie under the 0 horizontal line representing the
EU+EEA average, most notably two well-governed countries: Denmark and Finland seem to be
considerably less open than their structural characteristics, i.e. total trade openness, and procurement
spending structure, would predict. On the other hand, some countries are far above the red regression
line representing the average relationship between residual procurement openness and overall
corruption in the country. For example, Poland and Romania, two high risk countries, appear to
purport considerably more procurement trade than their corruption levels would suggest.
Even though we could gather some supportive evidence, the market-level analysis should corroborate
the finding that there is considerable particularistic protectionism going on in Europe in spite of the
extensive regulations and monitoring efforts against it.
Figure 2. Country-level residual procurement openness (higher values indicate above prediction
openness) and Corruption Risk Index (CRI), 2009-2014, EU+EEA
14
4.2 Particularistic protectionism on the market-level
In this section we turn to micro-level identification of particularistic protectionism by directly
clustering member state markets as outlined in section 3.2 according to their deviation from the best
performing benchmark in terms of market openness and corruption risks. The theoretical expectation
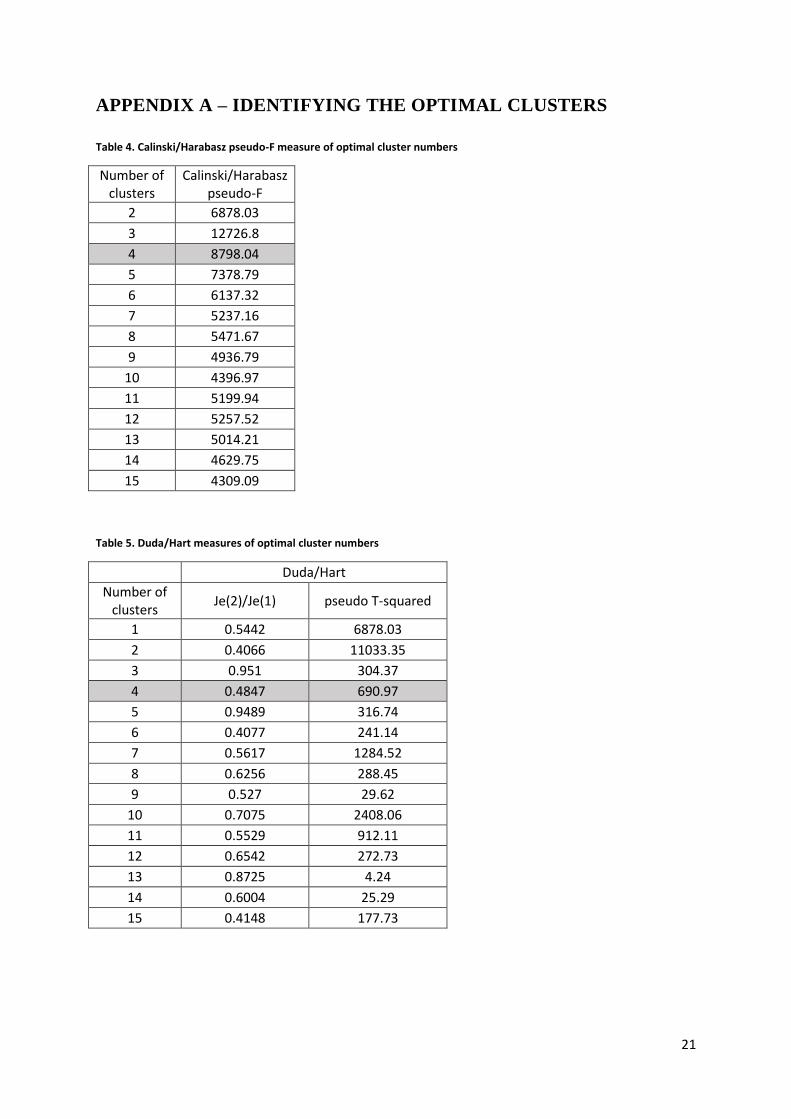
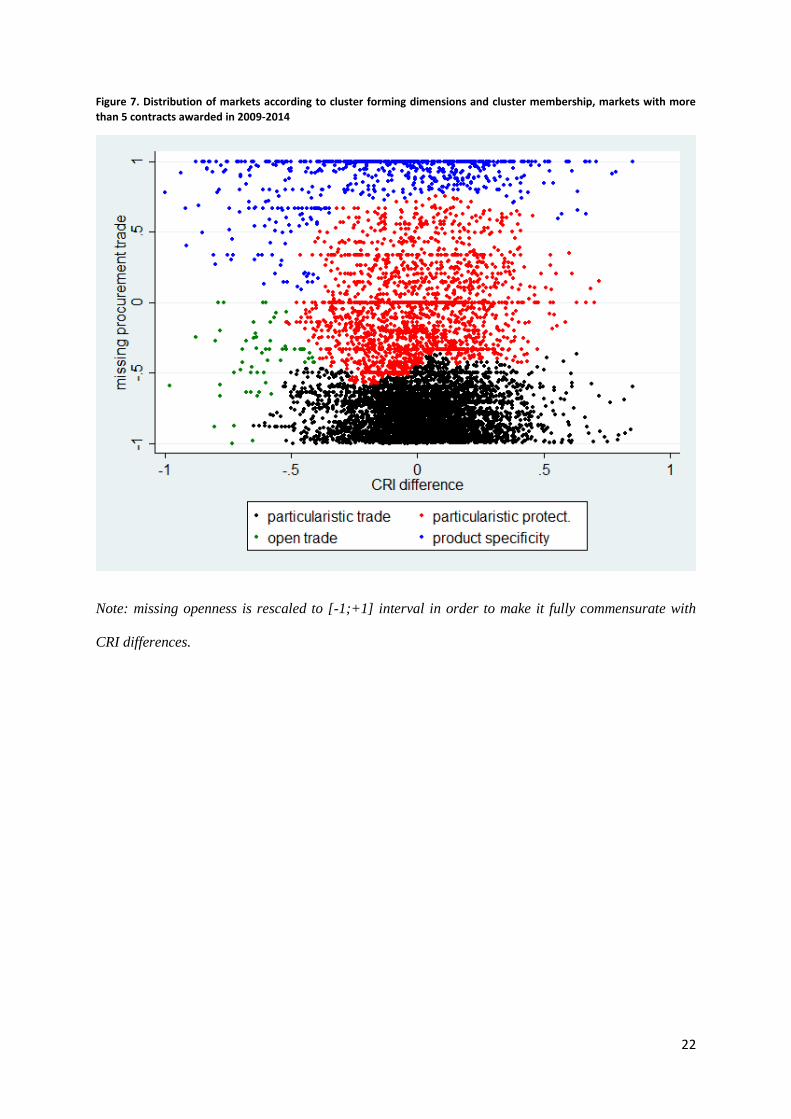
of four clusters is supported by the data (for details of optimal cluster numbers see Appendix A).
While the exact boundaries of clusters are ambiguous to some degree, the overall typology fits the
data well.
Quite in line with the initial puzzle of large amount of missing procurement trade (Figure 1), the open
trade cluster is small in size and represents the exception rather than the rule, whereas the
particularistic protectionism cluster encompasses a substantial portion of all spending analysed: 17%
(Table 3). The fact that the particularistic trade cluster captures the overwhelming majority of
procurement spending across Europe suggests that trade is far from promoting integrity uniformly,
rather it often has to accommodate to the receiving country’s corruption environment.
Table 3. Key characteristics of the identified clusters
Billion EUR total spend
Spending share
Nmarkets Missing
procurement trade
Corruption risk (CRI)
difference
Particularistic trade 1,620.0 79% 5,530 -0.83 0.02
Particularistic protectionism 350.0 17% 1,975 -0.05 -0.01
Product specificity 66.0 3% 652 0.89 -0.11
Open trade 4.7 0% 58 -0.40 -0.62
Total 2,040.0 100% 8,215 -0.50 0.00
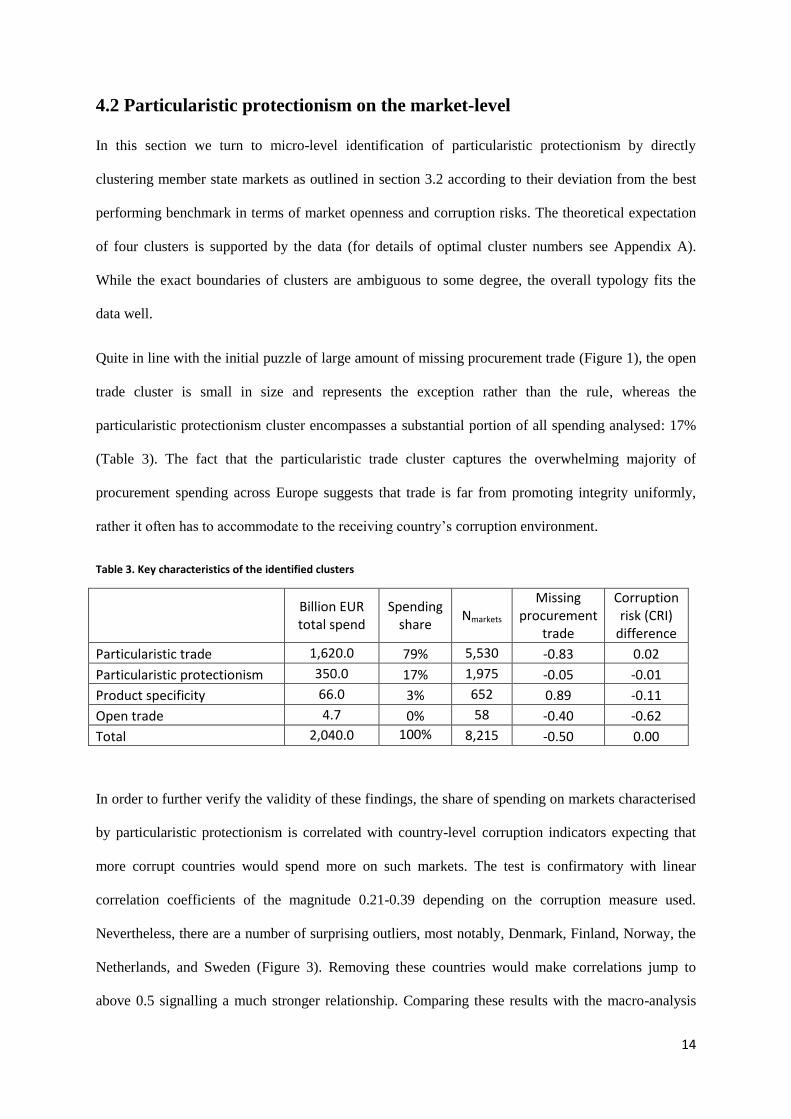
In order to further verify the validity of these findings, the share of spending on markets characterised
by particularistic protectionism is correlated with country-level corruption indicators expecting that
more corrupt countries would spend more on such markets. The test is confirmatory with linear
correlation coefficients of the magnitude 0.21-0.39 depending on the corruption measure used.
Nevertheless, there are a number of surprising outliers, most notably, Denmark, Finland, Norway, the
Netherlands, and Sweden (Figure 3). Removing these countries would make correlations jump to
above 0.5 signalling a much stronger relationship. Comparing these results with the macro-analysis
15
identifies a common set of outlier countries: Denmark and Finland on the more particularistic than
expected and Romania and Poland on the less particularistic than expected end of the scale.
Figure 3. Spending on markets characterised by particularistic protectionism and WGI-Control of Corruption scores,
2009-2014
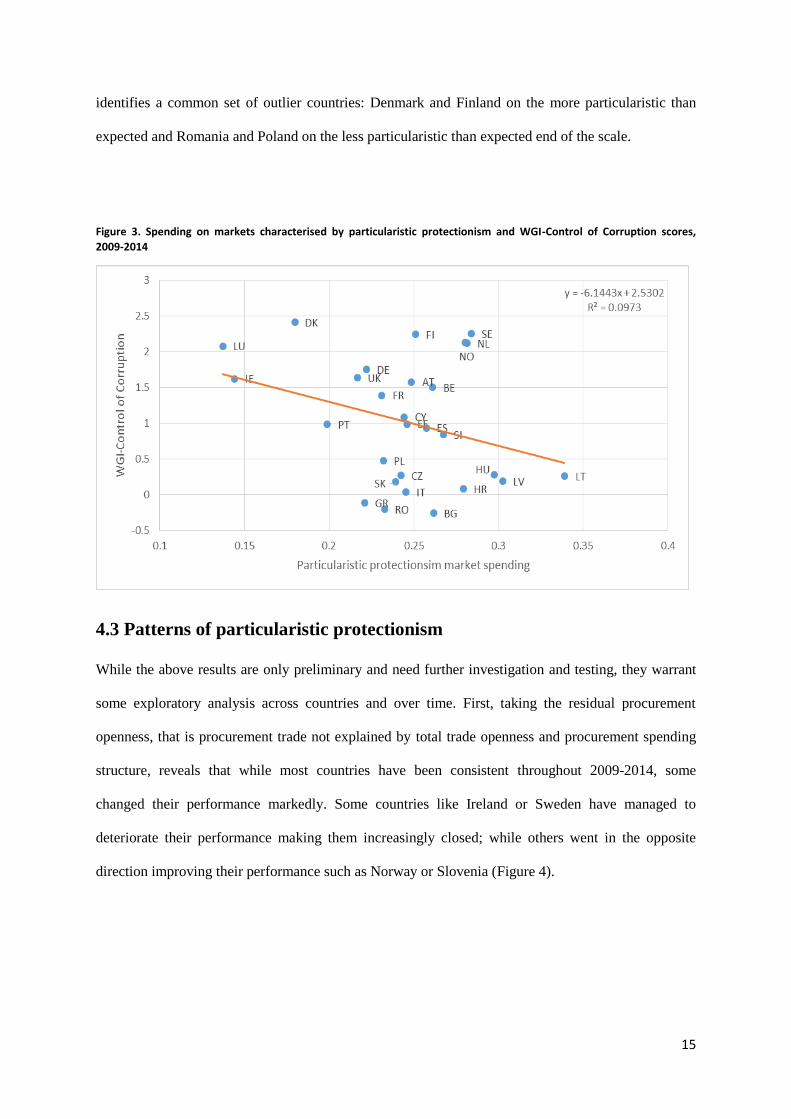
4.3 Patterns of particularistic protectionism
While the above results are only preliminary and need further investigation and testing, they warrant
some exploratory analysis across countries and over time. First, taking the residual procurement
openness, that is procurement trade not explained by total trade openness and procurement spending
structure, reveals that while most countries have been consistent throughout 2009-2014, some
changed their performance markedly. Some countries like Ireland or Sweden have managed to
deteriorate their performance making them increasingly closed; while others went in the opposite
direction improving their performance such as Norway or Slovenia (Figure 4).
16
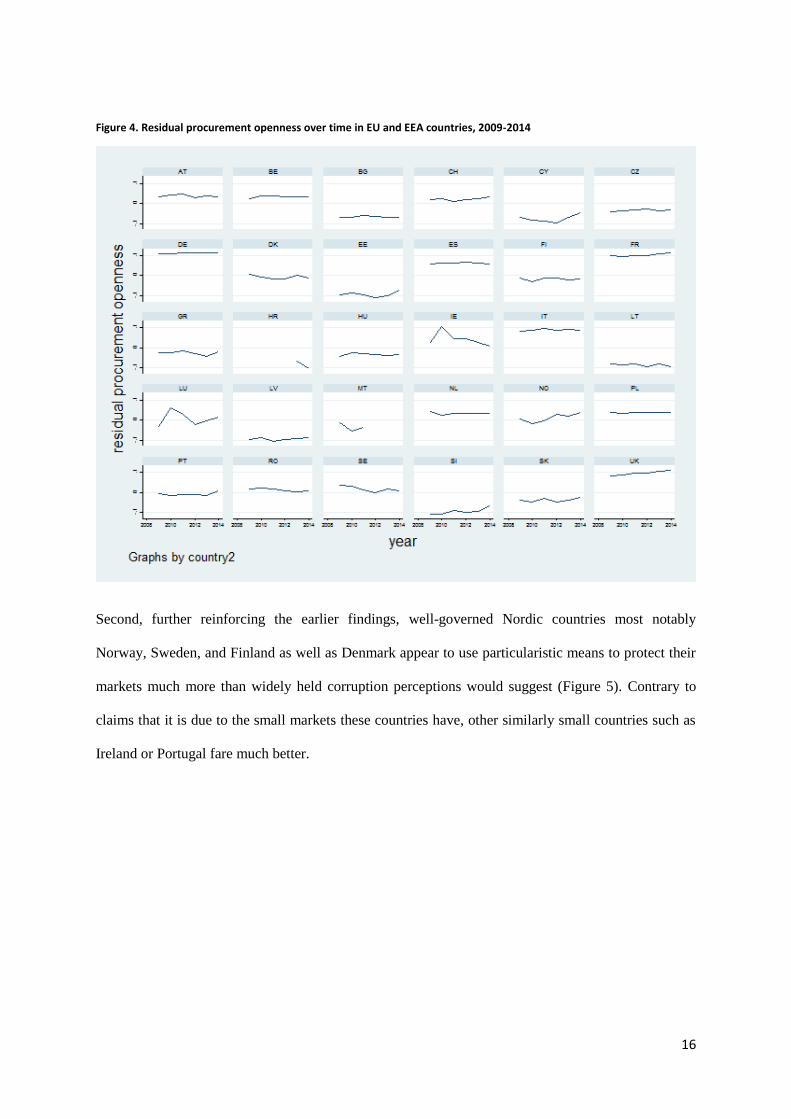
Figure 4. Residual procurement openness over time in EU and EEA countries, 2009-2014
Second, further reinforcing the earlier findings, well-governed Nordic countries most notably
Norway, Sweden, and Finland as well as Denmark appear to use particularistic means to protect their
markets much more than widely held corruption perceptions would suggest (Figure 5). Contrary to
claims that it is due to the small markets these countries have, other similarly small countries such as
Ireland or Portugal fare much better.
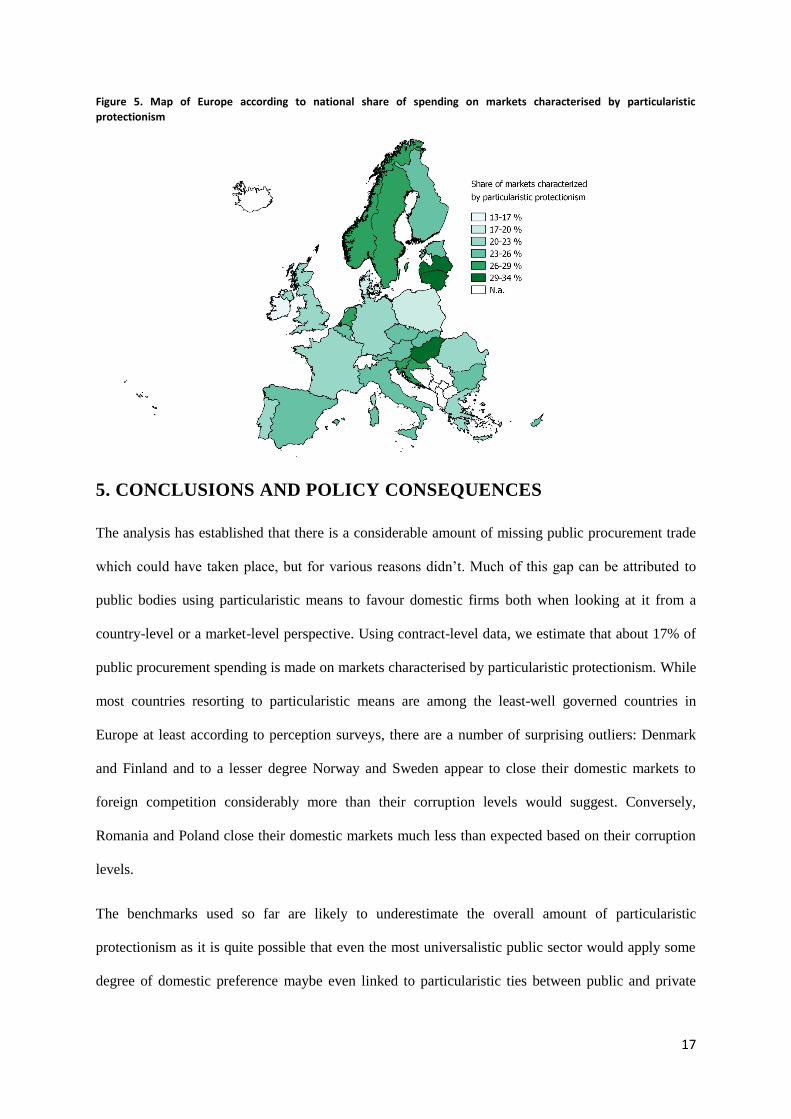
17
Figure 5. Map of Europe according to national share of spending on markets characterised by particularistic
protectionism
5. CONCLUSIONS AND POLICY CONSEQUENCES
The analysis has established that there is a considerable amount of missing public procurement trade
which could have taken place, but for various reasons didn’t. Much of this gap can be attributed to
public bodies using particularistic means to favour domestic firms both when looking at it from a
country-level or a market-level perspective. Using contract-level data, we estimate that about 17% of
public procurement spending is made on markets characterised by particularistic protectionism. While
most countries resorting to particularistic means are among the least-well governed countries in
Europe at least according to perception surveys, there are a number of surprising outliers: Denmark
and Finland and to a lesser degree Norway and Sweden appear to close their domestic markets to
foreign competition considerably more than their corruption levels would suggest. Conversely,
Romania and Poland close their domestic markets much less than expected based on their corruption
levels.
The benchmarks used so far are likely to underestimate the overall amount of particularistic
protectionism as it is quite possible that even the most universalistic public sector would apply some
degree of domestic preference maybe even linked to particularistic ties between public and private
18
actors. However, EU institutions are not bound to any national economy to the same degree as
domestic public institutions are, hence they may provide a pointer as to how much public procurement
trade could take place in the absence of domestic preferences.
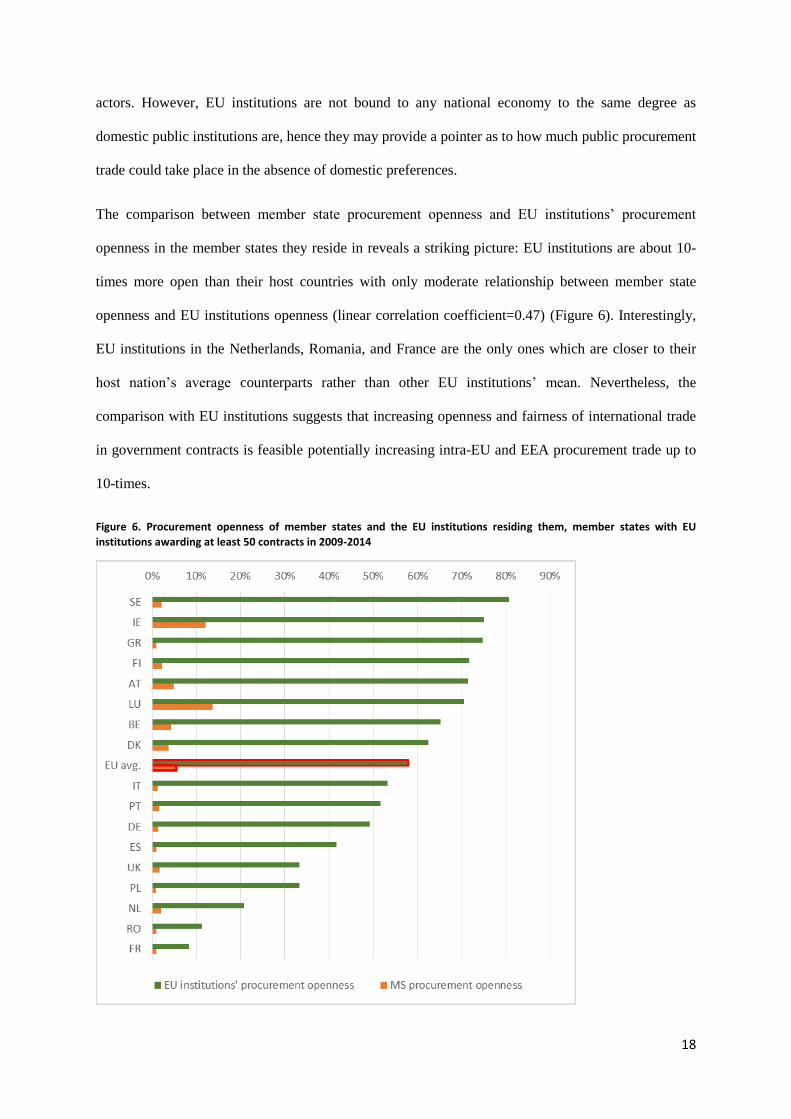
The comparison between member state procurement openness and EU institutions’ procurement
openness in the member states they reside in reveals a striking picture: EU institutions are about 10-
times more open than their host countries with only moderate relationship between member state
openness and EU institutions openness (linear correlation coefficient=0.47) (Figure 6). Interestingly,
EU institutions in the Netherlands, Romania, and France are the only ones which are closer to their
host nation’s average counterparts rather than other EU institutions’ mean. Nevertheless, the
comparison with EU institutions suggests that increasing openness and fairness of international trade
in government contracts is feasible potentially increasing intra-EU and EEA procurement trade up to
10-times.
Figure 6. Procurement openness of member states and the EU institutions residing them, member states with EU
institutions awarding at least 50 contracts in 2009-2014
19
5.1 Policy recommendations
This preliminary analysis has provided ample evidence that particularistic protectionism is substantial
and persistent in high as well as low integrity countries of Europe. This seems to be true in spite of
extensive regulations supporting open and fair trade pointing at the bending of universalistic rules at
he implementation stage, that is when administering tenders. Hence, policy reform should tackle
particularism more effectively within the existing institutional framework:
Monitor the implementation of the Public Procurement Directives on the tender-level rather
than focusing on the proofing of regulations and the institutional setup. Big Data analytical
tools offer real-time intelligence on the risk of corruption and anticompetitive behaviour
which can be made part of everyday policy making14
.
Improve member states’ remedies systems and give greater powers to the Court of Justice of
the European Union as it has been effective in striking down anti-competitive practices by
member state authorities (Fazekas & Gamir, 2015).
14
For an overview of available tools see: http://digiwhist.eu/resources/research-and-policy-papers/
20
BIBLIOGRAPHY
DG GROWTH. (2015). TED Structured Dataset (2009-2014), Tenders Electronic Daily, supplement
to the Official Journal of the European Union. Brussels.
European Commission. (2014). Public Procurement Indicators 2012. Brussels.
European Commission. (2016). Public Procurement Indicators 2014. Brussels.
Fazekas, M., & Gamir, A. F. (2015). Implementing the EU Public Procurement Directives:
Effectiveness of the European Commission and the Court of Justice of the European Union as
anticorruption actors. Berlin.
Fazekas, M., & Kocsis, G. (2015). Uncovering High-Level Corruption: Cross-National Corruption
Proxies Using Government Contracting Data (No. GTI-WP/2015:02). Budapest.
Mungiu-Pippidi, A. (2015). The Quest for Good Governance. How Societies Develop Control of
Corruption. Cambridge, UK: Cambridge University Press.
North, D. C., Wallis, J. J., & Weingast, B. R. (2009). Violence and Social Orders. A Conceptual
Framework for Interpreting Recorded Human History. Cambridge, UK: Cambridge University
Press.
Rothstein, B., & Teorell, J. (2008). What Is Quality of Government? A Theory of Impartial
Government Institutions. Governance, 21(2), 165–190.
21
APPENDIX A – IDENTIFYING THE OPTIMAL CLUSTERS
Table 4. Calinski/Harabasz pseudo-F measure of optimal cluster numbers
Number of clusters
Calinski/Harabasz pseudo-F
2 6878.03
3 12726.8
4 8798.04
5 7378.79
6 6137.32
7 5237.16
8 5471.67
9 4936.79
10 4396.97
11 5199.94
12 5257.52
13 5014.21
14 4629.75
15 4309.09
Table 5. Duda/Hart measures of optimal cluster numbers
Duda/Hart
Number of clusters
Je(2)/Je(1) pseudo T-squared
1 0.5442 6878.03
2 0.4066 11033.35
3 0.951 304.37
4 0.4847 690.97
5 0.9489 316.74
6 0.4077 241.14
7 0.5617 1284.52
8 0.6256 288.45
9 0.527 29.62
10 0.7075 2408.06
11 0.5529 912.11
12 0.6542 272.73
13 0.8725 4.24
14 0.6004 25.29
15 0.4148 177.73
22
Figure 7. Distribution of markets according to cluster forming dimensions and cluster membership, markets with more
than 5 contracts awarded in 2009-2014
Note: missing openness is rescaled to [-1;+1] interval in order to make it fully commensurate with
CRI differences.


![A Universalistic[1]](https://img.pdfslide.net/doc/110x75/553d1bb14a7959842a8b4c0e/a-universalistic1.jpg)
