Embed Size (px)
Citation preview
UNIVERSIDAD COMPLUTENSE DE MADRID
INSTITUTO UNIVERSITARIO DE INVESTIGACIÓN
ORTEGA Y GASSET
Programa de Doctorado:
Doctorado en Integración Económica y Monetaria de Europa
Título de la Tesis Doctoral:
“El mercado español de renta variable (2000-2014): hechos estilizados.”
“The Spanish equity market (2000-2014): stylized facts.”
Doctorando:
José Antonio Pérez Rodríguez
Director de la Tesis:
Wayne Sandholtz, Ph. D.
University of Southern California, USA
Madrid, 2015

THESIS: The Spanish equity market (2000-2014): stylized facts.
José Antonio Pérez Rodríguez (Instituto Universitario de Investigación Ortega y Gasset. Universidad Complutense de Madrid). 2
THESIS: The Spanish equity market (2000-2014): stylized facts.
José Antonio Pérez Rodríguez (Instituto Universitario de Investigación Ortega y Gasset. Universidad Complutense de Madrid). 3
“Education brings freedom”
Wayne Sandholtz – José Antonio Pérez, 2015.
" – La libertad, Sancho, es uno de los más preciados dones que a los hombres dieron los cielos; con ella no pueden igualarse los tesoros que encierra la tierra ni el mar encubre: por la libertad, así como por la honra, se puede y debe aventurar la vida; y, por el contrario, el cautiverio es el mayor mal que puede venir a los hombres. Digo esto, Sancho, porque bien has visto el regalo, la abundancia que en este castillo que dejamos hemos tenido; pues en metad de aquellos banquetes sazonados y de aquellas bebidas de nieve, me parecía a mí que estaba metido entre las estrechezas de la hambre, porque no lo gozaba con la libertad que lo gozara si fueran míos; que las obligaciones de las recompensas de los beneficios y mercedes recebidas son ataduras que no dejan campear al ánimo libre. ¡Venturoso aquel a quien el cielo dio un pedazo de pan, sin que le quede obligación de agradecerlo a otro que al mismo cielo!."
"El ingenioso hidalgo Don Quijote de la Mancha"
Miguel de Cervantes Saavedra, 1605

THESIS: The Spanish equity market (2000-2014): stylized facts.
José Antonio Pérez Rodríguez (Instituto Universitario de Investigación Ortega y Gasset. Universidad Complutense de Madrid). 4
THESIS: The Spanish equity market (2000-2014): stylized facts.
José Antonio Pérez Rodríguez (Instituto Universitario de Investigación Ortega y Gasset. Universidad Complutense de Madrid). 5
GRATITUDE
I would like to thank Wayne Sandholtz, advisor and director of this thesis, for his
continuous help and wise comments since academic year 1994/1995, when I was a student at
University of California, Irvine. Also, this thesis has a lot to do with my professional
experience and background at BME (Bolsas y Mercados Españoles): my colleagues at BME
have a part of the “good side” of this thesis: thank you. On the other hand, possible gaps or
inaccuracies are of my sole responsibility.
I am also very grateful to other colleagues, students and traders at different institutions
as AFI (Analistas Financieros Internacionales), Banco de España, Barclays (London and
Madrid), BNP Paribas (London, Madrid and Paris), Banco Portugués de Investimento
(Madrid and Porto), Caixabank, CEMFI (Centro de Estudios Monetarios y Financieros), CIFF
(Centro Internacional de Formación Financiera), Citigroup (London and Madrid), Colegio de
Economistas de Aragón, Credit Suisse (London and Madrid), CUNEF (Colegio Universitario
de Estudios Financieros), Deutsche Bank (London and Madrid), FEF (Fundación de Estudios
Financieros), IEB (Instituto de Estudios Bursátiles), London School of Economics and
Political Science, Morgan Stanley (London and Madrid), Société Générale (London, Madrid,
New York and Paris), UBS (London, Madrid and Zurich), Universities of Alcalá de Henares,
Carlos III and CEU in Madrid, Bordeaux (France), British Columbia (Canada), Castilla La
Mancha, Coruña, Granada, Málaga, Oviedo, Santiago de Compostela, Umeå (Sweden),
Valencia, Vigo, Zaragoza and, of course, to “Instituto Universitario de Investigación Ortega y
Gasset” and “Universidad Complutense de Madrid”, and mostly:
Y, sobre todo, a mis hermanos y familia y, en especial:
A mi padre, Miguel, por su luz…
A mi madre, Dorotea, por su calor…
A mis hijos, Carmen y Miguel, por ser como son.
A mi esposa, Conchi, por su eterna sonrisa y apoyo.

THESIS: The Spanish equity market (2000-2014): stylized facts.
José Antonio Pérez Rodríguez (Instituto Universitario de Investigación Ortega y Gasset. Universidad Complutense de Madrid). 6
THESIS: The Spanish equity market (2000-2014): stylized facts.
José Antonio Pérez Rodríguez (Instituto Universitario de Investigación Ortega y Gasset. Universidad Complutense de Madrid). 7
INDEX
CHAPTER 1. INTRODUCTION TO THE SPANISH EQUITY MARKE T (THE
“OLD” DAYS): BRIEF HISTORY AND CHANGES BEFORE YEAR 2000. THE
EUROPEAN ENVIRONMENT (MEETING OF YEAR 1999)____________________11
1.1. European meeting of 1999 in Madrid______________________________19
1.2. Recent trends of stock exchange in Europe_________________________21
1.3. European Stock Exchanges (current structure, main rules and some key
aspects –december 2014-)__________________________________________23
1.3.1. London Stock Exchange
1.3.2. Paris Stock Exchange (Paris Bourse)
1.3.3. German Stock Exchange
1.3.4. Italian Stock Exchange
CHAPTER 2. THEORETICAL FRAMEWORK: THE SITUATION AND MAIN
FUNCTIONS OF THE EQUITY MARKET IN AN ECONOMY_______ ___________35
2.1. The nature of markets__________________________________________37
2.2. The Spanish case: institutional framework and legal environment _____41
2.2.1. The first admission to trading of shares of a company (Initial
Public Offering –IPO-) and take over bids in the Spanish case.
THESIS: The Spanish equity market (2000-2014): stylized facts.
José Antonio Pérez Rodríguez (Instituto Universitario de Investigación Ortega y Gasset. Universidad Complutense de Madrid). 8
CHAPTER 3. ANALYSIS AND EMPIRICAL EVIDENCE OF THE E VOLUTION OF
THE SPANISH EQUITY MARKET DURING YEARS 2000 TO 2014______________55
3.1. Trading phases___________________________________________________59
3.1.1. Start of the session (Opening Auction)
3.1.2. Open Market
3.1.3. End of the session (Closing Auction) 3.1.4. Trading of shares on the fixing market 3.1.5. Block Market 3.1.6. Special Operations Market 3.1.7. Trading hours
3.2. Types of orders in SIBE___________________________________________68
3.2.1. Basic types of orders in SIBE.
3.2.2. Execution conditions in Open Market.
3.2.3. Iceberg orders. 3.2.4. Validity of orders according to the stage of the market in which they are entered. 3.2.5. Combination of order types
3.3. Order validity periods_____________________________________________85
3.4. Orders modification______________________________________________86
3.5. Tick sizes_______________________________________________________87
3.6. Market members’ execution capability_______________________________88
3.7. Basic trading rules________________________________________________89 3.7.1.Open Market. Basic Trading Rules 3.7.2. Auctions. General rules for fixing the auction price
THESIS: The Spanish equity market (2000-2014): stylized facts.
José Antonio Pérez Rodríguez (Instituto Universitario de Investigación Ortega y Gasset. Universidad Complutense de Madrid). 9
3.8. Volatility auctions and price ranges________________________________116
3.8.1. Volatility Auctions 3.8.2. Static and dynamic ranges 3.8.3. Volatility auctions due to breach of static range 3.8.4. Volatility auctions due to breach of dynamic range 3.8.5. Extensions of the opening and closing auctions
3.9. Market specialists_______________________________________________137 3.10. Information dissemination_______________________________________137 3.11. Main aspects about trading mechanisms and evolution of warrants and certificates in SIBE__________________________________________________138 3.12. Main aspects about trading mechanisms and evolution of ETFs in SIBE_140 3.13. IBEX 35: the official Spanish stock exchange index__________________141
3.13.1. IBEX 35®: Main characteristics, Technical Advisory Committee and liquidity criteria.
3.13.2. The Synthetic Liquidity Measure (SLM).
3.13.3. IBEX 35®: calculation of the index (formula used and adjustment processes).
3.14. Other Spanish stock exchange indices: IBEX MEDIUM CAP®, IBEX SMALL CAP® and FTSE 4GOOD IBEX®_____________________________179
3.14.1. IBEX MEDIUM CAP® and IBEX SMALL CAP®: Main characteristics, Technical Advisory Committee and liquidity criteria. 3.14.2. FTSE 4GOOD IBEX®: Main characteristics and eligibility criteria.
CHAPTER 4. ANNEX I: ANALYSIS AND EMPIRICAL EVIDENCE OF THE
INTRODUCTION OF THE CLOSING AUCTION IN THE SPANISH EQUITY
MARKET_______________________________________________________________185
4.1. Introduction____________________________________________________187
THESIS: The Spanish equity market (2000-2014): stylized facts.
José Antonio Pérez Rodríguez (Instituto Universitario de Investigación Ortega y Gasset. Universidad Complutense de Madrid). 10
4.2. IBEX indices__________________________________________________190
4.2.1. IBEX® indices in the closing auction. 4.2.2. IBEX® indices: comparative analysis of the closing auction versus the weighted-average price system.
4.3. Behaviour of stock prices_________________________________________195
4.3.1. Price determination of stocks in the closing auction. 4.3.2. Closing price: Closing auction versus closing price through average prices (without closing auction). 4.3.3. Volatility: comparative analysis of the closing auction versus the closing through average prices (without closing auction).
4.4. Traded volumes_________________________________________________206
4.4.1. Traded volumes in the closing auction. 4.4.2. Traded volumes: comparison between the closing auction versus the average-price system
4.5. Conclusions of this empirical analysis on the closing auction____________208
4.6. Note about methodology of this empirical analysis on the closing auction_210
CHAPTER 5. CONCLUSIONS OF THE THESIS_____________________________213
CHAPTER 6. ANNEX II: STATISTICAL ANNEX____________________________219
6.1. Charts_________________________________________________________223
6.2. Graphs________________________________________________________230
CHAPTER 7. BIBLIOGRAPHY____________________________________________233
RESUMEN (Spanish)_____________________________________________________243
SUMMARY (English)_____________________________________________________251
THESIS: The Spanish equity market (2000-2014): stylized facts.
José Antonio Pérez Rodríguez (Instituto Universitario de Investigación Ortega y Gasset. Universidad Complutense de Madrid). 11
Chapter 1
INTRODUCTION TO THE SPANISH EQUITY MARKET (THE “OLD ” DAYS):
BRIEF HISTORY AND CHANGES BEFORE YEAR 2000. THE EUROPEAN
ENVIRONMENT (MEETING OF YEAR 1999)

THESIS: The Spanish equity market (2000-2014): stylized facts.
José Antonio Pérez Rodríguez (Instituto Universitario de Investigación Ortega y Gasset. Universidad Complutense de Madrid). 12
THESIS: The Spanish equity market (2000-2014): stylized facts.
José Antonio Pérez Rodríguez (Instituto Universitario de Investigación Ortega y Gasset. Universidad Complutense de Madrid). 13
1. INTRODUCTION TO THE SPANISH EQUITY MARKET (THE “ OLD” DAYS):
BRIEF HISTORY AND CHANGES BEFORE YEAR 2000. THE EUROPEAN
ENVIRONMENT (MEETING OF YEAR 1999).
The historical background of the Spanish equity market is based on the out-cry circles1
whose start took place in Madrid (year 1831), Barcelona (year 1915), Bilbao (year 1890) and
Valencia (year 1970). According to that trading method, during a time schedule extended
from 10:00 a.m. to 12:00 p.m. from Monday to Friday, in short-periods of 10 minutes (shares
were grouped by economic sectors), buyers and sellers physically met in an “out-cry trading
circle”, where prices and quantities of shares were “shouted” by the traders. If agreement was
reached about a specific trade of shares, the word “done”2 was shouted by one employer of
the stock exchange. Prior to the subsequent reforms, the stock market was characterized as
being highly fragmented: trading in shares was isolated and unconnected among the four
trading places. Given that within Spain there were four different trading places (Stock
Exchanges Governing Bodies of Madrid, Barcelona, Bilbao and Valencia), therefore it existed
the possibility of buying one specific stock in one trading place (i.e.: Madrid) and selling the
same number of shares of the same stock at a slightly higher price in another trading place
(i.e.: Barcelona). Indeed, these arbitrage possibilities were given since it existed not only one
trading place but four of them. Afterwards, this trade was mechanized and experimented a
process of modernization.
Therefore, from the institutional point of view, as previously mentioned, in Spain we
had four Stock Exchange Governing Bodies: Madrid, Barcelona, Bilbao and Valencia3. Also,
still from the institutional point of view, trading were in the hands of the old “Stock Exchange
Agents” 4, which would disappear in the later years, and would lead to the appearance of the
modern market members (intermediaries), whose role would be much more “democratized”
1 Original in spanish: “Corros de contratación”.
2 Original in spanish: “Hecho”.
3 The reason of having four stock exchanges in Spain has to do with historical reasons given the regional structure of the
country.
4 Original in spanish: “Agentes de Cambio y Bolsa”.
THESIS: The Spanish equity market (2000-2014): stylized facts.
José Antonio Pérez Rodríguez (Instituto Universitario de Investigación Ortega y Gasset. Universidad Complutense de Madrid). 14
than the old “Stock Exchange Agents”. As we will see, along history, this “old pattern” would
change in a significant way not only from the institutional point of view but also from the
market-functioning perspective.
The first electronic platform used in Spain for the equity market was CATS (Computer
Assisted Trading System), imported from Toronto Stock Exchange (Canada) and today
Toronto Stock Exchange is based on this electronic platform. The first five companies whose
shares were quoting in CATS the first day (on April 24th., 1989) were “Altos Hornos”, “Motor
Ibérica”, “Nueva Montaña Quijano”, “Papelera Española” and “Tubacex”. These five
companies had the “courage to jump” to an electronic market (given the habit of quoting in
out-cry circles) in the sense that, at that time, it was not very clear if this system was going to
succeed. Of course, nowadays it is natural to think that technology must play a very important
role in the functioning of a market but on 1989 was not so clear. In fact, the Spanish market
was one of the first markets to take this important step which would change the trend of the
market in the near future.
Later, on november 2nd., 1995, the Spanish Stock Exchange Interconnection System
(SIBE hereinafter) was established5 as the main electronic platform of the Spanish equity
market and was one of the first initiatives to link different stock exchanges located in different
geographical areas (although regional ones). In fact, at some point, the Spanish stock
exchange has been addressed for providing advice concerning some mergers and agreements
of interconnection among international stock exchanges. SIBE is currently the electronic
market for equities in Spain.
It is important to mention here that, although we can say that SIBE “was born” in
1995, has developed an important number of modifications along time and, in this sense, we
can not say that it has remained static6.
5 In fact, along time there were different phases of introduction of SIBE as an electronic platform in Spain but we can say that
in November 1995 this electronic system was definitely established with the quotation of the 35 components of IBEX 35, the official index of the Spanish equity market.
6 The whole list of modifications of SIBE can be found in Annex 1 of this document.
THESIS: The Spanish equity market (2000-2014): stylized facts.
José Antonio Pérez Rodríguez (Instituto Universitario de Investigación Ortega y Gasset. Universidad Complutense de Madrid). 15
Besides, the dynamics and main differences of an electronic order book compared to
an out-cry circle (a more manual system) are very straightforward and can be summarized as
follows:
a. A single order book for every stock in Spain, which means that the arbitrage
opportunities arised with the out-cry circles and which we did explain before are
not possible anymore. A single order book means a single price at any moment for
a specific stock in a particular moment in time.
b. More rapidity in the execution of orders and in the process of sending these orders
to the central computer.
c. More transparency, allowing market participants to know the best bid-ask prices of
each security in real-time. In this sense, as the market microstructure theory
asserts, “market transparency refers to the ability of market participants to observe
the information in the trading process”.7 Certain processes of asymmetry of
information, typical of the out-cry circles at the time, are diminished in an
electronic system.
d. Trading rules equally available for all market participants, which means that all
market participants accurately know all trading rules, being available for all market
participants regardless of their size or characteristics (retail, institutional, etc.).
e. More time of continuous trading. As we have mentioned before, out-cry circles
time pattern followed the time-schedule from 10:00 a.m. to 12:00 p.m. However,
with the electronic system, more than eight hours of continuous trading is
implemented every trading day.
Besides, the main changes experimented by SIBE since its creation are the following,
and will be developed later on. Here are only listed:
7 “Despite the simplicity of this definition, the issue of transparency is remarkably complex”; O’Hara (1995): Market
Microstructure Theory.
THESIS: The Spanish equity market (2000-2014): stylized facts.
José Antonio Pérez Rodríguez (Instituto Universitario de Investigación Ortega y Gasset. Universidad Complutense de Madrid). 16
• January 14, 1992: IBEX 35®: the main index of the Spanish equity market was
born.
• February 16, 1993: validation on SIBE of the execution of stock option
contracts of MEFF (Spanish derivatives official secondary market).
• July 1, 1993: disappearance of the hedging of buy and sell volumes in the
fixing of the opening price.
• November 2, 1994: trading unit for shares as well as subscription rights
changes to 1 share, being the first market in the world that functions with a
unitary unit for stocks. Disappearance of the “rests” market8.
• November 2, 1995: it finishes the implementation of SIBE (Spanish Stock
Exchange Interconnection System).
• July 1, 1998: start of Fixing segment (segment reserved for certain shares).
• November 4, 1998: introduction of the Blocks market.
• January 4, 1999: start of trading and quoting in euros (from the previous
Spanish domestic currency9).
• December 1, 1999: introduction of trading of Latibex (the Latin-american
stock market quoting in euros in SIBE).
8 Original in Spanish language: “Mercado de picos”. These “picos” were rests of the complete lot-sizes of shares admitted to
quoting in the old system named CATS. These rests (a small number of shares) usually quoted at lower prices than the
standard price at that moment of the complete lot-size. Trading of these rests market represented between 2% and 3% of the
trading volume of the CATS system.
9 The domestic currency in Spain at the time was the “peseta”.
THESIS: The Spanish equity market (2000-2014): stylized facts.
José Antonio Pérez Rodríguez (Instituto Universitario de Investigación Ortega y Gasset. Universidad Complutense de Madrid). 17
• April 10, 2000: launching of the “New Market”10 (stocks of technological
companies with high potential of growth).
• June 1, 2000: phase 1 of SIBE modifications: introduction of closing auction,
market orders and new maximum validity of orders up to 90 calendar days.
• May 14, 2001: phase 2 of SIBE modifications: introduction of a new
management in price-variations of stocks through the static and dynamic
ranges and volatility auctions.
• September 17, 2001: phase 3 of SIBE modifications: SIBE opening to a new
way of introduction of automatic orders (introduction of orders through
external homologated applications).
• November 11, 2002: launching of the segment for Warrants, Certificates and
Other Products.
• July 1, 2005: launching of IBEX MEDIUM CAP® and IBEX SMALL CAP®
indices, within the wider Spanish stock exchange initiative of providing higher
visibility to medium-sized and small-sized capitalization companies.
• May 29, 2006: launching of the “Mercado Alternativo Bursátil (MAB)”.
• July 20, 2006: starts quoting the first exchange traded fund (ETF) in SIBE.
• January 25, 2007: the Spanish stock exchange (BME) triples the SIBE
technological capacity in order to face the growth and speed of the market.
• November 15, 2007: the Spanish stock exchange (BME) reorganizes the
trading segments of the equity market, and offers the companies that
compound the “New Market” the possibility to join the general trading
10 Original in Spanish language: “Nuevo Mercado”.
THESIS: The Spanish equity market (2000-2014): stylized facts.
José Antonio Pérez Rodríguez (Instituto Universitario de Investigación Ortega y Gasset. Universidad Complutense de Madrid). 18
segment. End of calculation and dissemination of the "IBEX Nuevo
Mercado®”.
• March 3, 2009: the Spanish stock exchange (BME) launches a new trading
electronic platform for Warrants, Certificates and Other Products, named
“SMART warrants”.
• April 30, 2009: the stocks of the Spanish market can be traded up to 4 decimal
places.
• July 9, 2009: last trading session of the out-cry circles celebrated in the four
stock exchange places in Spain (Madrid, Barcelona, Bilbao and Valencia).
• July 15, 2009: launching of the segment “growing companies”11 within the
“Mercado Alternativo Bursátil (MAB)”.
• September 30, 2009: the Spanish stock exchange launches the index “IBEX
35® Dividend Impact”12, an index that reflects the dividend payments of the
companies belonging to the official IBEX 35®, expressed in index points.
• January 20, 2010: starts trading the first series of structured bonds in the
platform SIBE Smart.
• April 22, 2010: launching of 5 new indices based on IBEX 35® index: IBEX
35® Net return, IBEX 35® Double Leverage, IBEX 35® Triple Leverage,
IBEX 35® Double Short and IBEX 35® Triple Short.
• June 16, 2010: launching of the first 5 issues of “Bonus” and “Bonus Cap”
products in SIBE Smart platform.
11 Original in Spanish: “Empresas en expansión”.
12 Original in Spanish: “IBEX 35® Impacto Dividendo”.
THESIS: The Spanish equity market (2000-2014): stylized facts.
José Antonio Pérez Rodríguez (Instituto Universitario de Investigación Ortega y Gasset. Universidad Complutense de Madrid). 19
• April 16, 2012: the Spanish stock exchange finishes the migration of the
trading platform “SIBE Smart”13, which unifies trading of shares, ETFs,
warrants and other investment products under the same electronic system. This
new SIBE multiplies the transaction execution capacity, providing the Spanish
equity market a large growth potential for the new and future needs.
1.1. European meeting of 1999 in Madrid:
One of the main historical moments from the institutional point of view is the
international meeting (held on December 1999 in Madrid) among eight European stock
exchanges (Amsterdam, Brussels, Frankfurt, London, Madrid, Milan, Paris and Zurich) trying
to reach the named “Alliance of European stock exchanges”, whose main agreements at the
time were taken in two different steps:
1) Harmonization of market models in Europe, which means that the trading
mechanisms, among these stock exchanges, should converge and use the same (or
very similar) trading elements14 from the point of view of the microstructure of the
market. This step was reached through the following three phases:
a. First phase (June 1, 2000): use of market orders, order validity up to 90
calendar days and introduction of the closing auction at the end of the
session.
b. Second phase (May 14, 2001): volatility auctions, static and dynamic
ranges.
c. Third phase (September 17, 2001): automatic orders.
13 The name of the previous system was “SIBE Windows Terminal”.
14 Among this elements, to be explained and detailed later on in this document, are the following: a) Closing auction, b)
Market orders, c) Volatility auctions, static and dynamic ranges and d) Automatic orders.
THESIS: The Spanish equity market (2000-2014): stylized facts.
José Antonio Pérez Rodríguez (Instituto Universitario de Investigación Ortega y Gasset. Universidad Complutense de Madrid). 20
2) Merger of these eight European stock exchanges achieving a single pan-European
stock exchange which would make national stock exchanges disappear. This
second step finally did not occur due to the fact that, after this agreement among
eight stock exchanges, two of them (London Stock Exchanges and Deutsche
Börse)15 tried to merge, finally with no success. The fact that two stock exchanges
(belonging to the group of eight) started conversations about a potential bilateral
agreement lead to a break of the two-step agreement reached among the eight
stock exchanges participating in the initial meeting in Madrid.
These works of year 1999 were named “Alliance of European stock exchanges” and,
as we mentioned, finished with no success, given that the final alliance never took place.
However, and even nowadays, “the integration of stock markets can be considered as one of
the most significant changes in the global financial market and an evidence of the
globalization that the world economy is leaving. The old fashioned pictures of stock
exchanges as open outcry markets is not representing markets anymore. The demutualization
of stock exchanges removed the cultural, economic and regulatory barriers to the development
of new companies” 16. In fact, vast research confirms the complexity of the integration
process, and how it depends on different macroeconomic, structural, cultural-geographical
and operative forces.
In the modern corporate groups of stock exchange operators, “the high number of
stakeholders involved in this integration process made the development of the market
structure unclear and the drivers of its evolution unknown”17. Here arises the controversy of
what it is considered a “stock exchange integration”.
15 This project of merger between London Stock Exchange and Deutsche Börse was known as the project “iX” (an initial
participation of 50% of each stock exchange –London Stock Exchange and Deutsche Börse- was agreed) which, as we have mentioned, was not successful and broke very soon after the initial intentions.
16 Dorodnykh, E. (2013): “What drives stock exchange integration?”. International Journal of Economic Sciences and
Applied Research 6 (2): 47-79.
17 Dorodnykh, E. (2013): “What drives stock exchange integration?”. International Journal of Economic Sciences and
Applied Research 6 (2): 47-79.
THESIS: The Spanish equity market (2000-2014): stylized facts.
José Antonio Pérez Rodríguez (Instituto Universitario de Investigación Ortega y Gasset. Universidad Complutense de Madrid). 21
There is a need for a clear definition of stock exchange integration. A broad definition
will be considered in this thesis, in accordance to Baele et al. (2004) and Schmiedel and
Schoenenberger (2005): the market for a given set of financial instruments and/or services is
fully integrated if all potential market participants with the same relevant characteristics (1)
face the same set of rules when they decide to deal with those financial instruments and/or
services, (2) have equal access to the above-mentioned set of financial instruments and/or
services, and (3) are treated equally when they are active in the market.
Several mergers like NYSE Euronext (2007), Nasdaq-OMX (2008), and even the
failed attempts of integration represented by TMX Group and London Stock Exchange
(2011), Singapore Stock Exchange and Australian Stock Exchange (2011), and NYSE
Euronext and Deutsche Börse (2012) are several examples showing that these processes of
stock exchange integration need to be taken into account when analyzing the dynamic sector
of international stock exchange operators.
1.2. Recent trends of stock exchange in Europe:
After 1999, several trends can be distinguished among a large part of the world stock
exchanges, and specially in Europe. In fact, “deregulation, globalization, and technological
developments have altered the business strategies of stock exchanges around the world. Many
scholars confirm the increasing convergence in international stock markets in recent years
(Karoli and Stulz, 2001; Eun and Lee, 2006; Mishkin, 2007; Christos and Nektarios, 2009).
The traditional role played by stock exchanges as self-regulatory, controlled and governed by
members or governments is being questioned due to the recent spectacular advances in
information technology, globalization, growing competition, which in turn has put more
pressure on stock markets to change their governance structure in order to be more cost
efficient, transparent and widely accountable”18. Therefore, although different patterns can be
found, the fact is that stock exchanges around the world have experienced a large degree of
18 Dorodnykh, E (2013): “What drives stock exchange integration?”. International Journal of Economic Sciences and
Applied Research 6 (2): 47-79.
THESIS: The Spanish equity market (2000-2014): stylized facts.
José Antonio Pérez Rodríguez (Instituto Universitario de Investigación Ortega y Gasset. Universidad Complutense de Madrid). 22
modernization in terms of the technology used, scope of financial products quoted as well as
different forms of integration.
Indeed, different ways and patterns of integration can be presented in the evolving
arena of the world stock exchanges. The form chosen by the Spanish stock exchange in 2002,
the focused case in this thesis, is the so-called “vertical silo”, in which all involved processes
linked to the markets are integrated in a single corporate structure19. These processes are
trading, clearing and settlement, technology, dissemination of information and collateral
activities as research, financial training, contingent services, international relations,
consulting, etc20.
One of the first institutional movements of world stock exchanges during the
beginning of the twenty-first century was Demutualization, which “in the strictest sense,
refers to the change in legal status of the exchange from a mutual association with one vote
per member (and possibly consensus-based decision making), into a company limited by
shares, with one vote per share (with majority-based decision making). Demutualization
makes sense if it induces a change in the exchange’s objective from managing the interests of
a closed based organization with a central focus on providing services for the benefit
primarily of the members/brokers and keeping costs and investments limited to financing
agreed by members, into a company set up with the objective of maximizing the value of the
equity shares by focusing on generating profits from servicing the demands of their customers
(brokers and investors) in a competitive manner”21.
19 This corporate structure in Spain is named BME (Bolsas y Mercados Españoles, Sociedad Holding de Mercados y
Sistemas Financieros, S.A.). This financial holding was born in february 2002 from previous separate companies. This single holding (which aggregates all markets, and their clearing and settlement services) is publicly listed in 2006 and belongs to the official index (IBEX 35) since 2007.
20 These activities are managed through the following specialized companies, all of them belonging to the financial Group
BME: research (Research Services BME), financial training (BME Institute), contingent services (BME Innova), international relations (BME International) and consulting (BME Consulting).
21 Asian Development Bank (2002): “Demutualization of stock exchanges: problems, solutions and case studies”, edited by
Shamshad Akhtar –Director Governance, Finance and Trade Division, East and Central Asia Department, Asian Development Bank-.
THESIS: The Spanish equity market (2000-2014): stylized facts.
José Antonio Pérez Rodríguez (Instituto Universitario de Investigación Ortega y Gasset. Universidad Complutense de Madrid). 23
Demutualization took place in a large number of stock exchanges since 1999, and this
trend was not only the case of Europe.
A second aspect to be considered when analyzing the current situation of stock
exchanges in Europe has to do with agreements, alliances or, in its most complete form,
mergers.
A third important aspect completing the strategy of traditional stocks exchanges along
time towards the new competitive and demanding environment was the diversification of
products.
Historically, stock exchanges offered shares as the main product to be quoted and
traded, either through outcry circles or through modern electronic markets. Besides,
derivatives (futures and options) and bonds could also be found during the twenty century. If
shares was the key element of stock exchanges in the past (before year 2000), in the first
fifteen years of the twenty first century, stock exchanges are large financial conglomerates
which offer a wide range of financial products ranging from the historical shares and
subscription rights to a more complex and wider set of products including warrants,
certificates, exchange traded funds, a wide variety of indices, only to name products from the
perspective of the equity unit of stock exchanges22.
1.3. European Stock Exchanges (current structure, main rules and some key aspects –
december 2014-):
1.3.1. London Stock Exchange:
London Stock Exchange was formally born in 1801 and currently is situated as an
international and diversified stock exchange operator. Previously, in 1698, John Castaing
starts to issue at “Jonathan’s Coffee House” a list of prices of equities and commodities
22 See table in the Annex with the number of products quoted in the Spanish Stock Exchange along time.
THESIS: The Spanish equity market (2000-2014): stylized facts.
José Antonio Pérez Rodríguez (Instituto Universitario de Investigación Ortega y Gasset. Universidad Complutense de Madrid). 24
named “The Course of the Exchange and other things”. It is the first evidence of organized
trading in London.
London Stock Exchange Group currently offers a wide variety of international
products as shares, bonds and derivatives and this financial Group includes London Stock
Exchange, Italian Stock Exchange (Borsa italiana), MTS (the leader European market of fixed
income) as well as the pan-European trading venue of shares Turquoise.
A large and growing activity of London Stock Exchange Group are the services linked
to post-trading and risk management. In this sense, this Group operates CC&G, CCP &
Monte Titoli (located in Rome). This Group is also significant owner of the global and
multilateral CCP named LCH.Clearnet. London Stock Exchange Group offers an extensive
quantity of real-time data, including Sedol, Unavista, Proquote and RNS as well as access to
more than 200.000 international stocks, bonds and indices of alternative assets through its
index provider leader FTSE.
Headquarters of London Stock Exchange Group are located in London, with
significant activities in Italy, France, North America and Sri Lanka. London Stock Exchange
Group employs 2800 people. London Stock Exchange Group also develops software for the
capital markets and its platforms. On the other hand, more than 30 organizations and stock
exchange operators in the world uses its technology of trading, surveillance and post-trading
named MilleniumIT.
Main Market is the flagship of the London Stock Exchange: the listed companies in
this market are big companies and these issuers also are admitted in the UK Listing
Authority’s Official List. Basically, there are two ways to be admitted to the market:
• Premium Listing: it is open to commercial or investment companies which wants to
issue their shares. The issuers of this segment are companies with a high level of
standards about listing and corporate governance. Also, these companies have more
transparency and enjoys investors confidence.
THESIS: The Spanish equity market (2000-2014): stylized facts.
José Antonio Pérez Rodríguez (Instituto Universitario de Investigación Ortega y Gasset. Universidad Complutense de Madrid). 25
• Standard Listing: they are usually commercial companies that want to issue their
shares, but also debt, derivatives and warrants. This segment allows issuers to accede
the Main Market fulfilling the minimum harmonized standards of the European Union.
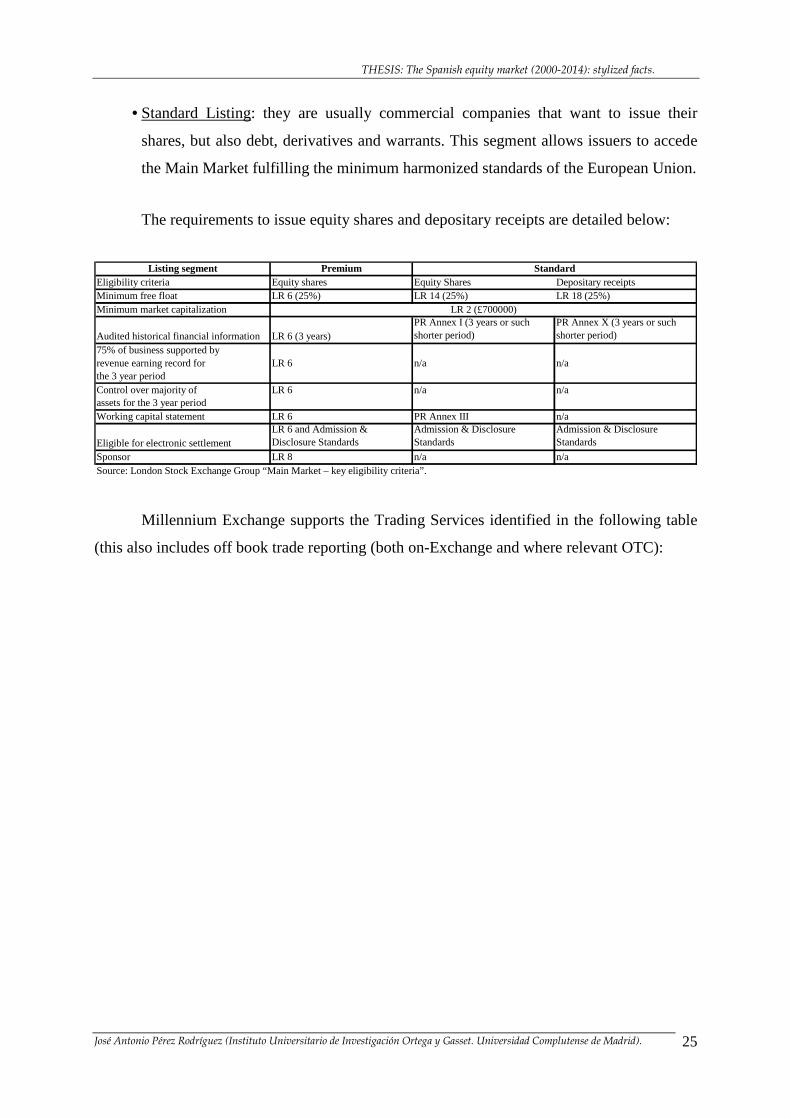
The requirements to issue equity shares and depositary receipts are detailed below:
Listing segment PremiumEligibility criteria Equity shares Equity Shares Depositary receiptsMinimum free float LR 6 (25%) LR 14 (25%) LR 18 (25%)Minimum market capitalization
Audited historical financial information LR 6 (3 years)PR Annex I (3 years or such shorter period)
PR Annex X (3 years or such shorter period)
75% of business supported byrevenue earning record for LR 6 n/a n/athe 3 year periodControl over majority of LR 6 n/a n/aassets for the 3 year periodWorking capital statement LR 6 PR Annex III n/a
Eligible for electronic settlementLR 6 and Admission & Disclosure Standards
Admission & Disclosure Standards
Admission & Disclosure Standards
Sponsor LR 8 n/a n/aSource: London Stock Exchange Group “Main Market – key eligibility criteria”.
Standard
LR 2 (£700000)
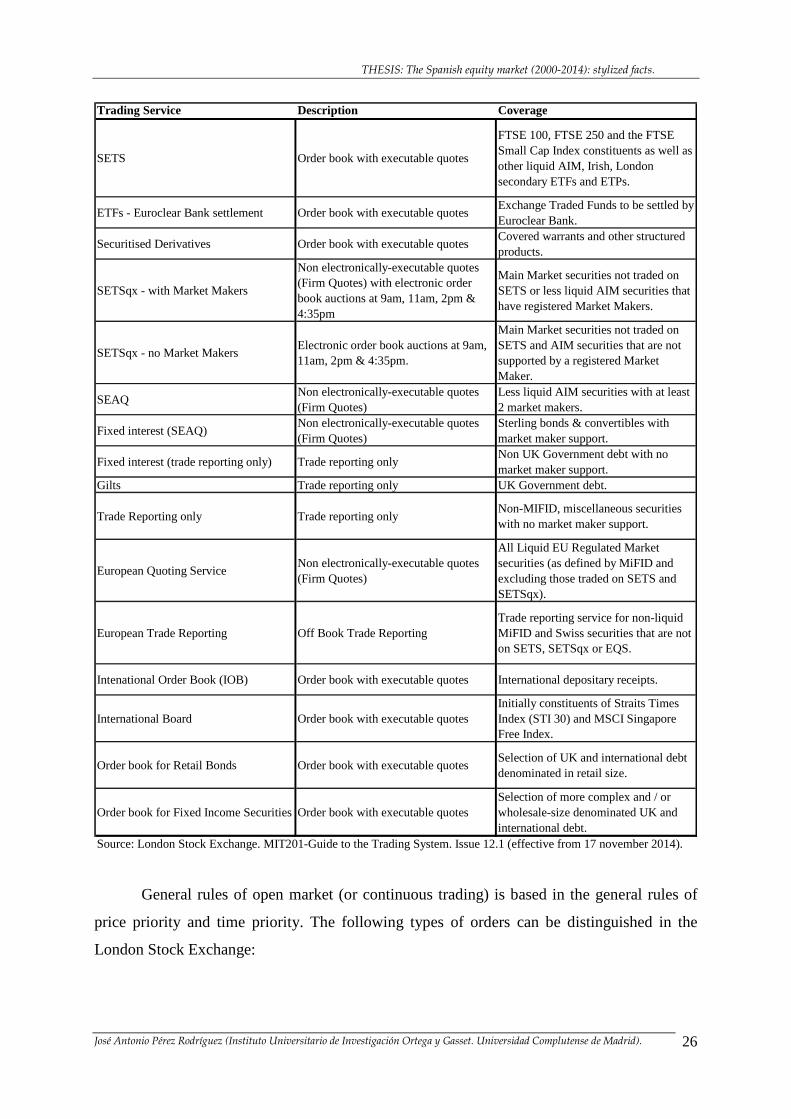
Millennium Exchange supports the Trading Services identified in the following table
(this also includes off book trade reporting (both on-Exchange and where relevant OTC):
THESIS: The Spanish equity market (2000-2014): stylized facts.
José Antonio Pérez Rodríguez (Instituto Universitario de Investigación Ortega y Gasset. Universidad Complutense de Madrid). 26
Trading Service Description Coverage
SETS Order book with executable quotes
FTSE 100, FTSE 250 and the FTSE Small Cap Index constituents as well as other liquid AIM, Irish, London secondary ETFs and ETPs.
ETFs - Euroclear Bank settlement Order book with executable quotesExchange Traded Funds to be settled by Euroclear Bank.
Securitised Derivatives Order book with executable quotesCovered warrants and other structured products.
SETSqx - with Market Makers
Non electronically-executable quotes (Firm Quotes) with electronic order book auctions at 9am, 11am, 2pm & 4:35pm
Main Market securities not traded on SETS or less liquid AIM securities that have registered Market Makers.
SETSqx - no Market MakersElectronic order book auctions at 9am, 11am, 2pm & 4:35pm.
Main Market securities not traded on SETS and AIM securities that are not supported by a registered Market Maker.
SEAQNon electronically-executable quotes (Firm Quotes)
Less liquid AIM securities with at least 2 market makers.
Fixed interest (SEAQ)Non electronically-executable quotes (Firm Quotes)
Sterling bonds & convertibles with market maker support.
Fixed interest (trade reporting only) Trade reporting onlyNon UK Government debt with no market maker support.
Gilts Trade reporting only UK Government debt.
Trade Reporting only Trade reporting onlyNon-MIFID, miscellaneous securities with no market maker support.
European Quoting ServiceNon electronically-executable quotes (Firm Quotes)
All Liquid EU Regulated Market securities (as defined by MiFID and excluding those traded on SETS and SETSqx).
European Trade Reporting Off Book Trade ReportingTrade reporting service for non-liquid MiFID and Swiss securities that are not on SETS, SETSqx or EQS.
Intenational Order Book (IOB) Order book with executable quotes International depositary receipts.
International Board Order book with executable quotesInitially constituents of Straits Times Index (STI 30) and MSCI Singapore Free Index.
Order book for Retail Bonds Order book with executable quotesSelection of UK and international debt denominated in retail size.
Order book for Fixed Income Securities Order book with executable quotesSelection of more complex and / or wholesale-size denominated UK and international debt.
Source: London Stock Exchange. MIT201-Guide to the Trading System. Issue 12.1 (effective from 17 november 2014).
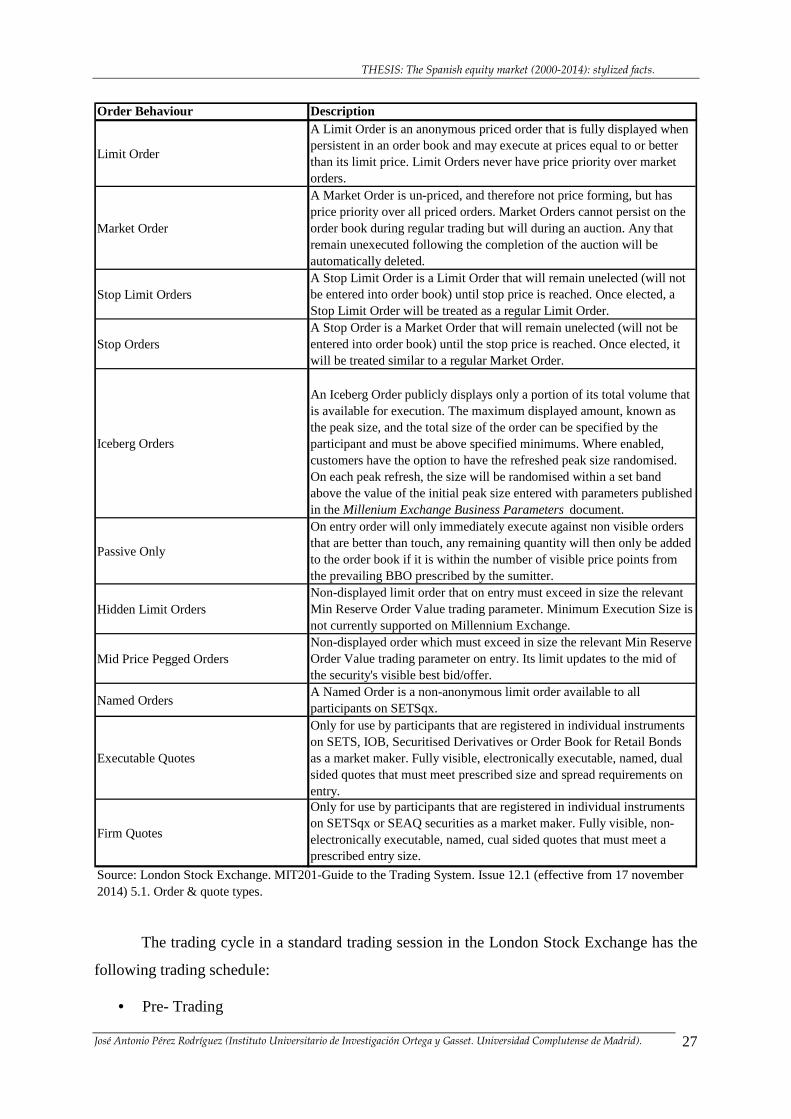
General rules of open market (or continuous trading) is based in the general rules of
price priority and time priority. The following types of orders can be distinguished in the
London Stock Exchange:
THESIS: The Spanish equity market (2000-2014): stylized facts.
José Antonio Pérez Rodríguez (Instituto Universitario de Investigación Ortega y Gasset. Universidad Complutense de Madrid). 27
Order Behaviour Description
Limit Order
A Limit Order is an anonymous priced order that is fully displayed when persistent in an order book and may execute at prices equal to or better than its limit price. Limit Orders never have price priority over market orders.
Market Order
A Market Order is un-priced, and therefore not price forming, but has price priority over all priced orders. Market Orders cannot persist on the order book during regular trading but will during an auction. Any that remain unexecuted following the completion of the auction will be automatically deleted.
Stop Limit OrdersA Stop Limit Order is a Limit Order that will remain unelected (will not be entered into order book) until stop price is reached. Once elected, a Stop Limit Order will be treated as a regular Limit Order.
Stop OrdersA Stop Order is a Market Order that will remain unelected (will not be entered into order book) until the stop price is reached. Once elected, it will be treated similar to a regular Market Order.
Iceberg Orders
An Iceberg Order publicly displays only a portion of its total volume that is available for execution. The maximum displayed amount, known as the peak size, and the total size of the order can be specified by the participant and must be above specified minimums. Where enabled, customers have the option to have the refreshed peak size randomised. On each peak refresh, the size will be randomised within a set band above the value of the initial peak size entered with parameters published in the Millenium Exchange Business Parameters document.
Passive Only
On entry order will only immediately execute against non visible orders that are better than touch, any remaining quantity will then only be added to the order book if it is within the number of visible price points from the prevailing BBO prescribed by the sumitter.
Hidden Limit OrdersNon-displayed limit order that on entry must exceed in size the relevant Min Reserve Order Value trading parameter. Minimum Execution Size is not currently supported on Millennium Exchange.
Mid Price Pegged OrdersNon-displayed order which must exceed in size the relevant Min Reserve Order Value trading parameter on entry. Its limit updates to the mid of the security's visible best bid/offer.
Named OrdersA Named Order is a non-anonymous limit order available to all participants on SETSqx.
Executable Quotes
Only for use by participants that are registered in individual instruments on SETS, IOB, Securitised Derivatives or Order Book for Retail Bonds as a market maker. Fully visible, electronically executable, named, dual sided quotes that must meet prescribed size and spread requirements on entry.
Firm Quotes
Only for use by participants that are registered in individual instruments on SETSqx or SEAQ securities as a market maker. Fully visible, non-electronically executable, named, cual sided quotes that must meet a prescribed entry size.
Source: London Stock Exchange. MIT201-Guide to the Trading System. Issue 12.1 (effective from 17 november 2014) 5.1. Order & quote types.
The trading cycle in a standard trading session in the London Stock Exchange has the
following trading schedule:
• Pre- Trading
THESIS: The Spanish equity market (2000-2014): stylized facts.
José Antonio Pérez Rodríguez (Instituto Universitario de Investigación Ortega y Gasset. Universidad Complutense de Madrid). 28
• Opening / First Auction Call
• Regular Trading
• Pre-Mandatory (quoting)
• Mandatory (quoting)
• Post-Mandatory (quoting)
• EDSP (auction call)
• Close (auction call)
• Closing Price Publication Session (CPP)
• Closing Price Crossing Session (CPX)
• Periodic (auction call)
• Post Close
Besides, for FTSE 100 index components, an expiry auction is developed all third
Fridays of each month, and for those FTSE 250 index components, an expiry auction is
developed each third Friday of the following months: March, June, September and December.
Finally, in this brief summary of the London Stock Exchange market rules, it should
be stressed that the equilibrium price of an auction is computed similarly to the Spanish case
but with a main difference (applicable after the fourth rule): “if there is no reference price, the
price chosen will be the lowest price” (7.2.3. Guide to the Trading System –effective from 17
November 2014-).
1.3.2. Paris Stock Exchange (Paris Bourse):
The Paris Stock Exchange (Paris Bourse) was officially recognized in 1801, and the
number of exchange agents (60 in 1786) was increased to 71 in 1801. Paris Stock Exchange is
merged with the family of Stock Exchanges of Euronext as Euronext Paris in year 2000.
Euronext Paris is supervised by the French Monetary and Financial Code, under which
the French Finance Minister has the authority of confer or revoke the “regulated market”
status with the recommendation of the Financial Market Authority (Autorité des Marches
Financiers (AMF)) with the opinion of the French Bank Commission (Commission Bancaire).
THESIS: The Spanish equity market (2000-2014): stylized facts.
José Antonio Pérez Rodríguez (Instituto Universitario de Investigación Ortega y Gasset. Universidad Complutense de Madrid). 29
The main index of Euronext Paris is CAC 40, which contains 40 companies selected
among those of highest capitalization and most liquid. It is the main reference of Euronext
Paris, and its evolution is very correlated with the French stock exchange market, being also
an underlying asset for futures and options.
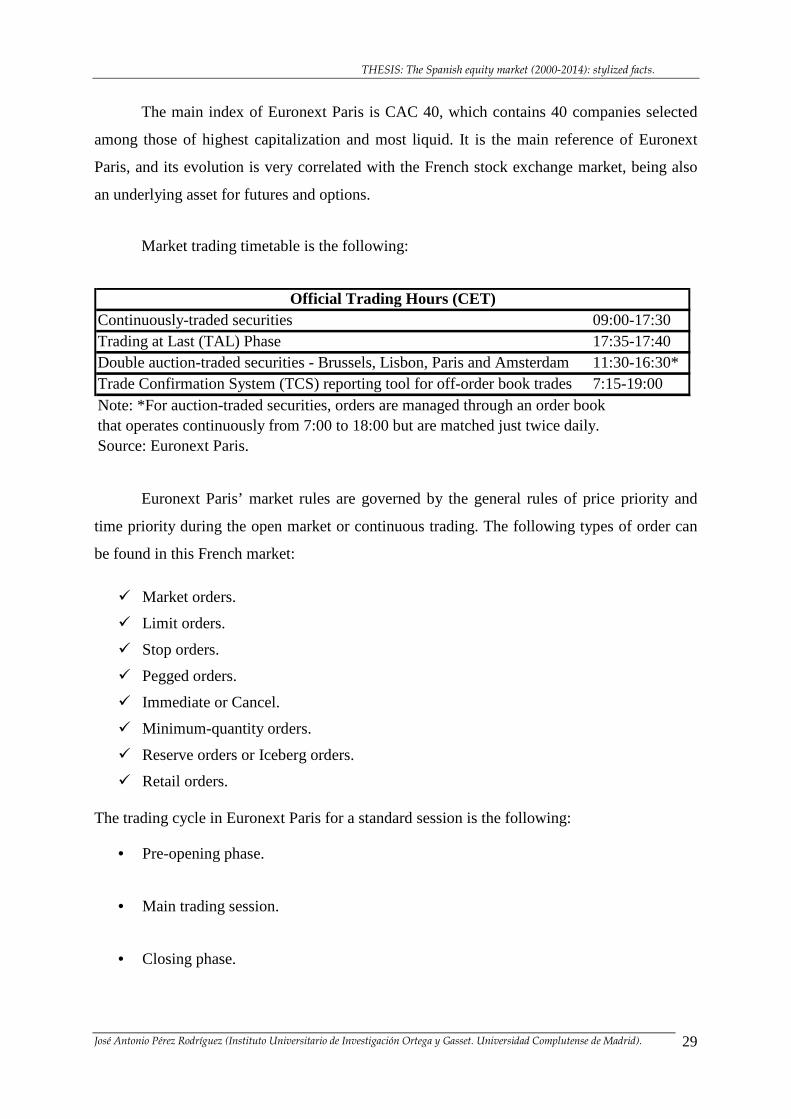
Market trading timetable is the following:
Continuously-traded securities 09:00-17:30Trading at Last (TAL) Phase 17:35-17:40Double auction-traded securities - Brussels, Lisbon, Paris and Amsterdam 11:30-16:30*Trade Confirmation System (TCS) reporting tool for off-order book trades 7:15-19:00Note: *For auction-traded securities, orders are managed through an order bookthat operates continuously from 7:00 to 18:00 but are matched just twice daily.Source: Euronext Paris.
Official Trading Hours (CET)
Euronext Paris’ market rules are governed by the general rules of price priority and
time priority during the open market or continuous trading. The following types of order can
be found in this French market:
� Market orders.
� Limit orders.
� Stop orders.
� Pegged orders.
� Immediate or Cancel.
� Minimum-quantity orders.
� Reserve orders or Iceberg orders.
� Retail orders. The trading cycle in Euronext Paris for a standard session is the following:
• Pre-opening phase.
• Main trading session.
• Closing phase.
THESIS: The Spanish equity market (2000-2014): stylized facts.
José Antonio Pérez Rodríguez (Instituto Universitario de Investigación Ortega y Gasset. Universidad Complutense de Madrid). 30
• Trading at last: except for certain shares designated by Euronext, this phase is a period
of time facilitated after the close of the market during which orders can be introduced
for its execution at the last executed price.
• Post-trading order book management: during a period after the close of the trading
session defined by a Notice, market members of Euronext can accede to the order
book in order to introduce, modify or cancel already existing orders for the next
trading session.
• Out-of-hours trading.
Finally, it should be pointed out that price variations in Euronext Paris are managed
with static and dynamic ranges and with volatility auctions (Source: Euronext Rule Book:
harmonised rules [issue date: 6 october 2014]. 4403/01. Collars and reservation thresholds –
volatility monitoring-).
1.3.3. German Stock Exchange:
The first mercantile assembly in Frankfurt takes place in 1585 in order to fix exchange
rates: this is the origin of the Frankfurt Stock Exchange. The German index, DAX 30 (main
reference of the German equity market), is born in 1988.
Currently, Deutsche Börse Group is one of the main stock exchange operators in the
world. It has an integrated business model in the sense that its products and services portfolio
covers the complete chain of processes: from the monitorization of execution of orders,
trading, clearing and settlement, custody, post-trading as well as all needed infrastructure and
information provision. Therefore, Deutsche Börse is an example of what we named “vertical
silo”.
Headquarters of Deutsche Börse group is located in the financial centre of Frankfurt
but this Group is also present in Luxemburg, Prague, London, Zurich, Moscow, New York,
Chicago, Hong Kong, Singapore, Beijing and Tokyo. At the end of year 2013, Deutsche
Börse Group provided employment to 3800 people.
THESIS: The Spanish equity market (2000-2014): stylized facts.
José Antonio Pérez Rodríguez (Instituto Universitario de Investigación Ortega y Gasset. Universidad Complutense de Madrid). 31
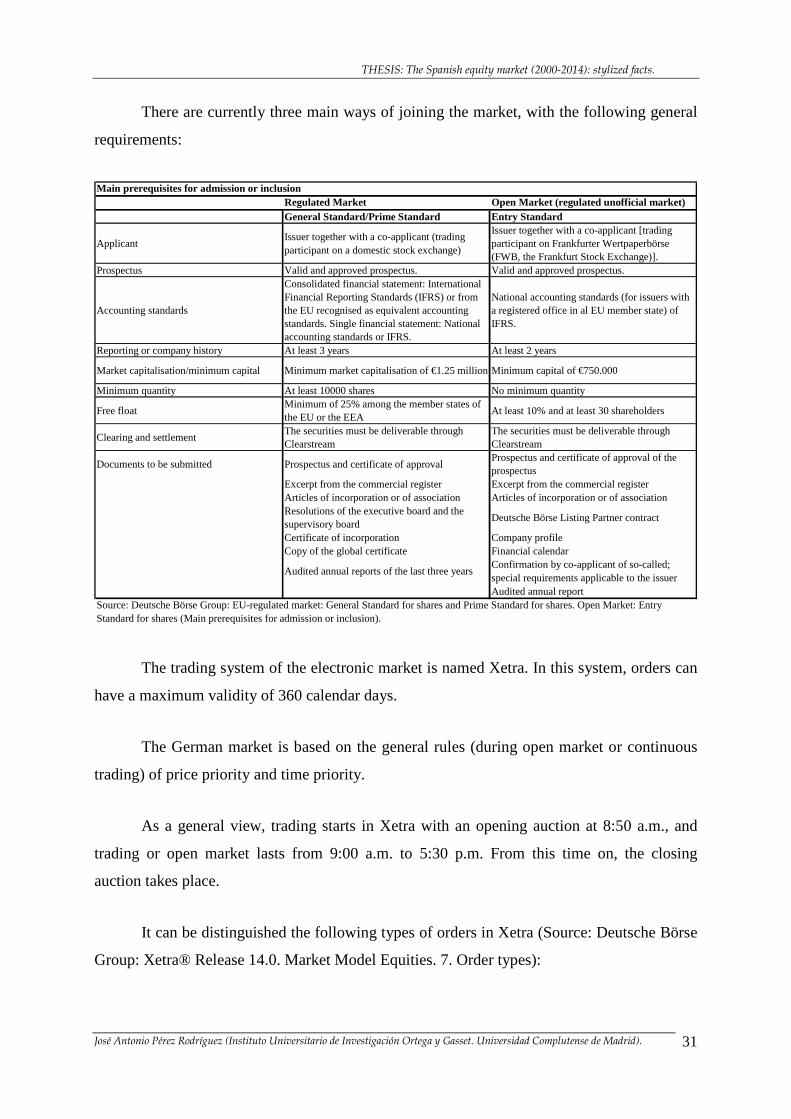
There are currently three main ways of joining the market, with the following general
requirements:
Main prerequisites for admission or inclusionRegulated Market Open Market (regulated unofficial market)General Standard/Prime Standard Entry Standard
ApplicantIssuer together with a co-applicant (trading participant on a domestic stock exchange)
Issuer together with a co-applicant [trading participant on Frankfurter Wertpaperbörse (FWB, the Frankfurt Stock Exchange)].
Prospectus Valid and approved prospectus. Valid and approved prospectus.
Accounting standards
Consolidated financial statement: International Financial Reporting Standards (IFRS) or from the EU recognised as equivalent accounting standards. Single financial statement: National accounting standards or IFRS.
National accounting standards (for issuers with a registered office in al EU member state) of IFRS.
Reporting or company history At least 3 years At least 2 years
Market capitalisation/minimum capital Minimum market capitalisation of €1.25 million Minimum capital of €750.000
Minimum quantity At least 10000 shares No minimum quantity
Free floatMinimum of 25% among the member states of the EU or the EEA
At least 10% and at least 30 shareholders
Clearing and settlementThe securities must be deliverable through Clearstream
The securities must be deliverable through Clearstream
Documents to be submitted Prospectus and certificate of approvalProspectus and certificate of approval of the prospectus
Excerpt from the commercial register Excerpt from the commercial registerArticles of incorporation or of association Articles of incorporation or of associationResolutions of the executive board and the supervisory board
Deutsche Börse Listing Partner contract
Certificate of incorporation Company profileCopy of the global certificate Financial calendar
Audited annual reports of the last three yearsConfirmation by co-applicant of so-called; special requirements applicable to the issuerAudited annual report
Source: Deutsche Börse Group: EU-regulated market: General Standard for shares and Prime Standard for shares. Open Market: Entry Standard for shares (Main prerequisites for admission or inclusion).
The trading system of the electronic market is named Xetra. In this system, orders can
have a maximum validity of 360 calendar days.
The German market is based on the general rules (during open market or continuous
trading) of price priority and time priority.
As a general view, trading starts in Xetra with an opening auction at 8:50 a.m., and
trading or open market lasts from 9:00 a.m. to 5:30 p.m. From this time on, the closing
auction takes place.
It can be distinguished the following types of orders in Xetra (Source: Deutsche Börse
Group: Xetra® Release 14.0. Market Model Equities. 7. Order types):
THESIS: The Spanish equity market (2000-2014): stylized facts.
José Antonio Pérez Rodríguez (Instituto Universitario de Investigación Ortega y Gasset. Universidad Complutense de Madrid). 32
� Market orders � Limit orders � Market-to-limit orders � Immediate or cancel � Fill-or-kill order � Book-or-cancel order � Top-of-the-book order � TOP+ order � Stop oders � Iceberg orders � Midpoint orders � Hidden orders) � Strike Match order � Trailing Stop Order � One-Cancels-Other Order � Order-on-Event
Trading restrictions:
� Opening auction only � Closing auction only � Auction only � Accept surplus � Main trading phase only � Auctions in main trading phase only � End-of-day auction only
Static and dynamic volatility auctions exist in Xetra (Deutsche Börse Group: Market
Model Equities –Xetra Release 14.0-. 10.1.3. Intraday Auctions).
1.3.4. Italian Stock Exchange:
On January 16, 1808, a Vice-Royal Decree written by Eugenio Napoleone officially
started the “Borsa di Commercio” (commodities exchange) in Milano.
The MTA (Mercato Telematico Azionario) is the Italian market where shares are
traded as well as convertible bonds, warrants and options. This market is integrated by
medium-sized and small-sized companies which meet the best international standards.
THESIS: The Spanish equity market (2000-2014): stylized facts.
José Antonio Pérez Rodríguez (Instituto Universitario de Investigación Ortega y Gasset. Universidad Complutense de Madrid). 33
Among the formal requirements needed in order to quote in MTA, it is needed a
capitalization of at least 40 million euro and a free float of at least 25% (35% in the case of
STAR segment).
The FTSE MIB index is compounded by 40 constituents, which are the most liquid
and capitalized companies listed in Borsa italiana. These companies are selected according to
size and liquidity. This index represents approximately 80% of the domestic capitalization,
and it is underlying of futures, options, ETFs, warrants and certificates.
STAR segment of Italian Stock Exchange is created in year 2001 in order to enhance
the value of medium-sized companies for Italian and international investors. These companies
integrating STAR segment are medium-sized companies providing excellence in terms of
transparency and communication, liquidity and corporate governance. In terms of liquidity,
these companies must fulfill the following requirements:
• Capitalization between 40 million and 1 billion euro.
• Free float of at least 35%.
• Presence of an specialist.
The Italian market is governed by the standard general rules of price priority and time
priority. The trading cycle in a standard trading session have the following phases:
• Pre-auction phase.
• Opening phase.
• Main trading session.
• Pre-auction phase.
• Closing phase.
THESIS: The Spanish equity market (2000-2014): stylized facts.
José Antonio Pérez Rodríguez (Instituto Universitario de Investigación Ortega y Gasset. Universidad Complutense de Madrid). 34
• Trading at the closing auction price.
The following types of orders can be distinguished in the Italian Stock Exchange:
� Market orders. � Limit orders. � Stop orders. � Market-to-limit orders. � Iceberg orders.
Finally, it should be pointed out that the algorithm of calculation of equilibrium price
during an auction is the same as the one applied in the Spanish stock exchange with the
following exception (applicable after the fourth rule): “if there is no reference price, the price
chosen will be the lowest price” (Rules of the Markets organised and managed by Borsa
Italiana S.p.A. Article 4.3.3.: Functioning of the auction and phase change rules –effective
from 6 October 2014-).
THESIS: The Spanish equity market (2000-2014): stylized facts.
José Antonio Pérez Rodríguez (Instituto Universitario de Investigación Ortega y Gasset. Universidad Complutense de Madrid). 35
Chapter 2
THEORETICAL FRAMEWORK: THE SITUATION AND MAIN FUNCT IONS OF
THE EQUITY MARKET IN AN ECONOMY.

THESIS: The Spanish equity market (2000-2014): stylized facts.
José Antonio Pérez Rodríguez (Instituto Universitario de Investigación Ortega y Gasset. Universidad Complutense de Madrid). 36
THESIS: The Spanish equity market (2000-2014): stylized facts.
José Antonio Pérez Rodríguez (Instituto Universitario de Investigación Ortega y Gasset. Universidad Complutense de Madrid). 37
2. THEORETICAL FRAMEWORK: THE SITUATION AND MAIN FU NCTIONS OF
THE EQUITY MARKET IN AN ECONOMY.
Given the typical classification of markets, the equity market is framed within the
capital markets (long term), as opposed to monetary markets (where we are being referred to
the short term). Besides, and as a complement to the previous classification, it can be
distinguished primary markets (where the initial issue of a trading value is done) and
secondary markets, where the subsequent trading is taking place. The equity market in an
economy belongs to the well-known subset of markets known as “secondary market”, and its
importance is clear since “the correct functioning of the capital markets in general, and the
primary markets in particular, depends in a large degree on the existence of a trading market
(secondary market) which provides liquidity; otherwise, primary markets would not function
properly and the capacity to raise permanent needed capitals would not be obtained in order to
finance long-term investments” 23.
As known, the main function of a secondary market is to provide liquidity to the
issued trading values, which means to enhance the level of acceptance of these trading
values24 and are generally accepted as a liquid value.
2.1. The nature of markets:
Financial markets are at the core of the question of how economic resources are put in
service of the productive economy, facilitating the production of goods and services and
enabling the possibility or channel through which economic resources are finally driven to the
producing economy. In other words, equity markets are the key element of an economy that
provides an adequate channel of transferring resources from economic agents with superavit
23 L. Rodríguez Sáiz, J.A. Parejo, Á. Cuervo y A. Calvo (1996): Manual de sistema financiero español.
24 A traded value (“valor negociable” in Spanish) is every right with patrimony content, with any name admitted that, given
its own legal configuration and transmission system, is susceptible of trading in a financial market”. Original in Spanish: “un valor negociable es todo derecho de contenido patrimonial, cualquiera que sea la denominación que se le dé, que, por su configuración jurídica propia y régimen de transmisión, sea susceptible de tráfico generalizado e impersonal en un mercado de índole financiera” (Real Decreto de 27 de marzo de 1992, que desarrolla el Título III de la Ley de Mercado de Valores). L. Rodríguez Sáiz, J.A. Parejo, Á. Cuervo y A. Calvo (1996): Manual de sistema financiero español.
THESIS: The Spanish equity market (2000-2014): stylized facts.
José Antonio Pérez Rodríguez (Instituto Universitario de Investigación Ortega y Gasset. Universidad Complutense de Madrid). 38
(more revenues than expenses) to economic agents with deficit (more expenses than
revenues). The first group of agents can be individuals, firms or governments while the
second group of firms are known as the “issuers”, that is, private companies whose shares are
quoting in the stock exchange providing information in real time about the market price
(therefore, market value, of a company at any moment in time). Although this function is
basic in the development of an economy, the fact that resources are driven to the productive
economy through the secondary market, does not mean that the issuer is influenced by the
prices quoted and exchanged in the secondary market, although, of course, the evolution of
trading and its liquidity is taken into account as a better or worse perception of the issuer
(level of acceptance) by the saving agents for subsequent emissions.
“Therefore, a general goal for stock exchanges is to increase participation by firms and
investors. There is a direct reason for doing so as trade executions and listing fees generate
revenue for exchanges, and both of these are increased by greater participation” 25.
From a global perspective, the main sources of revenues of stock exchanges
(considering equities) are the following three:
a) Dissemination of information in real time: stock exchanges are the ultimate source
of quotes, traded prices, market depth, index data, etc. and they charge for that
provision of information in real time to market participants as well as
disseminators of information (Reuters, Bloomberg, etc).
b) Index trademark: the main index of the country or area is not only a reference for
this market, but also a trademark. This means that all market participants who want
to issue a warrant, a certificate, an ETF; actually, any financial product whose
underlying asset is the index, must pay a fee to the stock exchange or institution
that manages this index.
25 Easley, D. and O´Hara, M. (2010): “Microstructure and ambiguity”. The Journal of Finance (vol. LXV. Nº 5. October
2010).
THESIS: The Spanish equity market (2000-2014): stylized facts.
José Antonio Pérez Rodríguez (Instituto Universitario de Investigación Ortega y Gasset. Universidad Complutense de Madrid). 39
c) Trading and listing fees: if a company wants to list and get their shares traded in a
specific stock market, this issuer should be charged by the concerned stock
exchange for their listing of shares. Besides, if these shares are traded every
trading day, then market participants are charged with a fee if they send orders and
get their orders fulfilled in this exchange.
From a general perspective, we can say that “exchanges and investors both gain from
greater participation and that society as a whole may benefit from increased participation in
stock markets if it lowers the equity premium” 26.
During the last fifteen years considered in this thesis, the landscape of stock exchanges
has varied a lot. In fact, one of the main aspects has been technology. “Technology has
transformed the competitive landscape for stock exchanges from what was a relatively
protected, monopolistic institution into a highly competitive, dynamic industry” 27.
In fact, that typical image of an old-fashioned and monopolistic stock exchange has
changed. Stock exchanges have experienced a huge transformation during the last fifteen
years playing now in a more competitive arena where trading venues compete with stock
exchanges trying to attract liquidity. There is a big difference, however, between the role
played by stock exchanges versus trading venues: “An exchange reduces company-specific
ambiguity by limiting which firms it allows to trade on the exchange. The exchange examines
companies that apply to be listed and only agrees to list those that meet some minimum listing
standards. Listing standards generally specify that a firm must have a certain number of
outstanding shares, must meet financial disclosure and governance requirements,…, must
have audited financial statements and independent audit committees, and must observe
corporate formalities such as annual meetings. Such standards reduce the company-related
ambiguity that investors face by ensuring that a functioning corporation exists and that there
will be sufficient shares to ensure an orderly market in that company´s shares.
26 Easley, D. and O´Hara, M. (2010): “Microstructure and ambiguity”. The Journal of Finance (vol. LXV. Nº 5. October
2010).
27 Easley, D. and O´Hara, M. (2010): “Microstructure and ambiguity”. The Journal of Finance (vol. LXV. Nº 5. October
2010).
THESIS: The Spanish equity market (2000-2014): stylized facts.
José Antonio Pérez Rodríguez (Instituto Universitario de Investigación Ortega y Gasset. Universidad Complutense de Madrid). 40
An exchange reduces market-related ambiguity by instituting rules that apply to all
trade on the market. Some rules establish clearing and settlement protocols to ensure that a
trader who buys stock receives it and that one who sells stock delivers it and is paid for it.
Other rules may be designed to level the playing field between different types of investors,
thereby reducing unsophisticated investors´ fears that they will be unfairly taken advantage of
by other traders” 28.
Moreover, “exchanges typically impose a duty of best execution on members to ensure
that the customer trades at the best price available. Exchanges also generally forbid “front-
running” by exchange members, thereby protecting the time priority of the investor´s order.
Yet another source of ambiguity is the potential for stock price manipulation. Exchanges
invest heavily in stock watch and trade monitoring systems to preclude exactly such
behaviors…. It is important to stress that such certification activities (of exchanges) do not
ensure that the stock is a good investment. The actual investment outcome for a stock can be
very good or very bad” 29.
With the aforementioned scenario and role played by stock exchanges, it is important
to stress here that microstructure theory concerns “the study of the process and outcomes of
exchanging assets under explicit trading rules” 30. Moreover, as O´Hara addresses,
“underlying the study of market microstructure there is a more basic curiosity: the desire to
know how prices are formed in the economy. This subject, long relegated to the “black box”
of economics is fundamental to understanding how economies work to allocate goods and
services” 31. Later in this thesis (in section 3), we will carefully cover the specific trading rules
of the Spanish equity market providing some empirical evidence with the main figures and
stylized facts of this market.
28 Easley, D. and O´Hara, M. (2010): “Microstructure and ambiguity”. The Journal of Finance (vol. LXV. Nº 5. October
2010).
29 Easley, D. and O´Hara, M. (2010): “Microstructure and ambiguity”. The Journal of Finance (vol. LXV. Nº 5. October
2010).
30 O´Hara (1995): “Microstructure Theory”.
31 O´Hara (1995): “Microstructure Theory”.
THESIS: The Spanish equity market (2000-2014): stylized facts.
José Antonio Pérez Rodríguez (Instituto Universitario de Investigación Ortega y Gasset. Universidad Complutense de Madrid). 41
Basically, as the microstructure theory points out, the three dimensions that markets
have, are the following:
1) Time: this variable has become incredibly important during last years, due to the
appearance and increasing development of high frequency trading and algorithmic
trading in electronic markets all over the world.
2) Place: when analyzing the evolution of markets along time, place has lost its
importance since markets nowadays are based on an electronic platform instead of
being based on out-cry circles located in a physical location.
3) Rules: trading rules design have an effect on the characteristics of a market, its
liquidity and could influence the behavior of market members while participating in
the market.
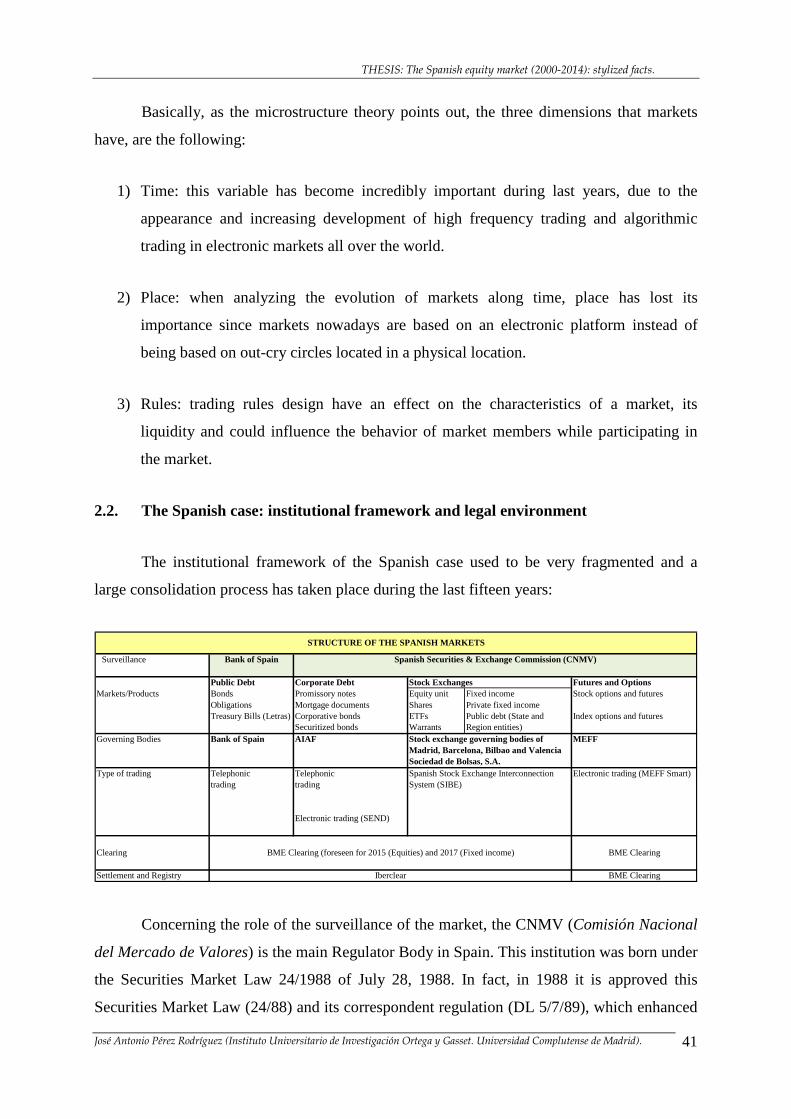
2.2. The Spanish case: institutional framework and legal environment
The institutional framework of the Spanish case used to be very fragmented and a
large consolidation process has taken place during the last fifteen years:
Surveillance Bank of Spain
Public Debt Corporate Debt Stock Exchanges Futures and OptionsMarkets/Products Bonds Promissory notes Equity unit Fixed income Stock options and futures
Obligations Mortgage documents Shares Private fixed incomeTreasury Bills (Letras) Corporative bonds ETFs Public debt (State and Index options and futures
Securitized bonds Warrants Region entities)Governing Bodies Bank of Spain AIAF Stock exchange governing bodies of MEFF
Madrid, Barcelona, Bilbao and ValenciaSociedad de Bolsas, S.A.
Type of trading Telephonic Telephonic Spanish Stock Exchange Interconnection Electronic trading (MEFF Smart)trading trading System (SIBE)
Electronic trading (SEND)
Clearing
Settlement and Registry
Spanish Securities & Exchange Commission (CNMV)
STRUCTURE OF THE SPANISH MARKETS
BME Clearing (foreseen for 2015 (Equities) and 2017 (Fixed income)
Iberclear
BME Clearing
BME Clearing
Concerning the role of the surveillance of the market, the CNMV (Comisión Nacional
del Mercado de Valores) is the main Regulator Body in Spain. This institution was born under
the Securities Market Law 24/1988 of July 28, 1988. In fact, in 1988 it is approved this
Securities Market Law (24/88) and its correspondent regulation (DL 5/7/89), which enhanced
THESIS: The Spanish equity market (2000-2014): stylized facts.
José Antonio Pérez Rodríguez (Instituto Universitario de Investigación Ortega y Gasset. Universidad Complutense de Madrid). 42
the growing role of the Spanish securities market, allowing the successful incorporation to the
European capital markets from 1992.
The development of this important Law can be summarized in the following five key
aspects:
1. Regulation of the listed securities, and substitution of the “old” economic agents, by
the current market members32.
2. The Spanish supervising institution (Comisión Nacional del Mercado de Valores) is
created as the main institution in charge of the control and regulation of the Spanish
market.
3. The official Spanish derivatives organized secondary market (futures and options) is
created (named “MEFF”).
4. High importance of the public debt market, already created in 1987.
5. Development of investment funds (named “Instituciones de Inversión Colectiva”).
Going back to our previous concern, the CNMV is the supervisory institution of the
Spanish securities market as already mentioned. It is a public entity with full legal
independence and full public and private capacity. This CNMV is governed by a Board,
whose composition is the following:
• President and Vice-President: chosen by the Government, and previously proposed by the
Economy and Competitiveness Ministry.
• General Manager of the General Secretariat of the Treasury and Financial Policy, and the
Vice-Governor of the Bank of Spain, as advisors.
32 This “old” economic agents were named in Spanish “Agentes de Cambio y Bolsa”, and the current market members are
named “Sociedades de Valores, Agencias de Valores y Entidades Financieras”.
THESIS: The Spanish equity market (2000-2014): stylized facts.
José Antonio Pérez Rodríguez (Instituto Universitario de Investigación Ortega y Gasset. Universidad Complutense de Madrid). 43
• Three advisors named by the Ministry of Economy and Competitiveness among persons of
recognized competence and expertise in the field of financial markets.
The main global functions of the CNMV are the following:
• Surveillance and inspection of securities markets, surveillance of the market
transparency, the correct setting or fixing of prices, and also as a provider of
protection to investors as well as to dictate (when authorized) the needed rules and
regulations in order to develop and execute the dictated rules in the development of
Law.
• To develop the admission, surveillance and management of the official secondary
market, and establish the trading rules to the market members.
• Related to the Stock Exchange Governing Bodies, their specific functions are the
following:
• Verification of the fulfillment of the demanded requirements concerning the
issuing and admission to the official listing of securities.
• To determine the categories of securities which are subject to trading, as well
as those which are to be integrated in the Spanish stock exchange
interconnection system.
• To control the takeover-bids and its procedures.
• To receive the information about the acquisitions and transmissions of major
holdings and own shares in listed companies.
Besides the previous important and basic institution, from a historical perspective, also
the Spanish securities market is based in four Stock Exchange Governing Bodies:
• Madrid Stock Exchange.
THESIS: The Spanish equity market (2000-2014): stylized facts.
José Antonio Pérez Rodríguez (Instituto Universitario de Investigación Ortega y Gasset. Universidad Complutense de Madrid). 44
• Barcelona Stock Exchange.
• Bilbao Stock Exchange.
• Valencia Stock Exchange.
Historically, during large part of the twentieth century33, these four stock exchanges
functioned as a relatively independent governing bodies and this had its consequences in the
market as well, in the sense that four markets were functioning in four different geographical
locations.
The aforementioned situation meant that, if transaction costs were small enough, an
investor could buy shares of one specific company at one specific price (say, in Madrid stock
exchange) and sell this same number of shares of the same company in another location (say,
in Barcelona stock exchange) at a higher price. In fact, there were four different separate
markets which, in other words meant (as the previous example tried to clarify), that four
different prices could be found for the same company the same day at the same moment in
time: therefore, arbitrage opportunities could arise.
This institutional structure of these four stock exchange Governing Bodies in Spain is
completed with Sociedad de Bolsas, a company equally participated by the four stock
exchange governing bodies in Spain (Madrid, Barcelona, Bilbao and Valencia), which
currently is a company within BME (Bolsas y Mercados Españoles), and which has two main
functions in the Spanish financial arena:
The first goal of Sociedad de Bolsas is to manage the Spanish stock exchange
interconnection system, that is, the electronic market. In this sense, Sociedad de Bolsas is in
charge of the surveillance of the equity market as well as to control the behavior in the market
of the market members, keep watch over the exact fulfillment of the technical and legal rules
applicable to the market and to adopt the necessary measures in order to safeguard its
immediate effectiveness.
THESIS: The Spanish equity market (2000-2014): stylized facts.
José Antonio Pérez Rodríguez (Instituto Universitario de Investigación Ortega y Gasset. Universidad Complutense de Madrid). 45
The other main function of Sociedad de Bolsas is to be the manager of the IBEX®
indices, that is, to manage the IBEX® indices. In other words, Sociedad de Bolsas manages
IBEX 35® and all the family of IBEX® indices34 providing their calculation, dissemination
and implementing the necessary adjustments to the indices when appropriate. Besides, the
Board of Directors of Sociedad de Bolsas has the responsibility for appointing the members of
the Technical Advisory Committee of the IBEX® indices, and the Chairman and Secretary,
and for establishing its internal rules of the IBEX® indices.
As already mentioned in the introduction of this thesis, all these 5 companies (Madrid
Stock Exchange, Barcelona Stock Exchange, Bilbao Stock Exchange, Barcelona Stock
Exchange and Sociedad de Bolsas, S.A.) belong to BME (the global financial Group “Bolsas
y Mercados Españoles”), which was fully integrated in 2002 becoming publicly listed in
2006.
2.2.1. The first admission to trading of shares of a company (Initial Public Offering –
IPO-) and take over bids in the Spanish case.
One of the key aspects of the whole process of a stock exchange and its activity, which
is narrowly linked with the institutional framework and legal environment, is the process of
the first admission to the market of the shares of a company: it is the so-called primary
market. In this sense, the Spanish regulator (CNMV: Comisión Nacional del Mercado de
33 Specially before year 1995.
34 The IBEX® family of indices is currently compounded by the following índices: IBEX 35 ®, IBEX MEDIUM CAP ®, IBEX SMALL CAP ®, IBEX TOP DIVIDENDO ®, IBEX 35 ® CAPPED, IBEX 35 ® CAPPED NET RETURN, IBEX 35 ® CON DIVIDENDOS (IBEX 35 ® TOTAL RETURN), IBEX 35 ® CON DIVIDENDOS NETOS (IBEX 35 ® NET RETURN), IBEX MEDIUM CAP ® CON DIVIDENDOS (IBEX MEDIUM ® TOTAL RETURN), IBEX MEDIUM CAP ® CON DIVIDENDOS NETOS (IBEX MEDIUM ® NET RETURN), IBEX SMALL CAP ® CON DIVIDENDOS (IBEX SMALL ® TOTAL RETURN), IBEX SMALL CAP ® CON DIVIDENDOS NETOS (IBEX SMALL ® NET RETURN), IBEX TOP DIVIDENDO ® RENTABILIDAD (IBEX TOP DIVIDENDO ® TOTAL RETURN), IBEX TOP DIVIDENDO ® RENTABILIDAD NETA (IBEX TOP DIVIDENDO ® NET RETURN), IBEX 35 ® INVERSO (IBEX 35 ® SHORT), IBEX 35 ® DOBLE INVERSO (IBEX 35 ® DOUBLE SHORT), IBEX 35 ® INVERSO X3 (IBEX 35 ® SHORT X3), IBEX 35 ® INVERSO X5 (IBEX 35 ® SHORT X5), IBEX 35 ® DOBLE APALANCADO (IBEX 35 ® DOUBLE LEVERAGE), IBEX 35 ® DOBLE APALANCADO BRUTO (IBEX 35 ® DOUBLE LEVERAGE GROSS), IBEX 35 ® DOBLE APALANCADO NETO (IBEX 35 ® DOUBLE LEVERAGE NET), IBEX 35 ® APALANCADO X3 (IBEX 35 ® LEVERAGE X3), IBEX 35 ® APALANCADO X3 NETO (IBEX 35 ® LEVERAGE NET X3), IBEX 35 ® APALANCADO X5 NETO (IBEX 35 ® LEVERAGE NET X5), IBEX 35 ® DE COMPRA (IBEX 35 ® BID), IBEX 35 ® DE VENTA (IBEX 35 ® ASK), IBEX 35 ® IMPACTO DIV (IBEX 35® DIV IMPACT), IBEX 35 ® VOLATILIDAD OBJETIVO (IBEX 35® TARGET VOLATILITY). Besides, together with the British publishing house “Financial Times Ltd.”, Sociedad de Bolsas is the manager of the following indices: FTSE Latibex Top, FTSE Latibex Brasil, FTSE Latibex all share, and FTSE 4GOOD IBEX® total return and FTSE 4GOOD IBEX® net return.
THESIS: The Spanish equity market (2000-2014): stylized facts.
José Antonio Pérez Rodríguez (Instituto Universitario de Investigación Ortega y Gasset. Universidad Complutense de Madrid). 46
Valores) and the Stock Exchange Governing Bodies agreed that the admission prospectuses of
securities must be implemented through a single-window system and that this process must be
centralized in any of the four Stock Exchange Governing Bodies.
Therefore, the issuer must present in the Coordination and Control Department of the
Stock Exchange Governing Body the original of the admission prospectus, which will include
all the related documents listed in the “Admissions Book”, in order to immediately send to the
regulator (CNMV: Comisión Nacional del Mercado de Valores) as well as the Stock
Exchange Governing Bodies.
As for the case of first admissions and merger processes creating a new company, this
sending of documentation must be done in the precise moment of issuing the Official Initial
Public Offering Prospectus or Merger Prospectus, given that this Prospectus contains in its
annexes a large part of the required documentation for the admission to trading according to
the current Spanish law.
A key aspect that should be stressed here is that, in order to admit the shares of a
company to the Spanish Stock Exchange Interconnection System (SIBE), it should be
previously admitted in at least two Spanish Stock Exchange Governing Body. This is a formal
step to be followed which does not have practical implications once the company is admitted
to trading in SIBE.
Among the Official requirements that must be fulfilled by a company in order to be
admitted to SIBE, the following three aspects must be fulfilled:
• A minimum social capital of 6,000,000 euro is required35, not taking into account the
part that each shareholder has with a participation of 25% or more.
• The company must have enough profits that allows the company to distribute a
dividend of 6% of social capital36, either in the last two years or in three non-
consecutive years of a total period of five years.
THESIS: The Spanish equity market (2000-2014): stylized facts.
José Antonio Pérez Rodríguez (Instituto Universitario de Investigación Ortega y Gasset. Universidad Complutense de Madrid). 47
• The company must have, at least, 100 shareholders with individual participation
lower than 25% of the total capital.
With this context in mind, an Initial Public Offering (IPO) is that action through which
one or several shareholders offer their shares selling them. The social capital does not change,
only change from one owner to other is implemented (totally or partially).
In most cases, it implies the registration in the Spanish regulator (CNMV: Comisión
Nacional del Mercado de Valores) of an informative Prospectus.
The reasons of developing an Initial Public Offering (IPO) are the following ones:
• A company wants their shares to be admitted in the market, and needs to fulfil the
requirement of enough distribution37.
• The will of a significant shareholder of selling a large portion of shares.
• The allocation among different shareholders of the own shares that the company
keeps in its portfolio (self-portfolio). In this case, the IPO is not implemented by the
shareholders but by the company itself.
A possible alternative available for the companies is a Subscription Public Offering,
which is an action through which a company offers new issued shares, consequence of a
capital increase. The main goal of this action is to collect resources in order to finance
business projects. Therefore, the buyer of the new shares will carefully analyze the objectives
where these resources are allocated for.
35 The regulation uses the term of “suitable requirement” (original in Spanish language: “requisito de idoneidad”).
36 Since June 1997, the Spanish regulator (CNMV: Comisión Nacional del Mercado de Valores) can exempt the fulfillment of this requirement under certain circumstances.
37 This “enough distribution” requirement means that, at least, 25% of shares that are required to be admitted, must be distributed among different shareholders.
THESIS: The Spanish equity market (2000-2014): stylized facts.
José Antonio Pérez Rodríguez (Instituto Universitario de Investigación Ortega y Gasset. Universidad Complutense de Madrid). 48
It should be pointed out that a company can go public (starting to be listed in the
market) either with an IPO, a Subscription Public Offering or both together.
Either in an Initial Public Offering or a Subscription Public Offering, there are certain
key concepts that should be fully understood:
• Segments: they are different groups of investors which are target of the offer. The
possible segments in an offer are the following: retail segment (for the retail
investors), qualified segment (for qualified investors) –this qualified segment can be
national, international or both-, and employees segment.
• Maximum retail price: it is the maximum amount that the retail investors will pay per
each allocated share.
• Retail price: it will be the lower price between two prices: either the maximum retail
price or the fixed price for the qualified investors.
• Not compulsory or compulsory application: it expresses the will of the investor to
participate in a public offering. The not compulsory or compulsory aspect is
distinguished by the moment of presentation (the not compulsory application can be
done from the registration of the prospectus –it is cancellable-; the compulsory
application can be done once the maximum retail price is fixed –it is not cancellable-
). Both applications can be ordered in the offices of the allocation entities.
• Cancellation period: it is that period that enables the investor who have presented not
compulsory applications to express their will to not finally participate in the offer.
• Quota process: it is that process through which the distribution of shares to retail
investors is done in the case that the demand (not compulsory and compulsory
applications) surpass the volume allocated to that segment.
It is also important to point out that there are some phases or steps to follow in an
offer. These steps must be done in a specific time frame. Therefore, the typical calendar of an
offer has the following time schedule:
THESIS: The Spanish equity market (2000-2014): stylized facts.
José Antonio Pérez Rodríguez (Instituto Universitario de Investigación Ortega y Gasset. Universidad Complutense de Madrid). 49
• Registration of the prospectus in the Spanish regulator (CNMV: Comisión Nacional
del Mercado de Valores).
• Starting date of the period of ordering non compulsory applications.
• End of the period of ordering non compulsory applications.
• Setting or fixing the band of maximum retail price (minimum and maximum prices).
• Starting date of the period of compulsory applications of buying or subscription
shares.
• End of the period of compulsory applications and end of the revoking period for the
non compulsory applications.
• Implementation, if appropriate, of quotas and fixing or setting of the maximum retail
price.
• Admission to trading in the market.
As a real example, the following calendar is the one of the largest Initial Public
Offering of the history of the Spanish Stock Exchange. It is the case of the company named
“Iberdrola Renovables”, whose calendar was the following:
• November 22, 2007: registration of the prospectus in the Spanish regulator (CNMV:
Comisión Nacional del Mercado de Valores).
• November 23, 2007: starting date of the period of ordering non compulsory
applications.
• December 3, 2007: end of the period of ordering non compulsory applications.
• December 3, 2007: setting or fixing the band of maximum retail price (minimum and
maximum prices).
THESIS: The Spanish equity market (2000-2014): stylized facts.
José Antonio Pérez Rodríguez (Instituto Universitario de Investigación Ortega y Gasset. Universidad Complutense de Madrid). 50
• December 4, 2007: starting date of the period of compulsory applications of buying or
subscription shares.
• December 7, 2007: end of the period of compulsory applications and end of the
revoking period for the non compulsory applications.
• December 11, 2007: implementation, if appropriate, of quotas and fixing or setting of
the maximum retail price.
• December 13, 2007: admission to trading in the market.
Once it has been covered Initial Public Offerings (IPO) and Subscription Public
Offerings, another large type of corporate action very typical is the take over bid from one
company to other.
A take over bid is a corporate action through which one or several physical persons or
companies offer to shareholders of a listed company the buying of their shares or other
securities which allow to acquire these shares against a specific price. This price is usually
paid in cash, but it can be paid also through shares or both (money and shares).
Accepting or not a take over bid is usually done in a voluntary basis. Therefore, each
shareholder will decide to accept or not the offer. If the investor (or shareholder) decides to
accept the offer, he/she must express that option in a explicit fashion, presenting his/her
acceptation order in the entity where he/she has the shares deposited. The acceptation period
of the offer, set by the company that launched the offer, can not be lower than fifteen natural
days nor higher than seventy natural days.
This acceptation order can be revoked at any moment before the last day of the offer
acceptation period shown in the informative prospectus. Current Spanish regulation about
take over bids is collected in the Royal Decree 1066/2007, of July 27, 2007. Different types of
take over bids can be distinguished:
- Compulsory or voluntary take over bids: current regulation establish the
situations where a take over bid is compulsory (control, exclusion and capital
THESIS: The Spanish equity market (2000-2014): stylized facts.
José Antonio Pérez Rodríguez (Instituto Universitario de Investigación Ortega y Gasset. Universidad Complutense de Madrid). 51
reduction). The compulsory take over bids must be presented for the 100% of
the shares of a company at a reasonable price and it can not be subject to any
specific condition. The voluntary take over bids are not subject to legal
requirements about price or number of shares, and the company that launched
the offer do can establish specific conditions.
- Control take over bids: the goal of this take over bid is that the shareholders of
the company which received the take over bid can sell their shares at a
reasonable price, once the company that launched the offer has obtained the
control. By control it is meant when 30% or more of the vote control have been
reached or, alternatively, when it can be named more than half of the members
of the Administration Board.
- Competitive take over bids: a competitive take over bid exists when the offer
influences the shares which previously received a take over bid and the
acceptation period did not finish, always when some specific requirements
occurs.
- Exclusion take over bids: the goal of this type of take over bid is that the shares
of the company are excluded from the market. In this type of take over bid, the
price is always paid in cash. The investor that decides to keep his/her shares
must know the implications of the new situation (i.e.: loosing liquidity, less
dissemination requirements by the company, etc.).
- Friendly or hostile take over bids: the friendly take over bid exists if there is a
previous agreement between the company that launches the take over bid and
the main shareholders or the Administration Board of the company that
received the take over bid. If there is no previous agreement, it is called a
hostile take over bid, although the name “hostile” does not mean the possible
interest by the shareholders.
It has been mentioned that accepting or not a take over bid is usually done in a
voluntary basis. However, a specific situation can be done where to accept the take over bid is
compulsory: under certain circumstances, it is possible that the shareholder that initially did
THESIS: The Spanish equity market (2000-2014): stylized facts.
José Antonio Pérez Rodríguez (Instituto Universitario de Investigación Ortega y Gasset. Universidad Complutense de Madrid). 52
not accept the take over bid, it can be obliged to sell his/her shares, or that the company which
launched the take over bid must buy these shares to those shareholders that initially did not
accept the take over bid. These situations, named “squeeze out” or “sell out”, can exist
whenever the following requirements are fulfilled:
� The take over bid is launched over 100% of the shares of a company.
� At the end of the acceptation period, there are still shareholders that did not sell, only
in the situation that these shareholders do not represent more than 10% of the social
capital.
� The take over bid was accepted by, at least, 90% of the targeted shares of the take over
bid.
In this “squeezed out” (or “sell out”) situation, the company that launched the take
over bid can require from the shareholders the selling of the shares, at the price of the take
over bid. In the same way, any shareholder can require from the company which launched the
take over bid to buy his/her shares at the same price.
The explicative prospectus will indicate if the company which launched the take over
bid has the intention to demand the compulsory selling. If the investor is the one that demands
from the company the buying of his/her shares, the derived expenses of the operation and the
subsequent clearing will correspond to the investor.
In any case, the maximum delay to demand the selling (from the side of the company
which launched the take over bid) or the buying (from the side of the shareholder) will be
three months from the end of the acceptation period of the take over bid.
In the process of a take over bid, a key aspect is to consider how to be informed about
this take over bid at every moment. In this sense, the following documents are relevant and
can be checked:
• The informative prospectus of the take over bid: it is the complete document
concerning the take over bid, and it contains all the needed information that the
THESIS: The Spanish equity market (2000-2014): stylized facts.
José Antonio Pérez Rodríguez (Instituto Universitario de Investigación Ortega y Gasset. Universidad Complutense de Madrid). 53
investor can demand in order to obtain a justified opinion about the take over
bid. It contains relevant information about the shares to which the take over bid
is targeted, the return price, the derived expenses of the operation, conditions
which are subjected to, goal of the operation, procedures of acceptation and
clearing, etc.
• The notice about the take over bid: this official notice contains a summary of
the main aspects of the take over bid.
• The report of the Administration Board: it must explicitly indicate if there is
any agreement between the company that launches the take over bid and the
company which receives the take over bid, the opinion of the members of the
Administration Board about the take over bid and the decision that they will
make concerning their shares.
• Other relevant informations.

THESIS: The Spanish equity market (2000-2014): stylized facts.
José Antonio Pérez Rodríguez (Instituto Universitario de Investigación Ortega y Gasset. Universidad Complutense de Madrid). 54
THESIS: The Spanish equity market (2000-2014): stylized facts.
José Antonio Pérez Rodríguez (Instituto Universitario de Investigación Ortega y Gasset. Universidad Complutense de Madrid). 55
Chapter 3
ANALYSIS AND EMPIRICAL EVIDENCE OF THE EVOLUTION OF THE
SPANISH EQUITY MARKET DURING YEARS 2000 TO 2014

THESIS: The Spanish equity market (2000-2014): stylized facts.
José Antonio Pérez Rodríguez (Instituto Universitario de Investigación Ortega y Gasset. Universidad Complutense de Madrid). 56
THESIS: The Spanish equity market (2000-2014): stylized facts.
José Antonio Pérez Rodríguez (Instituto Universitario de Investigación Ortega y Gasset. Universidad Complutense de Madrid). 57
3. ANALYSIS AND EMPIRICAL EVIDENCE OF THE EVOLUTION OF THE
SPANISH EQUITY MARKET DURING YEARS 2000 TO 2014.
The evolution of the Spanish equity market during years 2000 to 2014 has been very
intensive. This is true, not only according to the number of trading rules modifications and
new trading mechanisms introduced in the market microstructure of our case, but also in
terms of the number of different products traded along this period, in terms of the different
trading volumes registered (partly explained by the underlying economic cycle during these
years), and in terms of the type of investors holding shares in this period.
Although, as we have mentioned, this period has been very “productive” in terms of
the number of different trading mechanisms introduced in the Spanish stock exchange (SIBE),
it is not our goal here to mention and analyze every single modification in the Spanish equity
market , we will care in this thesis about the main modifications that SIBE had during these
last 15 years, and already mentioned before.
The main hypothesis of this thesis is that all these characteristics of the Spanish equity
market and its different trading mechanisms have, as a main consequence, the existence of a
robust market, in terms of trading volumes and growing attractiveness for different market
participants, national and foreign. The qualitative approach of this analysis about the main
trading mechanisms and elements of the current Spanish equity market must lead to a “credit
or confidence effect” for market participants which (regardless of the specific moment of the
economic cycle), should lead to a liquid, deep and versatile market.
This section describes the main strategic lines of the current38 functioning of the
Spanish equity market, which is an order-driven market, with liquidity providers (specialists)
for certain shares. The market features real time information on its screens and automatic
relaying of trading information, thus transparency is fully guaranteed.
38 December 2014.
THESIS: The Spanish equity market (2000-2014): stylized facts.
José Antonio Pérez Rodríguez (Instituto Universitario de Investigación Ortega y Gasset. Universidad Complutense de Madrid). 58
Most shares listed on the S.I.B.E. are part of the Main Trading market, which is an
order-driven continuous market with an opening auction at the session’s beginning and a
closing auction at the end. Some of these shares have specialists who are basically in charge
of providing liquidity for the stocks and have acquired certain commitments with the stock
exchanges. There is also a specific type of trading (trading of shares on the fixing market)
whereby the listed stocks are auctioned throughout the session, with two periods for allocation
of the shares. This facilitates efficient price formation for certain shares that are less liquid
than those quoting in the Main Trading market.
Besides, there are different market segments, with specific trading mechanisms
adapted to the characteristics of the stocks within each market. There is a segment for Latibex
(made up of Latin American stocks that trade in euros). This allows for diversity in a market
that relies on a common electronic trading system.
In addition, there is a market for large volume transactions carried out during the
market’s open trading session, known as the Block Market. Lastly, there is a Special
Operations Market for after-hours trading, whereby authorized or transmitted transactions that
fulfill certain cash or price requirements are communicated.
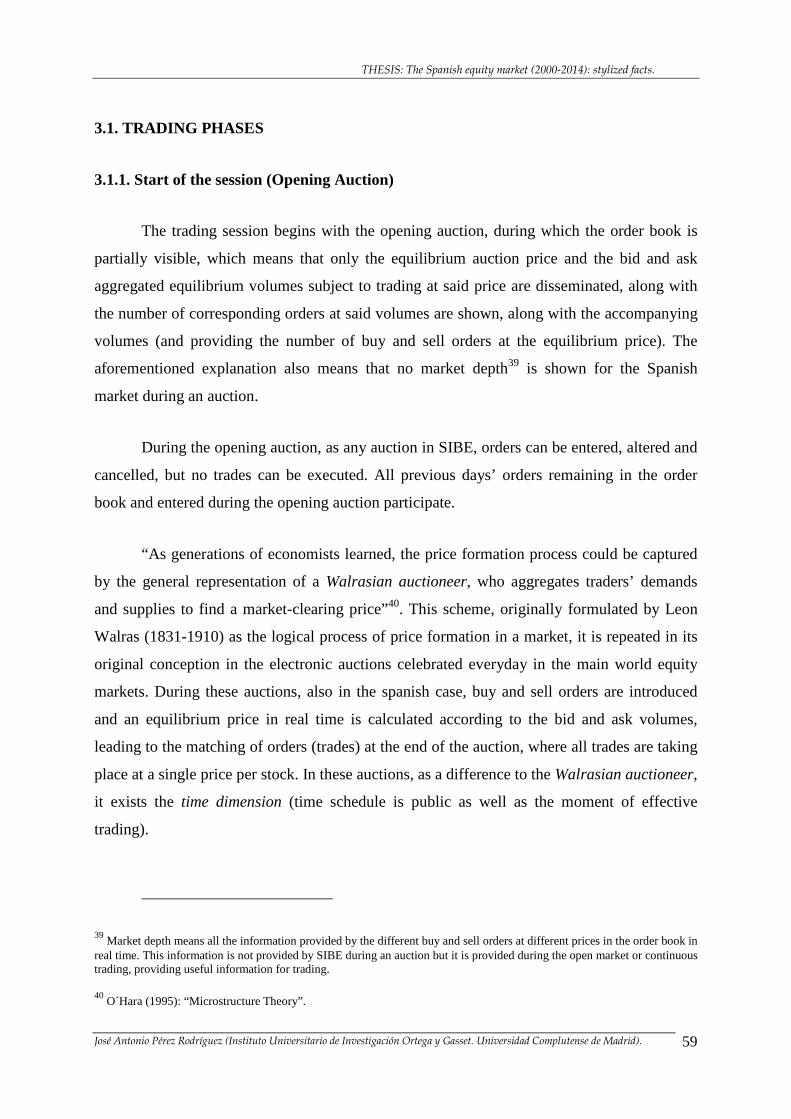
THESIS: The Spanish equity market (2000-2014): stylized facts.
José Antonio Pérez Rodríguez (Instituto Universitario de Investigación Ortega y Gasset. Universidad Complutense de Madrid). 59
3.1. TRADING PHASES
3.1.1. Start of the session (Opening Auction)
The trading session begins with the opening auction, during which the order book is
partially visible, which means that only the equilibrium auction price and the bid and ask
aggregated equilibrium volumes subject to trading at said price are disseminated, along with
the number of corresponding orders at said volumes are shown, along with the accompanying
volumes (and providing the number of buy and sell orders at the equilibrium price). The
aforementioned explanation also means that no market depth39 is shown for the Spanish
market during an auction.
During the opening auction, as any auction in SIBE, orders can be entered, altered and
cancelled, but no trades can be executed. All previous days’ orders remaining in the order
book and entered during the opening auction participate.
“As generations of economists learned, the price formation process could be captured
by the general representation of a Walrasian auctioneer, who aggregates traders’ demands
and supplies to find a market-clearing price”40. This scheme, originally formulated by Leon
Walras (1831-1910) as the logical process of price formation in a market, it is repeated in its
original conception in the electronic auctions celebrated everyday in the main world equity
markets. During these auctions, also in the spanish case, buy and sell orders are introduced
and an equilibrium price in real time is calculated according to the bid and ask volumes,
leading to the matching of orders (trades) at the end of the auction, where all trades are taking
place at a single price per stock. In these auctions, as a difference to the Walrasian auctioneer,
it exists the time dimension (time schedule is public as well as the moment of effective
trading).
39 Market depth means all the information provided by the different buy and sell orders at different prices in the order book in
real time. This information is not provided by SIBE during an auction but it is provided during the open market or continuous trading, providing useful information for trading.
40 O´Hara (1995): “Microstructure Theory”.
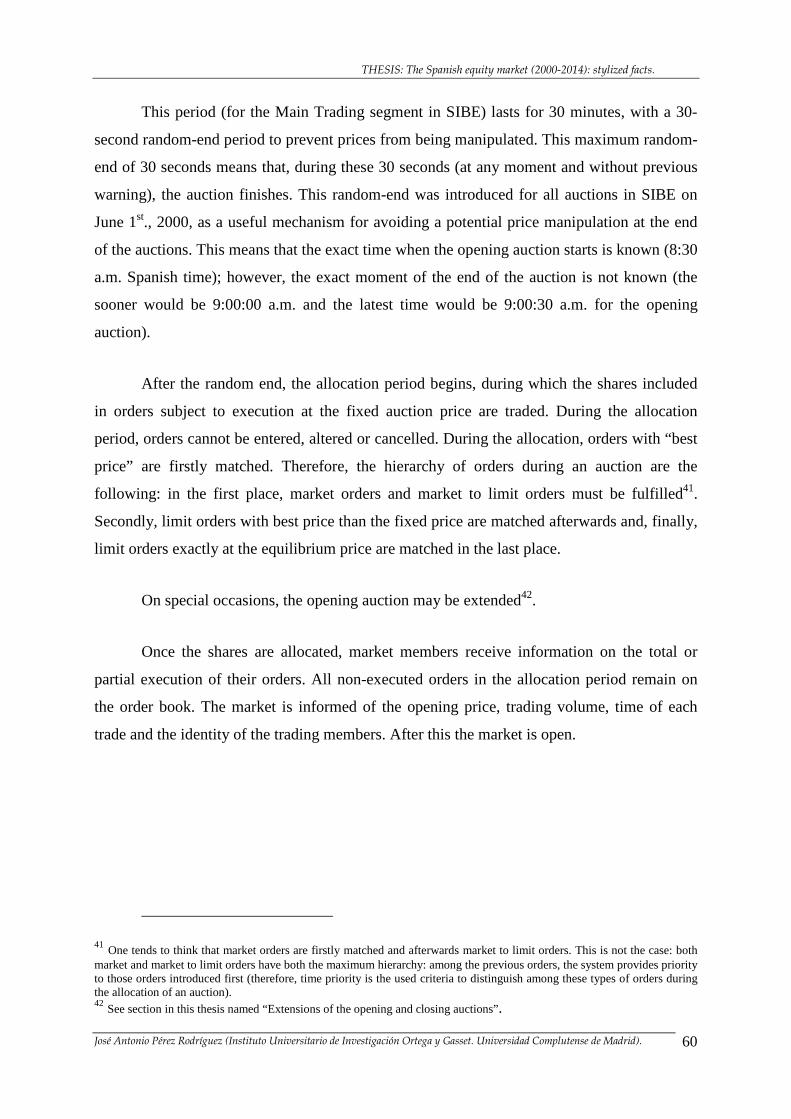
THESIS: The Spanish equity market (2000-2014): stylized facts.
José Antonio Pérez Rodríguez (Instituto Universitario de Investigación Ortega y Gasset. Universidad Complutense de Madrid). 60
This period (for the Main Trading segment in SIBE) lasts for 30 minutes, with a 30-
second random-end period to prevent prices from being manipulated. This maximum random-
end of 30 seconds means that, during these 30 seconds (at any moment and without previous
warning), the auction finishes. This random-end was introduced for all auctions in SIBE on
June 1st., 2000, as a useful mechanism for avoiding a potential price manipulation at the end
of the auctions. This means that the exact time when the opening auction starts is known (8:30
a.m. Spanish time); however, the exact moment of the end of the auction is not known (the
sooner would be 9:00:00 a.m. and the latest time would be 9:00:30 a.m. for the opening
auction).
After the random end, the allocation period begins, during which the shares included
in orders subject to execution at the fixed auction price are traded. During the allocation
period, orders cannot be entered, altered or cancelled. During the allocation, orders with “best
price” are firstly matched. Therefore, the hierarchy of orders during an auction are the
following: in the first place, market orders and market to limit orders must be fulfilled41.
Secondly, limit orders with best price than the fixed price are matched afterwards and, finally,
limit orders exactly at the equilibrium price are matched in the last place.
On special occasions, the opening auction may be extended42.
Once the shares are allocated, market members receive information on the total or
partial execution of their orders. All non-executed orders in the allocation period remain on
the order book. The market is informed of the opening price, trading volume, time of each
trade and the identity of the trading members. After this the market is open.
41 One tends to think that market orders are firstly matched and afterwards market to limit orders. This is not the case: both market and market to limit orders have both the maximum hierarchy: among the previous orders, the system provides priority to those orders introduced first (therefore, time priority is the used criteria to distinguish among these types of orders during the allocation of an auction). 42 See section in this thesis named “Extensions of the opening and closing auctions”.
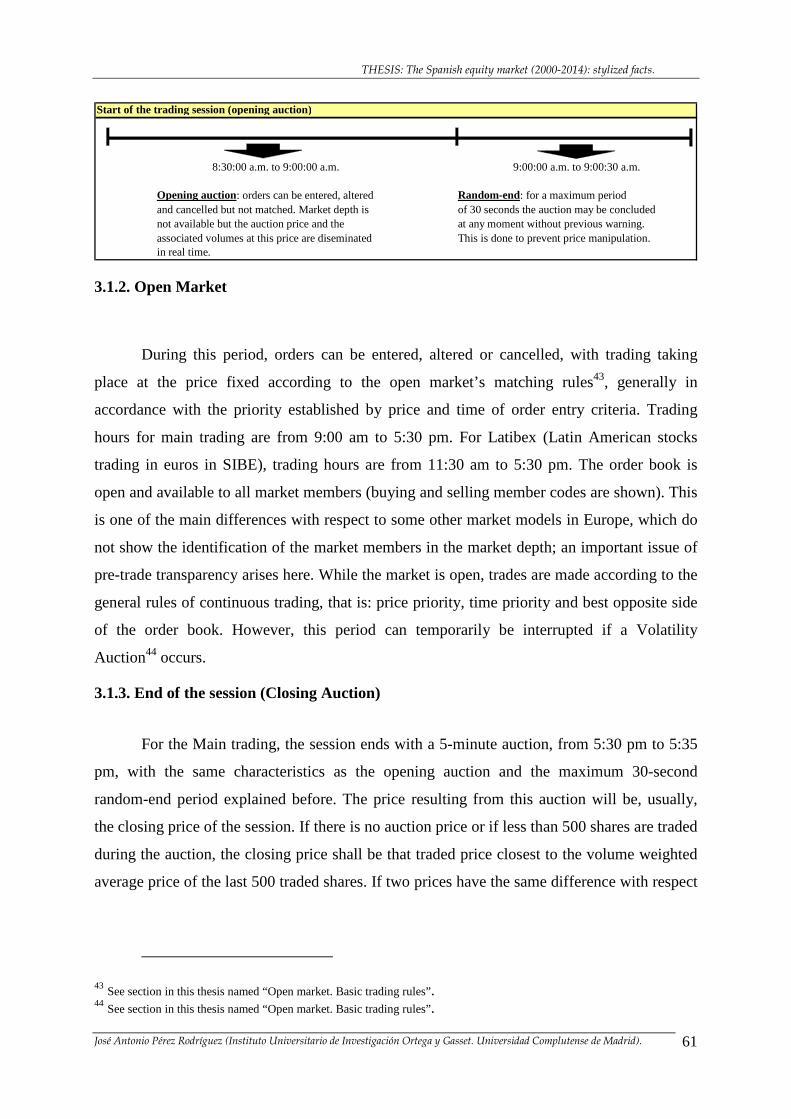
THESIS: The Spanish equity market (2000-2014): stylized facts.
José Antonio Pérez Rodríguez (Instituto Universitario de Investigación Ortega y Gasset. Universidad Complutense de Madrid). 61
Start of the trading session (opening auction)
Opening auction: orders can be entered, altered Random-end: for a maximum periodand cancelled but not matched. Market depth is of 30 seconds the auction may be concludednot available but the auction price and the at any moment without previous warning.associated volumes at this price are diseminated This is done to prevent price manipulation.in real time.
9:00:00 a.m. to 9:00:30 a.m.8:30:00 a.m. to 9:00:00 a.m.
3.1.2. Open Market
During this period, orders can be entered, altered or cancelled, with trading taking
place at the price fixed according to the open market’s matching rules43, generally in
accordance with the priority established by price and time of order entry criteria. Trading
hours for main trading are from 9:00 am to 5:30 pm. For Latibex (Latin American stocks
trading in euros in SIBE), trading hours are from 11:30 am to 5:30 pm. The order book is
open and available to all market members (buying and selling member codes are shown). This
is one of the main differences with respect to some other market models in Europe, which do
not show the identification of the market members in the market depth; an important issue of
pre-trade transparency arises here. While the market is open, trades are made according to the
general rules of continuous trading, that is: price priority, time priority and best opposite side
of the order book. However, this period can temporarily be interrupted if a Volatility
Auction44 occurs.
3.1.3. End of the session (Closing Auction)
For the Main trading, the session ends with a 5-minute auction, from 5:30 pm to 5:35
pm, with the same characteristics as the opening auction and the maximum 30-second
random-end period explained before. The price resulting from this auction will be, usually,
the closing price of the session. If there is no auction price or if less than 500 shares are traded
during the auction, the closing price shall be that traded price closest to the volume weighted
average price of the last 500 traded shares. If two prices have the same difference with respect
43 See section in this thesis named “Open market. Basic trading rules”. 44 See section in this thesis named “Open market. Basic trading rules”.
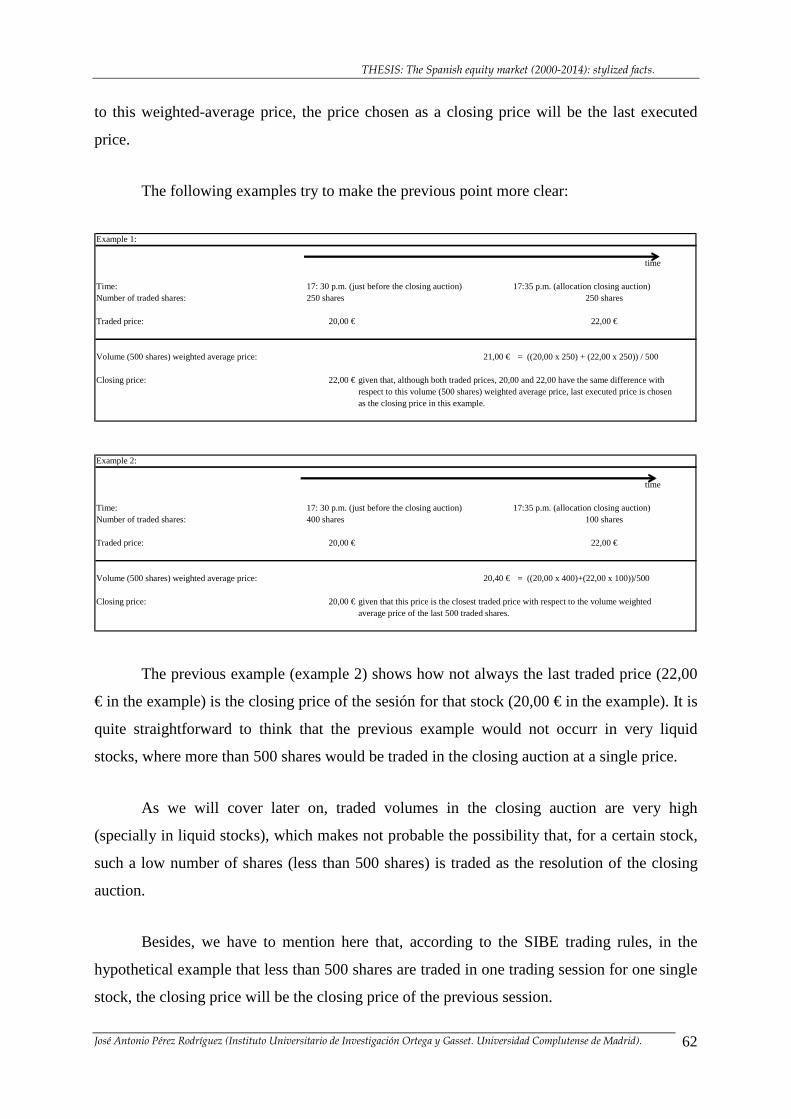
THESIS: The Spanish equity market (2000-2014): stylized facts.
José Antonio Pérez Rodríguez (Instituto Universitario de Investigación Ortega y Gasset. Universidad Complutense de Madrid). 62
to this weighted-average price, the price chosen as a closing price will be the last executed
price.
The following examples try to make the previous point more clear:
Example 1:
time
Time: 17: 30 p.m. (just before the closing auction) 17:35 p.m. (allocation closing auction)Number of traded shares: 250 shares 250 shares
Traded price: 20,00 € 22,00 €
Volume (500 shares) weighted average price: 21,00 € = ((20,00 x 250) + (22,00 x 250)) / 500
Closing price: 22,00 € given that, although both traded prices, 20,00 and 22,00 have the same difference withrespect to this volume (500 shares) weighted average price, last executed price is chosenas the closing price in this example.
Example 2:
time
Time: 17: 30 p.m. (just before the closing auction) 17:35 p.m. (allocation closing auction)Number of traded shares: 400 shares 100 shares
Traded price: 20,00 € 22,00 €
Volume (500 shares) weighted average price: 20,40 € = ((20,00 x 400)+(22,00 x 100))/500
Closing price: 20,00 € given that this price is the closest traded price with respect to the volume weighted average price of the last 500 traded shares.
The previous example (example 2) shows how not always the last traded price (22,00
€ in the example) is the closing price of the sesión for that stock (20,00 € in the example). It is
quite straightforward to think that the previous example would not occurr in very liquid
stocks, where more than 500 shares would be traded in the closing auction at a single price.
As we will cover later on, traded volumes in the closing auction are very high
(specially in liquid stocks), which makes not probable the possibility that, for a certain stock,
such a low number of shares (less than 500 shares) is traded as the resolution of the closing
auction.
Besides, we have to mention here that, according to the SIBE trading rules, in the
hypothetical example that less than 500 shares are traded in one trading session for one single
stock, the closing price will be the closing price of the previous session.
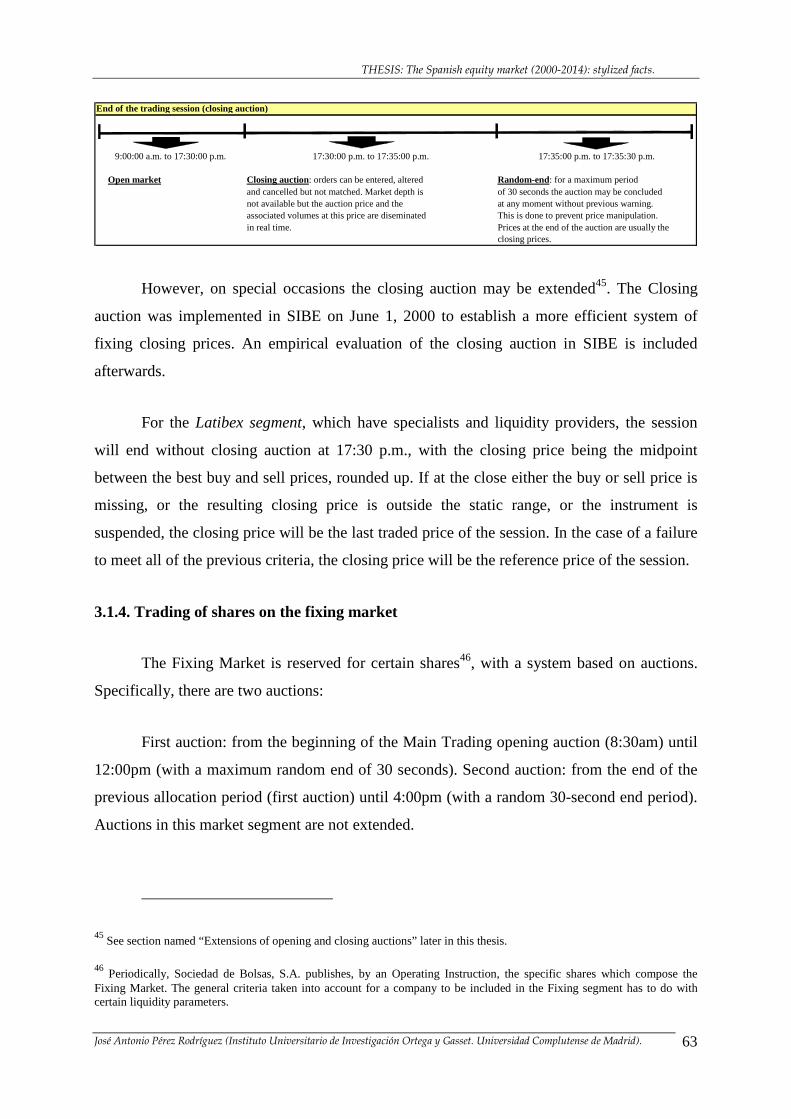
THESIS: The Spanish equity market (2000-2014): stylized facts.
José Antonio Pérez Rodríguez (Instituto Universitario de Investigación Ortega y Gasset. Universidad Complutense de Madrid). 63
End of the trading session (closing auction)
9:00:00 a.m. to 17:30:00 p.m.
Open market Closing auction: orders can be entered, altered Random-end: for a maximum periodand cancelled but not matched. Market depth is of 30 seconds the auction may be concludednot available but the auction price and the at any moment without previous warning.associated volumes at this price are diseminated This is done to prevent price manipulation.in real time. Prices at the end of the auction are usually the
closing prices.
17:35:00 p.m. to 17:35:30 p.m.17:30:00 p.m. to 17:35:00 p.m.
However, on special occasions the closing auction may be extended45. The Closing
auction was implemented in SIBE on June 1, 2000 to establish a more efficient system of
fixing closing prices. An empirical evaluation of the closing auction in SIBE is included
afterwards.
For the Latibex segment, which have specialists and liquidity providers, the session
will end without closing auction at 17:30 p.m., with the closing price being the midpoint
between the best buy and sell prices, rounded up. If at the close either the buy or sell price is
missing, or the resulting closing price is outside the static range, or the instrument is
suspended, the closing price will be the last traded price of the session. In the case of a failure
to meet all of the previous criteria, the closing price will be the reference price of the session.
3.1.4. Trading of shares on the fixing market
The Fixing Market is reserved for certain shares46, with a system based on auctions.
Specifically, there are two auctions:
First auction: from the beginning of the Main Trading opening auction (8:30am) until
12:00pm (with a maximum random end of 30 seconds). Second auction: from the end of the
previous allocation period (first auction) until 4:00pm (with a random 30-second end period).
Auctions in this market segment are not extended.
45 See section named “Extensions of opening and closing auctions” later in this thesis.
46 Periodically, Sociedad de Bolsas, S.A. publishes, by an Operating Instruction, the specific shares which compose the
Fixing Market. The general criteria taken into account for a company to be included in the Fixing segment has to do with certain liquidity parameters.
THESIS: The Spanish equity market (2000-2014): stylized facts.
José Antonio Pérez Rodríguez (Instituto Universitario de Investigación Ortega y Gasset. Universidad Complutense de Madrid). 64
Market to limit orders that do not trade in auctions will remain in the order book as
limited orders at the resulting auction price. Besides, the same information as in the Main
Trading auctions is transmitted and, as any auction in SIBE, during this period, orders can be
entered, altered and cancelled but no executions takes places until the end of the auction.
Market members receive information on the auction price and associated buy and sell
volumes (and number of orders) at that specific price.
If there is no auction price, the best buy and sell prices are shown, along with the
accompanying volumes (and number of orders). In this type of trading, the market depth of
the order book is not made public. During these auctions, as any other auction in SIBE, the
same rules govern the fixing of the equilibrium price during an auction47.
The price resulting from the second auction shall be the closing price of the session. If
there is no auction price or if fewer than 200 shares are traded during the auction, the closing
price shall be that traded price closest to the volume weighted-average price of the last 500
traded units. If two prices have the same difference with respect to this volume weighted-
average price, the price chosen will be the last executed price. In the hypothetical case that
200 shares have not been traded in the day, the closing price will be the reference price of that
session48.
3.1.5. Block Market
This market is designed to allow members to introduce and trade cross opposite-side
orders (same market member is buyer and seller) or carry out trades (different market
members are buyer and sellers), provided that they meet the volume and price requirements
established by the Spanish Stock Exchange for gaining access to block trading conditions.
47 See section named “Rules of fixing of the equilibrium price during an auction: theory and examples”.
48 We remind here that the reference price is the closing price of the previous session, with the exception of a corporate
action that could affect the reference price of the following session as a dividend, split, etc.
THESIS: The Spanish equity market (2000-2014): stylized facts.
José Antonio Pérez Rodríguez (Instituto Universitario de Investigación Ortega y Gasset. Universidad Complutense de Madrid). 65
All stocks trading on the SIBE can be traded in the Block Market as well. Trading
hours for this market are from 9:00am to 5:30pm49, and there are two types of blocks with
different requirements of price and volume that must be fulfilled at the time of entry of the
block trade by the seller:
Agreed Blocks: with respect to price, this type of block trade must obey, according to
the current regulation50, a maximum fluctuation of 1% with respect to the mid point of the
current spread (best buy and sell positions in main trading). According to the requirements of
the turnover of the block trade, turnover must meet the following conditions (in function of
the average daily traded turnover of the given stock during the last complete calendar year):
Average daily traded turnover (ADTT): Minimum turnover of the block trade: If ADTT is lower than 500.000 € 50.000 € If ADTT is higher than 500.000 € and lower than 1.000.000 € 100.000 € If ADTT is higher than 1.000.000 € and lower than 25.000.000 € 250.000 € If ADTT is higher than 25.000.000 € and lower than 50.000.000 € 400.000 € If ADTT is higher than 50.000.000 € 500.000 €
Parametrised Blocks: with respect to price, this type of block trade must obey,
according to the current regulation51, a maximum fluctuation of 15% with respect to the static
price. According to the requirements of the turnover of the block trade, turnover must have a
minimum of 500.000 € and obey, at least, 5% of the average daily traded turnover of the
concerning stock.
In SIBE, blocks must be introduced by the seller and confirmed by the buyer.
According to the current functioning, the only market member able to introduce the block is
the seller, and the buyer can only confirm (if he/she agrees with the trade) or reject (if he/she
does not agree with the trade introduced in the system).
Concerning block trading, two key aspects are relevant:
49 It should be noted that, when a stock is in a Volatility Auction, blocks can not be executed. 50 Circular nº 3/2008 of Sociedad de Bolsas, S.A. (BME). 51 It should be noted that, when a stock is in a Volatility Auction, blocks can not be executed.
THESIS: The Spanish equity market (2000-2014): stylized facts.
José Antonio Pérez Rodríguez (Instituto Universitario de Investigación Ortega y Gasset. Universidad Complutense de Madrid). 66
1) The existence of block trading is partly justified because, given that these trades
are executed apart from the order book, the intervening market members are fully
guaranteed and have certainty that they execute their block with the agreed
counterparty, and no other market member52.
2) Traded prices in blocks are not official quotations, which means that (although
they are traded prices), they are not official quotes in the sense that these prices do
not reflect the agreement of demand and supply given by the current functioning of
the order book. Through block trading, two market members can execute trades at
prices which are very different (respecting the official parameters) from the market
price. In fact, these traded prices do not reflect the valuation (fair asset value) of
the stock but an agreement of exchanging shares at an agreed price, which not
necessarily reflects the true assets value of an stock. To sum up, they are traded
prices but not official prices as those transactions executed in the order book along
the trading day.
3.1.6. Special Operations Market
This market is designed to allow market members to introduce and trade “cross
opposite-side orders” (same market member is buyer and seller) or carry out “trades”
(different market members are buyer and sellers) during an special trading schedule (from
17:40 p.m. to 20:00 p.m.) in SIBE. These trades must meet the volume and price requirements
established by the Spanish Stock Exchange concerning these special trades.
This market is also called the “after-hours market”, given its time schedule. There are
currently three types of special operations in SIBE:
a) Communicated operations: the seller introduces the trade, the buyer confirms the
trade and the Surveillance Department validates the trade (if this trade fulfills the
52 Note that, if block trading would take place in the order book, the intervening market member would not have full certainty that the block is executed with the desired counterparty, given the rapidness of the order flow in the order book along the trading session.
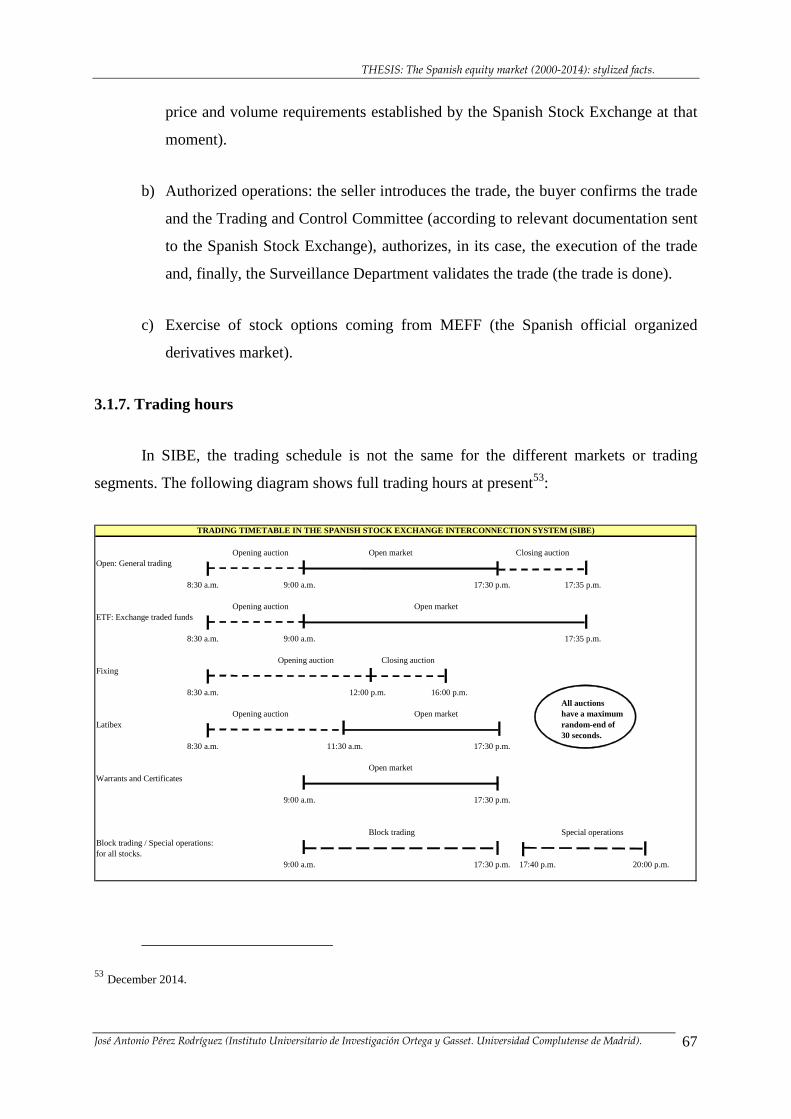
THESIS: The Spanish equity market (2000-2014): stylized facts.
José Antonio Pérez Rodríguez (Instituto Universitario de Investigación Ortega y Gasset. Universidad Complutense de Madrid). 67
price and volume requirements established by the Spanish Stock Exchange at that
moment).
b) Authorized operations: the seller introduces the trade, the buyer confirms the trade
and the Trading and Control Committee (according to relevant documentation sent
to the Spanish Stock Exchange), authorizes, in its case, the execution of the trade
and, finally, the Surveillance Department validates the trade (the trade is done).
c) Exercise of stock options coming from MEFF (the Spanish official organized
derivatives market).
3.1.7. Trading hours
In SIBE, the trading schedule is not the same for the different markets or trading
segments. The following diagram shows full trading hours at present53:
Opening auction Open market Closing auctionOpen: General trading
8:30 a.m. 9:00 a.m. 17:30 p.m. 17:35 p.m.
Opening auction Open marketETF: Exchange traded funds
8:30 a.m. 9:00 a.m. 17:35 p.m.
Opening auction Closing auctionFixing
8:30 a.m. 16:00 p.m.All auctions
Opening auction Open market have a maximumLatibex random-end of
30 seconds.8:30 a.m. 11:30 a.m. 17:30 p.m.
Open marketWarrants and Certificates
9:00 a.m. 17:30 p.m.
Block trading Special operationsBlock trading / Special operations:for all stocks.
9:00 a.m. 17:30 p.m. 17:40 p.m. 20:00 p.m.
TRADING TIMETABLE IN THE SPANISH STOCK EXCHANGE INT ERCONNECTION SYSTEM (SIBE)
12:00 p.m.
53 December 2014.
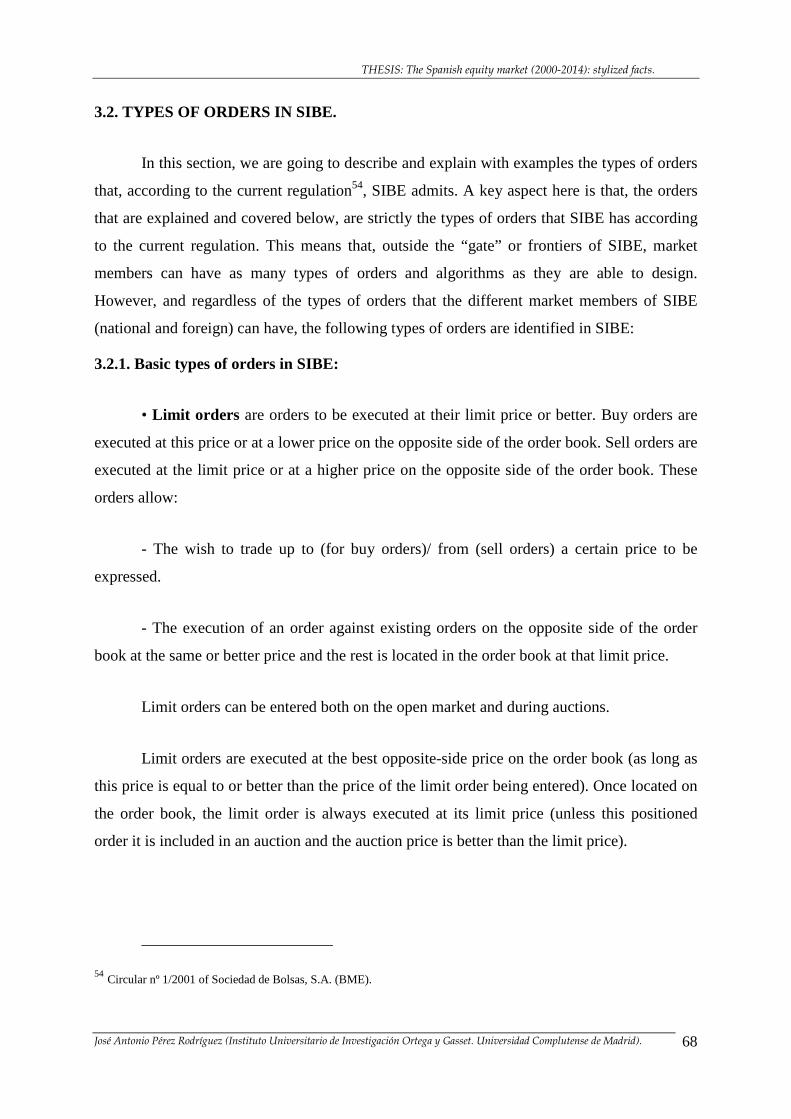
THESIS: The Spanish equity market (2000-2014): stylized facts.
José Antonio Pérez Rodríguez (Instituto Universitario de Investigación Ortega y Gasset. Universidad Complutense de Madrid). 68
3.2. TYPES OF ORDERS IN SIBE.
In this section, we are going to describe and explain with examples the types of orders
that, according to the current regulation54, SIBE admits. A key aspect here is that, the orders
that are explained and covered below, are strictly the types of orders that SIBE has according
to the current regulation. This means that, outside the “gate” or frontiers of SIBE, market
members can have as many types of orders and algorithms as they are able to design.
However, and regardless of the types of orders that the different market members of SIBE
(national and foreign) can have, the following types of orders are identified in SIBE:
3.2.1. Basic types of orders in SIBE:
• Limit orders are orders to be executed at their limit price or better. Buy orders are
executed at this price or at a lower price on the opposite side of the order book. Sell orders are
executed at the limit price or at a higher price on the opposite side of the order book. These
orders allow:
- The wish to trade up to (for buy orders)/ from (sell orders) a certain price to be
expressed.
- The execution of an order against existing orders on the opposite side of the order
book at the same or better price and the rest is located in the order book at that limit price.
Limit orders can be entered both on the open market and during auctions.
Limit orders are executed at the best opposite-side price on the order book (as long as
this price is equal to or better than the price of the limit order being entered). Once located on
the order book, the limit order is always executed at its limit price (unless this positioned
order it is included in an auction and the auction price is better than the limit price).
54 Circular nº 1/2001 of Sociedad de Bolsas, S.A. (BME).
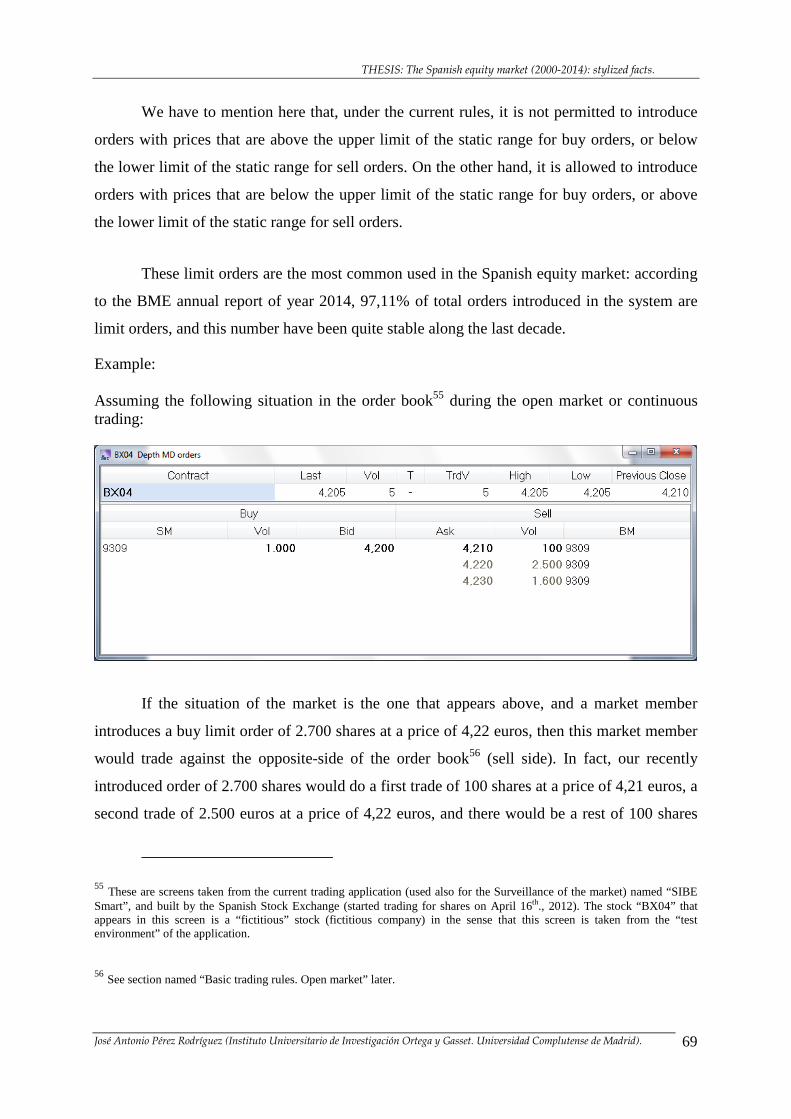
THESIS: The Spanish equity market (2000-2014): stylized facts.
José Antonio Pérez Rodríguez (Instituto Universitario de Investigación Ortega y Gasset. Universidad Complutense de Madrid). 69
We have to mention here that, under the current rules, it is not permitted to introduce
orders with prices that are above the upper limit of the static range for buy orders, or below
the lower limit of the static range for sell orders. On the other hand, it is allowed to introduce
orders with prices that are below the upper limit of the static range for buy orders, or above
the lower limit of the static range for sell orders.
These limit orders are the most common used in the Spanish equity market: according
to the BME annual report of year 2014, 97,11% of total orders introduced in the system are
limit orders, and this number have been quite stable along the last decade.
Example: Assuming the following situation in the order book55 during the open market or continuous trading:
If the situation of the market is the one that appears above, and a market member
introduces a buy limit order of 2.700 shares at a price of 4,22 euros, then this market member
would trade against the opposite-side of the order book56 (sell side). In fact, our recently
introduced order of 2.700 shares would do a first trade of 100 shares at a price of 4,21 euros, a
second trade of 2.500 euros at a price of 4,22 euros, and there would be a rest of 100 shares
55 These are screens taken from the current trading application (used also for the Surveillance of the market) named “SIBE Smart”, and built by the Spanish Stock Exchange (started trading for shares on April 16th., 2012). The stock “BX04” that appears in this screen is a “fictitious” stock (fictitious company) in the sense that this screen is taken from the “test environment” of the application.
56 See section named “Basic trading rules. Open market” later.
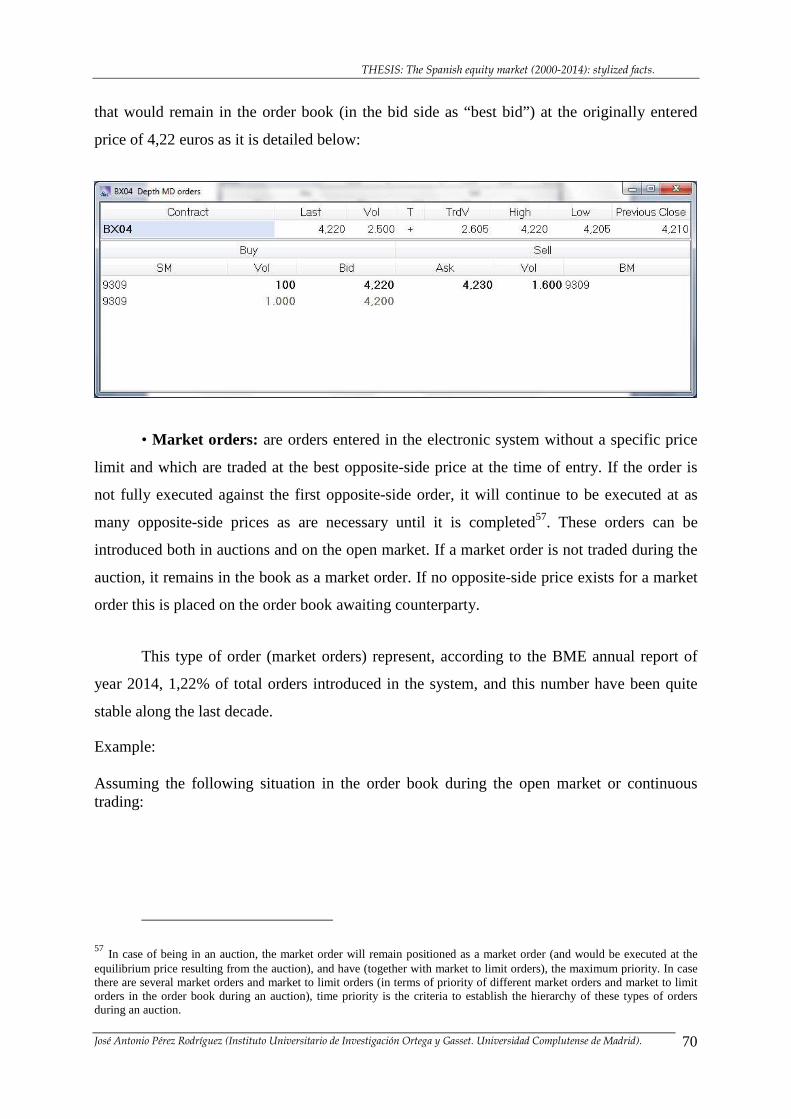
THESIS: The Spanish equity market (2000-2014): stylized facts.
José Antonio Pérez Rodríguez (Instituto Universitario de Investigación Ortega y Gasset. Universidad Complutense de Madrid). 70
that would remain in the order book (in the bid side as “best bid”) at the originally entered
price of 4,22 euros as it is detailed below:
• Market orders: are orders entered in the electronic system without a specific price
limit and which are traded at the best opposite-side price at the time of entry. If the order is
not fully executed against the first opposite-side order, it will continue to be executed at as
many opposite-side prices as are necessary until it is completed57. These orders can be
introduced both in auctions and on the open market. If a market order is not traded during the
auction, it remains in the book as a market order. If no opposite-side price exists for a market
order this is placed on the order book awaiting counterparty.
This type of order (market orders) represent, according to the BME annual report of
year 2014, 1,22% of total orders introduced in the system, and this number have been quite
stable along the last decade.
Example: Assuming the following situation in the order book during the open market or continuous trading:
57 In case of being in an auction, the market order will remain positioned as a market order (and would be executed at the equilibrium price resulting from the auction), and have (together with market to limit orders), the maximum priority. In case there are several market orders and market to limit orders (in terms of priority of different market orders and market to limit orders in the order book during an auction), time priority is the criteria to establish the hierarchy of these types of orders during an auction.
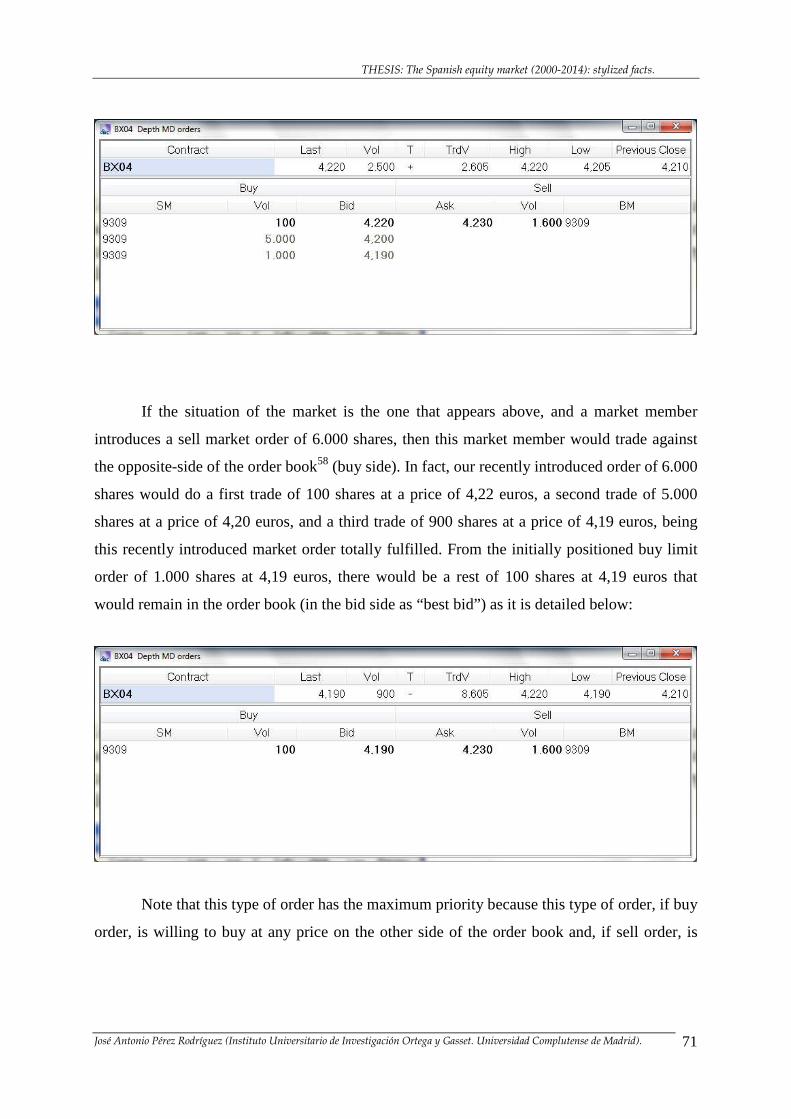
THESIS: The Spanish equity market (2000-2014): stylized facts.
José Antonio Pérez Rodríguez (Instituto Universitario de Investigación Ortega y Gasset. Universidad Complutense de Madrid). 71
If the situation of the market is the one that appears above, and a market member
introduces a sell market order of 6.000 shares, then this market member would trade against
the opposite-side of the order book58 (buy side). In fact, our recently introduced order of 6.000
shares would do a first trade of 100 shares at a price of 4,22 euros, a second trade of 5.000
shares at a price of 4,20 euros, and a third trade of 900 shares at a price of 4,19 euros, being
this recently introduced market order totally fulfilled. From the initially positioned buy limit
order of 1.000 shares at 4,19 euros, there would be a rest of 100 shares at 4,19 euros that
would remain in the order book (in the bid side as “best bid”) as it is detailed below:
Note that this type of order has the maximum priority because this type of order, if buy
order, is willing to buy at any price on the other side of the order book and, if sell order, is
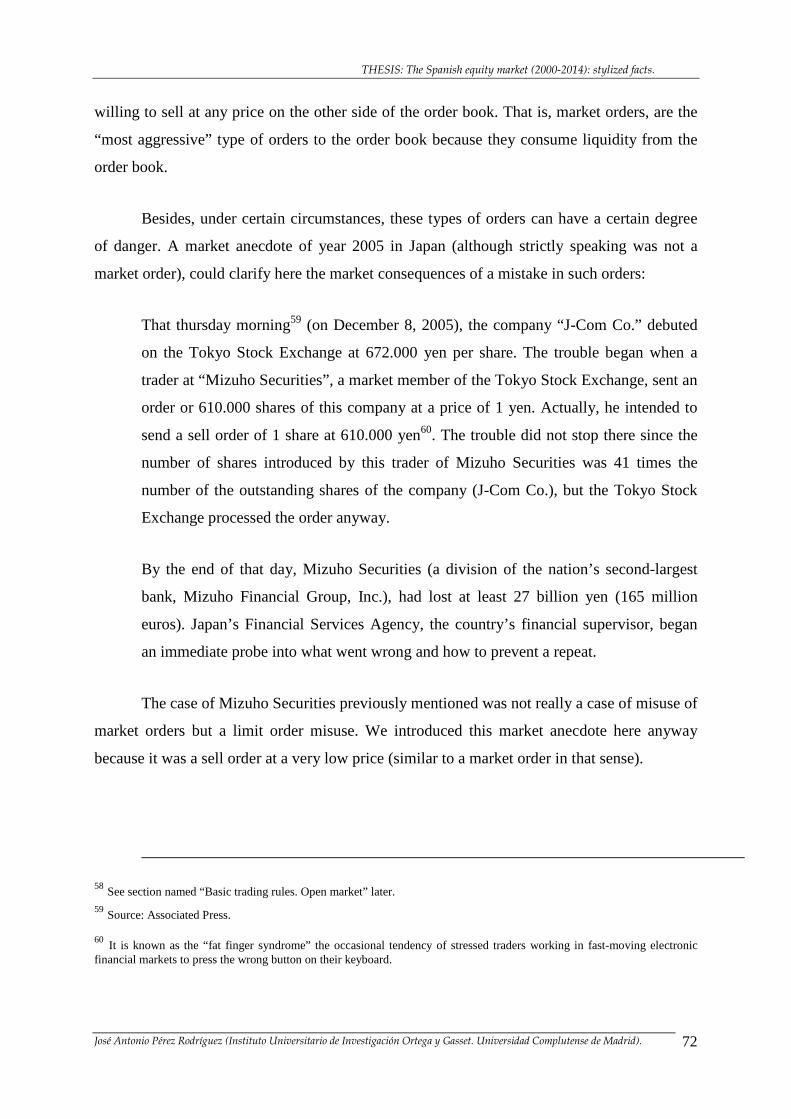
THESIS: The Spanish equity market (2000-2014): stylized facts.
José Antonio Pérez Rodríguez (Instituto Universitario de Investigación Ortega y Gasset. Universidad Complutense de Madrid). 72
willing to sell at any price on the other side of the order book. That is, market orders, are the
“most aggressive” type of orders to the order book because they consume liquidity from the
order book.
Besides, under certain circumstances, these types of orders can have a certain degree
of danger. A market anecdote of year 2005 in Japan (although strictly speaking was not a
market order), could clarify here the market consequences of a mistake in such orders:
That thursday morning59 (on December 8, 2005), the company “J-Com Co.” debuted
on the Tokyo Stock Exchange at 672.000 yen per share. The trouble began when a
trader at “Mizuho Securities”, a market member of the Tokyo Stock Exchange, sent an
order or 610.000 shares of this company at a price of 1 yen. Actually, he intended to
send a sell order of 1 share at 610.000 yen60. The trouble did not stop there since the
number of shares introduced by this trader of Mizuho Securities was 41 times the
number of the outstanding shares of the company (J-Com Co.), but the Tokyo Stock
Exchange processed the order anyway.
By the end of that day, Mizuho Securities (a division of the nation’s second-largest
bank, Mizuho Financial Group, Inc.), had lost at least 27 billion yen (165 million
euros). Japan’s Financial Services Agency, the country’s financial supervisor, began
an immediate probe into what went wrong and how to prevent a repeat.
The case of Mizuho Securities previously mentioned was not really a case of misuse of
market orders but a limit order misuse. We introduced this market anecdote here anyway
because it was a sell order at a very low price (similar to a market order in that sense).
58 See section named “Basic trading rules. Open market” later. 59 Source: Associated Press.
60 It is known as the “fat finger syndrome” the occasional tendency of stressed traders working in fast-moving electronic financial markets to press the wrong button on their keyboard.
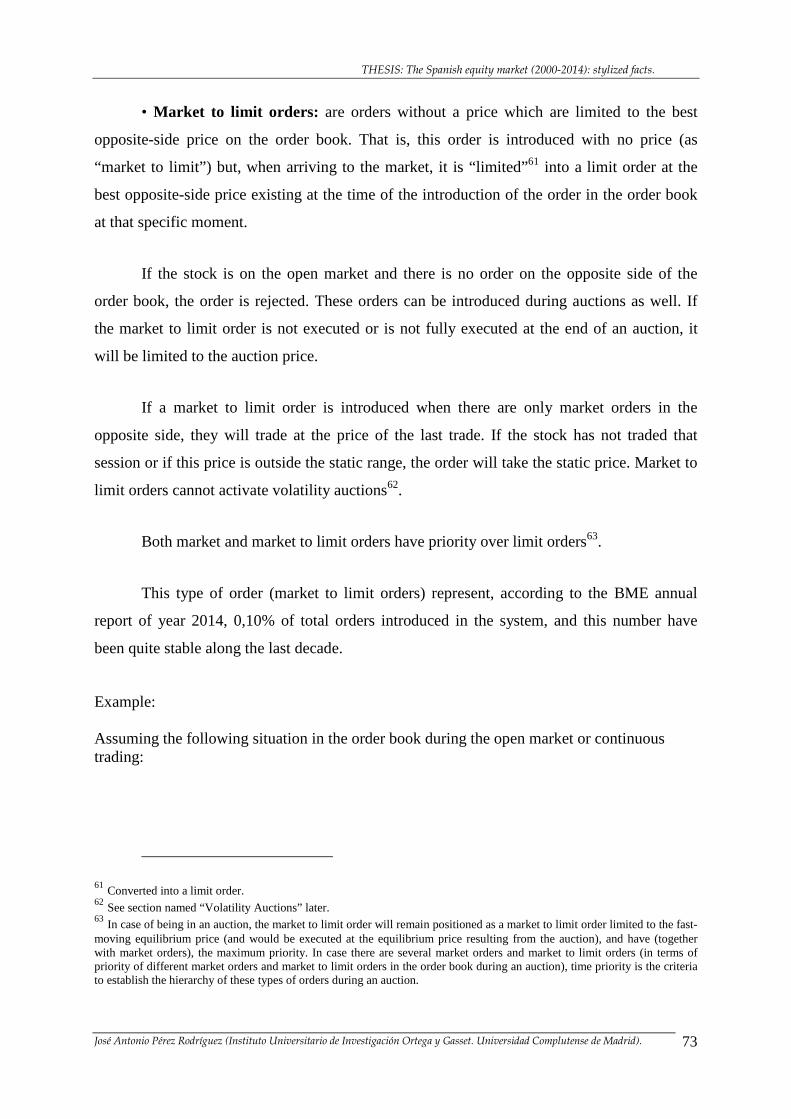
THESIS: The Spanish equity market (2000-2014): stylized facts.
José Antonio Pérez Rodríguez (Instituto Universitario de Investigación Ortega y Gasset. Universidad Complutense de Madrid). 73
• Market to limit orders: are orders without a price which are limited to the best
opposite-side price on the order book. That is, this order is introduced with no price (as
“market to limit”) but, when arriving to the market, it is “limited”61 into a limit order at the
best opposite-side price existing at the time of the introduction of the order in the order book
at that specific moment.
If the stock is on the open market and there is no order on the opposite side of the
order book, the order is rejected. These orders can be introduced during auctions as well. If
the market to limit order is not executed or is not fully executed at the end of an auction, it
will be limited to the auction price.
If a market to limit order is introduced when there are only market orders in the
opposite side, they will trade at the price of the last trade. If the stock has not traded that
session or if this price is outside the static range, the order will take the static price. Market to
limit orders cannot activate volatility auctions62.
Both market and market to limit orders have priority over limit orders63.
This type of order (market to limit orders) represent, according to the BME annual
report of year 2014, 0,10% of total orders introduced in the system, and this number have
been quite stable along the last decade.
Example: Assuming the following situation in the order book during the open market or continuous trading:
61 Converted into a limit order. 62 See section named “Volatility Auctions” later. 63 In case of being in an auction, the market to limit order will remain positioned as a market to limit order limited to the fast-moving equilibrium price (and would be executed at the equilibrium price resulting from the auction), and have (together with market orders), the maximum priority. In case there are several market orders and market to limit orders (in terms of priority of different market orders and market to limit orders in the order book during an auction), time priority is the criteria to establish the hierarchy of these types of orders during an auction.
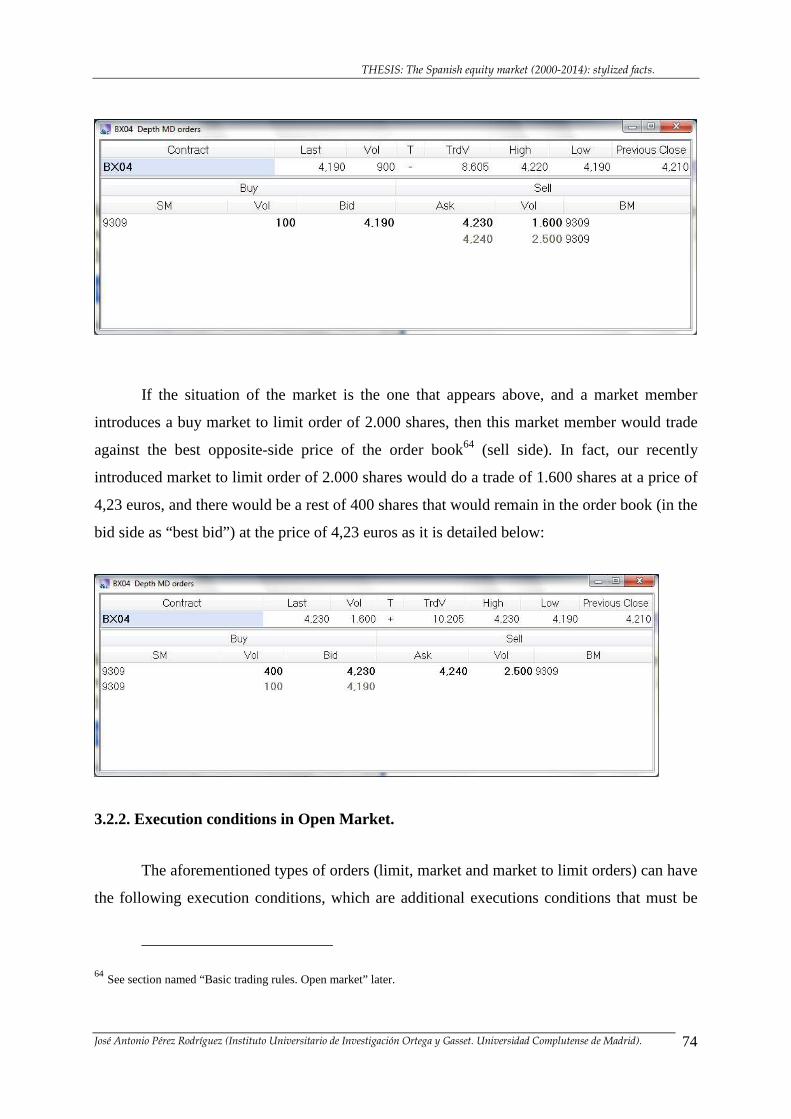
THESIS: The Spanish equity market (2000-2014): stylized facts.
José Antonio Pérez Rodríguez (Instituto Universitario de Investigación Ortega y Gasset. Universidad Complutense de Madrid). 74
If the situation of the market is the one that appears above, and a market member
introduces a buy market to limit order of 2.000 shares, then this market member would trade
against the best opposite-side price of the order book64 (sell side). In fact, our recently
introduced market to limit order of 2.000 shares would do a trade of 1.600 shares at a price of
4,23 euros, and there would be a rest of 400 shares that would remain in the order book (in the
bid side as “best bid”) at the price of 4,23 euros as it is detailed below:
3.2.2. Execution conditions in Open Market.
The aforementioned types of orders (limit, market and market to limit orders) can have
the following execution conditions, which are additional executions conditions that must be
64 See section named “Basic trading rules. Open market” later.
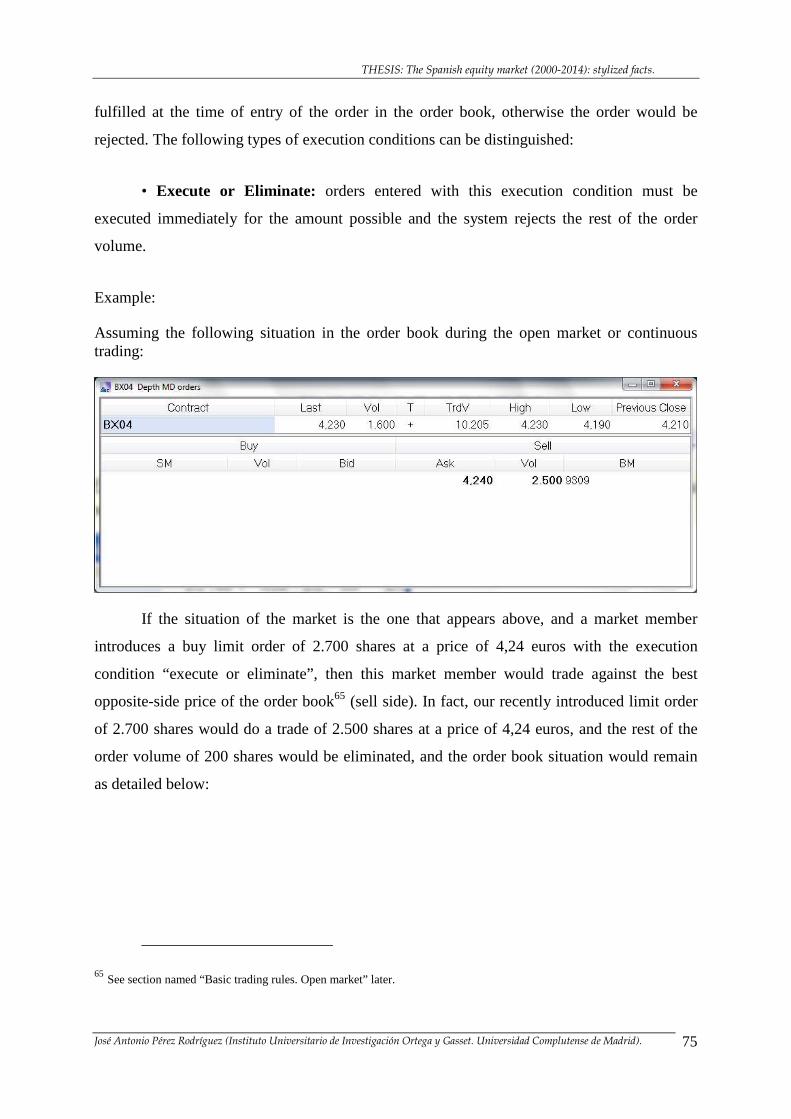
THESIS: The Spanish equity market (2000-2014): stylized facts.
José Antonio Pérez Rodríguez (Instituto Universitario de Investigación Ortega y Gasset. Universidad Complutense de Madrid). 75
fulfilled at the time of entry of the order in the order book, otherwise the order would be
rejected. The following types of execution conditions can be distinguished:
• Execute or Eliminate: orders entered with this execution condition must be
executed immediately for the amount possible and the system rejects the rest of the order
volume.
Example:
Assuming the following situation in the order book during the open market or continuous trading:
If the situation of the market is the one that appears above, and a market member
introduces a buy limit order of 2.700 shares at a price of 4,24 euros with the execution
condition “execute or eliminate”, then this market member would trade against the best
opposite-side price of the order book65 (sell side). In fact, our recently introduced limit order
of 2.700 shares would do a trade of 2.500 shares at a price of 4,24 euros, and the rest of the
order volume of 200 shares would be eliminated, and the order book situation would remain
as detailed below:
65 See section named “Basic trading rules. Open market” later.
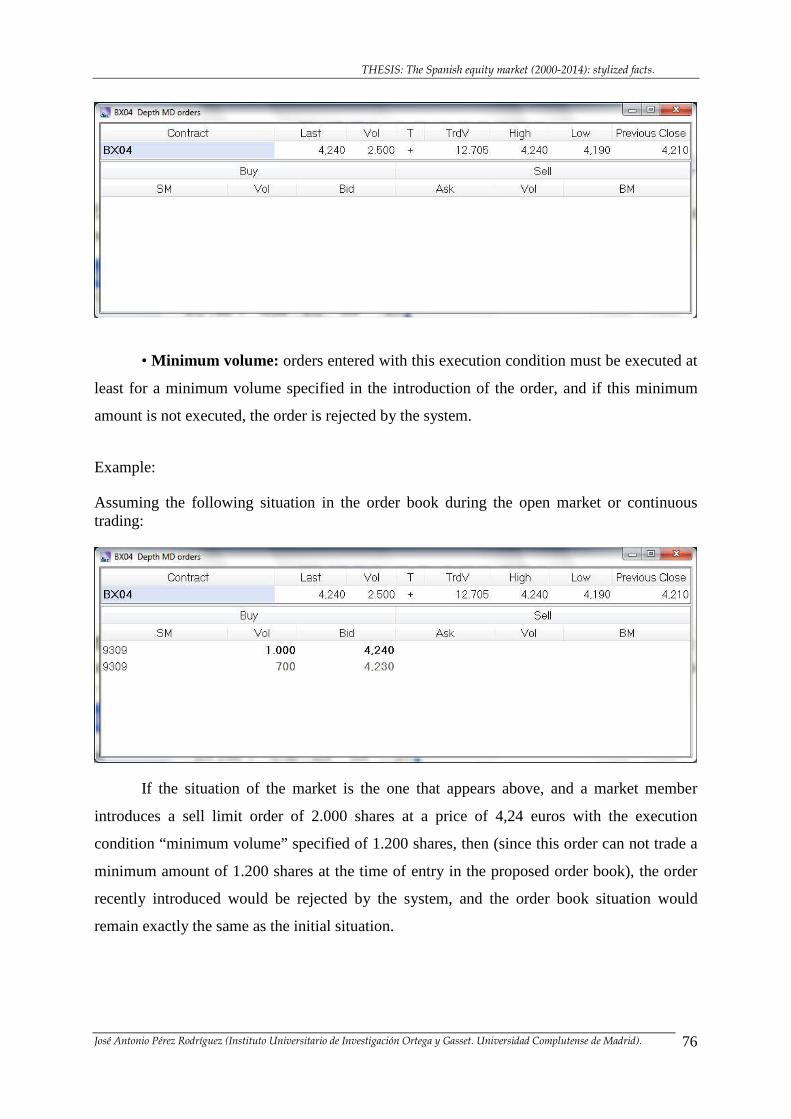
THESIS: The Spanish equity market (2000-2014): stylized facts.
José Antonio Pérez Rodríguez (Instituto Universitario de Investigación Ortega y Gasset. Universidad Complutense de Madrid). 76
• Minimum volume: orders entered with this execution condition must be executed at
least for a minimum volume specified in the introduction of the order, and if this minimum
amount is not executed, the order is rejected by the system.
Example:
Assuming the following situation in the order book during the open market or continuous trading:
If the situation of the market is the one that appears above, and a market member
introduces a sell limit order of 2.000 shares at a price of 4,24 euros with the execution
condition “minimum volume” specified of 1.200 shares, then (since this order can not trade a
minimum amount of 1.200 shares at the time of entry in the proposed order book), the order
recently introduced would be rejected by the system, and the order book situation would
remain exactly the same as the initial situation.
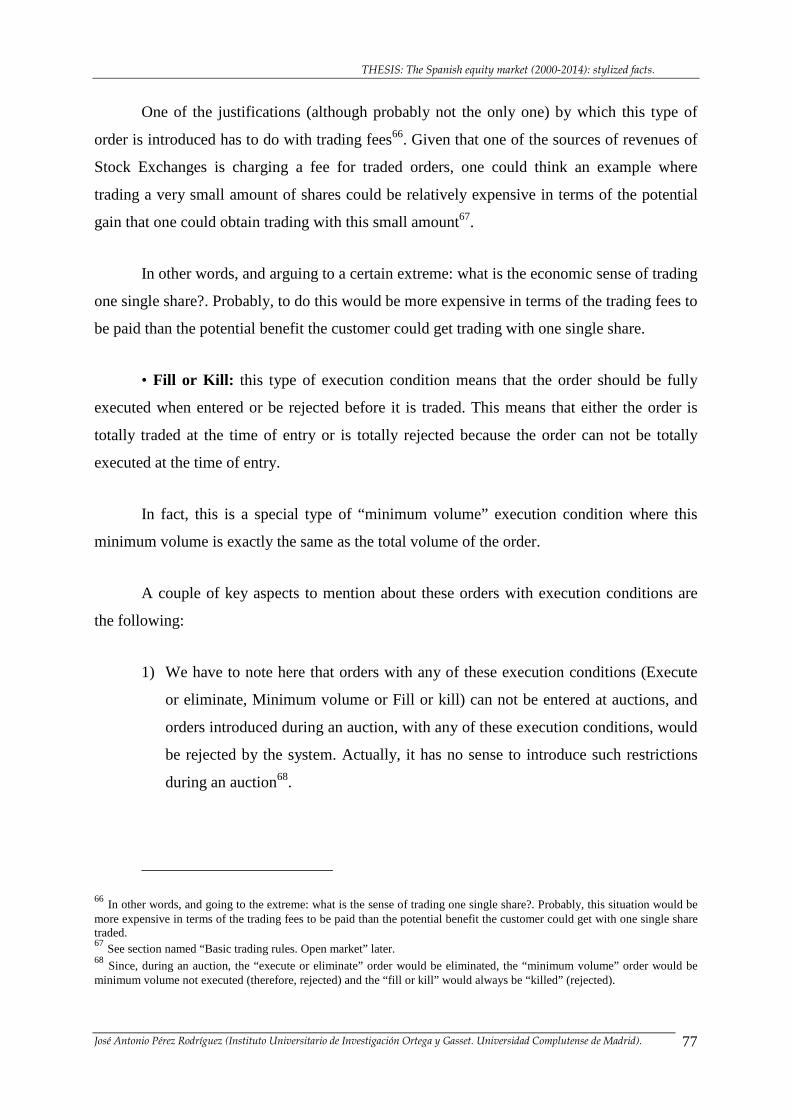
THESIS: The Spanish equity market (2000-2014): stylized facts.
José Antonio Pérez Rodríguez (Instituto Universitario de Investigación Ortega y Gasset. Universidad Complutense de Madrid). 77
One of the justifications (although probably not the only one) by which this type of
order is introduced has to do with trading fees66. Given that one of the sources of revenues of
Stock Exchanges is charging a fee for traded orders, one could think an example where
trading a very small amount of shares could be relatively expensive in terms of the potential
gain that one could obtain trading with this small amount67.
In other words, and arguing to a certain extreme: what is the economic sense of trading
one single share?. Probably, to do this would be more expensive in terms of the trading fees to
be paid than the potential benefit the customer could get trading with one single share.
• Fill or Kill: this type of execution condition means that the order should be fully
executed when entered or be rejected before it is traded. This means that either the order is
totally traded at the time of entry or is totally rejected because the order can not be totally
executed at the time of entry.
In fact, this is a special type of “minimum volume” execution condition where this
minimum volume is exactly the same as the total volume of the order.
A couple of key aspects to mention about these orders with execution conditions are
the following:
1) We have to note here that orders with any of these execution conditions (Execute
or eliminate, Minimum volume or Fill or kill) can not be entered at auctions, and
orders introduced during an auction, with any of these execution conditions, would
be rejected by the system. Actually, it has no sense to introduce such restrictions
during an auction68.
66 In other words, and going to the extreme: what is the sense of trading one single share?. Probably, this situation would be more expensive in terms of the trading fees to be paid than the potential benefit the customer could get with one single share traded. 67 See section named “Basic trading rules. Open market” later. 68 Since, during an auction, the “execute or eliminate” order would be eliminated, the “minimum volume” order would be minimum volume not executed (therefore, rejected) and the “fill or kill” would always be “killed” (rejected).
THESIS: The Spanish equity market (2000-2014): stylized facts.
José Antonio Pérez Rodríguez (Instituto Universitario de Investigación Ortega y Gasset. Universidad Complutense de Madrid). 78
2) Orders with Execute or Eliminate and Fill or Kill conditions cannot trigger
volatility auctions and will be rejected by the system in such a case. Minimum
volume orders can activate volatility auctions if the minimum volume established
in the order has been executed before triggering the volatility auction; if not, would
be rejected.
3.2.3. Iceberg orders.
Iceberg orders allow market participants to enter orders without revealing the full
volume of the order to the market. This possibility is especially interesting for large orders. In
this way, traders can avoid adverse price movements. It is necessary to note here that iceberg
orders can be limit orders, market orders or market to limit orders and, all of them, being also
iceberg orders, can have any of the execution conditions described above or none of them.
Price and time priority governs also the functioning of this type of order. Therefore,
the disclosed portion of the order (displayed volume unit) executes first. When this disclosed
portion is exhausted, the hidden part refreshes the disclosed portion to its original size but the
order is given a new time stamp (although the same number of order is kept in SIBE for the
total size of the order).
The functioning of this type of order is the following: when the order is entered in the
system, the trader must display part of the order volume (displayed volume unit) which,
according to the current Spanish regulation69 must be a minimum of 250 shares for all stocks
(regardless of the specific price of the stock). This type of order works in terms of “lot sizes”,
where each “lot size” is the displayed volume unit established by the trader when introducing
the order. It is like pre-programming an order of a specific size (i.e.: 10.000 shares), that
functions in terms of displayed volume units (i.e.: 300 shares). Once the trader specified the
displayed volume unit (in our example, 300 shares), all subsequent displayed volume units
have the same size of 300 shares. Anyway, and as any order positioned in SIBE, the trader
can modify (among other aspects) size and/or price. If the trader decides to modify the size of
69 Circular nº 1/2001 of Sociedad de Bolsas, S.A. (BME).
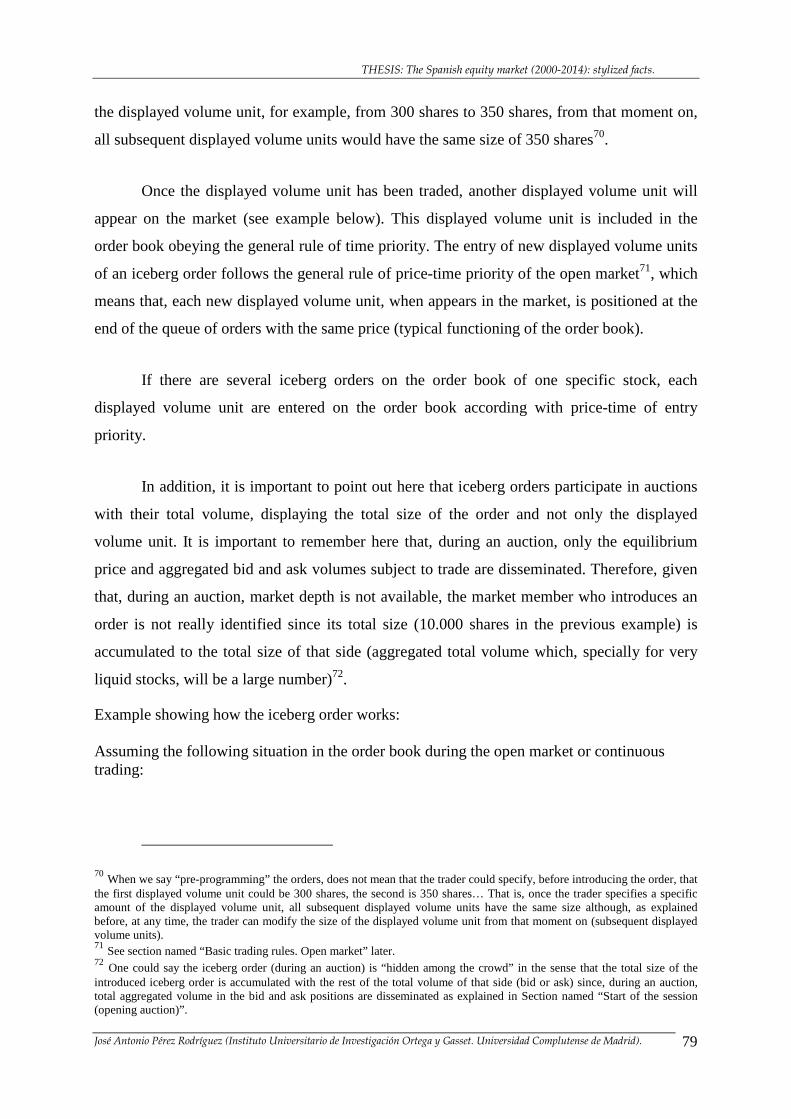
THESIS: The Spanish equity market (2000-2014): stylized facts.
José Antonio Pérez Rodríguez (Instituto Universitario de Investigación Ortega y Gasset. Universidad Complutense de Madrid). 79
the displayed volume unit, for example, from 300 shares to 350 shares, from that moment on,
all subsequent displayed volume units would have the same size of 350 shares70.
Once the displayed volume unit has been traded, another displayed volume unit will
appear on the market (see example below). This displayed volume unit is included in the
order book obeying the general rule of time priority. The entry of new displayed volume units
of an iceberg order follows the general rule of price-time priority of the open market71, which
means that, each new displayed volume unit, when appears in the market, is positioned at the
end of the queue of orders with the same price (typical functioning of the order book).
If there are several iceberg orders on the order book of one specific stock, each
displayed volume unit are entered on the order book according with price-time of entry
priority.
In addition, it is important to point out here that iceberg orders participate in auctions
with their total volume, displaying the total size of the order and not only the displayed
volume unit. It is important to remember here that, during an auction, only the equilibrium
price and aggregated bid and ask volumes subject to trade are disseminated. Therefore, given
that, during an auction, market depth is not available, the market member who introduces an
order is not really identified since its total size (10.000 shares in the previous example) is
accumulated to the total size of that side (aggregated total volume which, specially for very
liquid stocks, will be a large number)72.
Example showing how the iceberg order works: Assuming the following situation in the order book during the open market or continuous trading:
70 When we say “pre-programming” the orders, does not mean that the trader could specify, before introducing the order, that the first displayed volume unit could be 300 shares, the second is 350 shares… That is, once the trader specifies a specific amount of the displayed volume unit, all subsequent displayed volume units have the same size although, as explained before, at any time, the trader can modify the size of the displayed volume unit from that moment on (subsequent displayed volume units). 71 See section named “Basic trading rules. Open market” later. 72 One could say the iceberg order (during an auction) is “hidden among the crowd” in the sense that the total size of the introduced iceberg order is accumulated with the rest of the total volume of that side (bid or ask) since, during an auction, total aggregated volume in the bid and ask positions are disseminated as explained in Section named “Start of the session (opening auction)”.
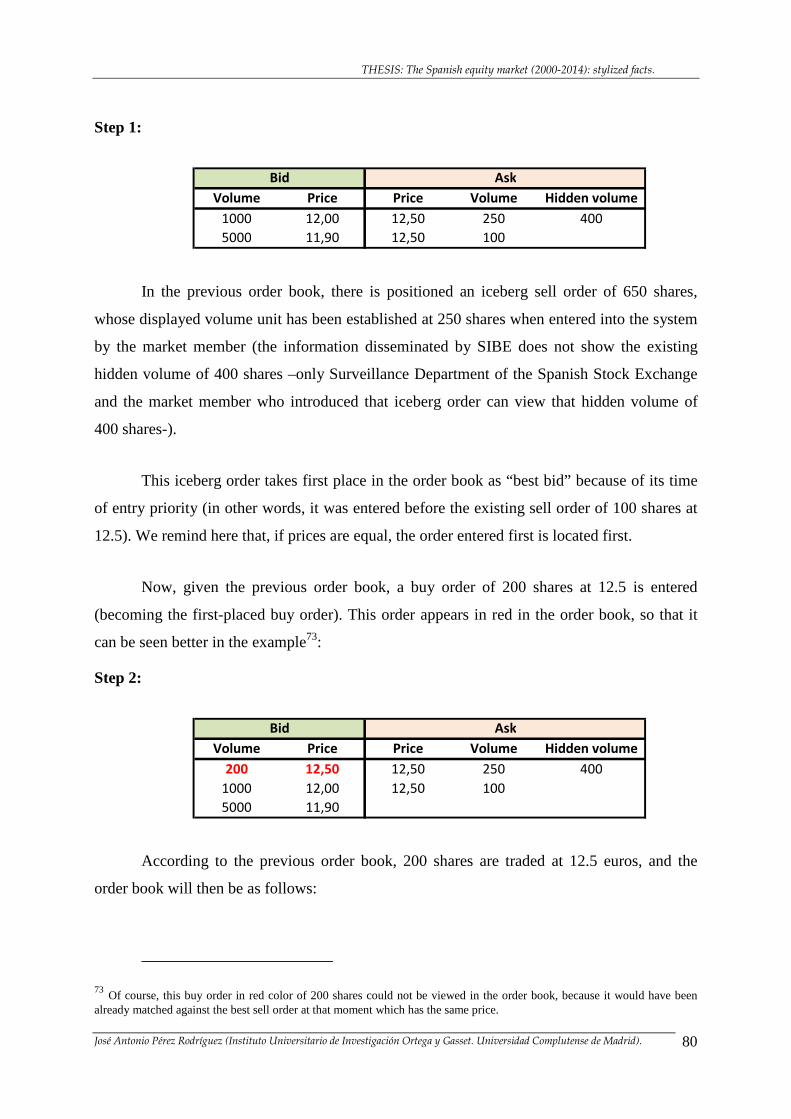
THESIS: The Spanish equity market (2000-2014): stylized facts.
José Antonio Pérez Rodríguez (Instituto Universitario de Investigación Ortega y Gasset. Universidad Complutense de Madrid). 80
Step 1:
Volume Price Price Volume Hidden volume
1000 12,00 12,50 250 400
5000 11,90 12,50 100
Bid Ask
In the previous order book, there is positioned an iceberg sell order of 650 shares,
whose displayed volume unit has been established at 250 shares when entered into the system
by the market member (the information disseminated by SIBE does not show the existing
hidden volume of 400 shares –only Surveillance Department of the Spanish Stock Exchange
and the market member who introduced that iceberg order can view that hidden volume of
400 shares-).
This iceberg order takes first place in the order book as “best bid” because of its time
of entry priority (in other words, it was entered before the existing sell order of 100 shares at
12.5). We remind here that, if prices are equal, the order entered first is located first.
Now, given the previous order book, a buy order of 200 shares at 12.5 is entered
(becoming the first-placed buy order). This order appears in red in the order book, so that it
can be seen better in the example73:
Step 2:
Volume Price Price Volume Hidden volume
200 12,50 12,50 250 400
1000 12,00 12,50 100
5000 11,90
Bid Ask
According to the previous order book, 200 shares are traded at 12.5 euros, and the
order book will then be as follows:
73 Of course, this buy order in red color of 200 shares could not be viewed in the order book, because it would have been already matched against the best sell order at that moment which has the same price.
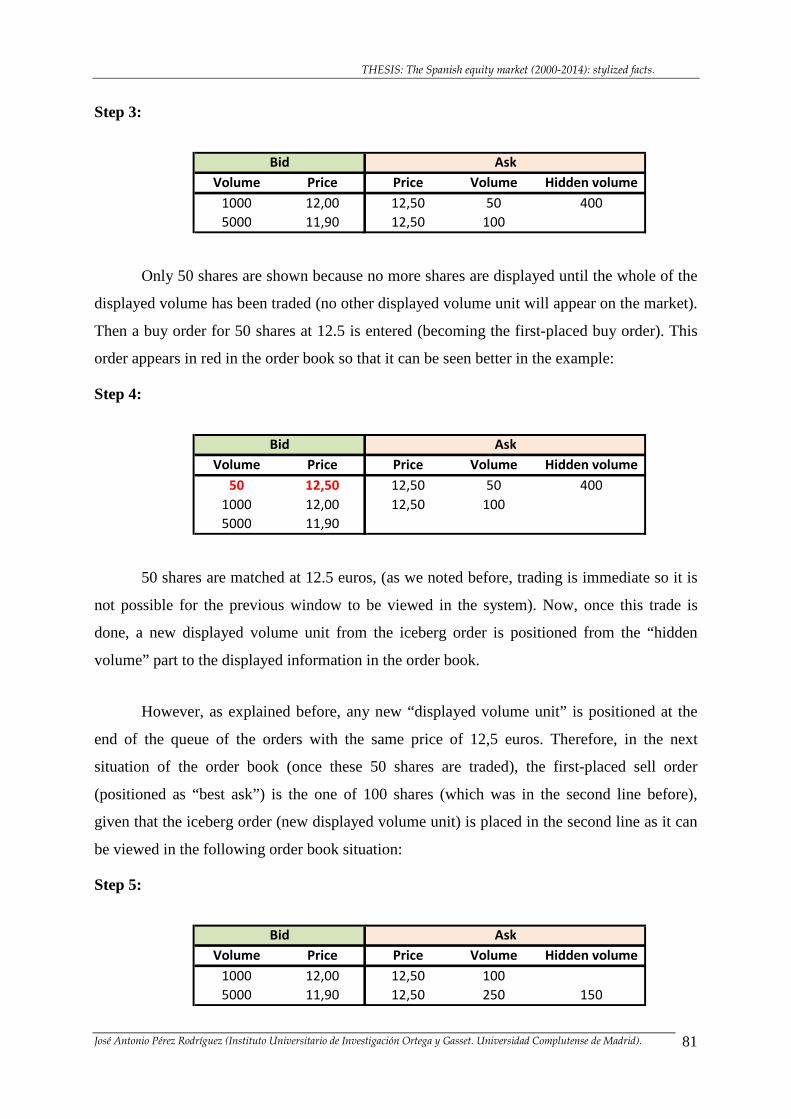
THESIS: The Spanish equity market (2000-2014): stylized facts.
José Antonio Pérez Rodríguez (Instituto Universitario de Investigación Ortega y Gasset. Universidad Complutense de Madrid). 81
Step 3:
Volume Price Price Volume Hidden volume
1000 12,00 12,50 50 400
5000 11,90 12,50 100
Bid Ask
Only 50 shares are shown because no more shares are displayed until the whole of the
displayed volume has been traded (no other displayed volume unit will appear on the market).
Then a buy order for 50 shares at 12.5 is entered (becoming the first-placed buy order). This
order appears in red in the order book so that it can be seen better in the example:
Step 4:
Volume Price Price Volume Hidden volume
50 12,50 12,50 50 400
1000 12,00 12,50 100
5000 11,90
Bid Ask
50 shares are matched at 12.5 euros, (as we noted before, trading is immediate so it is
not possible for the previous window to be viewed in the system). Now, once this trade is
done, a new displayed volume unit from the iceberg order is positioned from the “hidden
volume” part to the displayed information in the order book.
However, as explained before, any new “displayed volume unit” is positioned at the
end of the queue of the orders with the same price of 12,5 euros. Therefore, in the next
situation of the order book (once these 50 shares are traded), the first-placed sell order
(positioned as “best ask”) is the one of 100 shares (which was in the second line before),
given that the iceberg order (new displayed volume unit) is placed in the second line as it can
be viewed in the following order book situation:
Step 5:
Volume Price Price Volume Hidden volume
1000 12,00 12,50 100
5000 11,90 12,50 250 150
Bid Ask
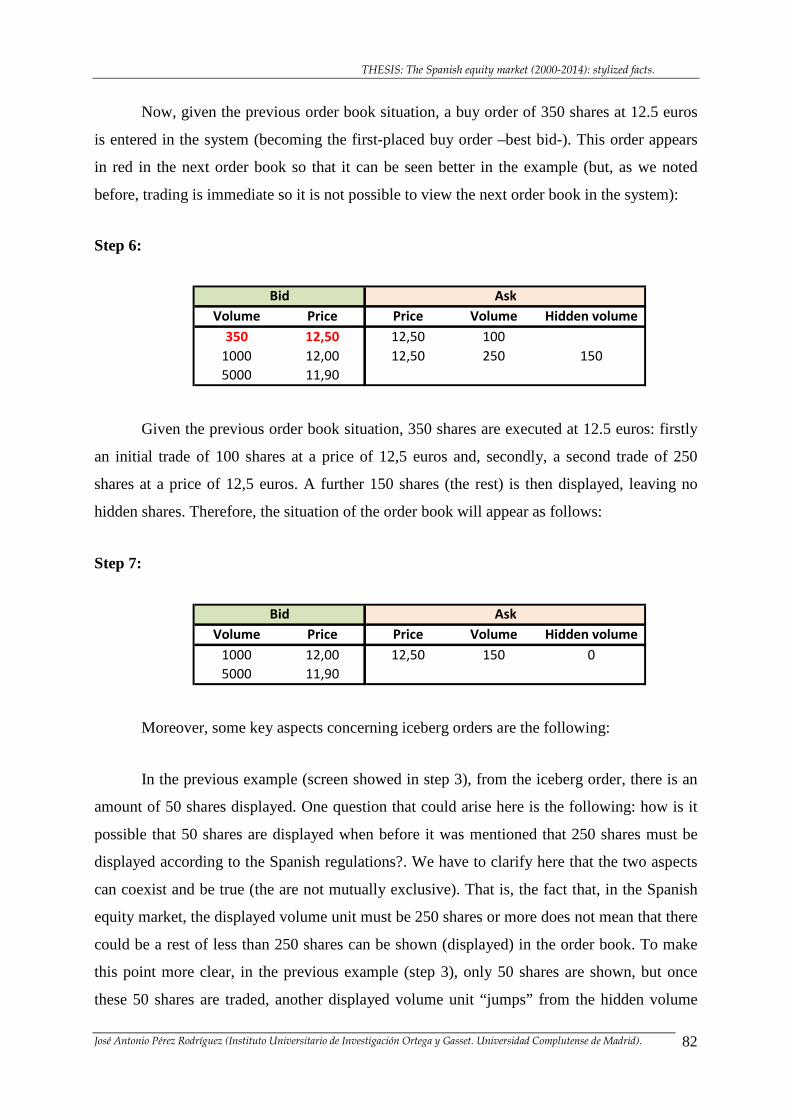
THESIS: The Spanish equity market (2000-2014): stylized facts.
José Antonio Pérez Rodríguez (Instituto Universitario de Investigación Ortega y Gasset. Universidad Complutense de Madrid). 82
Now, given the previous order book situation, a buy order of 350 shares at 12.5 euros
is entered in the system (becoming the first-placed buy order –best bid-). This order appears
in red in the next order book so that it can be seen better in the example (but, as we noted
before, trading is immediate so it is not possible to view the next order book in the system):
Step 6:
Volume Price Price Volume Hidden volume
350 12,50 12,50 100
1000 12,00 12,50 250 150
5000 11,90
Bid Ask
Given the previous order book situation, 350 shares are executed at 12.5 euros: firstly
an initial trade of 100 shares at a price of 12,5 euros and, secondly, a second trade of 250
shares at a price of 12,5 euros. A further 150 shares (the rest) is then displayed, leaving no
hidden shares. Therefore, the situation of the order book will appear as follows:
Step 7:
Volume Price Price Volume Hidden volume
1000 12,00 12,50 150 0
5000 11,90
Bid Ask
Moreover, some key aspects concerning iceberg orders are the following:
In the previous example (screen showed in step 3), from the iceberg order, there is an
amount of 50 shares displayed. One question that could arise here is the following: how is it
possible that 50 shares are displayed when before it was mentioned that 250 shares must be
displayed according to the Spanish regulations?. We have to clarify here that the two aspects
can coexist and be true (the are not mutually exclusive). That is, the fact that, in the Spanish
equity market, the displayed volume unit must be 250 shares or more does not mean that there
could be a rest of less than 250 shares can be shown (displayed) in the order book. To make
this point more clear, in the previous example (step 3), only 50 shares are shown, but once
these 50 shares are traded, another displayed volume unit “jumps” from the hidden volume
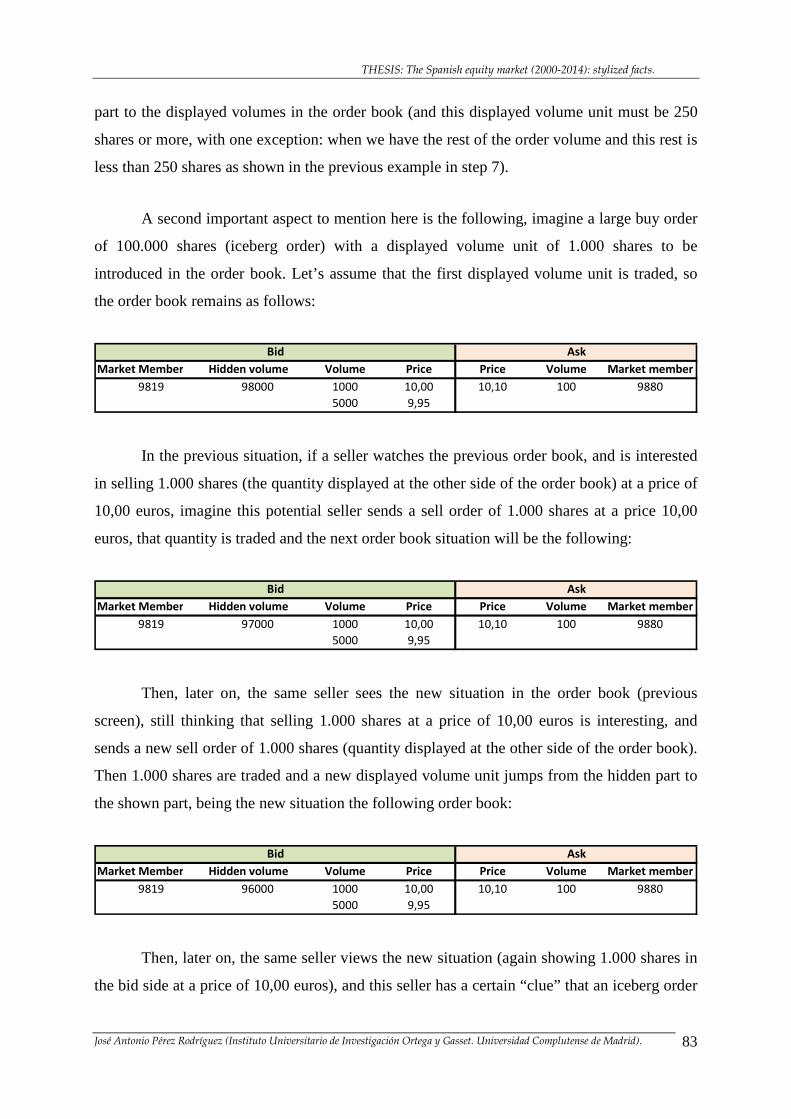
THESIS: The Spanish equity market (2000-2014): stylized facts.
José Antonio Pérez Rodríguez (Instituto Universitario de Investigación Ortega y Gasset. Universidad Complutense de Madrid). 83
part to the displayed volumes in the order book (and this displayed volume unit must be 250
shares or more, with one exception: when we have the rest of the order volume and this rest is
less than 250 shares as shown in the previous example in step 7).
A second important aspect to mention here is the following, imagine a large buy order
of 100.000 shares (iceberg order) with a displayed volume unit of 1.000 shares to be
introduced in the order book. Let’s assume that the first displayed volume unit is traded, so
the order book remains as follows:
Market Member Hidden volume Volume Price Price Volume Market member
9819 98000 1000 10,00 10,10 100 9880
5000 9,95
AskBid
In the previous situation, if a seller watches the previous order book, and is interested
in selling 1.000 shares (the quantity displayed at the other side of the order book) at a price of
10,00 euros, imagine this potential seller sends a sell order of 1.000 shares at a price 10,00
euros, that quantity is traded and the next order book situation will be the following:
Market Member Hidden volume Volume Price Price Volume Market member
9819 97000 1000 10,00 10,10 100 9880
5000 9,95
Bid Ask
Then, later on, the same seller sees the new situation in the order book (previous
screen), still thinking that selling 1.000 shares at a price of 10,00 euros is interesting, and
sends a new sell order of 1.000 shares (quantity displayed at the other side of the order book).
Then 1.000 shares are traded and a new displayed volume unit jumps from the hidden part to
the shown part, being the new situation the following order book:
Market Member Hidden volume Volume Price Price Volume Market member
9819 96000 1000 10,00 10,10 100 9880
5000 9,95
Bid Ask
Then, later on, the same seller views the new situation (again showing 1.000 shares in
the bid side at a price of 10,00 euros), and this seller has a certain “clue” that an iceberg order
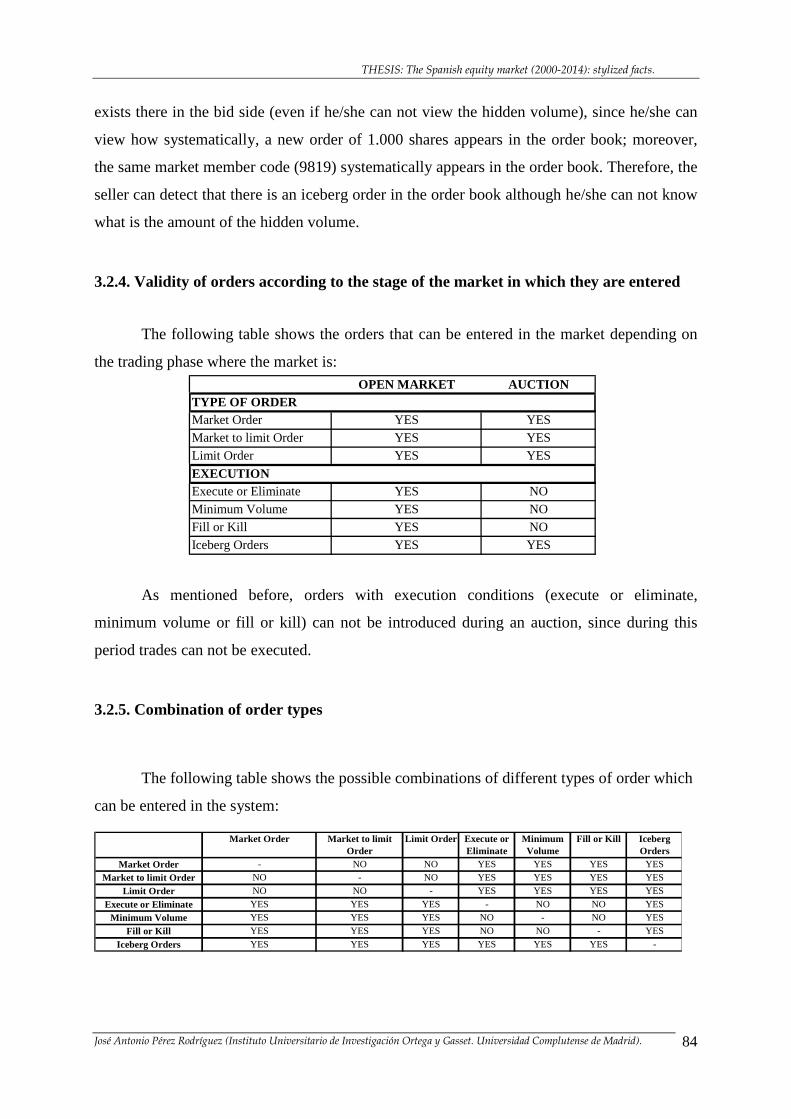
THESIS: The Spanish equity market (2000-2014): stylized facts.
José Antonio Pérez Rodríguez (Instituto Universitario de Investigación Ortega y Gasset. Universidad Complutense de Madrid). 84
OPEN MARKET AUCTIONTYPE OF ORDERMarket Order YES YESMarket to limit Order YES YESLimit Order YES YES
EXECUTION Execute or Eliminate YES NOMinimum Volume YES NOFill or Kill YES NOIceberg Orders YES YES
exists there in the bid side (even if he/she can not view the hidden volume), since he/she can
view how systematically, a new order of 1.000 shares appears in the order book; moreover,
the same market member code (9819) systematically appears in the order book. Therefore, the
seller can detect that there is an iceberg order in the order book although he/she can not know
what is the amount of the hidden volume.
3.2.4. Validity of orders according to the stage of the market in which they are entered
The following table shows the orders that can be entered in the market depending on
the trading phase where the market is:
As mentioned before, orders with execution conditions (execute or eliminate,
minimum volume or fill or kill) can not be introduced during an auction, since during this
period trades can not be executed.
3.2.5. Combination of order types
The following table shows the possible combinations of different types of order which
can be entered in the system:
Market Order - NO NO YES YES YES YES
Market to limit Order NO - NO YES YES YES YES
Limit Order NO NO - YES YES YES YES
Execute or Eliminate YES YES YES - NO NO YES
Minimum Volume YES YES YES NO - NO YES
Fill or Kill YES YES YES NO NO - YES
Iceberg Orders YES YES YES YES YES YES -
Execute or Eliminate
Minimum Volume
Fill or Kill Iceberg Orders
Market Order Market to limit Order
Limit Order
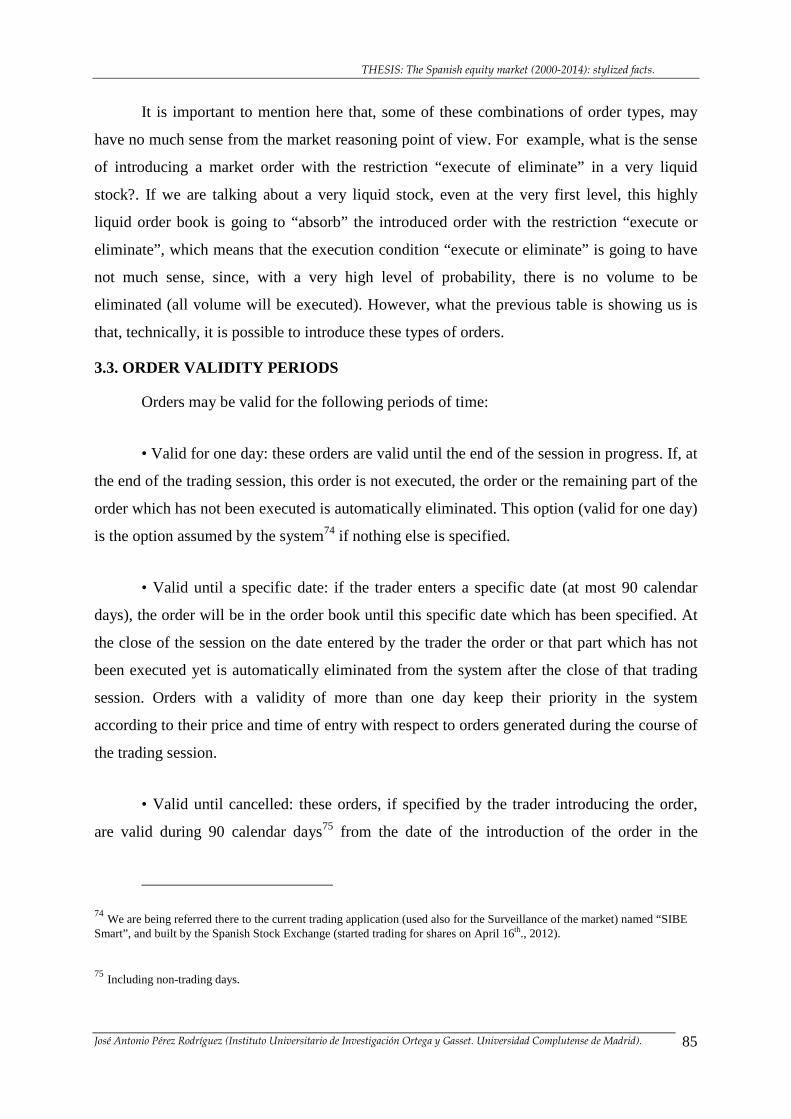
THESIS: The Spanish equity market (2000-2014): stylized facts.
José Antonio Pérez Rodríguez (Instituto Universitario de Investigación Ortega y Gasset. Universidad Complutense de Madrid). 85
It is important to mention here that, some of these combinations of order types, may
have no much sense from the market reasoning point of view. For example, what is the sense
of introducing a market order with the restriction “execute of eliminate” in a very liquid
stock?. If we are talking about a very liquid stock, even at the very first level, this highly
liquid order book is going to “absorb” the introduced order with the restriction “execute or
eliminate”, which means that the execution condition “execute or eliminate” is going to have
not much sense, since, with a very high level of probability, there is no volume to be
eliminated (all volume will be executed). However, what the previous table is showing us is
that, technically, it is possible to introduce these types of orders.
3.3. ORDER VALIDITY PERIODS
Orders may be valid for the following periods of time:
• Valid for one day: these orders are valid until the end of the session in progress. If, at
the end of the trading session, this order is not executed, the order or the remaining part of the
order which has not been executed is automatically eliminated. This option (valid for one day)
is the option assumed by the system74 if nothing else is specified.
• Valid until a specific date: if the trader enters a specific date (at most 90 calendar
days), the order will be in the order book until this specific date which has been specified. At
the close of the session on the date entered by the trader the order or that part which has not
been executed yet is automatically eliminated from the system after the close of that trading
session. Orders with a validity of more than one day keep their priority in the system
according to their price and time of entry with respect to orders generated during the course of
the trading session.
• Valid until cancelled: these orders, if specified by the trader introducing the order,
are valid during 90 calendar days75 from the date of the introduction of the order in the
74 We are being referred there to the current trading application (used also for the Surveillance of the market) named “SIBE Smart”, and built by the Spanish Stock Exchange (started trading for shares on April 16th., 2012).
75 Including non-trading days.
THESIS: The Spanish equity market (2000-2014): stylized facts.
José Antonio Pérez Rodríguez (Instituto Universitario de Investigación Ortega y Gasset. Universidad Complutense de Madrid). 86
system. After these 90 calendar days, the order or that part which has not been executed is
automatically eliminated from the system after the close of that trading session. Orders with a
validity of more than one day keep their priority in the system according to their price and
time of entry with respect to orders generated during the course of the trading session.
3.4. ORDERS MODIFICATION
When an order is introduced in SIBE, the system will assign to this order an “order
number”, which remains invariable during the whole life of it. To every order modification, a
new “number of history” will be generated (consecutively to be able to follow the evolution of
the order, and its subsequent modifications or cancellations).
Besides, if the modification or an order has an impact on its priority, a new “number of
priority” will be generated. The types of modifications that changes this priority are the
following:
- Change in price: any modification of the price of the order implies a change on
priority, according to the general rule of price-priority of the order book in SIBE76.
Therefore, the field “number of priority” of the application would change if the
price is modified.
- Increase of volume: any increase of the order volume of the order implies a change
on priority, since this order now is more “aggressive” in terms or demanding more
liquidity to the order book. Therefore, the field “number of priority” of the
application would change if this volume of the order is increased. However, if a
modification of the order book consists in a decrease of the order volume, then
priority holds and there is no change of the number of priority (this order would
now be less aggressive to the order book).
76 See section named “Basic trading rules. Open market” later.
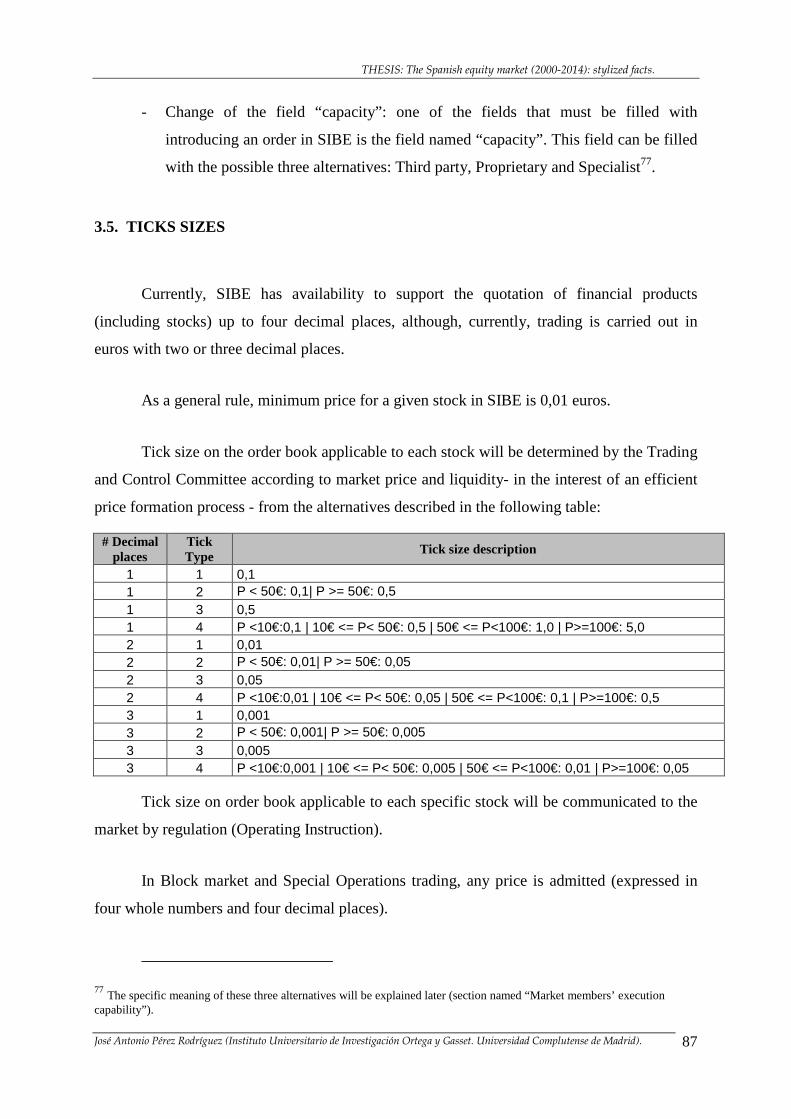
THESIS: The Spanish equity market (2000-2014): stylized facts.
José Antonio Pérez Rodríguez (Instituto Universitario de Investigación Ortega y Gasset. Universidad Complutense de Madrid). 87
- Change of the field “capacity”: one of the fields that must be filled with
introducing an order in SIBE is the field named “capacity”. This field can be filled
with the possible three alternatives: Third party, Proprietary and Specialist77.
3.5. TICKS SIZES
Currently, SIBE has availability to support the quotation of financial products
(including stocks) up to four decimal places, although, currently, trading is carried out in
euros with two or three decimal places.
As a general rule, minimum price for a given stock in SIBE is 0,01 euros.
Tick size on the order book applicable to each stock will be determined by the Trading
and Control Committee according to market price and liquidity- in the interest of an efficient
price formation process - from the alternatives described in the following table:
# Decimal places
Tick Type
Tick size description
1 1 0,1 1 2 P < 50€: 0,1| P >= 50€: 0,5 1 3 0,5 1 4 P <10€:0,1 | 10€ <= P< 50€: 0,5 | 50€ <= P<100€: 1,0 | P>=100€: 5,0 2 1 0,01 2 2 P < 50€: 0,01| P >= 50€: 0,05 2 3 0,05 2 4 P <10€:0,01 | 10€ <= P< 50€: 0,05 | 50€ <= P<100€: 0,1 | P>=100€: 0,5 3 1 0,001 3 2 P < 50€: 0,001| P >= 50€: 0,005 3 3 0,005 3 4 P <10€:0,001 | 10€ <= P< 50€: 0,005 | 50€ <= P<100€: 0,01 | P>=100€: 0,05
Tick size on order book applicable to each specific stock will be communicated to the
market by regulation (Operating Instruction).
In Block market and Special Operations trading, any price is admitted (expressed in
four whole numbers and four decimal places).
77 The specific meaning of these three alternatives will be explained later (section named “Market members’ execution capability”).
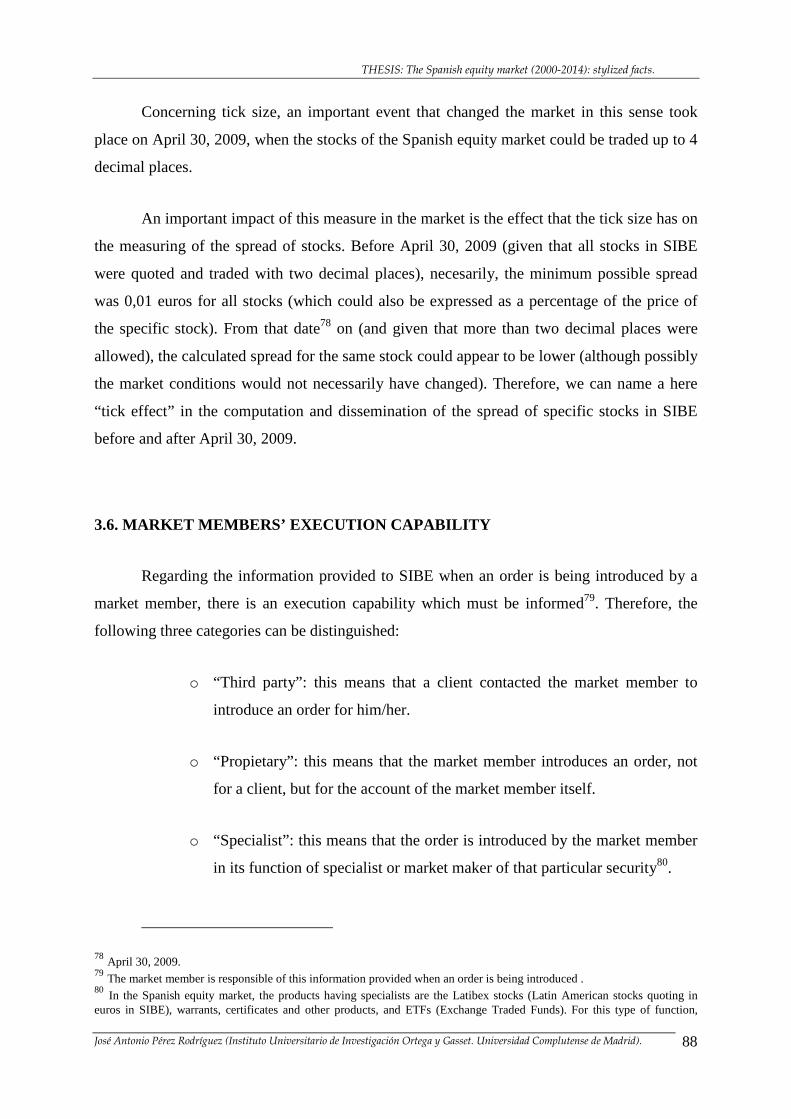
THESIS: The Spanish equity market (2000-2014): stylized facts.
José Antonio Pérez Rodríguez (Instituto Universitario de Investigación Ortega y Gasset. Universidad Complutense de Madrid). 88
Concerning tick size, an important event that changed the market in this sense took
place on April 30, 2009, when the stocks of the Spanish equity market could be traded up to 4
decimal places.
An important impact of this measure in the market is the effect that the tick size has on
the measuring of the spread of stocks. Before April 30, 2009 (given that all stocks in SIBE
were quoted and traded with two decimal places), necesarily, the minimum possible spread
was 0,01 euros for all stocks (which could also be expressed as a percentage of the price of
the specific stock). From that date78 on (and given that more than two decimal places were
allowed), the calculated spread for the same stock could appear to be lower (although possibly
the market conditions would not necessarily have changed). Therefore, we can name a here
“tick effect” in the computation and dissemination of the spread of specific stocks in SIBE
before and after April 30, 2009.
3.6. MARKET MEMBERS’ EXECUTION CAPABILITY
Regarding the information provided to SIBE when an order is being introduced by a
market member, there is an execution capability which must be informed79. Therefore, the
following three categories can be distinguished:
o “Third party”: this means that a client contacted the market member to
introduce an order for him/her.
o “Propietary”: this means that the market member introduces an order, not
for a client, but for the account of the market member itself.
o “Specialist”: this means that the order is introduced by the market member
in its function of specialist or market maker of that particular security80.
78 April 30, 2009. 79 The market member is responsible of this information provided when an order is being introduced . 80 In the Spanish equity market, the products having specialists are the Latibex stocks (Latin American stocks quoting in euros in SIBE), warrants, certificates and other products, and ETFs (Exchange Traded Funds). For this type of function,
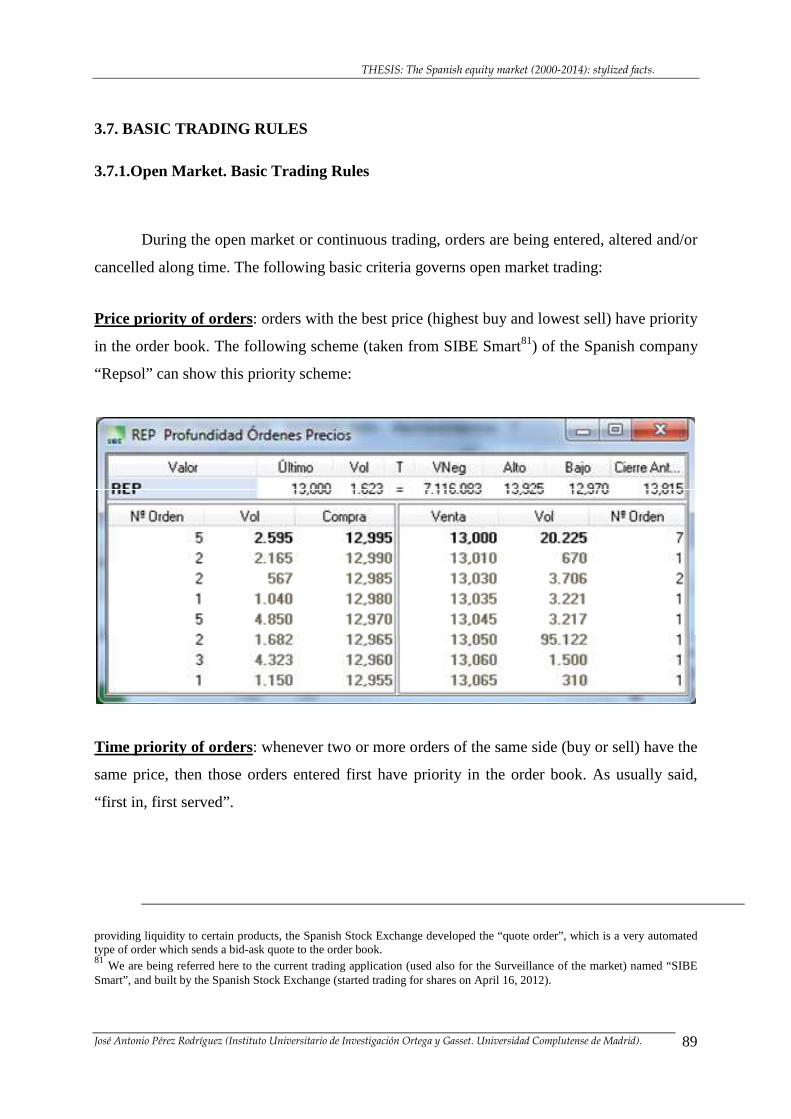
THESIS: The Spanish equity market (2000-2014): stylized facts.
José Antonio Pérez Rodríguez (Instituto Universitario de Investigación Ortega y Gasset. Universidad Complutense de Madrid). 89
3.7. BASIC TRADING RULES
3.7.1.Open Market. Basic Trading Rules
During the open market or continuous trading, orders are being entered, altered and/or
cancelled along time. The following basic criteria governs open market trading:
Price priority of orders : orders with the best price (highest buy and lowest sell) have priority
in the order book. The following scheme (taken from SIBE Smart81) of the Spanish company
“Repsol” can show this priority scheme:
Time priority of orders : whenever two or more orders of the same side (buy or sell) have the
same price, then those orders entered first have priority in the order book. As usually said,
“first in, first served”.
providing liquidity to certain products, the Spanish Stock Exchange developed the “quote order”, which is a very automated type of order which sends a bid-ask quote to the order book. 81 We are being referred here to the current trading application (used also for the Surveillance of the market) named “SIBE Smart”, and built by the Spanish Stock Exchange (started trading for shares on April 16, 2012).
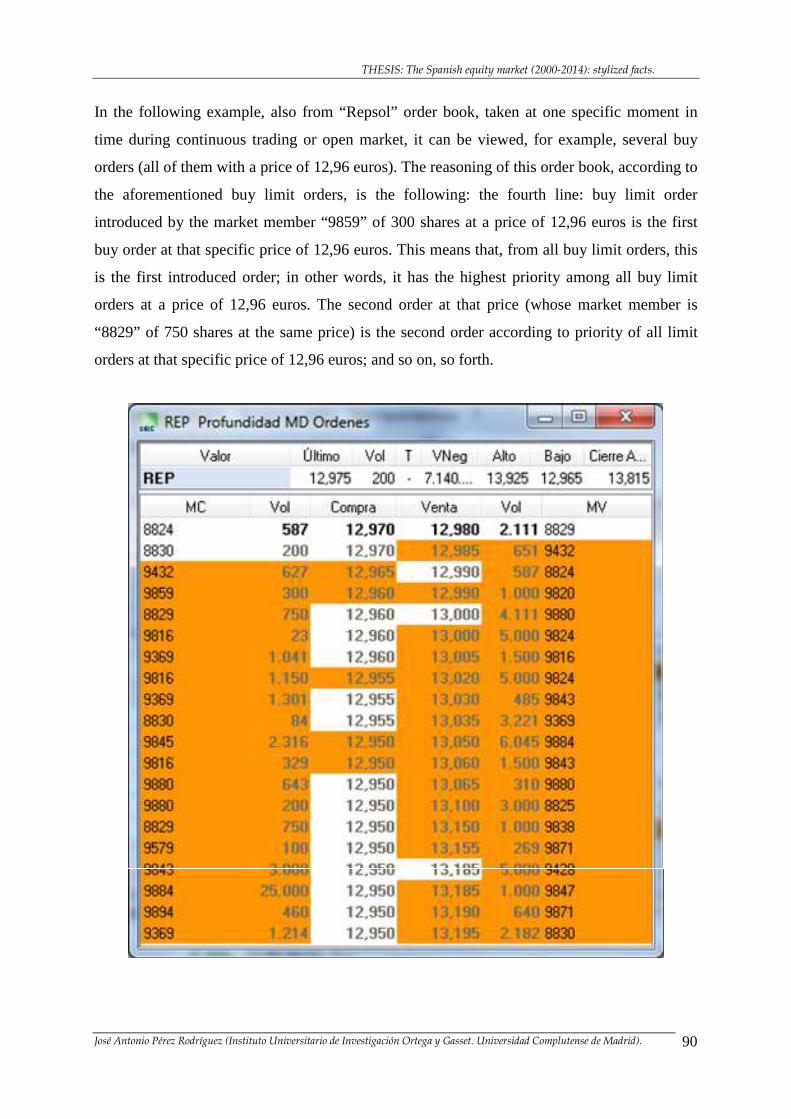
THESIS: The Spanish equity market (2000-2014): stylized facts.
José Antonio Pérez Rodríguez (Instituto Universitario de Investigación Ortega y Gasset. Universidad Complutense de Madrid). 90
In the following example, also from “Repsol” order book, taken at one specific moment in
time during continuous trading or open market, it can be viewed, for example, several buy
orders (all of them with a price of 12,96 euros). The reasoning of this order book, according to
the aforementioned buy limit orders, is the following: the fourth line: buy limit order
introduced by the market member “9859” of 300 shares at a price of 12,96 euros is the first
buy order at that specific price of 12,96 euros. This means that, from all buy limit orders, this
is the first introduced order; in other words, it has the highest priority among all buy limit
orders at a price of 12,96 euros. The second order at that price (whose market member is
“8829” of 750 shares at the same price) is the second order according to priority of all limit
orders at that specific price of 12,96 euros; and so on, so forth.
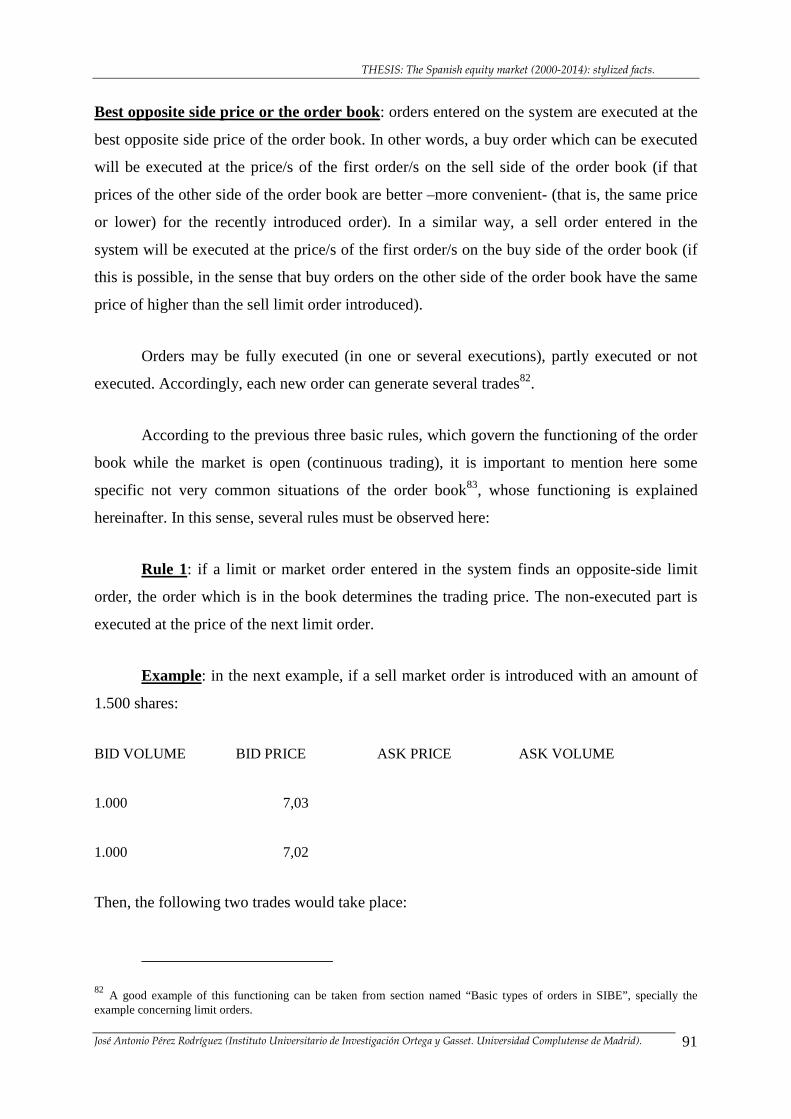
THESIS: The Spanish equity market (2000-2014): stylized facts.
José Antonio Pérez Rodríguez (Instituto Universitario de Investigación Ortega y Gasset. Universidad Complutense de Madrid). 91
Best opposite side price or the order book: orders entered on the system are executed at the
best opposite side price of the order book. In other words, a buy order which can be executed
will be executed at the price/s of the first order/s on the sell side of the order book (if that
prices of the other side of the order book are better –more convenient- (that is, the same price
or lower) for the recently introduced order). In a similar way, a sell order entered in the
system will be executed at the price/s of the first order/s on the buy side of the order book (if
this is possible, in the sense that buy orders on the other side of the order book have the same
price of higher than the sell limit order introduced).
Orders may be fully executed (in one or several executions), partly executed or not
executed. Accordingly, each new order can generate several trades82.
According to the previous three basic rules, which govern the functioning of the order
book while the market is open (continuous trading), it is important to mention here some
specific not very common situations of the order book83, whose functioning is explained
hereinafter. In this sense, several rules must be observed here:
Rule 1: if a limit or market order entered in the system finds an opposite-side limit
order, the order which is in the book determines the trading price. The non-executed part is
executed at the price of the next limit order.
Example: in the next example, if a sell market order is introduced with an amount of
1.500 shares:
BID VOLUME BID PRICE ASK PRICE ASK VOLUME
1.000 7,03
1.000 7,02
Then, the following two trades would take place:
82 A good example of this functioning can be taken from section named “Basic types of orders in SIBE”, specially the example concerning limit orders.
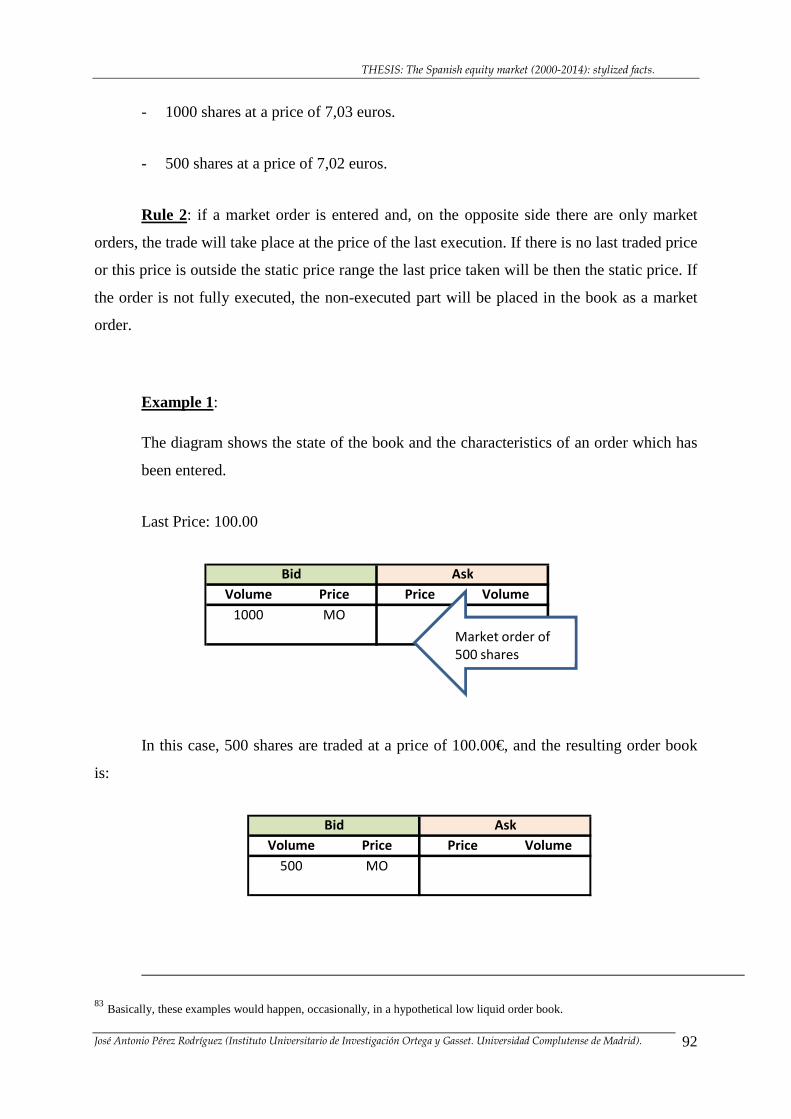
THESIS: The Spanish equity market (2000-2014): stylized facts.
José Antonio Pérez Rodríguez (Instituto Universitario de Investigación Ortega y Gasset. Universidad Complutense de Madrid). 92
- 1000 shares at a price of 7,03 euros.
- 500 shares at a price of 7,02 euros.
Rule 2: if a market order is entered and, on the opposite side there are only market
orders, the trade will take place at the price of the last execution. If there is no last traded price
or this price is outside the static price range the last price taken will be then the static price. If
the order is not fully executed, the non-executed part will be placed in the book as a market
order.
Example 1:
The diagram shows the state of the book and the characteristics of an order which has
been entered.
Last Price: 100.00
Volume Price Price Volume
1000 MO
Bid Ask
Market order of
500 shares
In this case, 500 shares are traded at a price of 100.00€, and the resulting order book
is:
Volume Price Price Volume
500 MO
Bid Ask
83 Basically, these examples would happen, occasionally, in a hypothetical low liquid order book.
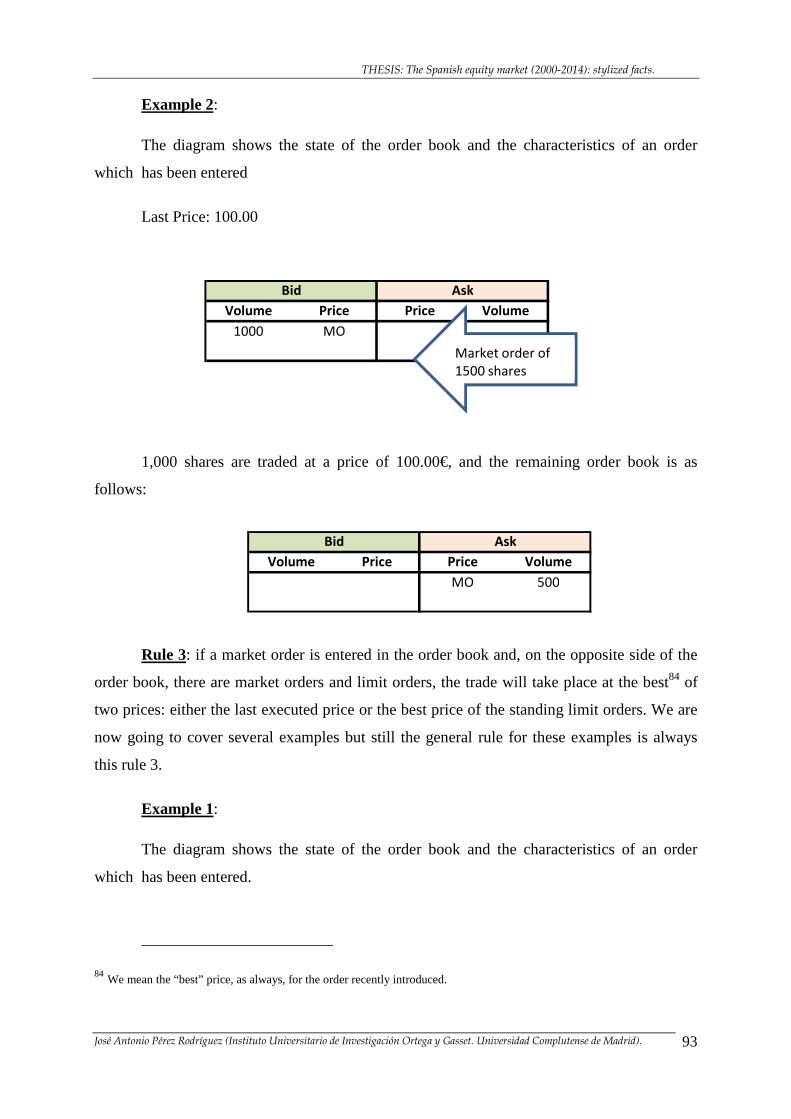
THESIS: The Spanish equity market (2000-2014): stylized facts.
José Antonio Pérez Rodríguez (Instituto Universitario de Investigación Ortega y Gasset. Universidad Complutense de Madrid). 93
Example 2:
The diagram shows the state of the order book and the characteristics of an order
which has been entered
Last Price: 100.00
Volume Price Price Volume
1000 MO
Bid Ask
Market order of
1500 shares
1,000 shares are traded at a price of 100.00€, and the remaining order book is as
follows:
Volume Price Price Volume
MO 500
Bid Ask
Rule 3: if a market order is entered in the order book and, on the opposite side of the
order book, there are market orders and limit orders, the trade will take place at the best84 of
two prices: either the last executed price or the best price of the standing limit orders. We are
now going to cover several examples but still the general rule for these examples is always
this rule 3.
Example 1:
The diagram shows the state of the order book and the characteristics of an order
which has been entered.
84 We mean the “best” price, as always, for the order recently introduced.
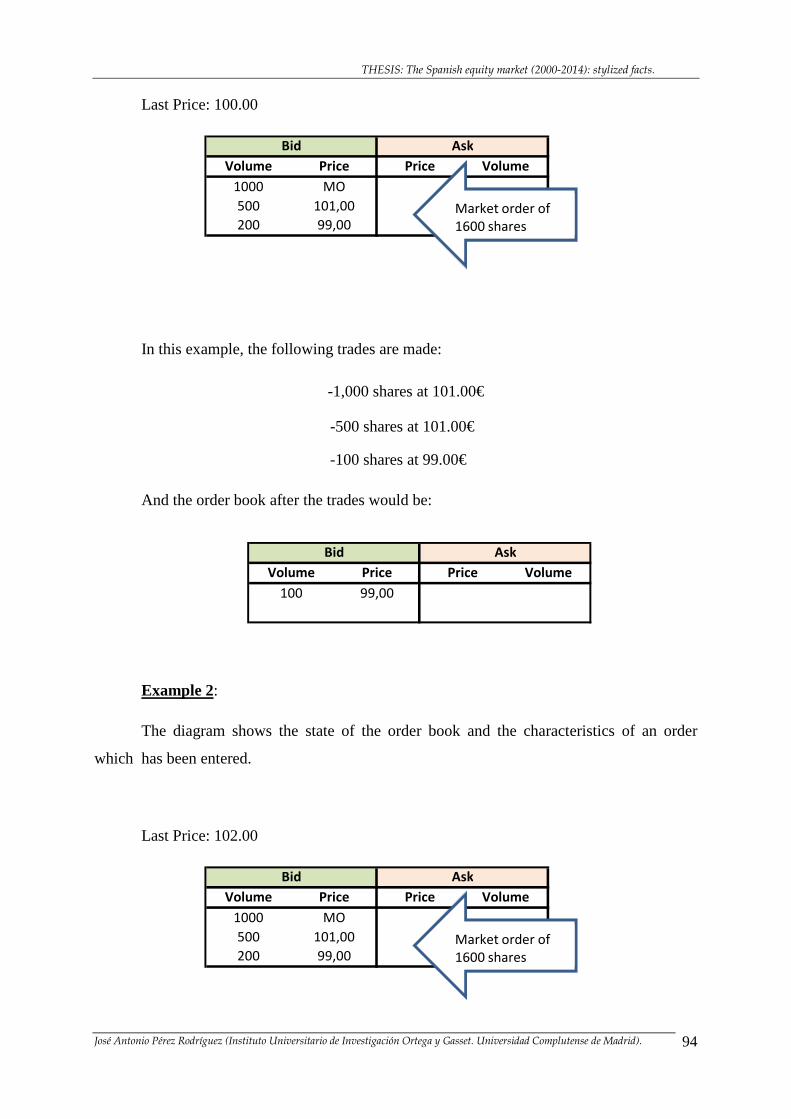
THESIS: The Spanish equity market (2000-2014): stylized facts.
José Antonio Pérez Rodríguez (Instituto Universitario de Investigación Ortega y Gasset. Universidad Complutense de Madrid). 94
Last Price: 100.00
Volume Price Price Volume
1000 MO
500 101,00
200 99,00
Bid Ask
Market order of
1600 shares
In this example, the following trades are made:
-1,000 shares at 101.00€
-500 shares at 101.00€
-100 shares at 99.00€
And the order book after the trades would be:
Volume Price Price Volume
100 99,00
Bid Ask
Example 2:
The diagram shows the state of the order book and the characteristics of an order
which has been entered.
Last Price: 102.00
Volume Price Price Volume
1000 MO
500 101,00
200 99,00
Bid Ask
Market order of
1600 shares
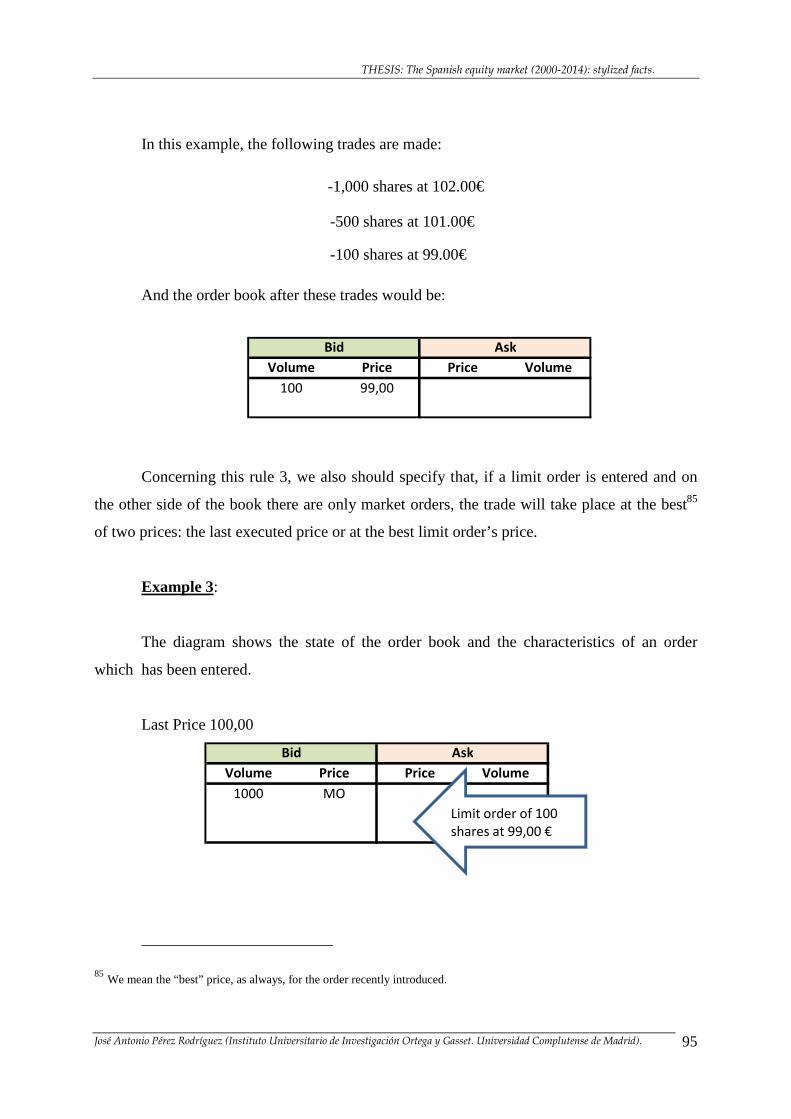
THESIS: The Spanish equity market (2000-2014): stylized facts.
José Antonio Pérez Rodríguez (Instituto Universitario de Investigación Ortega y Gasset. Universidad Complutense de Madrid). 95
In this example, the following trades are made:
-1,000 shares at 102.00€
-500 shares at 101.00€
-100 shares at 99.00€
And the order book after these trades would be:
Volume Price Price Volume
100 99,00
Bid Ask
Concerning this rule 3, we also should specify that, if a limit order is entered and on
the other side of the book there are only market orders, the trade will take place at the best85
of two prices: the last executed price or at the best limit order’s price.
Example 3:
The diagram shows the state of the order book and the characteristics of an order
which has been entered.
Last Price 100,00
Volume Price Price Volume
1000 MO
Bid Ask
Limit order of 100
shares at 99,00 €
85 We mean the “best” price, as always, for the order recently introduced.
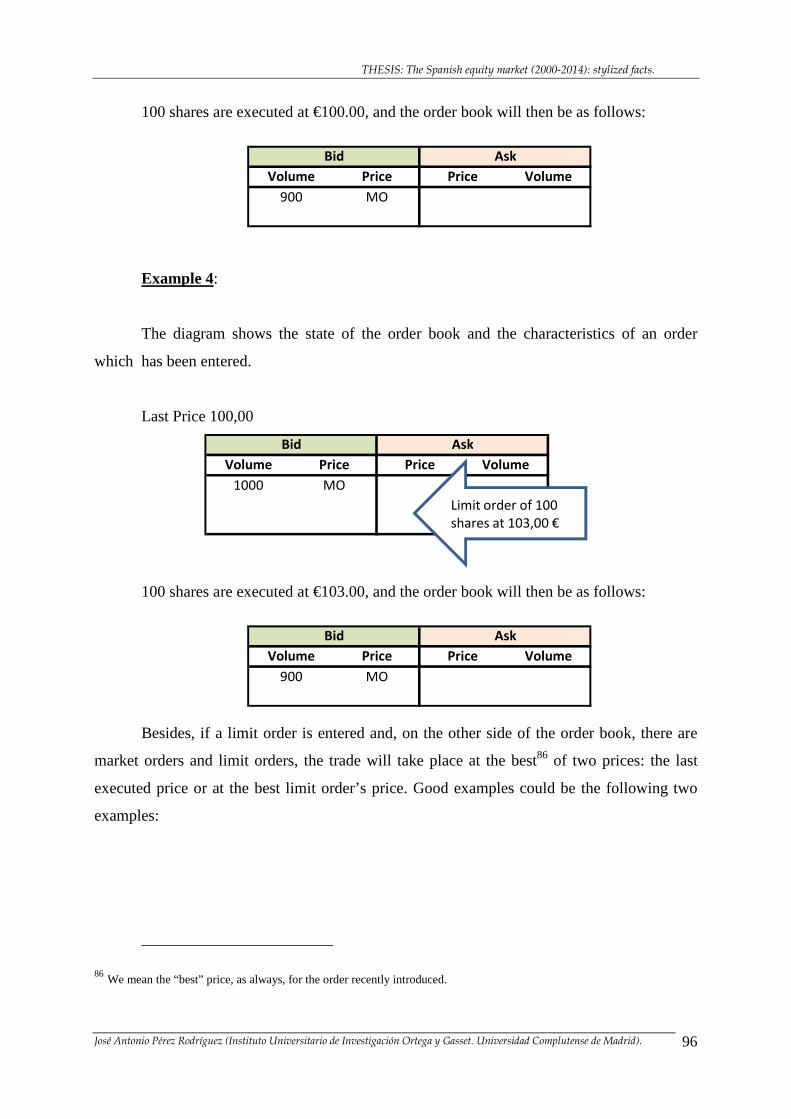
THESIS: The Spanish equity market (2000-2014): stylized facts.
José Antonio Pérez Rodríguez (Instituto Universitario de Investigación Ortega y Gasset. Universidad Complutense de Madrid). 96
100 shares are executed at €100.00, and the order book will then be as follows:
Volume Price Price Volume
900 MO
Bid Ask
Example 4:
The diagram shows the state of the order book and the characteristics of an order
which has been entered.
Last Price 100,00
Volume Price Price Volume
1000 MO
Bid Ask
Limit order of 100
shares at 103,00 €
100 shares are executed at €103.00, and the order book will then be as follows:
Volume Price Price Volume
900 MO
Bid Ask
Besides, if a limit order is entered and, on the other side of the order book, there are
market orders and limit orders, the trade will take place at the best86 of two prices: the last
executed price or at the best limit order’s price. Good examples could be the following two
examples:
86 We mean the “best” price, as always, for the order recently introduced.
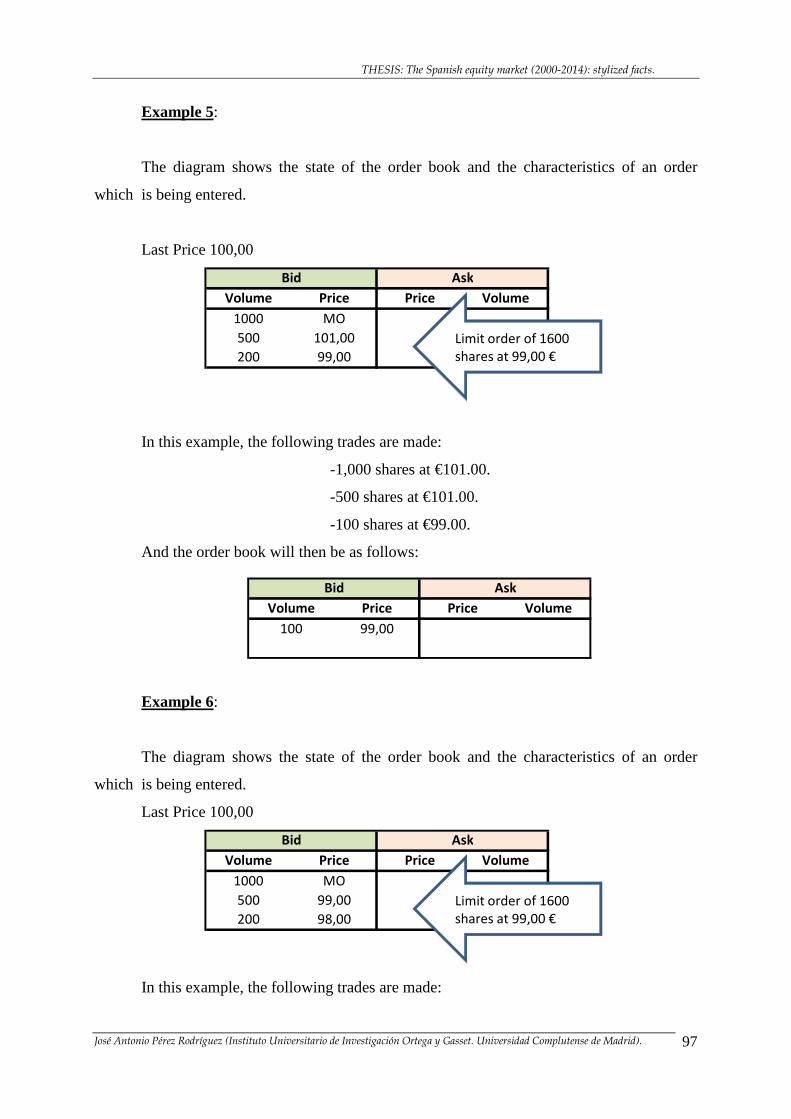
THESIS: The Spanish equity market (2000-2014): stylized facts.
José Antonio Pérez Rodríguez (Instituto Universitario de Investigación Ortega y Gasset. Universidad Complutense de Madrid). 97
Example 5:
The diagram shows the state of the order book and the characteristics of an order
which is being entered.
Last Price 100,00
Volume Price Price Volume
1000 MO
500 101,00
200 99,00
Bid Ask
Limit order of 1600
shares at 99,00 €
In this example, the following trades are made:
-1,000 shares at €101.00.
-500 shares at €101.00.
-100 shares at €99.00.
And the order book will then be as follows:
Volume Price Price Volume
100 99,00
Bid Ask
Example 6:
The diagram shows the state of the order book and the characteristics of an order
which is being entered.
Last Price 100,00
Volume Price Price Volume
1000 MO
500 99,00
200 98,00
Bid Ask
Limit order of 1600
shares at 99,00 €
In this example, the following trades are made:
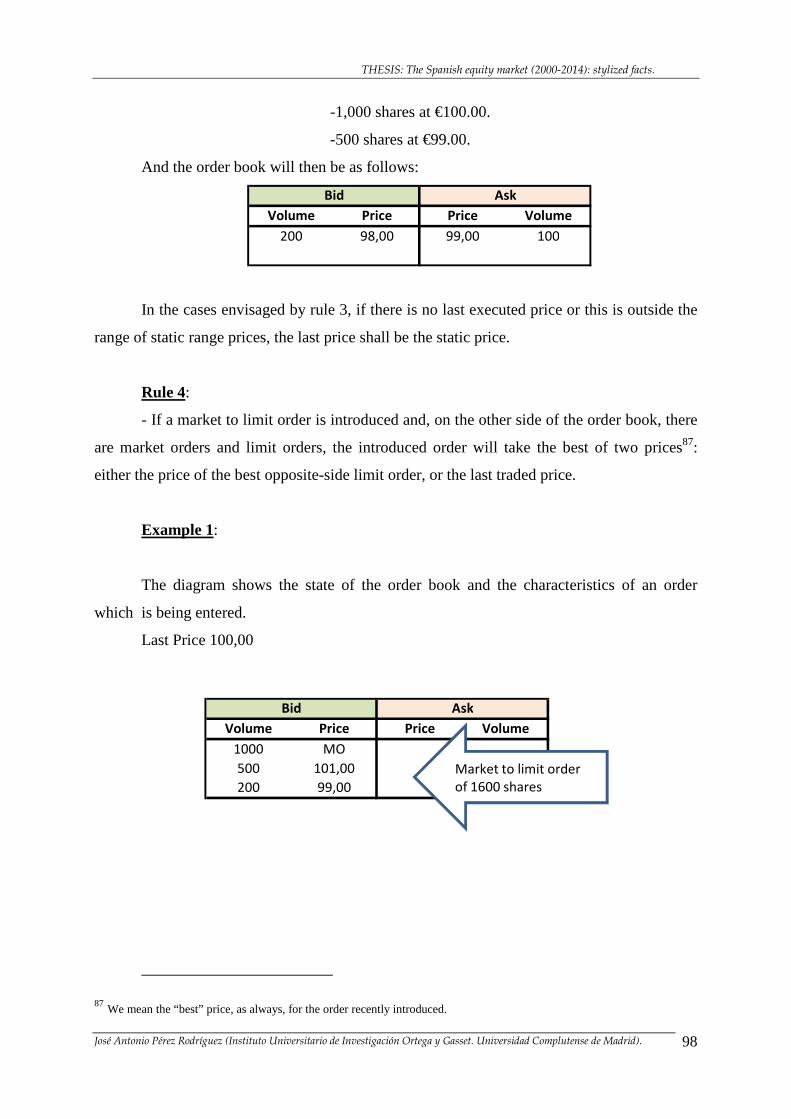
THESIS: The Spanish equity market (2000-2014): stylized facts.
José Antonio Pérez Rodríguez (Instituto Universitario de Investigación Ortega y Gasset. Universidad Complutense de Madrid). 98
-1,000 shares at €100.00.
-500 shares at €99.00.
And the order book will then be as follows:
Volume Price Price Volume
200 98,00 99,00 100
Bid Ask
In the cases envisaged by rule 3, if there is no last executed price or this is outside the
range of static range prices, the last price shall be the static price.
Rule 4:
- If a market to limit order is introduced and, on the other side of the order book, there
are market orders and limit orders, the introduced order will take the best of two prices87:
either the price of the best opposite-side limit order, or the last traded price.
Example 1:
The diagram shows the state of the order book and the characteristics of an order
which is being entered.
Last Price 100,00
Volume Price Price Volume
1000 MO
500 101,00
200 99,00
Bid Ask
Market to limit order
of 1600 shares
87 We mean the “best” price, as always, for the order recently introduced.
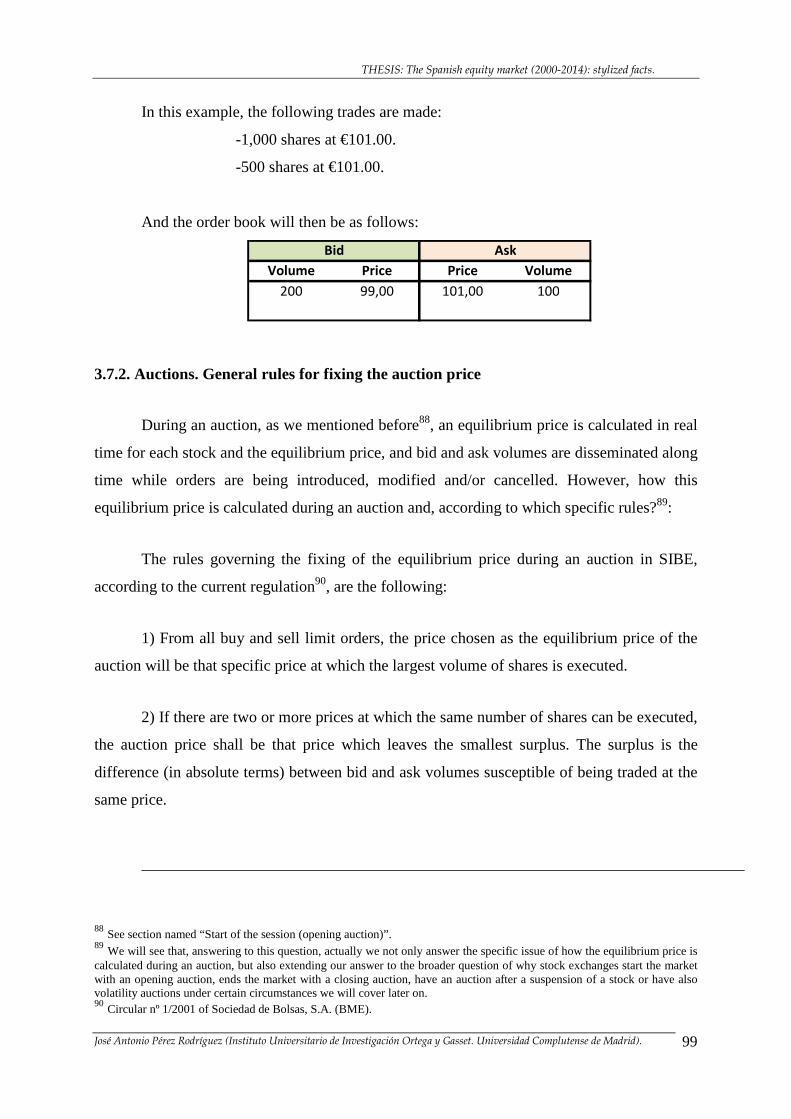
THESIS: The Spanish equity market (2000-2014): stylized facts.
José Antonio Pérez Rodríguez (Instituto Universitario de Investigación Ortega y Gasset. Universidad Complutense de Madrid). 99
In this example, the following trades are made:
-1,000 shares at €101.00.
-500 shares at €101.00.
And the order book will then be as follows:
Volume Price Price Volume
200 99,00 101,00 100
Bid Ask
3.7.2. Auctions. General rules for fixing the auction price
During an auction, as we mentioned before88, an equilibrium price is calculated in real
time for each stock and the equilibrium price, and bid and ask volumes are disseminated along
time while orders are being introduced, modified and/or cancelled. However, how this
equilibrium price is calculated during an auction and, according to which specific rules?89:
The rules governing the fixing of the equilibrium price during an auction in SIBE,
according to the current regulation90, are the following:
1) From all buy and sell limit orders, the price chosen as the equilibrium price of the
auction will be that specific price at which the largest volume of shares is executed.
2) If there are two or more prices at which the same number of shares can be executed,
the auction price shall be that price which leaves the smallest surplus. The surplus is the
difference (in absolute terms) between bid and ask volumes susceptible of being traded at the
same price.
88 See section named “Start of the session (opening auction)”. 89 We will see that, answering to this question, actually we not only answer the specific issue of how the equilibrium price is calculated during an auction, but also extending our answer to the broader question of why stock exchanges start the market with an opening auction, ends the market with a closing auction, have an auction after a suspension of a stock or have also volatility auctions under certain circumstances we will cover later on. 90 Circular nº 1/2001 of Sociedad de Bolsas, S.A. (BME).
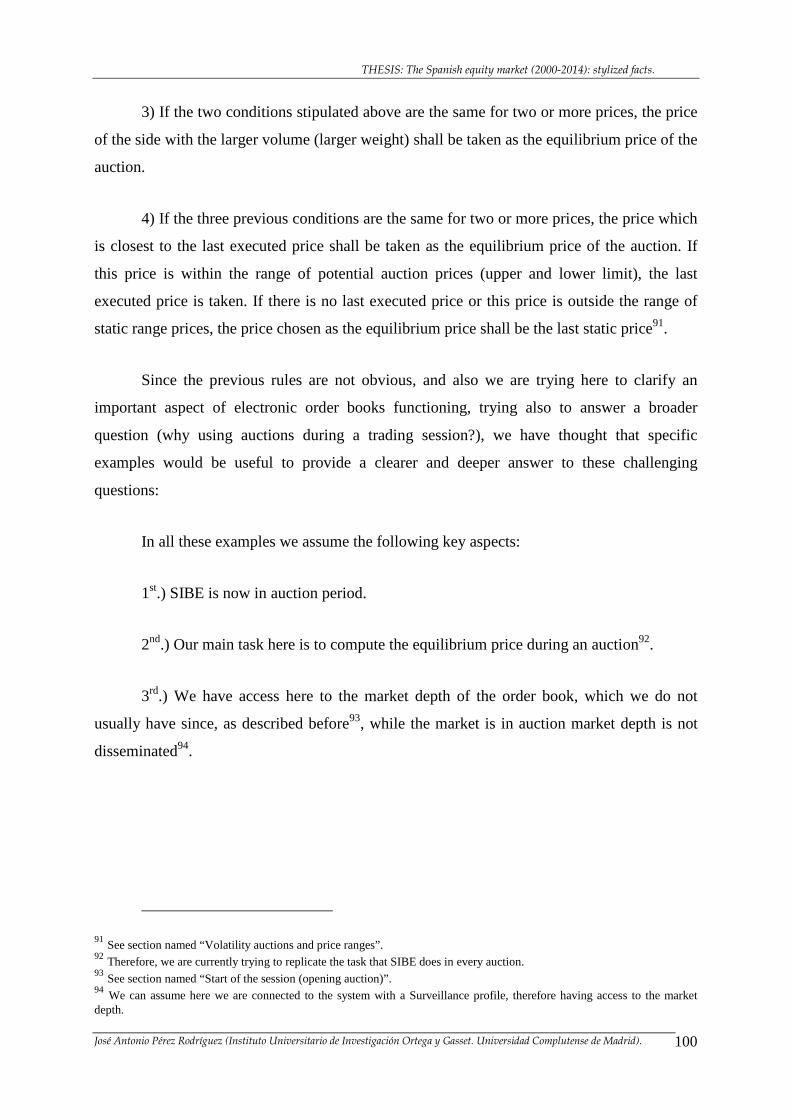
THESIS: The Spanish equity market (2000-2014): stylized facts.
José Antonio Pérez Rodríguez (Instituto Universitario de Investigación Ortega y Gasset. Universidad Complutense de Madrid). 100
3) If the two conditions stipulated above are the same for two or more prices, the price
of the side with the larger volume (larger weight) shall be taken as the equilibrium price of the
auction.
4) If the three previous conditions are the same for two or more prices, the price which
is closest to the last executed price shall be taken as the equilibrium price of the auction. If
this price is within the range of potential auction prices (upper and lower limit), the last
executed price is taken. If there is no last executed price or this price is outside the range of
static range prices, the price chosen as the equilibrium price shall be the last static price91.
Since the previous rules are not obvious, and also we are trying here to clarify an
important aspect of electronic order books functioning, trying also to answer a broader
question (why using auctions during a trading session?), we have thought that specific
examples would be useful to provide a clearer and deeper answer to these challenging
questions:
In all these examples we assume the following key aspects:
1st.) SIBE is now in auction period.
2nd.) Our main task here is to compute the equilibrium price during an auction92.
3rd.) We have access here to the market depth of the order book, which we do not
usually have since, as described before93, while the market is in auction market depth is not
disseminated94.
91 See section named “Volatility auctions and price ranges”. 92 Therefore, we are currently trying to replicate the task that SIBE does in every auction. 93 See section named “Start of the session (opening auction)”. 94 We can assume here we are connected to the system with a Surveillance profile, therefore having access to the market depth.
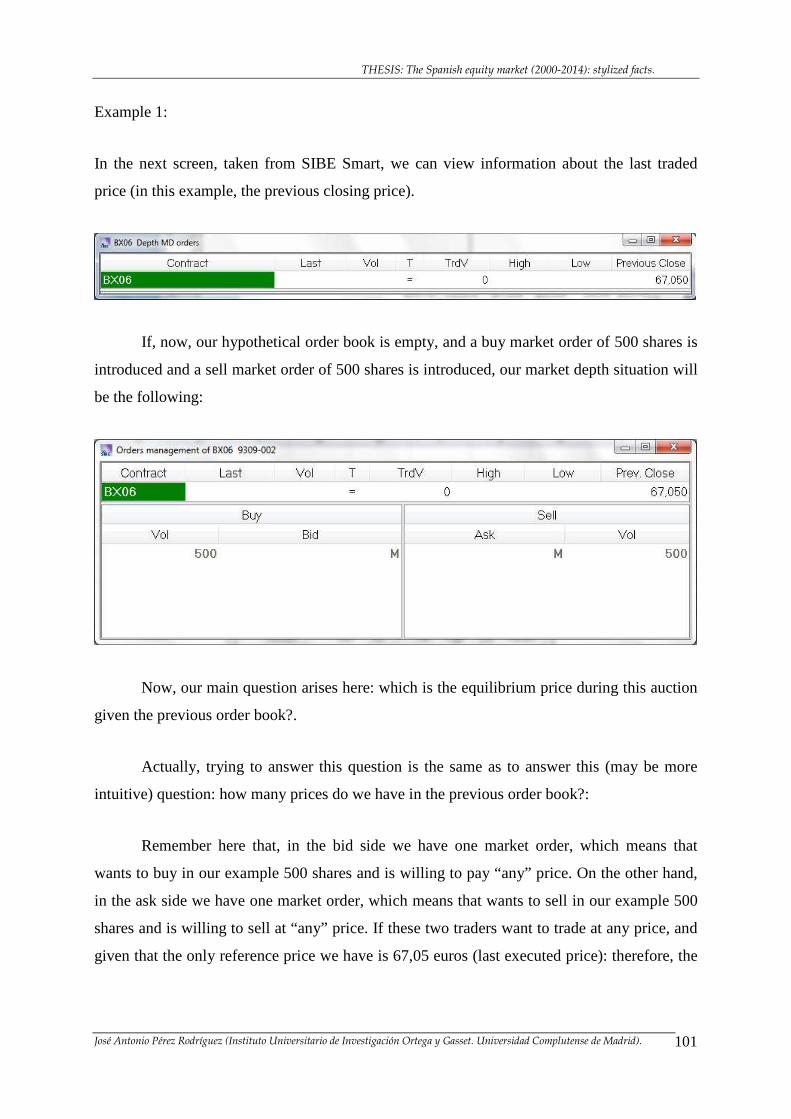
THESIS: The Spanish equity market (2000-2014): stylized facts.
José Antonio Pérez Rodríguez (Instituto Universitario de Investigación Ortega y Gasset. Universidad Complutense de Madrid). 101
Example 1:
In the next screen, taken from SIBE Smart, we can view information about the last traded
price (in this example, the previous closing price).
If, now, our hypothetical order book is empty, and a buy market order of 500 shares is
introduced and a sell market order of 500 shares is introduced, our market depth situation will
be the following:
Now, our main question arises here: which is the equilibrium price during this auction
given the previous order book?.
Actually, trying to answer this question is the same as to answer this (may be more
intuitive) question: how many prices do we have in the previous order book?:
Remember here that, in the bid side we have one market order, which means that
wants to buy in our example 500 shares and is willing to pay “any” price. On the other hand,
in the ask side we have one market order, which means that wants to sell in our example 500
shares and is willing to sell at “any” price. If these two traders want to trade at any price, and
given that the only reference price we have is 67,05 euros (last executed price): therefore, the
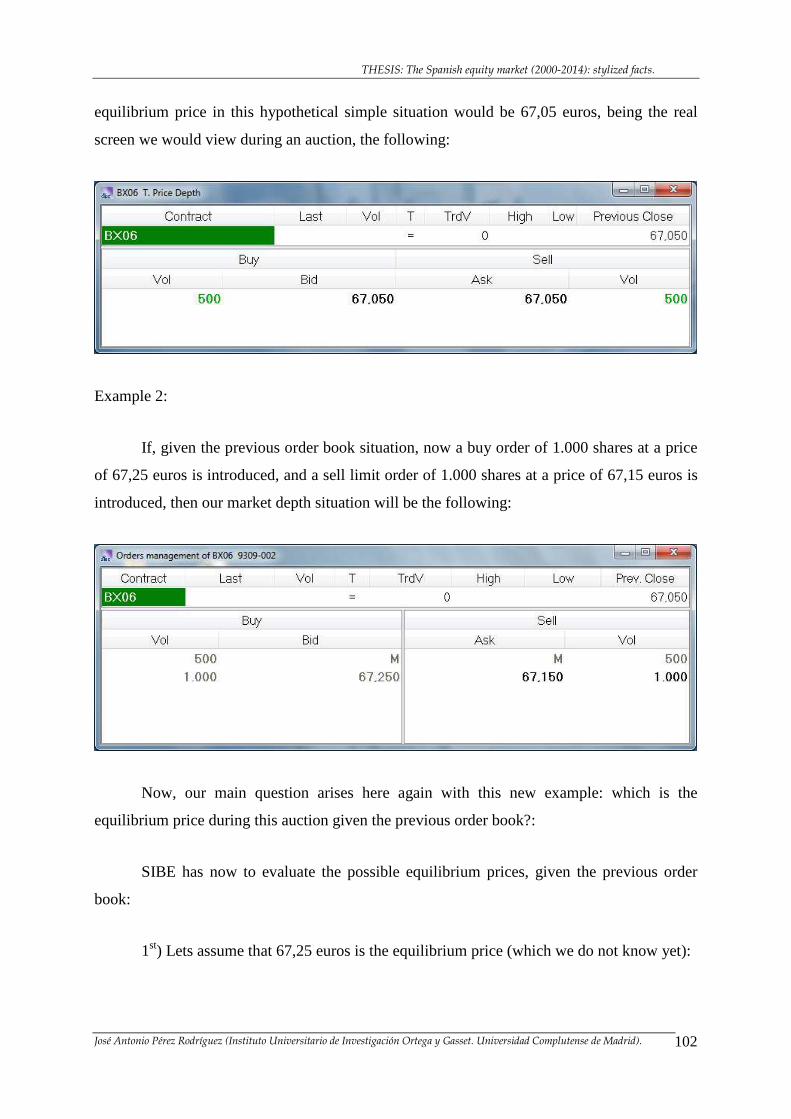
THESIS: The Spanish equity market (2000-2014): stylized facts.
José Antonio Pérez Rodríguez (Instituto Universitario de Investigación Ortega y Gasset. Universidad Complutense de Madrid). 102
equilibrium price in this hypothetical simple situation would be 67,05 euros, being the real
screen we would view during an auction, the following:
Example 2:
If, given the previous order book situation, now a buy order of 1.000 shares at a price
of 67,25 euros is introduced, and a sell limit order of 1.000 shares at a price of 67,15 euros is
introduced, then our market depth situation will be the following:
Now, our main question arises here again with this new example: which is the
equilibrium price during this auction given the previous order book?:
SIBE has now to evaluate the possible equilibrium prices, given the previous order
book:
1st) Lets assume that 67,25 euros is the equilibrium price (which we do not know yet):
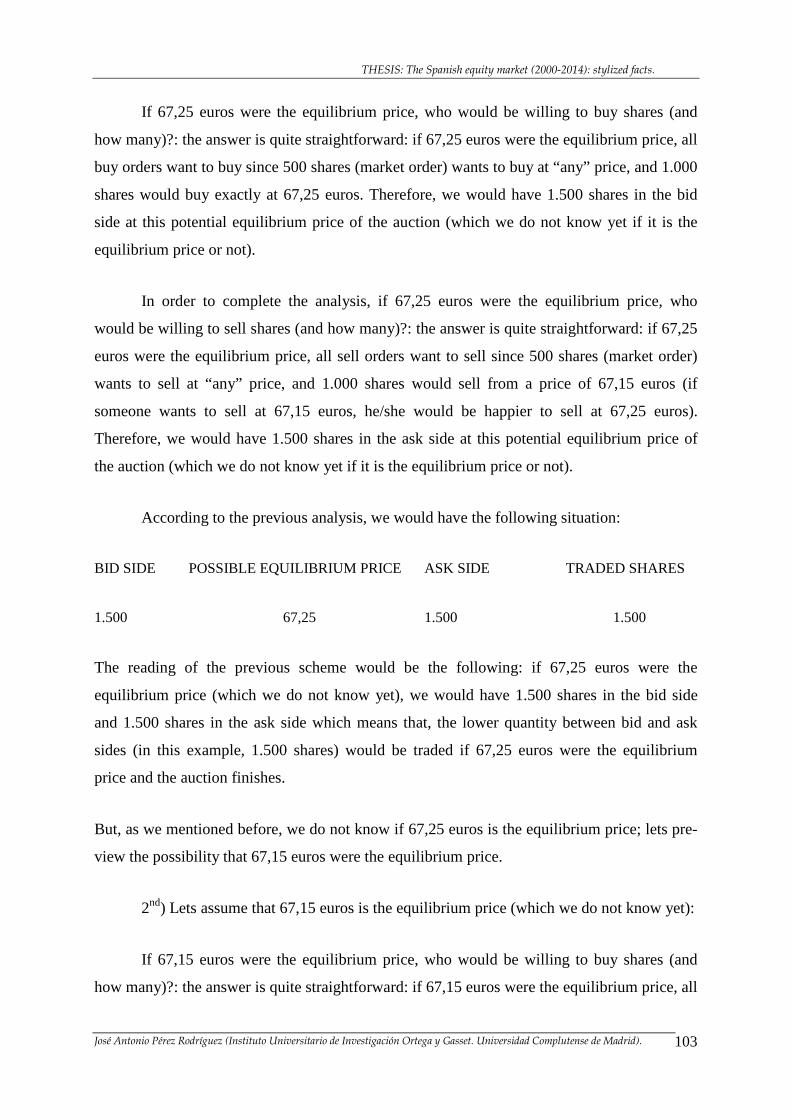
THESIS: The Spanish equity market (2000-2014): stylized facts.
José Antonio Pérez Rodríguez (Instituto Universitario de Investigación Ortega y Gasset. Universidad Complutense de Madrid). 103
If 67,25 euros were the equilibrium price, who would be willing to buy shares (and
how many)?: the answer is quite straightforward: if 67,25 euros were the equilibrium price, all
buy orders want to buy since 500 shares (market order) wants to buy at “any” price, and 1.000
shares would buy exactly at 67,25 euros. Therefore, we would have 1.500 shares in the bid
side at this potential equilibrium price of the auction (which we do not know yet if it is the
equilibrium price or not).
In order to complete the analysis, if 67,25 euros were the equilibrium price, who
would be willing to sell shares (and how many)?: the answer is quite straightforward: if 67,25
euros were the equilibrium price, all sell orders want to sell since 500 shares (market order)
wants to sell at “any” price, and 1.000 shares would sell from a price of 67,15 euros (if
someone wants to sell at 67,15 euros, he/she would be happier to sell at 67,25 euros).
Therefore, we would have 1.500 shares in the ask side at this potential equilibrium price of
the auction (which we do not know yet if it is the equilibrium price or not).
According to the previous analysis, we would have the following situation:
BID SIDE POSSIBLE EQUILIBRIUM PRICE ASK SIDE TRADED SHARES
1.500 67,25 1.500 1.500
The reading of the previous scheme would be the following: if 67,25 euros were the
equilibrium price (which we do not know yet), we would have 1.500 shares in the bid side
and 1.500 shares in the ask side which means that, the lower quantity between bid and ask
sides (in this example, 1.500 shares) would be traded if 67,25 euros were the equilibrium
price and the auction finishes.
But, as we mentioned before, we do not know if 67,25 euros is the equilibrium price; lets pre-
view the possibility that 67,15 euros were the equilibrium price.
2nd) Lets assume that 67,15 euros is the equilibrium price (which we do not know yet):
If 67,15 euros were the equilibrium price, who would be willing to buy shares (and
how many)?: the answer is quite straightforward: if 67,15 euros were the equilibrium price, all
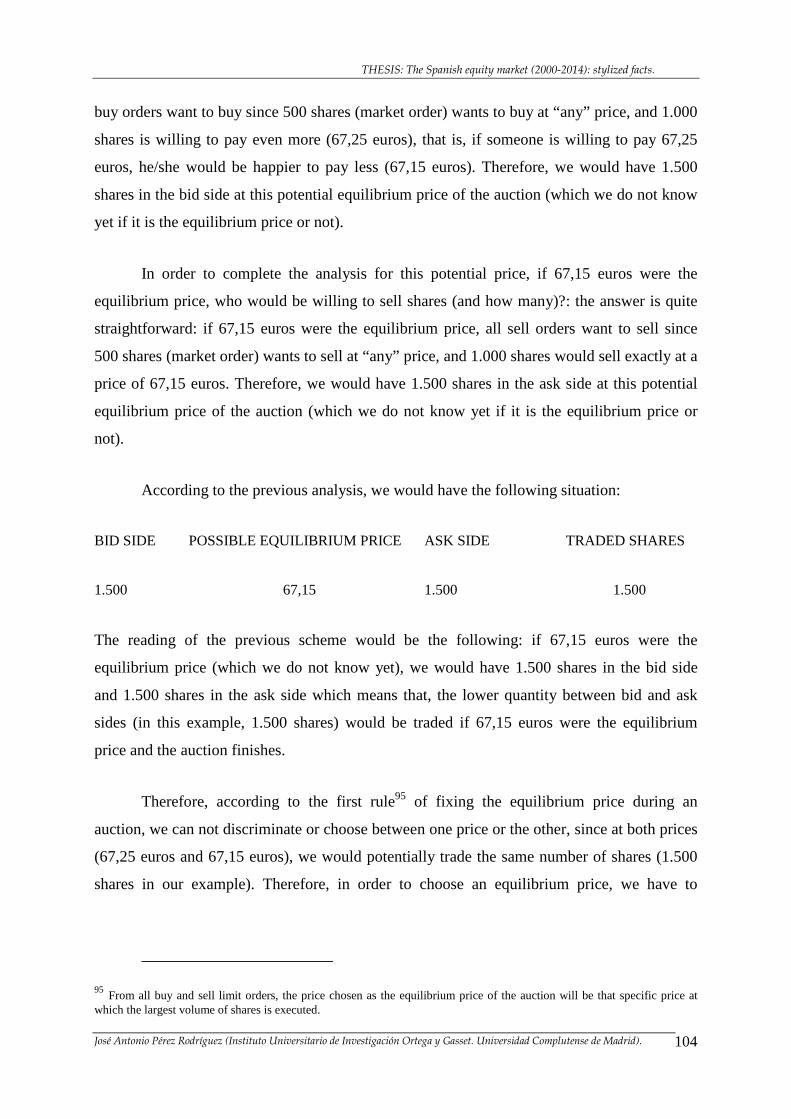
THESIS: The Spanish equity market (2000-2014): stylized facts.
José Antonio Pérez Rodríguez (Instituto Universitario de Investigación Ortega y Gasset. Universidad Complutense de Madrid). 104
buy orders want to buy since 500 shares (market order) wants to buy at “any” price, and 1.000
shares is willing to pay even more (67,25 euros), that is, if someone is willing to pay 67,25
euros, he/she would be happier to pay less (67,15 euros). Therefore, we would have 1.500
shares in the bid side at this potential equilibrium price of the auction (which we do not know
yet if it is the equilibrium price or not).
In order to complete the analysis for this potential price, if 67,15 euros were the
equilibrium price, who would be willing to sell shares (and how many)?: the answer is quite
straightforward: if 67,15 euros were the equilibrium price, all sell orders want to sell since
500 shares (market order) wants to sell at “any” price, and 1.000 shares would sell exactly at a
price of 67,15 euros. Therefore, we would have 1.500 shares in the ask side at this potential
equilibrium price of the auction (which we do not know yet if it is the equilibrium price or
not).
According to the previous analysis, we would have the following situation:
BID SIDE POSSIBLE EQUILIBRIUM PRICE ASK SIDE TRADED SHARES
1.500 67,15 1.500 1.500
The reading of the previous scheme would be the following: if 67,15 euros were the
equilibrium price (which we do not know yet), we would have 1.500 shares in the bid side
and 1.500 shares in the ask side which means that, the lower quantity between bid and ask
sides (in this example, 1.500 shares) would be traded if 67,15 euros were the equilibrium
price and the auction finishes.
Therefore, according to the first rule95 of fixing the equilibrium price during an
auction, we can not discriminate or choose between one price or the other, since at both prices
(67,25 euros and 67,15 euros), we would potentially trade the same number of shares (1.500
shares in our example). Therefore, in order to choose an equilibrium price, we have to
95 From all buy and sell limit orders, the price chosen as the equilibrium price of the auction will be that specific price at which the largest volume of shares is executed.
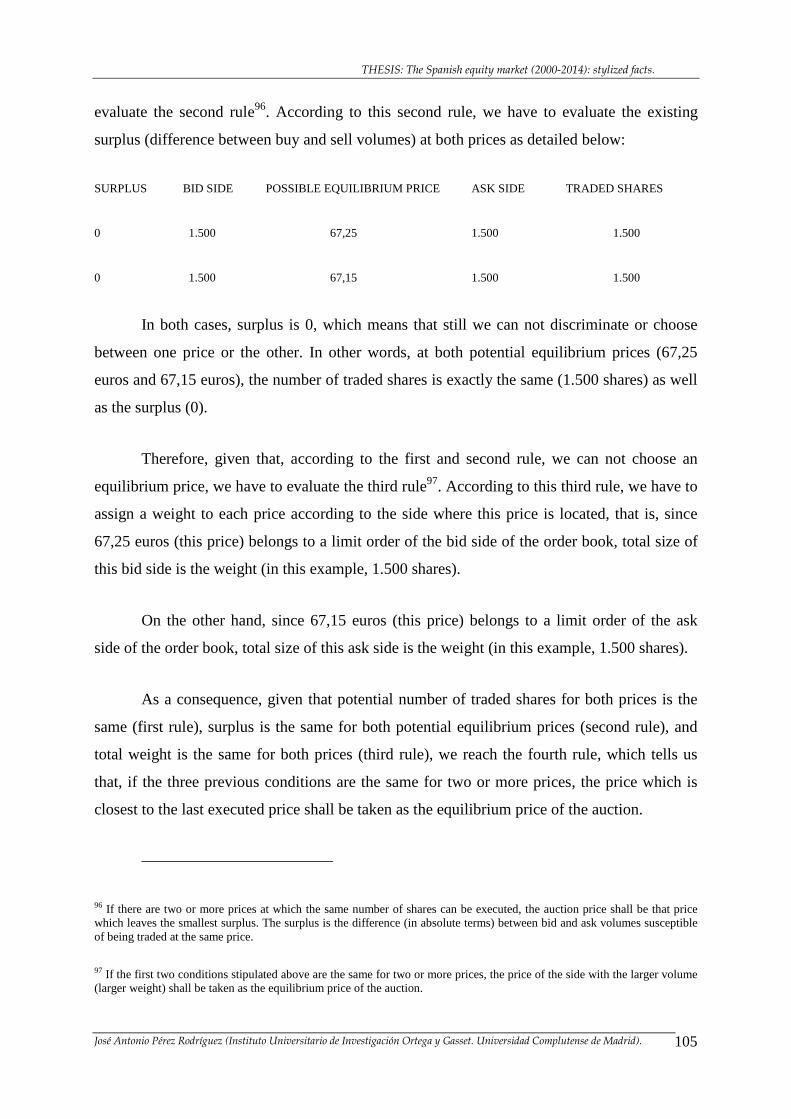
THESIS: The Spanish equity market (2000-2014): stylized facts.
José Antonio Pérez Rodríguez (Instituto Universitario de Investigación Ortega y Gasset. Universidad Complutense de Madrid). 105
evaluate the second rule96. According to this second rule, we have to evaluate the existing
surplus (difference between buy and sell volumes) at both prices as detailed below:
SURPLUS BID SIDE POSSIBLE EQUILIBRIUM PRICE ASK SIDE TRADED SHARES
0 1.500 67,25 1.500 1.500
0 1.500 67,15 1.500 1.500
In both cases, surplus is 0, which means that still we can not discriminate or choose
between one price or the other. In other words, at both potential equilibrium prices (67,25
euros and 67,15 euros), the number of traded shares is exactly the same (1.500 shares) as well
as the surplus (0).
Therefore, given that, according to the first and second rule, we can not choose an
equilibrium price, we have to evaluate the third rule97. According to this third rule, we have to
assign a weight to each price according to the side where this price is located, that is, since
67,25 euros (this price) belongs to a limit order of the bid side of the order book, total size of
this bid side is the weight (in this example, 1.500 shares).
On the other hand, since 67,15 euros (this price) belongs to a limit order of the ask
side of the order book, total size of this ask side is the weight (in this example, 1.500 shares).
As a consequence, given that potential number of traded shares for both prices is the
same (first rule), surplus is the same for both potential equilibrium prices (second rule), and
total weight is the same for both prices (third rule), we reach the fourth rule, which tells us
that, if the three previous conditions are the same for two or more prices, the price which is
closest to the last executed price shall be taken as the equilibrium price of the auction.
96 If there are two or more prices at which the same number of shares can be executed, the auction price shall be that price which leaves the smallest surplus. The surplus is the difference (in absolute terms) between bid and ask volumes susceptible of being traded at the same price.
97 If the first two conditions stipulated above are the same for two or more prices, the price of the side with the larger volume (larger weight) shall be taken as the equilibrium price of the auction.
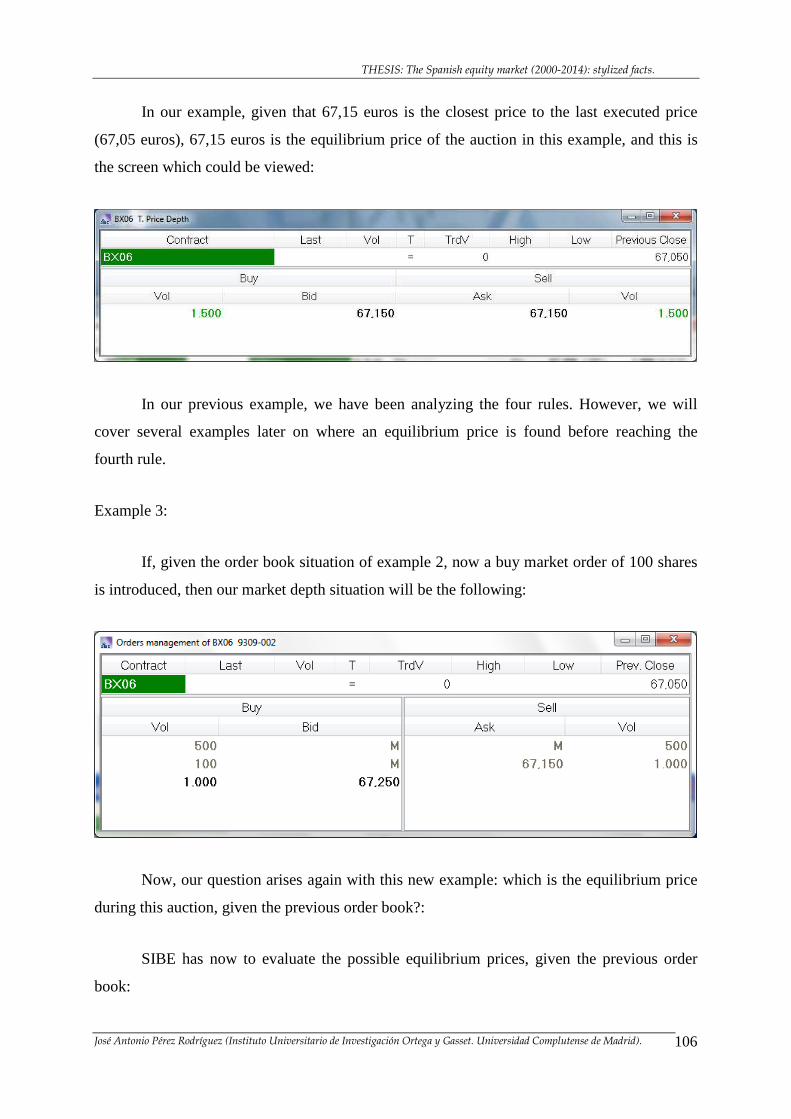
THESIS: The Spanish equity market (2000-2014): stylized facts.
José Antonio Pérez Rodríguez (Instituto Universitario de Investigación Ortega y Gasset. Universidad Complutense de Madrid). 106
In our example, given that 67,15 euros is the closest price to the last executed price
(67,05 euros), 67,15 euros is the equilibrium price of the auction in this example, and this is
the screen which could be viewed:
In our previous example, we have been analyzing the four rules. However, we will
cover several examples later on where an equilibrium price is found before reaching the
fourth rule.
Example 3:
If, given the order book situation of example 2, now a buy market order of 100 shares
is introduced, then our market depth situation will be the following:
Now, our question arises again with this new example: which is the equilibrium price
during this auction, given the previous order book?:
SIBE has now to evaluate the possible equilibrium prices, given the previous order
book:
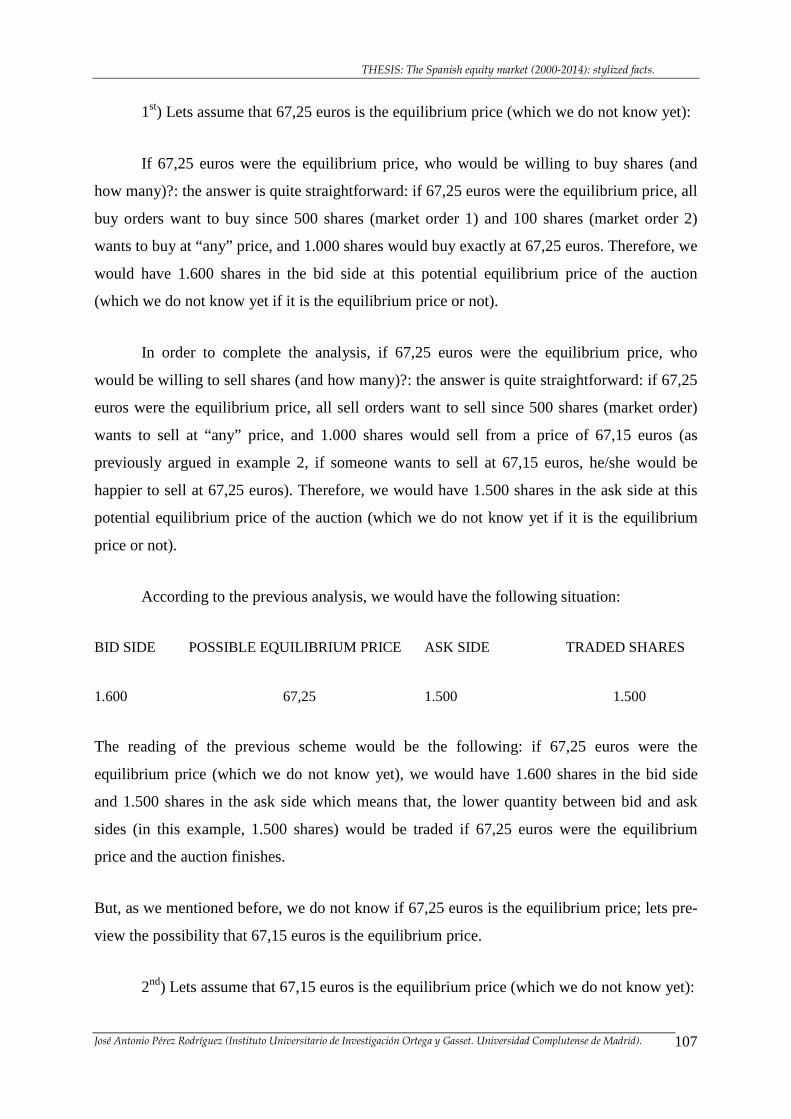
THESIS: The Spanish equity market (2000-2014): stylized facts.
José Antonio Pérez Rodríguez (Instituto Universitario de Investigación Ortega y Gasset. Universidad Complutense de Madrid). 107
1st) Lets assume that 67,25 euros is the equilibrium price (which we do not know yet):
If 67,25 euros were the equilibrium price, who would be willing to buy shares (and
how many)?: the answer is quite straightforward: if 67,25 euros were the equilibrium price, all
buy orders want to buy since 500 shares (market order 1) and 100 shares (market order 2)
wants to buy at “any” price, and 1.000 shares would buy exactly at 67,25 euros. Therefore, we
would have 1.600 shares in the bid side at this potential equilibrium price of the auction
(which we do not know yet if it is the equilibrium price or not).
In order to complete the analysis, if 67,25 euros were the equilibrium price, who
would be willing to sell shares (and how many)?: the answer is quite straightforward: if 67,25
euros were the equilibrium price, all sell orders want to sell since 500 shares (market order)
wants to sell at “any” price, and 1.000 shares would sell from a price of 67,15 euros (as
previously argued in example 2, if someone wants to sell at 67,15 euros, he/she would be
happier to sell at 67,25 euros). Therefore, we would have 1.500 shares in the ask side at this
potential equilibrium price of the auction (which we do not know yet if it is the equilibrium
price or not).
According to the previous analysis, we would have the following situation:
BID SIDE POSSIBLE EQUILIBRIUM PRICE ASK SIDE TRADED SHARES
1.600 67,25 1.500 1.500
The reading of the previous scheme would be the following: if 67,25 euros were the
equilibrium price (which we do not know yet), we would have 1.600 shares in the bid side
and 1.500 shares in the ask side which means that, the lower quantity between bid and ask
sides (in this example, 1.500 shares) would be traded if 67,25 euros were the equilibrium
price and the auction finishes.
But, as we mentioned before, we do not know if 67,25 euros is the equilibrium price; lets pre-
view the possibility that 67,15 euros is the equilibrium price.
2nd) Lets assume that 67,15 euros is the equilibrium price (which we do not know yet):
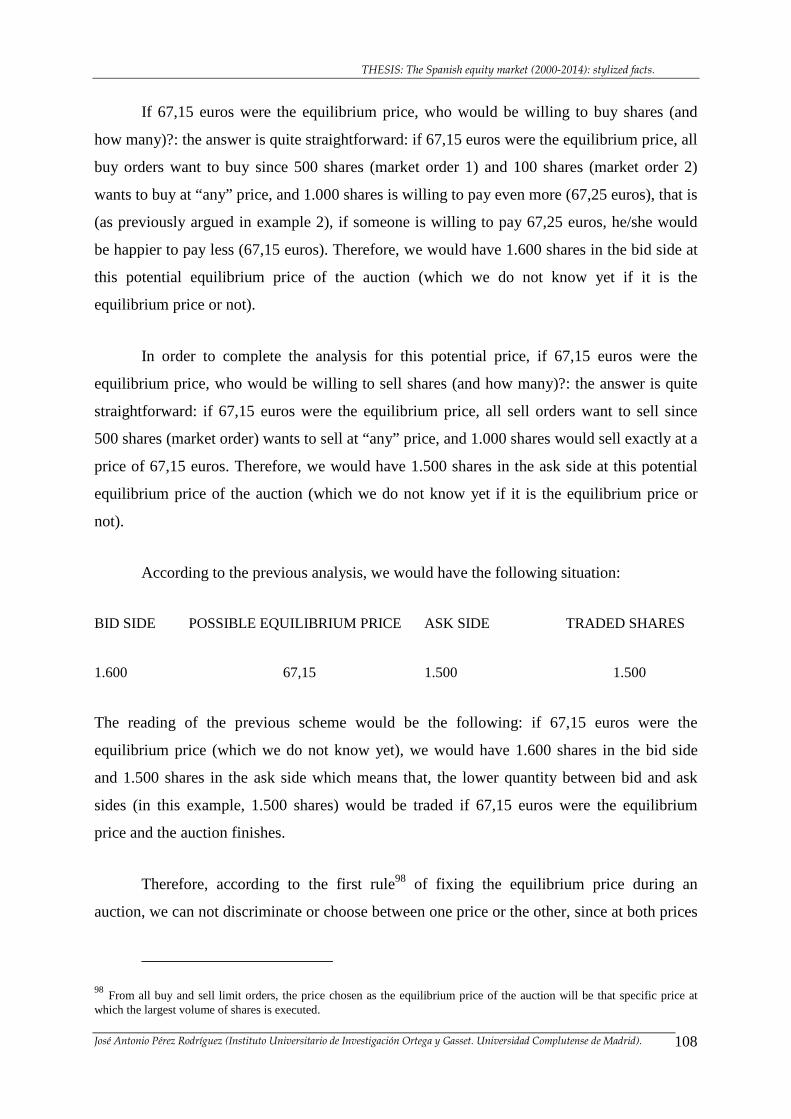
THESIS: The Spanish equity market (2000-2014): stylized facts.
José Antonio Pérez Rodríguez (Instituto Universitario de Investigación Ortega y Gasset. Universidad Complutense de Madrid). 108
If 67,15 euros were the equilibrium price, who would be willing to buy shares (and
how many)?: the answer is quite straightforward: if 67,15 euros were the equilibrium price, all
buy orders want to buy since 500 shares (market order 1) and 100 shares (market order 2)
wants to buy at “any” price, and 1.000 shares is willing to pay even more (67,25 euros), that is
(as previously argued in example 2), if someone is willing to pay 67,25 euros, he/she would
be happier to pay less (67,15 euros). Therefore, we would have 1.600 shares in the bid side at
this potential equilibrium price of the auction (which we do not know yet if it is the
equilibrium price or not).
In order to complete the analysis for this potential price, if 67,15 euros were the
equilibrium price, who would be willing to sell shares (and how many)?: the answer is quite
straightforward: if 67,15 euros were the equilibrium price, all sell orders want to sell since
500 shares (market order) wants to sell at “any” price, and 1.000 shares would sell exactly at a
price of 67,15 euros. Therefore, we would have 1.500 shares in the ask side at this potential
equilibrium price of the auction (which we do not know yet if it is the equilibrium price or
not).
According to the previous analysis, we would have the following situation:
BID SIDE POSSIBLE EQUILIBRIUM PRICE ASK SIDE TRADED SHARES
1.600 67,15 1.500 1.500
The reading of the previous scheme would be the following: if 67,15 euros were the
equilibrium price (which we do not know yet), we would have 1.600 shares in the bid side
and 1.500 shares in the ask side which means that, the lower quantity between bid and ask
sides (in this example, 1.500 shares) would be traded if 67,15 euros were the equilibrium
price and the auction finishes.
Therefore, according to the first rule98 of fixing the equilibrium price during an
auction, we can not discriminate or choose between one price or the other, since at both prices
98 From all buy and sell limit orders, the price chosen as the equilibrium price of the auction will be that specific price at which the largest volume of shares is executed.
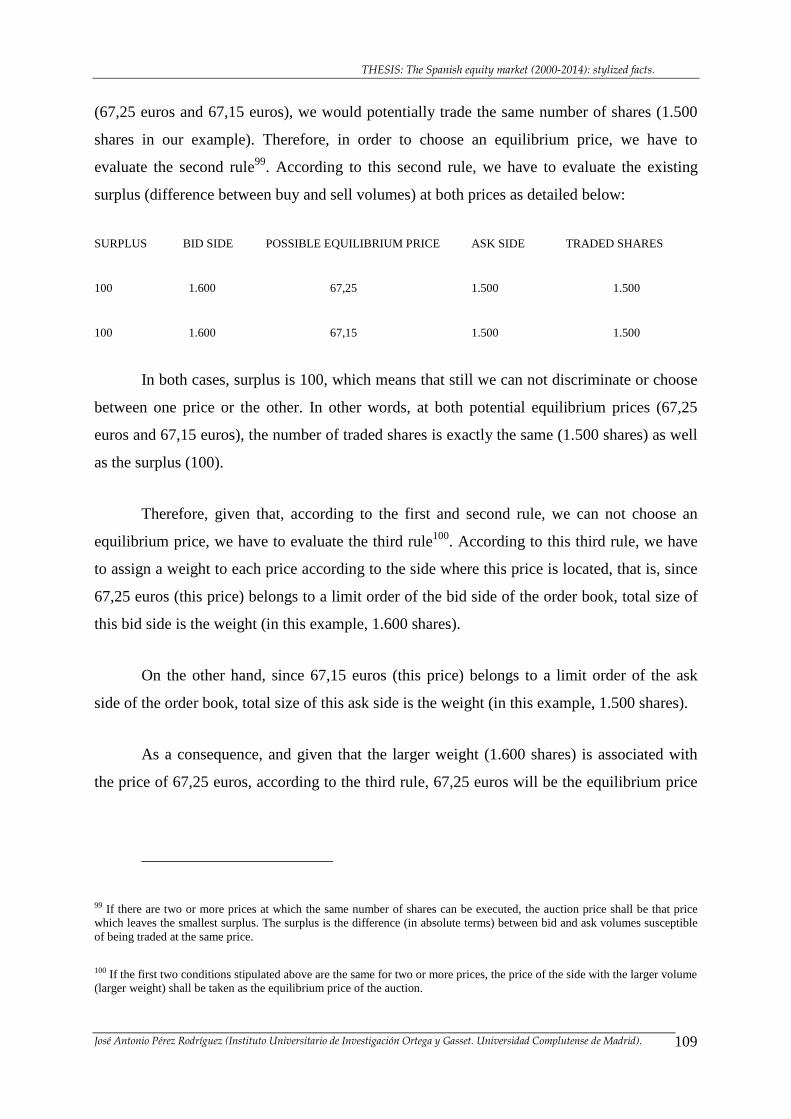
THESIS: The Spanish equity market (2000-2014): stylized facts.
José Antonio Pérez Rodríguez (Instituto Universitario de Investigación Ortega y Gasset. Universidad Complutense de Madrid). 109
(67,25 euros and 67,15 euros), we would potentially trade the same number of shares (1.500
shares in our example). Therefore, in order to choose an equilibrium price, we have to
evaluate the second rule99. According to this second rule, we have to evaluate the existing
surplus (difference between buy and sell volumes) at both prices as detailed below:
SURPLUS BID SIDE POSSIBLE EQUILIBRIUM PRICE ASK SIDE TRADED SHARES
100 1.600 67,25 1.500 1.500
100 1.600 67,15 1.500 1.500
In both cases, surplus is 100, which means that still we can not discriminate or choose
between one price or the other. In other words, at both potential equilibrium prices (67,25
euros and 67,15 euros), the number of traded shares is exactly the same (1.500 shares) as well
as the surplus (100).
Therefore, given that, according to the first and second rule, we can not choose an
equilibrium price, we have to evaluate the third rule100. According to this third rule, we have
to assign a weight to each price according to the side where this price is located, that is, since
67,25 euros (this price) belongs to a limit order of the bid side of the order book, total size of
this bid side is the weight (in this example, 1.600 shares).
On the other hand, since 67,15 euros (this price) belongs to a limit order of the ask
side of the order book, total size of this ask side is the weight (in this example, 1.500 shares).
As a consequence, and given that the larger weight (1.600 shares) is associated with
the price of 67,25 euros, according to the third rule, 67,25 euros will be the equilibrium price
99 If there are two or more prices at which the same number of shares can be executed, the auction price shall be that price which leaves the smallest surplus. The surplus is the difference (in absolute terms) between bid and ask volumes susceptible of being traded at the same price.
100 If the first two conditions stipulated above are the same for two or more prices, the price of the side with the larger volume (larger weight) shall be taken as the equilibrium price of the auction.
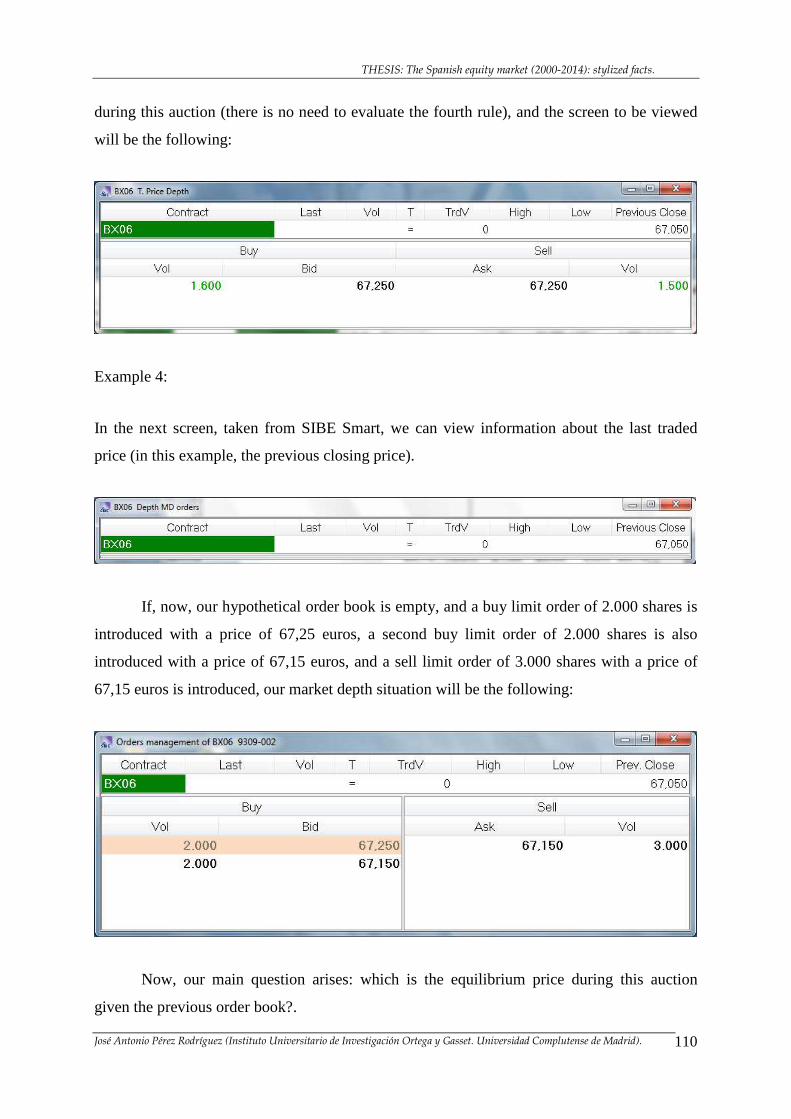
THESIS: The Spanish equity market (2000-2014): stylized facts.
José Antonio Pérez Rodríguez (Instituto Universitario de Investigación Ortega y Gasset. Universidad Complutense de Madrid). 110
during this auction (there is no need to evaluate the fourth rule), and the screen to be viewed
will be the following:
Example 4:
In the next screen, taken from SIBE Smart, we can view information about the last traded
price (in this example, the previous closing price).
If, now, our hypothetical order book is empty, and a buy limit order of 2.000 shares is
introduced with a price of 67,25 euros, a second buy limit order of 2.000 shares is also
introduced with a price of 67,15 euros, and a sell limit order of 3.000 shares with a price of
67,15 euros is introduced, our market depth situation will be the following:
Now, our main question arises: which is the equilibrium price during this auction
given the previous order book?.
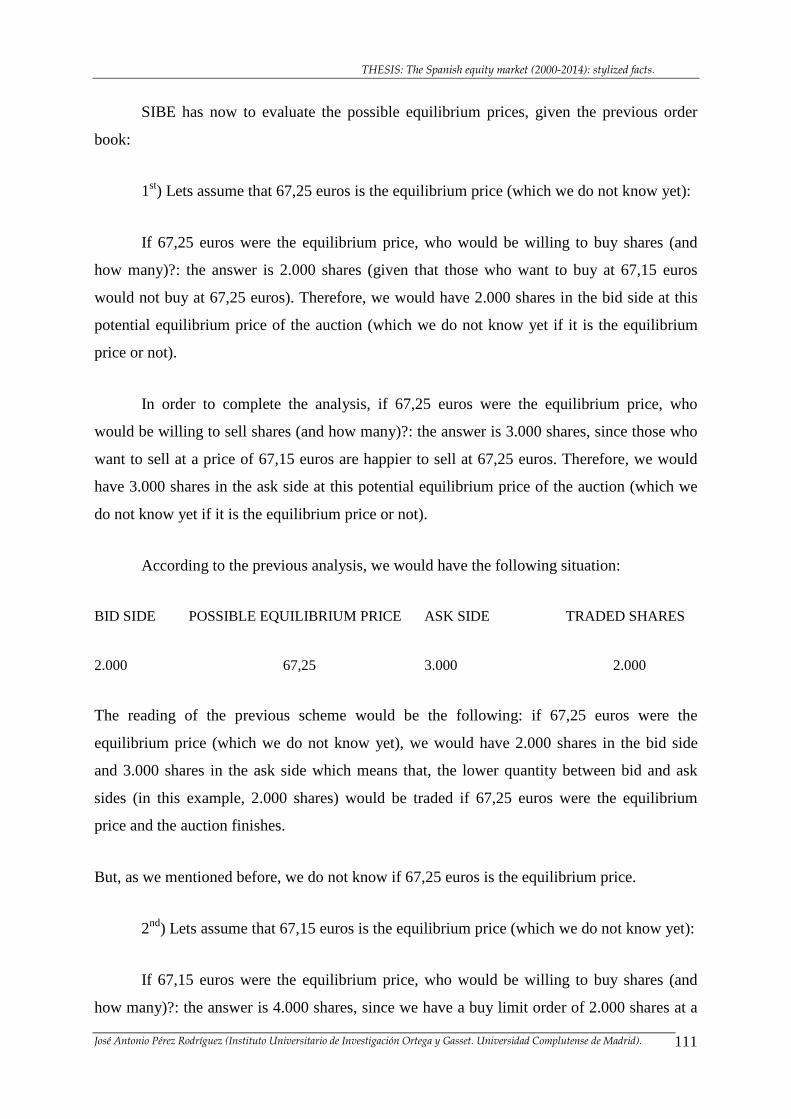
THESIS: The Spanish equity market (2000-2014): stylized facts.
José Antonio Pérez Rodríguez (Instituto Universitario de Investigación Ortega y Gasset. Universidad Complutense de Madrid). 111
SIBE has now to evaluate the possible equilibrium prices, given the previous order
book:
1st) Lets assume that 67,25 euros is the equilibrium price (which we do not know yet):
If 67,25 euros were the equilibrium price, who would be willing to buy shares (and
how many)?: the answer is 2.000 shares (given that those who want to buy at 67,15 euros
would not buy at 67,25 euros). Therefore, we would have 2.000 shares in the bid side at this
potential equilibrium price of the auction (which we do not know yet if it is the equilibrium
price or not).
In order to complete the analysis, if 67,25 euros were the equilibrium price, who
would be willing to sell shares (and how many)?: the answer is 3.000 shares, since those who
want to sell at a price of 67,15 euros are happier to sell at 67,25 euros. Therefore, we would
have 3.000 shares in the ask side at this potential equilibrium price of the auction (which we
do not know yet if it is the equilibrium price or not).
According to the previous analysis, we would have the following situation:
BID SIDE POSSIBLE EQUILIBRIUM PRICE ASK SIDE TRADED SHARES
2.000 67,25 3.000 2.000
The reading of the previous scheme would be the following: if 67,25 euros were the
equilibrium price (which we do not know yet), we would have 2.000 shares in the bid side
and 3.000 shares in the ask side which means that, the lower quantity between bid and ask
sides (in this example, 2.000 shares) would be traded if 67,25 euros were the equilibrium
price and the auction finishes.
But, as we mentioned before, we do not know if 67,25 euros is the equilibrium price.
2nd) Lets assume that 67,15 euros is the equilibrium price (which we do not know yet):
If 67,15 euros were the equilibrium price, who would be willing to buy shares (and
how many)?: the answer is 4.000 shares, since we have a buy limit order of 2.000 shares at a
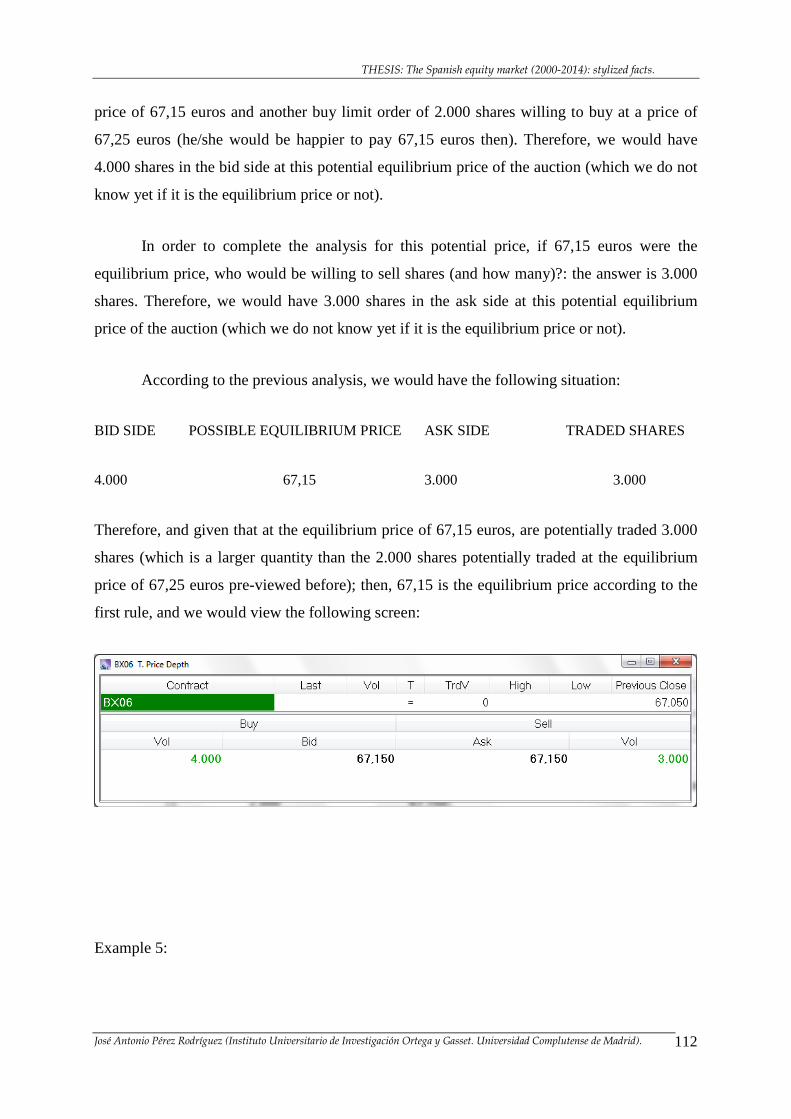
THESIS: The Spanish equity market (2000-2014): stylized facts.
José Antonio Pérez Rodríguez (Instituto Universitario de Investigación Ortega y Gasset. Universidad Complutense de Madrid). 112
price of 67,15 euros and another buy limit order of 2.000 shares willing to buy at a price of
67,25 euros (he/she would be happier to pay 67,15 euros then). Therefore, we would have
4.000 shares in the bid side at this potential equilibrium price of the auction (which we do not
know yet if it is the equilibrium price or not).
In order to complete the analysis for this potential price, if 67,15 euros were the
equilibrium price, who would be willing to sell shares (and how many)?: the answer is 3.000
shares. Therefore, we would have 3.000 shares in the ask side at this potential equilibrium
price of the auction (which we do not know yet if it is the equilibrium price or not).
According to the previous analysis, we would have the following situation:
BID SIDE POSSIBLE EQUILIBRIUM PRICE ASK SIDE TRADED SHARES
4.000 67,15 3.000 3.000
Therefore, and given that at the equilibrium price of 67,15 euros, are potentially traded 3.000
shares (which is a larger quantity than the 2.000 shares potentially traded at the equilibrium
price of 67,25 euros pre-viewed before); then, 67,15 is the equilibrium price according to the
first rule, and we would view the following screen:
Example 5:
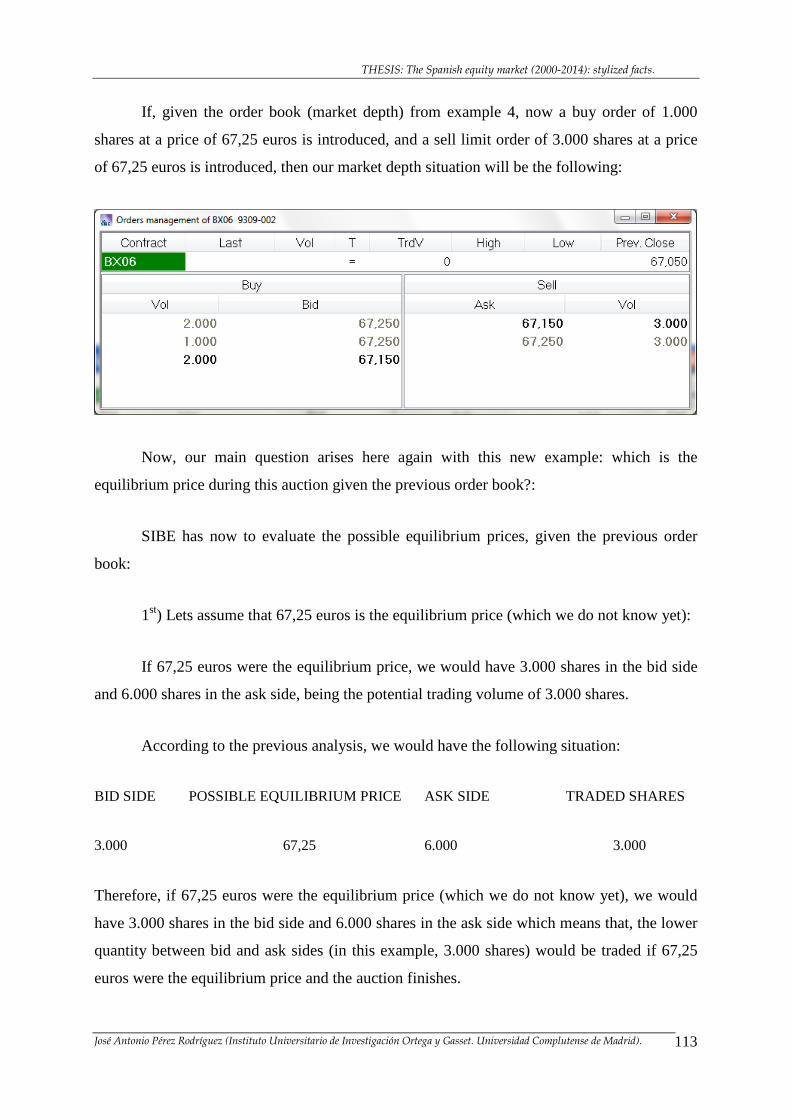
THESIS: The Spanish equity market (2000-2014): stylized facts.
José Antonio Pérez Rodríguez (Instituto Universitario de Investigación Ortega y Gasset. Universidad Complutense de Madrid). 113
If, given the order book (market depth) from example 4, now a buy order of 1.000
shares at a price of 67,25 euros is introduced, and a sell limit order of 3.000 shares at a price
of 67,25 euros is introduced, then our market depth situation will be the following:
Now, our main question arises here again with this new example: which is the
equilibrium price during this auction given the previous order book?:
SIBE has now to evaluate the possible equilibrium prices, given the previous order
book:
1st) Lets assume that 67,25 euros is the equilibrium price (which we do not know yet):
If 67,25 euros were the equilibrium price, we would have 3.000 shares in the bid side
and 6.000 shares in the ask side, being the potential trading volume of 3.000 shares.
According to the previous analysis, we would have the following situation:
BID SIDE POSSIBLE EQUILIBRIUM PRICE ASK SIDE TRADED SHARES
3.000 67,25 6.000 3.000
Therefore, if 67,25 euros were the equilibrium price (which we do not know yet), we would
have 3.000 shares in the bid side and 6.000 shares in the ask side which means that, the lower
quantity between bid and ask sides (in this example, 3.000 shares) would be traded if 67,25
euros were the equilibrium price and the auction finishes.
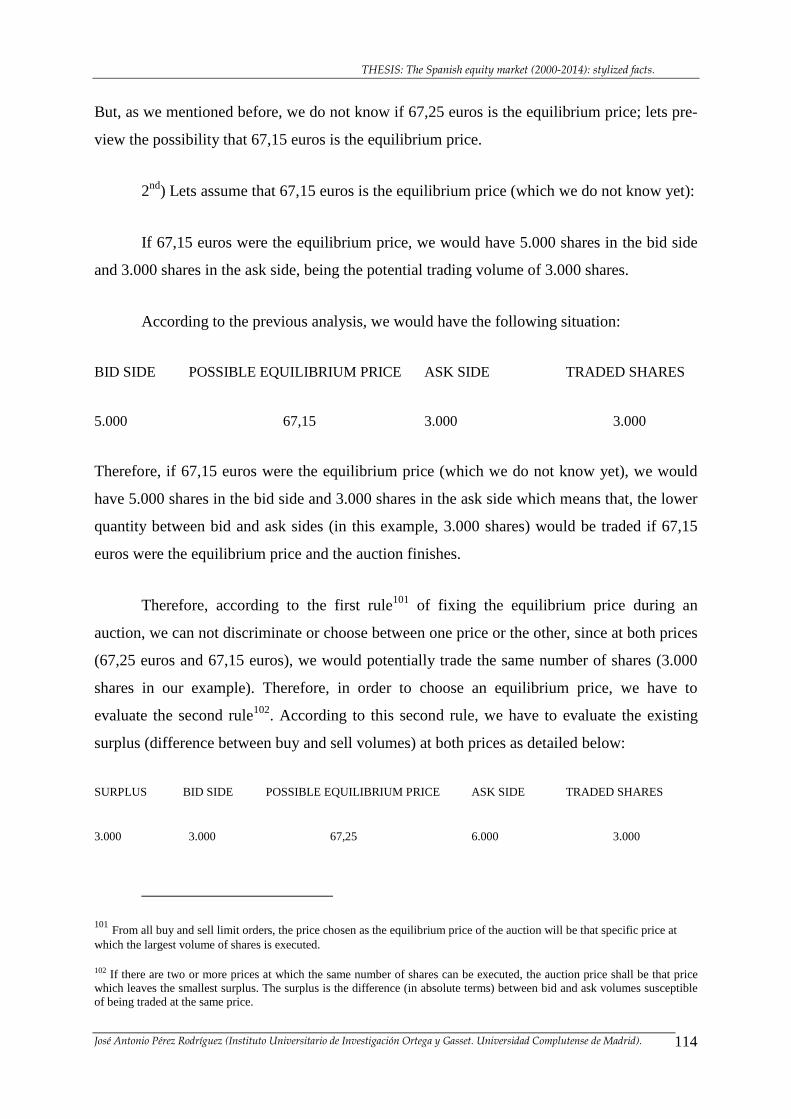
THESIS: The Spanish equity market (2000-2014): stylized facts.
José Antonio Pérez Rodríguez (Instituto Universitario de Investigación Ortega y Gasset. Universidad Complutense de Madrid). 114
But, as we mentioned before, we do not know if 67,25 euros is the equilibrium price; lets pre-
view the possibility that 67,15 euros is the equilibrium price.
2nd) Lets assume that 67,15 euros is the equilibrium price (which we do not know yet):
If 67,15 euros were the equilibrium price, we would have 5.000 shares in the bid side
and 3.000 shares in the ask side, being the potential trading volume of 3.000 shares.
According to the previous analysis, we would have the following situation:
BID SIDE POSSIBLE EQUILIBRIUM PRICE ASK SIDE TRADED SHARES
5.000 67,15 3.000 3.000
Therefore, if 67,15 euros were the equilibrium price (which we do not know yet), we would
have 5.000 shares in the bid side and 3.000 shares in the ask side which means that, the lower
quantity between bid and ask sides (in this example, 3.000 shares) would be traded if 67,15
euros were the equilibrium price and the auction finishes.
Therefore, according to the first rule101 of fixing the equilibrium price during an
auction, we can not discriminate or choose between one price or the other, since at both prices
(67,25 euros and 67,15 euros), we would potentially trade the same number of shares (3.000
shares in our example). Therefore, in order to choose an equilibrium price, we have to
evaluate the second rule102. According to this second rule, we have to evaluate the existing
surplus (difference between buy and sell volumes) at both prices as detailed below:
SURPLUS BID SIDE POSSIBLE EQUILIBRIUM PRICE ASK SIDE TRADED SHARES
3.000 3.000 67,25 6.000 3.000
101 From all buy and sell limit orders, the price chosen as the equilibrium price of the auction will be that specific price at which the largest volume of shares is executed.
102 If there are two or more prices at which the same number of shares can be executed, the auction price shall be that price which leaves the smallest surplus. The surplus is the difference (in absolute terms) between bid and ask volumes susceptible of being traded at the same price.
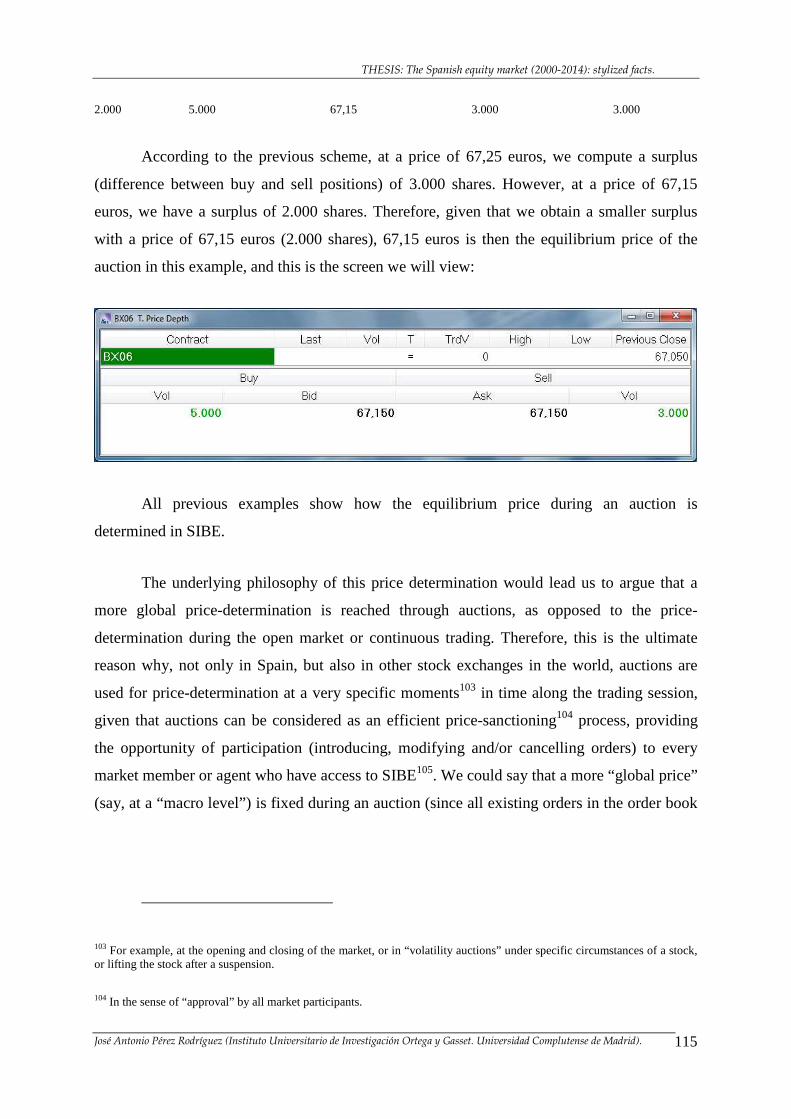
THESIS: The Spanish equity market (2000-2014): stylized facts.
José Antonio Pérez Rodríguez (Instituto Universitario de Investigación Ortega y Gasset. Universidad Complutense de Madrid). 115
2.000 5.000 67,15 3.000 3.000
According to the previous scheme, at a price of 67,25 euros, we compute a surplus
(difference between buy and sell positions) of 3.000 shares. However, at a price of 67,15
euros, we have a surplus of 2.000 shares. Therefore, given that we obtain a smaller surplus
with a price of 67,15 euros (2.000 shares), 67,15 euros is then the equilibrium price of the
auction in this example, and this is the screen we will view:
All previous examples show how the equilibrium price during an auction is
determined in SIBE.
The underlying philosophy of this price determination would lead us to argue that a
more global price-determination is reached through auctions, as opposed to the price-
determination during the open market or continuous trading. Therefore, this is the ultimate
reason why, not only in Spain, but also in other stock exchanges in the world, auctions are
used for price-determination at a very specific moments103 in time along the trading session,
given that auctions can be considered as an efficient price-sanctioning104 process, providing
the opportunity of participation (introducing, modifying and/or cancelling orders) to every
market member or agent who have access to SIBE105. We could say that a more “global price”
(say, at a “macro level”) is fixed during an auction (since all existing orders in the order book
103 For example, at the opening and closing of the market, or in “volatility auctions” under specific circumstances of a stock, or lifting the stock after a suspension.
104 In the sense of “approval” by all market participants.
THESIS: The Spanish equity market (2000-2014): stylized facts.
José Antonio Pérez Rodríguez (Instituto Universitario de Investigación Ortega y Gasset. Universidad Complutense de Madrid). 116
participate in the computation of the equilibrium price during an auction) as opposed to the
“micro level” determination during open market or continuous trading106.
3.8. VOLATILITY AUCTIONS AND PRICE RANGES
3.8.1. Volatility Auctions
Volatility Auctions in SIBE last five minutes, plus a maximum 30-second random end,
during which the auction may close at any moment without prior warning and the shares
allocation process begin (trades made at the resulting auction price). It should be noted that
Volatility Auctions are never extended107; the only auctions that may be extended are opening
and closing auctions.
During volatility auctions, all the general rules for fixing the auction price detailed
before are also applied for volatility auctions. Volatility Auctions take place when the static or
the dynamic price range is breached.
3.8.2. Static and dynamic ranges
Static and dynamic ranges are calculated on the basis of the most recent historical
volatility of each stock. Each stock has a unique static and dynamic range, reflecting its
specific characteristics and in line with its most recent performance (volatility). These
percentages are based on the recent past volatility of each stock and, for its calculation, it is
105 It is natural to remind here that, during an auction, price-determination has no impact (in the sense that the subsequent equilibrium prices are only indicative). However, as detailed before, at the end of every auction, the last equilibrium price leads to an effectively traded price.
106 A more complete understanding of these aspects would be reached once covered the section named “Open market. Basic trading rules”.
107 By “extension” we mean 2 minutes plus a maximum 30-second random end. It is, however, possible for a share to remain under auction once the Volatility Auction is over; this exceptional case will be explained later on in the section named “Volatility auctions due to breach of static range”.
THESIS: The Spanish equity market (2000-2014): stylized facts.
José Antonio Pérez Rodríguez (Instituto Universitario de Investigación Ortega y Gasset. Universidad Complutense de Madrid). 117
assumed that stock returns, in the medium and long run, follow a normal (Gauss) statistical
distribution, which is a quite common and well-recognized assumption from the point of view
of both academics and practitioners.
In the Spanish case, as a difference with respect some other markets in Europe, these
ranges are publicly available112 and are updated on a regular basis, so ensuring that they
accurately reflect the characteristics of the share at any given moment.
• Static ranges: The static range defines the maximum permitted variation around the static
price (up or down) and is expressed as a percentage. As a general rule, the static price is
the price fixed at the last auction (the auction allocation price)113, with one exception:
when the upper or lower limit is breached, then this price functions as a static price (only
during the auction because, at the end of the auction, we are going to find a new static
price that, by definition, is a static price).
The static range remains in force throughout the entire trading session (opening auction,
open market or continuous trading and closing auction). This means, among other aspects
to be detailed later on, that it can not be entered buy orders with a higher price than the
maximum static limit neither sell orders with a lower price than the minimum static limit
(these orders would be rejected by SIBE).
A number of standard categories for possible static ranges have been set by the
Spanish Securities Market114. These are as follows: 4%, 5%, 6%, 7% and 8%.
• Dynamic ranges: The dynamic range defines the maximum permitted variation around the
dynamic price (up or down) and is expressed as a percentage. The dynamic price is the
price fixed in the last trade, and may be the result either of an auction (in which case it will
be the same as the static price) or a trade executed on the open market or continuous
trading.
A number of standardised categories for possible dynamic ranges have been set by the
Spanish Securities Market115. These are as follows: 1%, 1.5%, 2%, 2.5%, 3%, 3.5%, 4% and
112 The ranges in force in each period are published in Operating Instructions from Sociedad de Bolsas, S.A. (BME). However, its specific calculation method is not publicly available. For example, in the case of the German case (Xetra system), these ranges are not publicly available nor its calculation method. 113 The static price at 8.30 a m. is the reference price. 114 Sociedad de Bolsas, S.A. (BME)
THESIS: The Spanish equity market (2000-2014): stylized facts.
José Antonio Pérez Rodríguez (Instituto Universitario de Investigación Ortega y Gasset. Universidad Complutense de Madrid). 118
8%. The dynamic range remains in force only while the market is open and during the
closing auction.
However, although standard market practice in the Spanish case will be to apply these
ranges, in exceptional circumstances the Trading and Control Committee may adjust the range
set for a certain share or segment, or, where applicable and when prevailing market conditions
so require, for the whole of the market116.
It should be noted that dynamic ranges are, by definition, less than or equal to static
ranges.
Besides, it should be noted that, although general standard categories for possible
static and dynamic ranges were defined before, the so-called “3-tick rule” is also applied,
which means that, for certain very low-priced stocks, a static and dynamic range is established
such that, at least, a stock can have three consecutive traded prices (up or down) without
triggering volatility auctions. Therefore, this means then that we can find static and/or
dynamic ranges of, for example, 20% or 50% for specific stocks.
3.8.3. Volatility auctions due to breach of static range
Volatility Auctions due to breaches of the static range are triggered when a trade in a
stock is tried either at the upper or lower limit of the static price range (maximum variation up
or down with respect the static price).
As an example, we offer the following graph, which uses real data of the first static
volatility auction produced the first day of implementation of this system in SIBE (May 14,
2001) and is plotted in Graph 1, showing the evolution in the stock price throughout most of
the session. This chart plots both trading prices on the open market and the (non-traded)
indicative price (equilibrium price) during the auction.
The reference price (previous close) of this stock was 13,49 euros. The static range of
this stock was 5%, which means that the upper static limit was 14,16 euros and the lower
115 Sociedad de Bolsas, S.A. (BME) 116 One specific case of modification decision of static ranges for the whole market was made by this Trading and Control Committee of Sociedad de Bolsas, S.A. (BME) after September 11th., 2001 (terrorist attacks of Twin Towers in the US). The day after (September 12th., 2001), a general static range of 15% was implemented in the market with the exception of the “Nuevo Mercado” segment, whose general static range for that day was 25%.
THESIS: The Spanish equity market (2000-2014): stylized facts.
José Antonio Pérez Rodríguez (Instituto Universitario de Investigación Ortega y Gasset. Universidad Complutense de Madrid). 119
static limit was 12,82 euros117 during the opening auction. As the graph shows, a static
volatility auction is triggered when the stock tries to trade at the upper static limit of 14,16
euros (static price +5%).
The opening auction finishes and fix a price (static price) at 9:00 a.m. + random end of
13,75 euros. Therefore, we are in continuous trading or open market. With respect to this
static price we have 5% up and down which gives us our new static limits: 13,07 euros (lower
limit) and 14,43 euros (upper limit). As we mentioned before, this means that, according to
these limits, buy limit orders above 14,43 euros or sell limit orders below 13,75 euros118 can
not be entered, although limit orders with exactly those limits are permitted.
Once the stock is in continuous trading or open market phase, the stock starts
trading119 at different increasing prices drawing an up-slope trend. Finally, a potential price of
14,43 euros is trying to be traded.
The mechanics of the triggering of the static volatility auction is then the following:
let’s assume, for example, that there is a bid standing order of 14,43 euros120 of 100 shares
and then, a sell limit order of 14,42 euros of 80 shares is entered. If this was the case, then the
recently entered sell limit order of 14,42 euros would try to trade at the best opposite side
price of the order book which, in our example is 14,43 euros. Since 14,43 euros is exactly the
upper static limit, once the trade tries to be done at that price of 14,43 euros, without
trading121, a static volatility auction is triggered and the new static price during the auction is
14,43 euros.
From that moment on (12:49:24 p.m.), all market participants know that a static
volatility auction has been triggered, since SIBE sends a message (which is broadcasted
117 We have to note here that there is a rounding criteria established for static ranges consisting on narrowing the static spread. In our example, if 13,49 euros is the static price (in this case, also the reference price), the upper limit calculation would be 13,49 + 5% = 14,1645 which is finally rounded to 14,16 euros. The lower limit calculation would be 13,49 – 5% = 12,8155 which is finally rounded to 12,82 euros. Therefore, the official static limits in SIBE for this stock were 12,82 euros (lower limit) and 14,16 euros (upper limit). 118 Please note that, buy orders below 13,75 euros or sell orders above 14,43 euros are permitted. 119 According to the standard rules already covered (price priority, time priority and best opposite side of the order book). 120 Please note that a buy limit order with a price of 14,43 euros is possible to be entered and positioned in the order book since limit orders exactly with the limit price are permitted (however, buy limit orders with a higher price than 14,43 euros would not be petmitted). Therefore, a possible bid-ask spread in that moment in the order book would be the following: 14,43 euros (as best bid) and 14,44 euros (as best ask). Besides, this ask limit order at 14,44 euros is also possible to be standing because the rule was that buy limit orders with higher price than the upper limit are not permitted nor sell limit orders with a lower price than the lower limit. Therefore, sell limit orders with a higher price than the upper limit are permitted. 121 This means that the potential trade at 14,43 euros is not produced. However, the triggering sell limit order of 80 shares at a price of 14,42 euros is entered (is part of the order book during the auction).
THESIS: The Spanish equity market (2000-2014): stylized facts.
José Antonio Pérez Rodríguez (Instituto Universitario de Investigación Ortega y Gasset. Universidad Complutense de Madrid). 120
through all vendor disseminators of information) letting know all market participants the new
situation as well as the new static price and static limits for this stock and during the auction.
Therefore, the new static limits during the auction are 15,15 euros (lower limit) and
13,71 euros (upper limit), which makes possible to find a new price above or below (5%
band) the trigger price (14,43 euros).
It should be also noted that during this auction period, the static price is the trigger
price of the auction. As we mentioned before, as a general rule, the static price is the price
fixed at the last auction (the auction allocation price)122, but also the static price is when the
upper or lower limit is breached, then this price functions as a static price (only during the
auction because, at the end of the auction, we are going to find a new static price that, by
general definition, is a static price). Otherwise, in our example, the stock could not continue
fluctuating in the breaking point sense (on the upside).
We have to note here that, concerning a static volatility auction, 4 possible situations
can be found in SIBE:
FIRST SITUATION: in the real example given here (see graph), the evolution of the
equilibrium price during the volatility auction is as follows: during the five minutes (plus
random end) of the auction, the trigger price was perceived to be too high by all market
participants, since the allocation price of the volatility auction (14,25 euros) was a lower price
than the trigger price (14,43 euros). This new static price resulting from this static volatility
auction (14,25 euros) is lower than the trigger price (14,43 euros) but higher than the original
static price fixed that morning at the resolution of the opening auction (13,75 euros).
Therefore, keeping apart from more technical aspects and focusing our attention in the
philosophy or raison d´être of these volatility auctions, according to these example123, all
market participants “think” (through the general rules of fixing the auction price –macro
level-) that the true asset’s value of this stock is 14,25 euros according to the new information
received by the market; which is a lower price than the trigger price of 14,43 euros (coming
from two specific orders in one specific moment in the order book –micro level-) but a higher
price than the one fixed that morning at the resolution of the opening auction (13,75 euros),
122 The static price at 8.30 a m. is the reference price. 123 This example is a good example, according to the evolution of prices, in the sense that shows the typical structure of a static volatility auction in SIBE.
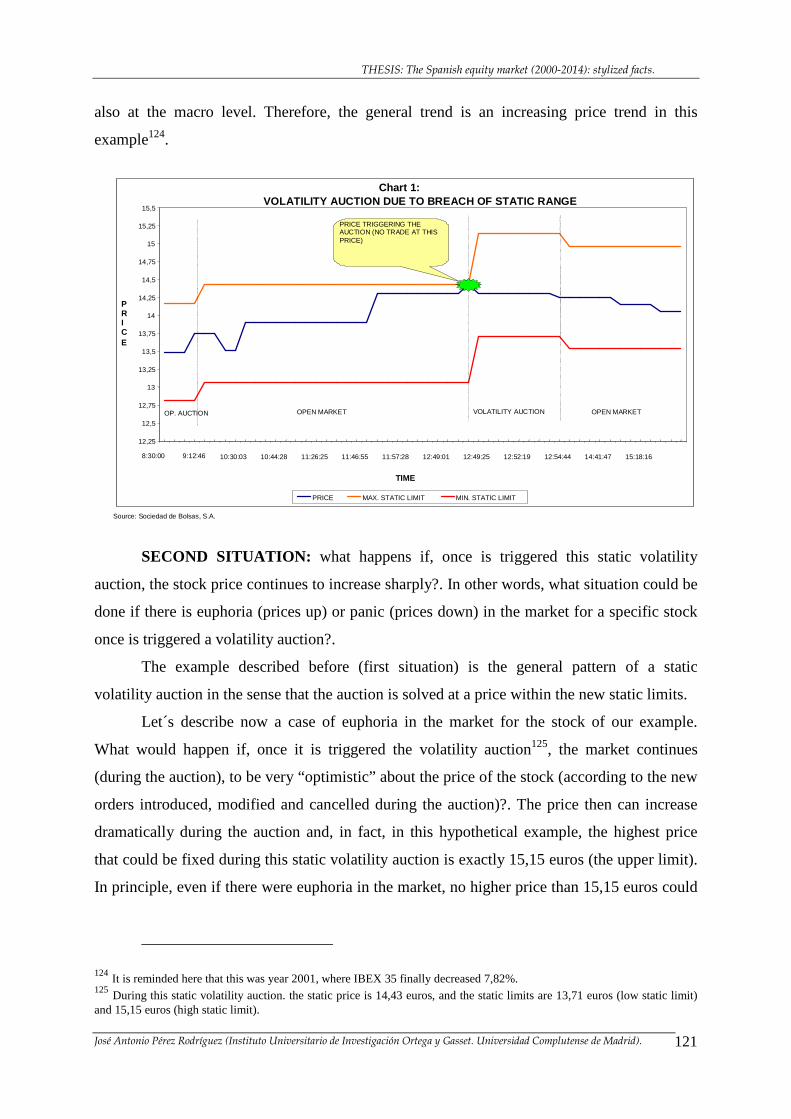
THESIS: The Spanish equity market (2000-2014): stylized facts.
José Antonio Pérez Rodríguez (Instituto Universitario de Investigación Ortega y Gasset. Universidad Complutense de Madrid). 121
also at the macro level. Therefore, the general trend is an increasing price trend in this
example124.
SECOND SITUATION: what happens if, once is triggered this static volatility
auction, the stock price continues to increase sharply?. In other words, what situation could be
done if there is euphoria (prices up) or panic (prices down) in the market for a specific stock
once is triggered a volatility auction?.
The example described before (first situation) is the general pattern of a static
volatility auction in the sense that the auction is solved at a price within the new static limits.
Let´s describe now a case of euphoria in the market for the stock of our example.
What would happen if, once it is triggered the volatility auction125, the market continues
(during the auction), to be very “optimistic” about the price of the stock (according to the new
orders introduced, modified and cancelled during the auction)?. The price then can increase
dramatically during the auction and, in fact, in this hypothetical example, the highest price
that could be fixed during this static volatility auction is exactly 15,15 euros (the upper limit).
In principle, even if there were euphoria in the market, no higher price than 15,15 euros could
124 It is reminded here that this was year 2001, where IBEX 35 finally decreased 7,82%. 125 During this static volatility auction. the static price is 14,43 euros, and the static limits are 13,71 euros (low static limit) and 15,15 euros (high static limit).
Source: Sociedad de Bolsas, S.A.
Chart 1: VOLATILITY AUCTION DUE TO BREACH OF STATIC RANGE
12,25 12,5
12,75 13
13,25 13,5
13,75 14
14,25 14,5
14,75 15
15,25 15,5
8:30:00 9:12:46 10:30:03 10:44:28 11:26:25 11:46:55 11:57:28 12:49:01 12:49:25 12:52:19 12:54:44 14:41:47 15:18:16 TIME
P R I C E
PRICE MAX. STATIC LIMIT MIN. STATIC LIMIT
OPEN MARKET OP. AUCTION VOLATILITY AUCTION OPEN MARKET
PRICE TRIGGERING THE AUCTION (NO TRADE AT THIS PRICE)
THESIS: The Spanish equity market (2000-2014): stylized facts.
José Antonio Pérez Rodríguez (Instituto Universitario de Investigación Ortega y Gasset. Universidad Complutense de Madrid). 122
be reached during the volatility auction. However, what is indeed possible (under this
“euphoria sentiment hypothesis” in the market) is that, once the auction would be solved at a
price of 15,15 euros (new static price), the stock could continue increasing, now under the
open market or continuous trading. Therefore, a stock could go up (or down) more than the
percentage established by the static range, since it could alternatively have periods of
volatility auction and periods of open market (or continuous trading) drawing an upward
(downward126) sloping line of prices.
THIRD SITUATION: however, a third situation is also possible: this would be a
more extreme case, and is the situation of a struggling of a stock. Imagine that the previous
situation is given, that is, the price fixed during the auction is in the upper or lower limit
(imagine the upper limit –we still think about the “euphoria sentiment hypothesis”). If, at the
time of the allocation and following the five minute auction plus random end, market
conditions are such that the volume of market orders plus market to limit orders, is higher
than the volume of opposite-side orders which may be allocated, in such situations, the system
does not carry out the share allocation and, in these exceptional cases, the share remains under
auction, leaving the allocation decision in the hands of the Trading and Control Committee127,
which (through the Surveillance Department) will make the decision to go ahead with the
allocation, provided that the situation is corrected128.
Therefore, in this third situation, the market situation evolves as follows: once a
volatility auction for a stock tries to finish (allocation of an auction), and finds a situation of
its order book such that the volume of market orders plus market to limit orders, is higher than
the volume of opposite-side orders which may be allocated, then SIBE sends the following
message to all market participants129: “The stock XYZ continues in auction”. From that
moment on, the stock continues in auction during an undetermined period of time. Given that
situation of a struggling of a stock, SIBE does not find a solution to that, let’s say, conflict.
126 Of course this example described of an optimistic situation (“euphoria sentiment hypothesis”) drawing an up trend line of prices could be also a pessimistic situation (“panic sentiment hypothesis”) drawing a down trend line of prices. 127 The Trading and Control Committee is compounded by five members: one member from each of the four Stock Exchanges Governing Bodies in Spain (Madrid, Barcelona, Bilbao and Valencia) and the Coordinator member, who belongs to Sociedad de Bolsas, S.A. 128 If the closing auction is extended, the system will carry out the allocation process automatically after the close of the two-minute extension period, and this is one of the main differences with respect to some other markets in Europe. 129 This message is sent through the vendor feed to all disseminators of information of SIBE.
THESIS: The Spanish equity market (2000-2014): stylized facts.
José Antonio Pérez Rodríguez (Instituto Universitario de Investigación Ortega y Gasset. Universidad Complutense de Madrid). 123
It is a conflict in the sense that, as we explained before, a market order, for example, is
a very aggressive type of order. From the perspective of an investor, a market order is a tool
that, in some way, guarantees that he/she is necessarily going to buy (if it is a buy order) or
sell (if it is a sell order) since this type of order is willing to buy / sell at any possible price.
However, given this special situation, his/her “trading wishes” are not going to be satisfied in
the sense that his/her order is not going to be satisfied. This investor may think “I gave an
instruction (order) to buy at no matter which price and finally I did not buy…”. On the other
hand, there is a market situation such that the volume on the other side of the order book is
lower than the volume of market orders plus market to limit orders. In the aforementioned
sense, this is a conflict for SIBE which, as mentioned, in a first step sends the following
message: “The stock XYZ continues in auction”.
Now, the Trading and Control Committee (human decisions are made) intervenes.
They usually make two complementary decisions. Therefore, the following two measures are
taken:
A) Longer the auction. This decision is announced (broadcasted) through the trading
terminals (SIBE Smart) and also reaches all disseminators of information whose
original market data is SIBE. Imagine that, in our example, it could be fixed (by
the Trading and Control Committee) the new time of resolution of the auction at
13:45 p.m.
B) Widen ranges. This decision is also announced (broadcasted) through the trading
terminals (SIBE Smart) and also reaches all disseminators of information whose
original market data is SIBE. Imagine that, in our example, and given that this
stock had a static range of 5%, then imagine that the decision made (by the
Trading and Control Committee) was to widen this static range to 10% (up and
down).
As a result of these two measures, all market participants now know that, on one side,
there is more time of auction period for this particular stock and, on the other side, upper and
lower limits are now permitted under the new static range of 10%.
Trying to apply these two measures in our previous example (first situation), we
remind that the volatility auction was triggered at a price of 14,43 euros. Therefore, 14,43
euros was the new static price during the auction (given that we had 5% of static range, upper
limit is 15,15 and lower limit is 13,71 euros). If, under this volatility auction, we have a
THESIS: The Spanish equity market (2000-2014): stylized facts.
José Antonio Pérez Rodríguez (Instituto Universitario de Investigación Ortega y Gasset. Universidad Complutense de Madrid). 124
situation such that market orders plus market to limit orders (let’s say, in the bid side) have a
higher volume than all standing orders in the ask side, we have a struggling of this stock. The
above situation have a up-side pressure in the sense that, apparently the price of the stock tries
to continue to go up once is triggered the volatility auction.
Now, the Trading and Control Committee decides to longer the auction and to widen
the static range to, say, 10%. New static limits are, therefore, 12,99 euros (lower limit) and
15,87 euros (upper limit).
As previously mentioned, for an investor that had a market order standing in the order
book, he/she wanted to buy shares at “any” price (he/she does not care about the price).
However, if we carefully analyze the situation, given that the upper limit was (before the
decision taken by the Trading and Control Committee –static range still at 5%-) 15,15 euros,
this investor knows that the highest price at which, hypothetically, he/she could buy would
exactly that price of 15,15 euros.
Now, after the decision taken by the Trading and Control Committee (static range at
10%), and given the new static limits of 12,99 euros (lower limit) and 15,87 euros (highest
limit), the highest price at which he/she could buy would be 15,87 euros. Now, our investor
reconsider his preferences since he/she is willing to buy not exactly at “any” price: his/her
internal psychological limit price is 15,50 euros.
To sum up, before the Trading and Control Committee widened ranges (when the
limits were 12,99 and 15,15 euros), he/she wanted to buy at “any” price (in the sense that his
“internal psychological limit” of 15,50 euros is out of the static limits); therefore, he/she could
place an order as a market order. However, now (after the Trading and Control Committee
widened ranges –static limits are now 12,99 euros and 15,87 euros-) he/she reconsiders
because the upper limit (now 15,87 euros) is really high! according to his/her individual
preferences. Therefore, he/she modifies his/her order from “market order” to a “limit order”
with a price, for example, 15,50 euros (his/her “internal personal” maximum price to pay for
this stock).
As this investor behavioural process is described, probably many investors follows the
same pattern. Therefore, the situation is corrected in the order book in the sense that, since
many orders are modified from market orders (or market to limit orders130) to limit orders
130 We remind here that, in an auction, market to limit orders are limited to the equilibrium price of the auction, once the auction is solved.
THESIS: The Spanish equity market (2000-2014): stylized facts.
José Antonio Pérez Rodríguez (Instituto Universitario de Investigación Ortega y Gasset. Universidad Complutense de Madrid). 125
with a specific price, there are no disequilibrium131 anymore and the auction can be solved as
usually once the new time is reached.
FOURTH SITUATION: there is a fourth situation also possible: this is the case
when, once is triggered a volatility auction, there is no equilibrium price at the end of the
auction. Therefore, the volatility auction is solved but no equilibrium price is found. The
typical situation here would be to find, at the end of the auction, a spread of prices where best
bid is a lower price than best ask. Therefore, the number of shares traded at the end of the
auction would be zero and the static price after the auction would be the previous static price
(triggering price if static volatility auction or previous static price if dynamic volatility
auction).
Therefore, as a general and complete view, we could have the following 4 alternative
situations about the resolution of a static volatility auction in SIBE:
1) When the price fixed at the end of a volatility auction is within the static limits,
which is the general pattern and our first real example described above.
2) If the price fixed at the end of the volatility auction is exactly in the upper or lower
static limit, which is a more rare case but also possible (was our second example
described before).
3) This is the case of a struggling of a stock, which means that, once is triggered the
volatility auction, there is the case when the volume of market orders plus market
to limit orders of one side is higher than the volume of the opposite side of the
order book132.
4) Last possibility is the case when there is no equilibrium price at the end of the
auction.
131 We understand “disequilibrium” when market orders plus market to limit orders of one side of the order book have a total higher volume than orders in the other side of the order book. 132 In these cases, the price tends to go up to the upper static limit or low to the lower static limit.
THESIS: The Spanish equity market (2000-2014): stylized facts.
José Antonio Pérez Rodríguez (Instituto Universitario de Investigación Ortega y Gasset. Universidad Complutense de Madrid). 126
3.8.4. Volatility auctions due to breach of dynamic range
Volatility Auctions due to breaches of the static range are triggered when a trade in a
stock is tried either at or out the upper or lower limit of the dynamic price range (maximum
variation up or down with respect the dynamic price).
As an example, we offer the following graph, which uses real data of the first dynamic
volatility auction produced the first day of implementation of this system in SIBE (May 14,
2001) and is plotted in Graph 2, showing the evolution in the stock price throughout most of
the session. This chart plots both trading prices on the open market and the (non-traded)
indicative price (equilibrium price) during the auction.
The reference price (previous close) of this stock was 8,40 euros. The static range of
this stock was 6%, which means that the upper static limit was 8,90 euros and the lower static
limit was 7,90 euros during the opening auction.
The opening auction finishes and fix a price (static price) at 9:00 a.m. + random end of
8,34 euros. Therefore, we are in continuous trading or open market. With respect to this static
price we have 6% up and down which gives us our new static limits: 7,84 euros (lower limit)
and 8,84 euros (upper limit). As we mentioned before, this means that, according to these
limits, buy limit orders above 8,84 euros or sell limit orders below 7,84 euros133 can not be
entered, although limit orders with exactly those limits are permitted.
Besides, the dynamic range for this example is 3,5%.
Once the stock is in continuous trading or open market phase (after the opening
auction), the stock starts trading134 at different decreasing prices drawing a down-slope trend.
Finally, a traded price of 8,35 euros is reached.
Given that specific price of 8,35 euros, the dynamic price (last traded price) is
therefore 8,35 euros at this moment (9:33:55 a.m.). With respect to this dynamic price, we
have a symmetric dynamic range of 3,5% (up and down). Therefore, the lower dynamic limit
is 8,05 euros and the upper dynamic limit is 8,65 euros.135
133 Please note that, buy orders below 7,84 euros or sell orders above 8,84 euros are permitted. 134 According to the standard rules already covered (price priority, time priority and best opposite side of the order book). 135 We have to note here that there is a rounding criteria established for dynamic ranges (which is different than the static range criteria) consisting on widening the dynamic spread. In our example, if 8,35 euros is the dynamic price (last traded price), the upper limit calculation would be 8,35 + 3,5% = 8,64225 which is finally rounded to 8,65 euros. The lower limit
THESIS: The Spanish equity market (2000-2014): stylized facts.
José Antonio Pérez Rodríguez (Instituto Universitario de Investigación Ortega y Gasset. Universidad Complutense de Madrid). 127
Given the situation described in the previous paragraph, next traded price tries to be
done at 7,90 euros (which is a lower price than the low dynamic limit established at 8,05
euros). The mechanics of the triggering of the dynamic volatility auction is then the
following: let’s assume, for example, that there is a bid standing order of 7,90euros136 of 80
shares and then, a sell limit order of 7,89 euros of 60 shares is entered. If this were the case,
then the recently entered sell limit order of 7,89 euros would try to trade at the best opposite
side price of the order book which, in our example is 7,90 euros. Since 7,90 euros is out (a
lower price) of the low dynamic limit at that moment, once the trade tries to be done at that
price of 7,90 euros, without trading137, a dynamic volatility auction is triggered.
From that moment on (09:39:50 p.m.), all market participants know that this stock is
under volatility auction conditions, since SIBE sends a message (which is broadcasted
through all vendor disseminators of information) letting know all market participants the new
situation: a dynamic volatility auction has been triggered.
We note here that the static price during the auction is still 8,34 euros (the static price
fixed at the end of the opening auction). Therefore, the static limits during the auction are still
7,84 euros (lower limit) and 8,84 euros (upper limit), which makes possible to find a new
price above or below (6% band) the static price (8,34 euros).
We have to note here that, concerning a dynamic volatility auction, 4 possible
situations can be found in SIBE:
FIRST SITUATION: in the real example provided here (see graph), the evolution of
the equilibrium price during the volatility auction is as follows: during the five minutes (plus
random end) of the auction, the trigger price was perceived to be too low by all market
participants, since the allocation price of the volatility auction (8,08 euros) was a higher price
than the trigger price (8,05 euros), which is also the lower dynamic limit. The new static price
resulting from this dynamic volatility auction (8,08 euros) is higher than the trigger price
(8,05 euros) but lower than the original static price fixed that morning at the resolution of the
opening auction (8,34 euros).
calculation would be 8,35 – 3,5% = 8,05775 which is finally rounded to 8,05 euros. Therefore, the official dynamic limits in SIBE for this stock at this moment were 8,05 euros (lower limit) and 8,65 euros (upper limit). 136 Please note therefore that a possible bid-ask spread in that moment in the order book would be the following: 7,90 euros (as best bid) and 7,91 euros (as best ask). 137 This means that the potential trade at 7,90 euros is not produced. However, the triggering sell limit order of 60 shares at a price of 7,89 euros is entered (is part of the order book during the auction).
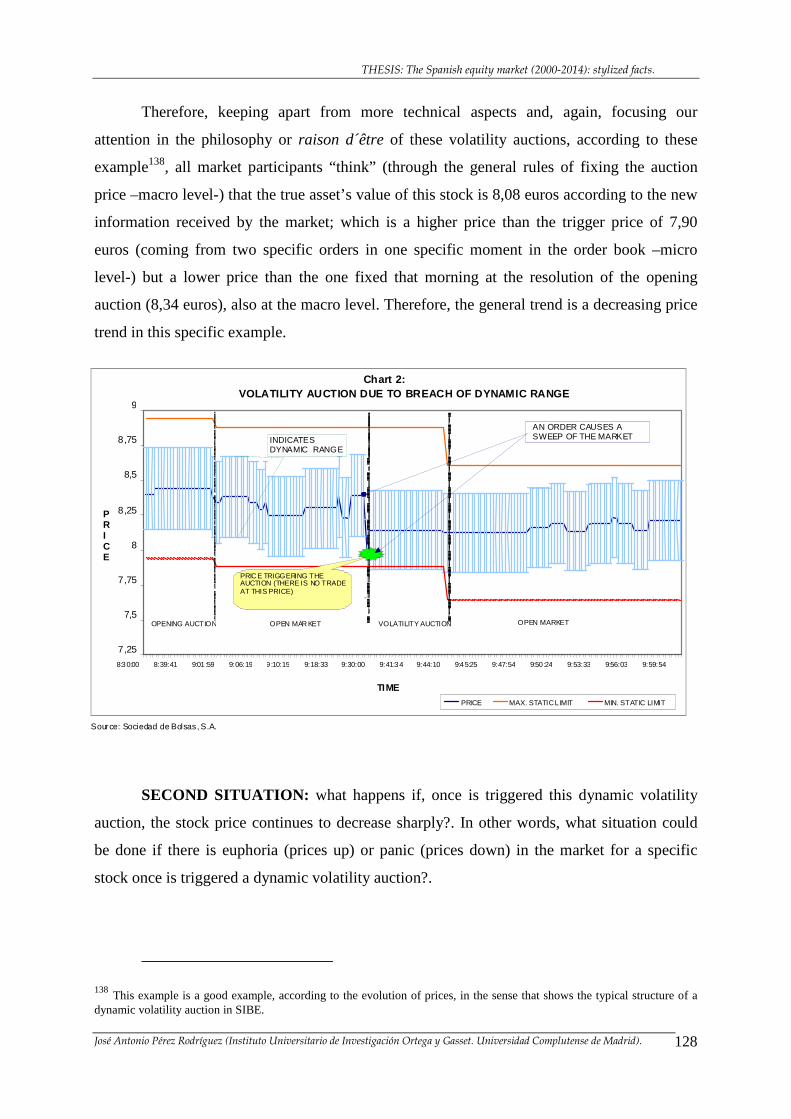
THESIS: The Spanish equity market (2000-2014): stylized facts.
José Antonio Pérez Rodríguez (Instituto Universitario de Investigación Ortega y Gasset. Universidad Complutense de Madrid). 128
Therefore, keeping apart from more technical aspects and, again, focusing our
attention in the philosophy or raison d´être of these volatility auctions, according to these
example138, all market participants “think” (through the general rules of fixing the auction
price –macro level-) that the true asset’s value of this stock is 8,08 euros according to the new
information received by the market; which is a higher price than the trigger price of 7,90
euros (coming from two specific orders in one specific moment in the order book –micro
level-) but a lower price than the one fixed that morning at the resolution of the opening
auction (8,34 euros), also at the macro level. Therefore, the general trend is a decreasing price
trend in this specific example.
SECOND SITUATION: what happens if, once is triggered this dynamic volatility
auction, the stock price continues to decrease sharply?. In other words, what situation could
be done if there is euphoria (prices up) or panic (prices down) in the market for a specific
stock once is triggered a dynamic volatility auction?.
138 This example is a good example, according to the evolution of prices, in the sense that shows the typical structure of a dynamic volatility auction in SIBE.
Source: Sociedad de Bolsas, S.A.
Chart 2: VOLATILITY AUCTION DUE TO BREACH OF DYNAMIC RANGE
7,25
7,5
7,75
8
8,25
8,5
8,75
9
8:30:00 8:39:41 9:01 :59 9:06:19 9 :10:15 9:18:33 9:30:00 9:41:34 9:44:10 9:45:25 9:47:54 9:50 :24 9:53:33 9:56:03 9:59:54
TIME
PR I C E
PRICE MAX. STATIC L IMIT MIN. STATIC LIMIT
OPEN MAR KET OPENING AUCTION VOLATILITY AUCTION OPEN MARKET
INDICATES DYNAMIC RANGE
PRIC E TRIGGERING THE AUCTION (THERE IS NO TRADE AT THIS PRICE)
AN ORDER CAUSES A SWEEP OF THE MARKET
THESIS: The Spanish equity market (2000-2014): stylized facts.
José Antonio Pérez Rodríguez (Instituto Universitario de Investigación Ortega y Gasset. Universidad Complutense de Madrid). 129
The example described before (first situation) is the general pattern of a dynamic
volatility auction in the sense that the auction is solved at a price within the static limits.
Let´s describe now a case of panic in the market for the stock of our example. What
would happen if, once it is triggered the volatility auction, the market continues (during the
auction), to be very “pessimistic” about the price of the stock (according to the new orders
introduced, modified and cancelled during the auction)?. The price then can decrease
dramatically during the auction and, in fact, in this hypothetical example, the lowest price that
could be fixed during this dynamic volatility auction is exactly 7,84 euros (the lower limit). In
principle, even if there were panic in the market, no lower price than 7,84 euros could be
reached during the volatility auction. However, what is indeed possible (under this “panic
sentiment hypothesis” in the market) is that, once the auction would be solved at a price of
7,84 euros (new static price), the stock could continue falling, now under the open market or
continuous trading phase. Therefore, a stock could go down (or up) more than the percentage
established by the static range, since it could alternatively have periods of volatility auction
and periods of open market (or continuous trading) drawing a downward (upward139) sloping
line of prices.
THIRD SITUATION: however, a third situation is also possible: this would be a
more extreme case, and is the situation of a struggling of a stock. Imagine that the previous
situation is given, that is, the price fixed during the auction is in the upper or lower limit
(imagine the lower limit –we still think about the “panic sentiment hypothesis”). If, at the
time of the allocation and following the five minute auction plus random end, market
conditions are such that the volume of market orders plus market to limit orders, is higher
than the volume of opposite-side orders which may be allocated, in such situations, the system
does not carry out the share allocation and, in these exceptional cases, the share remains under
auction, leaving the allocation decision in the hands of the Trading and Control Committee,
which (through the Surveillance Department) will make the decision to go ahead with the
allocation, provided that the situation is corrected140.
139 Of course this example described of a pessimistic situation (“pessimistic sentiment hypothesis”) drawing a down trend line of prices could be also a optimistic situation (“euphoria sentiment hypothesis”) drawing an up trend line of prices. 140 If the closing auction is extended, the system will carry out the allocation process automatically after the close of the two-minute extension period, and, as mentioned before, this is one of the main differences with respect to some other markets in Europe.
THESIS: The Spanish equity market (2000-2014): stylized facts.
José Antonio Pérez Rodríguez (Instituto Universitario de Investigación Ortega y Gasset. Universidad Complutense de Madrid). 130
Therefore, in this third situation (and similarly to the explained process with the static
volatility auctions), the market situation evolves as follows: once a volatility auction for a
stock tries to finish (allocation of an auction), and finds a situation of its order book such that
the volume of market orders plus market to limit orders, is higher than the volume of
opposite-side orders which may be allocated, then SIBE sends the following message to all
market participants141: “The stock XYZ continues in auction”. From that moment on, the
stock continues in auction during an undetermined period of time. Given that situation of a
struggling of a stock, SIBE does not find a solution to that, let’s say, conflict.
It is a conflict in the sense that, as we explained before, a market order, for example, is
a very aggressive type of order. From the perspective of an investor, a market order is a tool
that, in some way, guarantees that he/she is necessarily going to buy (if it is a buy order) or
sell (if it is a sell order) since this type of order is willing to buy/sell at any possible price.
However, given this special situation, his/her “trading wishes” are not going to be satisfied in
the sense that his/her order is not going to be satisfied. This investor may think “I gave an
instruction (order) to sell at no matter which price and finally I did not sell…”. On the other
hand, there is a market situation such that the volume on the other side of the order book is
lower than the volume of market orders plus market to limit orders. In the aforementioned
sense, this is a conflict for SIBE which, as mentioned, in a first step sends the following
message: “The stock XYZ continues in auction”.
Now, once this message is sent, the Trading and Control Committee intervenes
(human decisions are made). They usually make two complementary decisions:
A) Longer the auction. This decision is announced (broadcasted) through the trading
terminals (SIBE Smart) and also reaches all disseminators of information whose
original market data is SIBE. Imagine that, in our example, it could be fixed (by
the Trading and Control Committee) the new time of resolution of the auction at
10:30 p.m.
B) Widen ranges. This decision is also announced (broadcasted) through the trading
terminals (SIBE Smart) and also reaches all disseminators of information whose
original market data is SIBE. Imagine that, in our example, and given that this
stock had a static range of 6%, then imagine that the decision made (by the
141 This message is sent through the vendor feed to all disseminators of information of SIBE.
THESIS: The Spanish equity market (2000-2014): stylized facts.
José Antonio Pérez Rodríguez (Instituto Universitario de Investigación Ortega y Gasset. Universidad Complutense de Madrid). 131
Trading and Control Committee) was to widen this static range to 10% (up and
down).
As a result of these two measures, all market participants now know that, on one side,
there is more time of auction period for this particular stock and, on the other side, upper and
lower limits are now permitted under the new static range of 10%.
Trying to apply these two measures in our previous example (first situation), we
remind that the volatility auction was triggered at a price of 7,90 euros. The static range, once
triggered this dynamic volatility auction continues to be 8,34 euros (price fixed at the end of
the opening auction at 9:00 + random end). Given that this stock has an established static
range of 6%, the upper limit is 8,84 and lower limit is 7,84 euros. If, under this volatility
auction, we have a situation such that market orders plus market to limit orders (let’s say, in
the ask side) have a higher volume than all standing orders in the bid side, we have a
struggling of this stock. The above situation have a down-side pressure in the sense that,
apparently the price of the stock tries to continue to go down once is triggered the volatility
auction.
Now, the Trading and Control Committee decides to longer the auction and to widen
the static range to, say, 10%. New static limits are, therefore, 7,51 euros (lower limit) and 9,17
euros (upper limit).
As previously mentioned, for an investor that had a market order standing in the order
book, he/she wanted to sell shares at “any” price (he/she does not care about the price).
However, if we carefully analyze the situation, given that the lower limit was (before the
decision taken by the Trading and Control Committee –static range at 6%-) 7,84 euros, this
investor knows that the lowest price at which, hypothetically, he/she could sell would be
exactly that price of 7,84 euros.
Now, after the decision taken by the Trading and Control Committee, and given the
new static limits of 7,51 euros (lower limit) and 9,17 euros (highest limit), the lowest price at
which he/she could sell would be 7,51 euros. Now, our investor reconsider his preferences
since he/she is willing to sell not exactly at “any” price: his/her internal psicological limit
price is 7,70 euros.
To sum up, before the Trading and Control Committee widened ranges (when the
limits were 7,84 and 8,84 euros), he/she wanted to sell at “any” price (in the sense that his
“internal psicological limit” of 7,70 euros is out of the static limits); therefore, he/she could
THESIS: The Spanish equity market (2000-2014): stylized facts.
José Antonio Pérez Rodríguez (Instituto Universitario de Investigación Ortega y Gasset. Universidad Complutense de Madrid). 132
place an order as a market order (apparently, willing to sell at any price). However, now (after
the Trading and Control Committee widened ranges –static limits are now 7,51 euros and 9,17
euros-) he/she reconsiders because the lower limit (now 7,51 euros) is really low! according to
his/her individual preferences. Therefore, he/she modifies his/her order from “market order”
to a “limit order” with a price, for example, 7,70 euros (his/her “internal personal” minimum
price to receive for this stock).
As this investor behavioural process is described before, probably many investors
follow the same pattern. Therefore, the situation is corrected in the order book in the sense
that, since many orders are modified from market orders (or market to limit orders142) to limit
orders with a specific price, there are no disequilibrium143 anymore and the auction can be
solved as usually once the new time is reached.
Last comment about this third situation will be that, probably, and due to the nature of
both kinds of volatility auctions (static and dynamic), this third situation is more probable to
occur for static volatility auctions than for dynamic volatility auctions.
FOURTH SITUATION: there is a fourth situation also possible: this is the case
when, once is triggered a volatility auction, there is no equilibrium price at the end of the
auction. Therefore, the volatility auction is solved but no equilibrium price is found. The
typical situation here would be to find, at the end of the auction, a spread of prices where best
bid is a lower price than best ask. Therefore, the number of shares traded at the end of the
auction would be zero and the static price after the auction would be the previous static price
(the one fixed at the opening auction in our example).
Therefore, as a general and complete view, we could have the following 4 alternative
situations about the resolution of a dynamic volatility auction in SIBE:
1) When the price fixed at the end of a volatility auction is within the static limits,
which is the general pattern and our first real example described above.
2) If the price fixed at the end of the volatility auction is exactly in the upper or lower
static limit, which is a more rare case but also possible (was our second example
described before).
142 We remind here that, in an auction, market to limit orders are limited to the equilibrium price of the auction, once the auction is solved. 143 We understand “disequilibrium” when market orders plus market to limit orders of one side of the order book have a total higher volume than orders in the other side of the order book.
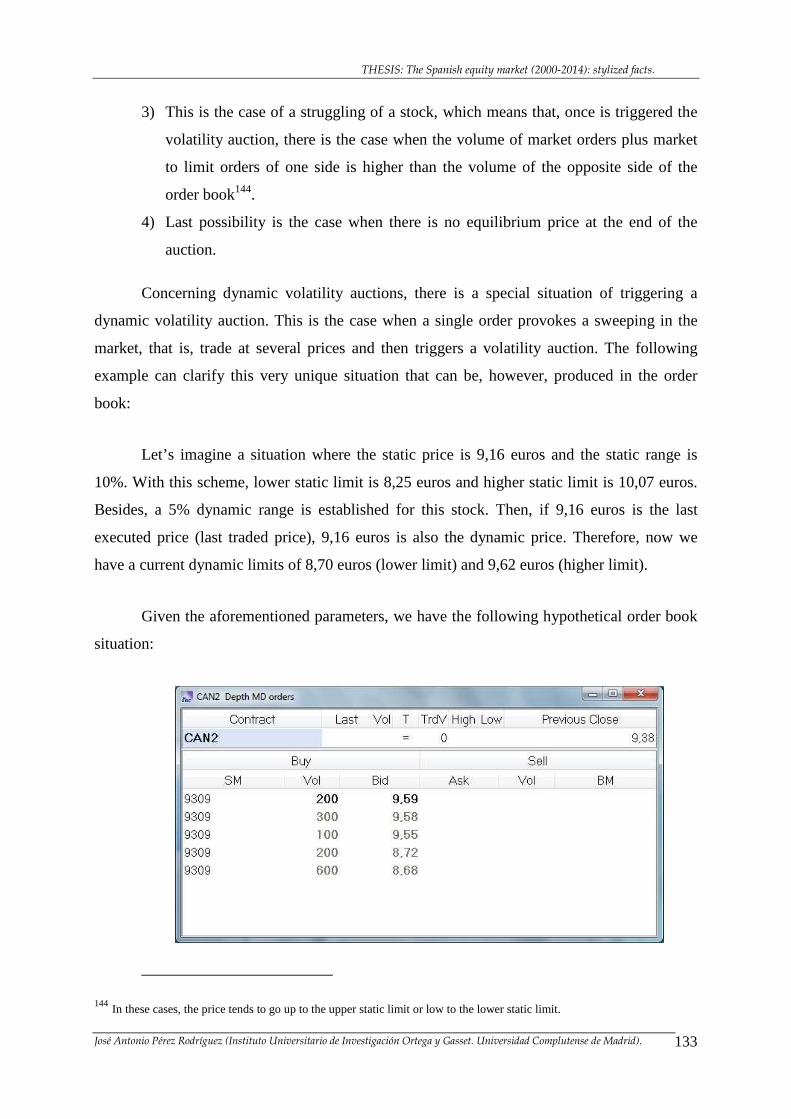
THESIS: The Spanish equity market (2000-2014): stylized facts.
José Antonio Pérez Rodríguez (Instituto Universitario de Investigación Ortega y Gasset. Universidad Complutense de Madrid). 133
3) This is the case of a struggling of a stock, which means that, once is triggered the
volatility auction, there is the case when the volume of market orders plus market
to limit orders of one side is higher than the volume of the opposite side of the
order book144.
4) Last possibility is the case when there is no equilibrium price at the end of the
auction.
Concerning dynamic volatility auctions, there is a special situation of triggering a
dynamic volatility auction. This is the case when a single order provokes a sweeping in the
market, that is, trade at several prices and then triggers a volatility auction. The following
example can clarify this very unique situation that can be, however, produced in the order
book:
Let’s imagine a situation where the static price is 9,16 euros and the static range is
10%. With this scheme, lower static limit is 8,25 euros and higher static limit is 10,07 euros.
Besides, a 5% dynamic range is established for this stock. Then, if 9,16 euros is the last
executed price (last traded price), 9,16 euros is also the dynamic price. Therefore, now we
have a current dynamic limits of 8,70 euros (lower limit) and 9,62 euros (higher limit).
Given the aforementioned parameters, we have the following hypothetical order book
situation:
144 In these cases, the price tends to go up to the upper static limit or low to the lower static limit.
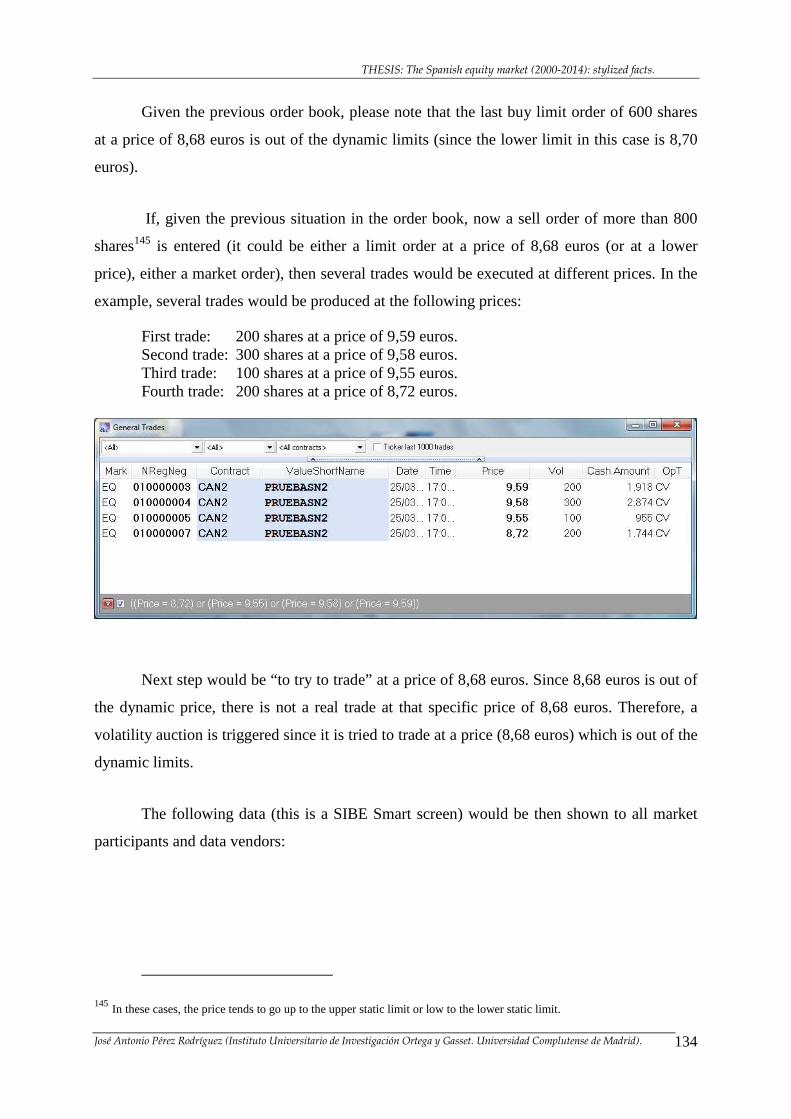
THESIS: The Spanish equity market (2000-2014): stylized facts.
José Antonio Pérez Rodríguez (Instituto Universitario de Investigación Ortega y Gasset. Universidad Complutense de Madrid). 134
Given the previous order book, please note that the last buy limit order of 600 shares
at a price of 8,68 euros is out of the dynamic limits (since the lower limit in this case is 8,70
euros).
If, given the previous situation in the order book, now a sell order of more than 800
shares145 is entered (it could be either a limit order at a price of 8,68 euros (or at a lower
price), either a market order), then several trades would be executed at different prices. In the
example, several trades would be produced at the following prices:
First trade: 200 shares at a price of 9,59 euros. Second trade: 300 shares at a price of 9,58 euros. Third trade: 100 shares at a price of 9,55 euros. Fourth trade: 200 shares at a price of 8,72 euros.
Next step would be “to try to trade” at a price of 8,68 euros. Since 8,68 euros is out of
the dynamic price, there is not a real trade at that specific price of 8,68 euros. Therefore, a
volatility auction is triggered since it is tried to trade at a price (8,68 euros) which is out of the
dynamic limits.
The following data (this is a SIBE Smart screen) would be then shown to all market
participants and data vendors:
145 In these cases, the price tends to go up to the upper static limit or low to the lower static limit.
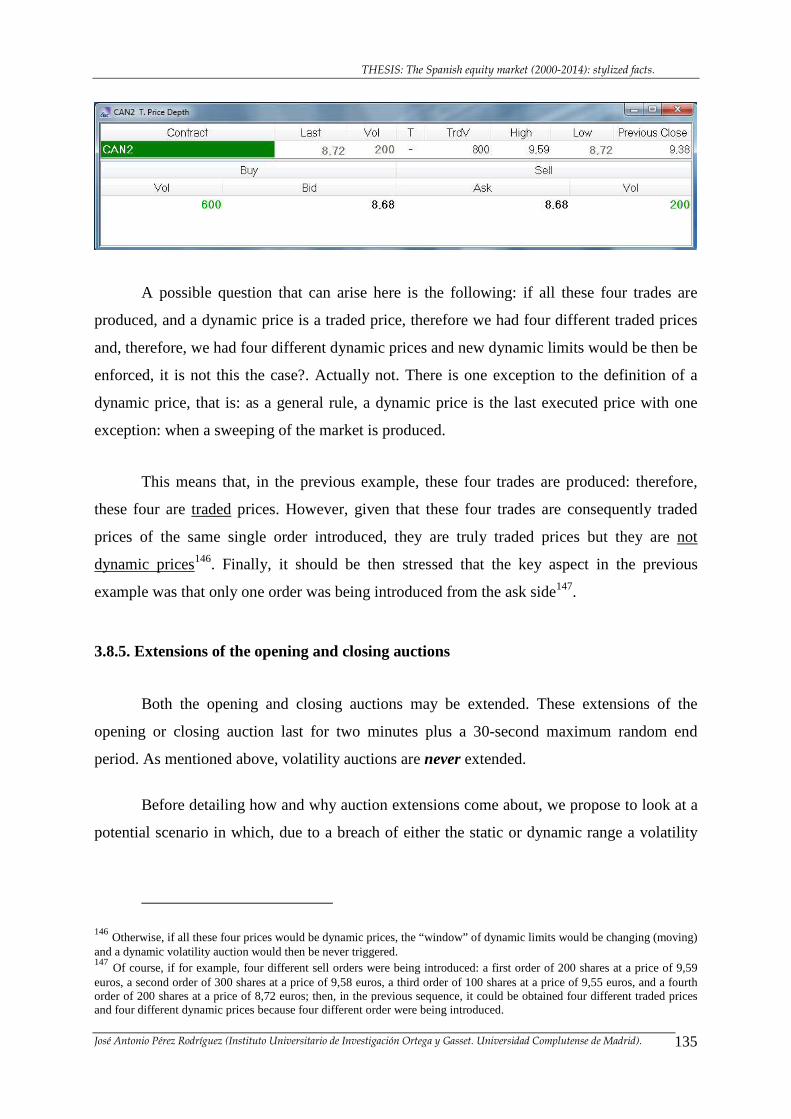
THESIS: The Spanish equity market (2000-2014): stylized facts.
José Antonio Pérez Rodríguez (Instituto Universitario de Investigación Ortega y Gasset. Universidad Complutense de Madrid). 135
A possible question that can arise here is the following: if all these four trades are
produced, and a dynamic price is a traded price, therefore we had four different traded prices
and, therefore, we had four different dynamic prices and new dynamic limits would be then be
enforced, it is not this the case?. Actually not. There is one exception to the definition of a
dynamic price, that is: as a general rule, a dynamic price is the last executed price with one
exception: when a sweeping of the market is produced.
This means that, in the previous example, these four trades are produced: therefore,
these four are traded prices. However, given that these four trades are consequently traded
prices of the same single order introduced, they are truly traded prices but they are not
dynamic prices146. Finally, it should be then stressed that the key aspect in the previous
example was that only one order was being introduced from the ask side147.
3.8.5. Extensions of the opening and closing auctions
Both the opening and closing auctions may be extended. These extensions of the
opening or closing auction last for two minutes plus a 30-second maximum random end
period. As mentioned above, volatility auctions are never extended.
Before detailing how and why auction extensions come about, we propose to look at a
potential scenario in which, due to a breach of either the static or dynamic range a volatility
146 Otherwise, if all these four prices would be dynamic prices, the “window” of dynamic limits would be changing (moving) and a dynamic volatility auction would then be never triggered. 147 Of course, if for example, four different sell orders were being introduced: a first order of 200 shares at a price of 9,59 euros, a second order of 300 shares at a price of 9,58 euros, a third order of 100 shares at a price of 9,55 euros, and a fourth order of 200 shares at a price of 8,72 euros; then, in the previous sequence, it could be obtained four different traded prices and four different dynamic prices because four different order were being introduced.
THESIS: The Spanish equity market (2000-2014): stylized facts.
José Antonio Pérez Rodríguez (Instituto Universitario de Investigación Ortega y Gasset. Universidad Complutense de Madrid). 136
auction is triggered less than five minutes before the start of a closing auction. In such cases,
the Volatility Auction overlaps with the general closing auction.
Why and when is the opening auction for a given stock extended? If the price resulting
from the opening auction of one specific stock is on the limits of the static range, the opening
auction for this stock would be extended (two minutes plus the maximum 30 second-random
end).
Why and when is the closing auction for a given stock extended? If the price resulting
from the closing auction of one specific stock is on the limits of the static range, or on the
limits of or outside the dynamic range, the closing auction for that specific stock is extended
(two minutes plus the maximum 30 second-random end).
There is also one specific case of an extension, both applied at the opening or closing
auction: this is the case when, at the end of the auction (either opening or closing), a situation
is given such that the volume of market orders plus market to limit orders is higher than the
volume of opposite-side orders which may be allocated.
If the aforementioned situation occurs at the end of an opening auction, then an
extension of two minutes plus a maximum random end of 30 seconds is produced. If, at the
end of the extension of the opening auction, this situation continues to happen then SIBE
sends the following message to all market participants150: “The stock XYZ continues in
auction”. From that moment on, the stock continues in auction during an undetermined period
of time. Given that situation of a struggling of a stock, the typical decisions made by the
Trading and Control Committee (already explained in sections 3.8.3 and 3.8.4) takes place:
longer the auction and lengthen ranges.
148 Remember that the dynamic range also applies in the closing auction.
149 Extensions to closing auctions always end with an allocation, regardless of whether market conditions are such that the
volume of market orders, plus market to limit orders, is higher than the volume of opposite-side orders that may be allocated. However, if such conditions arise during an extension to an opening auction, the share remains under auction, leaving the allocation decision in the hands of the Trading and Control Committee, which (via the Supervision Department) will make the decision to go ahead with the allocation, provided that the situation is corrected.
150 This message is sent through the vendor feed to all disseminators of information of SIBE.
THESIS: The Spanish equity market (2000-2014): stylized facts.
José Antonio Pérez Rodríguez (Instituto Universitario de Investigación Ortega y Gasset. Universidad Complutense de Madrid). 137
If the aforementioned situation occurs at the end of a closing auction, then an
extension of two minutes plus a maximum random end of 30 seconds is produced. If, at the
end of the extension of the closing auction, this situation continues to happen then SIBE
allocates and solves the auction, which means that, even if some market orders and market to
limit orders are not totally fulfilled (SIBE allocates market orders and market to limit orders
according to time priority –those orders introduced first are first served-), market closes151.
3.9. Market specialists
Some stocks in SIBE have specialists152, that is, market members whose function is to
provide liquidity quoting bid and ask prices in the order book along the trading session.
Stocks which have specialists are those included in the Latibex153.
Market members may request that the Trading and Control Committee register
commitments assumed with the issuers of shares traded in the market in respect of which they
are responsible for promoting and boosting market liquidity. Accordingly, market members
who have registered a liquidity commitment shall be considered specialists and shall be
required to comply with certain market parameters (mainly spread and volume parameters)
and prerequisites at all times. These parameters will differ depending on whether the share is
the subject of an auction or is trading on the open market.
The surveillance department is responsible for ensuring that specialists comply with
the contractual commitments assumed at all times.
3.10. Information dissemination
SIBE includes a specialised information dissemination system, designed to distribute
detailed information on how the market is performing—both in terms of trades actually being
151 This is one of the main differences of the Spanish market with respect to some other markets in Europe. In Euronext (Paris), they have an additional period named “trading at last”; also in London Stock Exchange there is an additional period as explained in Section 1.3 of this thesis. 152
These specialists, and depending on the specific national market, are also named internationally market makers, designated sponsors, liquidity providers, animateurs, etc. although they all not have the same specific rights and obligations.
153 Core regulation concerning specialists are contained in Circular no 3/2000 and Operating Instruction no 1/2001 of Latibex
(Mercado de Valores Latinoamericanos).
THESIS: The Spanish equity market (2000-2014): stylized facts.
José Antonio Pérez Rodríguez (Instituto Universitario de Investigación Ortega y Gasset. Universidad Complutense de Madrid). 138
carried out on the market and the system’s order book—in real time. The aim of this is to
provide a service giving a true reflection of market transparency.
This flow of information is provided to all entities connected to the system with real
time information on each trade produced in the market, any change in the IBEX® indices and
the status of the order book throughout the session.
The following contents are available:
• Trades: a message is issued each time a trade is produced. The message details the
specific stock code, time stamp, price, volume and counterparties (market members)
of the trade.
• Order book (Market by prices): a message is issued each time there is a change in the
five (5) or twenty (20) best buy and/or sell positions.
• Index information: messages with information pertaining to all IBEX® indices are
issued.
3.11. Main aspects about trading mechanisms and evolution of warrants and certificates
in SIBE.
As already mentioned in section 1, on November 11, 2002 the segment for Warrants,
Certificates and Other Products was launched in SIBE. The market functioning of these
products is slightly different from those trading aspects already mentioned for shares.
In order to make more clear this point, a brief summary about the main differences of
the market model of Warrants, Certificates and Other products (with respect to the market
model of shares) is shown here:
• Neither opening auction nor closing auction exists for warrants, certificates and other
products, and the key-aspect to stress here is that the closing price of the session is the
midpoint of the bid-ask spread quoted by the specialist, rounded up. In the absence of
these bid-ask positions or if the closing price is outside the security’s dynamic range
or the security is suspended from trading, the closing price shall be the price of the last
trade in the session. In the absence of the above, the closing price shall be the
reference price of the session.
THESIS: The Spanish equity market (2000-2014): stylized facts.
José Antonio Pérez Rodríguez (Instituto Universitario de Investigación Ortega y Gasset. Universidad Complutense de Madrid). 139
• Concerning order types, only the limit order exists for warrants, certificates and other
products in SIBE. Neither market order nor market to limit orders exists for this
segment in SIBE. Besides, execution conditions (execute or eliminate, minimum
volume or fill or kill) or iceberg orders does not exist for warrants, certificates and
other products. Finally, concerning orders, it should be pointed out that all orders are
valid for the day which means that, after the end of each session, all existing orders are
eliminated from the system.
• Still concerning order types for warrants, certificates and other products, there is one
special type of order (only existing for warrants, certificates and other products as well
as for ETFs), which is the quote order. The quote order is a limit bid-ask order used by
specialists in order to provide liquidity in the products they are obliged to act as
specialists or market makers154. It is a “double” order in the sense that a bid-price and
an ask-price is provided at the same time through this quote order. The number of
quote orders in SIBE is 1,8%155 of all orders introduced in SIBE. Quote orders can be
traded at all times against simple orders and may activate auctions just like any other
order.
• Static ranges and static volatility auctions’s functioning is the same as for shares.
However, dynamic ranges or dynamic volatility auctions does not exist for warrants,
certificates and other products.
• As mentioned before, specialists (also named liquidity providers) have an important
role in this segment as opposed to shares (where specialists are only present for
Latibex market).
• Finally, it should be pointed out that, as opposed to the market functioning explained
before concerning shares, for warrants, certificates and other products market
members identification for each trade are not disseminated in real time as trades are
taking place while the market is open. However, market participants identification are
shown after the close of the market156.
154 This “quote order” is usually implemented through external applications not existing in the manual application of order
introduction and surveillance of the market named “SIBE Smart”.
155 Data collected in November 2014. Source: BME monthly report.
156 This information is shown through the web page (section warrants): www.bmerv.es
THESIS: The Spanish equity market (2000-2014): stylized facts.
José Antonio Pérez Rodríguez (Instituto Universitario de Investigación Ortega y Gasset. Universidad Complutense de Madrid). 140
3.12. Main aspects about trading mechanisms and evolution of ETF in SIBE.
The first ETF in SIBE was launched on July 20, 2006. The market model for ETFs is
similar as the one for shares. Some differences, though, should be stressed here:
• Closing auction does not exist for ETFs. Therefore, the closing price is calculated as
the midpoint of the existing best bid and best ask positions when the market closes,
rounded up. In absence of any of those positions or if the closing price were out of the
static range of the security, or if the security were suspended, the closing price would
be the last traded price in the session. In absence of the previous ones, the closing
price would be the reference price for the session.
• Another main aspect it should be stressed here is that, besides the standard information
disseminated in real time as already explained in shares, also the Indicative Net Asset
Value for ETFs is disseminated in real time. This means that the Net Asset Value sent
by the issuer157 after the close of the previous day is disseminated. Therefore, this Net
Asset Value sent by the issuer the previous day, multiplied by the percentage of
variation of the underlying, is disseminated in real time: this number is named the
“Indicative Net Asset Value”.
• Concerning order types, the same order types as considered for shares are valid for
ETFs. Besides, as also explained for warrants, certificates and other products, the
quote order exists also for ETFs as an important tool for the specialists in order to
boost market liquidity for their corresponding ETF. It is reminded here that 1,8%158 of
all orders introduced in SIBE are quote orders.
• Finally, according to the management of price variation, static and dynamic ranges as
well as static and dynamic volatility auctions occurs in SIBE for ETFs as in the case
for shares.
157 Actually, the Manager Entity (in Spanish “Sociedad Gestora de Instituciones de Inversión Colectiva”) is the entity in
charge of sending the Net Asset Value after the close of each trading session as well as, among their obligations, it should be pointed out that this Manager Entity is in charge of computing the Net Asset Value, implements the Adjustments to the securities basket with respect to the underlying index, it creates and eliminates the corresponding participations and subscription units and, finally, it implements the dividend payments as well as their marketing functions and statistical collection and publications of its corresponding ETF.
158 Data collected in November 2014. Source: BME monthly report.
THESIS: The Spanish equity market (2000-2014): stylized facts.
José Antonio Pérez Rodríguez (Instituto Universitario de Investigación Ortega y Gasset. Universidad Complutense de Madrid). 141
3.13. IBEX 35®: the official Spanish stock exchange index.
IBEX 35® is the official index of the Spanish equity market, and it is calculated,
published and disseminated by BME (Bolsas y Mercados Españoles).
This index is compounded by the highest liquid 35 companies of the Spanish equity
market (shares). It is a representative indicator since it represents more than 89% of total
turnover traded in the Spanish equity market (shares) and its capitalization159 accounts for
more than 64% of total capitalization of shares of the Spanish equity market160. It can be said
that this means an important achievement of the index since, with a relatively low
capitalization (and is not that low, is more than 64% of the total market), represents more than
89% of total turnover traded in the Spanish stock market (which is a very large figure).
IBEX 35® is a tradable index suitable for investment products and it is designed to
represent the performance of the Spanish Stock Market. Besides, this index (born on January
14, 1992) is designed to function as an underlying index for futures and options contracts
traded on BME’s Derivatives Market (MEFF). IBEX 35 is also the benchmark for Exchange-
traded funds (ETFs), warrants and certificates.
3.13.1. IBEX 35®: Main characteristics, Technical Advisory Committee and liquidity
criteria.
IBEX 35® is a Laspeyres type index and its components weight in the index according
to free float market capitalization. It is an index which has redefinitions 4 times a year (on
March and September –named follow up meetings- and on June and December –named
ordinary meetings-); all other meetings will be held on an extraordinary basis. Free float is
taken into account in the formula of calculation. Finally, and in order to complete this brief
introduction to the index, adjustments are made in the index when certain corporate actions
are taken place in any constituent of the index.
159 Capitalization is a key-variable in the formula used to compute the index. Capitalization is the number resulting from
multiplying the number of shares admitted for listing of one company by the price of the security (if it is a closing price, it should be obtained the capitalization of that company at the closing price; if it is considered the last executed price at a very specific moment in time, it should be obtained the capitalization in real time).
160 Data collected in November 2014. Source: BME monthly report.
THESIS: The Spanish equity market (2000-2014): stylized facts.
José Antonio Pérez Rodríguez (Instituto Universitario de Investigación Ortega y Gasset. Universidad Complutense de Madrid). 142
Another aspect that should be mentioned here is that all constituents of the index have
a maximum weighting of 20% (“these adjustments to the individual weights shall be effective
the same day on which the Ordinary reviews are effective. In the case that any constituent’s
weight rises significantly between reviews, exceeding the 20% limit, the index manager may
propose the Committee to perform an adjustment to the index to reestablish the maximum
weight to 20%”161).
Another main characteristic to be pointed out is that, although the real-time calculation
of the index started on January 14, 1992, the index has a base value of 3,000 at the close of
trading on December 29, 1989.
The Technical Advisory Committee is in charge of the indexes and it is compounded
by a minimum of five and a maximum of nine members162. According to the Official Rules,
this Technical Advisory Committee has the main following functions:
• “To supervise that the calculation of the Indexes is carried out by the Manager in
accordance with the present Technical Regulations for the Composition and Calculation of the
Sociedad de Bolsas, S.A. Indexes,
• To ensure the proper operation of the Indexes for use as an underlying index for
trading in financial derivatives,
• To study and approve the redefinitions of the Indexes when it deems appropriate and
at least every three months” 163.
161 Source: BME: “Technical regulations for the composition and calculation of the Sociedad de Bolsas, S.A. indexes” (October 2014). This new aspect of a maximum weight of 20% (announced last July 21, 2014 through an Official Notice) is due to the entry of the European regulations (ESMA/2012/832ES) that establishes the requirements for an investment fund to be considered UCITS. The guidelines to indices refer to diversification, methodology, transparency and independence. Specifically, there are certain limits in diversification for an index to be considered as a possible underlying for a UCITS fund.
162 The current members (December 2014) of this Technical Advisory Committe are the following: Mr. Blas Calzada (in his
capacity of Chairman of the Committee), Mr. Ramón Acín Ferrer, Mr. José Ramón Lasuén Sancho, Mr. Pablo Fernández,
Mr. Máximo Ferrando Bolado, Mr. Mikel Tapia Torres, Mr. Simón Sosvilla Rivero and Ms. María Parga Landa (as secretary
of the Committee but not as a member).
163 Source: BME: “Technical regulations for the composition and calculation of the Sociedad de Bolsas, S.A. indexes”
(October 2014).
THESIS: The Spanish equity market (2000-2014): stylized facts.
José Antonio Pérez Rodríguez (Instituto Universitario de Investigación Ortega y Gasset. Universidad Complutense de Madrid). 143
According to this last point, the decisions of the redefinitions of the index are made
four times a year. On June and December, the ordinary redefinitions are taking place, and on
March and September the follow up redefinitions are taking place.
For example, when the Technical Advisory Committee celebrates its meeting of June,
they take into account the last period control (which is the six-month previous period, that is,
from December of the previous year to the end of the month of May). This means that they
analyze data of these six previous months in order to make their decision about which
company (if any) should join the index and which company (if any) should leave the index. It
is important to stress here that the Technical Advisory Committee, in any of their meetings,
can decide not to alter the composition of the index, or that one stock joins the index
(therefore, one company leaves the index) or two companies joins the index (therefore, two
companies would leave the index) or more companies. In other words, there is no limit to the
number of constituents about which the Technical Advisory Committee can take their
decisions.
In the previous example, where June was the date of the ordinary meeting (usually
during the first fifteen days of the month), the same day of the meeting the Technical
Advisory Committee publishes (the afternoon of the day of the meeting, after the close of the
market) a Notice. Therefore, the decision is announced that afternoon but it will not come into
effect until the first trading day after the third day of the month (in this example, June)164.
Finally, concerning the dates where the Technical Advisory Committee celebrates a
meeting, it should be pointed out that, besides the standard meetings of March, June,
September and December, an Extraordinary Meeting can be also celebrated.
Concerning the criteria of selection of IBEX index constituents, the Technical
Advisory Committee takes into account the following liquidity factors:
“1. The trading volume in Euros in the order-driven market (Spanish Stock Exchange
Interconnection System market segment of the Joint Stock Exchange System called Main
Trading Market).
164 Source: BME: “Technical regulations for the composition and calculation of the Sociedad de Bolsas, S.A. indexes” (October 2014). It should be pointed out that this rule concerning the dates on which the decisions from the Technical Advisory Committee take effect were revised by the Sociedad de Bolsas’ Board of Directors, according to liquidity and replicability criteria from IBEX 35® index, and in convergence with international counterparts’ indices.
THESIS: The Spanish equity market (2000-2014): stylized facts.
José Antonio Pérez Rodríguez (Instituto Universitario de Investigación Ortega y Gasset. Universidad Complutense de Madrid). 144
2. The quality of the said trading volume, considering:
– trading volume during the control period that:
• is the result of transactions involving a change in the stable shareholding structure of the
Company,
• was traded by the same market member in a small number of transactions, or traded during a
time period regarded by the Manager as not representative,
• suffers a decline such as to cause the Manager to consider that the stock’s liquidity has been
seriously affected,
– the characteristics and amount of the transactions made in the market,
– the statistics for the trading volume and characteristics of the trading,
– the quality of bid-ask spreads, turnover and other liquidity measures applied at the
discretion of the Technical Advisory Committee.
3. Suspension of quotation or trading during a time period considered significant by the
Technical Advisory Committee” 165.
In order to provide a more explicative view of the aforementioned rules (detailing also
some examples), it should be mentioned here that, in general terms, liquidity is considered as
the main aspect to be considered when evaluating a possible candidate for joining IBEX 35
index. In this context of “liquidity” as the main concept to be measured, trading volume in
euro is obviously one key aspect to be considered when evaluating a candidate for joining the
index.
However, the concept of “quality” of that volume it could be not clear enough: one
example that could be clarifying here is that, in terms of quality of the market, it is considered
as more “valuable” (in terms of market quality) 10 different trades of 100000 shares each
trade that a single trade of 1000000 shares. It should be noticeable that the total number of
shares is the same in both cases; however, in terms of market quality (as long as it is more
disaggregated; possibly trades done between different market members), 10 different trades
are considered as having more “market quality” (more disaggregation) than one single block
165 Source: BME: “Technical regulations for the composition and calculation of the Sociedad de Bolsas, S.A. indexes” (October 2014).
THESIS: The Spanish equity market (2000-2014): stylized facts.
José Antonio Pérez Rodríguez (Instituto Universitario de Investigación Ortega y Gasset. Universidad Complutense de Madrid). 145
of 1000000 shares which, by the way, it could be the result of a pre-agreed trade between two
specific market members166.
Although, as mentioned, liquidity is the key concept to be considered, also
capitalization of a company plays a role in a very precise way in the following terms:
“For a stock to be included in the IBEX 35®, its average capitalization in the index
must be greater than 0.30% of the average index capitalization during the control period. For
this reason, the average capitalization of the stock computable in the Index will be understood
to be the arithmetic mean, adjusted by the corresponding free float factor according to the free
float band, resulting from multiplying the securities admitted for listing in each one of the
trading sessions of the control period by the closing price of the security in each one of these
sessions. Without prejudice to the stated above, the Technical Advisory Committee may
decide to remove a constituent stock from the IBEX 35® index when its average
capitalization computable in the index is lower than 0.30% of the average index capitalization
during two consecutive control periods for ordinary reviews”167.
According to the aforementioned rules, and although liquidity (and not capitalization)
is the key-aspect to be considered, capitalization in fact plays a role as seen in the previous
paragraph.
It should be reminded here that IBEX 35 collects the highest liquid 35 companies of
the Spanish Stock Exchange and, in that sense, (although it is obvious) it should be stressed
that liquidity is not size (capitalization). However, it is important to point out that, usually,
there is a very high correlation between liquidity and size (measured by capitalization), but
they are two different variables.
One interesting aspect considering the index is the case of new listings in the market.
What would happen if a the shares of a company starts to be listed in the market?. Is this
166 This last case, in fact, would not be a good example of market quality for two reasons: first, it is only one single trade and, secondly, since it is a pre-agreed trade, it does not show market quality because it is simply a bilateral pre-agreed trade which, obviously, is not very useful to measure market quality of that stock. 167 Source: BME: “Technical regulations for the composition and calculation of the Sociedad de Bolsas, S.A. indexes” (October 2014).
THESIS: The Spanish equity market (2000-2014): stylized facts.
José Antonio Pérez Rodríguez (Instituto Universitario de Investigación Ortega y Gasset. Universidad Complutense de Madrid). 146
company candidate for joining the index?. Going farther in this question: what would happen
if a company has been recently listed but was not in the market during the last six months (the
so-called “control period”?). “If this is the case, a minimum requirement of a certain number
of completed trading days shall be established, which will be at least one-third of those
included in the control period, except if the company has an index computable capitalization
among the top twenty in the IBEX 35®”168.
Going along with this argument, a good example would be the case of “Iberdrola
Renovables”, a company whose shares were listed on SIBE on December 13, 2007. Later on,
on January 29, 2008 an extraordinary meeting of the Technical Advisory Committee of the
IBEX 35 index was held. During the days previous to that Extraordinary Meeting, on the
social-media and press was published that “Iberdrola Renovables” was a good candidate for
joining the index because, as it was asserted, the index was highly concentrated in a few
number of sectors, that is, there were so much concentration of companies belonging to the
same activities (mainly banking and construction activities).
A first appropriate answer to be provided here to these general comments is that it
should be stressed that the Technical Advisory Committee does not take into account the
activities that the companies develop. In other words, the Technical Advisory Committee does
not analyze nor is an objective to reach an equilibrium of sectors in the index169. In fact,
“Iberdrola Renovables” was a company that was quoting on SIBE (Spanish Stock Exchange
Interconnection System) during less than 35 days before the Extraordinary Meeting of the
Technical Advisory Committee of last January 29, 2008 was held. According to the Official
rules specified two paragraphs before, “Iberdrola Renovables” was in the market a number of
trading days less than one-third of those included in the control period170, that is, two
168 Source: BME: “Technical regulations for the composition and calculation of the Sociedad de Bolsas, S.A. indexes” (October 2014). 169 This means that, potentially, it can exist a hypothetical IBEX 35 index with 35 companies, all of them belonging to the same sector, or the opposite: it can exist an index with 35 different sectors. The activity of the company (sectoral composition of the index) is not a variable taken into account by the Technical Advisory Committee when selecting constituents of the index. 170 As specified before, the control period is a complete period of 6 months (approximately 132 trading sessions).
THESIS: The Spanish equity market (2000-2014): stylized facts.
José Antonio Pérez Rodríguez (Instituto Universitario de Investigación Ortega y Gasset. Universidad Complutense de Madrid). 147
months171, while the trading days where “Iberdrola Renovables” was quoted was less than 35
trading days.
In fact, the Technical Advisory Committee (on January 29, 2008) decided to include
“Iberdrola Renovables” in the index because it was a company highly liquid and, although it
did not quote during at least this period of one-third of the control period, indeed it had “an
index computable capitalization among the top twenty in the IBEX 35®”; therefore this
requirement was fulfilled (actually, “Iberdrola Renovables” was the largest initial public
offering of the Spanish Stock Exchange in history).
Going further in these technical aspects of selection of constituents of the index by the
Technical Advisory Committee, it is also sometimes understood by some agents172 that, since
the evolution of a specific stock is positive during the control period (in terms of higher prices
reached by the shares of one specific company), this means that this specific stock is a good
candidate for joining the index in the next review of the index. This is not true given that, as
mentioned, the Technical Advisory Committee takes into account liquidity aspects which
does not necessarily mean a growing evolution of prices of the shares of a company173.
Another key aspect that it should be stressed is that the number of changes, when a
redefinition of the index takes place, is not limited to a certain number. The previous sentence
means that the Technical Advisory Committee can decide, when reviewing the index, to
exclude one constituent and to choose one constituent as substitute or, alternatively, to
exclude two constituents of the index and to choose two new constituents as substitutes or,
alternative, three, four (there is no limit). Another possibility is that the Technical Advisory
Committee can decide, when reviewing the index, to keep the same composition of the index
therefore not excluding nor including any constituent.
It is also important to point out that IBEX 35® index can temporarily have less than
35 constituents. A relatively extraordinary process that has important consequences in the
171 Approximately 44 trading days. 172 Of course, we are being referred here to not very well informed economic agents. 173 A key aspect to stress here is the following: if traded prices of a company are growing along time, this means that (for the same number of trades produced), a higher turnover is reached since each trade is done at a higher price than in the past. In this sense, a higher turnover would be reached as a consequence of higher prices traded.
THESIS: The Spanish equity market (2000-2014): stylized facts.
José Antonio Pérez Rodríguez (Instituto Universitario de Investigación Ortega y Gasset. Universidad Complutense de Madrid). 148
index are take over bids and mergers of companies belonging to the index. When these
corporate actions influence a constituent of IBEX 35® index, the first measure (usually taken
in the past by the Technical Advisory Committee) is to temporarily exclude from the index
the shares of that company until the result of the take over bid is available. The previous
measure would lead us to find an index temporarily with 34 constituents (or even less if
several take over bids takes place around the same dates174).
Concerning all this process of decision making by the Technical Advisory Committee,
a reasonable question to be raised can be the following: does the Technical Advisory
Committee, when reviewing the index, forecast or take into consideration future perspectives
of a company, stock or economic sector when choosing a constituent of the index?:
“ In its decision-making process, the Committee does not make long-term forecasts
when including a security on the index or excluding it from the same, although it may
consider transactions scheduled for the near future, regarding which the reliable disclosed
information may or may not be sufficient-for instance, the specific dates may not be known.
In any event, it shall be publicly disclosed, reliable information that significantly affects the
criteria used by the Committee, which are set out on the Technical Regulations for the
Composition and Calculation of the Sociedad de Bolsas, S.A. Indices. In no case does the
Committee consider forecasts on trading volume (for instance, owing to the rise or fall of an
industry sector or a given geographic area that the company is related to), the arrival of
competitors (whether domestic or foreign) particularly affecting a given security, etc.”.175
Finally, an aspect concerning the stability of the stock is also considered in the Official
rules, that is, “the Technical Advisory Committee will also take into account the security’s
sufficient stability, bearing in mind the use of the Index as the underlying index for
derivatives trading, as well as an efficient replication of the same. They will also take into
account the disclosure of the company´s dividend policy to the shareholders, including
relevant dates for the determination of the ex-dividend date, as well as providing timely and
174 At some point in the past, IBEX 35® index had only 32 constituents, as a consequence of several take over bids that were taking place around the same dates. 175 A complete and intuitive document about these questions can be found in the following website: www.bmerv.es (“10 key questions about IBEX 35®”).
THESIS: The Spanish equity market (2000-2014): stylized facts.
José Antonio Pérez Rodríguez (Instituto Universitario de Investigación Ortega y Gasset. Universidad Complutense de Madrid). 149
accurate information about any modification to the policy, due to the special relevance in the
price formation process of the securities and the correct valuation of the derivatives
instruments related to the index”176.
3.13.2. The Synthetic Liquidity Measure (SLM).
As a source of present and future research, another aspect to be focused now is to
consider different liquidity measures in order to evaluate liquidity of a stock. As considered in
the Official rules, the quality of trading volumes can be measured by the “the quality of bid-
ask spreads, turnover and other liquidity measures applied at the discretion of the Technical
Advisory Committee”177.
Typical liquidity measures are the bid-ask spread, turnover traded in euro, number of
shares traded as well as number of trades, meaning that as lower is the bid-ask spread the
highest the liquidity is, and the highest turnover traded in euro, or number of shares traded or
number of trades executed the highest liquidity is reached by a specific stock178.
One interesting liquidity measure is Kyle’s lambda, initially implemented for the
Spanish stocks by Warren, B. and Diego, R. (2000). Briefly, the lambda theoretically
developed by Kyle was defined as the turnover traded (expressed in euro) needed to move the
price 1%. Note that, what it is behind this measure is a pre-trade measure of liquidity.
I propose here a completely original measure, named the Synthetic Liquidity Measure
(SLM) for a specific stock, which combines pre-trade data with post-trade data and which I
think can be used widespread in different markets and products quoted in modern electronic
markets.
176 Source: BME: “Technical regulations for the composition and calculation of the Sociedad de Bolsas, S.A. indexes” (October 2014). 177 Source: BME: “Technical regulations for the composition and calculation of the Sociedad de Bolsas, S.A. indexes” (October 2014). 178 Note that, while the bid-ask spread is referred to pre-trade transparency (before trading), variables referred as turnover traded in euro, number of shares traded as well as number of trades are referred to post-trade data (data collected once trades are produced).
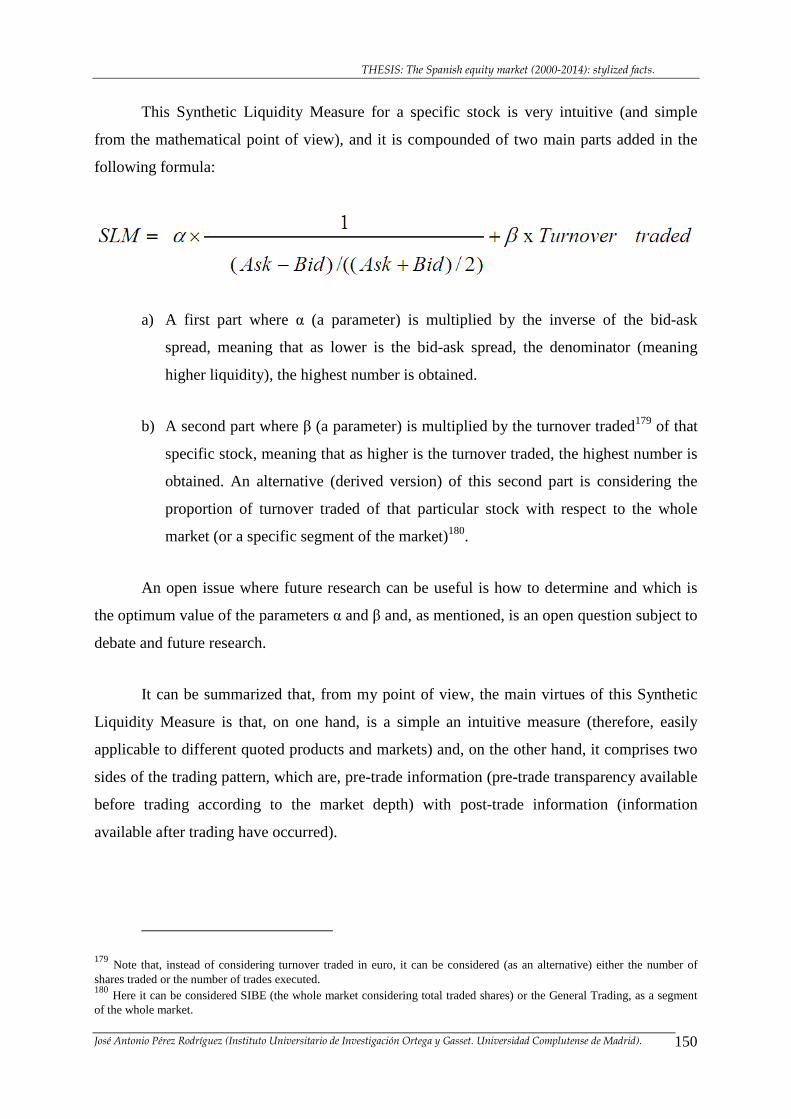
THESIS: The Spanish equity market (2000-2014): stylized facts.
José Antonio Pérez Rodríguez (Instituto Universitario de Investigación Ortega y Gasset. Universidad Complutense de Madrid). 150
This Synthetic Liquidity Measure for a specific stock is very intuitive (and simple
from the mathematical point of view), and it is compounded of two main parts added in the
following formula:
a) A first part where α (a parameter) is multiplied by the inverse of the bid-ask
spread, meaning that as lower is the bid-ask spread, the denominator (meaning
higher liquidity), the highest number is obtained.
b) A second part where β (a parameter) is multiplied by the turnover traded179 of that
specific stock, meaning that as higher is the turnover traded, the highest number is
obtained. An alternative (derived version) of this second part is considering the
proportion of turnover traded of that particular stock with respect to the whole
market (or a specific segment of the market)180.
An open issue where future research can be useful is how to determine and which is
the optimum value of the parameters α and β and, as mentioned, is an open question subject to
debate and future research.
It can be summarized that, from my point of view, the main virtues of this Synthetic
Liquidity Measure is that, on one hand, is a simple an intuitive measure (therefore, easily
applicable to different quoted products and markets) and, on the other hand, it comprises two
sides of the trading pattern, which are, pre-trade information (pre-trade transparency available
before trading according to the market depth) with post-trade information (information
available after trading have occurred).
179 Note that, instead of considering turnover traded in euro, it can be considered (as an alternative) either the number of shares traded or the number of trades executed. 180 Here it can be considered SIBE (the whole market considering total traded shares) or the General Trading, as a segment of the whole market.
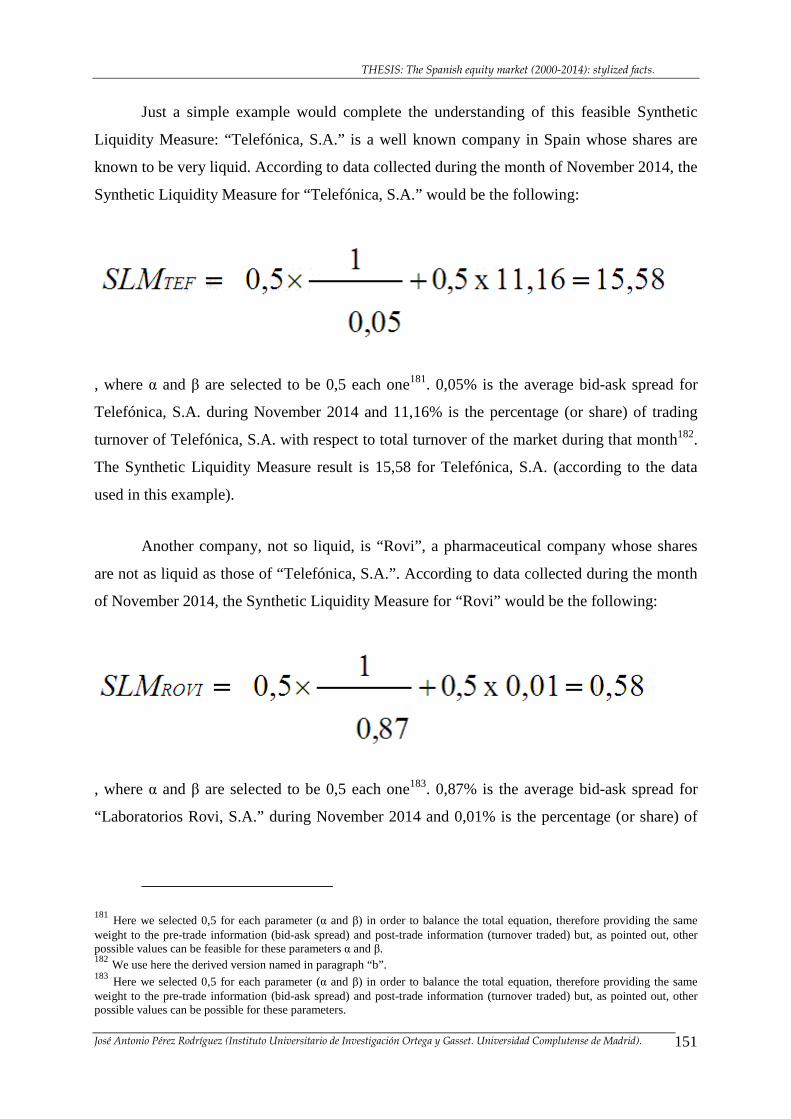
THESIS: The Spanish equity market (2000-2014): stylized facts.
José Antonio Pérez Rodríguez (Instituto Universitario de Investigación Ortega y Gasset. Universidad Complutense de Madrid). 151
Just a simple example would complete the understanding of this feasible Synthetic
Liquidity Measure: “Telefónica, S.A.” is a well known company in Spain whose shares are
known to be very liquid. According to data collected during the month of November 2014, the
Synthetic Liquidity Measure for “Telefónica, S.A.” would be the following:
, where α and β are selected to be 0,5 each one181. 0,05% is the average bid-ask spread for
Telefónica, S.A. during November 2014 and 11,16% is the percentage (or share) of trading
turnover of Telefónica, S.A. with respect to total turnover of the market during that month182.
The Synthetic Liquidity Measure result is 15,58 for Telefónica, S.A. (according to the data
used in this example).
Another company, not so liquid, is “Rovi”, a pharmaceutical company whose shares
are not as liquid as those of “Telefónica, S.A.”. According to data collected during the month
of November 2014, the Synthetic Liquidity Measure for “Rovi” would be the following:
, where α and β are selected to be 0,5 each one183. 0,87% is the average bid-ask spread for
“Laboratorios Rovi, S.A.” during November 2014 and 0,01% is the percentage (or share) of
181 Here we selected 0,5 for each parameter (α and β) in order to balance the total equation, therefore providing the same weight to the pre-trade information (bid-ask spread) and post-trade information (turnover traded) but, as pointed out, other possible values can be feasible for these parameters α and β. 182 We use here the derived version named in paragraph “b”. 183 Here we selected 0,5 for each parameter (α and β) in order to balance the total equation, therefore providing the same weight to the pre-trade information (bid-ask spread) and post-trade information (turnover traded) but, as pointed out, other possible values can be possible for these parameters.
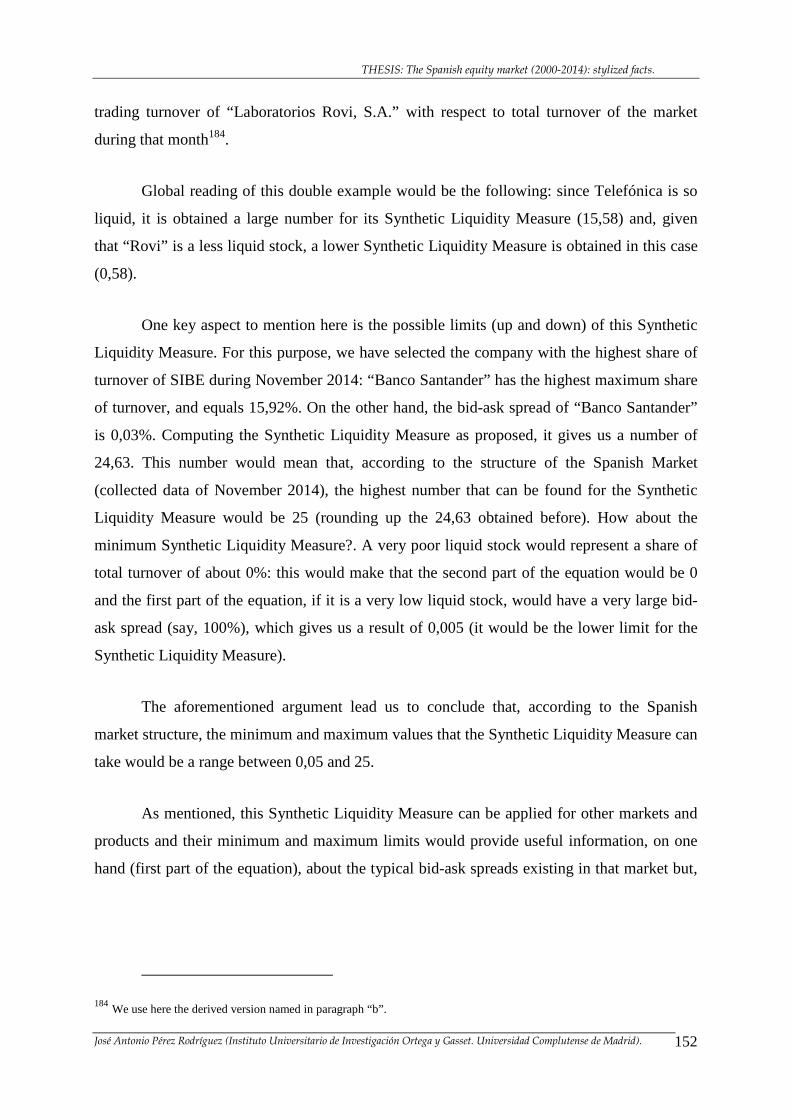
THESIS: The Spanish equity market (2000-2014): stylized facts.
José Antonio Pérez Rodríguez (Instituto Universitario de Investigación Ortega y Gasset. Universidad Complutense de Madrid). 152
trading turnover of “Laboratorios Rovi, S.A.” with respect to total turnover of the market
during that month184.
Global reading of this double example would be the following: since Telefónica is so
liquid, it is obtained a large number for its Synthetic Liquidity Measure (15,58) and, given
that “Rovi” is a less liquid stock, a lower Synthetic Liquidity Measure is obtained in this case
(0,58).
One key aspect to mention here is the possible limits (up and down) of this Synthetic
Liquidity Measure. For this purpose, we have selected the company with the highest share of
turnover of SIBE during November 2014: “Banco Santander” has the highest maximum share
of turnover, and equals 15,92%. On the other hand, the bid-ask spread of “Banco Santander”
is 0,03%. Computing the Synthetic Liquidity Measure as proposed, it gives us a number of
24,63. This number would mean that, according to the structure of the Spanish Market
(collected data of November 2014), the highest number that can be found for the Synthetic
Liquidity Measure would be 25 (rounding up the 24,63 obtained before). How about the
minimum Synthetic Liquidity Measure?. A very poor liquid stock would represent a share of
total turnover of about 0%: this would make that the second part of the equation would be 0
and the first part of the equation, if it is a very low liquid stock, would have a very large bid-
ask spread (say, 100%), which gives us a result of 0,005 (it would be the lower limit for the
Synthetic Liquidity Measure).
The aforementioned argument lead us to conclude that, according to the Spanish
market structure, the minimum and maximum values that the Synthetic Liquidity Measure can
take would be a range between 0,05 and 25.
As mentioned, this Synthetic Liquidity Measure can be applied for other markets and
products and their minimum and maximum limits would provide useful information, on one
hand (first part of the equation), about the typical bid-ask spreads existing in that market but,
184 We use here the derived version named in paragraph “b”.
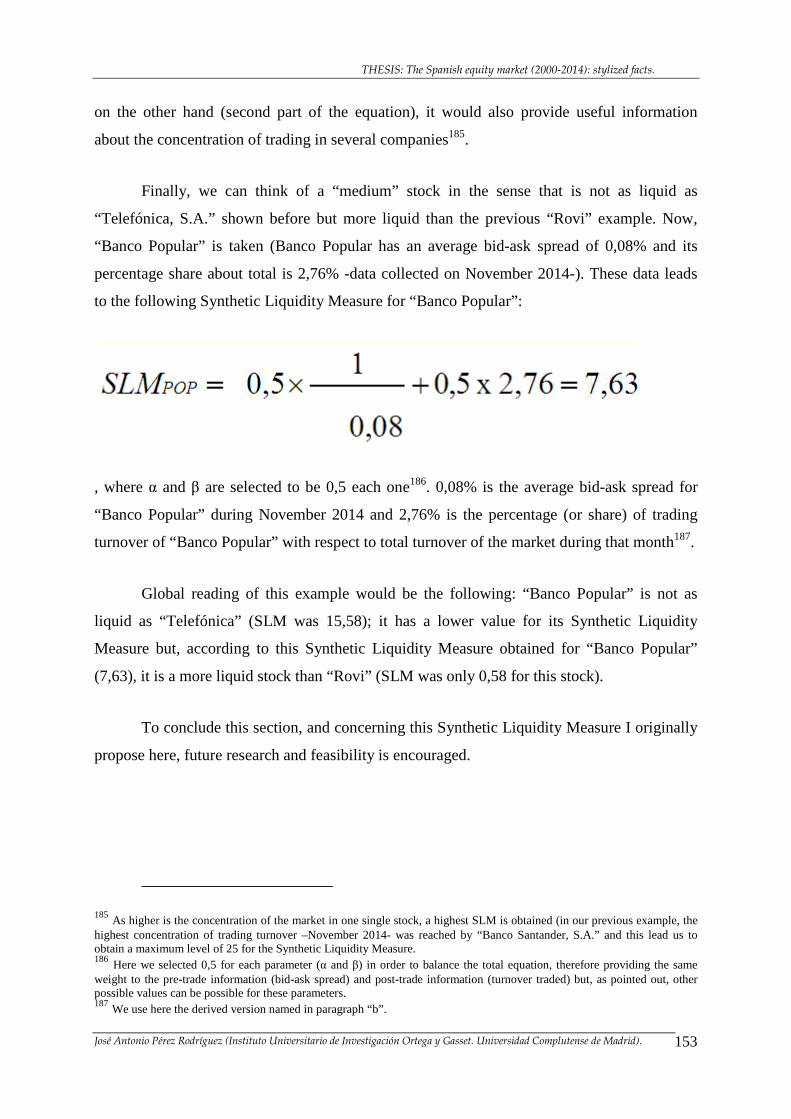
THESIS: The Spanish equity market (2000-2014): stylized facts.
José Antonio Pérez Rodríguez (Instituto Universitario de Investigación Ortega y Gasset. Universidad Complutense de Madrid). 153
on the other hand (second part of the equation), it would also provide useful information
about the concentration of trading in several companies185.
Finally, we can think of a “medium” stock in the sense that is not as liquid as
“Telefónica, S.A.” shown before but more liquid than the previous “Rovi” example. Now,
“Banco Popular” is taken (Banco Popular has an average bid-ask spread of 0,08% and its
percentage share about total is 2,76% -data collected on November 2014-). These data leads
to the following Synthetic Liquidity Measure for “Banco Popular”:
, where α and β are selected to be 0,5 each one186. 0,08% is the average bid-ask spread for
“Banco Popular” during November 2014 and 2,76% is the percentage (or share) of trading
turnover of “Banco Popular” with respect to total turnover of the market during that month187.
Global reading of this example would be the following: “Banco Popular” is not as
liquid as “Telefónica” (SLM was 15,58); it has a lower value for its Synthetic Liquidity
Measure but, according to this Synthetic Liquidity Measure obtained for “Banco Popular”
(7,63), it is a more liquid stock than “Rovi” (SLM was only 0,58 for this stock).
To conclude this section, and concerning this Synthetic Liquidity Measure I originally
propose here, future research and feasibility is encouraged.
185 As higher is the concentration of the market in one single stock, a highest SLM is obtained (in our previous example, the highest concentration of trading turnover –November 2014- was reached by “Banco Santander, S.A.” and this lead us to obtain a maximum level of 25 for the Synthetic Liquidity Measure. 186 Here we selected 0,5 for each parameter (α and β) in order to balance the total equation, therefore providing the same weight to the pre-trade information (bid-ask spread) and post-trade information (turnover traded) but, as pointed out, other possible values can be possible for these parameters. 187 We use here the derived version named in paragraph “b”.
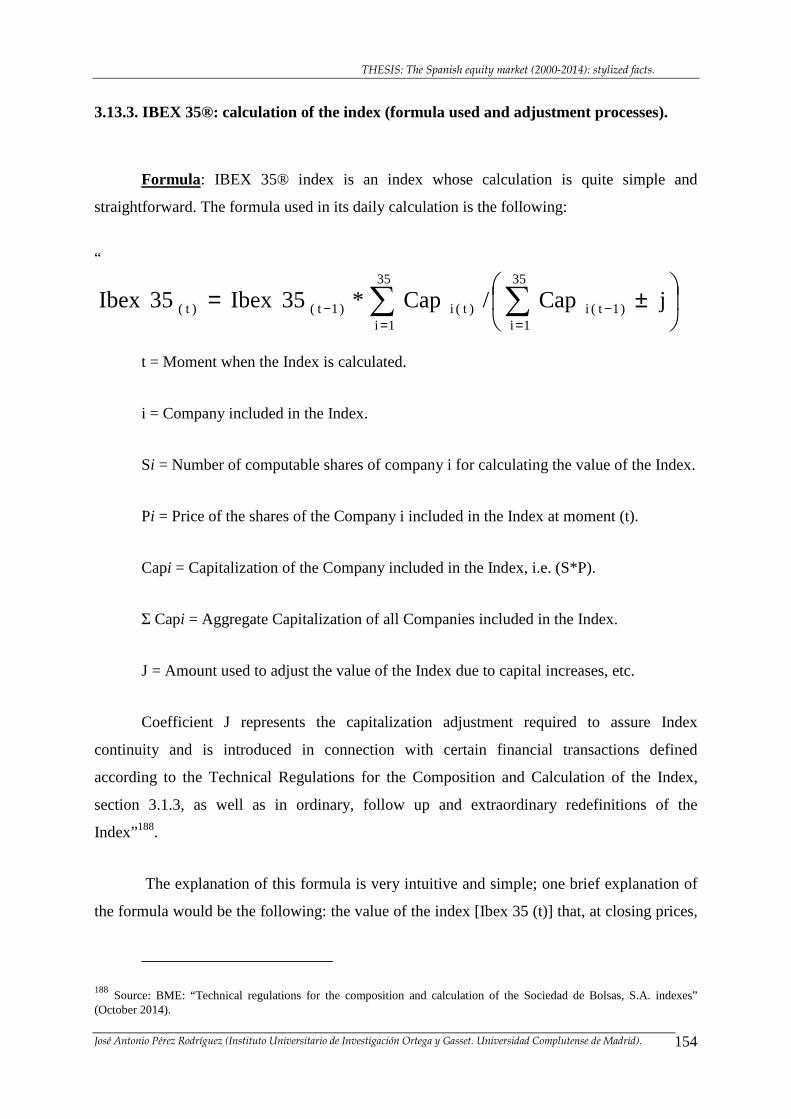
THESIS: The Spanish equity market (2000-2014): stylized facts.
José Antonio Pérez Rodríguez (Instituto Universitario de Investigación Ortega y Gasset. Universidad Complutense de Madrid). 154
3.13.3. IBEX 35®: calculation of the index (formula used and adjustment processes).
Formula: IBEX 35® index is an index whose calculation is quite simple and
straightforward. The formula used in its daily calculation is the following:
“
∑ ∑= =
−−
±=35
1i
35
1i)1t(i)t(i)1t()t( jCap/Cap*35Ibex35Ibex
t = Moment when the Index is calculated.
i = Company included in the Index.
Si = Number of computable shares of company i for calculating the value of the Index.
Pi = Price of the shares of the Company i included in the Index at moment (t).
Capi = Capitalization of the Company included in the Index, i.e. (S*P).
Σ Capi = Aggregate Capitalization of all Companies included in the Index.
J = Amount used to adjust the value of the Index due to capital increases, etc.
Coefficient J represents the capitalization adjustment required to assure Index
continuity and is introduced in connection with certain financial transactions defined
according to the Technical Regulations for the Composition and Calculation of the Index,
section 3.1.3, as well as in ordinary, follow up and extraordinary redefinitions of the
Index”188.
The explanation of this formula is very intuitive and simple; one brief explanation of
the formula would be the following: the value of the index [Ibex 35 (t)] that, at closing prices,
188 Source: BME: “Technical regulations for the composition and calculation of the Sociedad de Bolsas, S.A. indexes” (October 2014).
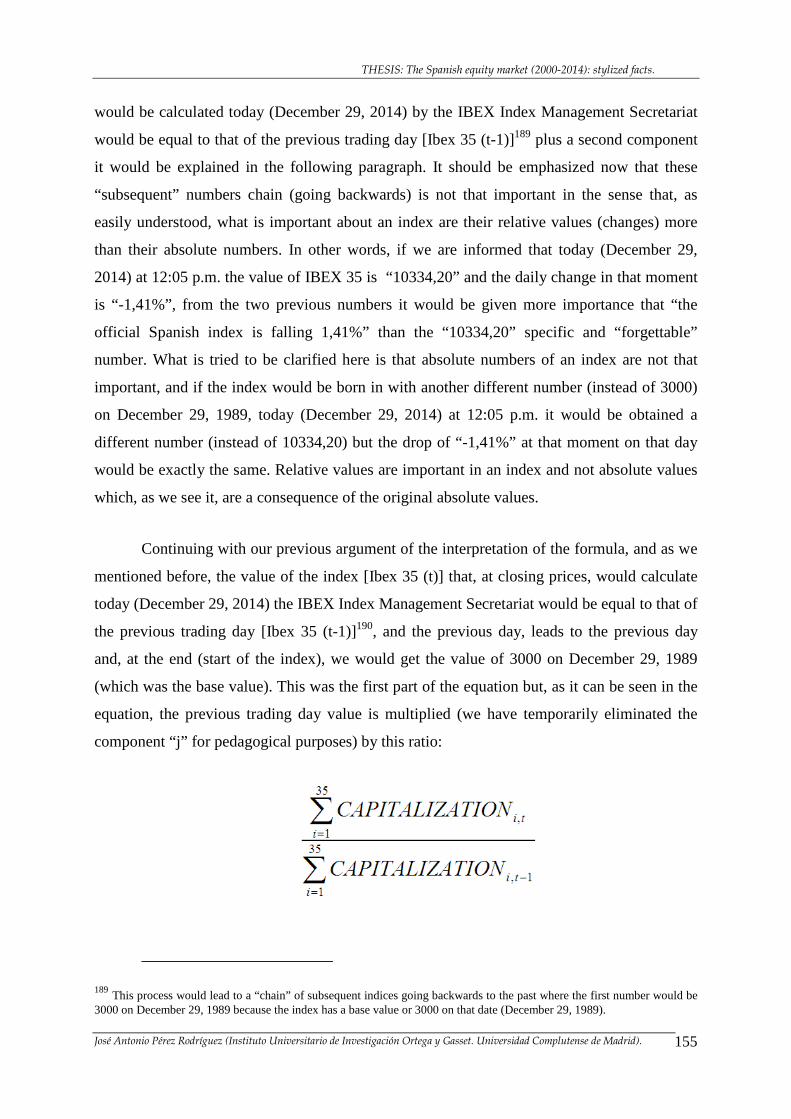
THESIS: The Spanish equity market (2000-2014): stylized facts.
José Antonio Pérez Rodríguez (Instituto Universitario de Investigación Ortega y Gasset. Universidad Complutense de Madrid). 155
would be calculated today (December 29, 2014) by the IBEX Index Management Secretariat
would be equal to that of the previous trading day [Ibex 35 (t-1)]189 plus a second component
it would be explained in the following paragraph. It should be emphasized now that these
“subsequent” numbers chain (going backwards) is not that important in the sense that, as
easily understood, what is important about an index are their relative values (changes) more
than their absolute numbers. In other words, if we are informed that today (December 29,
2014) at 12:05 p.m. the value of IBEX 35 is “10334,20” and the daily change in that moment
is “-1,41%”, from the two previous numbers it would be given more importance that “the
official Spanish index is falling 1,41%” than the “10334,20” specific and “forgettable”
number. What is tried to be clarified here is that absolute numbers of an index are not that
important, and if the index would be born in with another different number (instead of 3000)
on December 29, 1989, today (December 29, 2014) at 12:05 p.m. it would be obtained a
different number (instead of 10334,20) but the drop of “-1,41%” at that moment on that day
would be exactly the same. Relative values are important in an index and not absolute values
which, as we see it, are a consequence of the original absolute values.
Continuing with our previous argument of the interpretation of the formula, and as we
mentioned before, the value of the index [Ibex 35 (t)] that, at closing prices, would calculate
today (December 29, 2014) the IBEX Index Management Secretariat would be equal to that of
the previous trading day [Ibex 35 (t-1)]190, and the previous day, leads to the previous day
and, at the end (start of the index), we would get the value of 3000 on December 29, 1989
(which was the base value). This was the first part of the equation but, as it can be seen in the
equation, the previous trading day value is multiplied (we have temporarily eliminated the
component “j” for pedagogical purposes) by this ratio:
189 This process would lead to a “chain” of subsequent indices going backwards to the past where the first number would be 3000 on December 29, 1989 because the index has a base value or 3000 on that date (December 29, 1989).
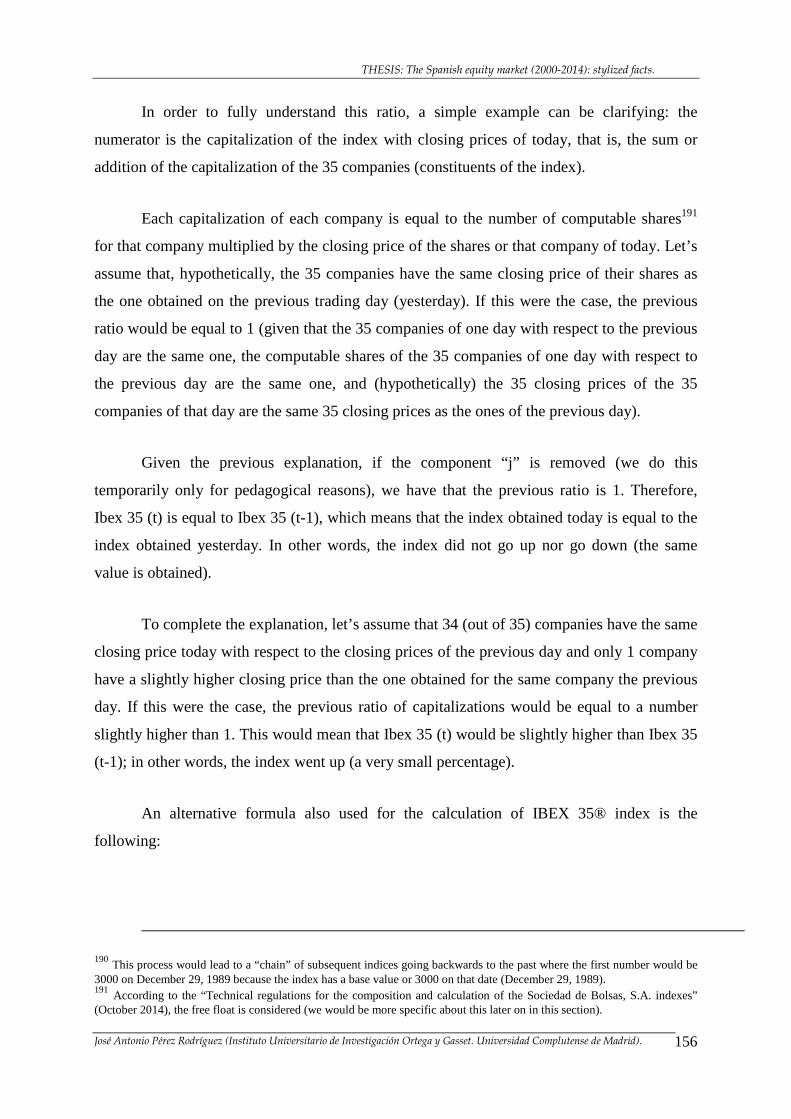
THESIS: The Spanish equity market (2000-2014): stylized facts.
José Antonio Pérez Rodríguez (Instituto Universitario de Investigación Ortega y Gasset. Universidad Complutense de Madrid). 156
In order to fully understand this ratio, a simple example can be clarifying: the
numerator is the capitalization of the index with closing prices of today, that is, the sum or
addition of the capitalization of the 35 companies (constituents of the index).
Each capitalization of each company is equal to the number of computable shares191
for that company multiplied by the closing price of the shares or that company of today. Let’s
assume that, hypothetically, the 35 companies have the same closing price of their shares as
the one obtained on the previous trading day (yesterday). If this were the case, the previous
ratio would be equal to 1 (given that the 35 companies of one day with respect to the previous
day are the same one, the computable shares of the 35 companies of one day with respect to
the previous day are the same one, and (hypothetically) the 35 closing prices of the 35
companies of that day are the same 35 closing prices as the ones of the previous day).
Given the previous explanation, if the component “j” is removed (we do this
temporarily only for pedagogical reasons), we have that the previous ratio is 1. Therefore,
Ibex 35 (t) is equal to Ibex 35 (t-1), which means that the index obtained today is equal to the
index obtained yesterday. In other words, the index did not go up nor go down (the same
value is obtained).
To complete the explanation, let’s assume that 34 (out of 35) companies have the same
closing price today with respect to the closing prices of the previous day and only 1 company
have a slightly higher closing price than the one obtained for the same company the previous
day. If this were the case, the previous ratio of capitalizations would be equal to a number
slightly higher than 1. This would mean that Ibex 35 (t) would be slightly higher than Ibex 35
(t-1); in other words, the index went up (a very small percentage).
An alternative formula also used for the calculation of IBEX 35® index is the
following:
190 This process would lead to a “chain” of subsequent indices going backwards to the past where the first number would be 3000 on December 29, 1989 because the index has a base value or 3000 on that date (December 29, 1989). 191 According to the “Technical regulations for the composition and calculation of the Sociedad de Bolsas, S.A. indexes” (October 2014), the free float is considered (we would be more specific about this later on in this section).
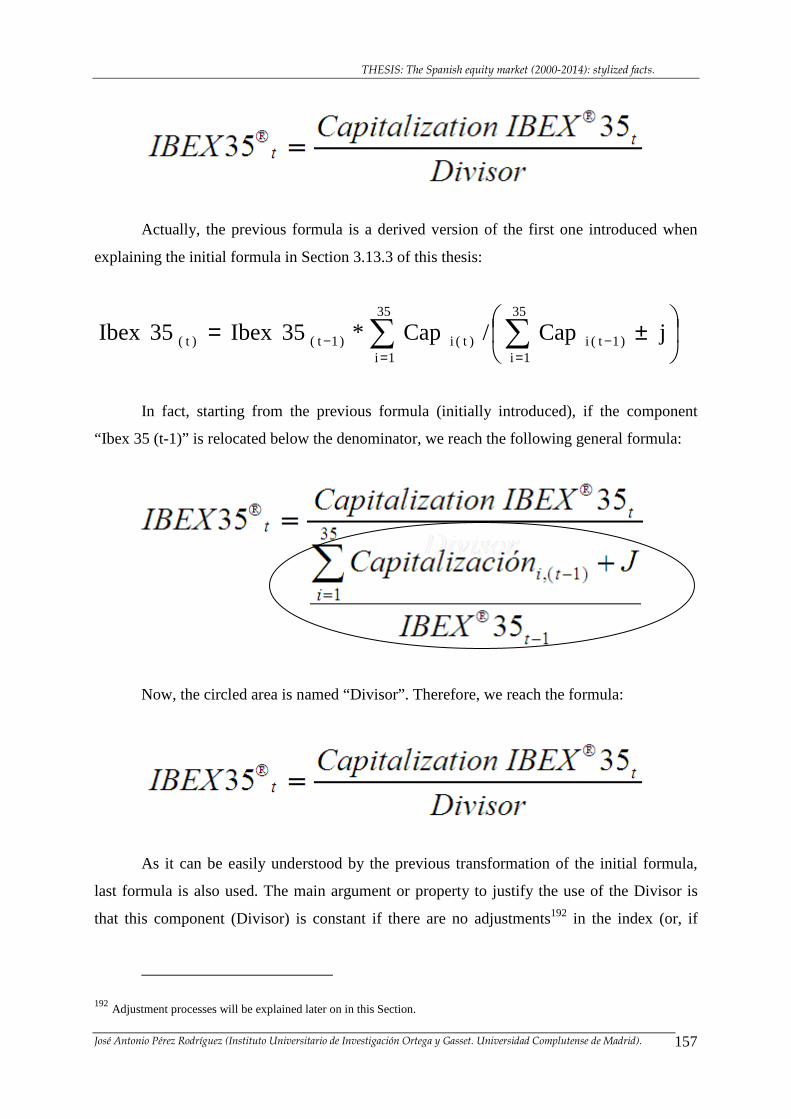
THESIS: The Spanish equity market (2000-2014): stylized facts.
José Antonio Pérez Rodríguez (Instituto Universitario de Investigación Ortega y Gasset. Universidad Complutense de Madrid). 157
Actually, the previous formula is a derived version of the first one introduced when
explaining the initial formula in Section 3.13.3 of this thesis:
∑ ∑= =
−−
±=35
1i
35
1i)1t(i)t(i)1t()t( jCap/Cap*35Ibex35Ibex
In fact, starting from the previous formula (initially introduced), if the component
“Ibex 35 (t-1)” is relocated below the denominator, we reach the following general formula:
Now, the circled area is named “Divisor”. Therefore, we reach the formula:
As it can be easily understood by the previous transformation of the initial formula,
last formula is also used. The main argument or property to justify the use of the Divisor is
that this component (Divisor) is constant if there are no adjustments192 in the index (or, if
192 Adjustment processes will be explained later on in this Section.
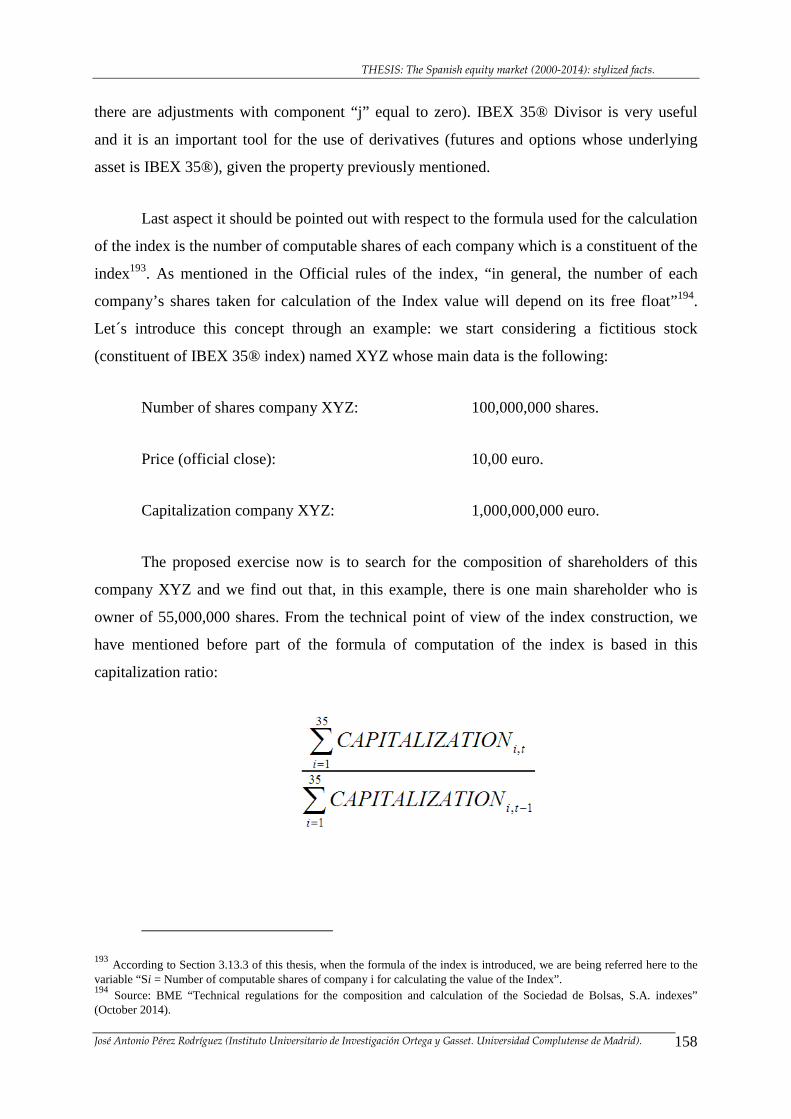
THESIS: The Spanish equity market (2000-2014): stylized facts.
José Antonio Pérez Rodríguez (Instituto Universitario de Investigación Ortega y Gasset. Universidad Complutense de Madrid). 158
there are adjustments with component “j” equal to zero). IBEX 35® Divisor is very useful
and it is an important tool for the use of derivatives (futures and options whose underlying
asset is IBEX 35®), given the property previously mentioned.
Last aspect it should be pointed out with respect to the formula used for the calculation
of the index is the number of computable shares of each company which is a constituent of the
index193. As mentioned in the Official rules of the index, “in general, the number of each
company’s shares taken for calculation of the Index value will depend on its free float”194.
Let´s introduce this concept through an example: we start considering a fictitious stock
(constituent of IBEX 35® index) named XYZ whose main data is the following:
Number of shares company XYZ: 100,000,000 shares.
Price (official close): 10,00 euro.
Capitalization company XYZ: 1,000,000,000 euro.
The proposed exercise now is to search for the composition of shareholders of this
company XYZ and we find out that, in this example, there is one main shareholder who is
owner of 55,000,000 shares. From the technical point of view of the index construction, we
have mentioned before part of the formula of computation of the index is based in this
capitalization ratio:
193 According to Section 3.13.3 of this thesis, when the formula of the index is introduced, we are being referred here to the variable “Si = Number of computable shares of company i for calculating the value of the Index”. 194 Source: BME “Technical regulations for the composition and calculation of the Sociedad de Bolsas, S.A. indexes” (October 2014).
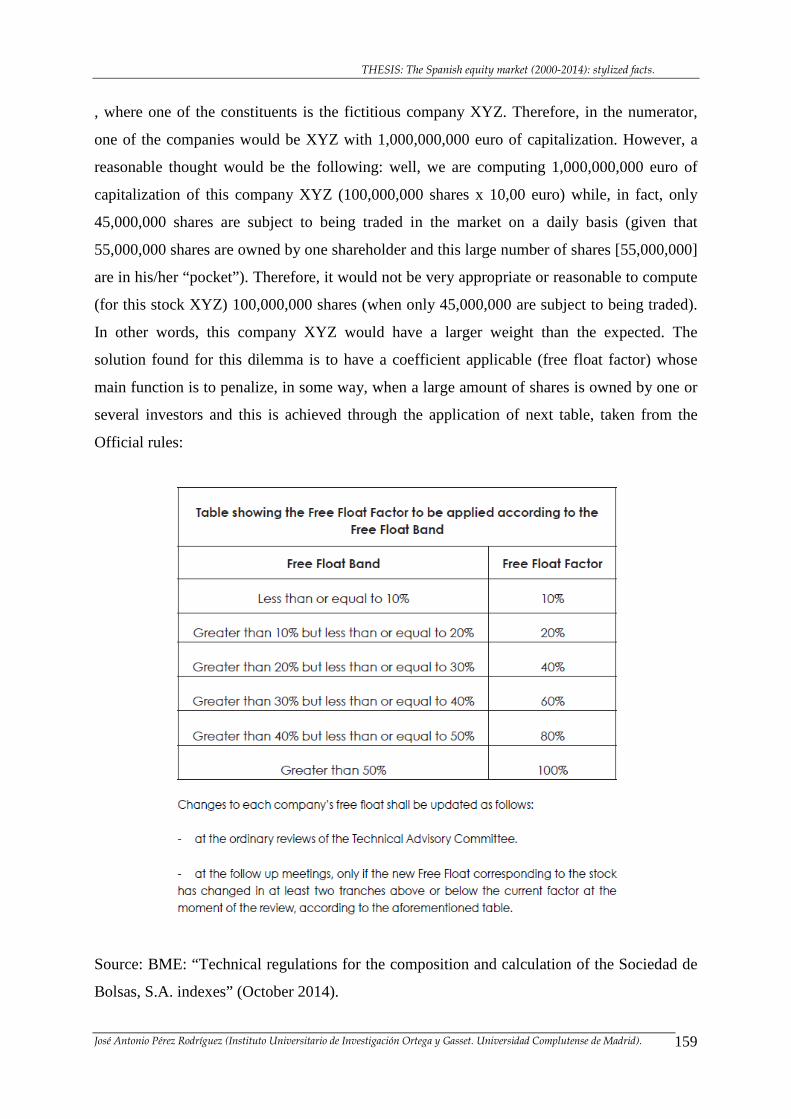
THESIS: The Spanish equity market (2000-2014): stylized facts.
José Antonio Pérez Rodríguez (Instituto Universitario de Investigación Ortega y Gasset. Universidad Complutense de Madrid). 159
, where one of the constituents is the fictitious company XYZ. Therefore, in the numerator,
one of the companies would be XYZ with 1,000,000,000 euro of capitalization. However, a
reasonable thought would be the following: well, we are computing 1,000,000,000 euro of
capitalization of this company XYZ (100,000,000 shares x 10,00 euro) while, in fact, only
45,000,000 shares are subject to being traded in the market on a daily basis (given that
55,000,000 shares are owned by one shareholder and this large number of shares [55,000,000]
are in his/her “pocket”). Therefore, it would not be very appropriate or reasonable to compute
(for this stock XYZ) 100,000,000 shares (when only 45,000,000 are subject to being traded).
In other words, this company XYZ would have a larger weight than the expected. The
solution found for this dilemma is to have a coefficient applicable (free float factor) whose
main function is to penalize, in some way, when a large amount of shares is owned by one or
several investors and this is achieved through the application of next table, taken from the
Official rules:
Source: BME: “Technical regulations for the composition and calculation of the Sociedad de
Bolsas, S.A. indexes” (October 2014).
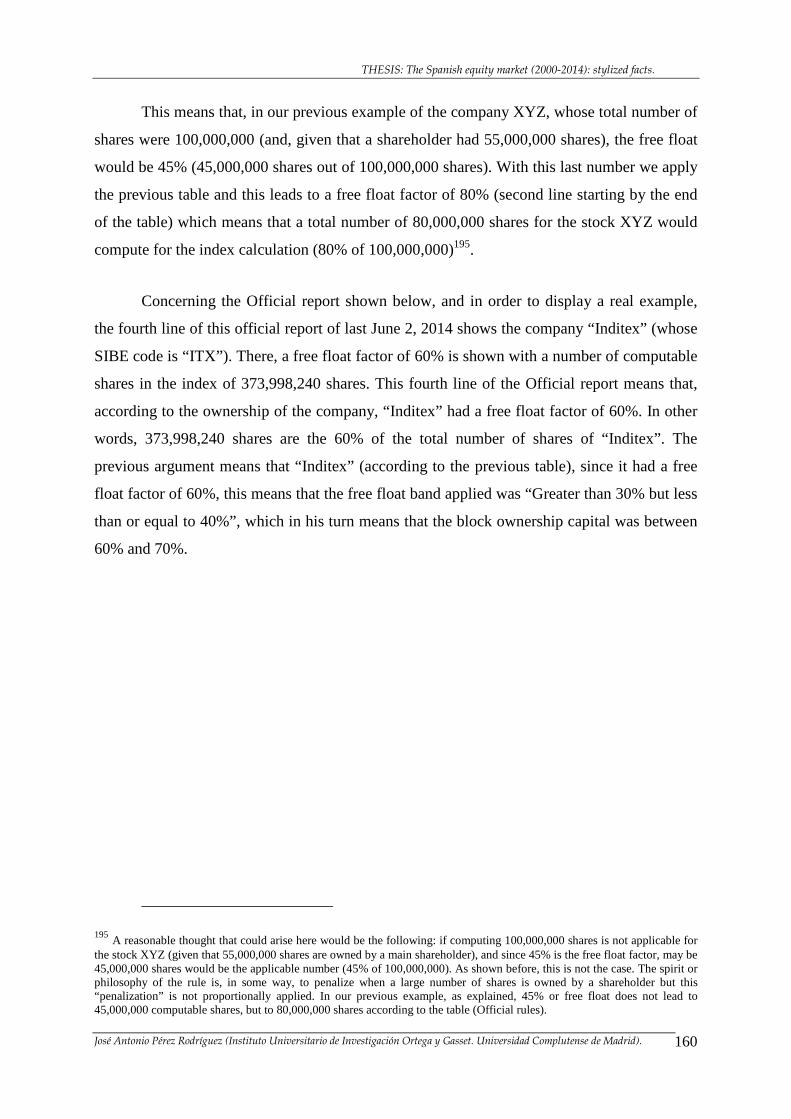
THESIS: The Spanish equity market (2000-2014): stylized facts.
José Antonio Pérez Rodríguez (Instituto Universitario de Investigación Ortega y Gasset. Universidad Complutense de Madrid). 160
This means that, in our previous example of the company XYZ, whose total number of
shares were 100,000,000 (and, given that a shareholder had 55,000,000 shares), the free float
would be 45% (45,000,000 shares out of 100,000,000 shares). With this last number we apply
the previous table and this leads to a free float factor of 80% (second line starting by the end
of the table) which means that a total number of 80,000,000 shares for the stock XYZ would
compute for the index calculation (80% of 100,000,000)195.
Concerning the Official report shown below, and in order to display a real example,
the fourth line of this official report of last June 2, 2014 shows the company “Inditex” (whose
SIBE code is “ITX”). There, a free float factor of 60% is shown with a number of computable
shares in the index of 373,998,240 shares. This fourth line of the Official report means that,
according to the ownership of the company, “Inditex” had a free float factor of 60%. In other
words, 373,998,240 shares are the 60% of the total number of shares of “Inditex”. The
previous argument means that “Inditex” (according to the previous table), since it had a free
float factor of 60%, this means that the free float band applied was “Greater than 30% but less
than or equal to 40%”, which in his turn means that the block ownership capital was between
60% and 70%.
195 A reasonable thought that could arise here would be the following: if computing 100,000,000 shares is not applicable for the stock XYZ (given that 55,000,000 shares are owned by a main shareholder), and since 45% is the free float factor, may be 45,000,000 shares would be the applicable number (45% of 100,000,000). As shown before, this is not the case. The spirit or philosophy of the rule is, in some way, to penalize when a large number of shares is owned by a shareholder but this “penalization” is not proportionally applied. In our previous example, as explained, 45% or free float does not lead to 45,000,000 computable shares, but to 80,000,000 shares according to the table (Official rules).
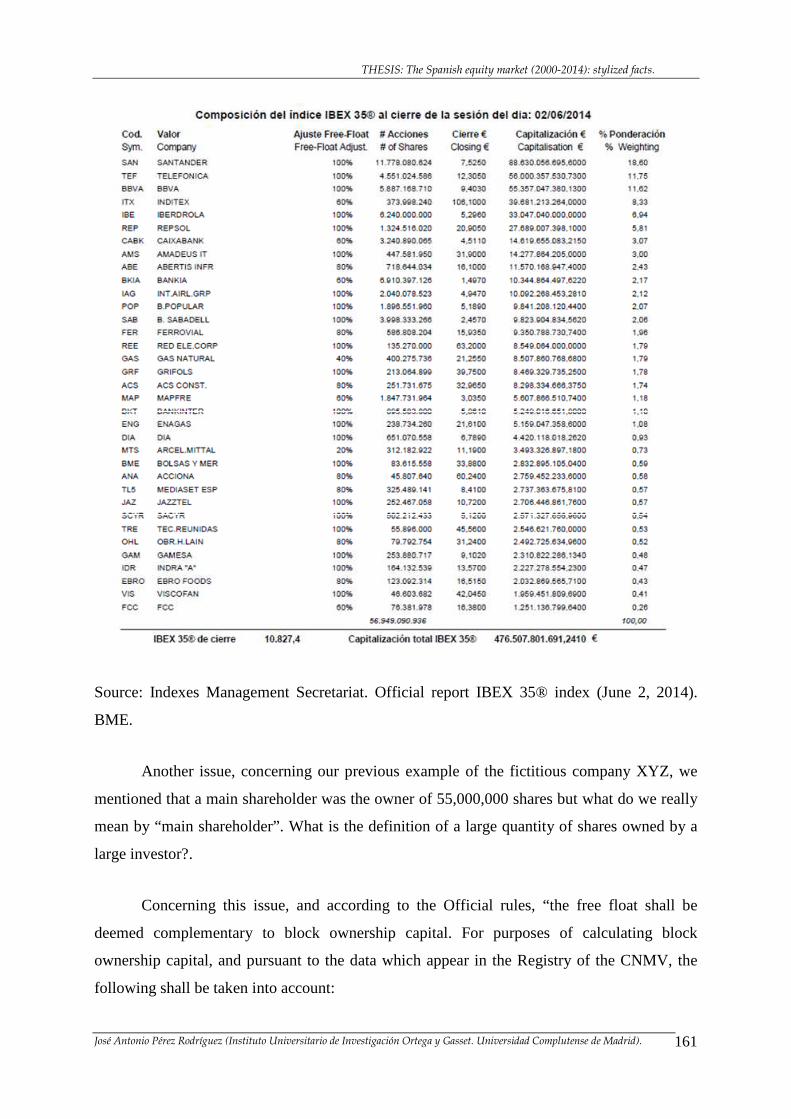
THESIS: The Spanish equity market (2000-2014): stylized facts.
José Antonio Pérez Rodríguez (Instituto Universitario de Investigación Ortega y Gasset. Universidad Complutense de Madrid). 161
Source: Indexes Management Secretariat. Official report IBEX 35® index (June 2, 2014).
BME.
Another issue, concerning our previous example of the fictitious company XYZ, we
mentioned that a main shareholder was the owner of 55,000,000 shares but what do we really
mean by “main shareholder”. What is the definition of a large quantity of shares owned by a
large investor?.
Concerning this issue, and according to the Official rules, “the free float shall be
deemed complementary to block ownership capital. For purposes of calculating block
ownership capital, and pursuant to the data which appear in the Registry of the CNMV, the
following shall be taken into account:
THESIS: The Spanish equity market (2000-2014): stylized facts.
José Antonio Pérez Rodríguez (Instituto Universitario de Investigación Ortega y Gasset. Universidad Complutense de Madrid). 162
− direct shareholdings greater than or equal to 3% of the share capital, and
− direct shareholdings held by members of the Board of Directors independently from
their amount.
The Technical Advisory Committee shall take the preceding data into account even
when the owner appearing in the Registry is a Nominee, unless the latter informs the CNMV
in the appropriate manner that these shareholdings, taken individually, amount to less than 3%
of capital”196.
Adjustment processes: in the previous example and reasoning, the component “j”
was not considered (it was temporarily removed for pedagogical purposes). Let’s now be
precise about the significance and function of this “j” component (adjustment). We now
introduce this “j” factor through an example: Let’s assume we have a company named “XYZ”
(hypothetically a constituent of IBEX 35) whose computable number of shares in the index
are 100,000,000 and the closing price of today (day t) is 10 euro.
Let’s assume that this XYZ company announced 20 days ago that, with effect from
tomorrow (day t+1) is going to pay in cash an extraordinary dividend of 2 euro. What is the
impact of this corporate action in the index?. Well, if the company XYZ pays a dividend with
effect from tomorrow (day t+1), that means that, if the closing price of today is 10 euro, the
reference price of tomorrow will be 8 euro (10-2).
A clarifying note, through a simpler example, would be the following: if the closing
price of today is 10 euro and there is no dividend to be paid with effect from tomorrow,
tomorrow (next trading session) the reference price would be 10 euro (this means that
tomorrow, along the day, the price of the shares would go up or down a certain quantity with
respect to 10 (reference price: in this example, is the previous close). However, if an
extraordinary dividend of 2 euro is going to be paid with effect from tomorrow. Today (if the
price of the share closed at 10 euro), after the close of the market, 2 euro would be removed
from the closing price of today and would reach the shareholders (meaning that, if one
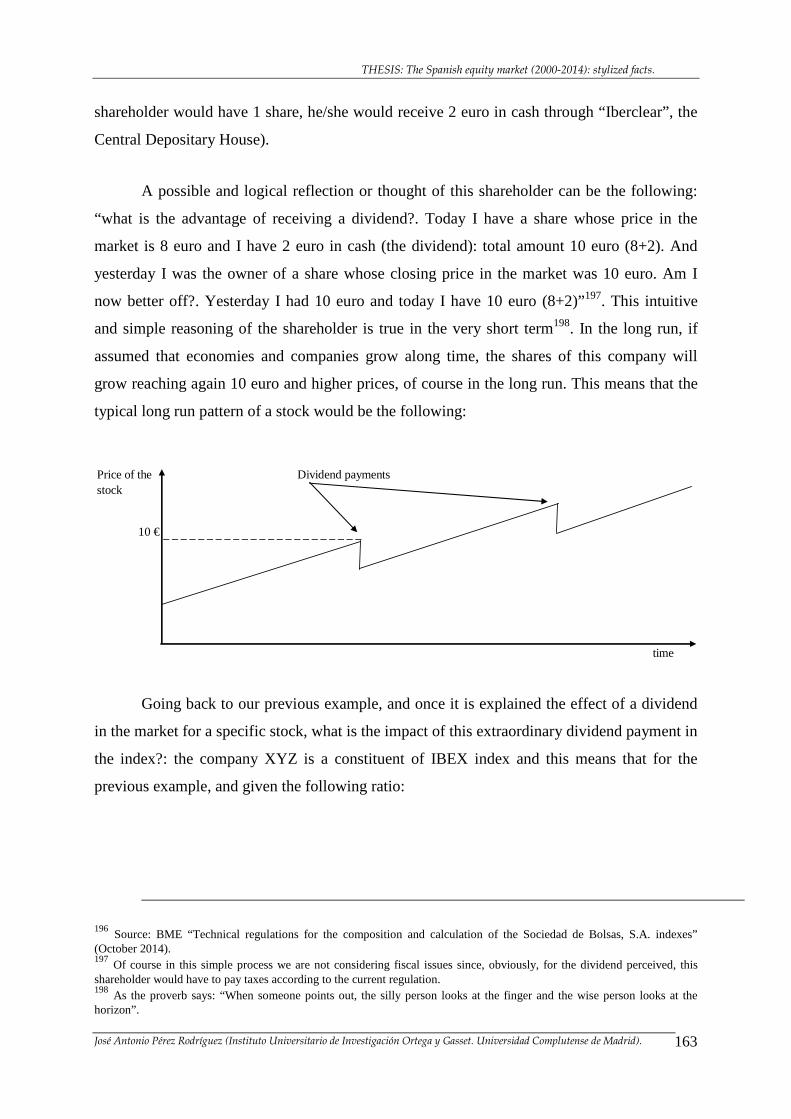
THESIS: The Spanish equity market (2000-2014): stylized facts.
José Antonio Pérez Rodríguez (Instituto Universitario de Investigación Ortega y Gasset. Universidad Complutense de Madrid). 163
shareholder would have 1 share, he/she would receive 2 euro in cash through “Iberclear”, the
Central Depositary House).
A possible and logical reflection or thought of this shareholder can be the following:
“what is the advantage of receiving a dividend?. Today I have a share whose price in the
market is 8 euro and I have 2 euro in cash (the dividend): total amount 10 euro (8+2). And
yesterday I was the owner of a share whose closing price in the market was 10 euro. Am I
now better off?. Yesterday I had 10 euro and today I have 10 euro (8+2)”197. This intuitive
and simple reasoning of the shareholder is true in the very short term198. In the long run, if
assumed that economies and companies grow along time, the shares of this company will
grow reaching again 10 euro and higher prices, of course in the long run. This means that the
typical long run pattern of a stock would be the following:
Price of the Dividend paymentsstock
10 €
time
Going back to our previous example, and once it is explained the effect of a dividend
in the market for a specific stock, what is the impact of this extraordinary dividend payment in
the index?: the company XYZ is a constituent of IBEX index and this means that for the
previous example, and given the following ratio:
196 Source: BME “Technical regulations for the composition and calculation of the Sociedad de Bolsas, S.A. indexes” (October 2014). 197 Of course in this simple process we are not considering fiscal issues since, obviously, for the dividend perceived, this shareholder would have to pay taxes according to the current regulation. 198 As the proverb says: “When someone points out, the silly person looks at the finger and the wise person looks at the horizon”.
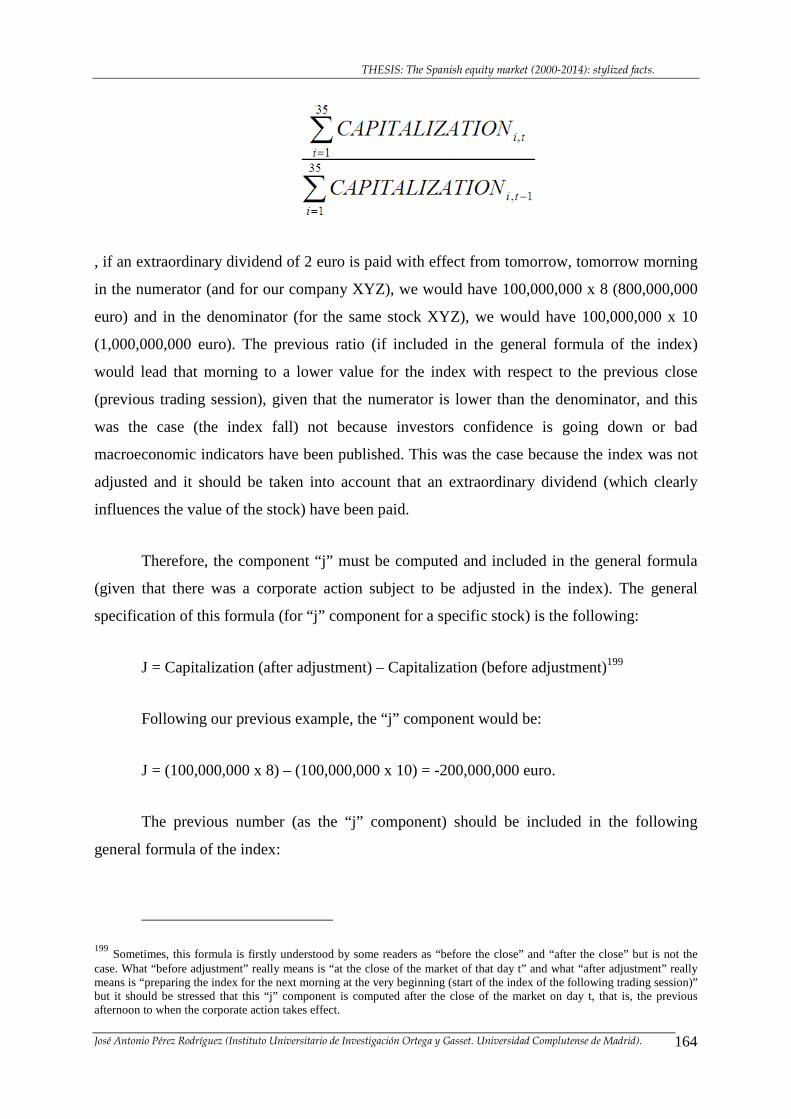
THESIS: The Spanish equity market (2000-2014): stylized facts.
José Antonio Pérez Rodríguez (Instituto Universitario de Investigación Ortega y Gasset. Universidad Complutense de Madrid). 164
, if an extraordinary dividend of 2 euro is paid with effect from tomorrow, tomorrow morning
in the numerator (and for our company XYZ), we would have 100,000,000 x 8 (800,000,000
euro) and in the denominator (for the same stock XYZ), we would have 100,000,000 x 10
(1,000,000,000 euro). The previous ratio (if included in the general formula of the index)
would lead that morning to a lower value for the index with respect to the previous close
(previous trading session), given that the numerator is lower than the denominator, and this
was the case (the index fall) not because investors confidence is going down or bad
macroeconomic indicators have been published. This was the case because the index was not
adjusted and it should be taken into account that an extraordinary dividend (which clearly
influences the value of the stock) have been paid.
Therefore, the component “j” must be computed and included in the general formula
(given that there was a corporate action subject to be adjusted in the index). The general
specification of this formula (for “j” component for a specific stock) is the following:
J = Capitalization (after adjustment) – Capitalization (before adjustment)199
Following our previous example, the “j” component would be:
J = (100,000,000 x 8) – (100,000,000 x 10) = -200,000,000 euro.
The previous number (as the “j” component) should be included in the following
general formula of the index:
199 Sometimes, this formula is firstly understood by some readers as “before the close” and “after the close” but is not the case. What “before adjustment” really means is “at the close of the market of that day t” and what “after adjustment” really means is “preparing the index for the next morning at the very beginning (start of the index of the following trading session)” but it should be stressed that this “j” component is computed after the close of the market on day t, that is, the previous afternoon to when the corporate action takes effect.
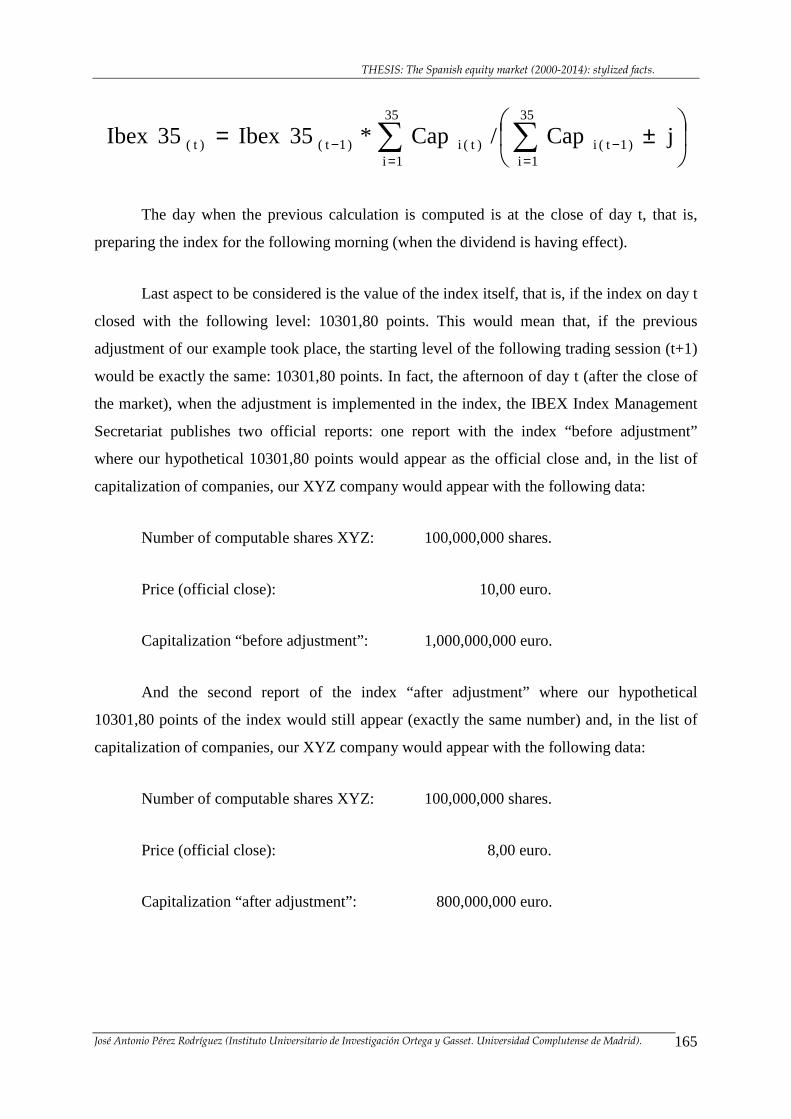
THESIS: The Spanish equity market (2000-2014): stylized facts.
José Antonio Pérez Rodríguez (Instituto Universitario de Investigación Ortega y Gasset. Universidad Complutense de Madrid). 165
∑ ∑= =
−−
±=35
1i
35
1i)1t(i)t(i)1t()t( jCap/Cap*35Ibex35Ibex
The day when the previous calculation is computed is at the close of day t, that is,
preparing the index for the following morning (when the dividend is having effect).
Last aspect to be considered is the value of the index itself, that is, if the index on day t
closed with the following level: 10301,80 points. This would mean that, if the previous
adjustment of our example took place, the starting level of the following trading session (t+1)
would be exactly the same: 10301,80 points. In fact, the afternoon of day t (after the close of
the market), when the adjustment is implemented in the index, the IBEX Index Management
Secretariat publishes two official reports: one report with the index “before adjustment”
where our hypothetical 10301,80 points would appear as the official close and, in the list of
capitalization of companies, our XYZ company would appear with the following data:
Number of computable shares XYZ: 100,000,000 shares.
Price (official close): 10,00 euro.
Capitalization “before adjustment”: 1,000,000,000 euro.
And the second report of the index “after adjustment” where our hypothetical
10301,80 points of the index would still appear (exactly the same number) and, in the list of
capitalization of companies, our XYZ company would appear with the following data:
Number of computable shares XYZ: 100,000,000 shares.
Price (official close): 8,00 euro.
Capitalization “after adjustment”: 800,000,000 euro.
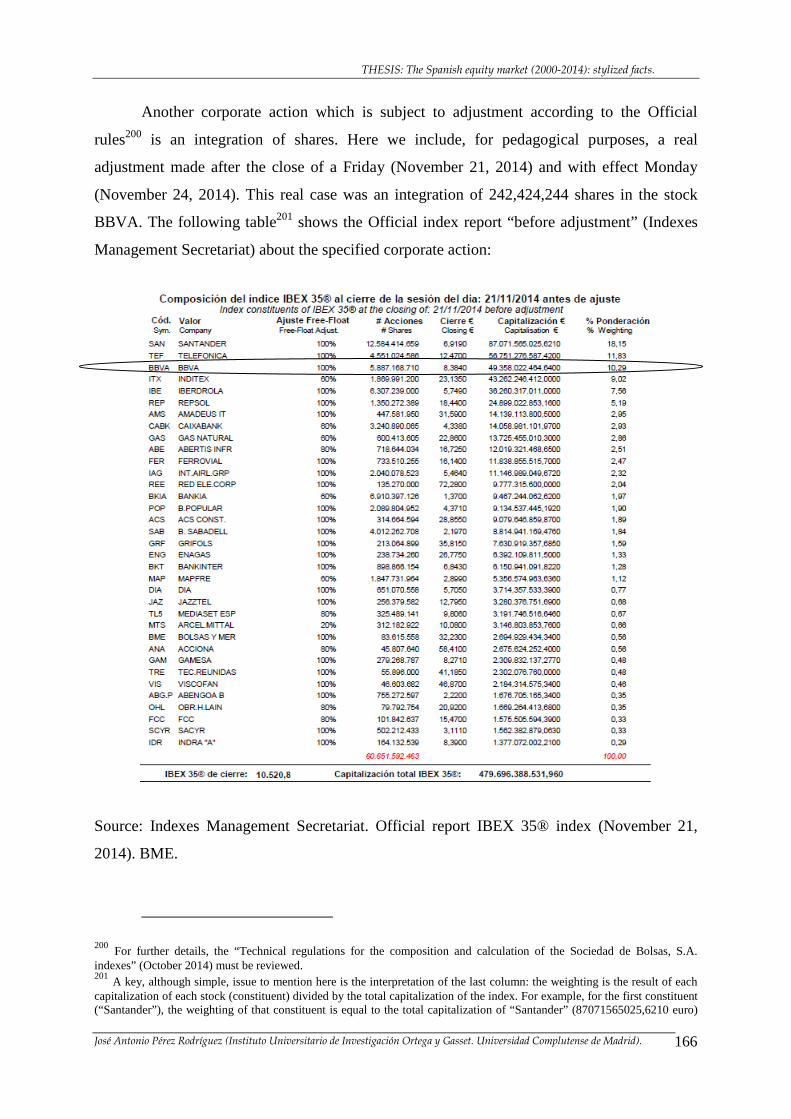
THESIS: The Spanish equity market (2000-2014): stylized facts.
José Antonio Pérez Rodríguez (Instituto Universitario de Investigación Ortega y Gasset. Universidad Complutense de Madrid). 166
Another corporate action which is subject to adjustment according to the Official
rules200 is an integration of shares. Here we include, for pedagogical purposes, a real
adjustment made after the close of a Friday (November 21, 2014) and with effect Monday
(November 24, 2014). This real case was an integration of 242,424,244 shares in the stock
BBVA. The following table201 shows the Official index report “before adjustment” (Indexes
Management Secretariat) about the specified corporate action:
Source: Indexes Management Secretariat. Official report IBEX 35® index (November 21,
2014). BME.
200 For further details, the “Technical regulations for the composition and calculation of the Sociedad de Bolsas, S.A. indexes” (October 2014) must be reviewed. 201 A key, although simple, issue to mention here is the interpretation of the last column: the weighting is the result of each capitalization of each stock (constituent) divided by the total capitalization of the index. For example, for the first constituent (“Santander”), the weighting of that constituent is equal to the total capitalization of “Santander” (87071565025,6210 euro)
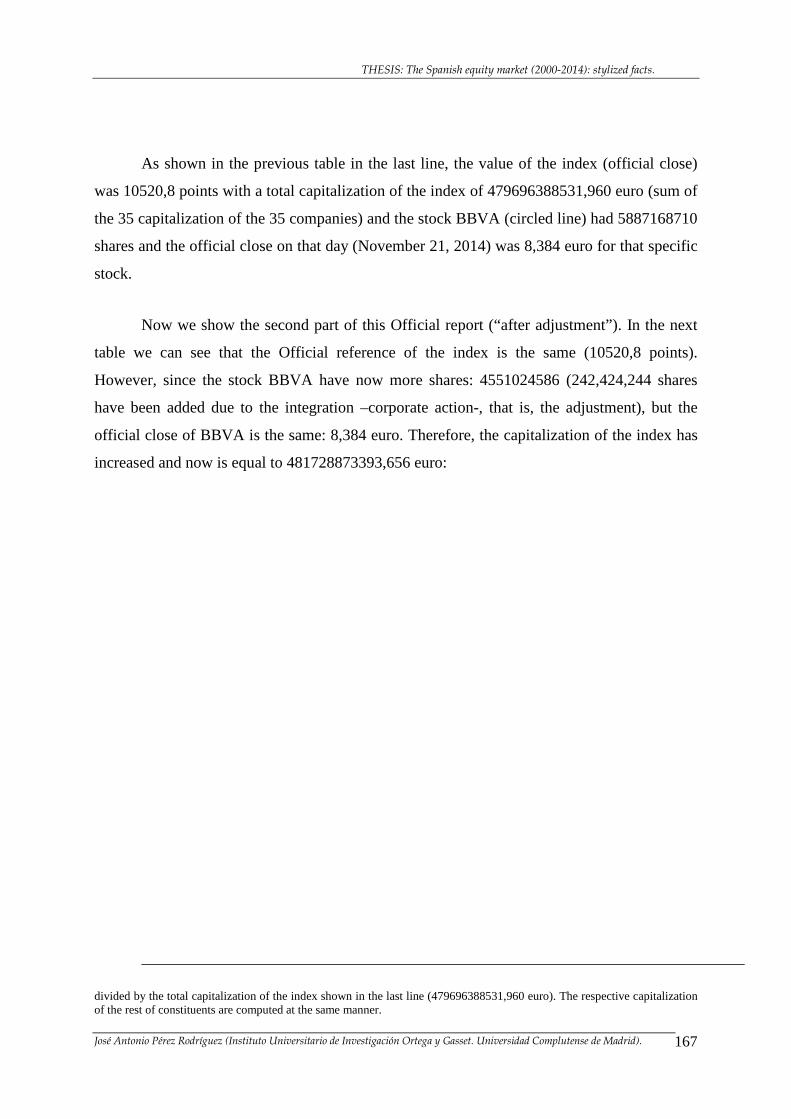
THESIS: The Spanish equity market (2000-2014): stylized facts.
José Antonio Pérez Rodríguez (Instituto Universitario de Investigación Ortega y Gasset. Universidad Complutense de Madrid). 167
As shown in the previous table in the last line, the value of the index (official close)
was 10520,8 points with a total capitalization of the index of 479696388531,960 euro (sum of
the 35 capitalization of the 35 companies) and the stock BBVA (circled line) had 5887168710
shares and the official close on that day (November 21, 2014) was 8,384 euro for that specific
stock.
Now we show the second part of this Official report (“after adjustment”). In the next
table we can see that the Official reference of the index is the same (10520,8 points).
However, since the stock BBVA have now more shares: 4551024586 (242,424,244 shares
have been added due to the integration –corporate action-, that is, the adjustment), but the
official close of BBVA is the same: 8,384 euro. Therefore, the capitalization of the index has
increased and now is equal to 481728873393,656 euro:
divided by the total capitalization of the index shown in the last line (479696388531,960 euro). The respective capitalization of the rest of constituents are computed at the same manner.
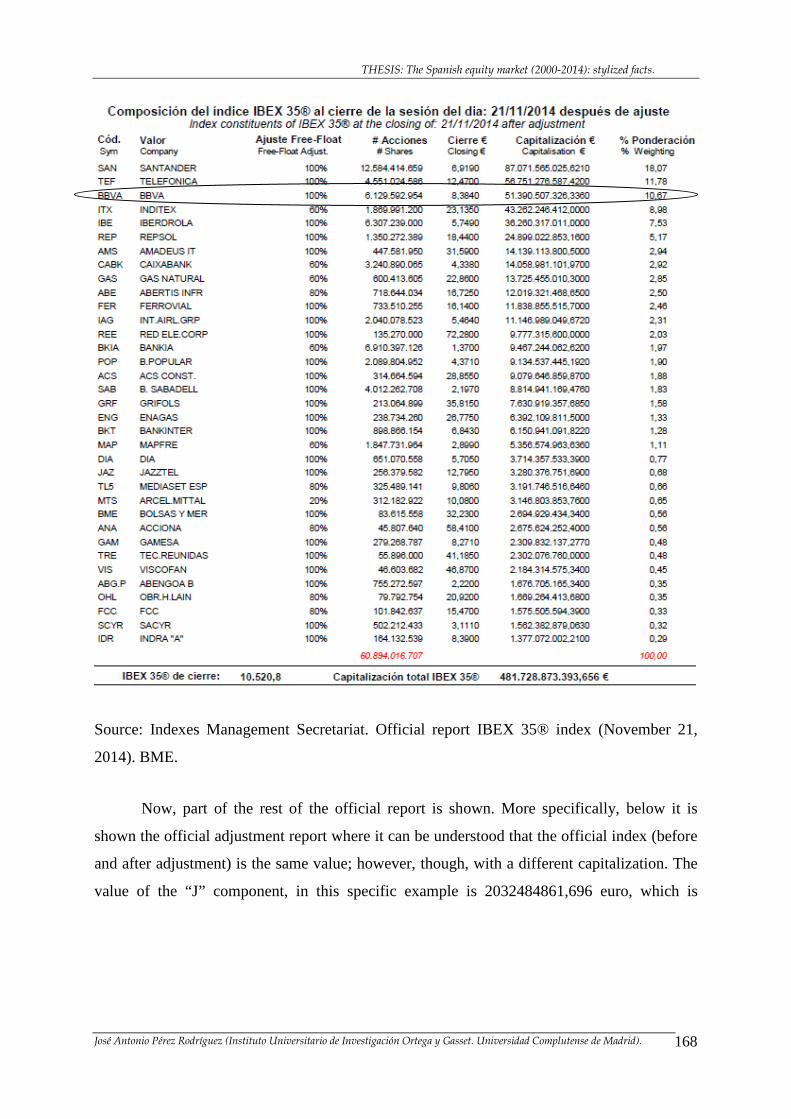
THESIS: The Spanish equity market (2000-2014): stylized facts.
José Antonio Pérez Rodríguez (Instituto Universitario de Investigación Ortega y Gasset. Universidad Complutense de Madrid). 168
Source: Indexes Management Secretariat. Official report IBEX 35® index (November 21,
2014). BME.
Now, part of the rest of the official report is shown. More specifically, below it is
shown the official adjustment report where it can be understood that the official index (before
and after adjustment) is the same value; however, though, with a different capitalization. The
value of the “J” component, in this specific example is 2032484861,696 euro, which is
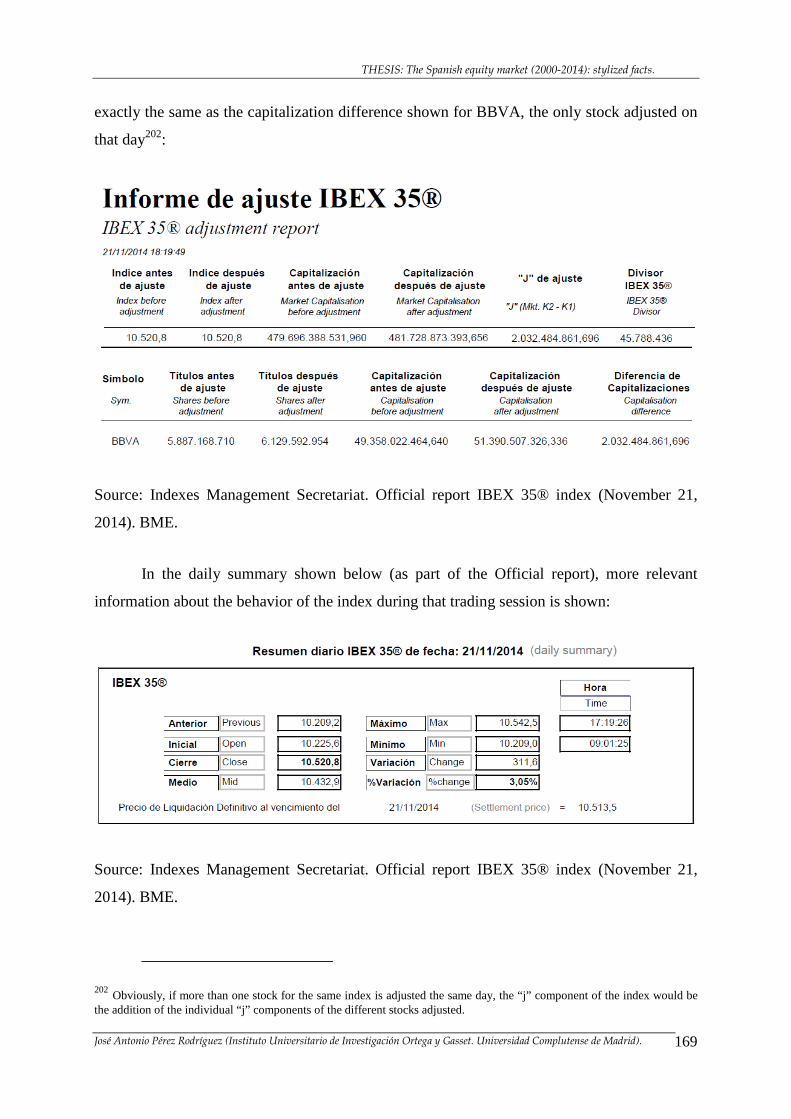
THESIS: The Spanish equity market (2000-2014): stylized facts.
José Antonio Pérez Rodríguez (Instituto Universitario de Investigación Ortega y Gasset. Universidad Complutense de Madrid). 169
exactly the same as the capitalization difference shown for BBVA, the only stock adjusted on
that day202:
Source: Indexes Management Secretariat. Official report IBEX 35® index (November 21,
2014). BME.
In the daily summary shown below (as part of the Official report), more relevant
information about the behavior of the index during that trading session is shown:
Source: Indexes Management Secretariat. Official report IBEX 35® index (November 21,
2014). BME.
202 Obviously, if more than one stock for the same index is adjusted the same day, the “j” component of the index would be the addition of the individual “j” components of the different stocks adjusted.
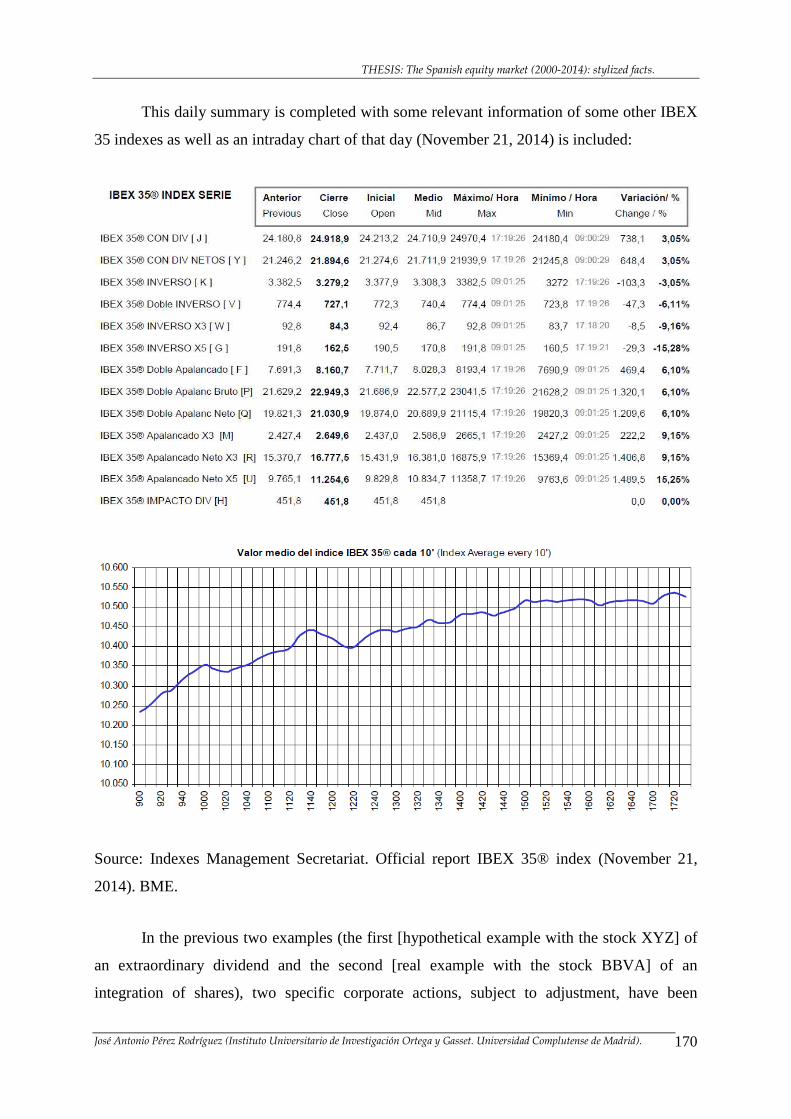
THESIS: The Spanish equity market (2000-2014): stylized facts.
José Antonio Pérez Rodríguez (Instituto Universitario de Investigación Ortega y Gasset. Universidad Complutense de Madrid). 170
This daily summary is completed with some relevant information of some other IBEX
35 indexes as well as an intraday chart of that day (November 21, 2014) is included:
Source: Indexes Management Secretariat. Official report IBEX 35® index (November 21,
2014). BME.
In the previous two examples (the first [hypothetical example with the stock XYZ] of
an extraordinary dividend and the second [real example with the stock BBVA] of an
integration of shares), two specific corporate actions, subject to adjustment, have been
THESIS: The Spanish equity market (2000-2014): stylized facts.
José Antonio Pérez Rodríguez (Instituto Universitario de Investigación Ortega y Gasset. Universidad Complutense de Madrid). 171
covered. However, according to the Official rules of the index, the following aspects can be
contemplated for an adjustment of IBEX 35® index:
- Ordinary dividends and other types of shareholder remuneration similar to
ordinary dividend payments (ordinary dividends and other types of shareholder
remuneration similar to ordinary dividend payments shall not be adjusted in the
index).
- Capital increases.
- Reductions of capital and other equity accounts.
- Issue of convertible or exchangeable financial instruments.
- Variation of the pair value.
- Mergers and absorptions.
- Segregation of equity or spin-off of companies with shareholder remuneration.
- Extraordinary dividends and other types of shareholder remuneration not similar to
ordinary dividend payments.
A full detail of the aforementioned corporate action treatments in the index according
to adjustments can be found in the Official rules203.
One key issue to cover now is to justify the existence or raison d´être of the
adjustments to the index. According to the Official rules “the aim of the adjustments to the
Index is to ensure, to the extent possible and in a simple manner, that the IBEX 35® Index
reflects the performance of a portfolio composed of the same shares as make up the Index.
The adjustments to the Index, carried out by the Manager, are:
THESIS: The Spanish equity market (2000-2014): stylized facts.
José Antonio Pérez Rodríguez (Instituto Universitario de Investigación Ortega y Gasset. Universidad Complutense de Madrid). 172
- calculated on their corresponding date depending on their nature,
- introduced once the market is closed and at the closing price of each security,
- effective as of the start of trading the next trading day,
so as to ensure that the value of the Index is not altered in any way. Should a transaction take
place with one or more securities in the Index that requires an adjustment not contemplated
within these Technical Regulations, or should the adjustment described herein not completely
fulfill the purpose of the Index, the Manager may propose to the Technical Advisory
Committee that a new adjustment be made or any other action to fulfill the purpose of the
Index”204.
At first sight, and given the previous explanation, it could be understood that (if there
are adjustments in the index), the component “j” has always a positive or negative value.
However, it can also be the case that the component “j” equals zero (under certain
circumstances of specific adjustments). An example of this specific case (where the
component “j” equals zero, although there is adjustment to the index), can be a corporate
action named split205; other case can be a capital increase as detailed in the following real
example:
A free capital increase in the company “Abertis” is having effect on May 11, 2009
(Monday). Therefore, the adjustment in the index must be done after the close of the market
on the previous trading day (Friday, May 8, 2009). The situation of the index after the close of
the market on May 8, 2009 is the following:
203 Source: BME “Technical regulations for the composition and calculation of the Sociedad de Bolsas, S.A. indexes” (October 2014). 204 Source: BME “Technical regulations for the composition and calculation of the Sociedad de Bolsas, S.A. indexes” (October 2014). 205 A split is a corporate action where the number of shares of a company is multiplied by a specific number (i.e.: 2) and the price of that company is divided by the same number. From the point of view of market capitalization, this corporate action has a neutral effect. The common justification for such a corporate action is due to psychological reasons since a lower price tends to be more attractive than a higher price.
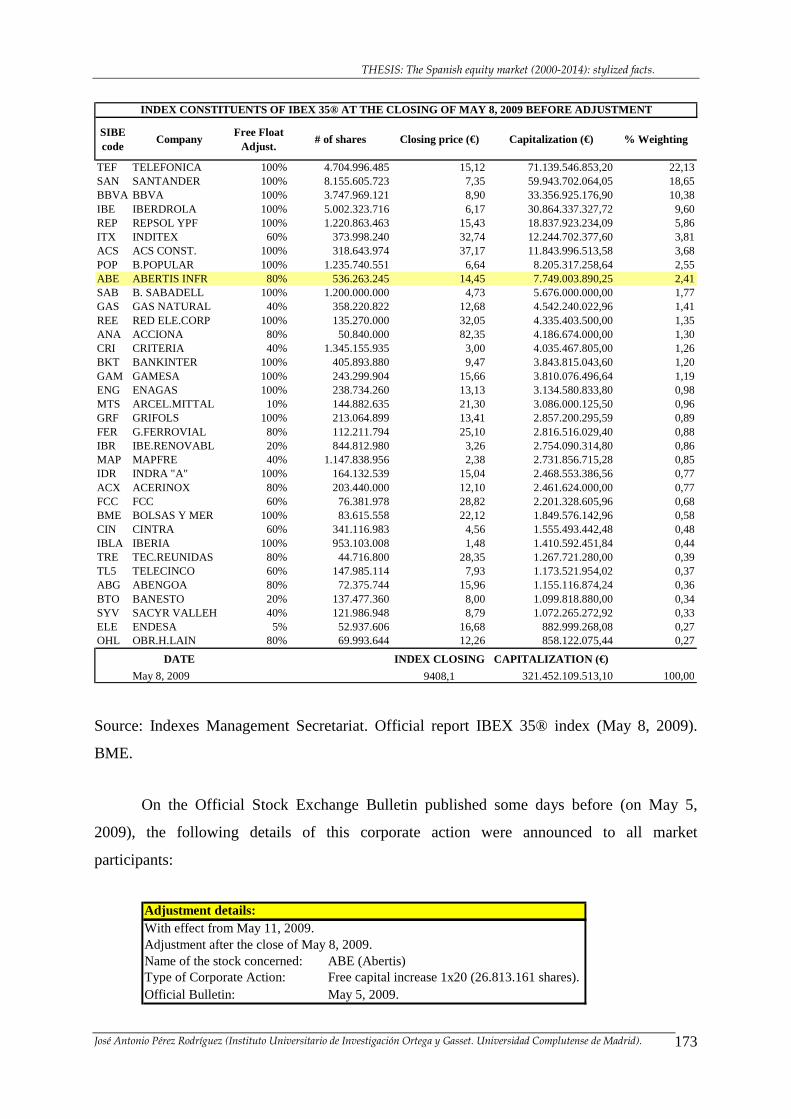
THESIS: The Spanish equity market (2000-2014): stylized facts.
José Antonio Pérez Rodríguez (Instituto Universitario de Investigación Ortega y Gasset. Universidad Complutense de Madrid). 173
SIBE code
CompanyFree Float
Adjust.# of shares Closing price (€) Capitalization (€) % Weighting
TEF TELEFONICA 100% 4.704.996.485 15,12 71.139.546.853,20 22,13SAN SANTANDER 100% 8.155.605.723 7,35 59.943.702.064,05 18,65BBVA BBVA 100% 3.747.969.121 8,90 33.356.925.176,90 10,38IBE IBERDROLA 100% 5.002.323.716 6,17 30.864.337.327,72 9,60REP REPSOL YPF 100% 1.220.863.463 15,43 18.837.923.234,09 5,86ITX INDITEX 60% 373.998.240 32,74 12.244.702.377,60 3,81ACS ACS CONST. 100% 318.643.974 37,17 11.843.996.513,58 3,68POP B.POPULAR 100% 1.235.740.551 6,64 8.205.317.258,64 2,55ABE ABERTIS INFR 80% 536.263.245 14,45 7.749.003.890,25 2,41SAB B. SABADELL 100% 1.200.000.000 4,73 5.676.000.000,00 1,77GAS GAS NATURAL 40% 358.220.822 12,68 4.542.240.022,96 1,41REE RED ELE.CORP 100% 135.270.000 32,05 4.335.403.500,00 1,35ANA ACCIONA 80% 50.840.000 82,35 4.186.674.000,00 1,30CRI CRITERIA 40% 1.345.155.935 3,00 4.035.467.805,00 1,26BKT BANKINTER 100% 405.893.880 9,47 3.843.815.043,60 1,20GAM GAMESA 100% 243.299.904 15,66 3.810.076.496,64 1,19ENG ENAGAS 100% 238.734.260 13,13 3.134.580.833,80 0,98MTS ARCEL.MITTAL 10% 144.882.635 21,30 3.086.000.125,50 0,96GRF GRIFOLS 100% 213.064.899 13,41 2.857.200.295,59 0,89FER G.FERROVIAL 80% 112.211.794 25,10 2.816.516.029,40 0,88IBR IBE.RENOVABL 20% 844.812.980 3,26 2.754.090.314,80 0,86MAP MAPFRE 40% 1.147.838.956 2,38 2.731.856.715,28 0,85IDR INDRA "A" 100% 164.132.539 15,04 2.468.553.386,56 0,77ACX ACERINOX 80% 203.440.000 12,10 2.461.624.000,00 0,77FCC FCC 60% 76.381.978 28,82 2.201.328.605,96 0,68BME BOLSAS Y MER 100% 83.615.558 22,12 1.849.576.142,96 0,58CIN CINTRA 60% 341.116.983 4,56 1.555.493.442,48 0,48IBLA IBERIA 100% 953.103.008 1,48 1.410.592.451,84 0,44TRE TEC.REUNIDAS 80% 44.716.800 28,35 1.267.721.280,00 0,39TL5 TELECINCO 60% 147.985.114 7,93 1.173.521.954,02 0,37ABG ABENGOA 80% 72.375.744 15,96 1.155.116.874,24 0,36BTO BANESTO 20% 137.477.360 8,00 1.099.818.880,00 0,34SYV SACYR VALLEH 40% 121.986.948 8,79 1.072.265.272,92 0,33ELE ENDESA 5% 52.937.606 16,68 882.999.268,08 0,27OHL OBR.H.LAIN 80% 69.993.644 12,26 858.122.075,44 0,27
DATE INDEX CLOSING CAPITALIZATION (€)
May 8, 2009 9408,1 321.452.109.513,10 100,00
INDEX CONSTITUENTS OF IBEX 35® AT THE CLOSING OF MA Y 8, 2009 BEFORE ADJUSTMENT
Source: Indexes Management Secretariat. Official report IBEX 35® index (May 8, 2009).
BME.
On the Official Stock Exchange Bulletin published some days before (on May 5,
2009), the following details of this corporate action were announced to all market
participants:
Adjustment details:With effect from May 11, 2009.Adjustment after the close of May 8, 2009.Name of the stock concerned: ABE (Abertis)Type of Corporate Action: Free capital increase 1x20 (26.813.161 shares).Official Bulletin: May 5, 2009.
THESIS: The Spanish equity market (2000-2014): stylized facts.
José Antonio Pérez Rodríguez (Instituto Universitario de Investigación Ortega y Gasset. Universidad Complutense de Madrid). 174
The previous information means that a number of shares (according to the proportion
announced 1x20206) must be added to that company in the index and, according to the
common practice in the market, the value of the theoretic value of the subscription right must
be diminished207 from the official close of Abertis on that day208.
According to the previous reasoning, what is the number of new shares of Abertis to
be included in the index?: Total number of shares of Abertis is 670,329,056 shares which,
according to the aforementioned proportion of 1x20 shares announced by the company for
this capital increase, a total number of 3,516,452.80 shares should be issued (= 670,329,056 /
20). This number (3,516,452.80) should be rounded down209 to 3,516,452 shares since it can
not be issued “parts” of a share and, therefore, it should be found a whole number with no
decimal places. However, as it is shown in the previous Official report, Abertis had a Free
Float Factor of 80% which means that, each 100 shares, only 80 are taken into account in the
index. Therefore, if 3,516,452 shares is the total number of new shares to be included in the
market, 80% of 3,516,452 shares, that is, 26,813,161.60 shares shall be included in the index.
As previously reasoned, “parts” or decimal places should not be considered. Therefore, the
previous number shall be rounded down and the total number of new shares to be included in
the index is therefore 26,813,161 shares.
Once we have reached the number of shares to be included in the index concerning
this adjustment, now the calculation of the theoretic value of the subscription right (TVSR)
shall be done according to the following standard formula:
206 The proportion 1x20 means that 1 share is issued per each previously-existing 20 shares in the company. 207 However, is possible that the company (issuer) can implement a capital increase (therefore issuing shares) without subscription right which means that there is no subscription right and, therefore, the theoretic value of this subscription right does not exist. 208 The preference right of subscription is one of the economic rights that the shareholder has when owning shares. Basically, it means that, when there is a capital increase announced by the company, the “old shareholder” (that is, the economic agent that already had shares -previously to the effective date of the capital increase- of that company) has the right to subscribe with preference the new shares to be admitted in the market of the same company. Of course, this “old shareholder” can decide not to join this capital increase; if this is the case, he/she can sell his/her subscription rights in the market since they are quoting during a certain period in the market.
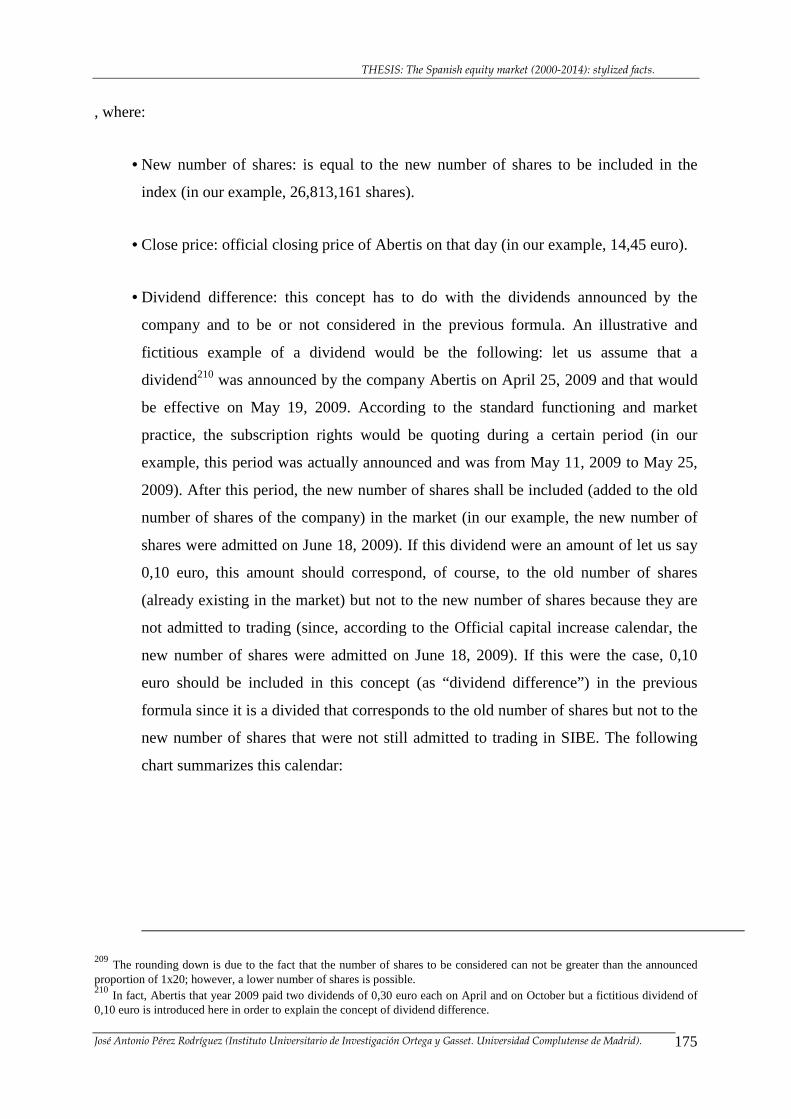
THESIS: The Spanish equity market (2000-2014): stylized facts.
José Antonio Pérez Rodríguez (Instituto Universitario de Investigación Ortega y Gasset. Universidad Complutense de Madrid). 175
, where:
• New number of shares: is equal to the new number of shares to be included in the
index (in our example, 26,813,161 shares).
• Close price: official closing price of Abertis on that day (in our example, 14,45 euro).
• Dividend difference: this concept has to do with the dividends announced by the
company and to be or not considered in the previous formula. An illustrative and
fictitious example of a dividend would be the following: let us assume that a
dividend210 was announced by the company Abertis on April 25, 2009 and that would
be effective on May 19, 2009. According to the standard functioning and market
practice, the subscription rights would be quoting during a certain period (in our
example, this period was actually announced and was from May 11, 2009 to May 25,
2009). After this period, the new number of shares shall be included (added to the old
number of shares of the company) in the market (in our example, the new number of
shares were admitted on June 18, 2009). If this dividend were an amount of let us say
0,10 euro, this amount should correspond, of course, to the old number of shares
(already existing in the market) but not to the new number of shares because they are
not admitted to trading (since, according to the Official capital increase calendar, the
new number of shares were admitted on June 18, 2009). If this were the case, 0,10
euro should be included in this concept (as “dividend difference”) in the previous
formula since it is a divided that corresponds to the old number of shares but not to the
new number of shares that were not still admitted to trading in SIBE. The following
chart summarizes this calendar:
209 The rounding down is due to the fact that the number of shares to be considered can not be greater than the announced proportion of 1x20; however, a lower number of shares is possible. 210 In fact, Abertis that year 2009 paid two dividends of 0,30 euro each on April and on October but a fictitious dividend of 0,10 euro is introduced here in order to explain the concept of dividend difference.
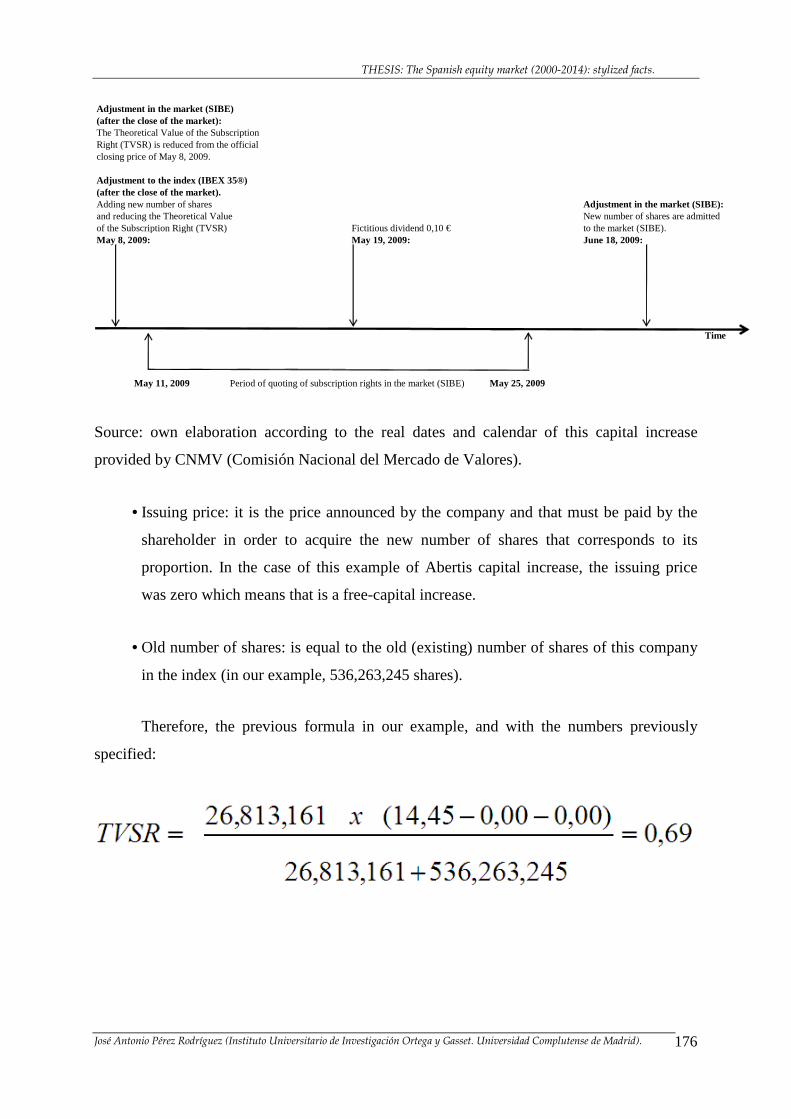
THESIS: The Spanish equity market (2000-2014): stylized facts.
José Antonio Pérez Rodríguez (Instituto Universitario de Investigación Ortega y Gasset. Universidad Complutense de Madrid). 176
Adjustment in the market (SIBE)(after the close of the market):The Theoretical Value of the SubscriptionRight (TVSR) is reduced from the official closing price of May 8, 2009.
Adjustment to the index (IBEX 35®)(after the close of the market).Adding new number of shares Adjustment in the market (SIBE):and reducing the Theoretical Value New number of shares are admittedof the Subscription Right (TVSR). Fictitious dividend 0,10 € to the market (SIBE).May 8, 2009: May 19, 2009: June 18, 2009:
Time
May 11, 2009 Period of quoting of subscription rights in the market (SIBE) May 25, 2009
Source: own elaboration according to the real dates and calendar of this capital increase
provided by CNMV (Comisión Nacional del Mercado de Valores).
• Issuing price: it is the price announced by the company and that must be paid by the
shareholder in order to acquire the new number of shares that corresponds to its
proportion. In the case of this example of Abertis capital increase, the issuing price
was zero which means that is a free-capital increase.
• Old number of shares: is equal to the old (existing) number of shares of this company
in the index (in our example, 536,263,245 shares).
Therefore, the previous formula in our example, and with the numbers previously
specified:
THESIS: The Spanish equity market (2000-2014): stylized facts.
José Antonio Pérez Rodríguez (Instituto Universitario de Investigación Ortega y Gasset. Universidad Complutense de Madrid). 177
A final result for the Theoretic Value of the Subscription Right of 0,69211 was obtained
in our example of the real Abertis capital increase of year 2009. This means that the Official
close of May 8, 2009 was reduced by 0,69 euro. Given that the Official close of that day for
Abertis was 14,45 euro, the reference price of Abertis for the next trading day (May 11, 2009)
was 13,76 euro.
To sum up, the adjustment in IBEX 35® index, concerning this capital increase of
Abertis with effect from May 11, 2009 consists of:
• Increasing the new number of computable shares of Abertis in the index: 26,813,161
shares (536,263,245+26,813,161 = 563,076,406 shares).
• Reducing the Theoretical Value of the Subscription Right (TVSR) of 0,69 from the
Official closing price of 14,45 euro (14,45-0,69 = 13,76 euro).
Therefore, the next Official Report of the index after adjustment shows the previous
adjustment once implemented:
211 In fact, the precise number obtained in the previous formula is 0,688095207544499 which is rounded to 0,69 euro given that, at that time, SIBE’s availability to quote shares was only two decimal places. This aspect could appear to be very simple and straightforward; however, it has implications given that the fact that, in the index, a Free Float Factor exists, in some capital increases and under certain circumstances, the value of the Theoretic Value of the Subscription Right (TVSR) can be slightly different if calculated according to the number of computable shares in the index or if calculated through the total number of shares admitted in the market.
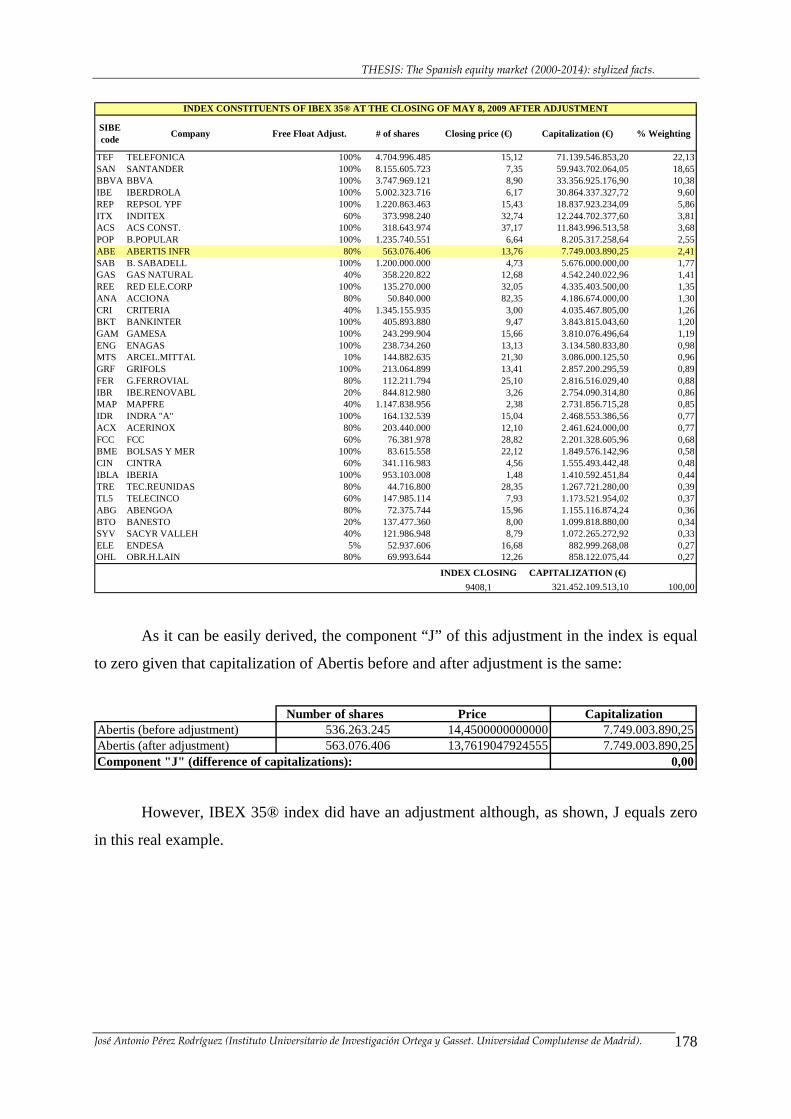
THESIS: The Spanish equity market (2000-2014): stylized facts.
José Antonio Pérez Rodríguez (Instituto Universitario de Investigación Ortega y Gasset. Universidad Complutense de Madrid). 178
SIBE code
Company Free Float Adjust. # of shares Closing price (€) Capitalization (€) % Weighting
TEF TELEFONICA 100% 4.704.996.485 15,12 71.139.546.853,20 22,13SAN SANTANDER 100% 8.155.605.723 7,35 59.943.702.064,05 18,65BBVA BBVA 100% 3.747.969.121 8,90 33.356.925.176,90 10,38IBE IBERDROLA 100% 5.002.323.716 6,17 30.864.337.327,72 9,60REP REPSOL YPF 100% 1.220.863.463 15,43 18.837.923.234,09 5,86ITX INDITEX 60% 373.998.240 32,74 12.244.702.377,60 3,81ACS ACS CONST. 100% 318.643.974 37,17 11.843.996.513,58 3,68POP B.POPULAR 100% 1.235.740.551 6,64 8.205.317.258,64 2,55ABE ABERTIS INFR 80% 563.076.406 13,76 7.749.003.890,25 2,41SAB B. SABADELL 100% 1.200.000.000 4,73 5.676.000.000,00 1,77GAS GAS NATURAL 40% 358.220.822 12,68 4.542.240.022,96 1,41REE RED ELE.CORP 100% 135.270.000 32,05 4.335.403.500,00 1,35ANA ACCIONA 80% 50.840.000 82,35 4.186.674.000,00 1,30CRI CRITERIA 40% 1.345.155.935 3,00 4.035.467.805,00 1,26BKT BANKINTER 100% 405.893.880 9,47 3.843.815.043,60 1,20GAM GAMESA 100% 243.299.904 15,66 3.810.076.496,64 1,19ENG ENAGAS 100% 238.734.260 13,13 3.134.580.833,80 0,98MTS ARCEL.MITTAL 10% 144.882.635 21,30 3.086.000.125,50 0,96GRF GRIFOLS 100% 213.064.899 13,41 2.857.200.295,59 0,89FER G.FERROVIAL 80% 112.211.794 25,10 2.816.516.029,40 0,88IBR IBE.RENOVABL 20% 844.812.980 3,26 2.754.090.314,80 0,86MAP MAPFRE 40% 1.147.838.956 2,38 2.731.856.715,28 0,85IDR INDRA "A" 100% 164.132.539 15,04 2.468.553.386,56 0,77ACX ACERINOX 80% 203.440.000 12,10 2.461.624.000,00 0,77FCC FCC 60% 76.381.978 28,82 2.201.328.605,96 0,68BME BOLSAS Y MER 100% 83.615.558 22,12 1.849.576.142,96 0,58CIN CINTRA 60% 341.116.983 4,56 1.555.493.442,48 0,48IBLA IBERIA 100% 953.103.008 1,48 1.410.592.451,84 0,44TRE TEC.REUNIDAS 80% 44.716.800 28,35 1.267.721.280,00 0,39TL5 TELECINCO 60% 147.985.114 7,93 1.173.521.954,02 0,37ABG ABENGOA 80% 72.375.744 15,96 1.155.116.874,24 0,36BTO BANESTO 20% 137.477.360 8,00 1.099.818.880,00 0,34SYV SACYR VALLEH 40% 121.986.948 8,79 1.072.265.272,92 0,33ELE ENDESA 5% 52.937.606 16,68 882.999.268,08 0,27OHL OBR.H.LAIN 80% 69.993.644 12,26 858.122.075,44 0,27
INDEX CLOSING CAPITALIZATION (€)
9408,1 321.452.109.513,10 100,00
INDEX CONSTITUENTS OF IBEX 35® AT THE CLOSING OF MA Y 8, 2009 AFTER ADJUSTMENT
As it can be easily derived, the component “J” of this adjustment in the index is equal
to zero given that capitalization of Abertis before and after adjustment is the same:
Number of shares Price CapitalizationAbertis (before adjustment) 536.263.245 14,4500000000000 7.749.003.890,25Abertis (after adjustment) 563.076.406 13,7619047924555 7.749.003.890,25Component "J" (difference of capitalizations): 0,00
However, IBEX 35® index did have an adjustment although, as shown, J equals zero
in this real example.
THESIS: The Spanish equity market (2000-2014): stylized facts.
José Antonio Pérez Rodríguez (Instituto Universitario de Investigación Ortega y Gasset. Universidad Complutense de Madrid). 179
3.14. Other Spanish stock exchange indices: IBEX MEDIUM CAP®, IBEX SMALL
CAP® and FTSE 4GOOD IBEX®.
Besides the index IBEX 35® (benchmark of the Spanish Stock Market), there are
more IBEX® indices212 with different characteristics which reflects other aspects of the
Spanish Stock Market. In next sections, IBEX MEDIUM CAP®, IBEX SMALL CAP® and
FTSE 4GOOD IBEX® are considered as some examples of the IBEX® indices family.
3.14.1. IBEX MEDIUM CAP® and IBEX SMALL CAP®: Main characteristics,
Technical Advisory Committee and liquidity criteria.
IBEX MEDIUM CAP® and IBEX SMALL CAP® indices were born on July 1, 2005
as two indices and references of the medium-sized and small-sized companies in the Spanish
Stock Exchange. One of the criticisms of the Spanish Stock Exchange (as other Stock
Exchanges in Europe) is that in the Stock Exchange there is good place for large companies
but medium-sized and small-sized companies are not that representative and therefore have
not that preeminent role.
In this context, BME launched these two indices for, in one hand, diversify the supply
of indices and, on the other hand, providing visibility to medium-sized and small-sized
companies.
212 The IBEX® family of indices is currently compounded by the following indices: IBEX 35 ®, IBEX MEDIUM CAP ®, IBEX SMALL CAP ®, IBEX TOP DIVIDENDO ®, IBEX 35 ® CAPPED, IBEX 35 ® CAPPED NET RETURN, IBEX 35 ® CON DIVIDENDOS (IBEX 35 ® TOTAL RETURN), IBEX 35 ® CON DIVIDENDOS NETOS (IBEX 35 ® NET RETURN), IBEX MEDIUM CAP ® CON DIVIDENDOS (IBEX MEDIUM ® TOTAL RETURN), IBEX MEDIUM CAP ® CON DIVIDENDOS NETOS (IBEX MEDIUM ® NET RETURN), IBEX SMALL CAP ® CON DIVIDENDOS (IBEX SMALL ® TOTAL RETURN), IBEX SMALL CAP ® CON DIVIDENDOS NETOS (IBEX SMALL ® NET RETURN), IBEX TOP DIVIDENDO ® RENTABILIDAD (IBEX TOP DIVIDENDO ® TOTAL RETURN), IBEX TOP DIVIDENDO ® RENTABILIDAD NETA (IBEX TOP DIVIDENDO ® NET RETURN), IBEX 35 ® INVERSO (IBEX 35 ® SHORT), IBEX 35 ® DOBLE INVERSO (IBEX 35 ® DOUBLE SHORT), IBEX 35 ® INVERSO X3 (IBEX 35 ® SHORT X3), IBEX 35 ® INVERSO X5 (IBEX 35 ® SHORT X5), IBEX 35 ® DOBLE APALANCADO (IBEX 35 ® DOUBLE LEVERAGE), IBEX 35 ® DOBLE APALANCADO BRUTO (IBEX 35 ® DOUBLE LEVERAGE GROSS), IBEX 35 ® DOBLE APALANCADO NETO (IBEX 35 ® DOUBLE LEVERAGE NET), IBEX 35 ® APALANCADO X3 (IBEX 35 ® LEVERAGE X3), IBEX 35 ® APALANCADO X3 NETO (IBEX 35 ® LEVERAGE NET X3), IBEX 35 ® APALANCADO X5 NETO (IBEX 35 ® LEVERAGE NET X5), IBEX 35 ® DE COMPRA (IBEX 35 ® BID), IBEX 35 ® DE VENTA (IBEX 35 ® ASK), IBEX 35 ® IMPACTO DIV (IBEX 35® DIV IMPACT), IBEX 35 ® VOLATILIDAD OBJETIVO (IBEX 35® TARGET VOLATILITY). Besides, together with the British publishing house “Financial Times
THESIS: The Spanish equity market (2000-2014): stylized facts.
José Antonio Pérez Rodríguez (Instituto Universitario de Investigación Ortega y Gasset. Universidad Complutense de Madrid). 180
Concerning the main characteristics of these two indices, both indices use the same
mathematical formula already detailed for IBEX 35® and, therefore, both are a Laspeyres
type index. However, two main differences of these two indices and IBEX 35® are, on one
hand, the number of constituents (20 for IBEX MEDIUM CAP® and 30 for IBEX SMALL
CAP®) and, on the other hand, the eligibility criteria of constituents (which is quite different
with respect to IBEX 35®).
Although liquidity is also the main driver when choosing constituents for these two
indices, the Technical Advisory Committee213 follows the following Official rules:
“The IBEX MEDIUM CAP ® Index is composed of the 20 securities listed in the
market segment of the Spanish Stock Exchange Interconnection System called Main Trading
Market which, excluding the 35 securities which are components of the IBEX 35® Index,
have the greatest free float adjusted capitalization and which meet the following requirements
for liquidity within the control period:
- Annualized rotation on free float capital greater than 15%.
- Percentage of free float capital greater than 15%” 214.
“The IBEX SMALL CAP® is composed of the 30 securities listed in the market
segment of the Spanish Stock Exchange Interconnection System called Main Trading Market
which, excluding the 35 securities which are components of the IBEX 35® Index and the 20
securities which are components of the IBEX MEDIUM CAP® Index, have the greatest free
Ltd.”, Sociedad de Bolsas is the manager of the following indices: FTSE Latibex Top, FTSE Latibex Brasil, FTSE Latibex all share, and FTSE 4GOOD IBEX® total return and FTSE 4GOOD IBEX® net return.
213 The Technical Advisory Committee of IBEX MEDIUM CAP® and IBEX SMALL CAP® is the same as for IBEX 35®,
and current members (December 2014) of this Technical Advisory Committe are the following: Mr. Blas Calzada (in his
capacity of Chairman of the Committee), Mr. Ramón Acín Ferrer, Mr. José Ramón Lasuén Sancho, Mr. Pablo Fernández,
Mr. Máximo Ferrando Bolado, Mr. Mikel Tapia Torres, Mr. Simón Sosvilla Rivero and Ms. María Parga Landa (as secretary
of the Committee but not as a member).
214 Source: BME “Technical regulations for the composition and calculation of the Sociedad de Bolsas, S.A. indexes” (October 2014).
THESIS: The Spanish equity market (2000-2014): stylized facts.
José Antonio Pérez Rodríguez (Instituto Universitario de Investigación Ortega y Gasset. Universidad Complutense de Madrid). 181
float adjusted capitalization and which fulfill the same requirements for liquidity as the IBEX
MEDIUM CAP® within the control period”215.
According to the previous rules, the practical functioning can be summarized as
follows: the Technical Advisory Committee pre-selects a universe of companies (excluding
those constituents of IBEX 35®), where rotation216 is above 15% and free float factor is also
greater than 15%. Then, a ranking of free float adjusted market capitalization is done (from
larger to smaller size) where the first twenty companies are selected to be constituents of
IBEX MEDIUM CAP® and the following thirty companies are selected to be constituents of
IBEX SMALL CAP®.
The previous scheme would lead to what it can be called a “cascade effect” among the
three indices (IBEX 35®, IBEX MEDIUM CAP® and IBEX SMALL CAP®) when
reviewing them. An example would be the following: if, in an index review, the Technical
Advisory Committee decides to exclude one stock from IBEX 35® index (although there are
differences among the rules followed to choose constituents of IBEX 35® and the other two
indices), probably the best candidate to join IBEX 35® would be one of the constituents of
IBEX MEDIUM CAP®. This would lead to the fact that IBEX MEDIUM CAP® would
therefore only have 19 constituents and the best candidate to join IBEX MEDIUM CAP®
would be one constituent of IBEX SMALL CAP®. The previous scheme would lead to the
fact that now IBEX MEDIUM CAP® has its 20 constituents (the previous 19 + the one
selected from IBEX SMALL CAP®) and IBEX SMALL CAP® has now 29 constituents. A
new constituent should be selected by the Committee from the market according to the rules
but, surely, it will not be a constituent from IBEX 35® nor IBEX SMALL CAP®, also
according to the Official rules.
215 Source: BME “Technical regulations for the composition and calculation of the Sociedad de Bolsas, S.A. indexes” (October 2014).
216 “Rotation will be understood to mean the relationship between the trading volume in Euros in the order-driven market
(market segment of the Stock Exchange Interconnection System called Main Trading Market), adjusted according to the
criteria defined in section 3.1.1. of these rules, and the free float adjusted capitalization”. Source: BME “Technical
regulations for the composition and calculation of the Sociedad de Bolsas, S.A. indexes” (October 2014).
THESIS: The Spanish equity market (2000-2014): stylized facts.
José Antonio Pérez Rodríguez (Instituto Universitario de Investigación Ortega y Gasset. Universidad Complutense de Madrid). 182
For both indices (IBEX MEDIUM CAP® and IBEX SMALL CAP®), as for IBEX
35®, “there is a maximum weighting of 20% allowed for each component in the index
reviews”217.
3.14.2. FTSE 4GOOD IBEX®: Main characteristics and eligibility criteria.
FTSE 4GOOD IBEX® is a quite different index in the Spanish Stock Exchange arena
in the sense that social aspects are considered when analyzing the possible constituents of this
“good” index.
“FTSE Group has partnered with Bolsas y Mercados Españoles (BME) to create the
FTSE4Good IBEX Index. The index comprises companies in the BME’s IBEX 35® Index
and the FTSE Spain All Cap Index that meet good standards of practice in corporate social
responsibility (CSR). These companies are working towards environmental sustainability,
developing positive relationships with stakeholders and upholding and supporting universal
human rights.
The FTSE4Good inclusion criteria represent globally accepted standards of good
practice corporate social responsibility as they evolve. They are developed using an extensive
market consultation process, and are shaped by a broad range of stakeholders including
NGOs, governmental bodies, consultants, academics, the investment community and the
corporate sector”218.
217 Source: BME “Technical regulations for the composition and calculation of the Sociedad de Bolsas, S.A. indexes” (October 2014). This new aspect of a maximum weight of 20% (announced last July 21, 2014 through an Official Notice) is due to the entry of the European regulations (ESMA/2012/832ES) that establishes the requirements for an investment fund to be considered UCITS. The guidelines to indices refer to diversification, methodology, transparency and independence. Specifically, there are certain limits in diversification for an index to be considered as a possible underlying for a UCITS fund.
218 Source: FTSE 4GOOD IBEX index Official Factsheet.
THESIS: The Spanish equity market (2000-2014): stylized facts.
José Antonio Pérez Rodríguez (Instituto Universitario de Investigación Ortega y Gasset. Universidad Complutense de Madrid). 183
This index, designed for the creation of derivatives, index tracking funds and ETFs219,
is calculated in accordance with the Industry Classification Benchmark (a global standard for
industry sector analysis).
It should be also pointed out that capital and total return indices are available for this
index and any company whose weight in the index is greater than 10% will be capped at 10%.
One key aspect to stress here, given the special nature of this index, is how the
selection of constituents is being done. In this sense (and according to the main characteristics
of the index), companies are assessed against the FTSE4Good IBEX® inclusion criteria by
the research provider “The Ethical Investment Research Service (EIRIS)" and their Spanish
research partner “Ecodes (Fundación Ecología y Desarrollo)”.
Index governance is overseen by the independent FTSE4Good Policy Committee,
made up of leading global responsible investment market practitioners and experts in the
principles and criteria used for determining the environmental and social responsibility of
corporate entities.
According to the Official rules, in order for a company to be eligible, the stock must
be included in the IBEX 35® index and/or a Spanish constituent in the FTSE Spain All-Cap
Index. All eligible companies are assessed against environmental and social criteria for
inclusion.
The following sectors are excluded, meaning that no stock belonging to any of the
following sectors, can be eligible: tobacco producers, companies manufacturing (or testing
and developing) whole weapon systems, companies manufacturing either whole, strategic
parts, or platforms for nuclear weapon systems or owners or operators of nuclear power
stations.
Among the inclusion criteria, if the company is involved in any of the following
activities, therefore is a eligible stock: environment (meaning environmental management or
219 In this sense, all FTSE4GOOD fund licensing revenues go to UNICEF to help children around the world.
THESIS: The Spanish equity market (2000-2014): stylized facts.
José Antonio Pérez Rodríguez (Instituto Universitario de Investigación Ortega y Gasset. Universidad Complutense de Madrid). 184
climate change) or social aspects (meaning human and labour rights, supply chain labour
standards or countering bribery)220.
The index is reviewed twice a year (in March and September) and is overseen by the
independent FTSE4Good Policy Committee. This Committee is made up of corporate
responsibility and responsible investment experts and practitioners from around the world
(including Spanish representation).
220 In addition to those listed before, there are FTSE4Good criteria for companies involved in the manufacture and marketing of breast milk substitutes and companies involved in uranium mining. As none of the current eligible FTSE4Good IBEX companies are active in these businesses, these criteria are not listed here. Source: www.ftse.com/ftse4good
THESIS: The Spanish equity market (2000-2014): stylized facts.
José Antonio Pérez Rodríguez (Instituto Universitario de Investigación Ortega y Gasset. Universidad Complutense de Madrid). 185
Chapter 4
ANNEX I: ANALYSIS AND EMPIRICAL EVIDENCE OF THE INT RODUCTION OF
THE CLOSING AUCTION IN THE SPANISH EQUITY MARKET

THESIS: The Spanish equity market (2000-2014): stylized facts.
José Antonio Pérez Rodríguez (Instituto Universitario de Investigación Ortega y Gasset. Universidad Complutense de Madrid). 186
THESIS: The Spanish equity market (2000-2014): stylized facts.
José Antonio Pérez Rodríguez (Instituto Universitario de Investigación Ortega y Gasset. Universidad Complutense de Madrid). 187
4. ANNEX I: ANALYSIS AND EMPIRICAL EVIDENCE OF THE INT RODUCTION
OF THE CLOSING AUCTION IN THE SPANISH EQUITY MARKET .
4.1. Introduction
The closing auction, as a new mechanism of fixation of the closing price of stocks at
the end of the trading session, was introduced in the Spanish equity market on June 1, 2000.
This new closing auction implies, besides a closer step towards integration with other
European stock exchanges221, an impulse towards a greater efficiency when computing the
closing price of securities, given that the closing auction is a period while new orders can be
introduced but no trades are done until the end of the auction is reached: then, the allocation
of shares is done with its subsequent computing of the closing price and the definitive close of
the market222.
As explained before in this thesis, closing auction is a period that lasts five minutes
plus a maximum random-end of 30 seconds during which (at any moment and without
previous notice), market closes. It is important to stress here that each of the different
segments of the market –for any auction- (Main Trading, Fixing, ETFs, Latibex) has a
different random-end, although in some cases, it could be exactly the same.
While the auction is taking place, market participants receive information about the
equilibrium price of the auction and the potential trading volume to be traded at that specific
moment according to supply and demand. If there were no auction price, best bid and best ask
prices would be shown with their correspondent bid and ask aggregated volumes (number of
shares at each side). The system will show at any moment (during the auction) which is the
price at which orders would be executed if at that specific moment, the auction would finish.
The computation of this equilibrium price is done in real time any time that a buy or sell order
is introduced, modified or cancelled.
221 Concerning this issue, it can be read section 1.4 European meeting of 1999 in Madrid of this thesis.
222 With the exception of the Special Operations (after hours market), which last from 17:40 p.m. to 20:00 p.m.
THESIS: The Spanish equity market (2000-2014): stylized facts.
José Antonio Pérez Rodríguez (Instituto Universitario de Investigación Ortega y Gasset. Universidad Complutense de Madrid). 188
As detailed before223, the rules governing the fixing of the equilibrium price during an
auction in SIBE, according to the current regulation224, are the following:
1) From all buy and sell limit orders, the price chosen as the equilibrium price of the
auction will be that specific price at which the largest volume of shares is executed.
2) If there are two or more prices at which the same number of shares can be executed,
the auction price shall be that price which leaves the smallest surplus. The surplus is the
difference (in absolute terms) between bid and ask volumes susceptible of being traded at the
same price.
3) If the two conditions stipulated above are the same for two or more prices, the price
of the side with the larger volume (larger weight) shall be taken as the equilibrium price of the
auction.
4) If the three previous conditions are the same for two or more prices, the price which
is closest to the last executed price shall be taken as the equilibrium price of the auction. If
this price is within the range of potential auction prices (upper and lower limit), the last
executed price is taken. If there is no last executed price or this price is outside the range of
static range prices, the price chosen as the equilibrium price shall be the last static price225.
Besides, the previous rules are the same ones used for the opening of the market, and
therefore used to compute the opening price of each stock for each trading session.
However, after 100 trading sessions using the closing auction226, an empirical
evaluation was needed. In other words, this section wonders if quantitative data can show if
the implementation of the closing auction in the Spanish market was useful or not. Questions
as: what is the quantitative importance of the closing auction in terms of trading volume?,
which is the relative variation of stock prices during this period?, which is the percentage
223 See section 3.7.2. 224 Circular nº 1/2001 of Sociedad de Bolsas, S.A. (BME). 225 See section named “Volatility auctions and price ranges”. 226 This empirical evaluation was researched on October 2000.
THESIS: The Spanish equity market (2000-2014): stylized facts.
José Antonio Pérez Rodríguez (Instituto Universitario de Investigación Ortega y Gasset. Universidad Complutense de Madrid). 189
change of IBEX indices227 during the auction?, and, last but not least important: how do
these results vary with respect to the old system (through average prices system)?. This
section tries to answer these questions based on the light shed by the first data available after
the introduction of the closing auction in the Spanish market.
On the other hand, it is necessary to detail how was the calculation of the closing price
of the session under the old system “through average prices”, before the closing auction was
implemented. This old system (through average prices) was defined228 as follows:
The closing price of the trading session for a specific stock is computed, among the
traded prices of the last 500 shares (Main trading) or 200 shares (Fixing market), respectively,
will be chosen that specific price closer to the weighted average price of the last 500 traded
shares and, if two prices have the same difference with respect to that weighted average price,
the last traded price will be chosen. If 500 shares (for Main trading) –or 200 shares for Fixing
market- have not been traded in the whole trading session, the closing price would be the
closing price of the previous trading session.
In the case that, during the last minutes of the trading session, an important deviation
of the price of a stock is produced, it will be chosen as a closing price (among those traded
prices during the last five minutes), that traded price closest to the volume weighted average
price of the last five minutes and, if two prices have the same distance with respect to that
weighted average price, the last traded price will be chosen as a closing price.
227 Under the name of IBEX indices, the following indices (at the epoch) are included: Ibex-35, Ibex Complementario
(Ibex Complementary), Ibex Financiero (Ibex Financials), Ibex Industria y varios (Ibex Industry and others), Ibex Nuevo Mercado (Ibex New Market) and Ibex Utilities (Ibex Utilities).
228 The new system of computation of the closing price of a stock in a trading session was explained in section 3.1.3. End of the session (closing auction) in this thesis.
THESIS: The Spanish equity market (2000-2014): stylized facts.
José Antonio Pérez Rodríguez (Instituto Universitario de Investigación Ortega y Gasset. Universidad Complutense de Madrid). 190
4.2. IBEX índices.
4.2.1. IBEX indices in the closing auction.
The following analysis is based on an empirical evidence taking data from June 1,
2000 to August 18, 2000 (56 trading sessions)229.
Given that, during this period, a change in the composition of the IBEX 35 index
took place, it has been taken into account the composition of the index valid from July 3,
2000, that is, the index taken into account includes the stocks Zeltia, S.A. (ZEL) and Red
Eléctrica de España, S.A.(REE) and the following stocks are not included: Autopistas Mare
Nostrum, S.A. (AUM) and Corporación Mapfre, S.A. (MAP). However, it should be pointed
out that here it is analyzed not only IBEX 35 index but also IBEX index family of indices
(complementary and sector indices).
The main result obtained here is the disparity of data obtained in different indices.
Indeed, an example is the average variations of IBEX indices during the closing auction;
that is, the variation of the last IBEX index (at 17:30:00 p.m.) and the closing IBEX index
(once it is finished the allocation of the auction and computed the closing price of the stocks).
These average variations go from 0,11% (IBEX 35) to 0,29% (IBEX New Market)
–see Graph 1-. The reasons of such variations among indices are due to different composition
of the indices not only in terms of capitalization of constituents but also in terms of the
homogeneity/heterogeneity of the constituents of each index.
229 In this period, June 23, 2000 is excluded. On that day, there were a technical glitch and trading session was extended,
being the definitive close of the market at 18:50 p.m.
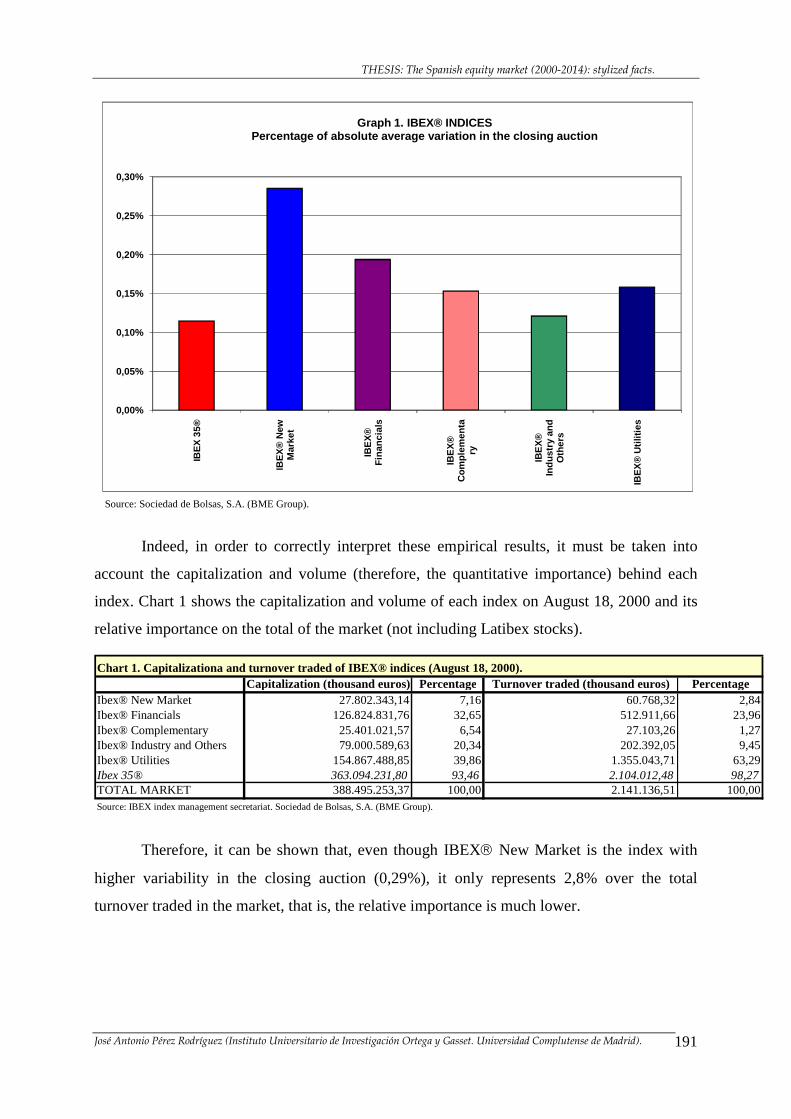
THESIS: The Spanish equity market (2000-2014): stylized facts.
José Antonio Pérez Rodríguez (Instituto Universitario de Investigación Ortega y Gasset. Universidad Complutense de Madrid). 191
Source: Sociedad de Bolsas, S.A. (BME Group).
0,00%
0,05%
0,10%
0,15%
0,20%
0,25%
0,30%
IBE
X 3
5®
IBE
X®
New
M
arke
t
IBE
X®
F
inan
cial
s
IBE
X®
C
ompl
emen
tary
IBE
X®
In
dust
ry a
nd
Oth
ers
IBE
X®
Util
ities
Graph 1. IBEX® INDICESPercentage of absolute average variation in the clo sing auction
Indeed, in order to correctly interpret these empirical results, it must be taken into
account the capitalization and volume (therefore, the quantitative importance) behind each
index. Chart 1 shows the capitalization and volume of each index on August 18, 2000 and its
relative importance on the total of the market (not including Latibex stocks).
Chart 1. Capitalizationa and turnover traded of IBEX® indices (August 18, 2000).Capitalization (thousand euros) Percentage Turnover traded (thousand euros) Percentage
Ibex® New Market 27.802.343,14 7,16 60.768,32 2,84Ibex® Financials 126.824.831,76 32,65 512.911,66 23,96Ibex® Complementary 25.401.021,57 6,54 27.103,26 1,27Ibex® Industry and Others 79.000.589,63 20,34 202.392,05 9,45Ibex® Utilities 154.867.488,85 39,86 1.355.043,71 63,29Ibex 35® 363.094.231,80 93,46 2.104.012,48 98,27TOTAL MARKET 388.495.253,37 100,00 2.141.136,51 100,00Source: IBEX index management secretariat. Sociedad de Bolsas, S.A. (BME Group).
Therefore, it can be shown that, even though IBEX New Market is the index with
higher variability in the closing auction (0,29%), it only represents 2,8% over the total
turnover traded in the market, that is, the relative importance is much lower.
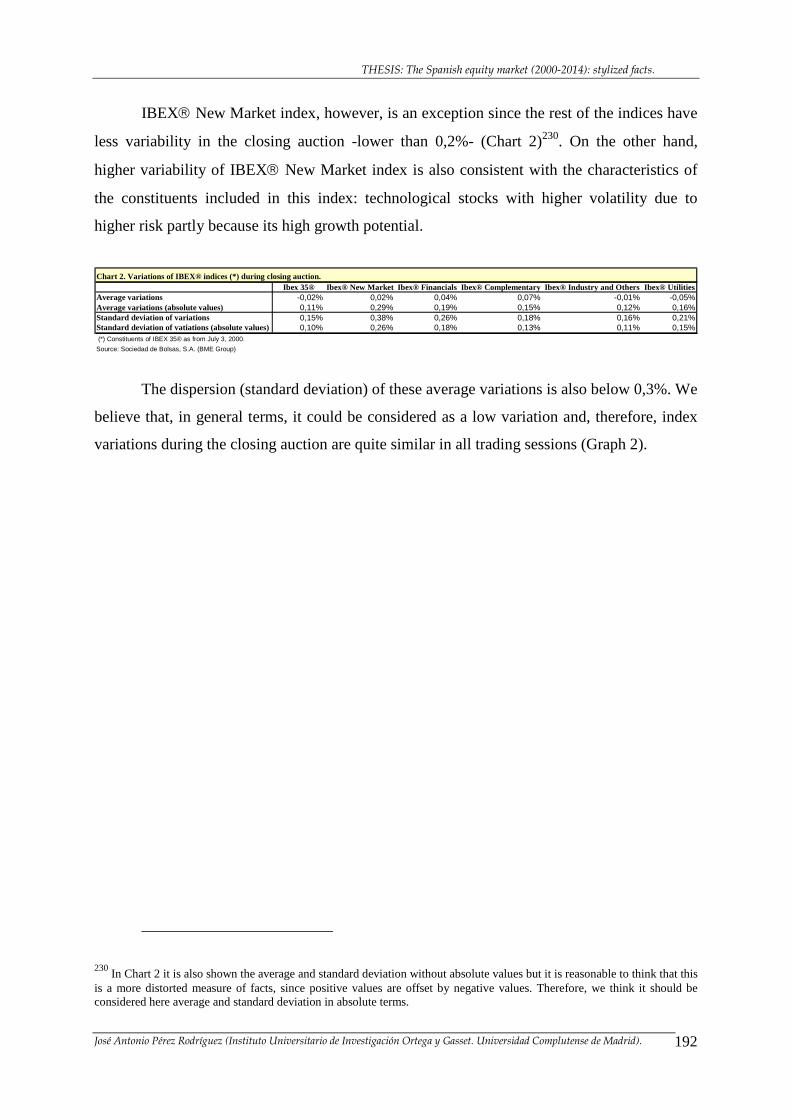
THESIS: The Spanish equity market (2000-2014): stylized facts.
José Antonio Pérez Rodríguez (Instituto Universitario de Investigación Ortega y Gasset. Universidad Complutense de Madrid). 192
IBEX New Market index, however, is an exception since the rest of the indices have
less variability in the closing auction -lower than 0,2%- (Chart 2)230. On the other hand,
higher variability of IBEX New Market index is also consistent with the characteristics of
the constituents included in this index: technological stocks with higher volatility due to
higher risk partly because its high growth potential.
Chart 2. Variations of IBEX® indices (*) during closing auction.Ibex 35® Ibex® New Market Ibex® Financials Ibex® Complementary Ibex® Industry and Others Ibex® Utilities
Average variations -0,02% 0,02% 0,04% 0,07% -0,01% -0,05%Average variations (absolute values) 0,11% 0,29% 0,19% 0,15% 0,12% 0,16%Standard deviation of variations 0,15% 0,38% 0,26% 0,18% 0,16% 0,21%Standard deviation of vatiations (absolute values) 0,10% 0,26% 0,18% 0,13% 0,11% 0,15% (*) Constituents of IBEX 35® as from July 3, 2000.
Source: Sociedad de Bolsas, S.A. (BME Group)
The dispersion (standard deviation) of these average variations is also below 0,3%. We
believe that, in general terms, it could be considered as a low variation and, therefore, index
variations during the closing auction are quite similar in all trading sessions (Graph 2).
230 In Chart 2 it is also shown the average and standard deviation without absolute values but it is reasonable to think that this
is a more distorted measure of facts, since positive values are offset by negative values. Therefore, we think it should be considered here average and standard deviation in absolute terms.
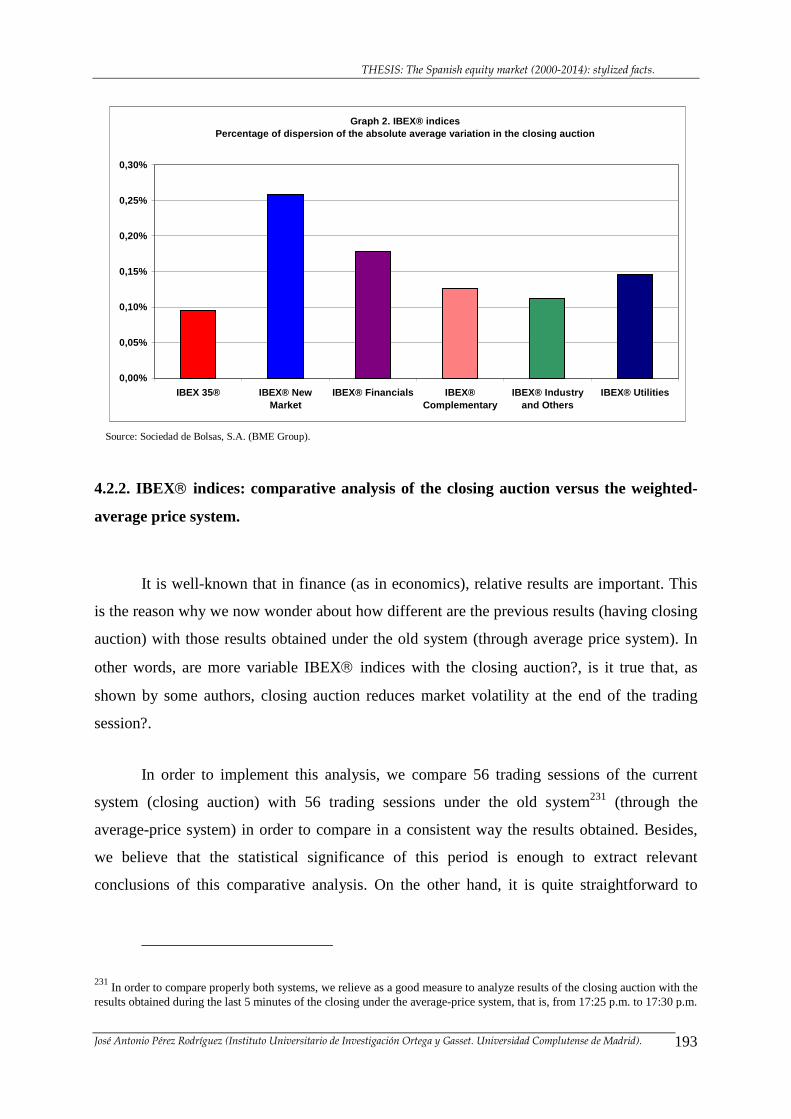
THESIS: The Spanish equity market (2000-2014): stylized facts.
José Antonio Pérez Rodríguez (Instituto Universitario de Investigación Ortega y Gasset. Universidad Complutense de Madrid). 193
Source: Sociedad de Bolsas, S.A. (BME Group).
Graph 2. IBEX® indicesPercentage of dispersion of the absolute average va riation in the closing auction
0,00%
0,05%
0,10%
0,15%
0,20%
0,25%
0,30%
IBEX 35® IBEX® NewMarket
IBEX® Financials IBEX®Complementary
IBEX® Industryand Others
IBEX® Utilities
4.2.2. IBEX indices: comparative analysis of the closing auction versus the weighted-
average price system.
It is well-known that in finance (as in economics), relative results are important. This
is the reason why we now wonder about how different are the previous results (having closing
auction) with those results obtained under the old system (through average price system). In
other words, are more variable IBEX indices with the closing auction?, is it true that, as
shown by some authors, closing auction reduces market volatility at the end of the trading
session?.
In order to implement this analysis, we compare 56 trading sessions of the current
system (closing auction) with 56 trading sessions under the old system231 (through the
average-price system) in order to compare in a consistent way the results obtained. Besides,
we believe that the statistical significance of this period is enough to extract relevant
conclusions of this comparative analysis. On the other hand, it is quite straightforward to
231 In order to compare properly both systems, we relieve as a good measure to analyze results of the closing auction with the
results obtained during the last 5 minutes of the closing under the average-price system, that is, from 17:25 p.m. to 17:30 p.m.
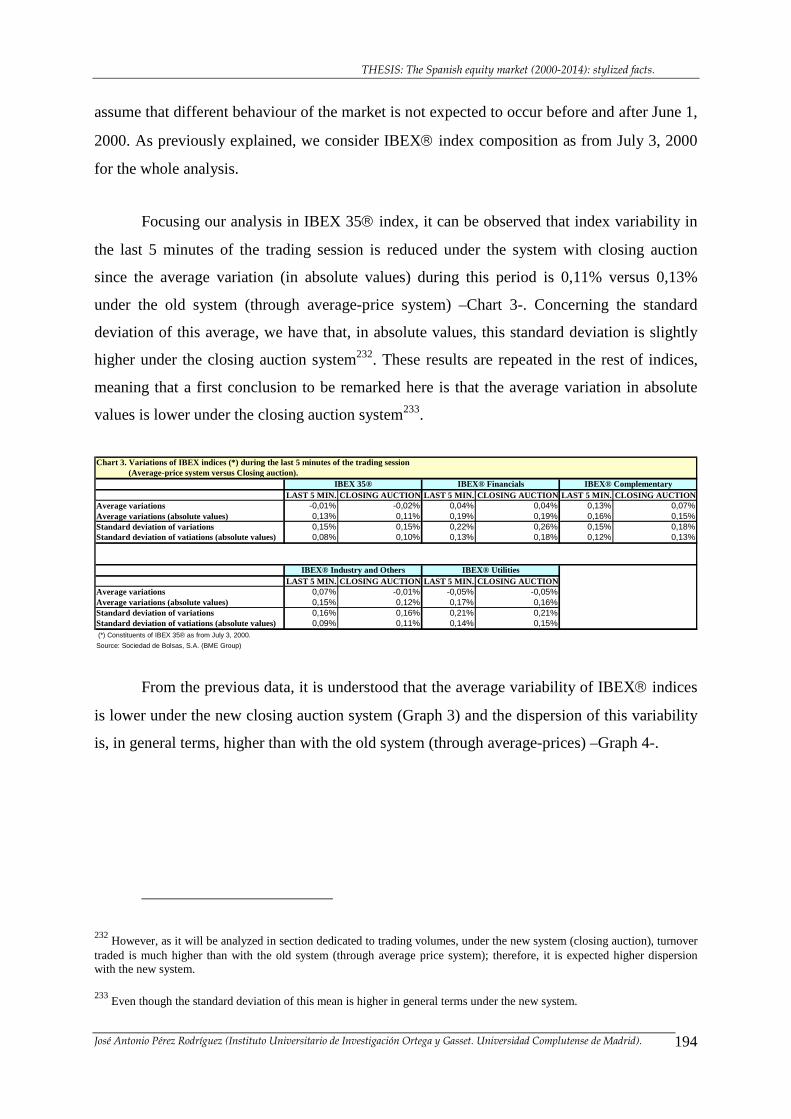
THESIS: The Spanish equity market (2000-2014): stylized facts.
José Antonio Pérez Rodríguez (Instituto Universitario de Investigación Ortega y Gasset. Universidad Complutense de Madrid). 194
assume that different behaviour of the market is not expected to occur before and after June 1,
2000. As previously explained, we consider IBEX index composition as from July 3, 2000
for the whole analysis.
Focusing our analysis in IBEX 35 index, it can be observed that index variability in
the last 5 minutes of the trading session is reduced under the system with closing auction
since the average variation (in absolute values) during this period is 0,11% versus 0,13%
under the old system (through average-price system) –Chart 3-. Concerning the standard
deviation of this average, we have that, in absolute values, this standard deviation is slightly
higher under the closing auction system232. These results are repeated in the rest of indices,
meaning that a first conclusion to be remarked here is that the average variation in absolute
values is lower under the closing auction system233.
Chart 3. Variations of IBEX indices (*) during the last 5 minutes of the trading session (Average-price system versus Closing auction).
LAST 5 MIN. CLOSING AUCTION LAST 5 MIN. CLOSING AUCTIO N LAST 5 MIN. CLOSING AUCTIONAverage variations -0,01% -0,02% 0,04% 0,04% 0,13% 0,07%Average variations (absolute values) 0,13% 0,11% 0,19% 0,19% 0,16% 0,15%Standard deviation of variations 0,15% 0,15% 0,22% 0,26% 0,15% 0,18%Standard deviation of vatiations (absolute values) 0,08% 0,10% 0,13% 0,18% 0,12% 0,13%
LAST 5 MIN. CLOSING AUCTION LAST 5 MIN. CLOSING AUCTIO NAverage variations 0,07% -0,01% -0,05% -0,05%Average variations (absolute values) 0,15% 0,12% 0,17% 0,16%Standard deviation of variations 0,16% 0,16% 0,21% 0,21%Standard deviation of vatiations (absolute values) 0,09% 0,11% 0,14% 0,15% (*) Constituents of IBEX 35® as from July 3, 2000.
Source: Sociedad de Bolsas, S.A. (BME Group)
IBEX® Industry and Others IBEX® Utilities
IBEX 35® IBEX® Financials IBEX® Complementary
From the previous data, it is understood that the average variability of IBEX indices
is lower under the new closing auction system (Graph 3) and the dispersion of this variability
is, in general terms, higher than with the old system (through average-prices) –Graph 4-.
232 However, as it will be analyzed in section dedicated to trading volumes, under the new system (closing auction), turnover
traded is much higher than with the old system (through average price system); therefore, it is expected higher dispersion with the new system.
233 Even though the standard deviation of this mean is higher in general terms under the new system.
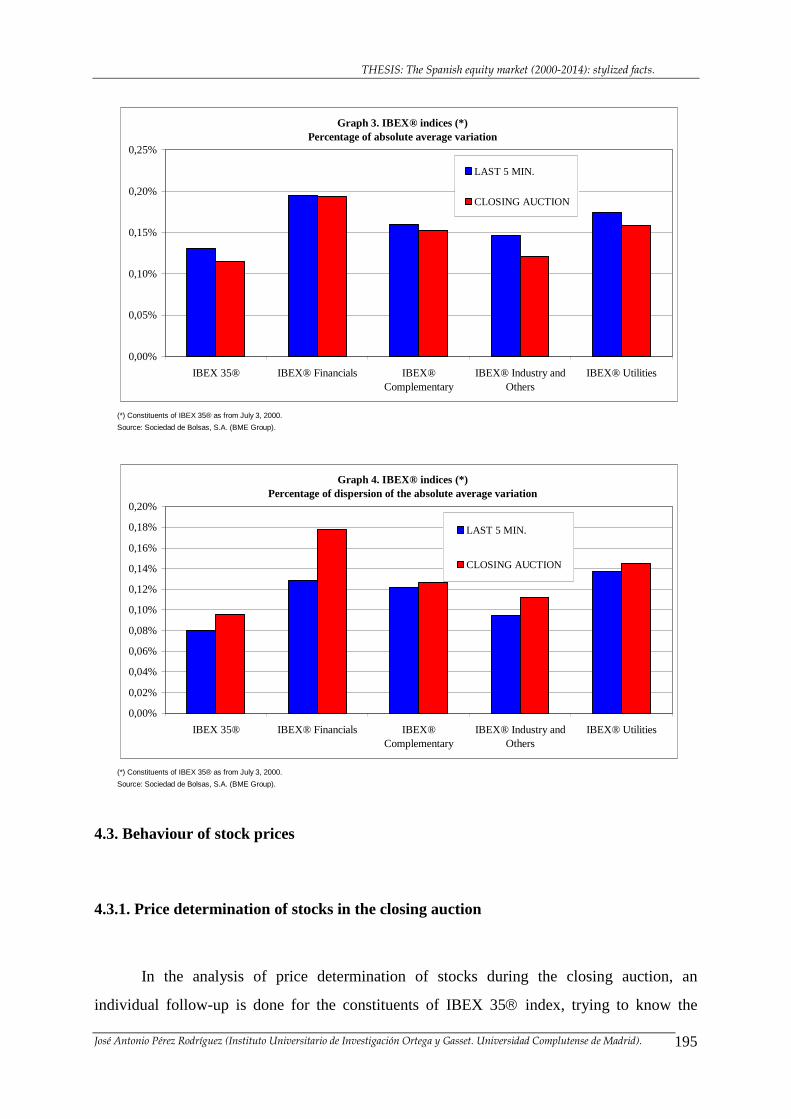
THESIS: The Spanish equity market (2000-2014): stylized facts.
José Antonio Pérez Rodríguez (Instituto Universitario de Investigación Ortega y Gasset. Universidad Complutense de Madrid). 195
(*) Constituents of IBEX 35® as from July 3, 2000.
Source: Sociedad de Bolsas, S.A. (BME Group).
Graph 3. IBEX® indices (*)Percentage of absolute average variation
0,00%
0,05%
0,10%
0,15%
0,20%
0,25%
IBEX 35® IBEX® Financials IBEX®Complementary
IBEX® Industry andOthers
IBEX® Utilities
LAST 5 MIN.
CLOSING AUCTION
(*) Constituents of IBEX 35® as from July 3, 2000.
Source: Sociedad de Bolsas, S.A. (BME Group).
Graph 4. IBEX® indices (*)Percentage of dispersion of the absolute average variation
0,00%
0,02%
0,04%
0,06%
0,08%
0,10%
0,12%
0,14%
0,16%
0,18%
0,20%
IBEX 35® IBEX® Financials IBEX®Complementary
IBEX® Industry andOthers
IBEX® Utilities
LAST 5 MIN.
CLOSING AUCTION
4.3. Behaviour of stock prices
4.3.1. Price determination of stocks in the closing auction
In the analysis of price determination of stocks during the closing auction, an
individual follow-up is done for the constituents of IBEX 35 index, trying to know the
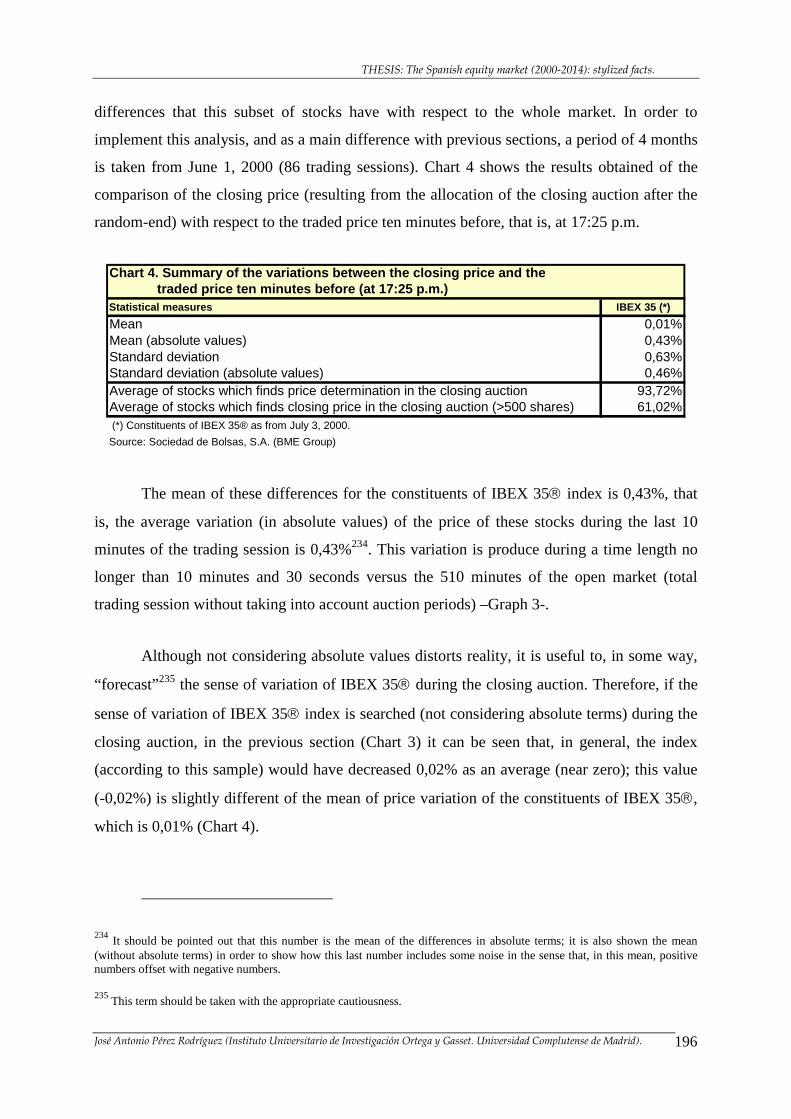
THESIS: The Spanish equity market (2000-2014): stylized facts.
José Antonio Pérez Rodríguez (Instituto Universitario de Investigación Ortega y Gasset. Universidad Complutense de Madrid). 196
differences that this subset of stocks have with respect to the whole market. In order to
implement this analysis, and as a main difference with previous sections, a period of 4 months
is taken from June 1, 2000 (86 trading sessions). Chart 4 shows the results obtained of the
comparison of the closing price (resulting from the allocation of the closing auction after the
random-end) with respect to the traded price ten minutes before, that is, at 17:25 p.m.
Chart 4. Summary of the variations between the clos ing price and the traded price ten minutes before (at 17 :25 p.m.)Statistical measures IBEX 35 (*)
Mean 0,01%Mean (absolute values) 0,43%Standard deviation 0,63%Standard deviation (absolute values) 0,46%Average of stocks which finds price determination in the closing auction 93,72%Average of stocks which finds closing price in the closing auction (>500 shares) 61,02% (*) Constituents of IBEX 35® as from July 3, 2000.
Source: Sociedad de Bolsas, S.A. (BME Group)
The mean of these differences for the constituents of IBEX 35 index is 0,43%, that
is, the average variation (in absolute values) of the price of these stocks during the last 10
minutes of the trading session is 0,43%234. This variation is produce during a time length no
longer than 10 minutes and 30 seconds versus the 510 minutes of the open market (total
trading session without taking into account auction periods) –Graph 3-.
Although not considering absolute values distorts reality, it is useful to, in some way,
“forecast”235 the sense of variation of IBEX 35 during the closing auction. Therefore, if the
sense of variation of IBEX 35 index is searched (not considering absolute terms) during the
closing auction, in the previous section (Chart 3) it can be seen that, in general, the index
(according to this sample) would have decreased 0,02% as an average (near zero); this value
(-0,02%) is slightly different of the mean of price variation of the constituents of IBEX 35,
which is 0,01% (Chart 4).
234 It should be pointed out that this number is the mean of the differences in absolute terms; it is also shown the mean
(without absolute terms) in order to show how this last number includes some noise in the sense that, in this mean, positive numbers offset with negative numbers.
235 This term should be taken with the appropriate cautiousness.
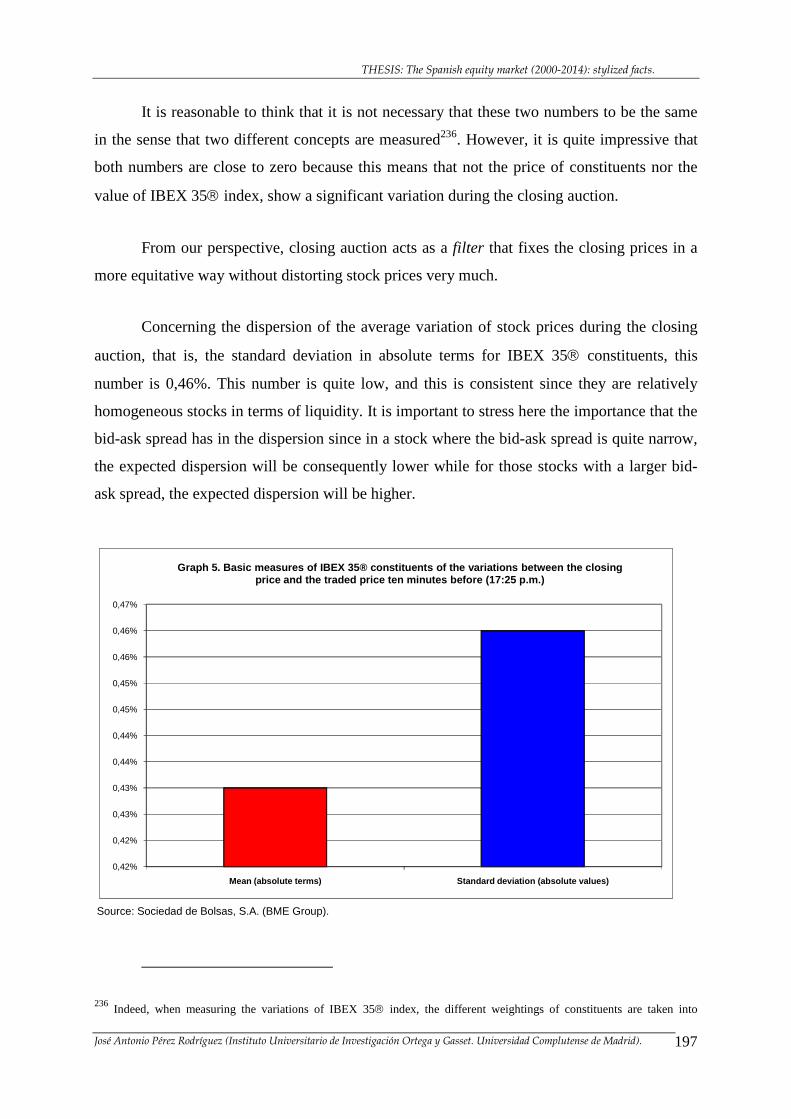
THESIS: The Spanish equity market (2000-2014): stylized facts.
José Antonio Pérez Rodríguez (Instituto Universitario de Investigación Ortega y Gasset. Universidad Complutense de Madrid). 197
It is reasonable to think that it is not necessary that these two numbers to be the same
in the sense that two different concepts are measured236. However, it is quite impressive that
both numbers are close to zero because this means that not the price of constituents nor the
value of IBEX 35 index, show a significant variation during the closing auction.
From our perspective, closing auction acts as a filter that fixes the closing prices in a
more equitative way without distorting stock prices very much.
Concerning the dispersion of the average variation of stock prices during the closing
auction, that is, the standard deviation in absolute terms for IBEX 35 constituents, this
number is 0,46%. This number is quite low, and this is consistent since they are relatively
homogeneous stocks in terms of liquidity. It is important to stress here the importance that the
bid-ask spread has in the dispersion since in a stock where the bid-ask spread is quite narrow,
the expected dispersion will be consequently lower while for those stocks with a larger bid-
ask spread, the expected dispersion will be higher.
Source: Sociedad de Bolsas, S.A. (BME Group).
0,42%
0,42%
0,43%
0,43%
0,44%
0,44%
0,45%
0,45%
0,46%
0,46%
0,47%
Mean (absolute terms) Standard deviation (absolute v alues)
Graph 5. Basic measures of IBEX 35® constituents of the variations between the closing price and the traded price ten minutes before (17:2 5 p.m.)
236 Indeed, when measuring the variations of IBEX 35 index, the different weightings of constituents are taken into
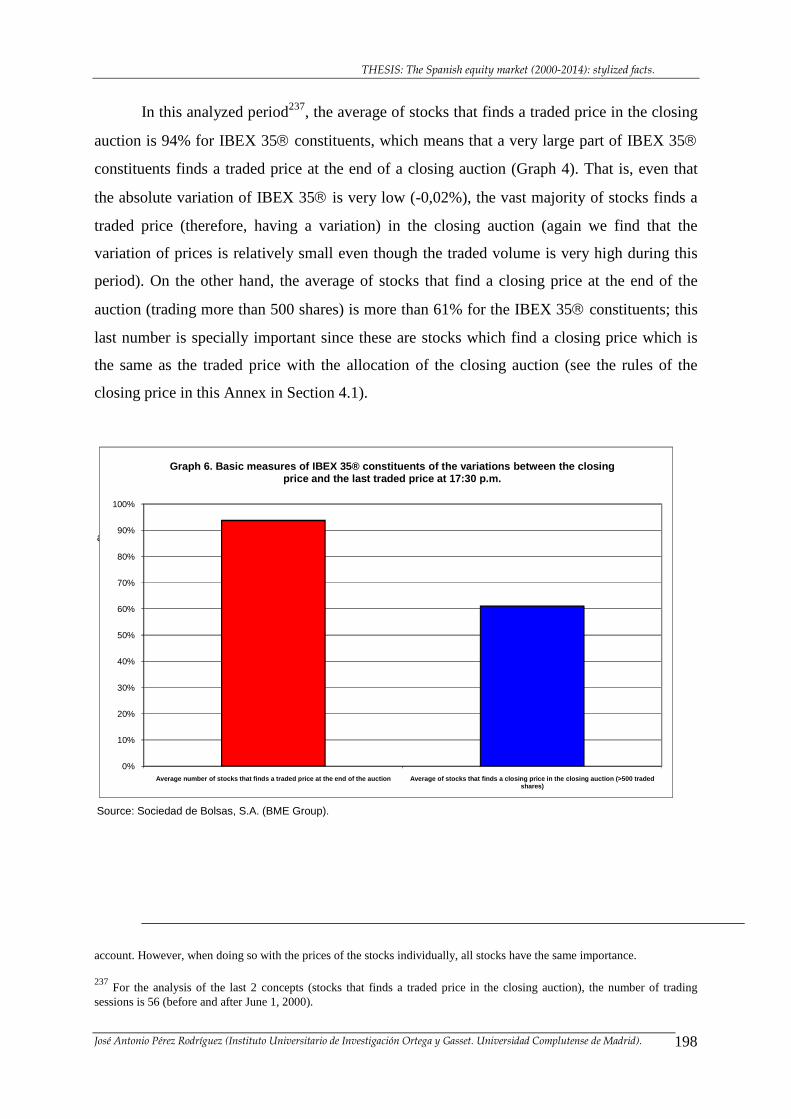
THESIS: The Spanish equity market (2000-2014): stylized facts.
José Antonio Pérez Rodríguez (Instituto Universitario de Investigación Ortega y Gasset. Universidad Complutense de Madrid). 198
In this analyzed period237, the average of stocks that finds a traded price in the closing
auction is 94% for IBEX 35 constituents, which means that a very large part of IBEX 35
constituents finds a traded price at the end of a closing auction (Graph 4). That is, even that
the absolute variation of IBEX 35 is very low (-0,02%), the vast majority of stocks finds a
traded price (therefore, having a variation) in the closing auction (again we find that the
variation of prices is relatively small even though the traded volume is very high during this
period). On the other hand, the average of stocks that find a closing price at the end of the
auction (trading more than 500 shares) is more than 61% for the IBEX 35 constituents; this
last number is specially important since these are stocks which find a closing price which is
the same as the traded price with the allocation of the closing auction (see the rules of the
closing price in this Annex in Section 4.1).
Average of stocks that finds a closing price in the closing auction (>500 traded shares)
Source: Sociedad de Bolsas, S.A. (BME Group).
0%
10%
20%
30%
40%
50%
60%
70%
80%
90%
100%
Average number of stocks that finds a traded price at the end of the auction Average of stocks that finds a closing price in the closing auction (>500 traded shares)
Graph 6. Basic measures of IBEX 35® constituents of the variations between the closing price and the last traded price at 17:30 p.m.
account. However, when doing so with the prices of the stocks individually, all stocks have the same importance.
237 For the analysis of the last 2 concepts (stocks that finds a traded price in the closing auction), the number of trading
sessions is 56 (before and after June 1, 2000).
THESIS: The Spanish equity market (2000-2014): stylized facts.
José Antonio Pérez Rodríguez (Instituto Universitario de Investigación Ortega y Gasset. Universidad Complutense de Madrid). 199
4.3.2. Closing price: Closing auction versus closing price through average prices (without
closing auction).
The previous section analyzed the behavior of the fixing of prices through the closing
auction. However, the analysis of these results with respect to those results obtained under the
system through average prices is now covered. When analyzing these results, it is found that,
for IBEX 35 index constituents, the percentage of average variation in absolute terms is
lower under the system with closing auction than under the system through average prices.
Indeed, the average variation (in absolute terms) of the prices of the last 10 minutes of the
trading session with the old system is 0,45% while through the closing auction this percentage
is 0,43% (Chart 5).
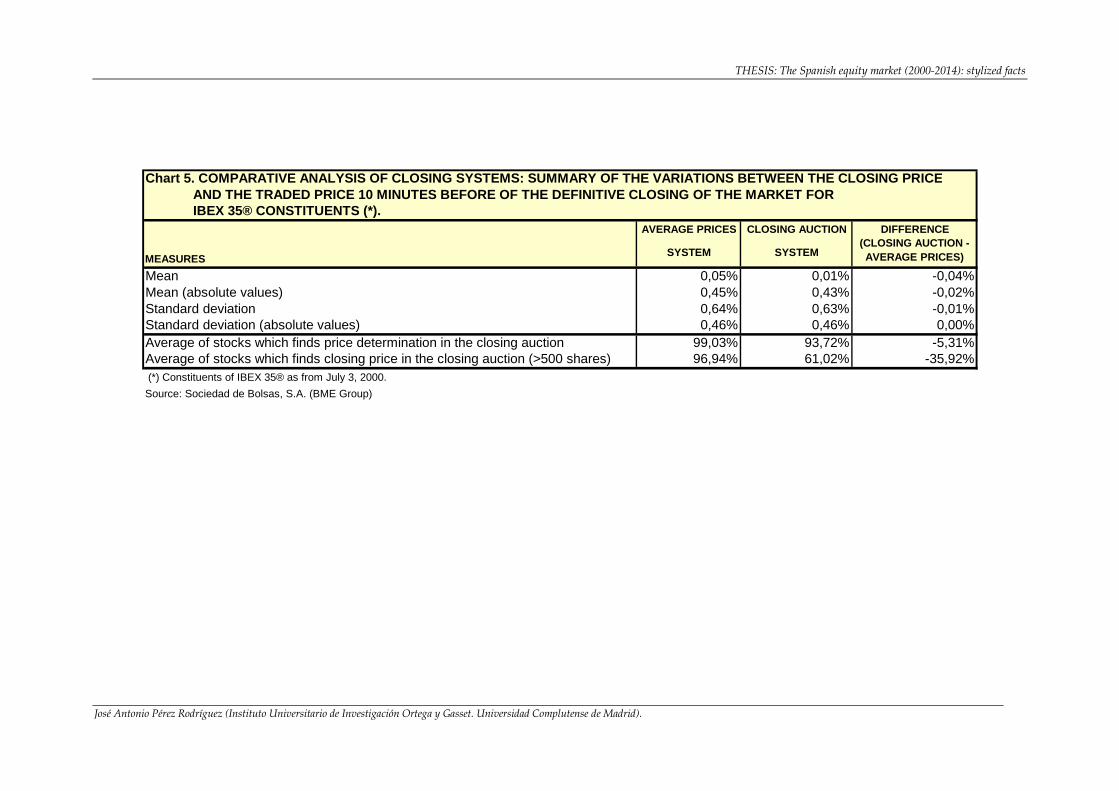
THESIS: The Spanish equity market (2000-2014): stylized facts
José Antonio Pérez Rodríguez (Instituto Universitario de Investigación Ortega y Gasset. Universidad Complutense de Madrid).
Chart 5. COMPARATIVE ANALYSIS OF CLOSING SYSTEMS: S UMMARY OF THE VARIATIONS BETWEEN THE CLOSING PRICE AND THE TRADED PRICE 10 MINUTES BEFORE OF THE DEFINITIVE CLOSING OF THE MARKET FOR IBEX 35® CONSTITUENTS (*).
AVERAGE PRICES CLOSING AUCTION DIFFERENCE
MEASURESSYSTEM SYSTEM
(CLOSING AUCTION - AVERAGE PRICES)
Mean 0,05% 0,01% -0,04%Mean (absolute values) 0,45% 0,43% -0,02%Standard deviation 0,64% 0,63% -0,01%Standard deviation (absolute values) 0,46% 0,46% 0,00%Average of stocks which finds price determination in the closing auction 99,03% 93,72% -5,31%Average of stocks which finds closing price in the closing auction (>500 shares) 96,94% 61,02% -35,92% (*) Constituents of IBEX 35® as from July 3, 2000.
Source: Sociedad de Bolsas, S.A. (BME Group)
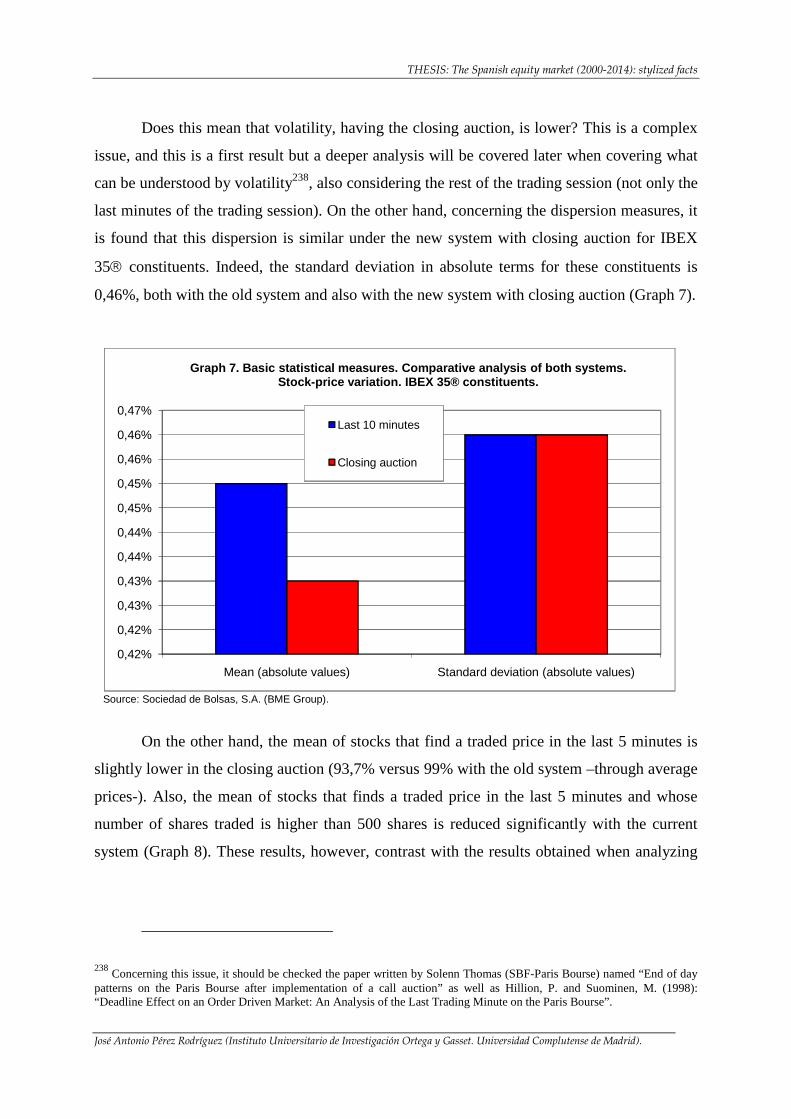
THESIS: The Spanish equity market (2000-2014): stylized facts
José Antonio Pérez Rodríguez (Instituto Universitario de Investigación Ortega y Gasset. Universidad Complutense de Madrid).
Does this mean that volatility, having the closing auction, is lower? This is a complex
issue, and this is a first result but a deeper analysis will be covered later when covering what
can be understood by volatility238, also considering the rest of the trading session (not only the
last minutes of the trading session). On the other hand, concerning the dispersion measures, it
is found that this dispersion is similar under the new system with closing auction for IBEX
35 constituents. Indeed, the standard deviation in absolute terms for these constituents is
0,46%, both with the old system and also with the new system with closing auction (Graph 7).
Source: Sociedad de Bolsas, S.A. (BME Group).
0,42%
0,42%
0,43%
0,43%
0,44%
0,44%
0,45%
0,45%
0,46%
0,46%
0,47%
Mean (absolute values) Standard deviation (absolute values)
Graph 7. Basic statistical measures. Comparative an alysis of both systems. Stock-price variation. IBEX 35® constituents.
Last 10 minutes
Closing auction
On the other hand, the mean of stocks that find a traded price in the last 5 minutes is
slightly lower in the closing auction (93,7% versus 99% with the old system –through average
prices-). Also, the mean of stocks that finds a traded price in the last 5 minutes and whose
number of shares traded is higher than 500 shares is reduced significantly with the current
system (Graph 8). These results, however, contrast with the results obtained when analyzing
238 Concerning this issue, it should be checked the paper written by Solenn Thomas (SBF-Paris Bourse) named “End of day
patterns on the Paris Bourse after implementation of a call auction” as well as Hillion, P. and Suominen, M. (1998): “Deadline Effect on an Order Driven Market: An Analysis of the Last Trading Minute on the Paris Bourse”.
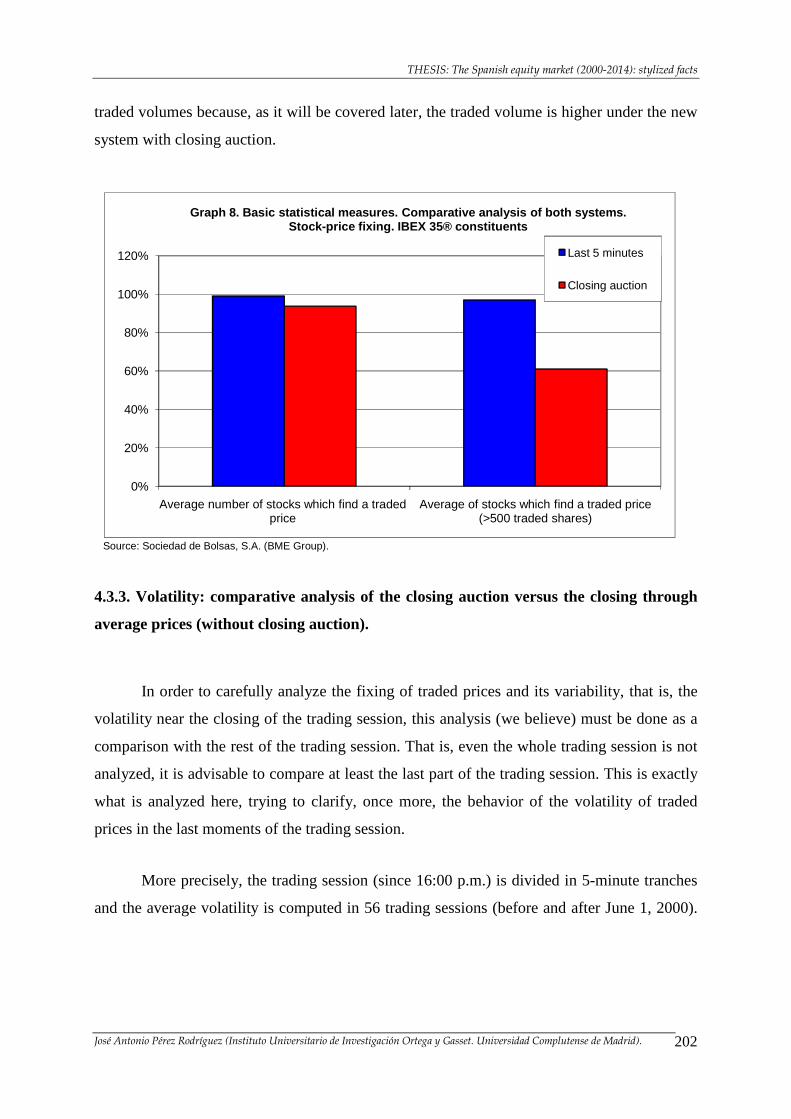
THESIS: The Spanish equity market (2000-2014): stylized facts
José Antonio Pérez Rodríguez (Instituto Universitario de Investigación Ortega y Gasset. Universidad Complutense de Madrid). 202
traded volumes because, as it will be covered later, the traded volume is higher under the new
system with closing auction.
Source: Sociedad de Bolsas, S.A. (BME Group).
0%
20%
40%
60%
80%
100%
120%
Average number of stocks which find a traded price
Average of stocks which find a traded price (>500 traded shares)
Graph 8. Basic statistical measures. Comparative an alysis of both systems. Stock-price fixing. IBEX 35® constituents
Last 5 minutes
Closing auction
4.3.3. Volatility: comparative analysis of the closing auction versus the closing through
average prices (without closing auction).
In order to carefully analyze the fixing of traded prices and its variability, that is, the
volatility near the closing of the trading session, this analysis (we believe) must be done as a
comparison with the rest of the trading session. That is, even the whole trading session is not
analyzed, it is advisable to compare at least the last part of the trading session. This is exactly
what is analyzed here, trying to clarify, once more, the behavior of the volatility of traded
prices in the last moments of the trading session.
More precisely, the trading session (since 16:00 p.m.) is divided in 5-minute tranches
and the average volatility is computed in 56 trading sessions (before and after June 1, 2000).
THESIS: The Spanish equity market (2000-2014): stylized facts
José Antonio Pérez Rodríguez (Instituto Universitario de Investigación Ortega y Gasset. Universidad Complutense de Madrid). 203
Therefore, available data is taken from 16:00 p.m. until the close of the trading session239 and
this appears to be important since a number of different research papers have confirmed that
volatility has stational components, specific effects of shares (news, etc.). It is therefore more
exhaustive method to analyze the average volatility of the last minutes versus the average
volatility of previous moments (before the closing of the market) in order to make more
consistent comparisons.
Therefore (and always considering IBEX 35 constituents), 2 different measures are
used (which, at the same time, can be considered as complementary ones) in order to compute
volatility. The first measure consists in analyzing the percentage variations of the stock prices
in absolute terms, and the second measure consists in analyzing the percentage variations of
the stock prices in terms of squared variations240 (please note that the standard deviation is not
used –which is the standard measure for volatility- because we consider as more correct the
use of these measures for the purpose tackled in this analysis). The results are shown in
Graphs 9 and 10 respectively and it is observed, as these graphs shed some light about the
sense of movement (they both show the same sense). Indeed, the key aspect here is not only
that volatility is dramatically reduced at the end of the trading session with the new system
with closing auction, but also that, with the new system having closing auction, before the
closing of the trading session, volatility levels are lower even before the end of the trading
session241.
239 The same time frame (from 16:00 p.m.) has been taken into account in the paper that Solenn Thomas writes for Paris
Bourse (Paris Stock Exchange): “End of Day Patterns on the Paris Bourse after Implementation of a call auction”.
240 100*
)(
1
1
−
−
−∑i
iin
i P
PPABS
−
−
−∑2
1
1 100*)(
i
iin
i P
PP ∀i i=1,………n.
241 Please note the graph points at 17:30 p.m. From June 1, 2000 volatility at this time is much lower in both graphs.
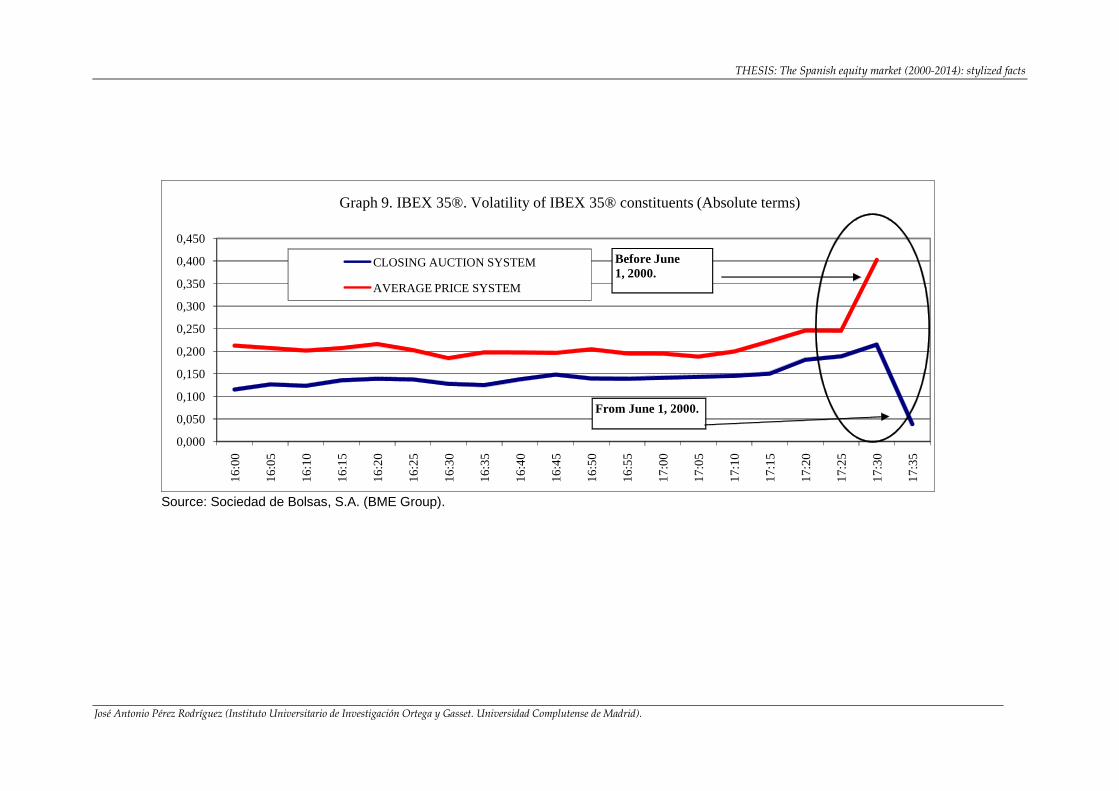
THESIS: The Spanish equity market (2000-2014): stylized facts
José Antonio Pérez Rodríguez (Instituto Universitario de Investigación Ortega y Gasset. Universidad Complutense de Madrid).
Source: Sociedad de Bolsas, S.A. (BME Group).
0,000
0,050
0,100
0,150
0,200
0,250
0,300
0,350
0,400
0,4501
6:0
0
16
:05
16
:10
16
:15
16
:20
16
:25
16
:30
16
:35
16
:40
16
:45
16
:50
16
:55
17
:00
17
:05
17
:10
17
:15
17
:20
17
:25
17
:30
17
:35
Graph 9. IBEX 35®. Volatility of IBEX 35® constituents (Absolute terms)
CLOSING AUCTION SYSTEM
AVERAGE PRICE SYSTEM
Before June 1, 2000.
From June 1, 2000.
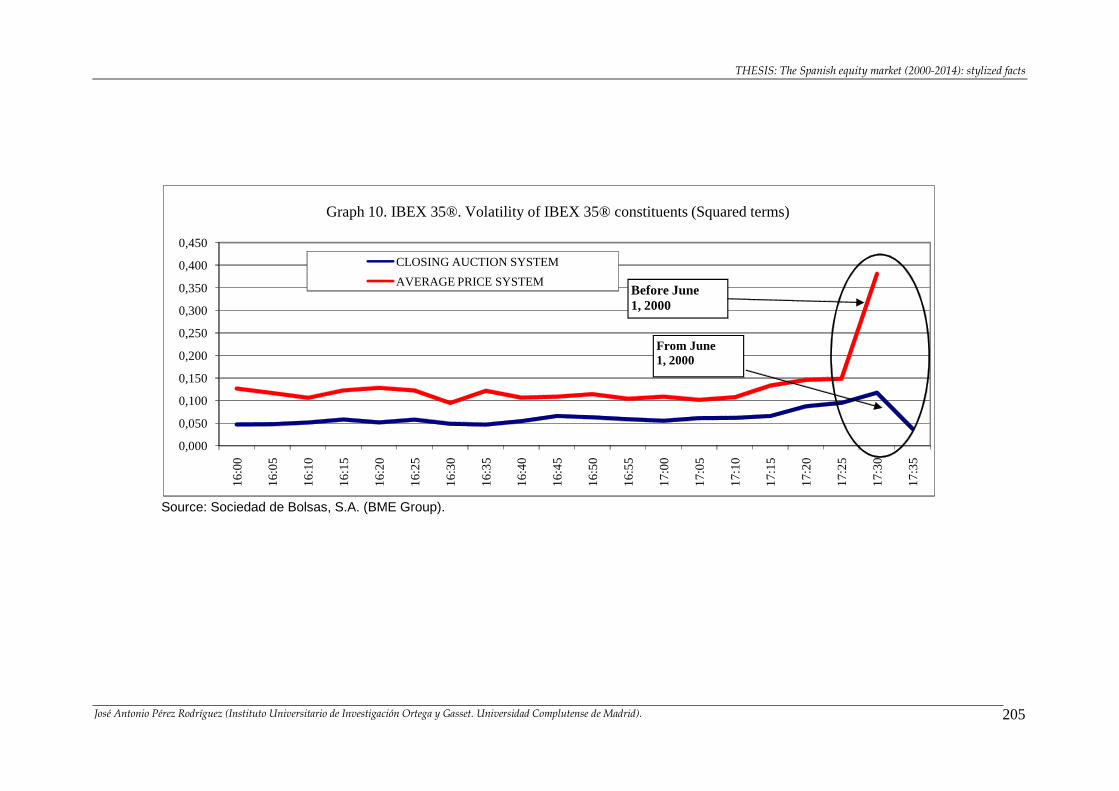
THESIS: The Spanish equity market (2000-2014): stylized facts
José Antonio Pérez Rodríguez (Instituto Universitario de Investigación Ortega y Gasset. Universidad Complutense de Madrid). 205
Source: Sociedad de Bolsas, S.A. (BME Group).
0,000
0,050
0,100
0,150
0,200
0,250
0,300
0,350
0,400
0,4501
6:0
0
16
:05
16
:10
16
:15
16
:20
16
:25
16
:30
16
:35
16
:40
16
:45
16
:50
16
:55
17
:00
17
:05
17
:10
17
:15
17
:20
17
:25
17
:30
17
:35
Graph 10. IBEX 35®. Volatility of IBEX 35® constituents (Squared terms)
CLOSING AUCTION SYSTEM
AVERAGE PRICE SYSTEM
From June 1, 2000
Before June 1, 2000
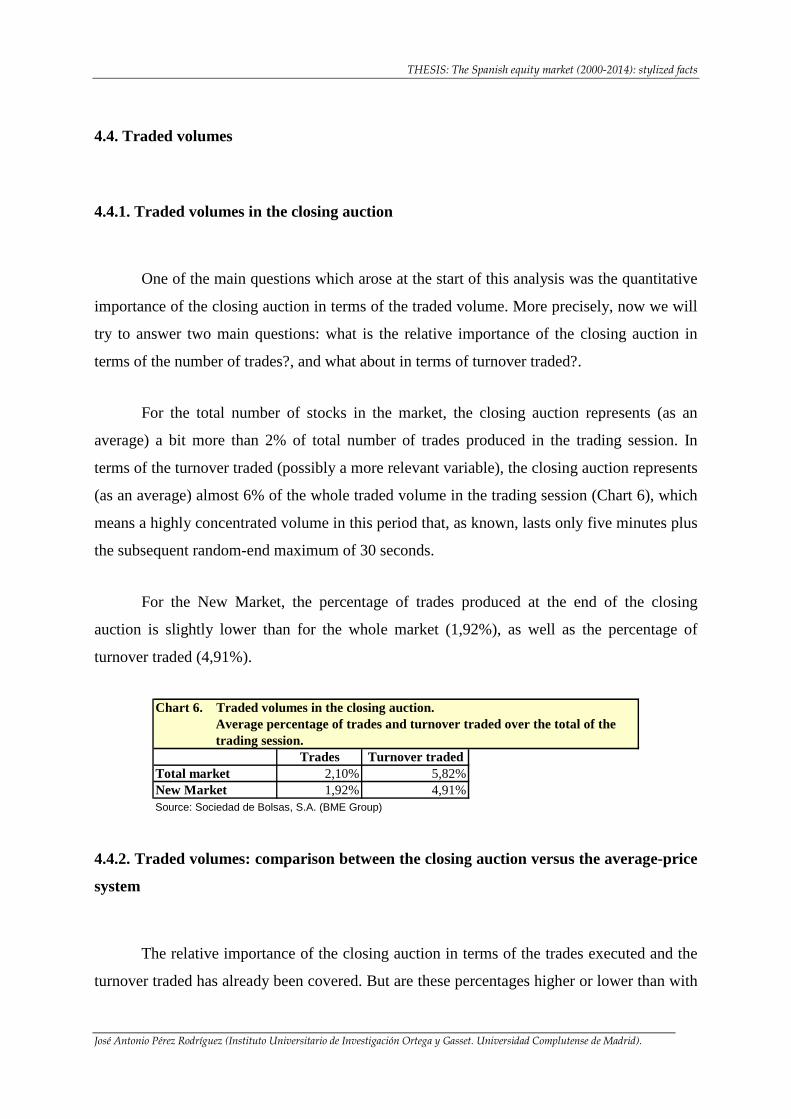
THESIS: The Spanish equity market (2000-2014): stylized facts
José Antonio Pérez Rodríguez (Instituto Universitario de Investigación Ortega y Gasset. Universidad Complutense de Madrid).
4.4. Traded volumes
4.4.1. Traded volumes in the closing auction
One of the main questions which arose at the start of this analysis was the quantitative
importance of the closing auction in terms of the traded volume. More precisely, now we will
try to answer two main questions: what is the relative importance of the closing auction in
terms of the number of trades?, and what about in terms of turnover traded?.
For the total number of stocks in the market, the closing auction represents (as an
average) a bit more than 2% of total number of trades produced in the trading session. In
terms of the turnover traded (possibly a more relevant variable), the closing auction represents
(as an average) almost 6% of the whole traded volume in the trading session (Chart 6), which
means a highly concentrated volume in this period that, as known, lasts only five minutes plus
the subsequent random-end maximum of 30 seconds.
For the New Market, the percentage of trades produced at the end of the closing
auction is slightly lower than for the whole market (1,92%), as well as the percentage of
turnover traded (4,91%).
Chart 6. Traded volumes in the closing auction. Average percentage of trades and turnover traded over the total of the trading session.
Trades Turnover tradedTotal market 2,10% 5,82%New Market 1,92% 4,91%Source: Sociedad de Bolsas, S.A. (BME Group)
4.4.2. Traded volumes: comparison between the closing auction versus the average-price
system
The relative importance of the closing auction in terms of the trades executed and the
turnover traded has already been covered. But are these percentages higher or lower than with
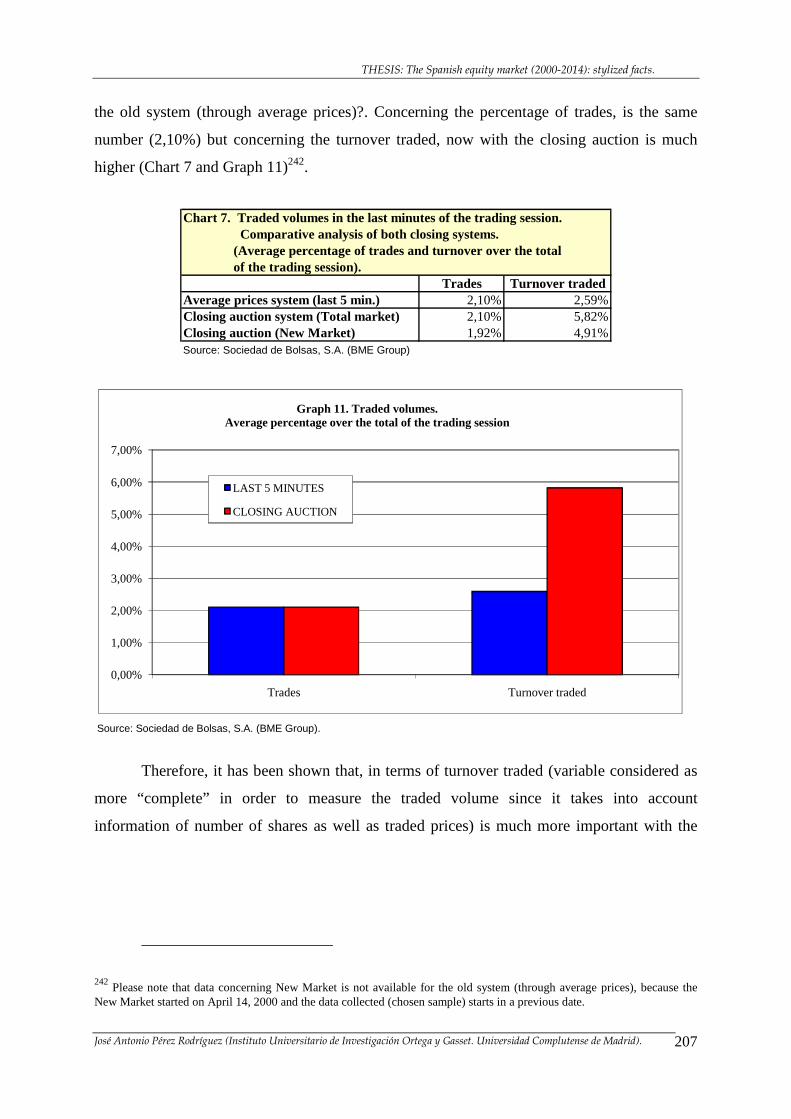
THESIS: The Spanish equity market (2000-2014): stylized facts.
José Antonio Pérez Rodríguez (Instituto Universitario de Investigación Ortega y Gasset. Universidad Complutense de Madrid). 207
the old system (through average prices)?. Concerning the percentage of trades, is the same
number (2,10%) but concerning the turnover traded, now with the closing auction is much
higher (Chart 7 and Graph 11)242.
Chart 7. Traded volumes in the last minutes of the trading session. Comparative analysis of both closing systems. (Average percentage of trades and turnover over the total of the trading session).
Trades Turnover tradedAverage prices system (last 5 min.) 2,10% 2,59%Closing auction system (Total market) 2,10% 5,82%Closing auction (New Market) 1,92% 4,91%Source: Sociedad de Bolsas, S.A. (BME Group)
Source: Sociedad de Bolsas, S.A. (BME Group).
0,00%
1,00%
2,00%
3,00%
4,00%
5,00%
6,00%
7,00%
Trades Turnover traded
Graph 11. Traded volumes. Average percentage over the total of the trading session
LAST 5 MINUTES
CLOSING AUCTION
Therefore, it has been shown that, in terms of turnover traded (variable considered as
more “complete” in order to measure the traded volume since it takes into account
information of number of shares as well as traded prices) is much more important with the
242 Please note that data concerning New Market is not available for the old system (through average prices), because the
New Market started on April 14, 2000 and the data collected (chosen sample) starts in a previous date.
THESIS: The Spanish equity market (2000-2014): stylized facts.
José Antonio Pérez Rodríguez (Instituto Universitario de Investigación Ortega y Gasset. Universidad Complutense de Madrid). 208
closing auction system although, as shown, the average percentage of stocks that finds a
traded price in the closing auction is lower243.
4.5. Conclusions of this empirical analysis on the closing auction.
We can conclude that the closing auction is a key period in the development of the
Spanish equity market since it provides a higher efficiency in the fixing of prices at the end of
the trading session. The quantitative empirical results support this conclusion because the
average variations of prices since the last traded price 10 minutes before of the closing (at
17:25 p.m.) compared to the closing price is 0,43% for IBEX 35 constituents (versus 0,45%
with the old system -through average prices-). The dispersion of these variations for these
constituents is 0,46% with both closing systems while the traded volume is much higher with
the closing auction system; that is, in the closing auction period there is a higher volume and
relatively low dispersion. Besides, turnover traded in the closing auction is 6% over total
traded volume of the whole trading session (3,7 percentage points more than with the old
system –through average prices-).
If we want to know what is the IBEX 35 variation (without absolute terms) during
the closing auction, we can observe that, in general, the index would drop 0,02% as an
average (therefore, very closet o zero); this number (-0,02%) is slightly different with respect
to the mean of price variation of IBEX 35 constituents, whose number is 0,01%. We believe
that it is not strictly needed that these two numbers to be the same, since we are measuring
different concepts244; however, it is important to point out that both numbers are so close to
zero since this indicates that not the prices nor IBEX 35 index has an important variation
during the closing auction.
243 Nos parece necesario señalar que para el presente bloque referido a volúmenes se utiliza una muestra representativa de 5
meses (antes y después del 1 de Junio de 2000).
244 Por otra parte, este resultado es lógico ya que, al medir las variaciones del índice, se contemplan las ponderaciones que
los valores tienen en el mismo mientras que al medir variaciones de precios de los valores, todos los valores ponderan por igual.
THESIS: The Spanish equity market (2000-2014): stylized facts.
José Antonio Pérez Rodríguez (Instituto Universitario de Investigación Ortega y Gasset. Universidad Complutense de Madrid). 209
On the other hand, the average of stocks that finds a traded price during the closing
auction is more than 93% for IBEX 35 constituents. That is, the vast majority of IBEX 35
constituents finds a traded price during the closing auction. Besides, for IBEX 35
constituents, 61% of the stocks finds a closing price at the end of the closing auction
(therefore, trading more than 500 shares at the end of the closing auction).
According to this empirical evidence, volatility under the new system with closing
auction is much lower245.
On the other hand, closing auction is a more transparent system of price formation
since the rules of fixing the equilibrium price during an auction are known by all market
participants. Besides, the fact that a random-end at the end of the auction introduces the
possibility of a stabilized price period.
Moreover, the closing auction provides the possibility (strongly demanded by traders
and private portfolio-managers) of buying and/or selling at the close of the market which
means that the arrival of buy and sell orders in the order book for fixing the last single traded
price is facilitated with this new system.
Therefore, the following aspects can summarize the main conclusions of this empirical
analysis:
• The mean of price variations of the last traded prices 10 minutes before (17:25 p.m.)
compared to the closing price is 0,43% for IBEX 35 constituents (versus 0,45% through
the old system –through average prices-). The dispersion of these variations for these
stocks is 0,46% (the same number as to with the old system –through average prices-).
This is a first indicator of lower price-volatility under the new system with closing
auction.
245 It is reminded here that standard deviation is not used (which is standard traditional measure) because we think as more
correct for the purpose of this empirical analysis to use the percentage variations (in abolute terms and in squared differences of stock prices.
THESIS: The Spanish equity market (2000-2014): stylized facts.
José Antonio Pérez Rodríguez (Instituto Universitario de Investigación Ortega y Gasset. Universidad Complutense de Madrid). 210
• Besides, turnover traded in this period is almost 6% over the total traded volume during
the whole trading session (3,7 percentage points more than with the old system –through
average prices-), which indicates a higher traded volume during the closing auction than
in the last 5 minutes of the old system (through average prices). Even though the number
of trades is 2,10% (over the total number of trades of the whole trading session) with both
systems, the turnover traded increased with the new system 124,5%.
• A more detailed analysys for IBEX 35 constituents (taking into account the rest of the
traded volume during the whole trading session) is consistent with the previous result that
volatility of stock prices is lower with the old system with closing auction.
• On the other hand, the average of stocks that find a traded price in the closing auction is
more than 93% for IBEX 35 constituents. That is, the vast majority of IBEX 35
constituents finds a traded price at the end of the closing auction.
• The closing auction provides the possibility (strongly demanded by traders and private
portfolio-managers) of buying and/or selling at the close of the market which means that
the arrival of buy and sell orders in the order book for fixing the last single traded price is
facilitated with this new system.
• More transparency when fixing prices through the new system with closing auction,
because the rules of fixing the equilibrium price during an auction are known by all
market participants.
• The random-end introduces the possibility of a stabilized price period at the end of the
trading session.
4.6. Note about methodology of this empirical analysis on the closing auction.
All used data for this empirical analysis have as a source data collected directly from
the Spanish Stock Exchange Interconnection System (SIBE) concerning the mentioned dates.
Concerning index data, these are collected from the IBEX Index Management Secretariat .

THESIS: The Spanish equity market (2000-2014): stylized facts.
José Antonio Pérez Rodríguez (Instituto Universitario de Investigación Ortega y Gasset. Universidad Complutense de Madrid). 211
On the other hand, the statistical signification of this analysis (56 trading sessions at
least) is enough for the implemented analysis; moreover, given that the analysis is done for
periods before and after June 1, 2000, it can not be expected important differences from this
date and therefore there is no disruption of the time series. In other words, there are no
significant arguments (news, market facts, etc.) to expect such disruption246.
246 It can be considered that the analysis have been done under the ceteris paribus assumtion and it is not found arguments to
reject such assumption.

THESIS: The Spanish equity market (2000-2014): stylized facts.
José Antonio Pérez Rodríguez (Instituto Universitario de Investigación Ortega y Gasset. Universidad Complutense de Madrid). 212

THESIS: The Spanish equity market (2000-2014): stylized facts.
José Antonio Pérez Rodríguez (Instituto Universitario de Investigación Ortega y Gasset. Universidad Complutense de Madrid). 213
Chapter 5
CONCLUSIONS OF THE THESIS

THESIS: The Spanish equity market (2000-2014): stylized facts.
José Antonio Pérez Rodríguez (Instituto Universitario de Investigación Ortega y Gasset. Universidad Complutense de Madrid). 214
THESIS: The Spanish equity market (2000-2014): stylized facts.
José Antonio Pérez Rodríguez (Instituto Universitario de Investigación Ortega y Gasset. Universidad Complutense de Madrid). 215
5. CONCLUSIONS OF THE THESIS.
The evolution of the Spanish equity market during years 2000 to 2014 has been quite
impressive in different aspects.
In fact, the ultimate reason of this evolution is narrowly linked with the market
microstructure of the Spanish equity market carefully explained and detailed in this thesis, so
it can be assured that the main hypothesis of this thesis has been supported. Key elements of
the current Spanish market microstructure as the different segmentation of quoted products,
types of orders247, the introduction (first) of the closing auction and (second) of volatility
auctions, static and dynamic ranges have been completed with (third) automatic orders as well
as a wide variety of products currently quoting in the Spanish equity market.
The aforementioned aspects have led to a market with a high degree of robustness in
terms of liquidity (measured as turnover traded [ex-post liquidity] as well as the observed bid-
ask spreads in the market [ex-ante liquidity]). Indeed, a main conclusion of this work is that
the highly-liquid Spanish equity market of today is a direct consequence of a trading system
based on transparent market rules and trading mechanisms.
One of these key microstructure elements (the introduction of the closing auction in
the Spanish equity market on June 1, 2000) has been carefully contemplated in this thesis. In
fact, Annex I includes a comparative analysis of the use of the closing auction versus the
weighted average price as a useful and effective tool not only to calculate the closing price at
the end of the trading session but also as a key element which reduces volatility at the end of
the trading session, therefore reducing the already small possibilities of price manipulation.
The specificities of the trading characteristics have situated the Spanish equity market
at the core of the European equity markets and as a key reference of national and international
247 See chart 6.1.3. concerning the evolution of different types of orders along years 2002 to 2014.
THESIS: The Spanish equity market (2000-2014): stylized facts.
José Antonio Pérez Rodríguez (Instituto Universitario de Investigación Ortega y Gasset. Universidad Complutense de Madrid). 216
market participants. Not only in terms of liquidity248, the Spanish equity market have also
been consolidated during the last fifteen years as a main financial centre within the European
context.
Concerning liquidity, probably the most important aspect of the market quality along
history, a new synthetic liquidity measure is proposed in this thesis, whose future use and
research is encouraged.
Besides, the wide variety of products249 currently quoting in the Spanish equity market
have completed a complex and long process of diversification of products of the Spanish
equity market which started some decades ago and which, at the date of the end of this thesis,
did not finish yet. This wide variety of products has encouraged market participants to use
new ways of trading with new possibilities which, along time, have reached more
sophisticated patterns of trading, being in harmony with other international equity markets in
Europe.
The qualitative aspects analyzed and explained at the core of this thesis, that is, the
trading mechanisms and all the specific aspects and details of the rules governing the standard
trading session in the Spanish equity market have lead to a consistent, transparent and
effective architecture whose main consequences can be measured from the point of view of
quantitative results in terms of the evolution of trading volumes, different measures of
liquidity and market depth250.
The official index, IBEX 35, considered by domestic and foreign market participants
as the main benchmark of the current Spanish equity market is also carefully analyzed from
the point of view of the current Spanish equity market architecture as a key element or
248 See charts 6.1.8. to 6.1.15. of the Statistical Annex about the ranking of the most traded stocks in Europe (Euro stoxx 50
constituents) and its persistence along years. See also chart 6.1.7. and graph 6.2.3. of the Statistical Annex about bid-ask spreads in the Spanish equity market
249 See charts 6.1.5. and 6.1.6. of the Statistical Annex about traded volumes of warrants, certificates and ETFs along time.
250 See chart 6.1.1. and graph 6.2.1. of the Statistical Annex about traded volumes during the last fifteen years.
THESIS: The Spanish equity market (2000-2014): stylized facts.
José Antonio Pérez Rodríguez (Instituto Universitario de Investigación Ortega y Gasset. Universidad Complutense de Madrid). 217
indicator251. Indeed, IBEX 35 is a main reference in today’s European equity market252. Key
elements as capitalization, free float of adjustments of the index are carefully analyzed in this
work whose main conclusion is that the Spanish index is a reference which has demonstrated
for years to be a key indicator for market participants and portfolios tracking the Spanish
equity market. Besides, the index is only a case in a wide variety of indices as IBEX
MEDIUM CAP, IBEX SMALL CAP of FTSE4GOOD IBEX, also included in this
document.
To summarize, as a consequence of the key trading elements of the Spanish market
microstructure -qualitatively analyzed in this thesis- the Spanish equity market has been
consistently situated along the last fifteen years as a main centre of liquidity within European
equity markets. The existing variety of quoted products of different characteristics, but whose
main solid ground is the current microstructure of the Spanish equity market, has undoubtedly
helped to this process of consolidation in the European arena.
251 The representativeness of this index with respect to the Spanish equity market in terms of capitalization and traded
volume can be checked in chart 6.1.4. of the Statistical Annex.
252 See chart 6.1.2. of the Statistical Annex about performance of European indices along years. See also graph 6.2.2. of the
Statistical Annex about the evolution of this index along time.

THESIS: The Spanish equity market (2000-2014): stylized facts.
José Antonio Pérez Rodríguez (Instituto Universitario de Investigación Ortega y Gasset. Universidad Complutense de Madrid). 218
THESIS: The Spanish equity market (2000-2014): stylized facts.
José Antonio Pérez Rodríguez (Instituto Universitario de Investigación Ortega y Gasset. Universidad Complutense de Madrid). 219
Chapter 6
ANNEX II: STATISTICAL ANNEX

THESIS: The Spanish equity market (2000-2014): stylized facts.
José Antonio Pérez Rodríguez (Instituto Universitario de Investigación Ortega y Gasset. Universidad Complutense de Madrid). 220
THESIS: The Spanish equity market (2000-2014): stylized facts.
José Antonio Pérez Rodríguez (Instituto Universitario de Investigación Ortega y Gasset. Universidad Complutense de Madrid). 221
6. ANNEX II: STATISTICAL ANNEX.
List of charts and graphs:
6.1. CHARTS (page 206).
6.1.1. Evolution of the Spanish equity market. Traded volumes (years 2000 to 2014).
6.1.2. Performance of European indices (%).
6.1.3. Evolution of orders introduced in the Spanish equity market (SIBE). Number of orders
introduced in SIBE, and basic types of orders (years 2002 to 2014).
6.1.4. Representativeness of IBEX 35 index over Total SIBE. Capitalization and turnover
traded (years 2002 to 2014).
6.1.5. Warrants and certificates in SIBE. Traded volumes (years 2003 to 2014).
6.1.6. ETFs in SIBE. Traded volumes (years 2006 to 2014).
6.1.7. Market quality in the Spanish equity market. Average bid-ask spread of IBEX 35
constituents (December 2014 to December 2014).
6.1.8. Ranking of European companies according to turnover traded (€) in year 2007 (Euro
stoxx 50 index constituents). –First 20 companies of the ranking-.
6.1.9. Ranking of European companies according to turnover traded (€) in year 2008 (Euro
stoxx 50 index constituents). –First 20 companies of the ranking-.
6.1.10. Ranking of European companies according to turnover traded (€) in year 2009 (Euro
stoxx 50 index constituents). –First 20 companies of the ranking-.
THESIS: The Spanish equity market (2000-2014): stylized facts.
José Antonio Pérez Rodríguez (Instituto Universitario de Investigación Ortega y Gasset. Universidad Complutense de Madrid). 222
6.1.11. Ranking of European companies according to turnover traded (€) in year 2010 (Euro
stoxx 50 index constituents). –First 20 companies of the ranking-.
6.1.12. Ranking of European companies according to turnover traded (€) in year 2011 (Euro
stoxx 50 index constituents). –First 20 companies of the ranking-.
6.1.13. Ranking of European companies according to turnover traded (€) in year 2012 (Euro
stoxx 50 index constituents). –First 20 companies of the ranking-.
6.1.14. Ranking of European companies according to turnover traded (€) in year 2013 (Euro
stoxx 50 index constituents). –First 20 companies of the ranking-.
6.1.15. Ranking of European companies according to turnover traded (€) in year 2014 (Euro
stoxx 50 index constituents). –First 20 companies of the ranking-.
6.2. GRAPHS (page 213):
6.2.1. Evolution of the Spanish equity market. Traded volumes (years 2000 to 2014).
6.2.2. Evolution of IBEX 35 index (January 14, 1992 to December 31, 2014).
6.2.3. Market quality in the Spanish equity market. Average bid-ask spread of IBEX 35
constituents (December 2014 to December 2014).
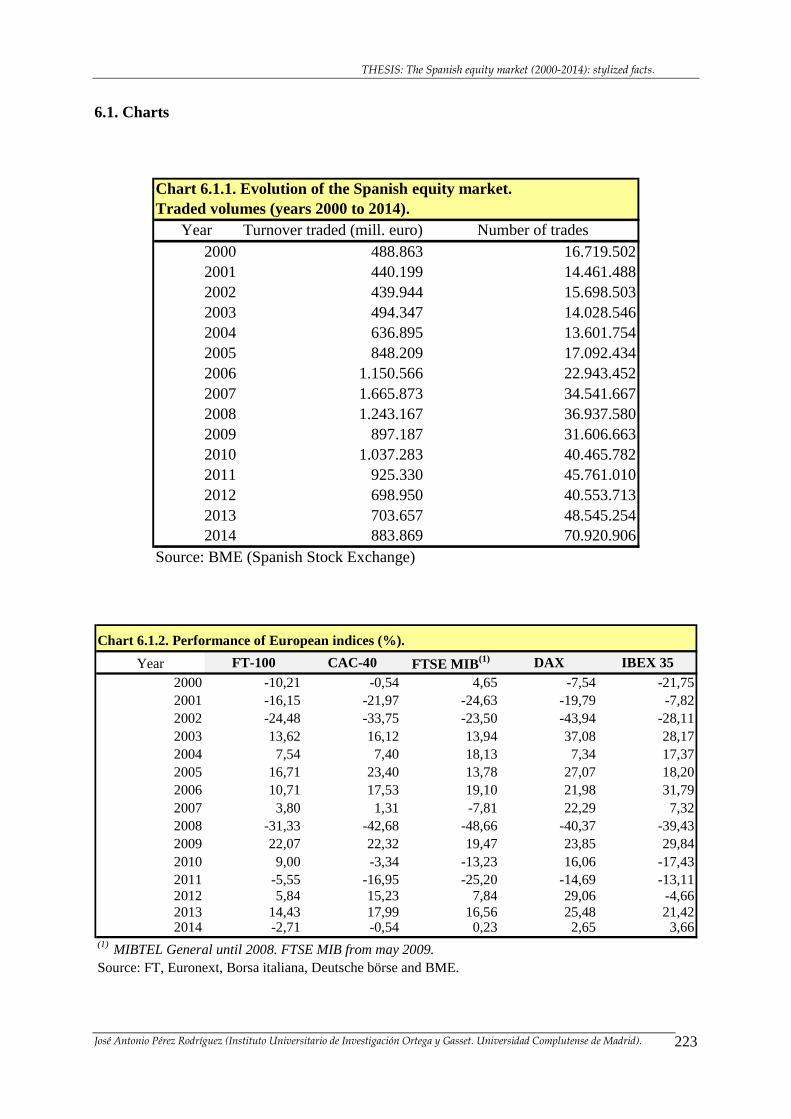
THESIS: The Spanish equity market (2000-2014): stylized facts.
José Antonio Pérez Rodríguez (Instituto Universitario de Investigación Ortega y Gasset. Universidad Complutense de Madrid). 223
6.1. Charts
Chart 6.1.1. Evolution of the Spanish equity market.Traded volumes (years 2000 to 2014).
Year Turnover traded (mill. euro) Number of trades2000 488.863 16.719.5022001 440.199 14.461.4882002 439.944 15.698.5032003 494.347 14.028.5462004 636.895 13.601.7542005 848.209 17.092.4342006 1.150.566 22.943.4522007 1.665.873 34.541.6672008 1.243.167 36.937.5802009 897.187 31.606.6632010 1.037.283 40.465.7822011 925.330 45.761.0102012 698.950 40.553.7132013 703.657 48.545.2542014 883.869 70.920.906
Source: BME (Spanish Stock Exchange)
Year FT-100 CAC-40 FTSE MIB (1) DAX IBEX 352000 -10,21 -0,54 4,65 -7,54 -21,752001 -16,15 -21,97 -24,63 -19,79 -7,822002 -24,48 -33,75 -23,50 -43,94 -28,112003 13,62 16,12 13,94 37,08 28,172004 7,54 7,40 18,13 7,34 17,372005 16,71 23,40 13,78 27,07 18,202006 10,71 17,53 19,10 21,98 31,792007 3,80 1,31 -7,81 22,29 7,322008 -31,33 -42,68 -48,66 -40,37 -39,432009 22,07 22,32 19,47 23,85 29,842010 9,00 -3,34 -13,23 16,06 -17,432011 -5,55 -16,95 -25,20 -14,69 -13,112012 5,84 15,23 7,84 29,06 -4,662013 14,43 17,99 16,56 25,48 21,422014 -2,71 -0,54 0,23 2,65 3,66
Source: FT, Euronext, Borsa italiana, Deutsche börse and BME.
Chart 6.1.2. Performance of European indices (%).
(1) MIBTEL General until 2008. FTSE MIB from may 2009.
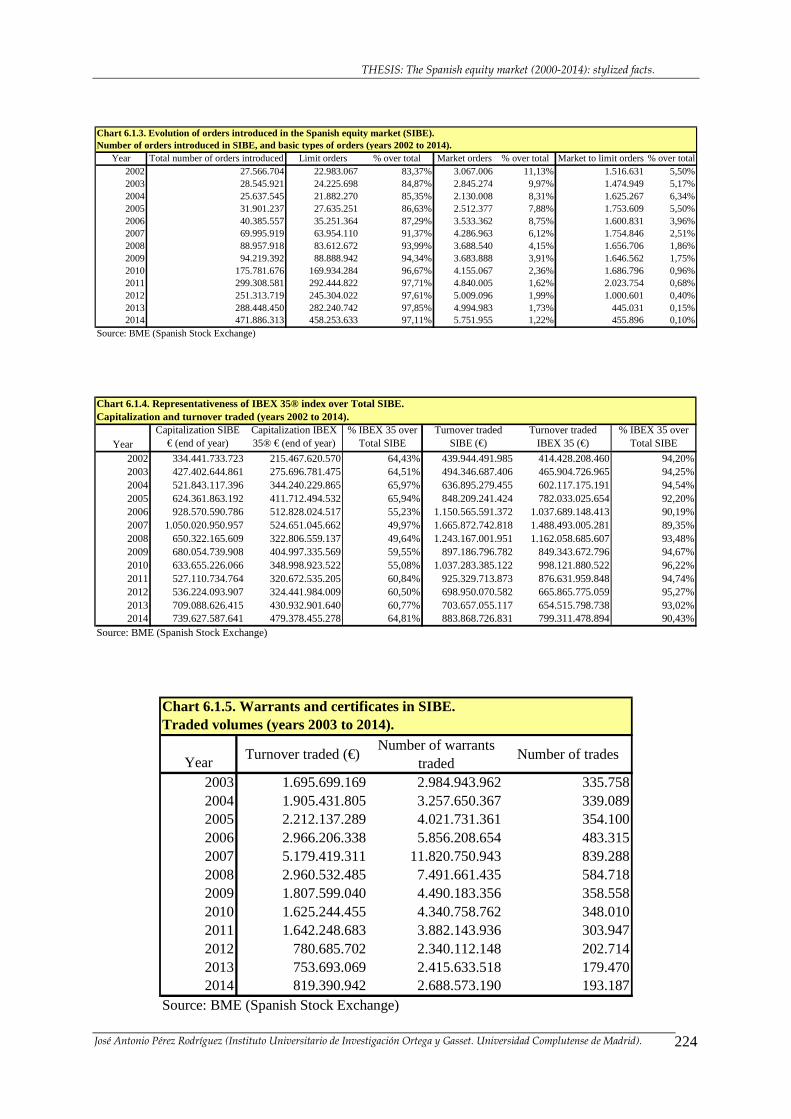
THESIS: The Spanish equity market (2000-2014): stylized facts.
José Antonio Pérez Rodríguez (Instituto Universitario de Investigación Ortega y Gasset. Universidad Complutense de Madrid). 224
Chart 6.1.3. Evolution of orders introduced in the Spanish equity market (SIBE).Number of orders introduced in SIBE, and basic types of orders (years 2002 to 2014).
Year Total number of orders introduced Limit orders % over total Market orders % over total Market to limit orders % over total2002 27.566.704 22.983.067 83,37% 3.067.006 11,13% 1.516.631 5,50%2003 28.545.921 24.225.698 84,87% 2.845.274 9,97% 1.474.949 5,17%2004 25.637.545 21.882.270 85,35% 2.130.008 8,31% 1.625.267 6,34%2005 31.901.237 27.635.251 86,63% 2.512.377 7,88% 1.753.609 5,50%2006 40.385.557 35.251.364 87,29% 3.533.362 8,75% 1.600.831 3,96%2007 69.995.919 63.954.110 91,37% 4.286.963 6,12% 1.754.846 2,51%2008 88.957.918 83.612.672 93,99% 3.688.540 4,15% 1.656.706 1,86%2009 94.219.392 88.888.942 94,34% 3.683.888 3,91% 1.646.562 1,75%2010 175.781.676 169.934.284 96,67% 4.155.067 2,36% 1.686.796 0,96%2011 299.308.581 292.444.822 97,71% 4.840.005 1,62% 2.023.754 0,68%2012 251.313.719 245.304.022 97,61% 5.009.096 1,99% 1.000.601 0,40%2013 288.448.450 282.240.742 97,85% 4.994.983 1,73% 445.031 0,15%2014 471.886.313 458.253.633 97,11% 5.751.955 1,22% 455.896 0,10%
Source: BME (Spanish Stock Exchange)
Chart 6.1.4. Representativeness of IBEX 35® index over Total SIBE.Capitalization and turnover traded (years 2002 to 2014).
YearCapitalization SIBE
€ (end of year)Capitalization IBEX 35® € (end of year)
% IBEX 35 over Total SIBE
Turnover traded SIBE (€)
Turnover traded IBEX 35 (€)
% IBEX 35 over Total SIBE
2002 334.441.733.723 215.467.620.570 64,43% 439.944.491.985 414.428.208.460 94,20%2003 427.402.644.861 275.696.781.475 64,51% 494.346.687.406 465.904.726.965 94,25%2004 521.843.117.396 344.240.229.865 65,97% 636.895.279.455 602.117.175.191 94,54%2005 624.361.863.192 411.712.494.532 65,94% 848.209.241.424 782.033.025.654 92,20%2006 928.570.590.786 512.828.024.517 55,23% 1.150.565.591.372 1.037.689.148.413 90,19%2007 1.050.020.950.957 524.651.045.662 49,97% 1.665.872.742.818 1.488.493.005.281 89,35%2008 650.322.165.609 322.806.559.137 49,64% 1.243.167.001.951 1.162.058.685.607 93,48%2009 680.054.739.908 404.997.335.569 59,55% 897.186.796.782 849.343.672.796 94,67%2010 633.655.226.066 348.998.923.522 55,08% 1.037.283.385.122 998.121.880.522 96,22%2011 527.110.734.764 320.672.535.205 60,84% 925.329.713.873 876.631.959.848 94,74%2012 536.224.093.907 324.441.984.009 60,50% 698.950.070.582 665.865.775.059 95,27%2013 709.088.626.415 430.932.901.640 60,77% 703.657.055.117 654.515.798.738 93,02%2014 739.627.587.641 479.378.455.278 64,81% 883.868.726.831 799.311.478.894 90,43%
Source: BME (Spanish Stock Exchange)
Chart 6.1.5. Warrants and certificates in SIBE.Traded volumes (years 2003 to 2014).
YearTurnover traded (€)
Number of warrants traded
Number of trades
2003 1.695.699.169 2.984.943.962 335.7582004 1.905.431.805 3.257.650.367 339.0892005 2.212.137.289 4.021.731.361 354.1002006 2.966.206.338 5.856.208.654 483.3152007 5.179.419.311 11.820.750.943 839.2882008 2.960.532.485 7.491.661.435 584.7182009 1.807.599.040 4.490.183.356 358.5582010 1.625.244.455 4.340.758.762 348.0102011 1.642.248.683 3.882.143.936 303.9472012 780.685.702 2.340.112.148 202.7142013 753.693.069 2.415.633.518 179.4702014 819.390.942 2.688.573.190 193.187
Source: BME (Spanish Stock Exchange)
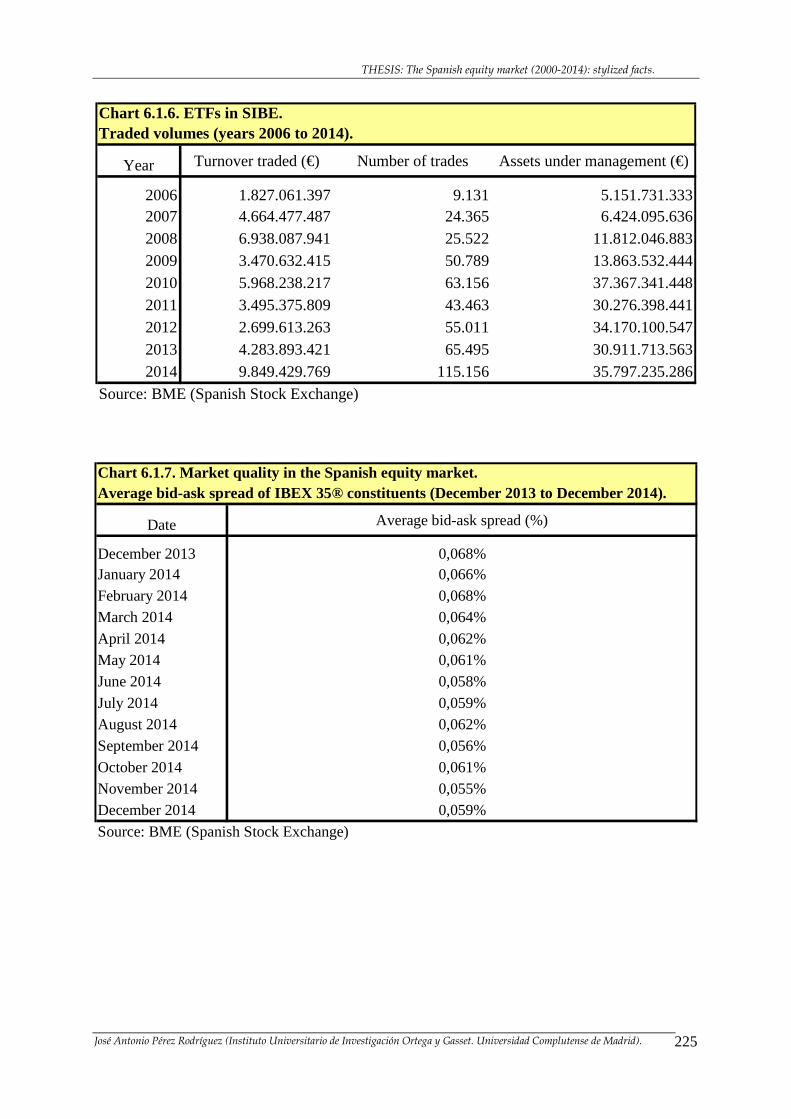
THESIS: The Spanish equity market (2000-2014): stylized facts.
José Antonio Pérez Rodríguez (Instituto Universitario de Investigación Ortega y Gasset. Universidad Complutense de Madrid). 225
Chart 6.1.6. ETFs in SIBE.Traded volumes (years 2006 to 2014).
Year Turnover traded (€) Number of trades Assets under management (€)
2006 1.827.061.397 9.131 5.151.731.3332007 4.664.477.487 24.365 6.424.095.6362008 6.938.087.941 25.522 11.812.046.8832009 3.470.632.415 50.789 13.863.532.4442010 5.968.238.217 63.156 37.367.341.4482011 3.495.375.809 43.463 30.276.398.4412012 2.699.613.263 55.011 34.170.100.5472013 4.283.893.421 65.495 30.911.713.5632014 9.849.429.769 115.156 35.797.235.286
Source: BME (Spanish Stock Exchange)
Chart 6.1.7. Market quality in the Spanish equity market.Average bid-ask spread of IBEX 35® constituents (December 2013 to December 2014).
Date Average bid-ask spread (%)
December 2013 0,068%January 2014 0,066%February 2014 0,068%March 2014 0,064%
April 2014 0,062%May 2014 0,061%June 2014 0,058%
July 2014 0,059%August 2014 0,062%September 2014 0,056%
October 2014 0,061%November 2014 0,055%December 2014 0,059%
Source: BME (Spanish Stock Exchange)
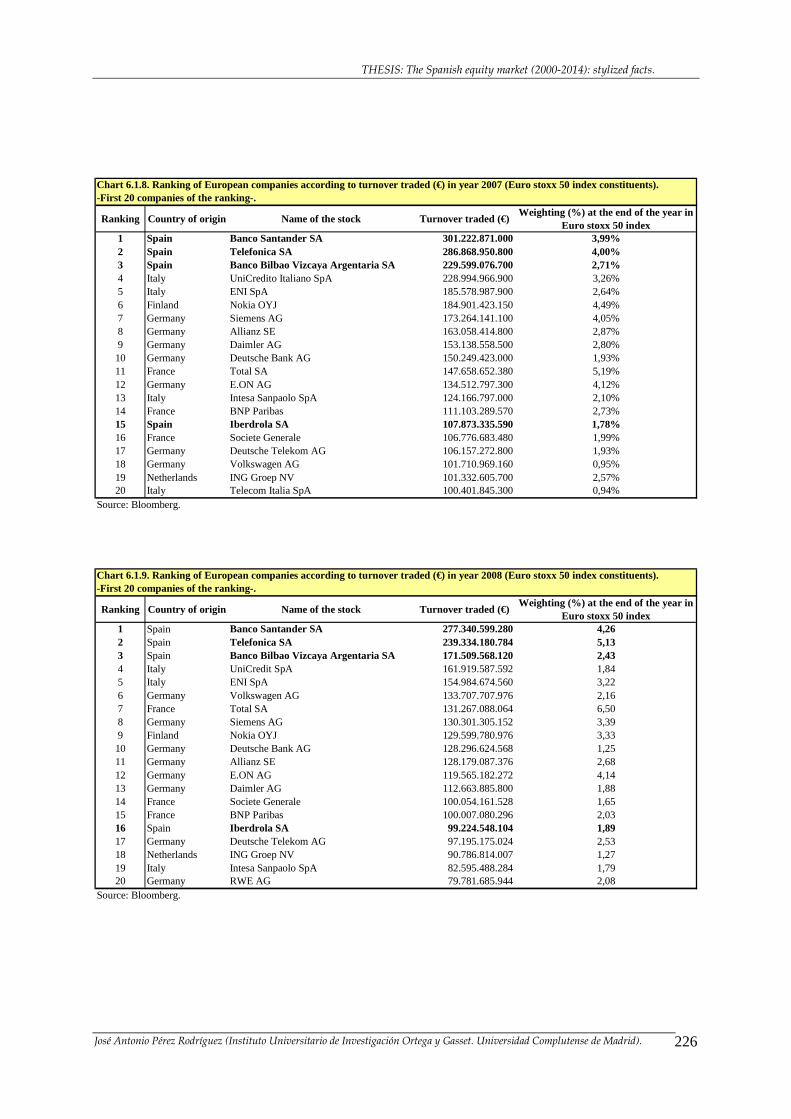
THESIS: The Spanish equity market (2000-2014): stylized facts.
José Antonio Pérez Rodríguez (Instituto Universitario de Investigación Ortega y Gasset. Universidad Complutense de Madrid). 226
Chart 6.1.8. Ranking of European companies according to turnover traded (€) in year 2007 (Euro stoxx 50 index constituents).-First 20 companies of the ranking-.
Ranking Country of origin Name of the stock Turnover traded (€)Weighting (%) at the end of the year in
Euro stoxx 50 index1 Spain Banco Santander SA 301.222.871.000 3,99%2 Spain Telefonica SA 286.868.950.800 4,00%3 Spain Banco Bilbao Vizcaya Argentaria SA 229.599.076.700 2,71%4 Italy UniCredito Italiano SpA 228.994.966.900 3,26%5 Italy ENI SpA 185.578.987.900 2,64%6 Finland Nokia OYJ 184.901.423.150 4,49%7 Germany Siemens AG 173.264.141.100 4,05%8 Germany Allianz SE 163.058.414.800 2,87%9 Germany Daimler AG 153.138.558.500 2,80%10 Germany Deutsche Bank AG 150.249.423.000 1,93%11 France Total SA 147.658.652.380 5,19%12 Germany E.ON AG 134.512.797.300 4,12%13 Italy Intesa Sanpaolo SpA 124.166.797.000 2,10%14 France BNP Paribas 111.103.289.570 2,73%15 Spain Iberdrola SA 107.873.335.590 1,78%16 France Societe Generale 106.776.683.480 1,99%17 Germany Deutsche Telekom AG 106.157.272.800 1,93%18 Germany Volkswagen AG 101.710.969.160 0,95%19 Netherlands ING Groep NV 101.332.605.700 2,57%20 Italy Telecom Italia SpA 100.401.845.300 0,94%
Source: Bloomberg.
Chart 6.1.9. Ranking of European companies according to turnover traded (€) in year 2008 (Euro stoxx 50 index constituents).-First 20 companies of the ranking-.
Ranking Country of origin Name of the stock Turnover traded (€)Weighting (%) at the end of the year in
Euro stoxx 50 index1 Spain Banco Santander SA 277.340.599.280 4,262 Spain Telefonica SA 239.334.180.784 5,133 Spain Banco Bilbao Vizcaya Argentaria SA 171.509.568.120 2,434 Italy UniCredit SpA 161.919.587.592 1,845 Italy ENI SpA 154.984.674.560 3,226 Germany Volkswagen AG 133.707.707.976 2,167 France Total SA 131.267.088.064 6,508 Germany Siemens AG 130.301.305.152 3,399 Finland Nokia OYJ 129.599.780.976 3,3310 Germany Deutsche Bank AG 128.296.624.568 1,2511 Germany Allianz SE 128.179.087.376 2,6812 Germany E.ON AG 119.565.182.272 4,1413 Germany Daimler AG 112.663.885.800 1,8814 France Societe Generale 100.054.161.528 1,6515 France BNP Paribas 100.007.080.296 2,0316 Spain Iberdrola SA 99.224.548.104 1,8917 Germany Deutsche Telekom AG 97.195.175.024 2,5318 Netherlands ING Groep NV 90.786.814.007 1,2719 Italy Intesa Sanpaolo SpA 82.595.488.284 1,7920 Germany RWE AG 79.781.685.944 2,08
Source: Bloomberg.
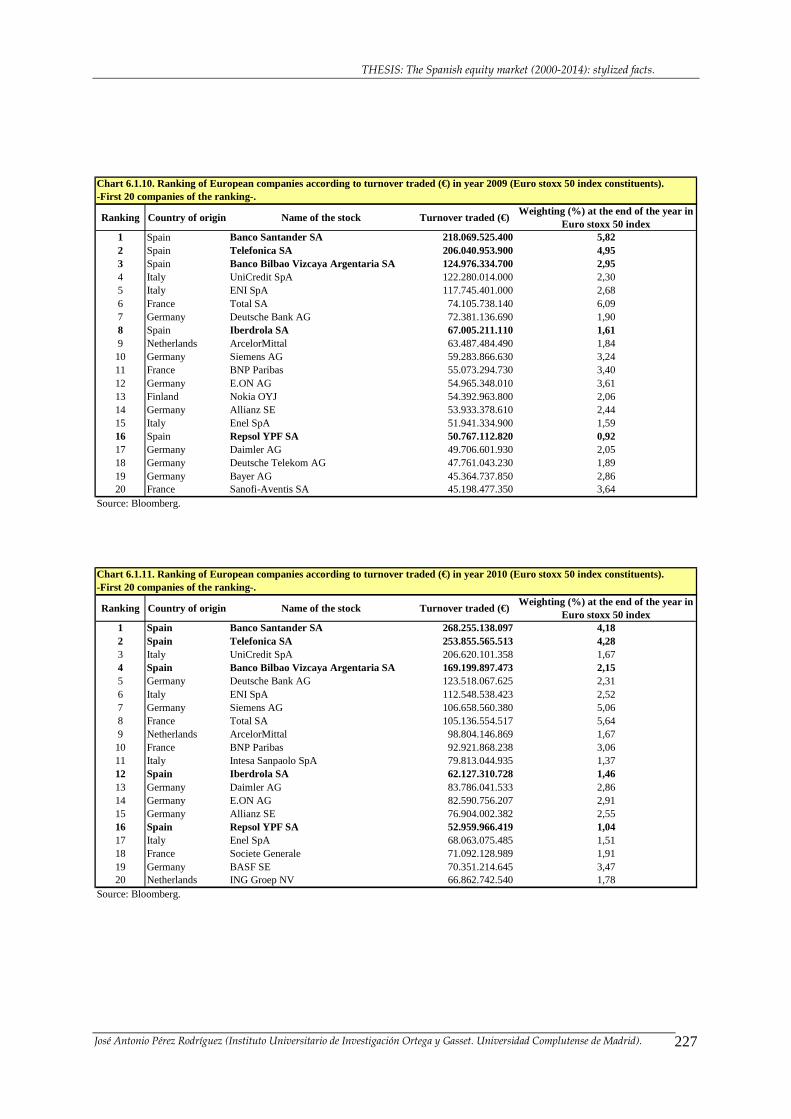
THESIS: The Spanish equity market (2000-2014): stylized facts.
José Antonio Pérez Rodríguez (Instituto Universitario de Investigación Ortega y Gasset. Universidad Complutense de Madrid). 227
Chart 6.1.10. Ranking of European companies according to turnover traded (€) in year 2009 (Euro stoxx 50 index constituents).-First 20 companies of the ranking-.
Ranking Country of origin Name of the stock Turnover traded (€)Weighting (%) at the end of the year in
Euro stoxx 50 index1 Spain Banco Santander SA 218.069.525.400 5,822 Spain Telefonica SA 206.040.953.900 4,953 Spain Banco Bilbao Vizcaya Argentaria SA 124.976.334.700 2,954 Italy UniCredit SpA 122.280.014.000 2,305 Italy ENI SpA 117.745.401.000 2,686 France Total SA 74.105.738.140 6,097 Germany Deutsche Bank AG 72.381.136.690 1,908 Spain Iberdrola SA 67.005.211.110 1,619 Netherlands ArcelorMittal 63.487.484.490 1,8410 Germany Siemens AG 59.283.866.630 3,2411 France BNP Paribas 55.073.294.730 3,4012 Germany E.ON AG 54.965.348.010 3,6113 Finland Nokia OYJ 54.392.963.800 2,0614 Germany Allianz SE 53.933.378.610 2,4415 Italy Enel SpA 51.941.334.900 1,5916 Spain Repsol YPF SA 50.767.112.820 0,9217 Germany Daimler AG 49.706.601.930 2,0518 Germany Deutsche Telekom AG 47.761.043.230 1,8919 Germany Bayer AG 45.364.737.850 2,8620 France Sanofi-Aventis SA 45.198.477.350 3,64
Source: Bloomberg.
Chart 6.1.11. Ranking of European companies according to turnover traded (€) in year 2010 (Euro stoxx 50 index constituents).-First 20 companies of the ranking-.
Ranking Country of origin Name of the stock Turnover traded (€)Weighting (%) at the end of the year in
Euro stoxx 50 index1 Spain Banco Santander SA 268.255.138.097 4,182 Spain Telefonica SA 253.855.565.513 4,283 Italy UniCredit SpA 206.620.101.358 1,674 Spain Banco Bilbao Vizcaya Argentaria SA 169.199.897.473 2,155 Germany Deutsche Bank AG 123.518.067.625 2,316 Italy ENI SpA 112.548.538.423 2,527 Germany Siemens AG 106.658.560.380 5,068 France Total SA 105.136.554.517 5,649 Netherlands ArcelorMittal 98.804.146.869 1,6710 France BNP Paribas 92.921.868.238 3,0611 Italy Intesa Sanpaolo SpA 79.813.044.935 1,3712 Spain Iberdrola SA 62.127.310.728 1,4613 Germany Daimler AG 83.786.041.533 2,8614 Germany E.ON AG 82.590.756.207 2,9115 Germany Allianz SE 76.904.002.382 2,5516 Spain Repsol YPF SA 52.959.966.419 1,0417 Italy Enel SpA 68.063.075.485 1,5118 France Societe Generale 71.092.128.989 1,9119 Germany BASF SE 70.351.214.645 3,4720 Netherlands ING Groep NV 66.862.742.540 1,78
Source: Bloomberg.
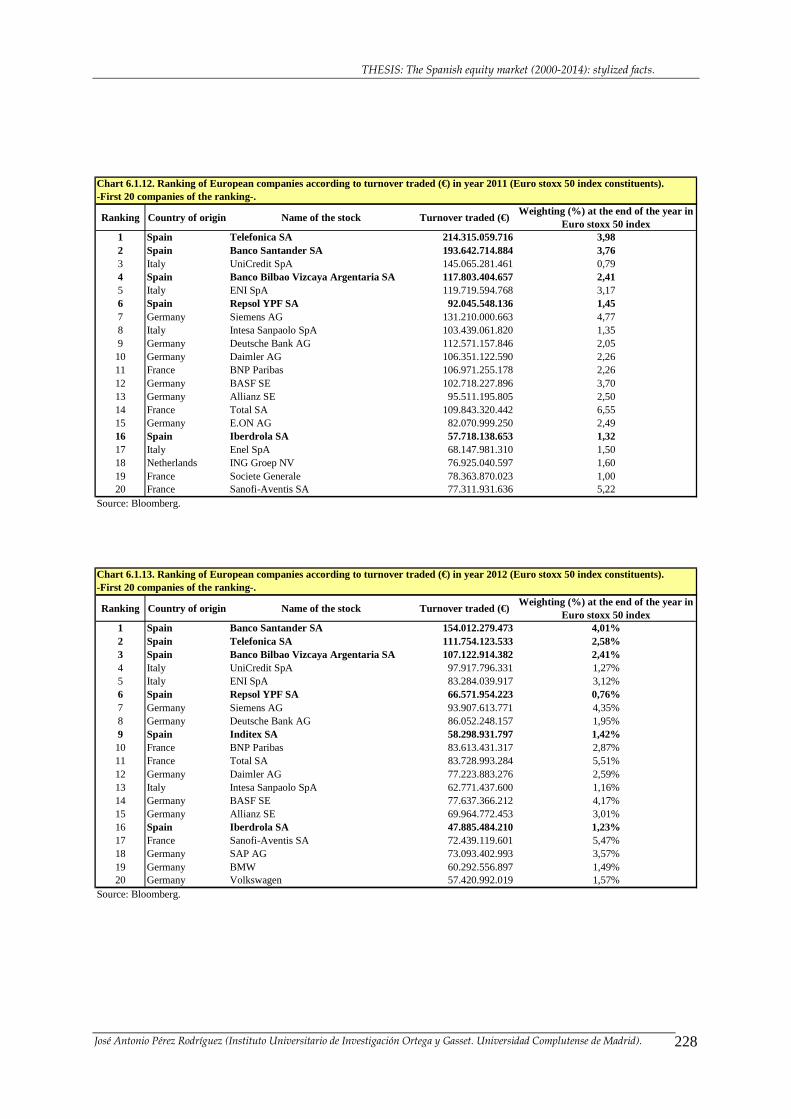
THESIS: The Spanish equity market (2000-2014): stylized facts.
José Antonio Pérez Rodríguez (Instituto Universitario de Investigación Ortega y Gasset. Universidad Complutense de Madrid). 228
Chart 6.1.12. Ranking of European companies according to turnover traded (€) in year 2011 (Euro stoxx 50 index constituents).-First 20 companies of the ranking-.
Ranking Country of origin Name of the stock Turnover traded (€)Weighting (%) at the end of the year in
Euro stoxx 50 index1 Spain Telefonica SA 214.315.059.716 3,982 Spain Banco Santander SA 193.642.714.884 3,763 Italy UniCredit SpA 145.065.281.461 0,794 Spain Banco Bilbao Vizcaya Argentaria SA 117.803.404.657 2,415 Italy ENI SpA 119.719.594.768 3,176 Spain Repsol YPF SA 92.045.548.136 1,457 Germany Siemens AG 131.210.000.663 4,778 Italy Intesa Sanpaolo SpA 103.439.061.820 1,359 Germany Deutsche Bank AG 112.571.157.846 2,0510 Germany Daimler AG 106.351.122.590 2,2611 France BNP Paribas 106.971.255.178 2,2612 Germany BASF SE 102.718.227.896 3,7013 Germany Allianz SE 95.511.195.805 2,5014 France Total SA 109.843.320.442 6,5515 Germany E.ON AG 82.070.999.250 2,4916 Spain Iberdrola SA 57.718.138.653 1,3217 Italy Enel SpA 68.147.981.310 1,5018 Netherlands ING Groep NV 76.925.040.597 1,6019 France Societe Generale 78.363.870.023 1,0020 France Sanofi-Aventis SA 77.311.931.636 5,22
Source: Bloomberg.
Chart 6.1.13. Ranking of European companies according to turnover traded (€) in year 2012 (Euro stoxx 50 index constituents).-First 20 companies of the ranking-.
Ranking Country of origin Name of the stock Turnover traded (€)Weighting (%) at the end of the year in
Euro stoxx 50 index1 Spain Banco Santander SA 154.012.279.473 4,01%2 Spain Telefonica SA 111.754.123.533 2,58%3 Spain Banco Bilbao Vizcaya Argentaria SA 107.122.914.382 2,41%4 Italy UniCredit SpA 97.917.796.331 1,27%5 Italy ENI SpA 83.284.039.917 3,12%6 Spain Repsol YPF SA 66.571.954.223 0,76%7 Germany Siemens AG 93.907.613.771 4,35%8 Germany Deutsche Bank AG 86.052.248.157 1,95%9 Spain Inditex SA 58.298.931.797 1,42%10 France BNP Paribas 83.613.431.317 2,87%11 France Total SA 83.728.993.284 5,51%12 Germany Daimler AG 77.223.883.276 2,59%13 Italy Intesa Sanpaolo SpA 62.771.437.600 1,16%14 Germany BASF SE 77.637.366.212 4,17%15 Germany Allianz SE 69.964.772.453 3,01%16 Spain Iberdrola SA 47.885.484.210 1,23%17 France Sanofi-Aventis SA 72.439.119.601 5,47%18 Germany SAP AG 73.093.402.993 3,57%19 Germany BMW 60.292.556.897 1,49%20 Germany Volkswagen 57.420.992.019 1,57%
Source: Bloomberg.
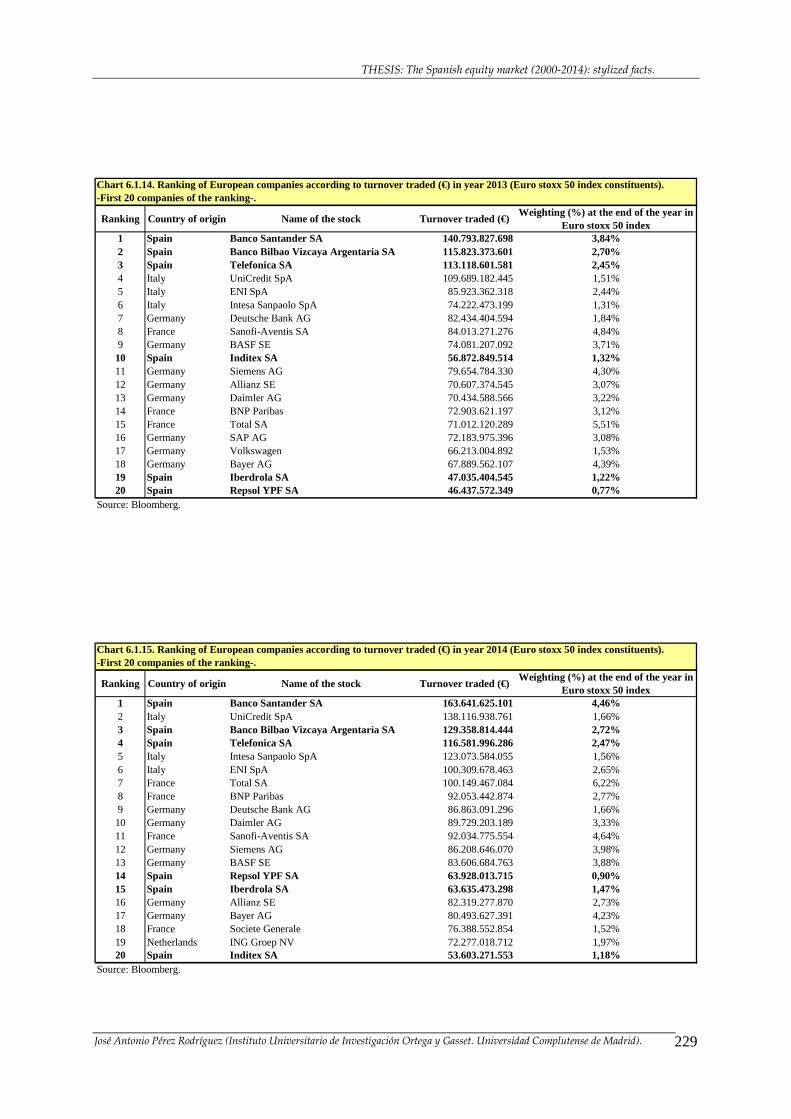
THESIS: The Spanish equity market (2000-2014): stylized facts.
José Antonio Pérez Rodríguez (Instituto Universitario de Investigación Ortega y Gasset. Universidad Complutense de Madrid). 229
Chart 6.1.14. Ranking of European companies according to turnover traded (€) in year 2013 (Euro stoxx 50 index constituents).-First 20 companies of the ranking-.
Ranking Country of origin Name of the stock Turnover traded (€)Weighting (%) at the end of the year in
Euro stoxx 50 index1 Spain Banco Santander SA 140.793.827.698 3,84%2 Spain Banco Bilbao Vizcaya Argentaria SA 115.823.373.601 2,70%3 Spain Telefonica SA 113.118.601.581 2,45%4 Italy UniCredit SpA 109.689.182.445 1,51%5 Italy ENI SpA 85.923.362.318 2,44%6 Italy Intesa Sanpaolo SpA 74.222.473.199 1,31%7 Germany Deutsche Bank AG 82.434.404.594 1,84%8 France Sanofi-Aventis SA 84.013.271.276 4,84%9 Germany BASF SE 74.081.207.092 3,71%10 Spain Inditex SA 56.872.849.514 1,32%11 Germany Siemens AG 79.654.784.330 4,30%12 Germany Allianz SE 70.607.374.545 3,07%13 Germany Daimler AG 70.434.588.566 3,22%14 France BNP Paribas 72.903.621.197 3,12%15 France Total SA 71.012.120.289 5,51%16 Germany SAP AG 72.183.975.396 3,08%17 Germany Volkswagen 66.213.004.892 1,53%18 Germany Bayer AG 67.889.562.107 4,39%19 Spain Iberdrola SA 47.035.404.545 1,22%20 Spain Repsol YPF SA 46.437.572.349 0,77%
Source: Bloomberg.
Chart 6.1.15. Ranking of European companies according to turnover traded (€) in year 2014 (Euro stoxx 50 index constituents).-First 20 companies of the ranking-.
Ranking Country of origin Name of the stock Turnover traded (€)Weighting (%) at the end of the year in
Euro stoxx 50 index1 Spain Banco Santander SA 163.641.625.101 4,46%2 Italy UniCredit SpA 138.116.938.761 1,66%3 Spain Banco Bilbao Vizcaya Argentaria SA 129.358.814.444 2,72%4 Spain Telefonica SA 116.581.996.286 2,47%5 Italy Intesa Sanpaolo SpA 123.073.584.055 1,56%6 Italy ENI SpA 100.309.678.463 2,65%7 France Total SA 100.149.467.084 6,22%8 France BNP Paribas 92.053.442.874 2,77%9 Germany Deutsche Bank AG 86.863.091.296 1,66%10 Germany Daimler AG 89.729.203.189 3,33%11 France Sanofi-Aventis SA 92.034.775.554 4,64%12 Germany Siemens AG 86.208.646.070 3,98%13 Germany BASF SE 83.606.684.763 3,88%14 Spain Repsol YPF SA 63.928.013.715 0,90%15 Spain Iberdrola SA 63.635.473.298 1,47%16 Germany Allianz SE 82.319.277.870 2,73%17 Germany Bayer AG 80.493.627.391 4,23%18 France Societe Generale 76.388.552.854 1,52%19 Netherlands ING Groep NV 72.277.018.712 1,97%20 Spain Inditex SA 53.603.271.553 1,18%
Source: Bloomberg.
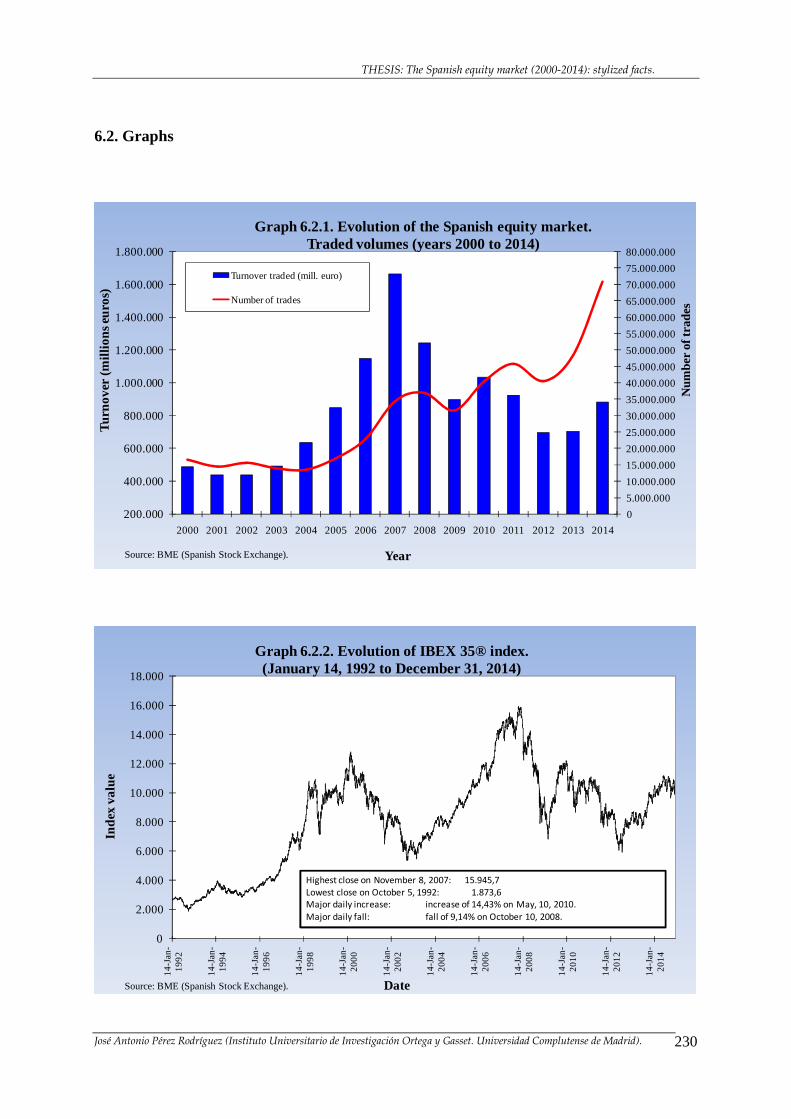
THESIS: The Spanish equity market (2000-2014): stylized facts.
José Antonio Pérez Rodríguez (Instituto Universitario de Investigación Ortega y Gasset. Universidad Complutense de Madrid). 230
6.2. Graphs
0
5.000.000
10.000.000
15.000.000
20.000.000
25.000.000
30.000.000
35.000.000
40.000.000
45.000.000
50.000.000
55.000.000
60.000.000
65.000.000
70.000.000
75.000.000
80.000.000
200.000
400.000
600.000
800.000
1.000.000
1.200.000
1.400.000
1.600.000
1.800.000
2000 2001 2002 2003 2004 2005 2006 2007 2008 2009 2010 2011 2012 2013 2014
Num
ber o
f tra
des
Turn
ove
r (m
illio
ns e
uro
s)
Year
Graph 6.2.1. Evolution of the Spanish equity market.Traded volumes (years 2000 to 2014)
Turnover traded (mill. euro)
Number of trades
Source: BME (Spanish Stock Exchange).
0
2.000
4.000
6.000
8.000
10.000
12.000
14.000
16.000
18.000
14
-Ja
n-
19
92
14-
Jan-
19
94
14
-Ja
n-
19
96
14-
Jan-
19
98
14-
Jan-
20
00
14
-Ja
n-
20
02
14-
Jan-
20
04
14
-Ja
n-
20
06
14-
Jan-
20
08
14-
Jan-
20
10
14
-Ja
n-
20
12
14-
Jan-
20
14
Inde
x va
lue
Date
Graph 6.2.2. Evolution of IBEX 35® index.(January 14, 1992 to December 31, 2014)
Source: BME (Spanish Stock Exchange).
Highest close on November 8, 2007: 15.945,7
Lowest close on October 5, 1992: 1.873,6
Major daily increase: increase of 14,43% on May, 10, 2010.
Major daily fall: fall of 9,14% on October 10, 2008.
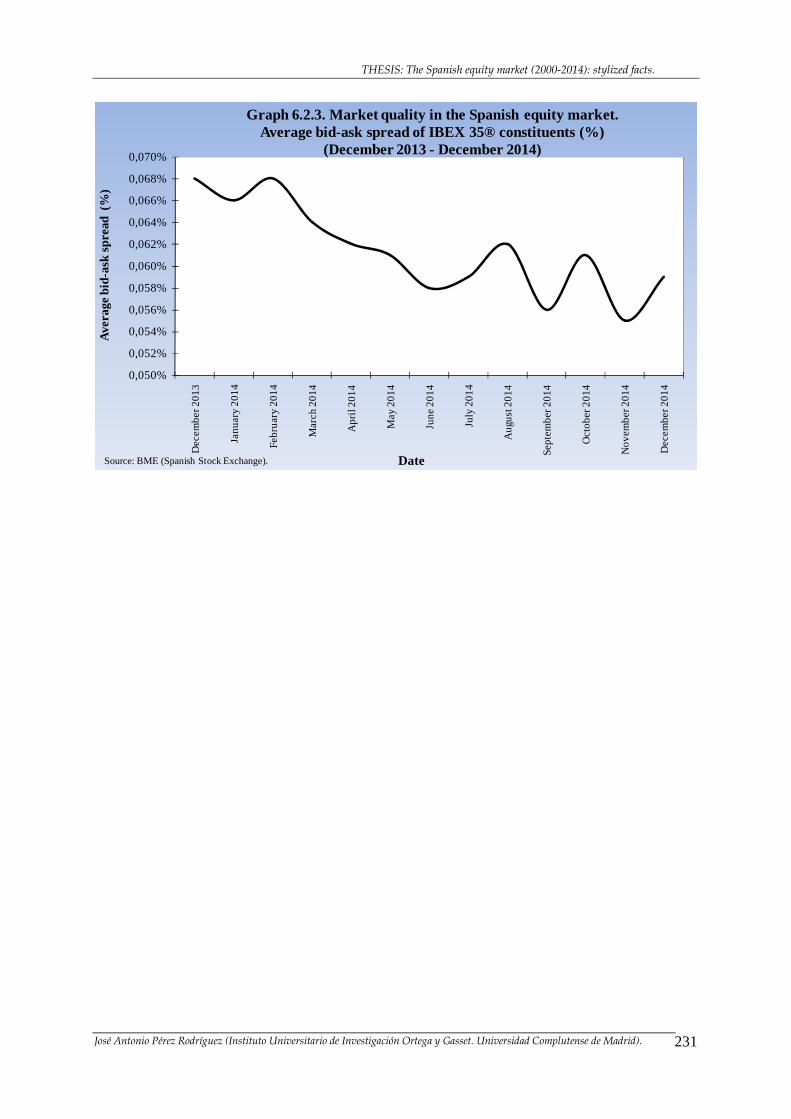
THESIS: The Spanish equity market (2000-2014): stylized facts.
José Antonio Pérez Rodríguez (Instituto Universitario de Investigación Ortega y Gasset. Universidad Complutense de Madrid). 231
0,050%
0,052%
0,054%
0,056%
0,058%
0,060%
0,062%
0,064%
0,066%
0,068%
0,070%
De
cem
be
r 20
13
Jan
ua
ry 2
01
4
Fe
bru
ary
20
14
Ma
rch
20
14
Ap
ril 2
01
4
Ma
y 2
01
4
Jun
e 20
14
July
20
14
Au
gust
20
14
Se
pte
mb
er 20
14
Oct
ob
er 2
01
4
No
vem
be
r 20
14
De
cem
be
r 20
14
Ave
rage
bid
-ask
spr
ead
(%
)
Date
Graph 6.2.3. Market quality in the Spanish equity market.Average bid-ask spread of IBEX 35® constituents (%)
(December 2013 - December 2014)
Source: BME (Spanish Stock Exchange).

THESIS: The Spanish equity market (2000-2014): stylized facts.
José Antonio Pérez Rodríguez (Instituto Universitario de Investigación Ortega y Gasset. Universidad Complutense de Madrid). 232

THESIS: The Spanish equity market (2000-2014): stylized facts.
José Antonio Pérez Rodríguez (Instituto Universitario de Investigación Ortega y Gasset. Universidad Complutense de Madrid). 233
Chapter 7
BIBLIOGRAPHY

THESIS: The Spanish equity market (2000-2014): stylized facts.
José Antonio Pérez Rodríguez (Instituto Universitario de Investigación Ortega y Gasset. Universidad Complutense de Madrid). 234
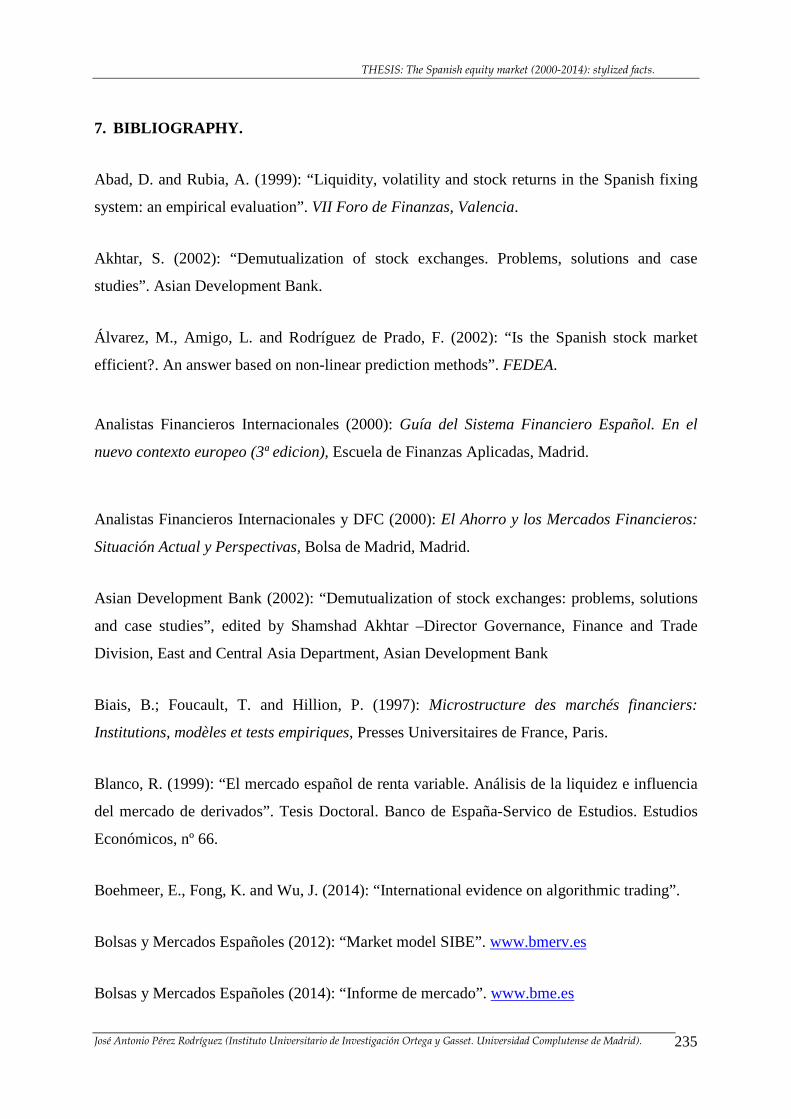
THESIS: The Spanish equity market (2000-2014): stylized facts.
José Antonio Pérez Rodríguez (Instituto Universitario de Investigación Ortega y Gasset. Universidad Complutense de Madrid). 235
7. BIBLIOGRAPHY.
Abad, D. and Rubia, A. (1999): “Liquidity, volatility and stock returns in the Spanish fixing
system: an empirical evaluation”. VII Foro de Finanzas, Valencia.
Akhtar, S. (2002): “Demutualization of stock exchanges. Problems, solutions and case
studies”. Asian Development Bank.
Álvarez, M., Amigo, L. and Rodríguez de Prado, F. (2002): “Is the Spanish stock market
efficient?. An answer based on non-linear prediction methods”. FEDEA.
Analistas Financieros Internacionales (2000): Guía del Sistema Financiero Español. En el
nuevo contexto europeo (3ª edicion), Escuela de Finanzas Aplicadas, Madrid.
Analistas Financieros Internacionales y DFC (2000): El Ahorro y los Mercados Financieros:
Situación Actual y Perspectivas, Bolsa de Madrid, Madrid.
Asian Development Bank (2002): “Demutualization of stock exchanges: problems, solutions
and case studies”, edited by Shamshad Akhtar –Director Governance, Finance and Trade
Division, East and Central Asia Department, Asian Development Bank
Biais, B.; Foucault, T. and Hillion, P. (1997): Microstructure des marchés financiers:
Institutions, modèles et tests empiriques, Presses Universitaires de France, Paris.
Blanco, R. (1999): “El mercado español de renta variable. Análisis de la liquidez e influencia
del mercado de derivados”. Tesis Doctoral. Banco de España-Servico de Estudios. Estudios
Económicos, nº 66.
Boehmeer, E., Fong, K. and Wu, J. (2014): “International evidence on algorithmic trading”.
Bolsas y Mercados Españoles (2012): “Market model SIBE”. www.bmerv.es
Bolsas y Mercados Españoles (2014): “Informe de mercado”. www.bme.es
THESIS: The Spanish equity market (2000-2014): stylized facts.
José Antonio Pérez Rodríguez (Instituto Universitario de Investigación Ortega y Gasset. Universidad Complutense de Madrid). 236
Borsa Italiana (2014): Rules of the Markets organised and managed by Borsa Italiana S.p.A.
(effective from 6 October 2014). www.borsaitaliana.it
Brusco, S., Manzano, C. and Tapia, M. (2003): “Price discovery in the pre-opening period.
Theory and evidence from the Madrid Stock Exchange”.
Calzada, B. (2006): El buen gobierno en España: un análisis crítico. Instituto de Estudios
Económicos.
Campbell, J.Y.; Lo, A.W. and Mackinlay, A.C. (1997): The Econometrics of Financial
Markets, Princeton University Press, Princeton, New Jersey, USA.
Chakraborty, A., Pagano, M.S. and Schwartz, R.A. (2012): “Order revelation and market
openings”. Journal of Financial Markets. vol. 15. n. 2. May 2012. p.127-150.
Chesini, G. (2007): “From demutualization to globalization: new challenges for stock
exchanges”. International Review of Business Research Papers.
Comerton-Forde, C. Rydge, J. (2004): A review of stock market microstructure: a study of
market microstructure in eighteen of the world's largest and most influential stock markets.
Sydney. SIRCA.
Cumming, D., Johan, S. and Li, D. (2010): “Exchange trading rules and stock market
liquidity”.
Cumming, D., Zhan, F. and Aitken, M. (2013): “High frequency trading and end-of-day
dislocation”.
Deutsche Börse Group (2014): EU-regulated market: General Standard for shares and Prime
Standard for shares. Open Market: Entry Standard for shares (Main prerequisites for
admission or inclusion). www.deutsche-boerse.com
Deutsche Börse Group (2014): Xetra® Release 14.0. Market Model Equities. www.deutsche-
boerse.com
THESIS: The Spanish equity market (2000-2014): stylized facts.
José Antonio Pérez Rodríguez (Instituto Universitario de Investigación Ortega y Gasset. Universidad Complutense de Madrid). 237
Dorodnykh, E. (2013): “What drives stock exchange integration?”. International Journal of
Economic Sciences and Applied Research 6 (2): 47-79
Easley, D. and O'Hara, M. (2010): “Microstructure and ambiguity”. The Journal of Finance
(vol. LXV. Nº 5. October 2010).
Euronext Rule Book (2014): harmonised rules [issue date: 6 october 2014].
www.euronext.com
European Securities and Markets Authority (2014): Final report. ESMAs technical advice to
the Commission on MiFID II and MiFIR.
Economist, The (2001): “Global equity markets survey”. The Economist. May 2001.
Federation of European Securities Exchanges (2002): Share ownership structure in Europe,
prepared by Mr. Domingo García Coto (Madrid Stock Exchange) on behalf of the Economics
and Statistics Subcommittee of the Federation of European Securities Exchanges (FESE).
Federation of European Securities Exchanges (2014): A Blueprint for European Capital
Markets: How to Unleash Markets' Potential to Finance Dynamic and Sustainable Growth.
Fernández, P. e Yzaguirre, J. (1996): Ibex 35. Análisis e Investigaciones, Ediciones
Internacionales Universitarias, Barcelona.
Fioravanti, S.F. and Gentile, M. (2011): “The impact of market fragmentation on European
stock exchanges”: Commissione Nazionale per la Socità e la Borsa.
FTSE 4GOOD IBEX index Official Factsheet, at www.ftse.com/ftse4good
García Coto, D. (2001): Tesis Doctoral: “Demanda y oferta de valores en España. El futuro
del mercado bursátil”. Departamento de Financiación e Investigación Comercial. Universidad
Autónoma de Madrid.
Giordano, F. (2002): “Cross-border trading in financial securities in Europe: the role of centra
counterparty”. European Capital Markets Institute.
THESIS: The Spanish equity market (2000-2014): stylized facts.
José Antonio Pérez Rodríguez (Instituto Universitario de Investigación Ortega y Gasset. Universidad Complutense de Madrid). 238
Glosten, L. And Milgrom, P. (1985): “Bid, ask and transaction prices in a specialist market with
heterogeneously informed traders”, Journal of Financial Economics, 14, 71-100.
Gomber, P. (2013): Competition/fragmentation in equities markets: a literature survey.
Frankfurt: Goethe University (SAFE Working Paper;5).
Hanousek, J., Kocenda, E. and Novotný, J. (2013): “Price jumps on European stock markets”.
University of Michigan: The William Davidson Institute (working paper; 1059).
Hillion, P. and Suominen, M. (1998): “Deadline Effect on an Order Driven Market: An
Analysis of the Last Trading Minute on the Paris Bourse”. Global Equity Markets
Conference, Paris.
Jorgensen, B. N., Kavajecz and Swisser, S.N. (2011): “The historical evolution of financial
exchanges”.
Kalay, A., Wei, L., and A. Wohl (2002): “Continuous trading or call auctions: Revealed
preference of investors at the Tel Aviv Stock Exchange”, Journal of Finance 57, 523-542.
Lequeux, P. (1999): Financial Markets Tick by Tick. Insights in Financial Markets
Microstructure, John Wiley & Sons Ltd. Baffins Lane, Chichester, England.
London Stock Exchange (2014). MIT201-Guide to the Trading System. Issue 12.1 (effective
from 17 november 2014). www.londonstockexchange.com
London Stock Exchange Group (2014): “Main Market-key eligibility criteria”.
www.londonstockexchange.com
Lucarelli, C., Molyneux, P. and Vitali, S. (2011): “Where has all the trading gone?: a network
approach to European stock exchanges and alternative trading venue”.
Madhavan, A. (1992) : “Trading mechanisms in Securities Markets”, Journal of Finance, XLVII
(2), June, 607-641.
THESIS: The Spanish equity market (2000-2014): stylized facts.
José Antonio Pérez Rodríguez (Instituto Universitario de Investigación Ortega y Gasset. Universidad Complutense de Madrid). 239
Martínez, M.A., Nieto, B., Rubio, G. and Tapia, M. (2003): “Asset pricing and systematic
liquidity risk: an empirical investigation of the Spanish stock market”. Working paper
Universidad Carlos III de Madrid. January 2003.
Mason, R.D.; Lind, D.A. and Marchal, W.G. (1999): Statistical Techniques in Business and
Economics (tenth edition), McGraw-Hill Companies, Inc. USA.
Nicholson, W. (1992): Microeconomic Theory, Basic Principles and Extensions, 5th edition.
The Dryden Press.
O'Hara, M. (1995): Market Microstructure Theory, Basil Blackwell Inc, Oxford.
O'Hara, M. (2014): “High frequency trading and its impact on markets”. Financial Analysts
Journal, vol. 70, n. 3., May/June 2014. p. 18-27.
Pagano, M. and Schwartz, R. (2002) : “A closing call’s impact on market quality at Euronext
Paris”, Journal of Financial Economics.
Pardo, A. and Pascual, R. (2004): “On the hidden side of liquidity”.
Pascual, R. and Verdas, D. (2004): “What pieces of limit order book information are
informative?”.
Pérez, J.A. (2001): “La fijación del precio de cierre en el Sistema de Interconexión Bursátil
Español. Cambios Medios versus Subasta de Cierre”. Revista Bolsa de Madrid. Madrid.
Pérez, J.A. y Ortiz-Repiso, J.M. (2001): “Subastas por Volatilidad y Rangos en el SIBE. Una
nueva gestión en las variaciones de precios”. Revista Bolsa de Madrid. Madrid.
Pérez, J.A. y Ortiz-Repiso, J.M. (2007): “ “Warrants repetidos”: una análisis de clusters sobre
parejas de warrants similares ”. Revista BOLSA. Madrid.
THESIS: The Spanish equity market (2000-2014): stylized facts.
José Antonio Pérez Rodríguez (Instituto Universitario de Investigación Ortega y Gasset. Universidad Complutense de Madrid). 240
Pérez, J.A. e Yzaguirre, J. (2007): “Los sistemas de contratación en las bolsas de valores”, en
Curso de Bolsa y Mercados Financieros, dirigido por José L. Sánchez Fernández de
Valderrama.
Rodríguez Sáiz, L., Parejo, J.A., Cuervo, A. y Calvo, A. (1996): Manual de sistema
financiero español.
Rubio, G. (1985): Dissertation: “Asset pricing and equity rights issues: the case of the Spanish
capital market”. University of California, Berkeley, 1985.
Sandholtz, W. (1998): European integration and supranational Governance. Oxford: Oxford
University Press: co-edited with Alec Stone Sweet.
Sandholtz, W. (2001): The institutionalization of Europe. Oxford: Oxford University Press:
co-edited with Alec Stone and Neil Fligstein.
Sentana, E. (1991): Dissertation: “Time-varying volatility and returns on ordinary shares: an
empirical investigation”. London School of Economics and Political Science.
Sociedad de Bolsas, S.A. (BME) (2001): Circular 1/2001: “The operating rules of the Spanish
stock exchange interconnection system (SIBE)”, at www.bmerv.es
Sociedad de Bolsas, S.A. (BME) (2008): Circular 3/2008: “Modification of the stock
exchange interconnection system rules regarding the block trading (section 7 of the operating
rules of the aforementioned system and operating rules of the warrants, certificates and other
products segment and exchange traded funds)”, at www.bmerv.es
Sociedad de Bolsas, S.A. (BME) (2014): “Technical regulations for the composition and
calculation of the Sociedad de Bolsas, S.A. indexes”. www.bmerv.es
Stoll, Hans R. (1999): Microstructure: The Organization of Trading and Short Term Price
Behavior (Volumes I and II), Edward Elgar Publishing, Northampton, Massachusetts.
THESIS: The Spanish equity market (2000-2014): stylized facts.
José Antonio Pérez Rodríguez (Instituto Universitario de Investigación Ortega y Gasset. Universidad Complutense de Madrid). 241
Tapia, M. (1995): “Ensayos sobre microestructura: información, riesgo y liquidez”. Tesis
Doctoral. Departamento de Fundamentos de Análisis Económico. Universidad del País
Vasco.
Thatcher, M. (2007): Internationalisation and economic institutions: comparing European
experiences. Oxford University Press.
Thomas, S. (1998): “End of Day Patterns on the Paris Bourse after Implementation of a call
auction”. Global Equity Markets Conference, Paris.
Walras, L. (1954): Elements of Pure Economics. Translated by W. Jaffe. Homewood, Ill.; Richard
D. Irwing.
Weild, D., Kim, E. and Newport, L. (2013): “Making stock markets work to support
economic growth: implications for governments, regulators, stock exchanges, corporate
issuers and their investors”. OCDE Corporate Governance Working Papers.
World Federation of Exchanges (2013): Understanding high frequency trading. WFE Focus.
May 2013.
Yzaguirre, J. (2004): Tesis Doctoral: “Estudios sobre el mercado electrónico español de
acciones”. Universidad Autónoma de Madrid.
Zoido, A. (2011): “Priorities for ensuring the stability and efficiency of financial markets”.
World Exchanges Congress.

THESIS: The Spanish equity market (2000-2014): stylized facts.
José Antonio Pérez Rodríguez (Instituto Universitario de Investigación Ortega y Gasset. Universidad Complutense de Madrid). 242
THESIS: The Spanish equity market (2000-2014): stylized facts.
José Antonio Pérez Rodríguez (Instituto Universitario de Investigación Ortega y Gasset. Universidad Complutense de Madrid). 243
RESUMEN (Spanish)

THESIS: The Spanish equity market (2000-2014): stylized facts.
José Antonio Pérez Rodríguez (Instituto Universitario de Investigación Ortega y Gasset. Universidad Complutense de Madrid). 244
THESIS: The Spanish equity market (2000-2014): stylized facts.
José Antonio Pérez Rodríguez (Instituto Universitario de Investigación Ortega y Gasset. Universidad Complutense de Madrid). 245
RESUMEN (Spanish).
Introducción
El trabajo aquí presentado tiene como marco temporal los últimos 15 años de historia
en la renta variable española (años 2000 a 2014). En este sentido (y como introducción a esta
tesis), se dibuja en el primer capítulo cuales son los antecedentes del mercado electrónico de
acciones, y lo que supuso el paso de la contratación en corros a este sistema automatizado.
Los principales hitos o novedades de este sistema electrónico (Sistema de Interconexión
Bursátil Español) se enumeran y detallan en esta parte. También en este primer capítulo se
explica la reunión, en diciembre de 1999, de ocho bolsas europeas que tratan, en un primer
lugar, de diseñar conjuntamente un modelo de mercado único para, posteriormente, intentar
fusionarse a nivel europeo, paso que finalmente no tuvo lugar.
Tras este punto de partida de diciembre de 1999, en el trabajo se hace una descripción
general de los principales mercados europeos de renta variable (a saber: Londres, París,
Alemania e Italia), dado que, desde todo punto de vista, parece relevante considerar el
contexto europeo del mercado español de renta variable, especialmente durante estos tres
pasados lustros.
En el capítulo 2, se apuntala la tesis detallando el marco teórico del trabajo explicando
aquí la naturaleza de los mercados y su papel en la economía, para después detallar el caso
español en cuanto a su estructura institucional y marco legal. Se hace en este capítulo también
un repaso a lo que supone en el mercado una Oferta Pública de Venta (principales conceptos y
etapas de su calendario), así como las Ofertas Públicas de Adquisición (tipología y conceptos
clave).
Síntesis (objetivos y resultados)
El capítulo tercero (cuerpo central de esta tesis) comienza con las hipótesis de partida,
basadas en que las características y mecanismos de contratación del mercado español de renta
variable tienen, como principal consecuencia, la existencia de un mercado que, a lo largo del
trabajo, demuestra ser robusto en términos de volúmenes negociados y creciente atractivo
para los diferentes participantes de mercado, nacionales e internacionales.
THESIS: The Spanish equity market (2000-2014): stylized facts.
José Antonio Pérez Rodríguez (Instituto Universitario de Investigación Ortega y Gasset. Universidad Complutense de Madrid). 246
A lo largo de este extenso capítulo tercero, se hace un análisis desde el punto de vista
cualitativo de los principales elementos y mecanismos de contratación que redundan en un
mercado líquido, profundo y versátil (todas ellas características relevantes en un mercado que
quiera distinguirse por su calidad) donde, además, la transparencia de este mercado español de
renta variable constituye una de sus señas de identidad.
Este tercer capítulo se estructura en varias partes: tras presentar las hipótesis ya
señaladas, se hace un análisis de las diferentes fases de negociación y horarios de la sesión
bursátil, alcanzando posteriormente el máximo nivel de detalle en los diferentes tipos de
órdenes existentes actualmente en el mercado español de acciones, en las reglas de
contratación durante el periodo de mercado abierto y subastas, y en la explicación y análisis
posterior de las subastas por volatilidad, los rangos estáticos y dinámicos, todos estos puntos
sustentados con ejemplos prácticos (en muchos casos, ejemplos reales).
Un último aspecto de este capítulo tercero lo constituye el detalle y análisis del índice
IBEX 35® como indicador de referencia del mercado español de acciones (ejemplos prácticos
reales de ajustes en el índice se aportan y analizan también aquí). Por otro lado, en esta
sección, esta tesis aporta un indicador original sobre la liquidez de los valores del mercado,
llamada “medida sintética de liquidez”. Este indicador tiene como principal virtud, no sólo el
hecho de que se trata de una formulación original desconocida anteriormente, sino que
(siendo un indicador de formulación sencilla), combina factores de liquidez ex–ante (antes de
la negociación) con factores relacionados con la liquidez ex–post (una vez realizada la
contratación). Algunos ejemplos son planteados aquí destacando la utilidad y puesta en
práctica de este indicador, pero futura investigación se promueve al respecto de esta
herramienta.
Por último, otros índices (además del índice IBEX 35®) se describen aquí, si bien de
forma más resumida.
En el capítulo cuarto, se recoge un monográfico sobre uno de los mecanismos de
contratación introducidos en el SIBE en estos quince años, en concreto: la implantación de la
subasta de cierre el 1 de junio de 2000. En esta parte, se hace una análisis cuantitativo sobre
las variaciones de los precios de los valores (componentes del índice IBEX 35®) hacia el final
de la sesión, antes y después de que se implantara la subasta de cierre. También, un análisis
THESIS: The Spanish equity market (2000-2014): stylized facts.
José Antonio Pérez Rodríguez (Instituto Universitario de Investigación Ortega y Gasset. Universidad Complutense de Madrid). 247
sobre los volúmenes negociados en esta última parte de la sesión se realiza aquí. Las
conclusiones de este monográfico sobre la subasta de cierre son concluyentes: la subasta de
cierre es un periodo clave en el desarrollo del mercado español de renta variable, dado que
este elemento consigue una mayor eficiencia en la fijación de precios hacia el final de la
sesión (basada en las reglas de fijación del precio de equilibrio en las subastas explicadas en
el anterior capítulo).
Los resultados empíricos avalan esta conclusión, dado que las variaciones de precios
de los valores son de un 0,43% con el nuevo sistema (respecto al 0,45% con el sistema
antiguo mediante precios medios). Por otro lado, y en cuanto a los volúmenes negociados de
acuerdo a la muestra explotada, en el periodo de subasta de cierre se negocia un 6% sobre el
total negociado en toda sesión bursátil (3,7 puntos porcentuales más que con el antiguo
sistema mediante precios medios).
Un análisis empírico más pormenorizado sobre los componentes del índice IBEX 35®
es consistente con el resultado previo obtenido sobre la volatilidad. En efecto, la volatilidad
de los precios de los valores hacia el final de la sesión es ahora inferior con el nuevo sistema,
si lo comparamos con el sistema antiguo mediante precios medios.
En definitiva, la subasta de cierre en su implantación proporcionó la posibilidad (muy
demandada por operadores y gestores de carteras) de comprar y/o vender al precio de cierre
de la sesión, y la llegada de órdenes de compra y venta en el libro de órdenes para fijar el
precio de cierre de la sesión es ahora más fácil con el nuevo sistema.
Por último, y dentro del monográfico sobre la subasta de cierre, una mayor
transparencia es conseguida con el nuevo sistema donde el cierre aleatorio al final de las
subasta introduce la posibilidad de un periodo de estabilización de precios al final de la sesión
bursátil.
Al final de la tesis, en su apéndice estadístico, se provee información estadística sobre
volúmenes de contratación y otros indicadores contundentes sobre la liquidez del mercado
español de renta variable en los últimos años dentro del contexto europeo.
THESIS: The Spanish equity market (2000-2014): stylized facts.
José Antonio Pérez Rodríguez (Instituto Universitario de Investigación Ortega y Gasset. Universidad Complutense de Madrid). 248
Conclusiones
La evolución del mercado español de renta variable durante los años 2000 a 2014 ha
sido muy positiva en varios aspectos.
En concreto, basándose en las hipótesis de partida de esta tesis, la razón última de esta
positiva evolución, a la luz de los resultados, está estrechamente ligada con la microestructura
del mercado español de renta variable cuidadosamente detallada y analizada en este trabajo,
de tal forma que puede afirmarse que las principales hipótesis quedan demostradas en esta
tesis.
En este sentido, elementos clave como la diferente segmentación de productos, los
tipos de órdenes, la introducción (primero) de la subasta de cierre y (segundo) de las subastas
por volatilidad, rangos estáticos y dinámicos han sido completados con (tercero) las órdenes
automáticas así como con la variedad de productos cotizados actualmente en el mercado
español de renta variable.
Los mecanismos de contratación mencionados anteriormente han tenido como
consecuencia un mercado con un elevado nivel de robustez en términos de liquidez. En
efecto, una de las principales conclusiones de esta tesis es que el líquido mercado actual de
renta variable español es una consecuencia directa del sistema de negociación basado en
reglas y mecanismos transparentes de negociación.
Estas especificidades y características han situado al mercado español de renta variable
en el centro de los mercados europeos de renta variable y constituyen en la actualidad una
indudable referencia para los participantes de mercado nacionales e internacionales.
En relación a la liquidez, y desde un punto de vista más metodológico, esta tesis
propone de forma totalmente original una “medida sintética de liquidez”. En este sentido, su
uso futuro e investigación posterior al respecto se incentiva desde este trabajo.
En otro orden de cosas, queda puesto de manifiesto la gran variedad de productos
cotizados en la renta variable española, completando así un proceso de diversificación que, a
la fecha de finalización de esta tesis, aún no ha acabado.
THESIS: The Spanish equity market (2000-2014): stylized facts.
José Antonio Pérez Rodríguez (Instituto Universitario de Investigación Ortega y Gasset. Universidad Complutense de Madrid). 249
Los aspectos cualitativos explicados y analizados en el corazón de esta tesis (esto es,
los mecanismos de contratación y todos los aspectos específicos y detalles sobre las reglas
que gobiernan la sesión bursátil en el mercado español de renta variable) han desembocado, a
lo largo de los años, en una arquitectura de mercado consistente, transparente y eficiente
cuyas principales consecuencias tienen como resultado la evolución positiva de los volúmenes
de contratación y los altos estándares alcanzados de liquidez y profundidad del mercado.
El índice IBEX 35®, considerado por participantes de mercado nacionales e
internacionales como la principal referencia del mercado español de renta variable, también se
analiza cuidadosamente como un indicador clave. En efecto, la conclusión alcanzada en esta
tesis es que este índice bursátil español ha demostrado durante años ser una referencia para los
participantes de mercado y carteras que siguen la evolución del mercado español de renta
variable.
En resumen, como consecuencia de los elementos clave de la microestructura actual
del mercado español de renta variable (cualitativamente analizados en esta tesis), este
mercado se ha situado a lo largo de los últimos quince años en el centro de liquidez de los
mercados europeos de renta variable. La variedad actual de productos cotizados en el mercado
de renta variable español (cuya sólida base la constituye su microestructura actual), ha
ayudado sin duda a este proceso de consolidación en el entorno europeo.

THESIS: The Spanish equity market (2000-2014): stylized facts.
José Antonio Pérez Rodríguez (Instituto Universitario de Investigación Ortega y Gasset. Universidad Complutense de Madrid). 250
THESIS: The Spanish equity market (2000-2014): stylized facts.
José Antonio Pérez Rodríguez (Instituto Universitario de Investigación Ortega y Gasset. Universidad Complutense de Madrid). 251
SUMMARY (English )

THESIS: The Spanish equity market (2000-2014): stylized facts.
José Antonio Pérez Rodríguez (Instituto Universitario de Investigación Ortega y Gasset. Universidad Complutense de Madrid). 252
THESIS: The Spanish equity market (2000-2014): stylized facts.
José Antonio Pérez Rodríguez (Instituto Universitario de Investigación Ortega y Gasset. Universidad Complutense de Madrid). 253
SUMMARY (English).
Introduction
This thesis is framed in the last 15 years of history of the Spanish equity market (years
2000 to 2014). In this sense and, as an introduction of this work, in the first chapter the main
features of the background of the electronic market for shares and the implications that the
migration from out-cry circles to this automatic system is explained. The main changes of this
electronic system (Spanish stock exchange interconnection system) are detailed in this part.
Also in this first chapter is explained the important European meeting, in December 1999, of
eight stock exchanges which foresee, in a first step, to design a single market model for,
lately, try to merge, final step that did not take place.
After this initial moment in December 1999, in this work the main features of the
market model of the main European markets (London, Paris, Germany and Italy) are generally
described, given that it is important to consider the European context of the Spanish equity
market, specially during these last fifteen years.
Along chapter two, the thesis is supported with the theoretic frame explaining here the
nature of markets and their important role in the economy, detailing afterwards the Spanish
case from the point of view of its institutional structure and legal framework. Besides, in this
chapter, a deep review of initial public offerings (main concepts and calendar steps) is done as
well as take-over bids (typology and key-concepts).
Objectives and results
Chapter three (the core of this thesis) starts with the initial hypothesis, based on the
fact that the main characteristics and trading mechanisms of the Spanish equity market have,
as a main consequence, the existence of a market that, along different parts of this work, is
shown to be robust in terms of traded volumes and growing interest for national and
international market participants.
THESIS: The Spanish equity market (2000-2014): stylized facts.
José Antonio Pérez Rodríguez (Instituto Universitario de Investigación Ortega y Gasset. Universidad Complutense de Madrid). 254
Along this extensive chapter three, a qualitative approach is done through the main
elements and trading mechanisms which imply a liquid, deep and versatile market (all of
them, key-aspects to be considered in a high quality market) where, besides, this Spanish
equity market is distinguished by its transparency.
This third chapter is structured in several parts: after the main hypothesis are
presented, an analysis of the different trading phases is done as well as the description of the
timetable of the trading session is done, reaching a high level of deepness when analyzing the
different types of orders currently existing in the Spanish market for shares, when explaining
the trading rules during open market and auctions, and in the later analysis of the volatility
auctions, static and dynamic ranges, always adding practical examples (in many cases, real
examples).
The last aspect of this third chapter is the analysis of IBEX 35® index as a reference
of the Spanish market for shares (real examples of adjustments in the index are included and
analyzed here too).
On the other hand, the main contribution of this thesis is presented during this section,
that is, an original liquidity indicator about stocks of the market named “synthetic liquidity
measure (SLM)”. This indicator has as a main virtue, not only the fact that (being a simple
indicator in its formulation), but also that it combines ex-ante (before trading) liquidity factors
with ex-post (once trading is done) liquidity factors. Some examples are detailed here
enhancing the usefulness of this indicator, but future research is also encouraged concerning
this new tool.
Also, other indexes (besides IBEX 35®) are briefly described in this third chapter.
In chapter four, a monographic about the closing auction (implemented in SIBE on
June 1, 2000) is included. The closing auction is one of the main trading mechanisms that
changed the way of fixing the closing price of the trading session. In this part, a quantitative
analysis on the price variation of stocks (IBEX 35® constituents) towards the end of the
trading session is analyzed and measured, before and after the existence of the closing
auction. A deeper analysis is also done concerning trading volumes towards the end of the
trading session. The main conclusions of this monographic are conclusive: the closing auction
THESIS: The Spanish equity market (2000-2014): stylized facts.
José Antonio Pérez Rodríguez (Instituto Universitario de Investigación Ortega y Gasset. Universidad Complutense de Madrid). 255
is a key aspect in the development of the Spanish equity market, given that this trading
mechanism obtains relevant efficiency when fixing prices towards the end of the trading
session (based on the equilibrium rules of fixing prices during an auction explained in the
previous chapter).
The empirical results support this conclusion, given that stock price variations are
0,43% under the new system with closing auction (with respect to 0,45% under the old system
based on average prices). On the other hand, and concerning traded volumes according to the
exploited sample, about 6% of all traded volume during the whole trading session, is done in
the closing auction, that is, 3,7 percentage points more than under the old system through
average prices).
A more detailed empirical analysis on volatility about IBEX 35® constituents is
consistent with the previous result. Indeed, stock price volatility towards the end of the
trading session is now lower with the new system, if compared with the old system through
average prices.
To summarize, the implementation of the closing auction provided the possibility
(highly demanded by traders and portfolio managers) of buying and/or selling at the closing
price of the trading session, and the arrival of buy and sell orders in the order book (in order
to fix the closing price of the trading session) is now easier under the new system.
In the monographic on the closing auction, a higher transparency is reached under the
new system where the random-end at the end of the auction introduces the possibility of a
price stabilization period towards the end of the trading session.
At the end of this thesis, in its statistical annex, statistical information is provided
about traded volumes and other robust indicators concerning the market liquidity of the
Spanish equity market during the last years within the European arena.
Conclusions
The evolution of the Spanish equity market during years 2000 to 2014 has been
impressive and positive in several aspects.
THESIS: The Spanish equity market (2000-2014): stylized facts.
José Antonio Pérez Rodríguez (Instituto Universitario de Investigación Ortega y Gasset. Universidad Complutense de Madrid). 256
More specifically, based on the aforementioned hypothesis of this research work, the
ultimate reason of this positive evolution, given these results, is narrowly linked to the
microstructure of the Spanish equity market carefully explained and analyzed in this thesis, in
such way that we can assert that the main hypothesis are demonstrated in this thesis.
In this sense, key aspects are the different segmentation of financial products, typology
of orders, the introduction, first, of the closing auction, secondly, the implementation of
volatility auctions, static and dynamic ranges and, thirdly, automatic orders as well as the
current wide variety of quoted products in the Spanish equity market.
The trading mechanisms already mentioned have had as a main implication a high
level of robustness in terms of liquidity. Indeed, one of the main conclusions of this thesis is
that the current highly liquid Spanish equity market is a direct consequence of the trading
mechanism based in transparent trading rules and mechanisms.
These specificities and characteristics have situated the Spanish equity market at the
core of the European equity markets and, as a consequence, this Spanish equity market is a
key reference for the national and international market participants.
Concerning liquidity, and from a more methodological point of view, this thesis
contributes with an original “synthetic liquidity measure (SML)”. This indicator has as a main
virtue, not only the fact that (being a simple indicator in its formulation), but also that it
combines ex-ante (before trading) liquidity factors with ex-post (once trading is done)
liquidity factors. Some examples are detailed here enhancing the usefulness of this indicator,
but future research is also encouraged concerning this new tool.
It is also explicit the fact that the wide variety of financial products quoting in the
Spanish equity market, have completed a diversification process that, at the date of writing
this thesis, still did not finish.
The more qualitative aspects explained and analyzed at the core of this thesis (that is,
the trading mechanisms and all the specific aspects and details about the trading rules which
govern the trading session in the Spanish equity market) have lead, along years, to a market
architecture that can be described as consistent, transparent and efficient whose main
THESIS: The Spanish equity market (2000-2014): stylized facts.
José Antonio Pérez Rodríguez (Instituto Universitario de Investigación Ortega y Gasset. Universidad Complutense de Madrid). 257
consequences have, as a result, the positive evolution of the trading volumes and the high
standards of market liquidity and market depth.
IBEX 35® index, considered by national and international market participants as the
main reference of the Spanish equity market, it is also carefully analyzed as a key indicator.
Indeed, the main conclusion here is that this index has demonstrated along years to be a
reference for market participants as well as portfolios who track the Spanish equity market.
To summarize, as a consequence of the key elements of the current microstructure of
the Spanish equity market (qualitatively analyzed in this thesis), this market has been situated
along the last fifteen years at the core of the liquidity of the European equity markets. The
current wide variety of quoted products in the Spanish equity market (whose main solid
ground is its current microstructure), has helped to this consolidation process within the
European arena.

THESIS: The Spanish equity market (2000-2014): stylized facts.
José Antonio Pérez Rodríguez (Instituto Universitario de Investigación Ortega y Gasset. Universidad Complutense de Madrid). 258

THESIS: The Spanish equity market (2000-2014): stylized facts.
José Antonio Pérez Rodríguez (Instituto Universitario de Investigación Ortega y Gasset. Universidad Complutense de Madrid). 259


![citigroup paper[1]](https://img.pdfslide.net/doc/110x75/577d2eb71a28ab4e1eafc74e/citigroup-paper1.jpg)