Embed Size (px)
Citation preview
UNIVERSIDADE FEDERAL DO RIO GRANDE – FURG
INSTITUTO DE OCEANOGRAFIA
PROGRAMA DE PÓS GRADUAÇÃO EM AQUICULTURA
CONTROLE DE pH E DUREZA TOTAL EM SISTEMA DE BIOFLOC OS,
AVALIANDO A QUALIDADE DA ÁGUA E O DESEMPENHO DE TIL ÁPIA
DO NILO Oreochromis niloticus (L.)
GABRIEL BERNARDES MARTINS
FURG
Rio Grande, RS
Março, 2016
ii
UNIVERSIDADE FEDERAL DO RIO GRANDE – FURG
INSTITUTO DE OCEANOGRAFIA
PROGRAMA DE PÓS GRADUAÇÃO EM AQUICULTURA
CONTROLE DE pH E DUREZA TOTAL EM SISTEMA DE BIOFLOC OS,
AVALIANDO A QUALIDADE DA ÁGUA E O DESEMPENHO DE TIL ÁPIA
DO NILO Oreochromis niloticus (L.)
GABRIEL BERNARDES MARTINS
Tese apresentada como parte dos requisitos para
a obtenção do grau de doutor em Aquicultura no
programa de Pós-Graduação em Aquicultura da
Universidade Federal do Rio Grande.
Orientador: Dr. Ricardo Berteaux Robaldo
FURG
Rio Grande, RS
Março, 2016
v
ÍNDICE
AGRADECIMENTOS .................................................................................................... iv
RESUMO GERAL ........................................................................................................... 1
ABSTRACT ...................................................................................................................... 2
INTRODUÇÃO GERAL .................................................................................................. 4
OBJETIVO GERAL ....................................................................................................... 13
OBJETIVOS ESPECÍFICOS ......................................................................................... 13
REFERÊNCIAS BIBLIOGRÁFICAS ........................................................................ 13
ÉTICA ANIMAL ............................................................................................................ 20
CAPÍTULO I: The Utilization of Sodium Bicarbonate, Calcium Carbonate or Hydroxide in Biofloc System: Water Quality, Growth Performance and Oxidative Stress of Nile Tilapia (Oreochromis niloticus L.) ..................................................................... 21
CAPÍTULO II: Growth, Water Quality and Oxidative Stress of Nile Tilapia Oreochromis niloticus (L.) in Biofloc Technology System at Different pH .................. 48
CAPÍTULO III: Concentração de dureza da água durante berçário de tilápia do Nilo Oreochromis niloticus (L.) em sistema de bioflocos ...................................................... 74
DISCUSSÃO GERAL .................................................................................................... 96
CONCLUSÃO GERAL ................................................................................................ 101

vi
AGRADECIMENTOS
Lembro de quatro anos atrás. Eu, um rapaz com altura de menino, armado de:
porquê? Sem respostas e sem saber o caminho tortuoso que seria o doutorado. Foram
muitas as derrotas, mas estava preparado, e por isso agradeço aos meus pais, que me
proporcionaram excelente educação e liberdade para tomar decisões.
Agradeço à minha namorada Viviane Pozza, pela paciência, apoio e carinho nos
vários momentos difíceis e distantes.
Sou grato ao meu orientador Ricardo Robaldo, por ter me apoiado com dedicação
para a realização deste trabalho, e à sua família, pelos momentos de acolhida.
Agradeço aos colegas que ajudaram nas coletas finais dos ensaios – Marcelo Okamoto, Janaína Pedron, Jéssica Teske, Diogo Alcântara, Luize Lansini, Ana Beatriz Henzel e Anderson Chaves.
Também agradeço aos professores Drs. Wilson Wasielesky, Plínio Furtado e Ricardo Vieira Rodrigues, pelo auxílio e sugestões para realização dos ensaios.
Ainda, agradeço ao apoio prestado pela Guabi Nutrição e Saúde Animal, em especial ao João Manoel Cordeiro Alves; como também à Piscicultura Aquabel.
E que eu não esqueça os que lutaram por mim.
Escolhi estar na linha de frente, fortemente. Valeu à pena.

1
RESUMO GERAL
Em sistema de bioflocos (BFT), a alta biomassa de peixes e matéria orgânica,
associadas à ciclagem dos nitrogenados inorgânicos, ocasionam intenso consumo da
alcalinidade e redução do pH. Portanto, são necessárias frequentes adições de composto
alcalinizante. Nesse contexto, como forma de aprimorar o sistema BFT para tilápias do
Nilo Oreochromis niloticus, este estudo avalia a utilização de fontes alcalinizantes e
valores de pH e dureza, verificando o desempenho de crescimento e a qualidade da água
durante a fase de berçário. Todos os ensaios foram realizados no “Laboratório de
Piscicultura do Chasqueiro”, da Universidade Federal de Pelotas. Para os ensaios, foram
utilizadas caixas com 37.5 L de volume útil, aeração contínua (pedra porosa), aquecedor
(28°C) e três réplicas para cada tratamento. O primeiro capítulo, realizado durante 60
dias, demonstra que o melhor desempenho de crescimento e produtividade ocorre ao
utilizar bicarbonato de sódio (NaHCO3) (44,1 ± 0,9 g e 23,5 ± 0,5 kg/m³), comparado ao
carbonato de cálcio (CaCO3) (38,3 ± 1,3 g e 20,8 ± 0,70 kg/m³), enquanto o hidróxido
de cálcio (Ca(OH)2) (40,6 ± 1,7 g e 21,6 ± 0,9 kg/m³) foi similar aos demais. O
crescimento reduzido para o tratamento CaCO3 foi atribuído ao excessivo aumento dos
sólidos suspensos totais (SST) e maior frequência de clarificações, que
consequentemente reduzem o teor de proteínas totais dos bioflocos. Além disso, ao
utilizar Ca(OH)2 ou CaCO3, a água tornou-se extremamente dura (>1000 mg/L CaCO3),
entretanto não parece ter comprometido o crescimento. A sobrevivência (aprox. 80%) e
a conversão alimentar (aprox. 1,1) não diferiram entre os tratamentos. Para avaliar o
status fisiológico dos peixes, ao final do ensaio foram coletados tecidos (sangue, fígado
e brânquias) para avaliação de parâmetros hematológicos e da capacidade antioxidante.
Ambos os parâmetros não demonstraram alteração, indicando que a utilização dos
alcalinizantes não provoca distúrbio fisiológico. O segundo capítulo, testando os de pH
6,5, 7,5 e 8,3 durante 60 dias, demonstrou crescimento e produtividade superiores para
o pH 7,5 (44,1 ± 0,9 g e 23,5 ± 0,5 kg/m³), comparado ao 8,3 (37,1 ± 3,9 g e 19,1 ± 2,0
kg/m³), enquanto o 6,5 (40,4 ± 4,1 g e 22,6 ± 2,3 kg/m³) foi similar aos demais. A
sobrevivência (aprox. 80%) e a conversão alimentar (aprox. 1,1) não diferiram entre os
tratamentos. Os resultados indicam ser vantajoso à nitrificação iniciar a formação dos
bioflocos com pH próximo a 8,0, e que a manutenção até pH 6,5 não compromete a
2
ciclagem dos nitrogenados. Ainda mais, a manutenção do sistema com pH mais baixos
reduz a produção de sólidos, o que favorece o aumento do teor protéico dos bioflocos,
devido a menor necessidade de remover sólidos. As avaliações hematológicas e
oxidativas não demonstraram diferença entre os tratamentos, sugerindo que não é um
desafio às tilápias o pH entre 6,5 e 8,3. No terceiro capítulo, ao testar as concentrações
de dureza (250,0, 700,0 mg/L CaCO3 e controle (79,0 mg/L CaCO3) por 20 dias,
utilizando CaCl2, o melhor desempenho de crescimento e produtividade ocorreu para
250 (7,6 ± 0,4 g e 4,8 ± 0,2 kg/m³) e 700 (7,4 ± 0,3 g e 4,6 ± 0,05 kg/m³), comparado ao
controle (6,3 ± 0,1 g e 3,6 ± 0,4 kg/m³). Enquanto a sobrevivência (aprox. 80%) e a taxa
de conversão alimentar (aprox. 1,0), não diferiram entre os tratamentos. As
concentrações de SST demonstrou elevação positiva com o aumento da dureza. Isso
deve-se à maior adesão de Ca+2 na estrutura dos bioflocos, aumentando a densidade, o
que torna o índice de volume de floco (FVI, mL/g) nos tratamentos com correção da
dureza mais estável ao longo do ensaio. Finalmente, como forma de otimizar o
desempenho, os resultados obtidos podem ser utilizados na produção de tilápias do Nilo
O. niloticus em sistema BFT, indicando a formação de bioflocos usando pH em torno de
8,0, manutenção em pH até 6,5, como também a utilização dos alcalinizantes NaHCO3
ou Ca(OH)2. Ainda mais, a utilização de Ca(OH)2 causando elevação excessiva da
dureza, não compromete o crescimento quando mantida até 700 mg/L CaCO3.
Palavras chave: berçário, superintensivo, íons, sólidos suspensos totais, densidade
biofloco
ABSTRACT
In biofloc technology (BFT), the high biomass of fishes and organic material, associated
cycling of inorganic nitrogeneous, cause intense alkalinity consumption and pH
reduction. Thus, are necessary add frequently alkalizing compound. In this context, as a
way to improve the system for Nile tilapia Oreochromis niloticus, this study evaluate
the use of alkalizing compounds, pH and total hardness levels, verifying the growth
performance and water quality. All assays were performed in “Laboratório de
Piscicultura do Chasqueiro”, of the Universidade Federal de Pelotas, Rio Grande do

3
Sul, BR. For the experiments, were utilize tanks (useful vol. 37.5 L) and continuous
aeration (two airstone), heat (100W, adjusted to 28°C) and three replicates for
treatment. The first chapter realized for 60 days, demonstrate that best growth and net
yield performance occur to utilize NaHCO3 (44.1 ± 0.9 g and 23.5 ± 0.5 kg/m³),
compared to CaCO3 (38.3 ± 1.3 g and 20.8 ± 0.70 kg/m³), while the Ca(OH)2 (40.6 ± 1.7
g and 21.6 ± 0.9 kg/m³) was similar to the other treatments. The reduced growth for
CaCO3 was attributed to excessive total solid suspension (TSS) increase and higher
clarifications frequency that consequently reduces the protein content of bioflocs.
Besides that, to utilize Ca(OH)2 or CaCO3, the water became very hard (>1000 mg/L),
however, no appear to have compromised growth. The survival (about 80%) and food
conversion rate (FCR) (about 1.1) were similar among treatments. For evaluate the
physiologic status of fishes, at final assay were collected tissue (blood, liver and gills)
for evaluate hematologic parameters and antioxidant capacity. Both parameters do not
demonstrate alteration, indicating that use of alkalizing do not cause physiologic
disturb. The second chapter, testing the pH levels at 6.5, 7.5 and 8.3 during 60 days,
demonstrate superior growth and net yield for pH 7.5 (44.1 ± 0.9 g and 23.5 ± 0.5
kg/m³), compared to 8.3 (37.1 ± 3.9 g and 19.1 ± 2.0 kg/m³), while the 6.5 (40.4 ± 4.1 g
and 22.6 ± 2.3 kg/m³) was similar to other treatments. The survival (about 80%) and
FCR (about 1.1) was equal among treatments. The results indicate be benefic to
nitrification initiate biofloc formation with pH around the 8.0, and that maintenance at
pH 6.5 do not compromises the nitrogenous cycling. Furthermore, the system
maintenance with low pH reduces the solid suspension production, which favor the
crude protein increase in bioflocs, because the less need to clarifications. The
hematologic and oxidative evaluations, do not demonstrate difference among
treatments, suggesting that it is not challenge to Nile tilapia the pH between 6.5–8.3. On
third chapter, to test total hardness levels (250, 700 mg/L CaCO3 and control) at 20
days, utilizing CaCl2, the best growth and net yield performance occur for 250 (7.6 ±
0.4 g and 4.8 ± 0.2 kg/m³) e 700 (7.4 ± 0.3 g and 4.6 ± 0.05 kg/m³), compared to control
(6.3 ± 0.1 g and 3.6 ± 0.4 kg/m³). While the survival (about 80%) and FCR (about 1.0)
do not differ among treatments. Interestingly, the TSS levels demonstrate positive
relation with increase of total hardness. This is due to the calcium adhesion in biofloc
structure, increasing the density, what makes the floc volume index (FVI) in treatments
4
more stable throughout assay. Finally, as a way to improve the performance, the results
obtained may be used on Nile tilapia production in BFT system, indicating the biofloc
formation using pH around of the 8.0 and maintenance until 6.5, as also NaHCO3 or
Ca(OH)2 such alkalizing. Still more, the Ca(OH)2 utilization that causes excessive
increased in the total hardness, do not compromises the growth until 700 mg/L CaCO3.
Keywords: superintensive nursery, ions, total solid suspension, biofloc density.
INTRODUÇÃO GERAL
O desenvolvimento da aquicultura tem enfrentado desafios de sustentabilidade,
relacionados ao consumo da água e produção de efluentes, uso de óleo e farinha de
peixe nas rações, utilização de espécies exóticas e também perdas por doenças na
produção (Colt 2006, Naylor 2000, Deines et al. 2016, Defoirdt et al. 2010). Nesse
contexto, as pesquisas desenvolvidas para tilápia do Nilo Oreochromis niloticus em
tecnologia dos bioflocos (BFT) têm demonstrado bons resultados, sendo considerado
um sistema que supre grande parte das variáveis relacionadas à sustentabilidade (De
Schryver et al. 2008, Crab et al. 2012).
O sistema BFT, é baseado na ciclagem do nitrogênio (N) inorgânico, realizada por
microorganismos, que aderidos formam os bioflocos. Esses são compostos
principalmente por bactérias, fungos, microalgas, zooplâncton, como também colóides,
polímeros orgânicos, cátions e matéria orgânica (De Schryver et al. 2008). Além disso,
os bioflocos possuem como características o formato irregular, tamanhos diversos, alta
porosidade e permeabilidade aos fluidos (Chu & Lee 2004, Crab et al. 2012).
A ciclagem do N inorgânico, pelos microorganismos, permite que as renovações
de água sejam mínimas. Para a produção de peixes em sistema BFT, o consumo é
menor que 200 L de água/kg peixe produzido, enquanto que em viveiros convencionais,
utiliza aprox. 20000 L/kg (Martínez-Córdova et al. 2016). Assim, a baixa renovação de
água permite que ocorra a ciclagem dos restos de ração, matéria orgânica e N
inorgânico, pelos microorganismos em sistema BFT.
Quando em suspensão na água, os bioflocos são consumidos pelos peixes,
portanto, são fontes extra de nutrientes (De Schryver et al. 2008). Tem sido
demonstrado que o conteúdo de proteína, lipídeos e carboidratos (% base seca) dos
5
bioflocos estão no intervalo entre 12-42%, 0,5-12% e 18-36%, respectivamente
(Avnimelech 2012). Embora a concentração lipídica seja tipicamente baixa, os
bioflocos são considerados importantes fontes de ácidos graxos essenciais (n-3 e n-6)
(Azim & Little 2008, Ekasari et al. 2010), que são encontrados particularmente em óleo
e farinha de peixe, e não compõe os substitutos vegetais das rações (Martínez-Córdova
et al. 2016).
Trabalhos prévios foram realizados abordando o maior aproveitamento dos
nutrientes por tilápias em sistema BFT, e demonstraram maior assimilação de
nitrogênio em relação a sistemas convencionais (43 vs 23%, respectivamente)
(Avnimelech 2006), consequentemente reduzindo o consumo de ração entre 20-30%
(Avnimelech et al. 1994, Avnimelech 2007, Avnimelech & Kochba 2009, Ekasari et al.
2014). Nesse contexto, a baixa utilização de água e o melhor aproveitamento dos
nutrientes comprovam a sustentabilidade do sistema de bioflocos.
O sistema BFT foi inicialmente desenvolvido realizando fertilizações com
carbono (C) orgânico, mantendo a relação entre C orgânico e nitrogênio (N) entre 15-
20:1, para estimular o crescimento de bactérias heterotróficas (equação 1) (Avnimelech
1999). Esse grupo possui vantagens importantes, como o rápido crescimento e a grande
capacidade de absorver o nitrogênio amoniacal.
(1) NH4+ + 1,18C6H12O6 + HCO3
- + 2,06O2 → C5H7O2N + 6,06H2O + 3,07CO2
Diferentes estratégias de fertilização orgânica têm sido propostas para a formação
dos bioflocos na produção de tilápias do Nilo. Como por ex., a utilização de amido
(Crab et al. 2009), glicerol, glicose (Ekasari et al. 2010), melaço ou bagaço de cana de
açúcar (Hargreaves 2013). Além da fonte utilizada, a manutenção da relação C:N é
fundamental, e recentemente Pérez-Fuentes et al. (2016) demonstraram melhor
desempenho de crescimento e produtividade de tilápias do Nilo ao manter a relação
10:1, comparado a 12,5 até 20:1.
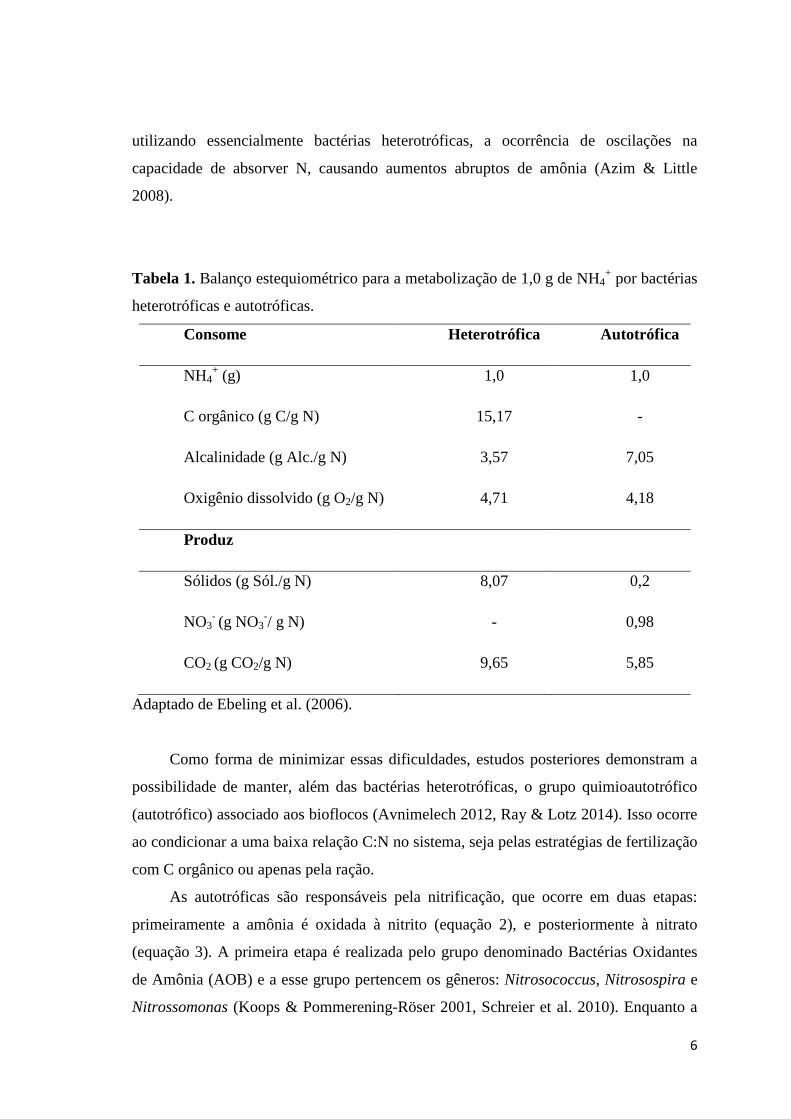
Devido ao consumo de C orgânico (Tabela 1) e rápido crescimento, as bactérias
heterotróficas produzem grande quantidade de biomassa, elevando rapidamente a
quantidade de sólidos no sistema, com elevado consumo de O2 e produção de CO2, que
favorece a acidificação do meio. Além disso, tem sido relatada em sistema BFT,
6
utilizando essencialmente bactérias heterotróficas, a ocorrência de oscilações na
capacidade de absorver N, causando aumentos abruptos de amônia (Azim & Little
2008).
Tabela 1. Balanço estequiométrico para a metabolização de 1,0 g de NH4+ por bactérias
heterotróficas e autotróficas.
Consome Heterotrófica Autotrófica
NH4+ (g) 1,0 1,0
C orgânico (g C/g N) 15,17 -
Alcalinidade (g Alc./g N) 3,57 7,05
Oxigênio dissolvido (g O2/g N) 4,71 4,18
Produz
Sólidos (g Sól./g N) 8,07 0,2
NO3- (g NO3
-/ g N) - 0,98
CO2 (g CO2/g N) 9,65 5,85
Adaptado de Ebeling et al. (2006).
Como forma de minimizar essas dificuldades, estudos posteriores demonstram a
possibilidade de manter, além das bactérias heterotróficas, o grupo quimioautotrófico
(autotrófico) associado aos bioflocos (Avnimelech 2012, Ray & Lotz 2014). Isso ocorre
ao condicionar a uma baixa relação C:N no sistema, seja pelas estratégias de fertilização
com C orgânico ou apenas pela ração.
As autotróficas são responsáveis pela nitrificação, que ocorre em duas etapas:
primeiramente a amônia é oxidada à nitrito (equação 2), e posteriormente à nitrato
(equação 3). A primeira etapa é realizada pelo grupo denominado Bactérias Oxidantes
de Amônia (AOB) e a esse grupo pertencem os gêneros: Nitrosococcus, Nitrosospira e
Nitrossomonas (Koops & Pommerening-Röser 2001, Schreier et al. 2010). Enquanto a
7
segunda etapa, a oxidação de nitrito à nitrato, é realizada pelo grupo denominado
Bactérias Oxidantes de Nitrito (NOB), e inclui os gêneros: Nitrobacter e Nitrospira
(Brown et al. 2013, Rurangwa & Verdegem 2015).
(2) NH4+ + 1,5O2 → NO2
- + 2H+ + H2O
(3) NO2- + 0,5O2 → NO3
-
A taxa de nitrificação é influenciada principalmente pela concentração de
substrato (amônia ou nitrito) e parâmetros de qualidade da água, como: temperatura,
pH, alcalinidade e salinidade (Chen et al. 2006, Gujer 2010, Gonzalez-Silva et al. 2016).
A nitrificação possui grande influência na redução do pH, especialmente devido a
produção de H+, e grande consumo de carbono inorgânico proveniente da alcalinidade.
E por sua vez, o pH afeta a nitrificação, devido a ativação-desativação das bactérias
nitrificantes, efeitos nutricionais relacionados a alcalinidade (carbono inorgânico) e
inibição das bactérias por amônia livre e ácido nitroso livre (NH3/NH4+ e NO2
-/HNO2)
(Villaverde et al. 1997, Bock & Wagner 2001, Gieseke et al. 2006).
Estudos em sistemas de tratamentos de efluentes foram realizados para
demonstrar a influência do pH na taxa de nitrificação. Como por ex. Jimenez et al.
(2011), que ao testar pH 6,5 não detectaram atividade nitrificante em lodo ativado,
entretanto, para o intervalo entre 7,5–9,9 não foi detectada inibição. Enquanto Gujer
(2010), cita em sua revisão, o intervalo ideal para a nitrificação entre 6,2–8,0.
Diferentemente, as bactérias heterotróficas são menos influenciadas pelo pH, podendo
ser considerado o intervalo ideal entre 7,0 – 8,0, porém até 10,0 é relatado crescimento
(Mayo &Noike 1996).
O consumo da alcalinidade e do pH tem sido previamente relatado em sistema
BFT, devido à ciclagem do N inorgânico (absorção pelas heterotróficas e nitrificação),
como também pela oxidação da matéria orgânica e produção de CO2 pelos organismos
no sistema (Azim & Little 2008; Pérez-Fuentes et al. 2016). Pode ser considerado um
desafio a preservação de valores adequados de pH e alcalinidade em sistema BFT, que
sejam capazes de manter a máxima absorção dos nitrogenados inorgânicos.
8
Portanto, a utilização de compostos alcalinizantes é fundamental para a
manutenção do sistema tampão da água (equação 4). A alcalinidade total, que é
associada ao tamponamento da água, é representada pela soma das bases tituláveis, que
são: HCO3-, CO3
-2 e OH-, e é expressa em mg/L CaCO3 (Boyd et al. 2016).
(4) CO2 + H2O ↔ H2CO3 ↔ HCO3- + H+ ↔ CO3
-2 + 2H+
Em aquicultura, é recomendada a manutenção da alcalinidade a uma taxa
suficiente para manter o pH estável ao longo do dia, e de forma geral, valores entre 50-
100 mg/L CaCO3 são mantidos em sistemas dulceaquícolas (Boyd et al. 2011, Boyd et
al. 2016). Assim, são utilizados compostos alcalinizantes, como o bicarbonato de sódio
(NaHCO3), o carbonato de cálcio (CaCO3) e o hidróxido de cálcio (Ca(OH)2).
O NaHCO3 possui rápida diluição na água, e ao se dissociar produz HCO3- e Na+.
É um composto seguro e eficaz no aumento da alcalinidade, e tem sido comumente
utilizado em sistemas de recirculação (RAS) (Loyless & Malone 1997). Estudos
anteriores com camarão marinho Litopenaeus vannamei em BFT demonstraram a
eficácia do NaHCO3 na correção da alcalinidade e do pH (Furtado et al. 2011, Zhang et
al. 2015).
O calcário é composto por CaCO3 e MgCO3, e em sistema intensivo tem sido
utilizado apenas o carbonato de cálcio (CaCO3), devido ao maior grau de pureza.
Comparado ao NaHCO3, o CaCO3 possui menor capacidade de diluição, sendo menos
eficiente na correção da alcalinidade e do pH. Quando dissolvido em água com pH
neutro ou superior, a capacidade de dissociação é baixa (equação 5), entretanto, em pH
abaixo de 7.0 e na presença de CO2, a diluição é facilitada (equação 6) (Boyd et al.
2016).
(5) CaCO3 → Ca+2 + CO3-2
CO3-2 + H+ → HCO3
-
HCO3- + H+ → CO2 + H2O
(6) CaCO3 + CO2 + H2O → Ca+2 + HCO3-
9
Enquanto o hidróxido de cálcio, também denominado cal hidratada (Ca(OH)2), é
amplamente utilizado em viveiros escavados, principalmente por ser uma alternativa de
baixo custo. Além disso, também tem sido utilizado para a produção de camarão
marinho L. vannamei em sistema BFT, demonstrando bons resultados (Furtado et al.
2014). O Ca(OH)2 possui rápida diluição, e devido à abrupta elevação do pH é
considerado bactericida (Ganguly et al. 1999). Portanto, sua utilização deve ser
realizada com cuidado, especialmente quando em água doce com alcalinidade baixa. A
dissolução na água produz as reações das equações 7 e 8.
(7) Ca(OH)2 + 2H+ → Ca+2 + 2H2O
(8) Ca(OH)2 + 2CO2 → Ca+2 + 2HCO3-
Devido à baixa ou nula renovação de água, o composto alcalinizante utilizado será
responsável pelo acumulo de íons ao longo do cultivo (Na+ e/ou Ca+2). Por exemplo, a
utilização excessiva de NaHCO3 por um longo período poderá tornar a água oligohalina
ou até salobra. É demonstrado que produzir tilápia do Nilo em água salobra (4-6‰)
proporciona melhora no crescimento (Qiang et al. 2013). Entretanto, o aumento
somente de Na+ pode causar desequilíbrio iônico, causando maior gasto energético com
a osmorregulação, e em situações severas pode prejudicar o crescimento (Boeuf &
Payan 2001). Esse é um tema que não é explorado para tilápias do Nilo, e pode se tornar
um limitante para o reuso da água ou descarte como efluente.
A dureza total é representada pela soma dos cátions divalentes, principalmente
Ca+2 e Mg+2, e é expressa como mg/L de CaCO3 (Boyd et al. 2016). De acordo com o
nível de dureza total, as águas podem ser classificadas como: leve (<50),
moderadamente dura (50-150), dura (150-300) e muito dura (>300) (Boyd 2015). Além
disso, a partir da dureza total, é possível demonstrar a dureza de Ca+2, que representa
0,4 do valor de dureza total (Boyd et al. 2016).
Os sistemas dulceaquícolas são bastante heterogêneos em relação à dureza,
podendo possuir valor entre 5-75 mg/L em regiões úmidas, até 1000 mg/L em áreas
com solo calcário (Boyd 2015). Portanto, não há um intervalo de dureza comum à água
10
doce. Para efeito de comparação, as águas marinhas possuem dureza em torno de 6.300
mg/L CaCO3, e concentração de Ca+2 de 400 mg/L (Boyd 2015).
Para os teleósteos, a principal função do Ca+2 está relacionada ao aumento da
rigidez das tight junctions nas brânquias, o que evita a perda iônica (Wood 2001). Essa
é uma das estratégias também utilizadas para evitar a perda iônica em água com pH
acidificado (Baldisserotto 2011). Para tilápias do Nilo, Cavalcante et al. (2012)
demonstraram melhor desempenho quando a dureza é mantida superior a 20 mg/L
CaCO3, enquanto que Cavalcante et al. (2014) ao balancear a relação
dureza:alcalinidade, demonstraram melhor desempenho quando mantida proporção em
1,0, comparado a 0,5 ou 5,0.
Em outra perspectiva, a função do Ca+2 é bastante explorada para sistema de
tratamento de efluentes que utilizam lodo ativado (similar aos bioflocos utilizados em
aquicultura) sendo principalmente relacionado à coagulação-floculação e aumento da
força de adesão dos flocos. O Ca+2 é responsável pela neutralização das cargas negativas
dos microorganismos e substâncias poliméricas extracelulares (EPS) produzida pelas
bactérias, portanto, promove a adesão dessas estruturas (Peeters et al. 2011, Ye et al.
2016).
Além do aumento da concentração iônica devido à baixa renovação, a utilização
da nitrificação em sistema BFT ocasiona acumulo de NO3- durante o ciclo de produção.
Algumas estratégias podem ser utilizadas para remoção de NO3-, como a denitrificação
por bactérias autotróficas e/ou heterotróficas em reator externo (Hargreaves 2013,
Schreier et al. 2010, Suhr et al. 2014) ou sistema associado à aquaponia (Rakocy 2012).
Esse acúmulo de substâncias (íons, NO3- e PO4
-) torna-se significativo em sistema
BFT para a produção de tilápias do Nilo O. niloticus, pois o sistema utiliza alta
densidade de estocagem, sendo reportada produtividade de até 45 kg/m³ (Crab et al.
2012, Luo et al. 2014). E isso representa um desafio deste sistema, devido à manutenção
dos parâmetros de qualidade da água no intervalo ótimo de crescimento da espécie
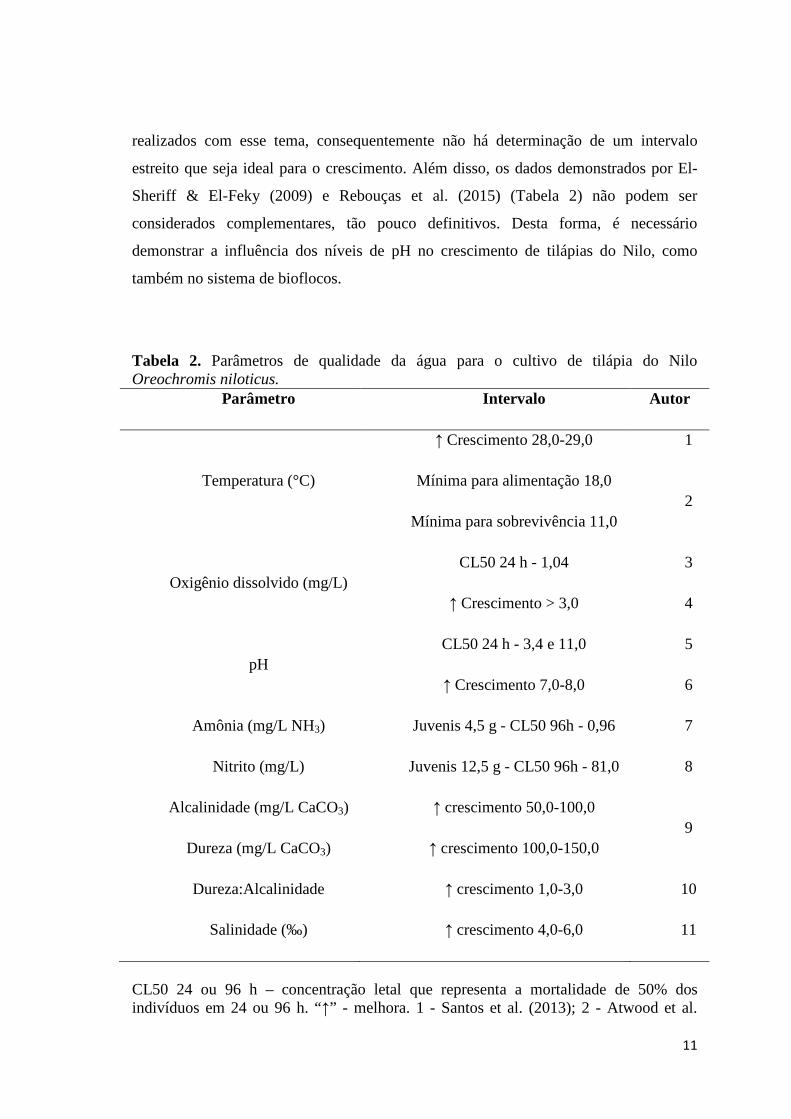
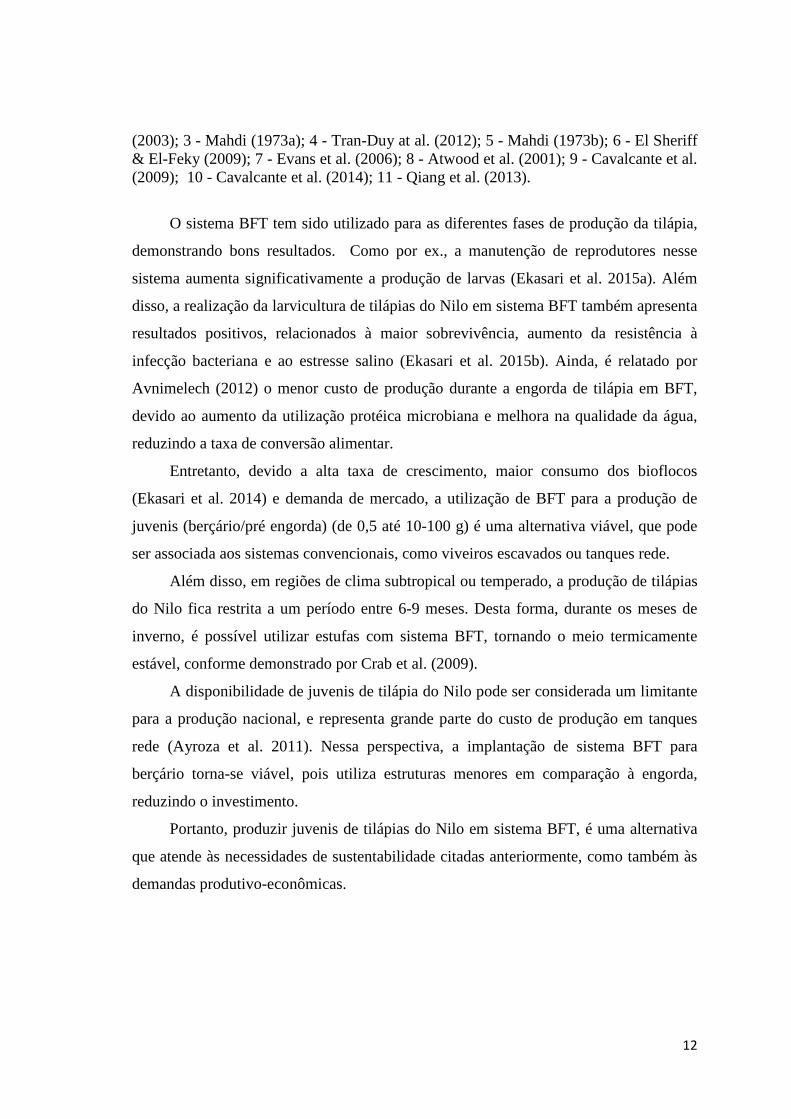
produzida, e as suas interações com os bioflocos. A Tabela 2 demonstra os parâmetros
de qualidade de água para o cultivo de tilápia do Nilo, evidenciando a ampla tolerância
das espécies aos parâmetros citados.
A tilápia do Nilo é considerada uma espécie tolerante a uma ampla faixa de pH
(Mahdi 1973b, Lim & Webster 2006), por essa razão poucos estudos tem sido
11
realizados com esse tema, consequentemente não há determinação de um intervalo
estreito que seja ideal para o crescimento. Além disso, os dados demonstrados por El-
Sheriff & El-Feky (2009) e Rebouças et al. (2015) (Tabela 2) não podem ser
considerados complementares, tão pouco definitivos. Desta forma, é necessário
demonstrar a influência dos níveis de pH no crescimento de tilápias do Nilo, como
também no sistema de bioflocos.
Tabela 2. Parâmetros de qualidade da água para o cultivo de tilápia do Nilo Oreochromis niloticus.
CL50 24 ou 96 h – concentração letal que representa a mortalidade de 50% dos indivíduos em 24 ou 96 h. “↑” - melhora. 1 - Santos et al. (2013); 2 - Atwood et al.
Parâmetro Intervalo Autor
Temperatura (°C)
↑ Crescimento 28,0-29,0 1
Mínima para alimentação 18,0
Mínima para sobrevivência 11,0 2
Oxigênio dissolvido (mg/L) CL50 24 h - 1,04 3
↑ Crescimento > 3,0 4
pH CL50 24 h - 3,4 e 11,0 5
↑ Crescimento 7,0-8,0 6
Amônia (mg/L NH3) Juvenis 4,5 g - CL50 96h - 0,96 7
Nitrito (mg/L) Juvenis 12,5 g - CL50 96h - 81,0 8
Alcalinidade (mg/L CaCO3) ↑ crescimento 50,0-100,0 9
Dureza (mg/L CaCO3) ↑ crescimento 100,0-150,0
Dureza:Alcalinidade ↑ crescimento 1,0-3,0 10
Salinidade (‰) ↑ crescimento 4,0-6,0 11
12
(2003); 3 - Mahdi (1973a); 4 - Tran-Duy at al. (2012); 5 - Mahdi (1973b); 6 - El Sheriff & El-Feky (2009); 7 - Evans et al. (2006); 8 - Atwood et al. (2001); 9 - Cavalcante et al. (2009); 10 - Cavalcante et al. (2014); 11 - Qiang et al. (2013).
O sistema BFT tem sido utilizado para as diferentes fases de produção da tilápia,
demonstrando bons resultados. Como por ex., a manutenção de reprodutores nesse
sistema aumenta significativamente a produção de larvas (Ekasari et al. 2015a). Além
disso, a realização da larvicultura de tilápias do Nilo em sistema BFT também apresenta
resultados positivos, relacionados à maior sobrevivência, aumento da resistência à
infecção bacteriana e ao estresse salino (Ekasari et al. 2015b). Ainda, é relatado por
Avnimelech (2012) o menor custo de produção durante a engorda de tilápia em BFT,
devido ao aumento da utilização protéica microbiana e melhora na qualidade da água,
reduzindo a taxa de conversão alimentar.
Entretanto, devido a alta taxa de crescimento, maior consumo dos bioflocos
(Ekasari et al. 2014) e demanda de mercado, a utilização de BFT para a produção de
juvenis (berçário/pré engorda) (de 0,5 até 10-100 g) é uma alternativa viável, que pode
ser associada aos sistemas convencionais, como viveiros escavados ou tanques rede.
Além disso, em regiões de clima subtropical ou temperado, a produção de tilápias
do Nilo fica restrita a um período entre 6-9 meses. Desta forma, durante os meses de
inverno, é possível utilizar estufas com sistema BFT, tornando o meio termicamente
estável, conforme demonstrado por Crab et al. (2009).
A disponibilidade de juvenis de tilápia do Nilo pode ser considerada um limitante
para a produção nacional, e representa grande parte do custo de produção em tanques
rede (Ayroza et al. 2011). Nessa perspectiva, a implantação de sistema BFT para
berçário torna-se viável, pois utiliza estruturas menores em comparação à engorda,
reduzindo o investimento.
Portanto, produzir juvenis de tilápias do Nilo em sistema BFT, é uma alternativa
que atende às necessidades de sustentabilidade citadas anteriormente, como também às
demandas produtivo-econômicas.
13
OBJETIVO GERAL
Nesse contexto, o presente estudo demonstra a correção da alcalinidade e do pH
utilizando NaHCO3, CaCO3 ou Ca(OH)2, como também os valores de pH (6,5, 7,5 e
8,3) e dureza total (controle, 250 e 700 mg/L CaCO3), avaliando a qualidade da água, o
crescimento e a sobrevivência de tilápia do Nilo Oreochromis niloticus durante berçário
em sistema de bioflocos.
OBJETIVOS ESPECÍFICOS
- Investigar a correção da alcalinidade e do pH utilizando NaHCO3, CaCO3 ou Ca(OH)2
durante berçário de tilápia do Nilo Oreochromis niloticus demonstrando a qualidade da
água, o crescimento, a análise proximal dos bioflocos, a hematologia e o estresse
oxidativo dos peixes.
- Determinar o valor de pH ideal entre 6,5 e 8,3 durante o berçário de tilápia do Nilo O.
niloticus, avaliando a qualidade da água, o crescimento, a análise proximal dos
bioflocos, a hematologia e o estresse oxidativo dos peixes.
- Demonstrar o efeito da dureza total durante o berçário de tilápia do Nilo O. niloticus,
avaliando a qualidade da água, o crescimento e a sobrevivência.
REFERÊNCIAS BIBLIOGRÁFICAS
ATWOOD, HL, QC FONTENOT, JR TOMASSO & KK ISELY. 2001. Toxicity of nitrite to Nile
Tilapia: effect of fish size and environmental chloride. N. Am. J. Aquacult., 63: 49–
51.
ATWOOD, HL, JR TOMASSO, K WEBB & DM GATLIN . 2003. Low-temperature tolerance of
Nile tilapia Oreochromis niloticus: effects of environmental and dietary factors.
Aquac. Res., 34: 241–251.
AVNIMELECH , Y, M KOCHBA & S DIAB. 1994. Development of controlled intensive
aquaculture systems with a limited water exchange and adjusted carbon to nitrogen
ratio. Isr. J. Aquacult.-Bamid., 46 (3): 119–131.
14
AVNIMELECH , Y. 1999. Carbon/nitrogen ratio as a control element in aquaculture
systems. Aquaculture, 176: 227–235.
AVNIMELECH , Y. 2006. Bio-filters: the need for an new comprehensive approach.
Aquacult. Eng., 34 (3): 172–178.
AVNIMELECH , Y. 2007. Feeding with microbial flocs by tilapia in minimal discharge bio-
flocs technology ponds. Aquaculture, 264: 140–147.
AVNIMELECH , Y & M KOCHBA. 2009. Evaluation of nitrogen uptake and excretion by
tilapia in bio floc tanks, using 15N tracing. Aquaculture, 287: 163-168.
AVNIMELECH , Y. 2012. Biofloc technology – A pratical Guide Book, 2nd Edition. The
World Aquaculture Society Baton Rouge, Louisiana, United States. 272 p.
AYROZA, LMS, E ROMAGOSA, DMMR AYROZA, JDS FILHO & FS SALLES. 2011. Custos e
rentabilidade da produção de juvenis de tilápia-do-nilo em tanques-rede utilizando-se
diferentes densidades de estocagem. R. Bras. Zootec., 40(2): 231– 239.
AZIM , ME & DC LITTLE. 2008. The bioflocs technology (BFT) in indoor tanks: water
quality, bioflocs composition, and growth and welfare of Nile tilapia (Oreochromis
niloticus). Aquaculture, 283: 29–35.
BALDISSEROTTO, B. 2011. Water pH and hardness affect growth of freshwater teleosts.
R. Bras. Zootec., 40: 138–144.
BOCK, E & M WAGNER. 2001. Oxidation of inorganic nitrogen compounds as energy
source, In: M DWORKIN et al. (ed.). The prokaryotes: an evolving electronic resource
for the microbiological community, 3rd ed. Springer, New York, N.Y., USA. 414–
430.
BOEUF, G & P PAYAN. 2001. How should salinity influence fish growth? Comp.
Biochem. Phys. C, 130: 411–423.
BOYD, CE, CS TUCKER & R VIRIYATUM . 2011. Interpretation of pH, acidity and alkalinity
in aquaculture and fisheries. N. Am. J. Aquacult., 73(4): 403–408.
BOYD, CE. 2015. Total hardness. In: CE BOYD (ed.). Water quality, an introduction, 2nd
ed. Springer, New York, New York, USA. 179-187.
BOYD, CE, CS TUCKER & B SOMRIDHIVEJ. 2016. Alkalinity and Hardness: Critical but
Elusive Concepts in Aquaculture. J. World Aquacult. Soc., 47 (1).
15
CAVALCANTE, DH, AS POLIATO, DC RIBEIRO, FB MAGALHÃES & MVC SÁ. 2009. Effects of
CaCO3 liming on water quality and growth performance of fingerlings of Nile tilapia,
Oreochromis niloticus. Acta. Sci. Anim. Sci., 31(3): 327-333.
CAVALCANTE, DH, RR SILVA, PD PINHEIRO, MMF AKAO & VC SÁ. 2012. Single or paired
increase of total alkalinity and hardness of water for cultivation of Nile tilapia
juveniles, Oreochromis niloticus. Acta Sci. Technol., 34 (2): 177–183.
CAVALCANTE, DH, NN CALDINI, JLS SILVA, FRS LIMA & MVC SÁ. 2014. Imbalances in the
hardness/alkalinity ratio of water and Nile tilapia’s growth performance. Acta. Sci.
Technol., 36 (1): 49-54.
CHEN, S, J LING & J-P BLANCHETON. 2006. Nitrification kinetics of biofilm as affected by
water quality factors. Aquacult. Eng., 34: 179–197.
CHU, CP & DJ LEE. 2004. Multiscale structures of biological flocs. Chem. Eng. Sci., 59:
1875–1883.
COLT, J. 2006. Water quality requirements for reuse systems. Aquacult. Eng., 34: 143–
156.
CRAB, R, M KOCHVA, W VERSTRAETE & Y AVNIMELECH . 2009. Bio-flocs technology
application in over-wintering of tilapia. Aquacult. Eng., 40: 105–112.
CRAB, R, T DEFOIRDT, P BOSSIER & W VERSTRAETE. 2012. Biofloc technology in
aquaculture: Beneficial effects and future challenges. Aquaculture, 356-357: 351–
56.
DE SCHRYVER, P, R CRAB, T DEFOIRDT, N BOON & W VERSTRAETE. 2008. The basics of
bio-flocs technology: The added value for aquaculture. Aquaculture, 277: 125–137.
DEFOIRDT, T, P SORGELOOS & P BOSSIER. 2010. Alternatives to antibiotics for the control
of bacterial disease in aquaculture. Curr. Opin. Microbiol., 14: 251–258.
DEINES, AM, ME WITTMANN , JM DEINES & DM LODGE. 2016. Tradeoffs among Ecosystem
Services Associated with Global Tilapia Introductions. Rev. Fish. Sci., 24(2): 178–
191.
EBELING, JM, MB TIMMONS & JJ BISOGNI. 2006. Engineering analysis of the stoichiometry
of photoautotrophic, autotrophic, and heterotrophic removal of ammonia–nitrogen in
aquaculture systems. Aquaculture, 257: 346–358.
16
EKASARI, J, R CRAB & W VERSTRAETE. 2010. Primary Nutritional Content of Bio-Flocs
Cultured with Different Organic Carbon Sources and Salinity. Hayati J. Biosci., 17
(3): 125–130.
EKASARI, J, D ANGELA, SH WALUYO, T BACHTIAR, EH SURAWIDJAJ, P BOSSIER & P DE
SCHRYVER. 2014. The size of biofloc determines the nutritional composition and the
nitrogen recovery by aquaculture animals. Aquaculture, 426-427: 105-111.
EKASARI, J, M ZAIRIN JR, DU PUTRI, NP SARI, EH SURAWIDJAJA & P BOSSIER. 2015a.
Biofloc-based reproductive performance of Nile tilapia Oreochromis niloticus L.
broodstock. Aquac. Res., 46: 509–512.
EKASARI, J, DR RIVANDI, AP FIRDAUSI, EH SURAWIDJAJA, M ZAIRIN JR., P BOSSIER, P DE
SCHRYVER. 2015b. Biofloc technology positively affects Nile tilapia (Oreochromis
niloticus) larvae performance. Aquaculture, 441: 72–77.
EL-SHERIF, MS & AMI EL-FEKY. 2009. Performance of Nile tilapia (Oreochromis
niloticus) fingerlings. I. Effect of pH. Int. J. Agric. Biol., 11: 297–300.
EVANS, JJ & DJ PASNIK. 2006. Un-ionized ammonia exposure in Nile tilapia: toxicity,
stress response, and susceptibility to Streptococcus agalactiae. N. Am. J. Aquacult.,
68: 23–33.
FURTADO, PS, LH POERSCH & W WASIELESKY. 2011. Effect of calcium hydroxide,
carbonate and sodium bicarbonate on water quality and zootechnical performance of
shrimp Litopenaeus vannamei reared in bio-flocs technology (BFT) systems.
Aquaculture, 321: 130-135.
FURTADO, PS, CAP GAONA, LH POERSCH & W WASIELESKY. 2014. Application of different
doses of calcium hydroxide in the farming shrimp Litopenaeus vannamei with the
biofloc technology (BFT). Aquacult. Int., 22: 1009–1023.
GANGULY, S, J CHATTERJEE & BB JANA. 1999. Biogeochemical cycling bacterial activity
in response to lime and fertilizer applications in pond systems. Aquacult. Int., 7:
413–432.
GIESEKE, A, S TARRE, M GREEN & D BEER. 2006. Nitrification in a Biofilm at Low pH
Values: Role of In Situ Microenvironments and Acid Tolerance. Appl. Environ.
Microb., 4283–4292.
17
GONZALEZ-SILVA , BM, KR JONASSEN, I BAKKE, K ØSTGAARD & O VADSTEIN. 2016.
Nitrification at different salinities: biofilm community composition and physiological
plasticity. Water Res., doi: 10.1016/j.watres.2016.02.050.
GUJER, W. 2010. Nitrification and me – A subjective review. Water Res., 44: 1-19.
HARGREAVES, JA. 2013. Biofloc Production Systems for Aquaculture. SRAC 4503.
JIMÉNEZ, E, JB GIMÉNEZ, MV RUANO, J FERRER & J SERRALTA. 2011. Effect of pH and
nitrite concentration on nitrite oxidation rate. Bioresource Technol., 102: 8741–8747.
KOOPS, HP & A POMMERENING-RÖSER. 2001. Distribution and ecophysiology of the
nitrifying bacteria emphasizing cultured species. FEMS Microbiol. Ecol., 37: 1–9.
LIM , CE & CD WEBSTER. 2006. Tilapia: Biology, Culture, and Nutrition. Complete Book.
Haworth Press, Binghamton, NY. 703p.
LOYLESS, JC & RF MALONE. 1997. A Sodium Bicarbonate Dosing Methodology for pH
Management in Freshwater-Recirculating Aquaculture Systems. Prog. Fish. Cult.,
59: 198-205.
LUO, G, QI GAO, C WANG, W LIU, D SUN, L LI & H TAN. 2014. Growth, digestive activity,
welfare, and partial cost-effectiveness of genetically improved farmed tilapia
(Oreochromis niloticus) cultured in a recirculating aquaculture system and an indoor
biofloc system. Aquaculture, 422-423: 1–7.
MAHDI , MA. 1973a. Studies on factors affecting survival of Nile fish in the Sudan. III.
The effect of oxygen. Mar. Biol., 18: 96–98.
MAHDI , MA. 1973b. Studies on factors affecting survival of Nile fish in the Sudan. I. The
effects of hydrogen ion concentration. Mar. Biol., 18: 89–92.
MARTÍNEZ-CÓRDOVA, LR, M MARTÍNEZ-PORCHAS, MGC EMERENCIANO, A MIRANDA -BAEZA
& T GOLLAS-GALVÁN . 2016. From microbes to fish the next revolution in food
production. Crit. Rev. Biotechnol., 1-9.
MAYO , AW & T NOIKE. 1996. Effects of Temperature and pH on The Growth of
Heterotrophic Bacteria in Waste Stabilization Ponds. Water Res., 30 (2): 447–455.
NAYLOR, RL, RJ GOLDBURG, JH PRIMAVERA, N KAUTSKY, MCM BEVERIDGE, J CLAY, C
FOLKE, J LUBCHENCO, H MOONEY & M TROELL. 2000. Effect of aquaculture on world
fish supplies. Nature, 405: 1017–1024.
18
PEETERS, B, R DEWIL, D LECHAT & IY SMETS. 2011. Quantification of the exchangeable
calcium in activated sludge flocs and its implication to sludge settleability. Separ.
Purif. Technol., 83: 1–8.
PÉREZ-FUENTES, JA, MP HERNÁNDEZ-BERGARA, I CARLOS, PÉREZ-ROSTRO & I FOGEL.
2016. C:N ratios affect nitrogen removal and production of Nile tilapia Oreochromis
niloticus raised in a biofloc system under high density cultivation. Aquaculture, 452:
247–251.
QIANG, J, H WANG, MD KPUNDEH, J HE & P XU. 2013. Effect of water temperature, salinity,
and their interaction on growth, plasma osmolality, and gill Na+, K+-ATPase activity
in juvenile GIFT tilapia Oreochromis niloticus (L.). J. Therm. Biol., 38: 331–338.
RAKOCY, JE. 2012. Aquaponics-Integrating Fish and Plant Culture. In: J TIDWELL (ed.).
Aquaculture Production Systems, 1st ed. Wiley-Blackwell, Oxford, UK. 344–386.
RAY, AJ & JM LOTZ. 2014. Comparing a chemoautotrophic-based biofloc system and
three heterotrophic-based systems receiving different carbohydrate sources.
Aquacult. Eng., 63: 54–61.
RURANGWA, E & MCJ VERDEGEM. 2015. Microorganisms in recirculating aquaculture
systems and their management. Rev. Aquacult., 7: 117–130.
SANTOS, VB, EA MARECO & MDP SILVA. 2013. Growth curves of Nile tilapia
(Oreochromis niloticus) strains cultivated at different temperatures. Acta Sci. Anim.
Sci., 35 (3): 235–242.
SCHREIER, HJ, N MIRZOYAN & K SAITO. 2010. Microbial diversity of biological filters in
recirculating aquaculture systems. Curr. Opin. Biotech., 21: 318–325.
SUHR, KI, LF PEDERSEN & JL NIELSES. 2014. End-of-pipe single-sludge denitrification in
pilot-scale recirculating aquaculture systems. Aquacult. Eng., 62: 28–35.
TRAN-DUY, A, AA DAM & JW SCHRAMA. 2012. Feed intake, growth and metabolism of
Nile tilapia (Oreochromis niloticus) in relation to dissolved oxygen concentration.
Aquac. Res., 43: 730–744.
VILLAVERDE , S, PA GARCÍA-ENCINA & F FDZ-POLANCO. 1997. Influence of pH over
nitrifying biofilm activity in submerged biofilters. Water Res., 31(5): 1180–1186.
WOOD, CM. 2001. Toxic response of the gill. In: D SCHLENK & WH benson (eds.). Target
Organ Toxicity in Marine and Freshwater Teleosts. Taylor & Francis, London, 1–89.
19
YE, C, X YANG, F ZHAO & L REN. 2016. The shift of the microbial community in activated
sludge with calcium treatment and its implication to sludge settleability. Bioresource
Technol., 207: 11–18.
ZHANG, K, L PAN, W CHEN & C WANG. 2015. Effect of using sodium bicarbonate to adjust
the pH to different levels on water quality, the growth and the immune response of
shrimp Litopenaeus vannamei reared in zero-water exchange biofloc-based culture
tanks. Aquac. Res., 1–15.
20
ÉTICA ANIMAL
Os ensaios realizados na presente tese foram aprovados pelo Comitê de Ética
Animal da Universidade Federal de Pelotas - UFPel (n° do processo
23110.001372/2016-87).
21
CAPÍTULO I
The Utilization of Sodium Bicarbonate, Calcium Carbonate or Hydroxide in
Biofloc System: Water Quality, Growth Performance and Oxidative Stress of Nile
Tilapia (Oreochromis niloticus)
Gabriel Bernardes Martins, Fábio Tarouco, Carlos Eduardo Rosa, Ricardo Berteaux
Robaldo
Artigo submetido à revista Aquaculture.
22
The Utilization of Sodium Bicarbonate, Calcium Carbonate or Hydroxide in
Biofloc System: Water Quality, Growth Performance and Oxidative Stress of Nile
Tilapia (Oreochromis niloticus L.)
Gabriel Bernardes Martins1*, Fábio Tarouco2, Carlos Eduardo Rosa2, Ricardo Berteaux
Robaldo1,3
1 Instituto de Oceanografia, Programa de Pós Graduação em Aquicultura, Universidade
Federal do Rio Grande - FURG, CP 474, 96201-900, Rio Grande - RS, Brasil 2 Instituto de Ciências Biológicas, Programa de Pós-Graduação em Ciências
Fisiológicas – Fisiologia Animal Comparada, Universidade Federal do Rio Grande -
FURG, Avenida Itália, Km 8, 96201-900, Rio Grande - RS, Brasil 3 Instituto de Biologia, Laboratório de Fisiologia Aplicada à Aquicultura, Universidade
Federal de Pelotas - UFPel, Campus Universitário, 96160-000, Capão do Leão - RS,
Brasil
* Corresponding author: Estação Marinha de Aquicultura, Instituto de Oceanografia,
Universidade Federal do Rio Grande - FURG, C. P. 474, Rio Grande, RS CEP 96201-
900, Brasil. Email: [email protected].
Highlights
- Utilize BFT system favoring hetero and autotrophic bacteria cause elevation on
alkalizing compound consumption.
- NaHCO3 and Ca(OH)2 demonstrates best results for final weight, specific growth rate
and net yield.
- For BFT system, the amount of alkalizing compound utilized for pH maintenance
relative to feed for NaHCO3 and Ca(OH)2 are 14.64 ± 0.49 and 7.18 ± 0.32%,
respectively.
- The alkalizing compound utilized cause increased on Ca+2 or Na+ levels.
- The control of total solid suspension is the challenge for high density systems.
23
Abstract
In biofloc technology (BFT) systems, nutrient cycling for microorganisms takes place.
This results in minimal or null water exchange. The sum of fish biomass and
microorganisms favors alkalinity consumption and, consequently, pH reduction. It is in
this context that the present study evaluates alkalinity and pH maintenance using
sodium bicarbonate (NaHCO3), calcium carbonate (CaCO3) or calcium hydroxide
(Ca(OH)2) on BFT during a Nile tilapia Oreochromis niloticus nursery. In this study, 25
fishes/tank was distributed in nine experimental units (useful vol. 37.5 L) and the
performance was evaluated at 60 days. During the assay, the temperature, oxygen and
pH were maintained within the ideal range levels for Nile tilapia growth. All alkalizing
compounds were able to pH and alkalinity correction, but when using NaHCO3, the
alkalinity and pH were more elevated than the other treatments. Furthermore, at the
beginning these assay, the total ammonia (TAN) and NO2- accumulate and it caused a
peak, but mostly experiment remained to very low levels because of the total
nitrification activity, resulting in NO3- accumulation. Because the non water exchange,
at the final experiment the ion Na+ accumulate when utilized NaHCO3, resulting in level
similar to brackish water. While using CaCO3 or Ca(OH)2, the Ca+2 ion accumulate,
resulting in extremely hard water. Despite this, the fish survival was similar between
treatments (about 80%). Moreover, the final weight, specific growth rate and net yield
for NaHCO3 and Ca(OH)2 they were higher than CaCO3 treatment. This may have been
because of the higher total solid suspension (TSS) and lower protein content of the
bioflocs in this treatment. In order to assess the possible physiologic alterations of the
fish associated with the production system, the hematocrit, glycemia and plasmatic
osmolality were evaluated. Furthermore, the antioxidant capacity against peroxy
radicals (ACAP), lipid peroxidation (LPO) and catalase (CAT) and superoxide
dismutase (SOD) activities on the gills and liver were also evaluated. There were no
differences in biochemical/physiological parameters when the different alkalizing
compounds were utilized. The results demonstrate that the use of sodium bicarbonate,
hydroxide or calcium carbonate is effective on the alkalinity and pH adjustments of the
final proportion of 14.64 ± 0.49, 7.18 ± 0.32 e 24.09 ± 2.32% in relation to the feed
consumption, respectively. Thus, the study demonstrates that the use of NaHCO3 and
24
Ca(OH)2 are recommended for alkalinity and pH correction during Nile tilapia nursery
on BFT systems, because of the higher growth and net yield, and this sum to less
amount of these compounds may represent important economic gain.
Keywords: alkalinity, pH, lime, hardness, calcium, sodium.
1. Introduction
The Nile tilapia production in biofloc technology (BFT) has been well developed
due to high productivity, reduction in water consumption and nutrient cycling for
bacteria that consumes inorganic nitrogen. For the initial formation of bioflocs, the
water is fertilized with organic carbon to the proportion of carbon:nitrogen 15:1, which
in turns favors heterotrophic growth (Avnimelech 1999).
Apart from heterotrophic, the BFT system permits the growth of autotrophic
bacteria, or also denominated nitrifying bacteria, which are responsible for ammonia
oxidation to nitrate. These microorganisms are responsible for inorganic carbon
consumption on alkalinity forms (Hargreaves 2013), favoring the reduction of alkalinity
and pH during the production cycle.
For the pH correction of systems with low water renovation, e.g., recirculation
aquaculture systems, sodium bicarbonate (NaHCO3) is used. When NaHCO3 dissociates
in water, a HCO3- base is produced. Besides bicarbonate, lime with limestone, which is
the trade name of calcium carbonate (CaCO3), has been traditionally used on
aquaculture. This has a slow impact on the alkalinity and pH correction and, when
diluted in water, reacts with CO2, producing Ca+2 and HCO3- (Thunjai et al. 2004). A
further compound that is utilized is the calcium hydroxide or hydrated lime (Ca(OH)2).
In water, this produces the neutralization reaction: Ca(OH)2 + 2H+ → 2H2O + Ca+2,
which causes faster pH elevation, mainly when the alkalinity is low.
Both carbonate and calcium hydroxide are interesting alternatives to BFT
cultivation. This is because they are both sources of Ca+2, which is important to bioflocs
for changing composition, reducing size (Luo et al. 2013) and increasing the
sedimentation rate (Peeters et al. 2011). Ca+2 is also important for Nile tilapia to balance
relations between the hardness and alkalinity of the water (Cavalcante et al. 2014).
25
In systems, where high stocking density is applied, a strict evaluation of the
biochemical and physiological characteristics would optimize the productive
performance. Oxidative stress in fish has previously been evaluated as a biomarker for
environmental pollution (Monserrat et al. 2007). Indeed, oxidative parameters are also
considered important tools in the evaluation of challenged for the cultivation conditions
that are related to the feed (Azaza et al. 2015), temperature changes (Castro et al. 2012),
ammonia exposure (Hegazi et al. 2010) and other stress sources like the stocking
density (Andrade et al. 2015) and pathogens (Ali et al. 2011). An oxidative stress is
characterized by a situation where the antioxidant capacity is not able to compete
against the reactive oxygen species (ROS) formation, affecting cellular function by
protein, nucleic acids and lipids oxidation (Jones 2006).
Therefore, in order to improve the technical production of BFT, the maintenance
of alkalinity is fundamental to avoid pH oscillations, providing a more stable system for
bioflocs and the physiologic status of fish. The present study investigated the alkalinity
and pH correction on BFT during a nursery of Nile tilapia, utilizing NaHCO3, CaCO3
and Ca(OH)2, it evaluated the water quality, growth, proximate composition of the
bioflocs, hematology and oxidative stress of the Nile tilapia juveniles.
2. Materials and Methods
2.1 Design experimental
The monosex Nile tilapia juveniles (Premium genetic) were acquired from a
commercial hatchery Aquabel (Rolândia, PR, BR) and transported to “Laboratório de
Piscicultura do Chasqueiro” (Universidade Federal de Pelotas, RS, BR), where the
experiment took place. For acclimation, the fish were maintained on a recirculation
system for 15 days until the experiment began.
During acclimation and the experiment, the Nile tilapias were fed with a
commercial feed (Guabi Nutrição e Saúde Animal , BR) at 08:00, 11:00, 14:00 and
17:00 hours, according to Table 1. For the adjustment of feeding (size, crude protein
(CP) and feeding rate), the biometrics were realized weekly (n = 10 fish/tank).
26
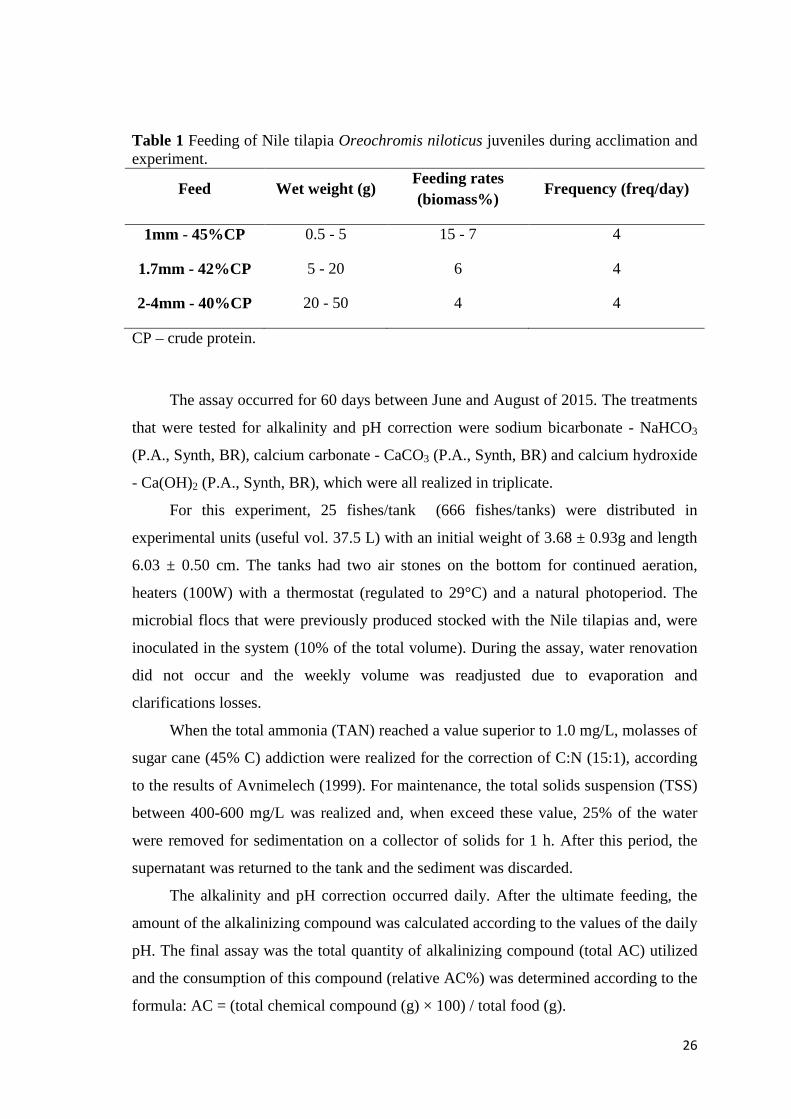
Table 1 Feeding of Nile tilapia Oreochromis niloticus juveniles during acclimation and experiment.
Feed Wet weight (g) Feeding rates (biomass%)
Frequency (freq/day)
1mm - 45%CP 0.5 - 5 15 - 7 4
1.7mm - 42%CP 5 - 20 6 4
2-4mm - 40%CP 20 - 50 4 4
CP – crude protein.
The assay occurred for 60 days between June and August of 2015. The treatments
that were tested for alkalinity and pH correction were sodium bicarbonate - NaHCO3
(P.A., Synth, BR), calcium carbonate - CaCO3 (P.A., Synth, BR) and calcium hydroxide
- Ca(OH)2 (P.A., Synth, BR), which were all realized in triplicate.
For this experiment, 25 fishes/tank (666 fishes/tanks) were distributed in
experimental units (useful vol. 37.5 L) with an initial weight of 3.68 ± 0.93g and length
6.03 ± 0.50 cm. The tanks had two air stones on the bottom for continued aeration,
heaters (100W) with a thermostat (regulated to 29°C) and a natural photoperiod. The
microbial flocs that were previously produced stocked with the Nile tilapias and, were
inoculated in the system (10% of the total volume). During the assay, water renovation
did not occur and the weekly volume was readjusted due to evaporation and
clarifications losses.
When the total ammonia (TAN) reached a value superior to 1.0 mg/L, molasses of
sugar cane (45% C) addiction were realized for the correction of C:N (15:1), according
to the results of Avnimelech (1999). For maintenance, the total solids suspension (TSS)
between 400-600 mg/L was realized and, when exceed these value, 25% of the water
were removed for sedimentation on a collector of solids for 1 h. After this period, the
supernatant was returned to the tank and the sediment was discarded.
The alkalinity and pH correction occurred daily. After the ultimate feeding, the
amount of the alkalinizing compound was calculated according to the values of the daily
pH. The final assay was the total quantity of alkalinizing compound (total AC) utilized
and the consumption of this compound (relative AC%) was determined according to the
formula: AC = (total chemical compound (g) × 100) / total food (g).
27
2.2. Water Quality and Growth Performance
The temperature and oxygen were measured twice a day (07:45 and 16:00) with a
digital oxymeter (PRO 20, Yellow Springs, OH, USA). The results are expressed as the
daily mean of treatments. The pH was measured at 16:00, utilizing digital pHmeter (HI
2212, HANNA Instrument, Woonsocket, RI, USA). Twice a week waters sample are
collected and the total ammonia (TAN) (UNESCO 1983), nitrite (NO2-N) and total
alkalinity (APHA 1998), the total solid suspension (TSS) (Strickland and Parsons
1972), the floc volume (FV) (Imhoff cone – 30 min) and total hardness (Adad 1982)
were measured. For TAN and NO2- dosages, were collected water samples before the
first feeding, while the TSS, FV, alkalinity and hardness the samples were collected
about the 13:30.
While the nitrate (NO3-) and orthophosphate (PO4
-) (Aminot and Chaussepied
1983), Na+ (photometer flame, B462, Micronal, BR) e Ca+2 (Doles, BR) were only
measured at the final assay. The floc volume index (FVI) was determined using the
following formula: FVI = FV (mL) / TSS (g) (Yousuf 2013).
At the end of the assay, all of the fish were quantified and their weight was
measured for the evaluation of survival, growth and food utilization, according to the
following equations:
a) Daily growth rate (DGR) = fish biomass increase (g) / time (days)
b) Survival rate = 100 × (Nf-Ni) / Ni
c) Net yield = fish biomass increase (g) × 1000 / Vol (L)
d) Feed conversion rate (FCR) = feed supply (g) / fish biomass increase (g)
Where Ni e Nf are the initial and final number of fishes.
2.3. Tissue Collection and Hematological Analyses
At the final experiment, the tissue samples (n = 6 fishes/tank) were collected for
analyses. The fish were anesthetized in a benzocaine bath (50ppm) for blood, gill and
liver collection. The blood was withdrawn via the arterial caudal fin (anticoagulant
EDTA 10%, 1mL sterile syringe, 25 gauge needle) and centrifuged (10min, 1500 × g)
for plasma achievement. After the blood collection, the fish were euthanized for spinal
28
medulla rupture and then the other tissue samples were collected. The samples of the
blood plasma, gill and liver were initially maintained at -180°C and after to -90°C until
the analyses.
Immediately after the blood collection, glucose (Accu Chek Performa, UK) and
hematocrit (15 min, 12000 RPM) were measured, while the plasma was subsequently
utilized for the osmolality measurement (Vapro®Vapor Pressure Osmometer, Wescor
5600, Logan, UT).
2.4. Proximate Analyses
The proximate analyses of the bioflocs were realized on duplicate. The
methodologies utilized are described for AOAC (1999). For the ash content (method
access number: #942.05), the samples were burned in muffle for 4h at 600°C. The
Kjeldhal method was used for the total protein determination (#984.13) after the acid
digestion samples and nitrogen distillation. To calculate the protein content, the 6.5
coefficient was used. While for the ethereal extraction (#920.39), Soxhlet extraction
was used for 6h, with petroleum ether as the solvent.
2.5. Biochemical Measurements
For biochemical dosages, two pools of two fish/tanks, totaling six pools, were
utilized for each treatment. The samples were homogenized (1:4 w/v) in buffer (specific
for each methodology), centrifuged (20.000 × g, 20 min, 4°C) and the supernatant was
utilized. The total protein content was determined in triplicate, utilizing the Biuret assay
(Doles, BR) and was realized in a microplate reader (550 nm).
The samples for catalase (CAT) and superoxide dismutase (SOD) activities were
homogenized (1:4 w/v) in buffer adjusted to pH 7.6, containing Tris base (20mM),
EDTA (1mM), dithiothreitol (DTT, 1mM), sucrose (500mM), KCl (150mM) and
phenylmethylsulfonyl fluoride (PMSF, 100mM).
The CAT was measured for an initial decomposition rate of 50mM H2O2 at
240nm (Beutler 1975). The results are expressed as CAT units, where one unit is the
29
enzyme amount that hydrolyzes 1µmol of H2O2 for one minute and for the protein mg at
30°C and pH 8.0.
The SOD was determined based on the inhibition and auto-oxidation of
epinephrine on the alkali medium of the SOD enzyme, which was monitored at 480 nm.
The activity is expressed as U SOD/mg of protein at 30°C and pH 8.0, where one unit is
defined as the enzyme amount that inhibits 50% of epinephrine auto-oxidation (Misra
and Fridovich 1972). For SOD activity, only the liver activity was possible accomplish.
For the antioxidant capacity against peroxy radicals (ACAP) determination, the
tissue were homogenized in buffer adjusted to pH 7.75, containing Tris-HCl (100mM),
disodium EDTA (2mM) e MgCl2.6H2O(5mM). This was determined employing the
fluorescence dye 2,7-dichlorofluorescein diacetate (H2DCF-DA – Molecular Probes) in
the presence or absence of a peroxyl radical generator 2, 2′-azobis 2
methylpropionamidine dihydrochloride (ABAP; 4mM; Aldrich), which decomposes at
37°C producing peroxyl radical (Winston et al. 1998). The difference in the
fluorescence area (at excitation and emission wavelengths of 488 nm and 525 nm,
respectively) with or without ABAP was considered as the antioxidant capacity measure
(Amado et al. 2009).
For the lipid peroxidation (LPO) determination, the samples were homogenized
(1:4 w/V) in methanol (100%, 4°C). The homogenized samples were centrifuged (1000
× g for 10 min, 4°C) and the supernatant was employed for determination. The LPO was
measured using the FOX method (Hermes-Lima et al. 1995), which is based on Fe+2
oxidation by lipid hidroperoxides (FOX reactive substances) at an acid pH with Fe+
complexing the xylenol orange dye. The cumene hydroperoxide was used as the
standard. The results are expressed as ηmol cumene hydroperoxide/g tissue.
2.6. Statistic Analysis
Initially, the data normality and homoscedasticity were analyzed. The results were
compared by ANOVA (One Way) and posterior Tukey test (p<0.05). The analyses were
realized on SigmaPlot 12.0 software (Systat Software, Inc., Chicago, IL). Data were
presented as average ± standard deviation.
30
3. Results
3.1. Water Quality
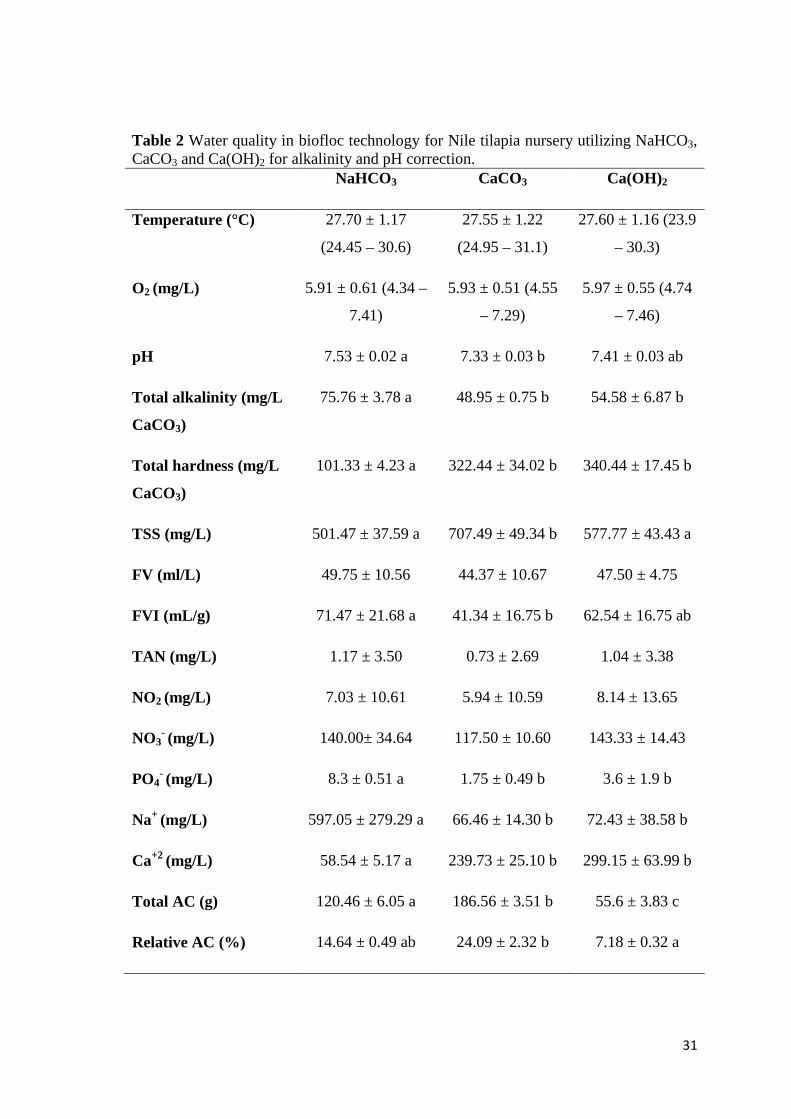
The physical and chemical parameters of the water are demonstrated in Table 2.
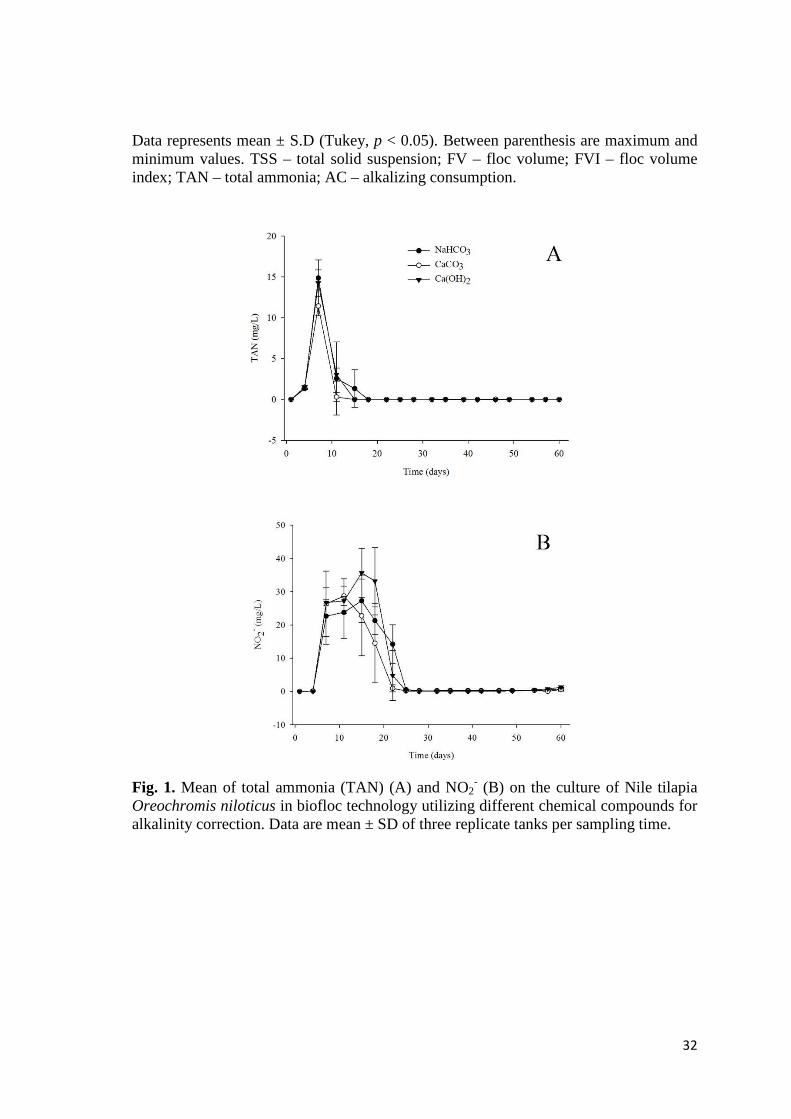
The temperature and dissolved oxygen did not differ among the treatments. The TAN
(Fig. 1a) and NO2- (Fig. 1b) values during the experiment did not demonstrate any
differences among the treatments and, during most of the experimental period remained
at very low levels. Furthermore, at the final assay, NO3- did not demonstrate any
differences among the treatments, while the orthophosphate was more elevated for the
NaHCO3 treatment than the other treatments.
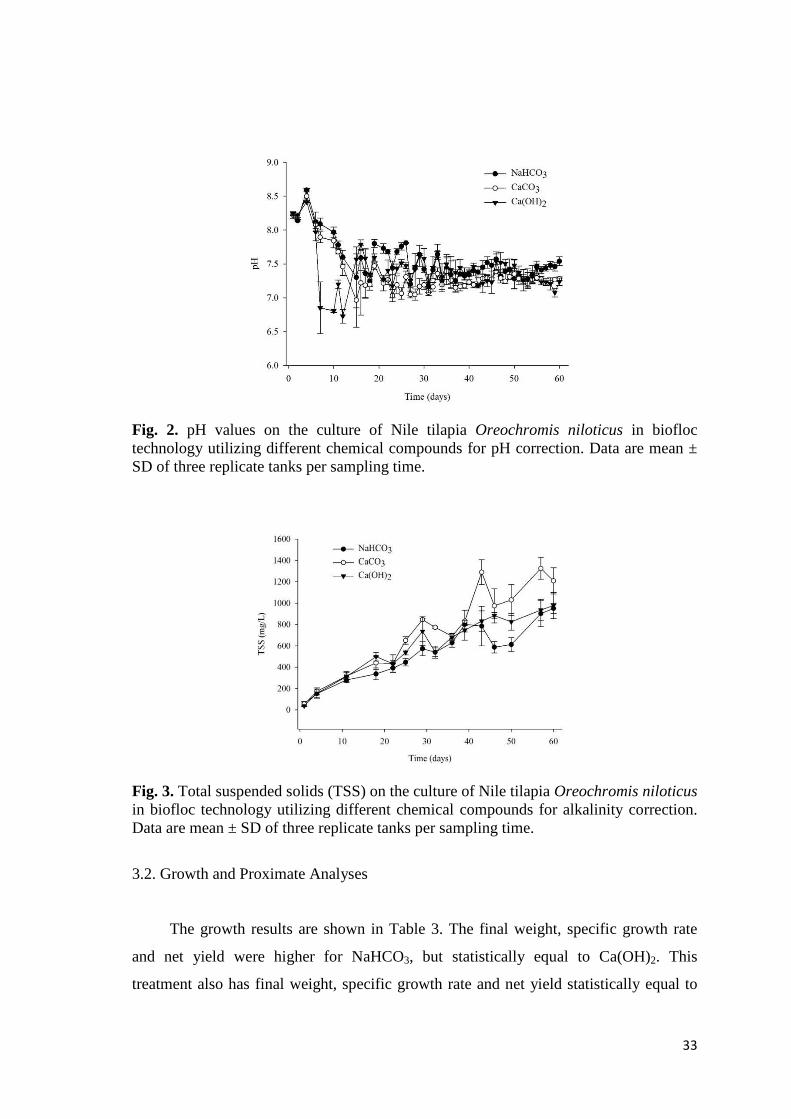
The alkalinity and pH averages (Table 2) were superior when NaHCO3 was
utilized and, in Fig. 2 are shown the daily averages of pHs along the assay. The
hardness and Ca+2 concentration were higher for the treatments CaCO3 or Ca(OH)2,
while the Na+ was superior for NaHCO3.
Along the experiment, TSS elevation (Fig. 3) occurred and CaCO3 had superior
values, while the FV (Table 2) was equal for all of the treatments. However, when the
carbonate was utilized, the FVI was lower than the NaHCO3 and equal to Ca(OH)2.
The total amount of alkalinizing compound (total AC) utilized and the relative
amount (relative AC) to feed (Table 2) were superior for CaCO3, followed by the
NaHCO3 and Ca(OH)2 treatments.
31
Table 2 Water quality in biofloc technology for Nile tilapia nursery utilizing NaHCO3, CaCO3 and Ca(OH)2 for alkalinity and pH correction. NaHCO3 CaCO3 Ca(OH)2
Temperature (°C) 27.70 ± 1.17
(24.45 – 30.6)
27.55 ± 1.22
(24.95 – 31.1)
27.60 ± 1.16 (23.9
– 30.3)
O2 (mg/L) 5.91 ± 0.61 (4.34 –
7.41)
5.93 ± 0.51 (4.55
– 7.29)
5.97 ± 0.55 (4.74
– 7.46)
pH 7.53 ± 0.02 a 7.33 ± 0.03 b 7.41 ± 0.03 ab
Total alkalinity (mg/L
CaCO3)
75.76 ± 3.78 a 48.95 ± 0.75 b 54.58 ± 6.87 b
Total hardness (mg/L
CaCO3)
101.33 ± 4.23 a 322.44 ± 34.02 b 340.44 ± 17.45 b
TSS (mg/L) 501.47 ± 37.59 a 707.49 ± 49.34 b 577.77 ± 43.43 a
FV (ml/L) 49.75 ± 10.56 44.37 ± 10.67 47.50 ± 4.75
FVI (mL/g) 71.47 ± 21.68 a 41.34 ± 16.75 b 62.54 ± 16.75 ab
TAN (mg/L) 1.17 ± 3.50 0.73 ± 2.69 1.04 ± 3.38
NO2 (mg/L) 7.03 ± 10.61 5.94 ± 10.59 8.14 ± 13.65
NO3- (mg/L) 140.00± 34.64 117.50 ± 10.60 143.33 ± 14.43
PO4- (mg/L) 8.3 ± 0.51 a 1.75 ± 0.49 b 3.6 ± 1.9 b
Na+ (mg/L) 597.05 ± 279.29 a 66.46 ± 14.30 b 72.43 ± 38.58 b
Ca+2 (mg/L) 58.54 ± 5.17 a 239.73 ± 25.10 b 299.15 ± 63.99 b
Total AC (g) 120.46 ± 6.05 a 186.56 ± 3.51 b 55.6 ± 3.83 c
Relative AC (%) 14.64 ± 0.49 ab 24.09 ± 2.32 b 7.18 ± 0.32 a
32
Data represents mean ± S.D (Tukey, p < 0.05). Between parenthesis are maximum and minimum values. TSS – total solid suspension; FV – floc volume; FVI – floc volume index; TAN – total ammonia; AC – alkalizing consumption.
Fig. 1. Mean of total ammonia (TAN) (A) and NO2- (B) on the culture of Nile tilapia
Oreochromis niloticus in biofloc technology utilizing different chemical compounds for alkalinity correction. Data are mean ± SD of three replicate tanks per sampling time.
33
Fig. 2. pH values on the culture of Nile tilapia Oreochromis niloticus in biofloc technology utilizing different chemical compounds for pH correction. Data are mean ± SD of three replicate tanks per sampling time.
Fig. 3. Total suspended solids (TSS) on the culture of Nile tilapia Oreochromis niloticus in biofloc technology utilizing different chemical compounds for alkalinity correction. Data are mean ± SD of three replicate tanks per sampling time.
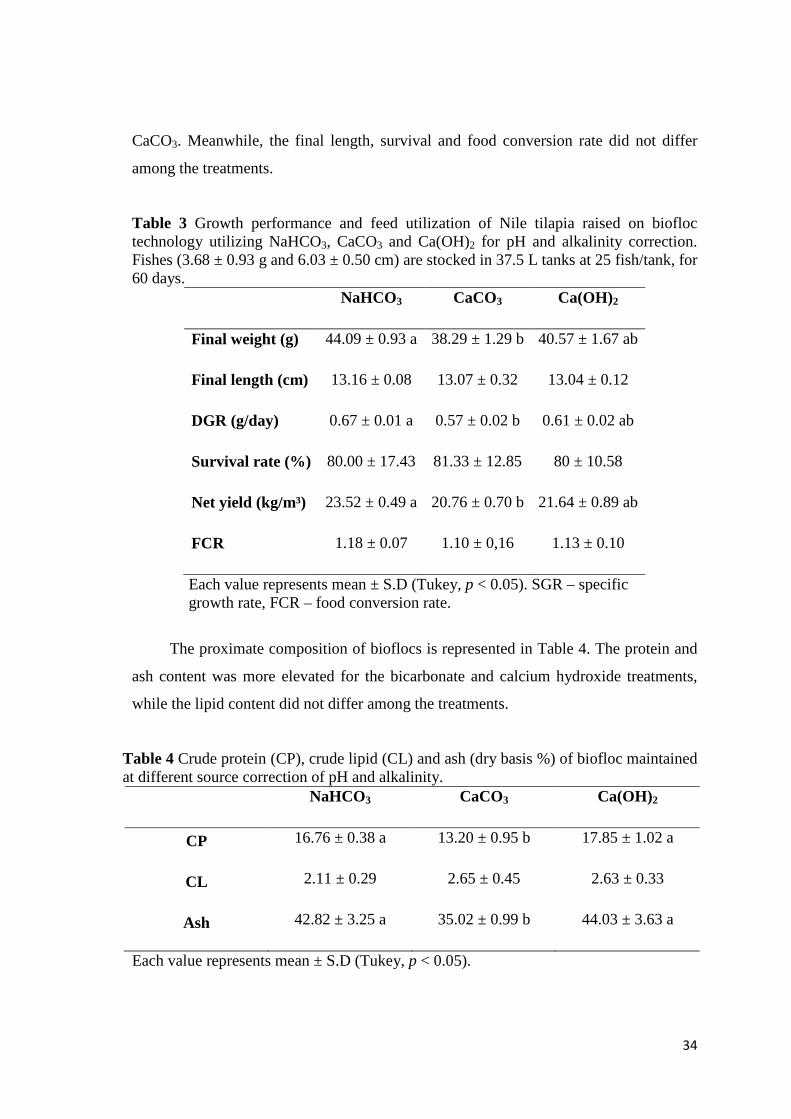
3.2. Growth and Proximate Analyses
The growth results are shown in Table 3. The final weight, specific growth rate
and net yield were higher for NaHCO3, but statistically equal to Ca(OH)2. This
treatment also has final weight, specific growth rate and net yield statistically equal to
34
CaCO3. Meanwhile, the final length, survival and food conversion rate did not differ
among the treatments.
Table 3 Growth performance and feed utilization of Nile tilapia raised on biofloc technology utilizing NaHCO3, CaCO3 and Ca(OH)2 for pH and alkalinity correction. Fishes (3.68 ± 0.93 g and 6.03 ± 0.50 cm) are stocked in 37.5 L tanks at 25 fish/tank, for 60 days.
NaHCO3 CaCO3 Ca(OH)2
Final weight (g) 44.09 ± 0.93 a 38.29 ± 1.29 b 40.57 ± 1.67 ab
Final length (cm) 13.16 ± 0.08 13.07 ± 0.32 13.04 ± 0.12
DGR (g/day) 0.67 ± 0.01 a 0.57 ± 0.02 b 0.61 ± 0.02 ab
Survival rate (%) 80.00 ± 17.43 81.33 ± 12.85 80 ± 10.58
Net yield (kg/m³) 23.52 ± 0.49 a 20.76 ± 0.70 b 21.64 ± 0.89 ab
FCR 1.18 ± 0.07 1.10 ± 0,16 1.13 ± 0.10
Each value represents mean ± S.D (Tukey, p < 0.05). SGR – specific growth rate, FCR – food conversion rate.
The proximate composition of bioflocs is represented in Table 4. The protein and
ash content was more elevated for the bicarbonate and calcium hydroxide treatments,
while the lipid content did not differ among the treatments.
Table 4 Crude protein (CP), crude lipid (CL) and ash (dry basis %) of biofloc maintained at different source correction of pH and alkalinity.
NaHCO3 CaCO3 Ca(OH)2
CP 16.76 ± 0.38 a 13.20 ± 0.95 b 17.85 ± 1.02 a
CL 2.11 ± 0.29 2.65 ± 0.45 2.63 ± 0.33
Ash 42.82 ± 3.25 a 35.02 ± 0.99 b 44.03 ± 3.63 a
Each value represents mean ± S.D (Tukey, p < 0.05).
35
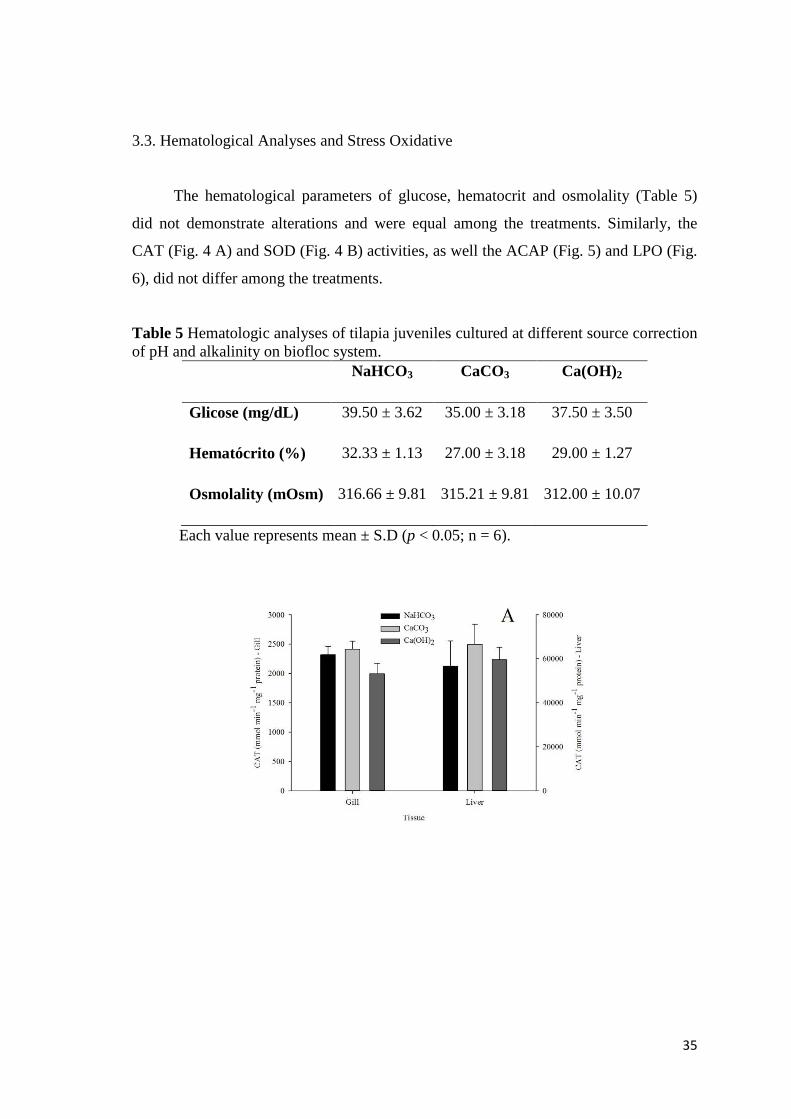
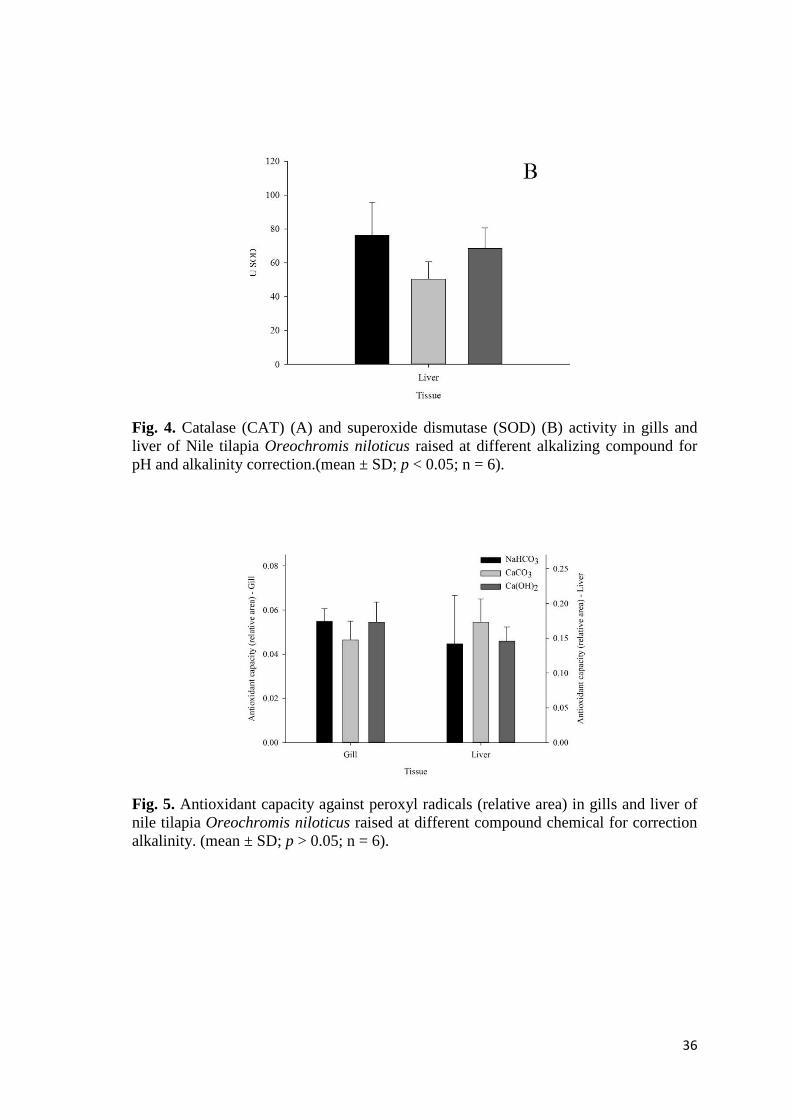
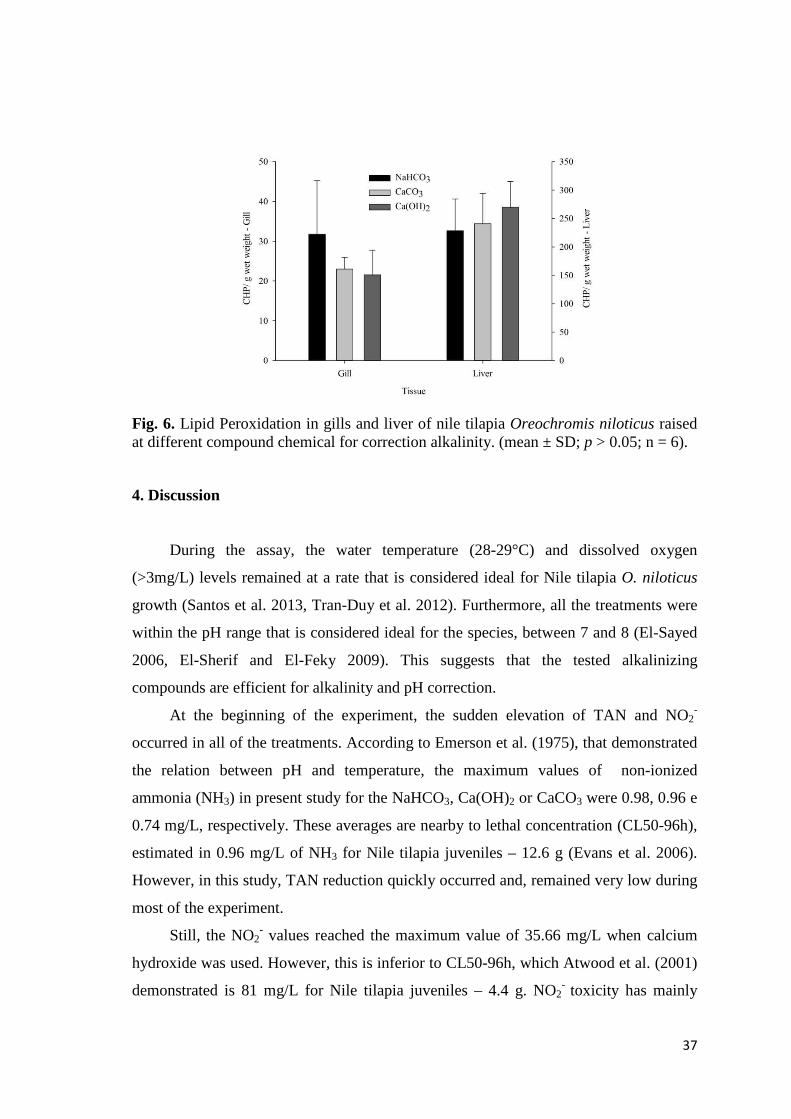
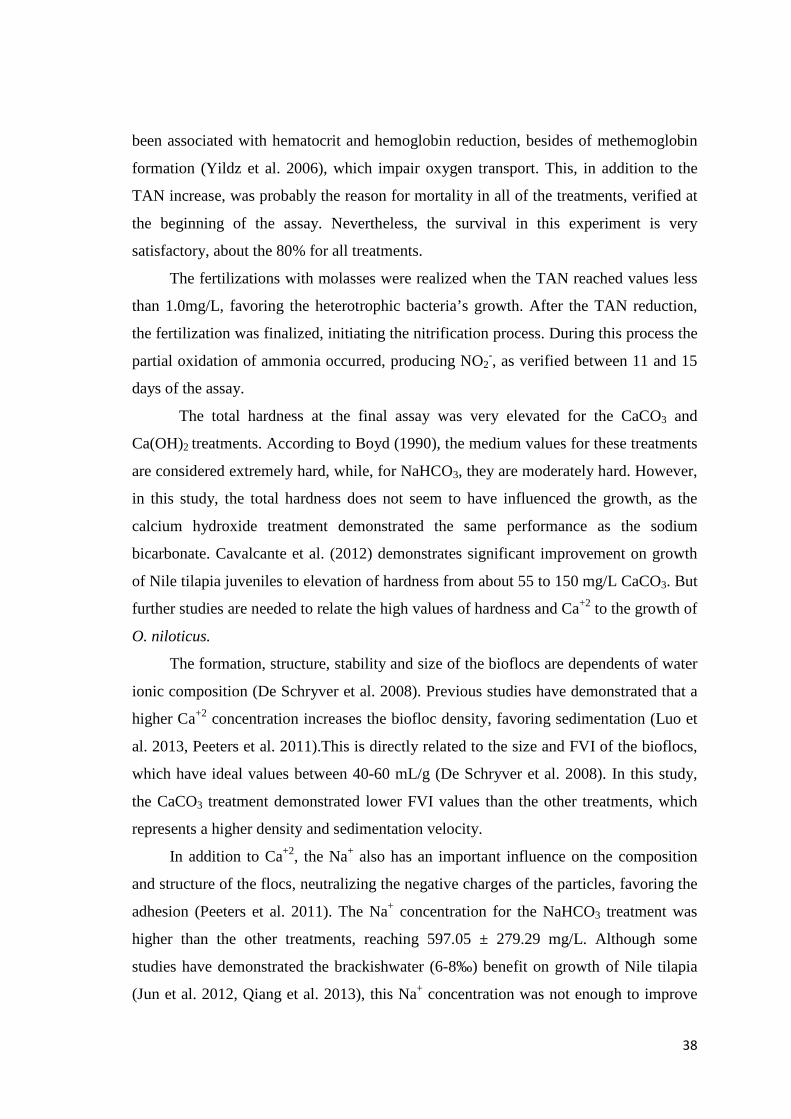
3.3. Hematological Analyses and Stress Oxidative
The hematological parameters of glucose, hematocrit and osmolality (Table 5)
did not demonstrate alterations and were equal among the treatments. Similarly, the
CAT (Fig. 4 A) and SOD (Fig. 4 B) activities, as well the ACAP (Fig. 5) and LPO (Fig.
6), did not differ among the treatments.
Table 5 Hematologic analyses of tilapia juveniles cultured at different source correction of pH and alkalinity on biofloc system.
NaHCO3 CaCO3 Ca(OH)2
Glicose (mg/dL) 39.50 ± 3.62 35.00 ± 3.18 37.50 ± 3.50
Hematócrito (%) 32.33 ± 1.13 27.00 ± 3.18 29.00 ± 1.27
Osmolality (mOsm) 316.66 ± 9.81 315.21 ± 9.81 312.00 ± 10.07
Each value represents mean ± S.D (p < 0.05; n = 6).
36
Fig. 4. Catalase (CAT) (A) and superoxide dismutase (SOD) (B) activity in gills and liver of Nile tilapia Oreochromis niloticus raised at different alkalizing compound for pH and alkalinity correction.(mean ± SD; p < 0.05; n = 6).
Fig. 5. Antioxidant capacity against peroxyl radicals (relative area) in gills and liver of nile tilapia Oreochromis niloticus raised at different compound chemical for correction alkalinity. (mean ± SD; p > 0.05; n = 6).
37
Fig. 6. Lipid Peroxidation in gills and liver of nile tilapia Oreochromis niloticus raised at different compound chemical for correction alkalinity. (mean ± SD; p > 0.05; n = 6).
4. Discussion
During the assay, the water temperature (28-29°C) and dissolved oxygen
(>3mg/L) levels remained at a rate that is considered ideal for Nile tilapia O. niloticus
growth (Santos et al. 2013, Tran-Duy et al. 2012). Furthermore, all the treatments were
within the pH range that is considered ideal for the species, between 7 and 8 (El-Sayed
2006, El-Sherif and El-Feky 2009). This suggests that the tested alkalinizing
compounds are efficient for alkalinity and pH correction.
At the beginning of the experiment, the sudden elevation of TAN and NO2-
occurred in all of the treatments. According to Emerson et al. (1975), that demonstrated
the relation between pH and temperature, the maximum values of non-ionized
ammonia (NH3) in present study for the NaHCO3, Ca(OH)2 or CaCO3 were 0.98, 0.96 e
0.74 mg/L, respectively. These averages are nearby to lethal concentration (CL50-96h),
estimated in 0.96 mg/L of NH3 for Nile tilapia juveniles – 12.6 g (Evans et al. 2006).
However, in this study, TAN reduction quickly occurred and, remained very low during
most of the experiment.
Still, the NO2- values reached the maximum value of 35.66 mg/L when calcium
hydroxide was used. However, this is inferior to CL50-96h, which Atwood et al. (2001)
demonstrated is 81 mg/L for Nile tilapia juveniles – 4.4 g. NO2- toxicity has mainly
38
been associated with hematocrit and hemoglobin reduction, besides of methemoglobin
formation (Yildz et al. 2006), which impair oxygen transport. This, in addition to the
TAN increase, was probably the reason for mortality in all of the treatments, verified at
the beginning of the assay. Nevertheless, the survival in this experiment is very
satisfactory, about the 80% for all treatments.
The fertilizations with molasses were realized when the TAN reached values less
than 1.0mg/L, favoring the heterotrophic bacteria’s growth. After the TAN reduction,
the fertilization was finalized, initiating the nitrification process. During this process the
partial oxidation of ammonia occurred, producing NO2-, as verified between 11 and 15
days of the assay.
The total hardness at the final assay was very elevated for the CaCO3 and
Ca(OH)2 treatments. According to Boyd (1990), the medium values for these treatments
are considered extremely hard, while, for NaHCO3, they are moderately hard. However,
in this study, the total hardness does not seem to have influenced the growth, as the
calcium hydroxide treatment demonstrated the same performance as the sodium
bicarbonate. Cavalcante et al. (2012) demonstrates significant improvement on growth
of Nile tilapia juveniles to elevation of hardness from about 55 to 150 mg/L CaCO3. But
further studies are needed to relate the high values of hardness and Ca+2 to the growth of
O. niloticus.
The formation, structure, stability and size of the bioflocs are dependents of water
ionic composition (De Schryver et al. 2008). Previous studies have demonstrated that a
higher Ca+2 concentration increases the biofloc density, favoring sedimentation (Luo et
al. 2013, Peeters et al. 2011).This is directly related to the size and FVI of the bioflocs,
which have ideal values between 40-60 mL/g (De Schryver et al. 2008). In this study,
the CaCO3 treatment demonstrated lower FVI values than the other treatments, which
represents a higher density and sedimentation velocity.
In addition to Ca+2, the Na+ also has an important influence on the composition
and structure of the flocs, neutralizing the negative charges of the particles, favoring the
adhesion (Peeters et al. 2011). The Na+ concentration for the NaHCO3 treatment was
higher than the other treatments, reaching 597.05 ± 279.29 mg/L. Although some
studies have demonstrated the brackishwater (6-8‰) benefit on growth of Nile tilapia
(Jun et al. 2012, Qiang et al. 2013), this Na+ concentration was not enough to improve
39
the growth, because the growth performance was similar to Ca(OH)2, reaching Na+
concentration of 72.43 ± 38.58 mg/L.
The TSS control is considered limiting for the high density system and, previous
studies with BFT have demonstrated TSS values superior of 500 mg/L (Avnimelech
2007, Azim and Little 2008, Long et al. 2015). Our results showed that, in the last 15
days, the TSS was superior for CaCO3, reaching values that were superior of 1000
mg/L. This may be associated with the chemical characteristics of the alkalizing
compound, because a greater total amount of CaCO3 (186.56 ± 3.51 g) was used
compared to Ca(OH)2 (55.6 ± 3.83 g).
When NaHCO3 was used, the growth and final density was equal to the Ca(OH)2
and, it was higher compared to the CaCO3. The lesser growth for CaCO3 can be
attributed to the sharp rise in the TSS, because high concentration of TSS is associate to
gill clogging, causing difficulty on gas and ions exchanges through the gills (Hargreaves
2013). Moreover, when using NaHCO3, the total hardness:alkalinity relation was more
proximate to those of Cavalcante et al. (2012), who demonstrated an improvement in
the growth of Nile tilapia juveniles, while keeping the ratio at 1:1.
There can be advantages to utilizing the BFT system, favoring the mixed
microbiologic system (hetero and autotrophic bacteria). For example, the lower C
organic consumption and the TSS produced, as well as the reduction in O2 and
alkalinity consumptions (Ebeling et al. 2006, Browdy et al. 2012). The economy caused
by reducing those elements may represent a significant reduction in the production cost.
In this context, Ray and Lotz (2014) compared the performance of white shrimp
Litopenaeus vannamei on BFT utilizing a hetero and chemoautotrofic system. They
confirmed that the second system leads to a reduction in oxygen consumption and lower
TSS production, without a loss of growth.
In the present study, there was high consumption of alkalizing compound. Due to
the chemical characteristics of each compound, there were differences in consumption,
which influenced the proportion that was utilized in relation to the feed. The calcium
hydroxide had a capacity to increase the pH quickly, mainly when there was low
alkalinity. Therefore, it can be said that it must be used with caution. Ganguly et al.
(1999) reported these characteristics when they utilized 0.1-0.2 g/L. They assign the
bactericidal capacity of stress to the quick increase in pH. Our results did not
40
demonstrate any damage to the bioflocs or fish due to the calcium hydroxide, using the
maximum daily concentration of 0.048 g/L. This was a less value than that reported by
Furtado et al. (2011), when 0.15 g/L lime was employed without causing damage to
bioflocs and white shrimp L. vannamei.
The PO4-P levels on the final assay remained low when the CaCO3 or Ca(OH)2
was utilized. The reaction between Ca+2 and PO4-P, producing calcium phosphate
(Ca3(PO4)2 and mineral phosphate (Li et al. 2012), was probably responsible for the
lower levels of treatment with high Ca+2 concentration. Luo et al. (2014) also obtained
low PO4-P on yours results, however they attributed the low values to the assimilation
of microorganisms present on the bioflocs, suggesting the cycling of phosphorus in
addition to nitrogen. This immobilization/cycling of PO4-P on medium is an important
result, because 80-90% of the phosphorus utilized in the feed is released in the
production system (Barak et al. 2003).
This is the best utilization of nutrients on BFT occur due to the absorption for the
organisms that compose the bioflocs and, the harvesting of Nile tilapia. Ekasari et al.
(2014) demonstrated that juveniles of Nile tilapia (9.6 g) consume around 90 g TSS/kg
wet weight. From this perspective, the biofloc represents an extra source of protein,
lipid, carbohydrate and energy.
The protein content of bioflocs in all treatments presented values below those
previously reported by Azim and Little (2008) and Lopes-Elias and Moreno-Arias
(2015). However, the ash content was more elevated and previous researches with Nile
tilapia have demonstrated ash values between 7-40% (Azim et al. 2007, Ekasari et al.
2010, Lopes-Elías and Moreno-Arias 2015). These results probably occurred because of
the intense harvesting of Nile tilapia and, besides that the utilization of the feed with a
higher total protein. These two factors result in a lower C:N relation in the system,
favoring the development of autotrophic bacteria, which are responsible for the high
consumption of alkalinizing compound and, consequently results in a higher ash
content.
The hematological index and biochemical evaluations gave insights into the health
status of the fish. The glucose and hematocrit did not demonstrate any differences
among the treatments and were within the range that is considered normal for Nile
tilapia (Bittencourt et al. 2003). These hematological parameters associated with none
41
alteration in antioxidant capacity evaluation can be reflective of the favorable
conditions.
The SOD and CAT enzymes act in a highly coordinated system. The alteration in
the activity of both enzymes is related to the conditions of the environment that causes
oxidative stress, such as management (Braun et al. 2010), hypoxia (Welker et al. 2013)
and ammonia (Sinha et al. 2014). The SOD is part of the antioxidant system and, is
responsible for the conversion of superoxide anions O2- on less toxic products H2O2 and
O2 (Gaté et al. 1999). The CAT catalyzes the removal of H2O2, transforming in water
and molecular oxygen. In the present study, there were no differences in the CAT and
SOD activities. Furthermore, there were no alterations on the antioxidant capacity and
lipidic peroxidation. Thus, our results demonstrated similar and favorable conditions for
growth when using different alkalinizing compounds.
5. Conclusions
The sodium bicarbonate utilization, calcium hydroxide or carbonate are effectives
on the alkalinity and pH correction on BFT systems. Due to the lower capacity of
calcium carbonate of correct the pH and alkalinity, there was utilized higher amount
from these compound. This significantly contributed to the increase in the TSS, which
reached superior values of 1000 mg/L and, high TSS associated with a low protein
content of bioflocs, which could be responsible for the diminished growth in these
treatments. However, when evaluating the hematological index and oxidative stress, the
alterations were not verified, indicating similar conditions among the treatments. Thus,
the best alternatives for alkalinity and pH correction are sodium bicarbonate or calcium
hydroxide.
More research is necessary in order to evaluate the water quality, mainly related to
the interaction and efficiency of bacteria, both autotrophics and heterotrophics, as also
ionic composition of reuse water for seeking the maximum efficiency of growth in BFT
system.
42
Acknowledgment
This research was supported by the “Conselho Nacional de Desenvolvimento
Científico e Tecnológico – CNPq” (Universal, proc. No.482810/2013-0), “Guabi
Nutrição e Saúde Animal” and “Piscicultura Aquabel”. The authors GBM and RBR
acknowledges to doctoral and research productivity scholarships, respectively. The
authors also thanks to Dr. Wilson Wasielesky (Estação Marinha de Aquicultura,
FURG), Dr. Marcelo Tesser (Laboratório de Nutrição e Alimentação de Organismos
Aquáticos, FURG) and Msc. João Manoel Cordeiro Alves (Guabi Nutrição e Saúde
Animal) for their contributions to this work.
References
Adad, J.M.T., 1982. Controle Químico de Qualidade. Guanabara Dois, Rio de Janeiro,
23-25 pp.
Ali, E.H., Hashem, M., Al-Salahy, M.B., 2011. Pathogenicity and oxidative stress in
Nile tilapia caused by Aphanomyces laevis and Phoma herbarum isolated from
farmed fish. Dis. Aquat. Organ. 94, 17–28.
Amado, L.L., Garcia, M.L., Ramos, P.B., Freitas, R.F., Zafalon, B., Ferreira, J.L.R.,
Yunes, J.S., Monserrat, J.M., 2009. A method to measure total antioxidant capacity
against peroxyl radicals in aquatic organisms: Application to evaluate microcystins
toxicity. Sci. Total Environ. 407, 2115–2123.
Aminot, A., Chaussepied, M., 1983. Manuel des analyses chimiques en milieu marin.
Centre National pour L'Exploitation des Oceans. CNEXO, Brest.
Andrade, T., Afonso, A., Pérez-Jiménez, A., Oliva-Teles, A., Heras, V., Mancera, J.M.,
Serradeiro, R., Costas, B., 2015. Evaluation of different stocking densities in a
Senegalese sole (Solea senegalensis) farm: Implications for growth, humoral
immune parameters and oxidative status. Aquaculture 438, 6–11.
AOAC (Association of Official Analytical Chemists), 1999. Official Methods of
Analysis, 17th edition. AOAC, Gaithersburg, MD, USA.
APHA (American Public Health Association), 1998. Standard methods for the
examination of water and wastewater, 20st edition, Whashington DC.

43
Atwood, H.L., Fontenot, Q.C., Tomasso, J.R., Isely, J.J., 2001. Toxicity of nitrite to
Nile Tilapia: effect of fish size and environmental chloride. N. Am. J. Aquacult. 63,
49–51.
Avnimelech, Y., 1999. Carbon/nitrogen ratio as a control element in aquaculture
systems. Aquaculture 176, 227–235.
Avnimelech, Y., 2007. Feeding with microbial flocs by tilapia in minimal discharge
bio-flocs technology ponds. Aquaculture 264, 140–147.
Azaza, M.S., Khiari, N., Dhraief, M.N., Aloui, N., Kraϊem, M.M., Elfeki, A., 2015.
Growth performance, oxidative stress indices and hepatic carbohydrate metabolic
enzymes activities of juvenile Nile tilapia, Oreochromis niloticus L., in response to
dietary starch to protein ratios. Aquac. Res. 46, 14–27.
Azim, M.E., Little, D.C., Bron, J.E., 2007. Microbial protein production in activated
suspension tanks manipulating C/N ratio in feed and implications for fish culture.
Bioresource Technol. 99, 3590–3599.
Azim, M.E., Little, D.C., 2008. The bioflocs technology (BFT) in indoor tanks: water
quality, bioflocs composition, and growth and welfare of Nile tilapia (Oreochromis
niloticus). Aquaculture 283, 29–35.
Barak, Y., Cytryn, E., Gelfand, I., Krom, M., Van Rijn, J., 2003. Phosphorus removal in
a marine prototype recirculating aquaculture system. Aquaculture 220, 313–326.
Beutler, E. 1975. The preparation of red cells for assay, in: Beutler, E. (Ed.), Red cell
748 metabolism: a manual of biochemical methods. Grune & Straton, New York, pp.
8–18.
Bittencourt, N.L.R., Molinari, M.L., Scoaris, D.O., Pedroso, R.B., Nakamura, C.V.,
Ueda-Nakamura, T., Abreu Filho, B.A., Dias Filho, B.P., 2003. Haematological and
biochemical values for Nile tilapia Oreochromis niloticus cultured in semi-intensive
system. Acta Sci. Biol. Sci. 25 (2), 385–389.
Boyd, C., 1990. Water Quality in Ponds for Aquaculture. Auburn University, Alabama.
Birmingham Publishing Co., Alabama.
Braun, N., Lima, R.L., Baldisserotto, B., Dafre, A.L., Nuñer, A.P.O., 2010. Growth,
biochemical and physiological responses of Salminus brasiliensis with different
stocking densities and handling. Aquaculture 301, 22–30.
44
Browdy, C.L., Ray, A.J., Leffler, J.W., Avnimelech, Y., 2012. Biofloc-based
aquaculture systems. In: Tidwell, J.H. (Ed.), Aquaculture Production Technologies.
Wiley-Blackwell, Oxford, UK, pp. 278–307.
Castro, C., Pérez-Jiménez, A., Guerreiro, I., Peres, H., Castro-Cunha, M., Oliva-Teles,
A., 2012. Effects of temperature and dietary protein level on hepatic oxidative status
of Senegalese sole juveniles (Solea senegalensis). Comp. Biochem. Physiol. A 163,
372–378.
Cavalcante, D.H., Silva, S.R., Pinheiro, P.D., Akao, M.M.F., Sá, M.V.C., 2012. Single
or paired increase of total alkalinity and hardness of water for cultivation of Nile
tilapia juveniles, Oreochromis niloticus. Acta Sci. Technol. 32 (2), 177–183.
Cavalcante, D.H., Caldini, N.N., Silva, J.L.S., Lima, F.R.S., Sá, M.V.C., 2014.
Imbalances in the hardness/alkalinity ratio of water and Nile tilapia’s growth
performance. Acta Sci. Technol. 36 (1), 49–54.
De Schryver, P., Crab. R., Defoirdt, T., Boon, N., Verstraete, W., 2008. The basics of
bio-flocs technology: The added value for aquaculture. Aquaculture 277, 125–137.
Ebeling, J.M., Timmons, M.B., Bisogni, J.J., 2006. Engineering analysis of the
stoichiometry of photoautotrophic, autotrophic, and heterotrophic removal of
ammonia–nitrogen in aquaculture systems. Aquaculture 257, 346–358.
Ekasari, J., Crab, R., Verstraete, W., 2010. Primary Nutritional Content of Bio-Flocs
Cultured with Different Organic Carbon Sources and Salinity. Hayati J. Biosci. 17,
125–130.
Ekasari, J., Angela, D., Waluyo, S.H., Bachtiar, T., Surawidjaja, E.H., Bossier, P., De
Schryver, P., 2014. The size of biofloc determines the nutritional composition and
the nitrogen recovery by aquaculture animals. Aquaculture 426-427, 105-111.
El-Sayed, A.E.M., 2006. Tilapia culture. CAB International, Oxfordshire, UK.
El-Sherif, M.S., El-Feky, A.M.I., 2009. Performance of Nile tilapia (Oreochromis
niloticus) fingerlings. I. Effect of pH. Int. J. Agric. Biol. 11, 297–300.
Emerson, K., Russo, R.C., Lund, R.E., Thurston, R.V., 1975. Aqueous ammonia
equilibrium calculations: effect of pH and temperature. J. Fish. Res. Board Can. 32,
2379–2383.
45
Evans, J.J, Pasnik, D.J., 2006. Un-ionized ammonia exposure in Nile tilapia: toxicity,
stress response, and susceptibility to Streptococcus agalactiae. N. Am. J. Aquacult.
68, 23–33.
Furtado, P.S., Poersch, L.H., Wasielesky, W., 2011. Effect of calcium hydroxide,
carbonate and sodium bicarbonate on water quality and zootechnical performance of
shrimp Litopenaeus vannamei reared in bio-flocs technology (BFT) systems.
Aquaculture 321, 130–135.
Ganguly, S., Chatterjee, J., Jana, B.B., 1999. Biogeochemical cycling bacterial activity
in response to lime and fertilizer applications in pond systems. Aquacult. Int. 7, 413–
432.
Gaté, L., Paul, J., Nguyen Ba, G., Tew, K.D., Tapiero, H., 1999. Oxidative stress
induced in pathologies: the role of antioxidants. Biomed. Pharmacoter. 53, 169–180.
Hargreaves, J.A., 2013. Biofloc Production Systems for Aquaculture. Southern
Regional Aquaculture Center (SRAC) Publication No. 4503.
Hegazi, M.M., Attia, Z.I., Ashour, O.A., 2010. Oxidative stress and antioxidant
enzymes in liver and white muscle of Nile tilapia juveniles in chronic ammonia
exposure. Aquat. Toxicol. 99, 118–125.
Hermes-Lima, M., Willmore, W.G., Storey, K.B., 1995. Quantification of lipid
peroxidation in tissue extracts based on Fe(III) xylenol orange complex formation.
Free Radical Bio. Med. 19 (3), 271–280.
Jones, D.P., 2006. Redefining oxidative stress. Antioxid. Redox Signal. 8, 1865–79.
Jun, Q., Pao, X., Haizhen, W., Ruiwei, L., Hui, W., 2012. Combined effect of
temperature, salinity and density on the growth and feed utilization of Nile tilapia
juveniles (Oreochromis niloticus). Aquac. Res. 43, 1344–1356.
Yildiz, B.Y., Köksal, G., Borazan, G., Benli, Ç.K., 2006. Nitrite-induced
methemoglobinemia in Nile tilapia, Oreochromis niloticus. J. Appl. Ichthyol. 22,
427–429.
Yousuf, I., 2013. 38th Annual WIOA Qld Water Industry Operations Conference
Parklands, Glod Coast, pp. 95-101.
Li, W., Xu, W., Parise, J.B., Phillips, B.L., 2012. Formation of hydroxylapatite from co-
sorption of phosphate and calcium by boehmite. Geochim. Cosmochim. Ac. 85, 289–
301.
46
Long, L., Yang, J., Li, Y., Guan, C., Wu, F., 2015. Effect of biofloc technology on
growth, digestive enzyme activity, hematology, and immune response of genetically
improved farmed tilapia (Oreochromis niloticus). Aquaculture 448, 135–14.
López-Elías, J.A., Moreno-Arias, A., 2015. Proximate Composition of Bioflocs in
Culture Systems Containing Hybrid Red Tilapia Fed Diets with Varying Levels of
vegetable Meal Inclusion. N. Am. J. Aquacult. 77, 102–109.
Luo, G., Liang, W., Tan, H., Yao, C., Zhang, N., Lu, L., 2013. Effects of calcium and
magnesium addition on the start-up of sequencing batch reactor using biofloc
technology treating solid aquaculture waste. Aquacult. Eng. 57, 32–37.
Luo, G., Gao, Q., Wang, C., Liu, W., Sun, D., Li, L., Tan, H., 2014. Growth, digestive
activity, welfare, and partial cost-effectiveness of genetically improved farmed
tilapia (Oreochromis niloticus) cultured in a recirculating aquaculture system and an
indoor biofloc system. Aquaculture 422-423, 1–7.
Misra, H.P.; Fridovich, I., 1972. The role of superoxide anion in the autoxidation of
epinephrine and a simple assay for superoxide dismutase. J. Biol. Chem. 247 (10),
3170–3175.
Monserrat, J.M., Martinez, P.E., Geracitano, L.A., Amado, L.L., Martins, C.M.G.,
Pinho ,G.L.L., Chaves, I.S., Ferreira-Cravo, M., Ventura-Lima, J., Bianchini, A.,
2007. Pollution biomarkers in estuarine animals: critical review and new
perspectives. Comp. Biochem. Physiol. 146 (C), 221–34.
Peeters, B., Dewil, R., Lechat, D., Smets, I.Y., 2011. Quantification of the exchangeable
calcium in activated sludge flocs and its implication to sludge settleability. Separ.
Purif. Technol. 83, 1–8.
Qiang, J., Wang, H., Kpundeh, M.D., He, J., Xu, P., 2013. Effect of water temperature,
salinity, and their interaction on growth, plasma osmolality, and gill Na+, K+-
ATPase activity in juvenile GIFT tilapia Oreochromis niloticus (L.). J. Therm. Biol.
38, 331–338.
Ray, A.J., Lotz, J.M., 2014. Comparing a chemoautotrophic-based biofloc system and
three heterotrophic-based systems receiving different carbohydrate sources.
Aquacult. Eng. 63, 54–61.
47
Santos, V.B., Mareco, E.A., Silva, M.D.P., 2013. Growth curves of Nile tilapia
(Oreochromis niloticus) strains cultivated at different temperatures. Acta Sci. Anim.
Sci. 35 (3), 235–242.
Sinha, A.K., AbdElgawad, H., Giblen, T., Zinta, G., De Rop, M., Asard, H., Blust, R.,
De Boeck, G., 2014. Anti-Oxidative Defences Are Modulated Differentially in Three
Freshwater Teleosts in Response to Ammonia-Induced Oxidative Stress. PLoS ONE
9(4), e95319.
Strickland, J.D.H., Parsons, T.R., 1972. A Practical Handbook of Seawater Analysis.
Ottawa: Bulletin of Fisheries Research Board Canada, 310 pp.
Thunjai, T., Boyd, C.E., Boonyaratpalin, M., 2004. Quality of liming materials used in
aquaculture in Thailand. Aquacult. Int. 12 (2), 161–168.
Tran-Duy, A., Dam, A.A., Schrama, J.W. 2012. Feed intake, growth and metabolism of
Nile tilapia (Oreochromis niloticus) in relation to dissolved oxygen concentration.
Aquac. Res. 43, 730–744.
Unesco, 1983. Chemical methods for use in marine environmental monitoring. Manual
and Guides 12. Intergovernmental Oceanographic Commission, Paris, France.
Welker, A.F., Moreira, D.C., Campos, E.G., Hermes-Lima, M., 2013. Role of redox
metabolism for adaptation of aquatic animals to drastic changes in oxygen
availability. Comp. Biochem. Physiol. A 165, 384–404.
Winston, G.W., Regoli, F., Dugas, Jr A.J., Fong, J.H., Blanchard, K.A., 1998. A rapid
gas chromatographic assay for determining oxyradical scavenging capacity of
antioxidants and biological fluids. Free Radic. Biol. Med. 24, 480–93.
48
CAPÍTULO II
Growth, Water Quality and Oxidative Stress of Nile Tilapia Oreochromis niloticus
(L.) in Biofloc Technology System at Different pH
Gabriel Bernardes Martins, Carlos Eduardo Rosa, Fábio Tarouco, Ricardo Berteaux
Robaldo
Artigo submetido à revista Aquaculture.
49
Growth, Water Quality and Oxidative Stress of Nile Tilapia Oreochromis niloticus
(L.) in Biofloc Technology System at Different pH
Gabriel Bernardes Martins1*, Carlos Eduardo Rosa2, Fábio Tarouco2, Ricardo Berteaux
Robaldo1,3
¹ Instituto de Oceanografia, Programa de Pós Graduação em Aquicultura, Universidade
Federal do Rio Grande - FURG, CP 474, 96201-900, Rio Grande - RS, Brasil
² Instituto de Ciências Biológicas, Programa de Pós-Graduação em Ciências
Fisiológicas – Fisiologia Animal Comparada, Universidade Federal do Rio Grande -
FURG, Avenida Itália, Km 8, 96201-900, Rio Grande - RS, Brasil
³ Instituto de Biologia, Laboratório de Fisiologia Aplicada à Aquicultura, Universidade
Federal de Pelotas - UFPel, Campus Universitário, 96160-000, Capão do Leão - RS,
Brasil
Corresponding author: Estação Marinha de Aquicultura, Instituto de Oceanografia,
Universidade Federal do Rio Grande - FURG, C. P. 474, Rio Grande, RS CEP 96201-
900, Brasil. Email: [email protected].
Highlights
- It is beneficial for nitrification rate in the BFT system to start with pH of about
the 8.0.
- Growth of Nile tilapia in the BFT system utilizing pH 6.5–7.5 is the best
alternative.
- pH 6.5 produces less solid suspension than higher pH values.
- Reducing pH can result in low ionic alteration during production.
Abstract
Biofloc technology (BFT) is a sustainable alternative to Nile tilapia production, mainly
because of the nitrogen waste cycling that result in minimal water exchange. The
management of BFT, favoring the hetero and autotrophic bacterial growth, causes high
50
alkalinity consumption and consequent pH reduction. Previous research has
demonstrate that nitrification rate influences pH, therefore, to keep it at appropriate
levels, current practice involves adding alkalizing compounds, such as NaHCO3 to the
system. In this context, this study demonstrates the influence of pH on growth, survival,
water quality, on proximal composition of bioflocs and on oxidative stress of Nile
tilapia in the BFT system. Twenty-five fishes (3.68 ± 0.93 g) were distributed in each
tank (useful vol. 37.5 L), utilizing treatments in triplicate with medium levels of pH 6.5,
7.5 and 8.3 at 60 days. During the assay, the oxidation of total ammonia (TAN) to NO2-
was similar among the treatments. However to the oxidation of NO2- was slower at pH
6.5, with superior mean (10.1 ±1.0 mg/L), compared to pH 7.5 (7.0 ± 0.6 mg/L) and 8.3
(7.1 ± 1.5 mg/L). After the total oxidation of NO2- to NO3
-, does not was pH influence
about the nitrification. At the final experiment the fishes from the 7.5 treatment reached
higher final weight (44.1 ± 0.9 g) compared to pH 8.3 (37.1 ± 3.9 g). At pH 6.5 the final
weight was similar to that observed with other treatments (40.4 ± 4.1 g). In contrast, the
survival, specific growth rate (SGR) and the food conversion rate (FCR) were not
affected by treatments. Moreover, the bioflocs at pH 6.5 demonstrate more crude
protein and ash content when compared to other treatments. When evaluating glucose,
hematocrit and osmolality, the results were similar among the treatments and they are
within the range considered normal for Nile tilapia. Further, to assess the oxidative
stress for antioxidant capacity against peroxy radicals (ACAP), lipidic peroxidation
(LPO) and superoxide dismutase (SOD) and catalase (CAT) activity, no alterations
were detected. This result indicates that pH in the range of 6.5 to 8.3 does not cause
hematologic or oxidative damage. Thus, the present study demonstrates that BFT for a
Nile tilapia nursery, utilizing the range of pH 6.5 to 7.5 after the establishment of
complete nitrification, promotes the best results in terms of growth and productivity.
Keywords: ions, nursery, heterotrophic, autotrophic, solid suspension
1. Introduction
Biofloc technology (BFT) represents an alternative to Nile tilapia production, with
advantages related to broodstock maintenance (Ekasari et al. 2015a) and larval
51
production (Ekasari et al. 2015b), as well as improved of digestive enzymes activities
and immune function (Long et al. 2015). The BFT uses low water renovation and high
stocking density, because of nitrogen (N) inorganic cycling, which is performed for a
variety of organisms, such as bacteria, microalgae, fungi, zooplankton and protozoa is
associate with extracellular polymeric substances (EPS) and organic material (De
Schryver et al. 2008).
In BFT, bacteria are mainly responsible for nitrogen waste cycling, and basically
two primary groups compose the bioflocs: heterotrophics and autotrophics bacteria. To
add organic carbon to the system, the heterotrophic bacteria would assimilate
ammoniacal nitrogen quickly, producing microbial biomass (Avnimelech 1999). Due to
fast growth, this group is responsible for high production and the accumulation of solids
in the system, aside from oxygen oscillations due to this significant consumption
(Hargreaves 2006, De Schryver and Verstraete 2009). Different strategies for organic
fertilization have been proposed for biofloc formation on Nile tilapia production, for
example the utilization of different C:N (Pérez-Fuentes et al. 2016) ratios and carbon
sources (Ekasari et al. 2010).
In contrast, the autotrophic bacteria utilize inorganic carbon, mainly from of
alkalinity, and realize the nitrification process in two steps. First the ammonium is
oxidized to nitrite and after to nitrate, which is a less toxic nitrogen compound (Burton
and Prosser 2001). After the establishment of complete nitrification, the process is
reliable, however, the establishment and growth of bacterial groups can be inconsistent
and slow, causing oscillations mainly related to nitrite oxidation. The nitrification is
generally utilized in recirculating aquaculture systems (RAS), being used substrates for
adhesion of the bacterial groups (Timmons et al. 2010). The main advantages of
autotrophic bacteria are the less solid production and reduced oxygen consumption,
when compared to heterotrophics (Ebeling et al. 2006).
The nitrification rate is influenced by N inorganic level, bacterial biomass,
temperature, oxygen and pH (Chen et al. 2006). Therefore, the water quality control is
very important, and various studies were performed on systems for effluent treatments
and bioreactors, to test pH levels in order to evaluate the nitrification rate. Varied results
are found in the literature; in his review Gujer (2010) quotes a range of pH from 6.2 to
52
8.0, while Jimenez et al. (2011) demonstrates that a range between 7.0 and 8.0 is ideal
for nitrification in a reactor of activated sludge.
Besides harming to the functioning of BFT system operation, the pH oscillations
can represent physiologic challenges to fishes. The decrease of pH has been related to
disturbances in acid-base balance, increased of gill permeability and consequent ionic
loses and water absorption (Wood 2001), besides the alteration on ammonia excretion
(Golombieski et al. 2013) and oxidative stress (Mai et al. 2010).
Previous studies on BFT systems for Nile tilapia have reported alkalinity
consumption and pH reduction (Azim and Little 2008; Pérez-Fuentes et al. 2016),
however, no studies testing these variables for BFT have been performed. The
utilization of systems with pH below of the neutrality can be favorable to Nile tilapia
growth, and it is has been shown that growth improves in ponds utilizing pH between
4–6 (Rebouças et al. 2015). However, as previously mentioned, the pH below of 7.0
may compromise the nitrogen cycling. Thus, for pH maintenance, the utilization of
alkalizing compound is necessary. Considering the mentioned above, this study aims to
investigate the BFT utilization with pH 6.5, 7.5 and 8.3, evaluating the growth, water
quality, proximate composition, hematology and oxidative stress of Nile tilapia in a
nursery on the BFT system.
2. Materials and methods
2.1. Management and experimental design
The monosex Nile tilapia juveniles (Premium genetic) acquired from Aquabel
commercial hatchery (Rolândia, PR, BR), and transported to “Laboratório de
Piscicultura do Chasqueiro (Universidade Federal de Pelotas, RS, BR), where assay
occurred. For acclimation, the fishes were maintained in recirculation aquaculture
system for fifteen days, until the experiment initiate. During acclimation and assay, the
Nile tilapias were fed with commercial feed (Guabi Nutrição e Saúde Animal S.A., BR)
on equal amounts at 08:00, 11:00, 14:00 and 17:00 h (Tab 1).
The assay lasted for 60 days. Twenty five fishes (3.68 ± 0.93 g) were distributed
for each experimental unit (useful vol. 37.5 L). The tanks had two air stones in bottom
for continuous aeration and were heated (100W) with thermostat (adjusted to 28°C).
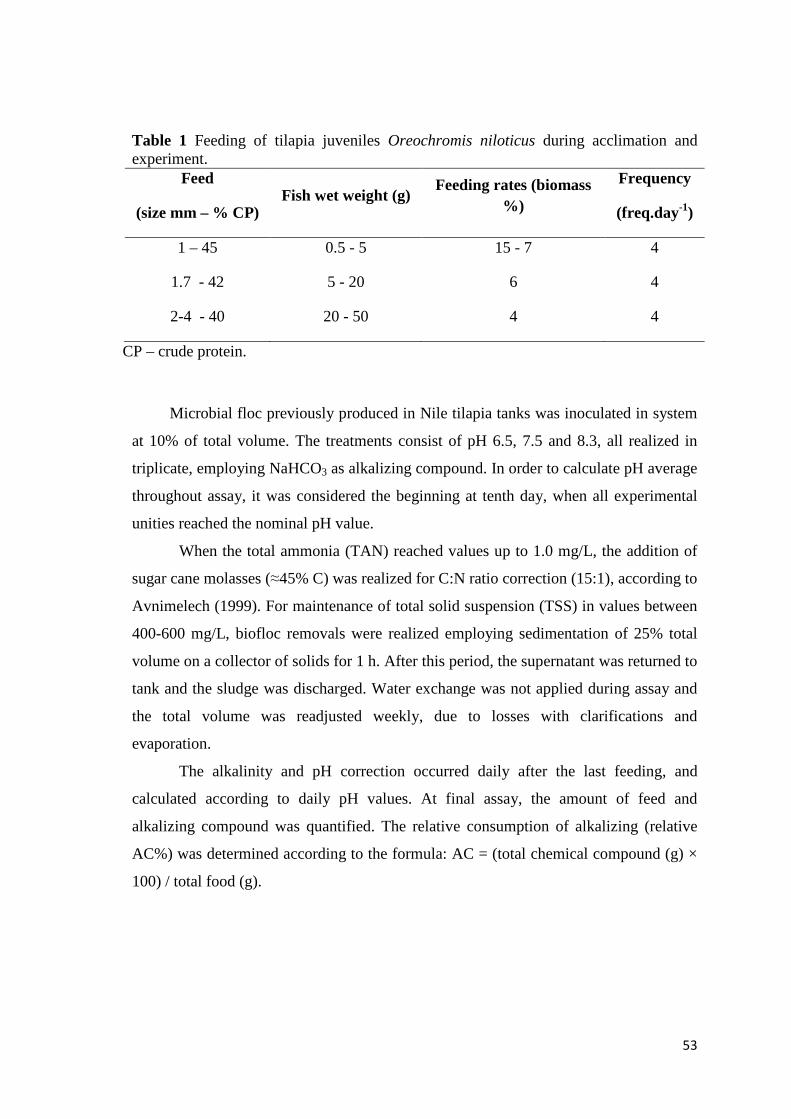
53
Table 1 Feeding of tilapia juveniles Oreochromis niloticus during acclimation and experiment.
Feed
(size mm – % CP) Fish wet weight (g)
Feeding rates (biomass %)
Frequency
(freq.day-1)
1 – 45 0.5 - 5 15 - 7 4
1.7 - 42 5 - 20 6 4
2-4 - 40 20 - 50 4 4
CP – crude protein.
Microbial floc previously produced in Nile tilapia tanks was inoculated in system
at 10% of total volume. The treatments consist of pH 6.5, 7.5 and 8.3, all realized in
triplicate, employing NaHCO3 as alkalizing compound. In order to calculate pH average
throughout assay, it was considered the beginning at tenth day, when all experimental
unities reached the nominal pH value.
When the total ammonia (TAN) reached values up to 1.0 mg/L, the addition of
sugar cane molasses (≈45% C) was realized for C:N ratio correction (15:1), according to
Avnimelech (1999). For maintenance of total solid suspension (TSS) in values between
400-600 mg/L, biofloc removals were realized employing sedimentation of 25% total
volume on a collector of solids for 1 h. After this period, the supernatant was returned to
tank and the sludge was discharged. Water exchange was not applied during assay and
the total volume was readjusted weekly, due to losses with clarifications and
evaporation.
The alkalinity and pH correction occurred daily after the last feeding, and
calculated according to daily pH values. At final assay, the amount of feed and
alkalizing compound was quantified. The relative consumption of alkalizing (relative
AC%) was determined according to the formula: AC = (total chemical compound (g) ×
100) / total food (g).
54
2.2. Water quality and growth performance
The temperature and dissolved oxygen were measured twice a day (07:45 and
16:00 h), utilizing YSI PRO 20 (YSI Incorporated, Yellow Springs, OH, USA). The pH
was daily measured (16:15 h) with digital pHmeter (HI 2212, HANNA Instrument,
Woonsocket, RI, USA). Twice a week, TAN (UNESCO 1983), NO2-, total alkalinity
(APHA, 1998), total solid suspension (Strickland and Parsons 1972), floc volume (FV)
(Imhoff Cone – 30 min) and total hardness (Eaton et al. 2005) were dosed. For TAN
and NO2- the samples were collected after the first feeding. NO3
- and PO4- (Aminot and
Chaussepied 1983), Na+ (photometer flame, B462, Micronal, BR) and the Ca+2
(Arsenazo calcium, Doles, BR), were dosed only at the end of assay. The floc volume
index was determinate according following formula: FVI = FV (mL) / SST (g) (Yousuf
2013).
Weekly biometrics (n=10) (fishes were sedated with benzocaine 50ppm) were
realized, for feed adjustment, according to Table 1. At final assay, weight were
quantified for all fishes for evaluation of following parameters:
a) Daily growth rate (g/day) = fish biomass increase (g) / time (days)
b) Survival rate (%) = 100 (Nf-Ni) / Ni
c) Net yield = fish biomass increase (g) *1000 / Vol (L)
d) Feed conversion rate (FCR) = feed supply (g) / fish biomass increase (g)
Where Ni e Nf are initial and final number of fishes.
2.3. Tissue collection and hematological analyses
Tissue samples (n = 6 fishes/tank) were collected for analyses at the end of
experimental period. The fishes were anesthetized with benzocaine (50ppm) for blood
collection. The blood was withdrawn via the arterial caudal fin (anticoagulant EDTA
10%, 1mL sterile syringe, 25 gauge needle) and centrifuged (10min, 1500 × g) for
plasma collections. After the blood collection, the fish were euthanized for spinal
medulla rupture and then tissue samples (gill and liver) were collected. The samples of
the blood plasma, gill and liver were initially maintained at -180°C and after to -90°C
until the analyses.
55
After blood collection, glucose (Accu Chek Performa, UK) and hematocrit (15
min, 12000 RPM) were measured, while the plasma was subsequently utilized for the
osmolality measurement (Vapro®Vapor Pressure Osmometer, Wescor 5600, Logan,
UT).
2.4. Proximate Analyses
The proximate analyses of the bioflocs were realized on duplicate. The
methodologies utilized are described for AOAC (1999). For the ash content (method
access number: #942.05), the samples were burned in muffle for 4h at 600°C. The
Kjeldhal method was used for the total protein determination (#984.13) after the acid
digestion samples and nitrogen distillation. To calculate the protein content, the 6.5
coefficient was used. While for the ethereal fraction extraction (#920.39), extraction in
Soxhlet was used for 6h, with petroleum ether as the solvent.
2.5. Biochemical Measurements
For biochemical dosages, two pools of two fish/tanks, totaling six pools, were
utilized for each treatment. The samples were homogenized (1:4 w/v) in buffer (specific
for each methodology), centrifuged (20.000 × g, 20 min, 4°C) and the supernatant was
utilized. The total protein content was determined in triplicate, utilizing the Biuret assay
(Doles, BR) in a microplate reader (550 nm).
The samples for catalase (CAT) and superoxide dismutase (SOD) activities were
homogenized (1:4 w/v) in buffer adjusted to pH 7.6, containing Tris base (20mM),
EDTA (1mM), dithiothreitol (DTT, 1mM), sucrose (500mM), KCl (150mM) and
phenylmethylsulfonyl fluoride (PMSF, 100mM).
The CAT was measured for an initial decomposition rate of 50mM H2O2
monitored spectrophotometrically at 240nm (Beutler 1975). The results are expressed as
CAT units, where one unit is the enzyme amount that hydrolyzes 1µmol of H2O2 for one
minute and for the protein mg at 30°C and pH 8.0.
The SOD was determined based on the inhibition of epinephrine auto-oxidation
on the alkali medium by SOD enzyme, which was monitored at 480 nm. The activity is
56
expressed as U SOD at 30°C and pH 8.0, where one unit is defined as the enzyme
amount that inhibits 50% of epinephrine auto-oxidation per mg of protein (Misra and
Fridovich 1972). For SOD activity, only the liver activity was possible accomplish.
For the antioxidant capacity against peroxyl radicals (ACAP) determination, the
tissue were homogenized in buffer adjusted to pH 7.75, containing Tris-HCl (100mM),
disodium EDTA (2mM) e MgCl2.6H2O (5mM). This was determined employing the
fluorescence dye 2,7-dichlorofluorescein diacetate (H2DCF-DA – Molecular Probes) in
the presence or absence of a peroxyl radical generator 2, 2′-azobis 2
methylpropionamidine dihydrochloride (ABAP; 4mM; Aldrich), which decomposes at
37°C producing peroxyl radical (Winston et al. 1998). The difference in the
fluorescence area (at excitation and emission wavelengths of 488 nm and 525 nm,
respectively) with or without ABAP was considered as the antioxidant capacity (Amado
et al. 2009).
For the lipid peroxidation (LPO) determination, the samples were homogenized
(1:4 w/V) in methanol (100%, 4°C). The homogenized samples were centrifuged (1000
× g for 10 min, 4°C) and the supernatant was employed for determination. The LPO was
measured using the FOX method (Hermes-Lima et al. 1995), which is based on Fe+2
oxidation by lipid hidroperoxides (FOX reactive substances) at an acid pH with Fe+
complexing dye xylenol orange. The cumene hydroperoxide was used as the standard.
The results are expressed as ηmol cumene hydroperoxide/g tissue.
2.6. Statistic Analysis
Previously, the data normality (Shapiro-Wilk) and homoscedasticity were
analyzed. The results were compared by ANOVA (One Way) and posterior Tukey test
(p<0.05). The analyses were realized on SigmaPlot 12.0 software (Systat Software, Inc.,
Chicago, IL). Data were presented as average ± standard deviation.
3. Results
The results of water quality are presented in Tab. 2. The average temperature
and dissolved oxygen do not differ among treatments. According the proposed, the
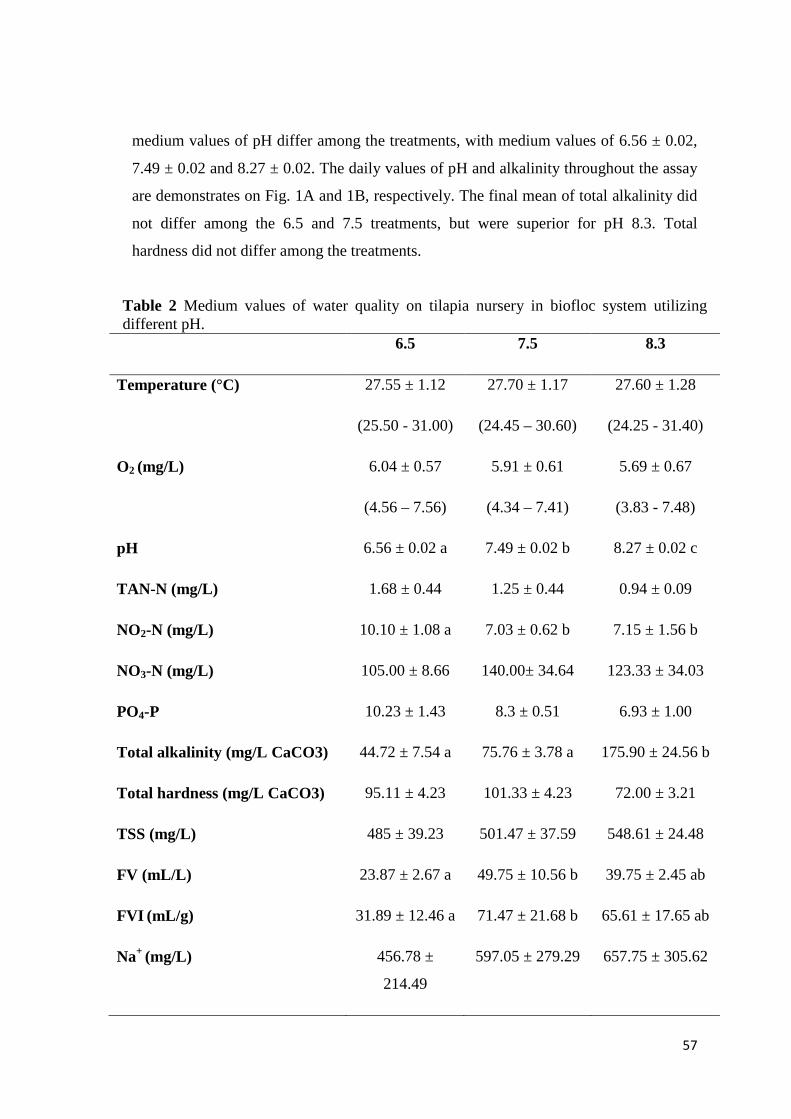
57
medium values of pH differ among the treatments, with medium values of 6.56 ± 0.02,
7.49 ± 0.02 and 8.27 ± 0.02. The daily values of pH and alkalinity throughout the assay
are demonstrates on Fig. 1A and 1B, respectively. The final mean of total alkalinity did
not differ among the 6.5 and 7.5 treatments, but were superior for pH 8.3. Total
hardness did not differ among the treatments.
Table 2 Medium values of water quality on tilapia nursery in biofloc system utilizing different pH.
6.5 7.5 8.3
Temperature (°C) 27.55 ± 1.12
(25.50 - 31.00)
27.70 ± 1.17
(24.45 – 30.60)
27.60 ± 1.28
(24.25 - 31.40)
O2 (mg/L) 6.04 ± 0.57
(4.56 – 7.56)
5.91 ± 0.61
(4.34 – 7.41)
5.69 ± 0.67
(3.83 - 7.48)
pH 6.56 ± 0.02 a 7.49 ± 0.02 b 8.27 ± 0.02 c
TAN-N (mg/L) 1.68 ± 0.44 1.25 ± 0.44 0.94 ± 0.09
NO2-N (mg/L) 10.10 ± 1.08 a 7.03 ± 0.62 b 7.15 ± 1.56 b
NO3-N (mg/L) 105.00 ± 8.66 140.00± 34.64 123.33 ± 34.03
PO4-P 10.23 ± 1.43 8.3 ± 0.51 6.93 ± 1.00
Total alkalinity (mg/L CaCO3) 44.72 ± 7.54 a 75.76 ± 3.78 a 175.90 ± 24.56 b
Total hardness (mg/L CaCO3) 95.11 ± 4.23 101.33 ± 4.23 72.00 ± 3.21
TSS (mg/L) 485 ± 39.23 501.47 ± 37.59 548.61 ± 24.48
FV (mL/L) 23.87 ± 2.67 a 49.75 ± 10.56 b 39.75 ± 2.45 ab
FVI (mL/g) 31.89 ± 12.46 a 71.47 ± 21.68 b 65.61 ± 17.65 ab
Na+ (mg/L) 456.78 ±
214.49
597.05 ± 279.29 657.75 ± 305.62
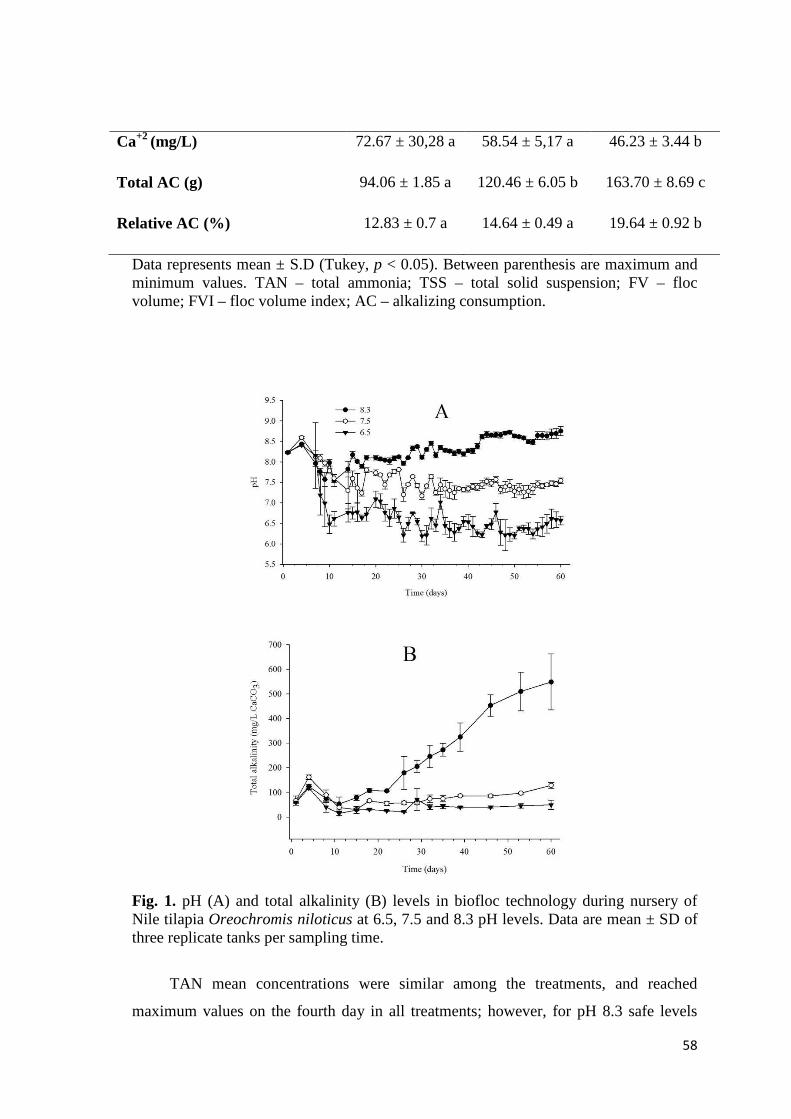
58
Ca+2 (mg/L) 72.67 ± 30,28 a 58.54 ± 5,17 a 46.23 ± 3.44 b
Total AC (g) 94.06 ± 1.85 a 120.46 ± 6.05 b 163.70 ± 8.69 c
Relative AC (%) 12.83 ± 0.7 a 14.64 ± 0.49 a 19.64 ± 0.92 b
Data represents mean ± S.D (Tukey, p < 0.05). Between parenthesis are maximum and minimum values. TAN – total ammonia; TSS – total solid suspension; FV – floc volume; FVI – floc volume index; AC – alkalizing consumption.
Fig. 1. pH (A) and total alkalinity (B) levels in biofloc technology during nursery of Nile tilapia Oreochromis niloticus at 6.5, 7.5 and 8.3 pH levels. Data are mean ± SD of three replicate tanks per sampling time.
TAN mean concentrations were similar among the treatments, and reached
maximum values on the fourth day in all treatments; however, for pH 8.3 safe levels
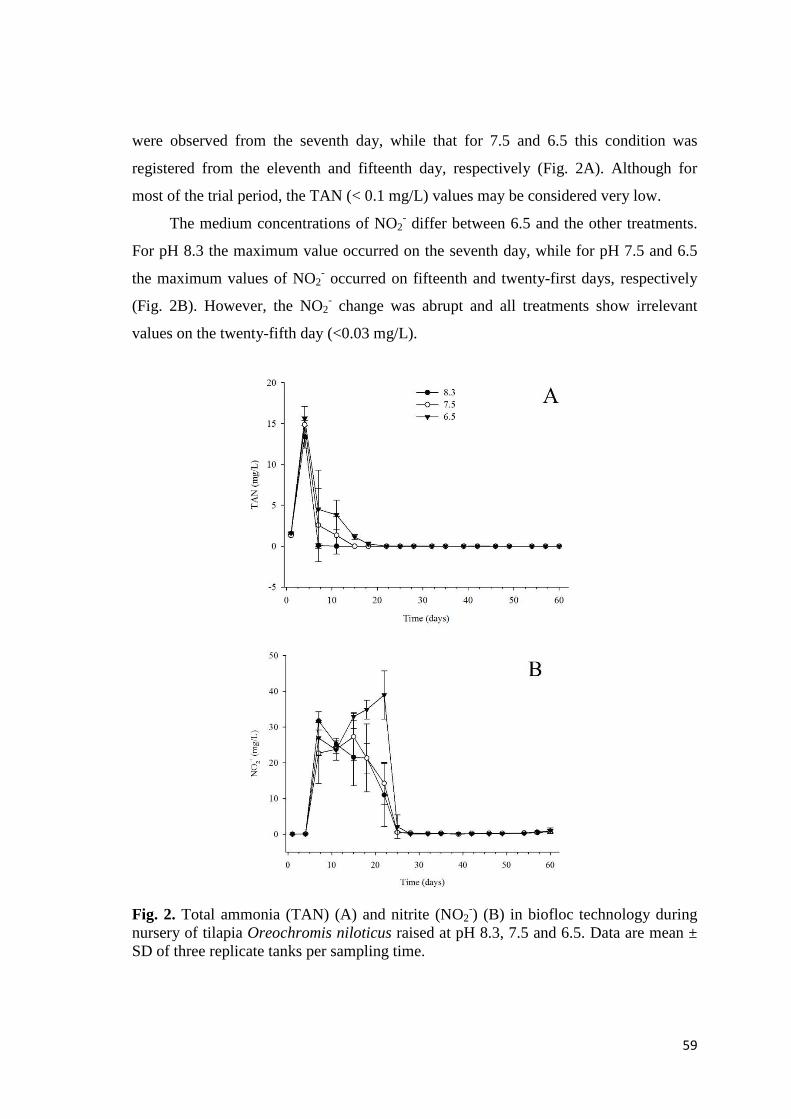
59
were observed from the seventh day, while that for 7.5 and 6.5 this condition was
registered from the eleventh and fifteenth day, respectively (Fig. 2A). Although for
most of the trial period, the TAN (< 0.1 mg/L) values may be considered very low.
The medium concentrations of NO2- differ between 6.5 and the other treatments.
For pH 8.3 the maximum value occurred on the seventh day, while for pH 7.5 and 6.5
the maximum values of NO2- occurred on fifteenth and twenty-first days, respectively
(Fig. 2B). However, the NO2- change was abrupt and all treatments show irrelevant
values on the twenty-fifth day (<0.03 mg/L).
Fig. 2. Total ammonia (TAN) (A) and nitrite (NO2-) (B) in biofloc technology during
nursery of tilapia Oreochromis niloticus raised at pH 8.3, 7.5 and 6.5. Data are mean ± SD of three replicate tanks per sampling time.
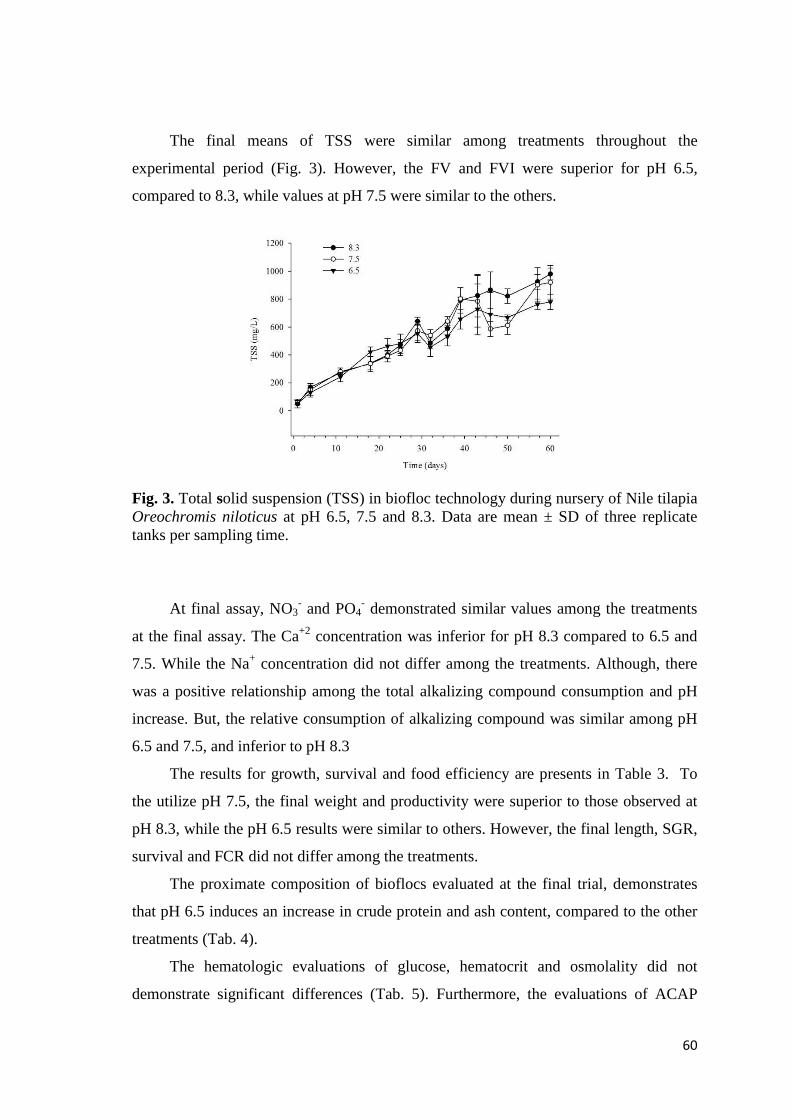
60
The final means of TSS were similar among treatments throughout the
experimental period (Fig. 3). However, the FV and FVI were superior for pH 6.5,
compared to 8.3, while values at pH 7.5 were similar to the others.
Fig. 3. Total solid suspension (TSS) in biofloc technology during nursery of Nile tilapia Oreochromis niloticus at pH 6.5, 7.5 and 8.3. Data are mean ± SD of three replicate tanks per sampling time.
At final assay, NO3- and PO4
- demonstrated similar values among the treatments
at the final assay. The Ca+2 concentration was inferior for pH 8.3 compared to 6.5 and
7.5. While the Na+ concentration did not differ among the treatments. Although, there
was a positive relationship among the total alkalizing compound consumption and pH
increase. But, the relative consumption of alkalizing compound was similar among pH
6.5 and 7.5, and inferior to pH 8.3
The results for growth, survival and food efficiency are presents in Table 3. To
the utilize pH 7.5, the final weight and productivity were superior to those observed at
pH 8.3, while the pH 6.5 results were similar to others. However, the final length, SGR,
survival and FCR did not differ among the treatments.
The proximate composition of bioflocs evaluated at the final trial, demonstrates
that pH 6.5 induces an increase in crude protein and ash content, compared to the other
treatments (Tab. 4).
The hematologic evaluations of glucose, hematocrit and osmolality did not
demonstrate significant differences (Tab. 5). Furthermore, the evaluations of ACAP
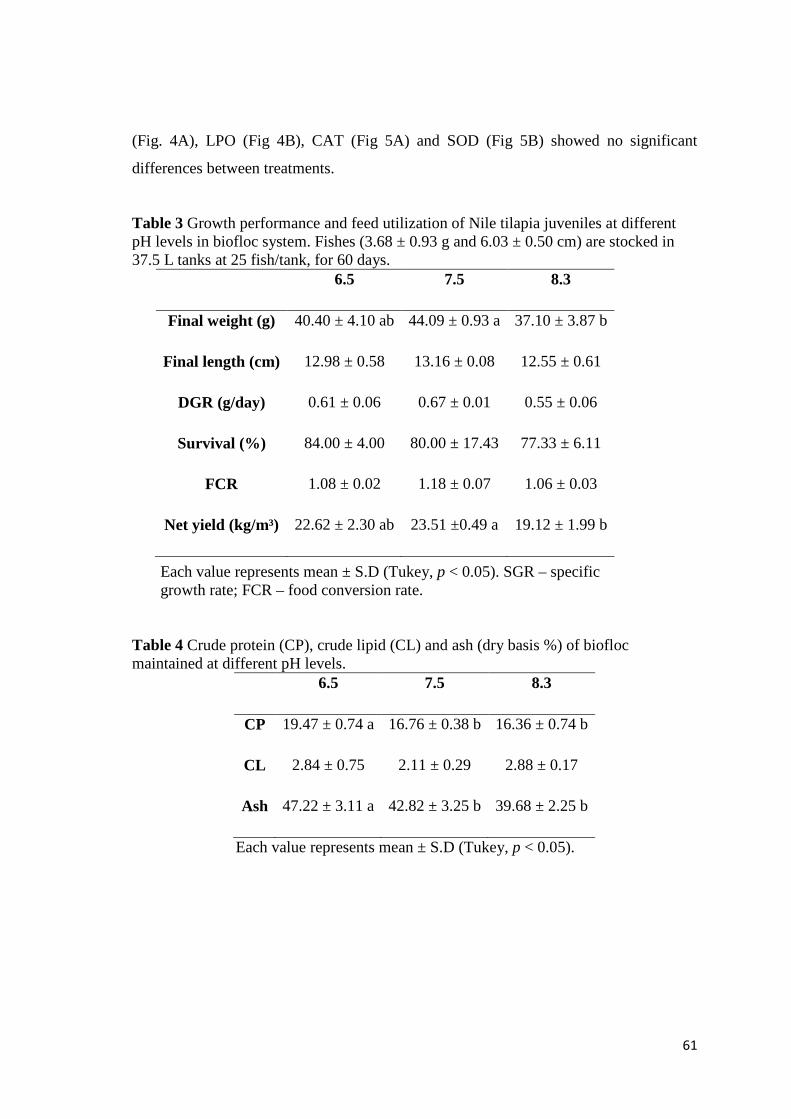
61
(Fig. 4A), LPO (Fig 4B), CAT (Fig 5A) and SOD (Fig 5B) showed no significant
differences between treatments.
Table 3 Growth performance and feed utilization of Nile tilapia juveniles at different pH levels in biofloc system. Fishes (3.68 ± 0.93 g and 6.03 ± 0.50 cm) are stocked in 37.5 L tanks at 25 fish/tank, for 60 days.
Each value represents mean ± S.D (Tukey, p < 0.05). SGR – specific growth rate; FCR – food conversion rate.
Table 4 Crude protein (CP), crude lipid (CL) and ash (dry basis %) of biofloc maintained at different pH levels.
6.5 7.5 8.3
CP 19.47 ± 0.74 a 16.76 ± 0.38 b 16.36 ± 0.74 b
CL 2.84 ± 0.75 2.11 ± 0.29 2.88 ± 0.17
Ash 47.22 ± 3.11 a 42.82 ± 3.25 b 39.68 ± 2.25 b
Each value represents mean ± S.D (Tukey, p < 0.05).
6.5 7.5 8.3
Final weight (g) 40.40 ± 4.10 ab 44.09 ± 0.93 a 37.10 ± 3.87 b
Final length (cm) 12.98 ± 0.58 13.16 ± 0.08 12.55 ± 0.61
DGR (g/day) 0.61 ± 0.06 0.67 ± 0.01 0.55 ± 0.06
Survival (%) 84.00 ± 4.00 80.00 ± 17.43 77.33 ± 6.11
FCR 1.08 ± 0.02 1.18 ± 0.07 1.06 ± 0.03
Net yield (kg/m³) 22.62 ± 2.30 ab 23.51 ±0.49 a 19.12 ± 1.99 b
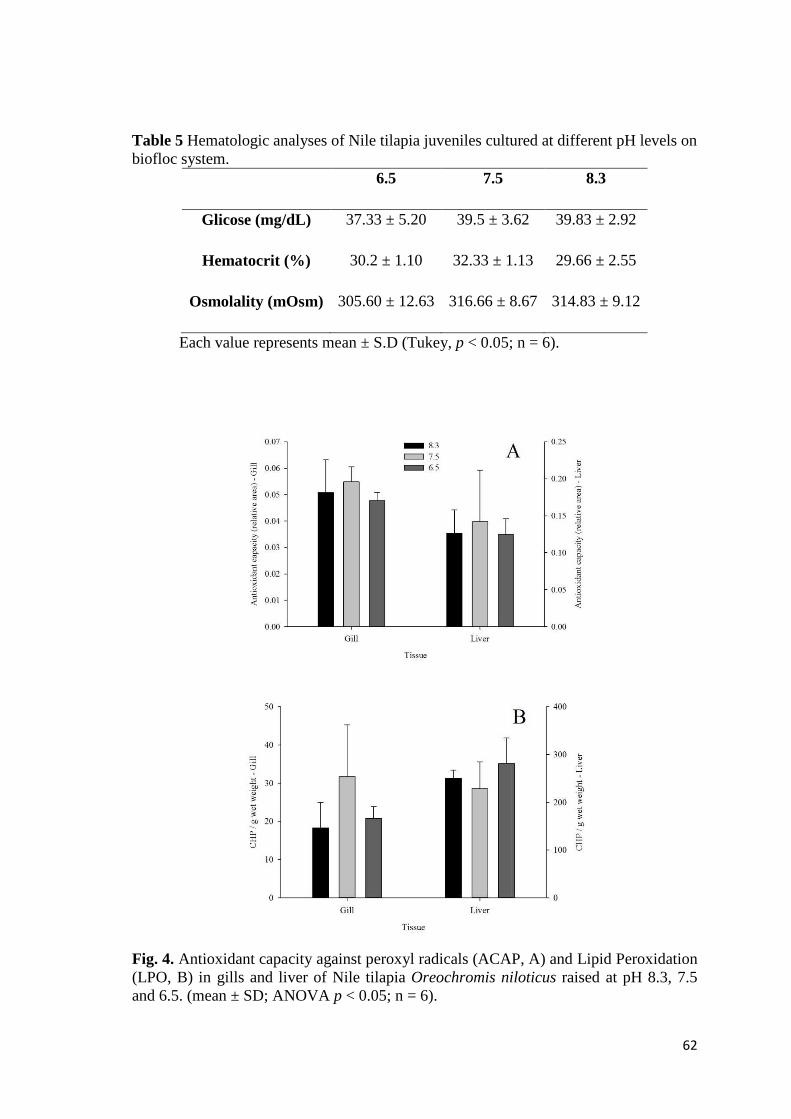
62
Table 5 Hematologic analyses of Nile tilapia juveniles cultured at different pH levels on biofloc system.
6.5 7.5 8.3
Glicose (mg/dL) 37.33 ± 5.20 39.5 ± 3.62 39.83 ± 2.92
Hematocrit (%) 30.2 ± 1.10 32.33 ± 1.13 29.66 ± 2.55
Osmolality (mOsm) 305.60 ± 12.63 316.66 ± 8.67 314.83 ± 9.12
Each value represents mean ± S.D (Tukey, p < 0.05; n = 6).
Fig. 4. Antioxidant capacity against peroxyl radicals (ACAP, A) and Lipid Peroxidation (LPO, B) in gills and liver of Nile tilapia Oreochromis niloticus raised at pH 8.3, 7.5 and 6.5. (mean ± SD; ANOVA p < 0.05; n = 6).

63
Fig. 5. Catalase (CAT) (A) and superoxide dismutase (SOD) (B) activity in gills and liver of Nile tilapia Oreochromis niloticus raised at pH 8.3, 7.5 and 6.5. (mean ± SD; ANOVA p < 0.05; n = 6).
4. Discussion
Throughout the assay, the temperature and dissolved oxygen range remained at
suitable levels for the survival and growth of Nile tilapia (Santos et al. 2013, Tran-Duy
et al. 2012). According to the aim of this present study, the pH values differ among
treatments, but the average of total alkalinity was equal for 6.5 and 7.5, and superior to
8.3.
Utilizing the fertilization with C organic strategy only for TAN > 1.0 mg/L is
favorable to initial heterotrophic growth, which is responsible for rapid TAN
consumption. Therefore, throughout the production cycle the C:N ratio decreases, which
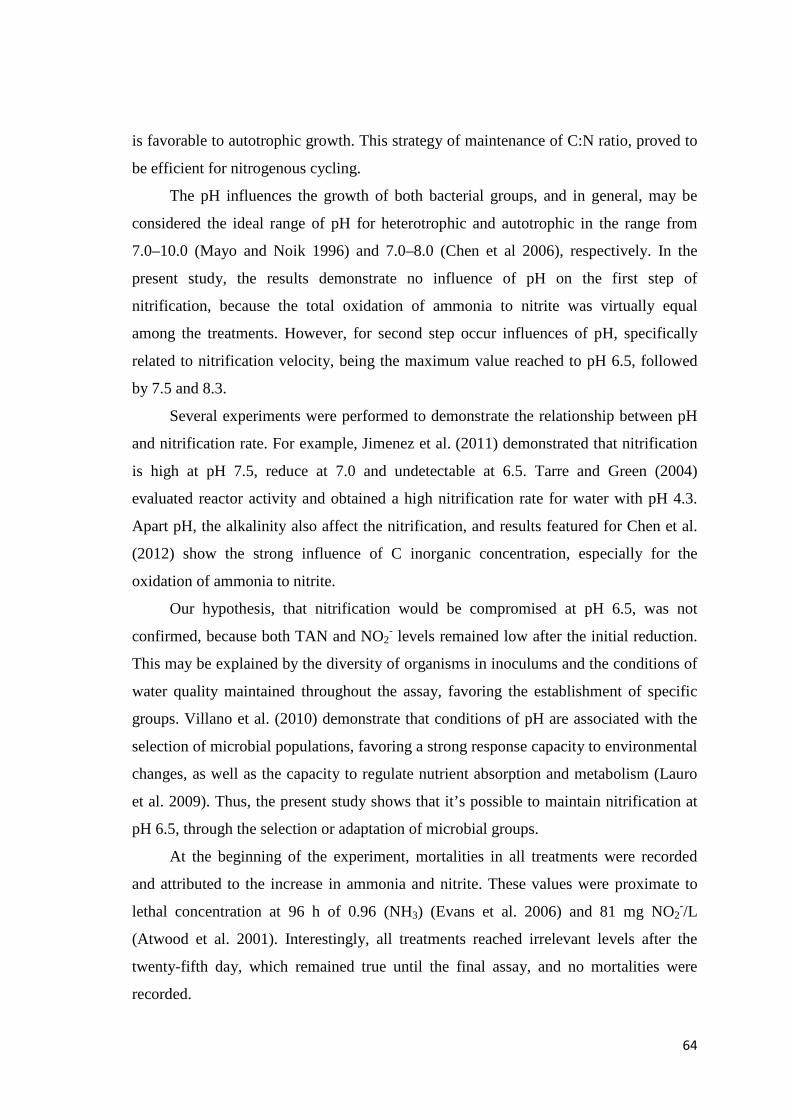
64
is favorable to autotrophic growth. This strategy of maintenance of C:N ratio, proved to
be efficient for nitrogenous cycling.
The pH influences the growth of both bacterial groups, and in general, may be
considered the ideal range of pH for heterotrophic and autotrophic in the range from
7.0–10.0 (Mayo and Noik 1996) and 7.0–8.0 (Chen et al 2006), respectively. In the
present study, the results demonstrate no influence of pH on the first step of
nitrification, because the total oxidation of ammonia to nitrite was virtually equal
among the treatments. However, for second step occur influences of pH, specifically
related to nitrification velocity, being the maximum value reached to pH 6.5, followed
by 7.5 and 8.3.
Several experiments were performed to demonstrate the relationship between pH
and nitrification rate. For example, Jimenez et al. (2011) demonstrated that nitrification
is high at pH 7.5, reduce at 7.0 and undetectable at 6.5. Tarre and Green (2004)
evaluated reactor activity and obtained a high nitrification rate for water with pH 4.3.
Apart pH, the alkalinity also affect the nitrification, and results featured for Chen et al.
(2012) show the strong influence of C inorganic concentration, especially for the
oxidation of ammonia to nitrite.
Our hypothesis, that nitrification would be compromised at pH 6.5, was not
confirmed, because both TAN and NO2- levels remained low after the initial reduction.
This may be explained by the diversity of organisms in inoculums and the conditions of
water quality maintained throughout the assay, favoring the establishment of specific
groups. Villano et al. (2010) demonstrate that conditions of pH are associated with the
selection of microbial populations, favoring a strong response capacity to environmental
changes, as well as the capacity to regulate nutrient absorption and metabolism (Lauro
et al. 2009). Thus, the present study shows that it’s possible to maintain nitrification at
pH 6.5, through the selection or adaptation of microbial groups.
At the beginning of the experiment, mortalities in all treatments were recorded
and attributed to the increase in ammonia and nitrite. These values were proximate to
lethal concentration at 96 h of 0.96 (NH3) (Evans et al. 2006) and 81 mg NO2-/L
(Atwood et al. 2001). Interestingly, all treatments reached irrelevant levels after the
twenty-fifth day, which remained true until the final assay, and no mortalities were
recorded.
65
The low or zero water exchange characteristic of the BFT system, is associated
with the correct management of water quality, providing for establishment and growth
of nitrifying bacteria (Avnimelech 2012). This favors the accumulation of NO3- and
phosphate. In the present study, the NO3- concentrations at ultimately reached levels
that indicate intense nitrifying activity, but more studies about the nitrate toxicity for
Nile tilapia are needed.
At the final assay, PO4- levels were low. Similarly, Luo et al. (2014) demonstrate
low concentrations of phosphate on BFT compared to RAS, indicating PO4- cycling by
microorganisms is present in bioflocs. Similarly, Ray and Lotz (2014) also found low
concentration of PO4-, which they attributed to absorption by heterotrophic bacteria, as
demonstrate for Longnecker et al. (2010). The monitoring of NO3- and PO4
- is
fundamental, both for reuse as well as for discharge as effluent.
At high stocking densities the TSS and their control are a limiting factor, and the
removal of excessive bioflocs is necessary (Ray et al. 2010). After the fortieth day the
TSS reached values superior to 600 mg/L in all treatments; however, no excessive
reduction of dissolved oxygen or nitrification oscillation occurred. Although the sludge
volume removed on each clarification was not recorded, increases in pH are
accompanied by a larger number of clarifications compared to pH 6.5, indicating higher
solid production in the system under higher pH values. Thus, keeping the BFT system at
pH 6.5 can also be an advantage, related to less solid production.
The FV and TSS proportion represent the FVI, which is related to biofloc density
(length, weight and porosity). According to De Schryver et al. (2008), the ideal range of
FVI is between 40-60 mL/g for waste treatment systems, which is considered an
intermediate range that favors the permanency in the water column as well as
sedimentation. The present results demonstrate FV and FVI reduction when utilized pH
6.5 or 8.5, while the upper FV and FVI values were obtained for pH 7.5. The higher
FVI (less density) reached can be attributed to further development of heterotrophic
bacteria that give low density to bioflocs, due to the pH 7.5 is within the ideal range for
growth of these group (Mayo and Noyk 1996), in contrast to the other treatments.
Management of the BFT system favors the ionic increase, because of the
alkalinity correction and water reposition lost by evaporation and during clarification
process. Recently, Pérez-Fuentes et al. (2016) have demonstrated increased dissolved
66
salts with increases in the C:N ratio. Besides that, NaHCO3 utilization results in Na+
accumulation, and the present study found that the final concentration of these ion did
not differ among the treatments. However, greater use occurred for NaHCO3 with
increased pH. Most likely for a more long time, the Na+ concentration is the largest for
the highest pH levels.
Although total hardness did not differ among the treatments, the Ca+2
concentration demonstrated reduction at increases pH, and these can be attributed to
higher production of extracellular polymeric substances (EPS) for bacteria and biofloc
removal according to increases in pH. The Ca+2 adhesion in floc structures is associated
with the neutralization of negative charges of EPS, favoring the adhesion of
microorganisms (Wilén et al. 2008, Ye et al. 2016). The Na+ and Ca+2 are fundamental
to the formation of floc structure (Peeters et al. 2011), and their accumulation
throughout the cycle deserves further investigation in the context of BFT system, with
particular attention to water reuse.
The nutritional composition of bioflocs is a form to characterize the nutritional
contribution to fishes. Our results demonstrate that crude protein remained below of the
values previously reported in the literature, while crude lipids it is within the range
previously demonstrated (Azim et al. 2007, Ekasari et al. 2010, Lopes-Elías and
Moreno-Arias 2015). The pH 6.5 presented the highest values of crude protein and ash
content, and these can be attributed to lower biofloc removal, pH values of 7.5 and 8.3
results in higher clarification, and this reduces nutrient content, as demonstrated by Ray
et al. (2010).
Although when using pH 6.5, the NO2- values were superior during the initial part
of the assay, there was no prejudice to growth and productivity, and these treatments
present similar results to those obtained at pH 7.5. The Nile tilapia is tolerant to a wide
range of pH (Lim and Webster 2006, El-Sherif et al. 2009), but our results demonstrate
growth reduction for pH 8.3. Similar results were obtained for Rebouças et al. (2015),
who evaluated juveniles Nile tilapia growth in ponds. The authors demonstrated best
growth when fish were maintained at pH 4-6, as compared to pH 8.0. In other
perspective, Cavalcante et al. (2012) demonstrated improvement in Nile tilapia growth
when hardness:alkalinity ratio was maintained equal or superior to 1.0, which in the
present study was achieved at pH 6.5 and 7.5.
67
The excessive increase in alkalinity at 8.3 treatments can be attributed to the
limiting of HCO3- on pH elevation, and this could influence growth. The accumulation
of HCO3- in water may have reduced the excretion of these ions and Cl- absorption.
Alternative ways of ionic regulation may have been used, mainly resulting in higher
energy expenditure with osmoregulation, related to Na+K+-ATPase higher activity
(Boeuf and Payan 2001), since the osmolality and hematocrit remained equal between
treatments. Hematologic and oxidative parameters can be used to demonstrate the health
status of fishes. Our results do not demonstrate alteration when evaluating the
hematologic parameters of glucose, hematocrit and osmolality, which showed no
alteration. These may indicate that system conditions remained appropriate among the
treatments, although growth was reduced for pH 8.3.
In relation to oxidative stress, the evaluation of CAT and SOD resulted in no
difference. The SOD is responsible for the conversion of superoxide anions to the less
toxic product H2O2 and CAT catalyses the H2O2 removal, producing H2O and O2.
(Storey 1996).
Similarly, the ACAP and LPO showed no difference among treatments. This may
be attributed to pH range tested, which is suitable for the Nile tilapia. Oxidative stress
has been associated with inadequate system conditions in aquaculture, leading to
alterations in SOD and CAT activity after exposure to ammonia exposure (Sinha et al.
2014), cellular damage related to alkaline challenges (Yao et al. 2012) and increased on
ROS levels for Nile tilapia at pH 5.3 (Mai et al. 2010). For this reason, the absence in
alteration in oxidative stress parameter observed in the present study would indicate that
the health status of organisms is good.
5. Conclusion
Initiating the biofloc formation with alkaline water could be advantageous for
nitrifying bacteria growth, resulting in the oxidation of nitrogenous forms faster than in
water with pH below 8.0. However, the elevated consumption for nitrification and
consequent pH reduction represents no damage to bioflocs, with nitrogenous oxidation
maintained even at pH 6.5. Furthermore, at pH 6.5, the biofloc density is higher (lower
FVI) and TSS production is reduced, resulting in less biofloc removal.
68
The best results for final weight and net yield were observed for pH 7.5 and 6.5.
Evaluations of the biochemical/physiological parameters showed no difference among
the treatments, proving that the conditions of pH 6.5–8.3 are not challenging to fish.
Thus, the utilization of pH 7.5–6.5 could be represents economic advantages, related to
reduced TSS production and less alkalizing compound consumption in the BFT system.
Acknowledgment
This research was supported by the “Conselho Nacional de Desenvolvimento
Científico e Tecnológico – CNPq” (Universal, proc. No.482810/2013-0), “Guabi
Nutrição e Saúde Animal” and “Piscicultura Aquabel”. The authors GBM and RBR
acknowledges to doctoral and research productivity scholarships, respectively. The
authors also thanks to Dr. Wilson Wasielesky (Estação Marinha de Aquicultura,
FURG), Dr. Marcelo Tesser (Laboratório de Nutrição e Alimentação de Organismos
Aquáticos, FURG) and Msc. João Manoel Cordeiro Alves (Guabi Nutrição e Saúde
Animal) for their contributions to this work.
References
Amado, L.L., Garcia, M.L., Ramos, P.B., Freitas, R.F., Zafalon, B., Ferreira, J.L.R.,
Yunes, J.S., Monserrat, J.M., 2009. A method to measure total antioxidant capacity
against peroxyl radicals in aquatic organisms: Application to evaluate microcystins
toxicity. Sci. Total Environ. 407, 2115–2123.
Aminot, A., Chaussepied, M., 1983. Manuel des analyses chimiques en milieu marin.
Centre National pour L'Exploitation des Oceans. CNEXO, Brest.
AOAC (Association of Official Analytical Chemists), 1999. Official Methods of
Analysis, 17th edition. AOAC, Gaithersburg, MD, USA.
APHA (American Public Health Association), 1998. Standard methods for the
examination of water and wastewater, 20st edition, Whashington DC.
Avnimelech, Y., 1999. Carbon/nitrogen ratio as a control element in aquaculture
systems. Aquaculture 176, 227–235.
69
Avnimelech, Y., Kochba, M., 2009. Evaluation of nitrogen uptake and excretion by
tilapia in bio floc tanks, using 15N tracing. Aquaculture 287, 163-168.
Avnimelech, Y. 2012. Biofloc technology – a practical guide book. 3rd ed. In:
Avnimelech Y, editor. Baton Rouge (LA): The World Aquaculture Society; 2015.
Azim, M.E., Little, D.C., Bron, J.E., 2007. Microbial protein production in activated
suspension tanks manipulating C/N ratio in feed and implications for fish culture.
Bioresource Technol. 99, 3590–3599.
Azim, M.E., Little, D.C., 2008. The bioflocs technology (BFT) in indoor tanks: water
quality, bioflocs composition, and growth and welfare of Nile tilapia (Oreochromis
niloticus). Aquaculture 283, 29–35.
Beutler, E. 1975. The preparation of red cells for assay, in: Beutler, E. (Ed.), Red cell
748 metabolism: a manual of biochemical methods. Grune & Straton, New York, pp.
8–18.
Boeuf, P., Payan, P., 2001. How should salinity influence fish growth? Comp. Biochem.
Physiol. C 130, 411–423.
Burton, S. A. Q., and J. I. Prosser. 2001. Autotrophic ammonia oxidation at low pH
through urea hydrolysis. Appl. Environ. Microbiol. 67:2952–2957.
Chen, S., Ling, J., Blancheton, J-P., 2006. Nitrification kinetics of biofilm as affected by
water quality factors. Aquacult. Eng. 34, 179–197.
Chen, Y., Li, S., Fang, F., Guo, J., Zhang, Q., Gao, X., Effect of inorganic carbon on the
completely autotrophic nitrogen removal over nitrite (CANON) process in a
sequencing batch biofilm reactor. Environ. Technol. 33(22), 2611–2617.
De Schryver, P., Crab. R., Defoirdt, T., Boon, N., Verstraete, W., 2008. The basics of
bio-flocs technology: The added value for aquaculture. Aquaculture 277, 125–137.
De Schryver, P., Verstraete, W., 2009. Nitrogen removal from aquaculture pond water
by heterotrophic nitrogen assimilation in lab-scale sequencing batch reactors.
Bioresource Technol. 100, 1161–1167.
Eaton, A.D., Clesceri, L.S., Rice, E.W., Greenberg, A.E. Standard methods for the
examination of water and wastewater, 21st edition. American Public Health
Association, Washington, District of Columbia, USA.

70
Ebeling, J.M., Timmons, M.B., Bisogni, J.J., 2006. Engineering analysis of the
stoichiometry of photoautotrophic, autotrophic, and heterotrophic removal of
ammonia–nitrogen in aquaculture systems. Aquaculture 257, 346–358.
Ekasari, J., Crab, R., Verstraete, W., 2010. Primary Nutritional Content of Bio-Flocs
Cultured with Different Organic Carbon Sources and Salinity. Hayati J. Biosci. 17,
125–130.
Ekasari, J., Angela, D., Waluyo, S.H., Bachtiar, T., Surawidjaja, E.H., Bossier, P., De
Schryver, P., 2014. The size of biofloc determines the nutritional composition and
the nitrogen recovery by aquaculture animals. Aquaculture 426-427, 105-111.
Ekasari, J., Zairin Jr, M., Putri, D.U., Sari, N.P., Surawidjaja, E.H., Bossier, P., 2015a.
Biofloc-based reproductive performance of Nile tilapia Oreochromis niloticus L.
broodstock. Aquac. Res. 46, 509–512.
Ekasari, J., Rivandi, D.R., Firdausi, A.P., Surawidjaja, E.H., Zairin Jr., M., Bossier, P.,
De Schryver, P., 2015b. Biofloc technology positively affects Nile tilapia
(Oreochromis niloticus) larvae performance. Aquaculture 441, 72–77.
El-Sherif, M.S., El-Feky, A.M.I., 2009. Performance of Nile tilapia (Oreochromis
niloticus) fingerlings. I. Effect of pH. Int. J. Agric. Biol. 11, 297–300.
Evans, J.J, Pasnik, D.J., 2006. Un-ionized ammonia exposure in Nile tilapia: toxicity,
stress response, and susceptibility to Streptococcus agalactiae. N. Am. J. Aquacult.
68, 23–33.
Golombieski, J.I., Koakoski, G., Becker, A.J., Almeida, A.P.G., Toni, C., Finamor, I.A.,
Pavanato, M.A., Almeida, T.M., Baldisserotto, B., 2013. Nitrogenous and
phosphorus excretions in juvenile silver catfish (Rhamdia quelen) exposed to
different water hardness, humic acid, and pH levels. Fish Physiol. Biochem. 39, 837–
849.
Gujer, W., 2010. Nitrification and me – A subjective review. Water Res. 44, 1-19.
Hargreaves, J.A., Photosynthetic suspended-growth systems in aquaculture. Aquacult.
Eng. 34, 344–363.
Hermes-Lima, M., Willmore, W.G., Storey, K.B., 1995. Quantification of lipid
peroxidation in tissue extracts based on Fe(III) xylenol orange complex formation.
Free Radical Bio. Med. 19 (3), 271–280.
71
Jiménez, E., Giménez, J.B., Ruano, M.V., Ferrer, J., Serralta, J., Effect of pH and nitrite
concentration on nitrite oxidation rate. Bioresource Technol. 102, 8741–8747.
Lauro, F.M., McDougald, D., Thomas, T., Williams, T.J., Egan, S., Rice, S.,
DeMaere,M.Z., Ting, L., Ertan, H., Johnson, J., Ferriera, S., Lapidus, A., Anderson,
I., Kyrpi-des, N., Munk, A.C., Detter, C., Han, C.S., Brown, M.V., Robb, F.T.,
Kjelleberg, S.,Cavicchioli, R., 2009. The genomic basis of trophic strategy in marine
bacteria. Proc. Natl. Acad. Sci. USA 106, 15527–15533.
Lim, C.E., Webster, C.D., 2006. Tilapia: Biology, Culture, and Nutrition. Complete
Book. Haworth Press, Binghamton, NY.
Long, L., Yang, J., Li, Y., Guan, C., Wu, F., 2015. Effect of biofloc technology on
growth, digestive enzyme activity, hematology, and immune response of genetically
improved farmed tilapia (Oreochromis niloticus). Aquaculture 448, 135–14.
Longnecker, K., Lomas, M.W., Van Mooy, B.A.S., 2010. Abundance and diversity of
heterotrophic bacterial cells assimilating phosphate in the subtropical North Atlantic
Ocean. Environ. Microbiol. 12 (10), 2773–2782.
López-Elías, J.A., Moreno-Arias, A., 2015. Proximate Composition of Bioflocs in
Culture Systems Containing Hybrid Red Tilapia Fed Diets with Varying Levels of
vegetable Meal Inclusion. N. Am. J. Aquacult. 77, 102–109.
Luo, G., Gao, Q., Wang, C., Liu, W., Sun, D., Li, L., Tan, H., 2014. Growth, digestive
activity, welfare, and partial cost-effectiveness of genetically improved farmed
tilapia (Oreochromis niloticus) cultured in a recirculating aquaculture system and an
indoor biofloc system. Aquaculture 422-423, 1–7.
Mai, W., Yan, J.,Wang, L., Zheng, Y., Xin, Y., Wang, W., 2010. Acute acidic exposure
induces p53-mediated oxidative stress and DNA damage in tilapia (Oreochromis
niloticus) blood cells. Aquat. Toxicol. 100, 271–281.
Mayo, A.W., Noike, T., 1996. Effects of Temperature and pH on The Growth of
Heterotrophic Bacteria in Waste Stabilization Ponds. Water Res. 30 (2), 447–455.
Michaud, L., Giudice, A.L., Interdonato, F., Triplet, S., Ying, L., Blancheton, J.P.,
2014. C/N ratio-induced structural shift of bacterial communities insidelab-scale
aquaculture biofilters. Aquacult. Eng. 58, 77-87.
72
Misra, H.P.; Fridovich, I., 1972. The role of superoxide anion in the autoxidation of
epinephrine and a simple assay for superoxide dismutase. J. Biol. Chem. 247 (10),
3170–3175.
Parra, J.E.G., Baldisserotto, B., 2007. Effect of Water pH and Hardness on Survival and
Growth of Freshwater Teleosts. In: Baldisserotto, B., Mancera, J.M., Kapoor, B.G.
(Eds.), Fish Osmoregulation. Science Publishers, Enfield, New Hampshire, pp. 135–
150.
Pérez-Fuentes, J.A., Hernándes-Vergara, M.P., Pérez-Rostro, C.I., Fogel, I., 2016. C:N
ratios affect nitrogen removal and production of Nile tilapia Oreochromis niloticus
raised in a biofloc system under high density cultivation. Aquaculture 452, 247–251.
Ray, A.J., Lewis, B.L., Browdy, C.L., Leffler, J.W., 2010. Suspended solids removal to
improve shrimp (Litopenaeus vannamei) production and an evaluation of a plant-
based feed in minimal-exchange, superintensive culture systems. Aquaculture 299,
89-98.
Ray, A.J., Lotz, J.M., 2014. Comparing a chemoautotrophic-based biofloc system and
three heterotrophic-based systems receiving different carbohydrate sources.
Aquacult. Eng. 63, 54–61.
REBOUÇAS, VT, FRS LIMA, DH CAVALCANTE & MCV SÁ. 2015. Tolerance of Nile tilapia
juveniles to highly acidic rearing water. Acta Sci. Anim. Sci., 37 (3): 227–233.
Santos, V.B., Mareco, E.A., Silva, M.D.P., 2013. Growth curves of Nile tilapia
(Oreochromis niloticus) strains cultivated at different temperatures. Acta Sci. Anim.
Sci. 35 (3), 235–242.
Storey, K.B., 1996. Oxidative stress: animal adaptations in nature. Braz. J. Med. Biol.
Res. 29, 1715–1733.
Strickland, J.D.H., Parsons, T.R., 1972. A Practical Handbook of Seawater Analysis.
Ottawa: Bulletin of Fisheries Research Board Canada.
Tarre, S., Green, M., 2004. High-Rate Nitrification at Low pH in Suspended- and
Attached-Biomass Reactors. Appl. Environ. Microb. 70 (11), 6481–6487.
Timmons, M.B., Ebeling, J.M., 2010. Recirculating Aquaculture. 2nd Edition. Cayuga
Aqua Ventures, Ithaca, NY, USA.
73
Tran-Duy, A., Dam, A.A., Schrama, J.W. 2012. Feed intake, growth and metabolism of
Nile tilapia (Oreochromis niloticus) in relation to dissolved oxygen concentration.
Aquac. Res. 43, 730–744.
Unesco, 1983. Chemical methods for use in marine environmental monitoring. Manual
and Guides 12. Intergovernmental Oceanographic Commission, Paris, FR. Villano,
M., Beccari, M., Dionisi, D., Lampis, S., Miccheli, A., Vallini, G., Majone, M.,
2010. Effect of pH on the production of bacterial polyhydroxyalkanoates by mixed
cultures enriched under periodic feeding. Process Biochem. 45, 714–723.
Wilén, B-M., Lumley, D., Mattsson, A., Mino, T., 2008. Relationship between floc
composition and flocculation and settling properties studied at a full scale activated
sludge plant. Water Res. 42, 4404–4418.
Winston, G.W., Regoli, F., Dugas, Jr A.J., Fong, J.H., Blanchard, K.A., 1998. A rapid
gas chromatographic assay for determining oxyradical scavenging capacity of
antioxidants and biological fluids. Free Radic. Biol. Med. 24, 480–93.
Wood, C.M., 2001. Toxic responses of the gill. In: Schlenk, D., Benson, W.H. (Eds.)
Target organ toxicity in marine and freshwater teleosts organs. Taylor and Francis,
London, pp. 1–89.
Yao, Z.L., Wang, H., Chen, L., Zhou, K., Ying, C.Q., Lai, Q.F., 2012. Transcriptomic
profiles of Japanese medaka (Oryzias latipes) in response to alkalinity stress. Genet.
Mol. Res. 11(3), 2200–2246.
Ye, C., Yang, X., Zhao, F-J, Ren, L., 2016. The shift of the microbial community in
activated sludge with calcium treatment and its implication to sludge settleability.
Bioresource Technol. 207, 11–18.
Yousuf, I., 2013. 38th Annual WIOA Qld Water Industry Operations Conference
Parklands, Glod Coast, pp. 95-101.
Sinha, A.K., AbdElgawad, H., Giblen, T., Zinta, G., De Rop, M., Asard, H., Blust, R.,
De Boeck, G., 2014. Anti-Oxidative Defences Are Modulated Differentially in Three
Freshwater Teleosts in Response to Ammonia-Induced Oxidative Stress. PLoS ONE
9(4), e95319.
74
CAPÍTULO III
Concentração de dureza da água durante berçário de tilápia do Nilo Oreochromis
niloticus (L.) em sistema de bioflocos
Gabriel Bernardes Martins, Ricardo Berteaux Robaldo
Manuscrito formatado de acordo com as normas da revista Aquaculture Research.
75
Concentrações de dureza da água durante berçário de tilápia do Nilo Oreochromis
niloticus (L.) em sistema de bioflocos
Gabriel Bernardes Martins1*, Ricardo Berteaux Robaldo1,2
1 Instituto de Oceanografia, Programa de Pós Graduação em Aquicultura, Universidade
Federal do Rio Grande - FURG, CP 474, 96201-900, Rio Grande - RS, Brasil 2 Instituto de Biologia, Laboratório de Fisiologia Aplicada à Aquicultura, Universidade
Federal de Pelotas - UFPel, Campus Universitário, 96160-000, Capão do Leão - RS,
Brasil
*Autor para correspondência: Estação Marinha de Aquicultura, Instituto de
Oceanografia, Universidade Federal do Rio Grande - FURG, C. P. 474, Rio Grande, RS
CEP 96201-900, Brasil. Email: [email protected]
Resumo
A produção de tilápia do Nilo utilizando a tecnologia dos bioflocos (BFT) é uma das
formas mais sustentáveis de produção, devido à ciclagem dos nitrogenados inorgânicos
pelos microorganismos. Entretanto, com a intensificação e a baixa renovação de água,
ocorre significativo consumo de alcalinidade, tornando necessária a utilização de
alcalinizante, como o hidróxido de cálcio – Ca(OH)2, que favorece o acumulo de cálcio
ao longo do cultivo. Nesse contexto, foi realizado o presente experimento de 20 dias de
duração, para investigar o aumento da dureza total avaliando: qualidade da água,
crescimento, sobrevivência e eficiência alimentar de juvenis de tilápia em sistema BFT.
Foram distribuídos 30 peixes (1,51 ± 0,38 g) por unidade experimental (vol. útil 37,5
L), testando em triplicata o controle (sem correção), 250 e 700 mg L-1 CaCO3 de dureza
total, utilizando CaCl2. No início do experimento, ocorreu elevação da amônia total
(TAN) de forma similar para todos os tratamentos, entretanto, rapidamente atingiu
níveis seguros. Enquanto que a oxidação de nitrito à nitrato (NO3-) foi um pouco mais
lenta para o tratamento 700, embora rapidamente todos tenham atingido níveis
irrisórios. O NO3- apresentou menor concentração final para o controle, e isso
demonstra maior absorção de N inorgânico pelas bactérias heterotróficas quando
76
comparado aos demais tratamentos. Enquanto os sólidos suspensos totais (SST)
apresentaram relação positiva com a dureza, e isso se deve à maior adesão de cálcio na
estrutura dos bioflocos, aumentando a densidade, e tornando o índice de volume de
floco (FVI) nos tratamentos com correção da dureza mais estável ao longo do ensaio.
Ainda mais, o peso final dos peixes nos tratamentos 250 (7,57 ± 0,40 g) e 700 (7,37 ±
0,35 g) foram superiores ao controle (6,30 ± 0,11 g). Enquanto a sobrevivência (aprox.
80%) e a taxa de conversão alimentar (aprox. 1,0) não apresentaram diferença entre os
tratamentos, porém apresentam valores satisfatórios e indicam a sustentabilidade do
sistema. Finalmente, as análises da composição iônica da água demonstram as
concentrações iniciais e finais de Ca+2, Na+ e Cl-, e no presente estudo não
comprometeram os bioflocos ou o crescimento dos peixes, entretanto, a longo prazo fica
evidente a importância do monitoramento desses íons em sistema com baixa renovação
de água, como o BFT.
Palavras chave: cálcio, sódio, cloreto, BFT, bactérias nitrificantes
Introdução
Existe uma crescente busca mundial em utilizar de forma sustentável os recursos
naturais, e em aquicultura o desafio é o desenvolvimento de sistemas intensivos que
utilizem menos água, produzam menos efluentes e alcancem o melhor aproveitamento
de nutrientes. Utilizando baixa ou nula renovação de água, a tecnologia dos bioflocos
(BFT) tem sido demonstrada como uma importante alternativa para suprir essas
necessidades (Crab, Defoirdt, Bossier & Verstraete 2012).
O sistema BFT caracteriza-se por possuir agregados microbianos (bioflocos) que
absorvem o nitrogênio inorgânico dissolvido (De Schryver, Crab, Defoirdt, Boon &
Verstraete 2008). Esses bioflocos permanecem em suspensão na água e são consumidos
pelas tilápias do Nilo, portanto, são considerados como suplementos nutricionais
(Avnimelech 2009; Ekasari, Angela, Waluyo, Bachtiar, Surawidjaja, Bossier & De
Schryver 2014).
A ciclagem do N inorgânico dissolvido em BFT, ocorre principalmente pelas
bactérias pertencentes aos grupos: heterotrófico e quimioautotrófico (autotrófico).
77
Inicialmente, o sistema BFT foi desenvolvido baseado no crescimento das
heterotróficas, realizando fertilizações com carbono (C) orgânico (relação 15:1 C:N)
(Avnimelech 1999). Esse grupo possui como principais características a alta taxa de
crescimento e capacidade de rápida absorção de nitrogênio amoniacal (Ebeling,
Timmons & Bisogni 2006).
Entretanto, tem sido demonstrado que as estratégias de manutenção do sistema
BFT, utilizando relações C:N mais baixas, seja pela fertilização com C orgânico ou pela
ração, podem favorecer o sistema a manter comunidades autotróficas (Ebeling et al.
2006, Avnimelech 2012, Luo, Avnimelech, Pan & Tan 2013a). A utilização desse
grupo, responsável pela nitrificação, pode representar algumas vantagens, como a
redução na produção de sólidos suspensos e menor consumo de O2 pelos bioflocos (Ray
& Lotz 2014). Entretanto, as autotróficas consomem o dobro de alcalinidade que as
heterotróficas (7,0 versus 3,5 g Alc. g-1 N-1), favorecendo a redução do pH do sistema
(Ebeling et al. 2006).
Consequentemente, em sistema BFT é necessária a adição permanente de
compostos alcalinizantes, e uma das alternativas utilizadas é o hidróxido de cálcio,
também denominado cal hidratada (Ca(OH)2) (Furtado, Gaona, Poersch & Wasielesky
2014). Ao se diluir em água, produz a seguinte reação de neutralização: Ca(OH)2 + 2H+
→ Ca+2 + 2H2O. Trata-se de uma alternativa barata, que possui rápida diluição e é
eficaz na correção da alcalinidade e do pH. Entretanto, a utilização de Ca(OH)2 durante
o cultivo em sistema BFT, associada às reposições de água devido às clarificações e à
evaporação, favorece o acumulo de Ca+2 ao longo do cultivo, tornando a água
excessivamente dura.
A dureza total representa a soma dos cátions divalentes, principalmente Ca+2 e
Mg+2, e é expressa em mg L-1 de CaCO3 (Boyd, Tucker & Someidhivej 2016). O Ca+2
possui importante função relacionada à floculação e adesão dos bioflocos, devido ao
cátion bridging theory (Sobeck & Higgins 2002). Foi demonstrado por Luo, Liang, Tan,
Yao, Zhang & Lu (2013b) que ao aumentar a concentração de Ca+2 em bioreatores,
ocorre proporcional redução no tamanho dos bioflocos, maior força de adesão e
capacidade de sedimentação, entretanto, há redução no teor de proteína e na capacidade
de absorver nitrogênio.
78
No aspecto fisiológico, os teleósteos absorvem o Ca+2 do meio principalmente
pelas brânquias, e quando em concentrações muito baixas, a principal fonte é a partir da
alimentação (Baldisserotto 2011). O Ca+2 é importante na estabilização das tight
junctions, resultando em menor perda iônica pelas brânquias (Wood 2001). Desta
forma, a elevação da dureza é uma estratégia utilizada quando em baixo pH, reduzindo
o desafio osmorregulatório (Parra & Baldisserotto 2007). O excesso ou déficit de cálcio
no meio pode ser prejudicial ao crescimento dos peixes, e ao avaliar o crescimento de
tilápias do Nilo, Cavalcante, Silva, Pinheiro, Akao & Sá (2012) demonstraram melhor
desempenho quando a dureza total é > 20 mg CaCO3 L-1, ainda mais, os peixes
obtiveram crescimento superior quando mantida a relação dureza:alcalinidade entre 1,0
e 3,0.
Portanto, em BFT há uma forte interação entre a composição dos bioflocos e os
parâmetros de qualidade da água, como alcalinidade, pH e dureza, e o conjunto desses
fatores afeta diretamente o desempenho dos peixes. Os efeitos dos níveis de Ca+2 não
são explorados em sistema BFT para tilápias do Nilo, e a maioria dos estudos tem sido
desenvolvidos em sistemas de tratamento de efluentes com lodo ativado (Peeters,
Dewil, Lechat & Smets 2011; Ye, Yang, Zhao & Ren 2016) e em sequence batch
reactor (SBR) utilizando BFT (Luo et al. 2013a). Nesse contexto, este estudo investiga
os níveis de dureza total da água avaliando a sobrevivência, o crescimento e a qualidade
da água de tilápias do Nilo durante berçário em sistema BFT.
Material e métodos
Peixes e desenho experimental
Os juvenis de tilápia do Nilo monosexo (Genética Premium) foram adquiridos da
piscicultura comercial Aquabel (Rolândia, PR, BR) e transportados ao Laboratório de
Piscicultura do Chasqueiro (Universidade Federal de Pelotas, Rio Grande do Sul,
Brasil) onde ocorreu o experimento.
Para aclimatação, os peixes foram mantidos em sistema de recirculação por 7 dias
até o início do experimento. Durante a aclimatação e o experimento, as tilápias foram
alimentadas com ração comercial (1mm, 45% Proteína Bruta, Pirá Mirim, Guabi
Nutrição e Saúde Animal, BR) distribuída as 07:30, 10:30, 13:30, 16:30 e 19:30 h. A
79
taxa de arraçoamento utilizada para peixes de 1,5 – 3,0 g foi 10% (peso úmido/dia),
enquanto que a partir de 3 g foi 8%. Durante o ensaio, foram realizadas biometrias
semanais (n = 10) para ajuste da quantidade de ração.
O experimento teve duração de 20 dias, e foram distribuídos 30 peixes por
unidade experimental (vol. útil 37,5 L) com peso inicial de 1,51 ± 0,38 g. As caixas
possuíam duas pedras de ar ao fundo para aeração contínua e aquecedor (100W) com
termostato (regulado para 28°C). Flocos microbianos previamente produzidos com
tilápias do Nilo foram inoculados no sistema, a uma taxa de 10% do volume total de
água.
Os tratamentos testados foram controle (sem correção), 250 e 700 mg CaCO3 L-1
de dureza total utilizando cloreto de cálcio – CaCl2 (P.A. Synth, BR), todos realizados
em triplicata e para elevar a dureza. A concentração de CaCl2 utilizada para os
tratamentos foi de 0,15 e 0,44 g L-1.
Quando a amônia total (TAN) atingiu valor igual ou superior a 1.0 mg L-1, foi
realizada a adição de melaço de cana de açúcar (≈45% C) para a correção da relação
entre C:N (15:1), conforme demonstrado por Avnimelech (1999). Para manter o nível
de sólidos suspensos totais (SST) entre 400-600 mg L-1, foram realizadas remoções dos
sólidos pela sedimentação de 25% do volume da caixa em um balde por 1,0 h, após esse
período o sobrenadante foi devolvido ao tanque e o sedimentado (sludge) foi
mensurado. Durante o ensaio, foi realizada clarificação apenas uma vez em duas
réplicas do tratamento 700 mg CaCO3 L-1, e por esse motivo não foi aplicado teste
estatístico para essa variável. O valor de sludge removed (SR) foi calculado para ser
expresso como SR (L m-³).
Para a correção da alcalinidade e do pH foi utilizado o bicarbonato de sódio –
NaHCO3 (P.A. Synth, BR), sendo calculada a quantidade de acordo com os valores de
pH diários, e adicionado diariamente após a última alimentação. Ainda, durante o
experimento não houve renovação de água, e semanalmente o volume de água foi
reajustado devido às perdas com as clarificações e evaporação.
Ao final do ensaio foi quantificado a ração total e o composto alcalinizante total
utilizado, sendo calculado o percentual de composto alcalinizante utilizado em relação à
ração (AC%).
80
Qualidade da água e desempenho zootécnico
A temperatura e o oxigênio foram medidos duas vezes ao dia (07:15 e 15:30 h),
utilizando YSI PRO 20 (YSI Incorporated, Yellow Springs, OH, USA). O pH foi
medido diariamente (17:00 h) com pHmetro digital de bancada (HI 2212, HANNA
Instrument, Woonsocket, RI, USA).
Para TAN e NO2- as amostras de água foram coletadas antes da primeira
alimentação do dia, enquanto que para o SST, FV, alcalinidade, dureza as amostras
foram coletadas as 13:15 h. Duas vezes por semana, foram dosados a amônia total
(TAN) (UNESCO 1983), o nitrito e a alcalinidade total (APHA 1998), os sólidos
suspensos totais (SST) (Strickland & Parsons 1972), o volume de sólidos suspensos
(FV; Cone de Imhoff - 30 min) e a dureza total (Eaton et al. 2005). O índice de volume
de floco foi determinado pela seguinte fórmula: FVI = FV (mL) / TSS (g) (Yousuf
2013).
O NO3- e o PO4
- (Aminot & Chaussepied 1983) o Na+ (fotômetro de chama,
B462, Micronal, BR), o Ca+2 (cálcio arsenazo, Doles, BR) e o Cl- (tiocianato de
mercúrio, Vida Biotecnologia, BR) foram dosados apenas no primeiro e último dias do
experimento.
Ao final do ensaio, foram quantificados e pesados todos os peixes para avaliação
dos seguintes índices de sobrevivência, crescimento e conversão alimentar:
a) Taxa de crescimento diário (DGR; g dia-1) = aumento da biomassa de peixes (g) /
tempo (dias)
b) Taxa de sobrevivência (%) = 100 (Nf-Ni) / Ni
c) Produtividade (kg m-3) = aumento da biomassa de peixes (g) *1000 / Vol (L)
d) Taxa de conversão alimentar (FCA) = quantidade de ração (g) / aumento da biomassa
de peixes (g)
Onde Ni e Nf representam o número de peixes inicial e final, respectivamente.
81
Análises estatísticas
Inicialmente os dados foram testados para normalidade (Shapiro-Wilk) e
homocedasticidade. Após, foram comparador por ANOVA (One way), e quando houve
diferença foi realizado Teste de Tukey (p<0,05). As análises foram realizadas no
software SigmaPlot 12.0 (Systat Software, Inc., Chicago, IL). Todos os dados são
demonstrados como Média ± Desvio Padrão.
Resultados e discussão
Os resultados de qualidade da água são demonstrados na Tabela 1. O intervalo de
temperatura do presente estudo se manteve entre 26-30°C, o que é considerado ideal
para a sobrevivência e crescimento de tilápia do Nilo (Santos, Mareco & Silva 2013).
Enquanto que o intervalo de oxigênio dissolvido foi de 4-7 mg L-1, o ideal para manter a
sobrevivência e o crescimento (Tran-Duy, Dam & Schrama 2012).
O pH durante o ensaio demonstrou considerável oscilação (8,3 a 6,6) (Fig. 1),
sendo o valor médio do controle igual ao tratamento 250 e superior ao 700. Entretanto,
as médias de pH estão dentro do intervalo considerado ideal para a sobrevivência de
tilápias do Nilo (Rebouças, Lima, Cavalcante & Sá 2015). Essa pequena diferença no
pH deve ter ocorrido porque a utilização de NaHCO3 em água com alta dureza favorece
a seguinte reação: Ca+2 + 2HCO3- → CaCO3 + CO2 + H2O. Portanto, a presença de Ca+2
limita o aumento do pH, devido a precipitação do CO3-2 como CaCO3 (Boyd et al.
2016). Entretanto, no presente estudo a diferença de pH entre os tratamentos pode ser
considerada pequena, pois a alcalinidade média não diferiu entre os tratamentos.
As águas podem ser classificadas de acordo com os valores de dureza, e para o
controle, é considerada moderadamente dura, enquanto que para os tratamentos 250 e
700 é classificada como dura e muito dura, respectivamente (Boyd 2015). Como
parâmetro, o tratamento 700 apresentou concentração de Ca+2 próximo a água do mar
(400 mg L-1) (Boyd 2015). Embora a dureza total seja representada pela soma dos
cátions divalentes, o Ca+2 é o que possui maior afinidade de ligação nos bioflocos
(Nguyen, Hankins & Hilal, 2007; Luo et al. 2013b), por isso o Mg+2 não foi considerado
neste estudo.
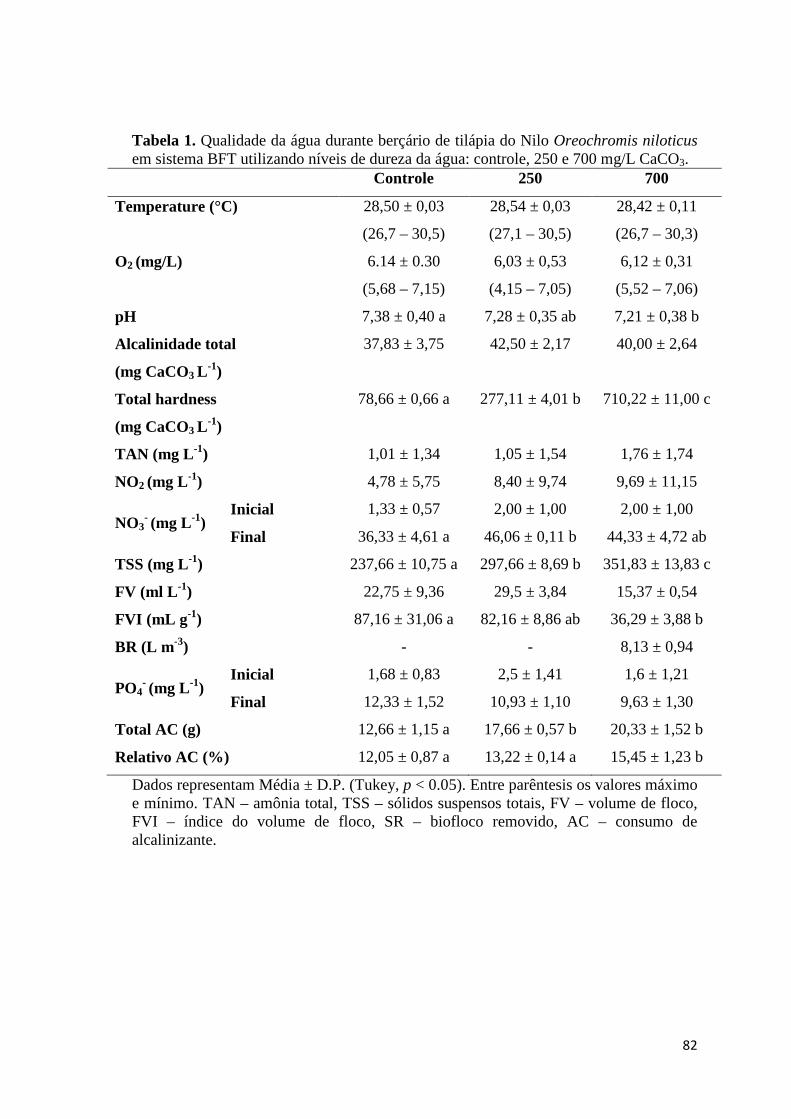
82
Tabela 1. Qualidade da água durante berçário de tilápia do Nilo Oreochromis niloticus em sistema BFT utilizando níveis de dureza da água: controle, 250 e 700 mg/L CaCO3.
Controle 250 700
Temperature (°C) 28,50 ± 0,03
(26,7 – 30,5)
28,54 ± 0,03
(27,1 – 30,5)
28,42 ± 0,11
(26,7 – 30,3)
O2 (mg/L) 6.14 ± 0.30
(5,68 – 7,15)
6,03 ± 0,53
(4,15 – 7,05)
6,12 ± 0,31
(5,52 – 7,06)
pH 7,38 ± 0,40 a 7,28 ± 0,35 ab 7,21 ± 0,38 b
Alcalinidade total
(mg CaCO3 L-1)
37,83 ± 3,75 42,50 ± 2,17 40,00 ± 2,64
Total hardness
(mg CaCO3 L-1)
78,66 ± 0,66 a 277,11 ± 4,01 b 710,22 ± 11,00 c
TAN (mg L -1) 1,01 ± 1,34 1,05 ± 1,54 1,76 ± 1,74
NO2 (mg L-1) 4,78 ± 5,75 8,40 ± 9,74 9,69 ± 11,15
NO3- (mg L-1)
Inicial 1,33 ± 0,57 2,00 ± 1,00 2,00 ± 1,00
Final 36,33 ± 4,61 a 46,06 ± 0,11 b 44,33 ± 4,72 ab
TSS (mg L-1) 237,66 ± 10,75 a 297,66 ± 8,69 b 351,83 ± 13,83 c
FV (ml L -1) 22,75 ± 9,36 29,5 ± 3,84 15,37 ± 0,54
FVI (mL g -1) 87,16 ± 31,06 a 82,16 ± 8,86 ab 36,29 ± 3,88 b
BR (L m-3) - - 8,13 ± 0,94
PO4- (mg L-1)
Inicial 1,68 ± 0,83 2,5 ± 1,41 1,6 ± 1,21
Final 12,33 ± 1,52 10,93 ± 1,10 9,63 ± 1,30
Total AC (g) 12,66 ± 1,15 a 17,66 ± 0,57 b 20,33 ± 1,52 b
Relativo AC (%) 12,05 ± 0,87 a 13,22 ± 0,14 a 15,45 ± 1,23 b
Dados representam Média ± D.P. (Tukey, p < 0.05). Entre parêntesis os valores máximo e mínimo. TAN – amônia total, TSS – sólidos suspensos totais, FV – volume de floco, FVI – índice do volume de floco, SR – biofloco removido, AC – consumo de alcalinizante.
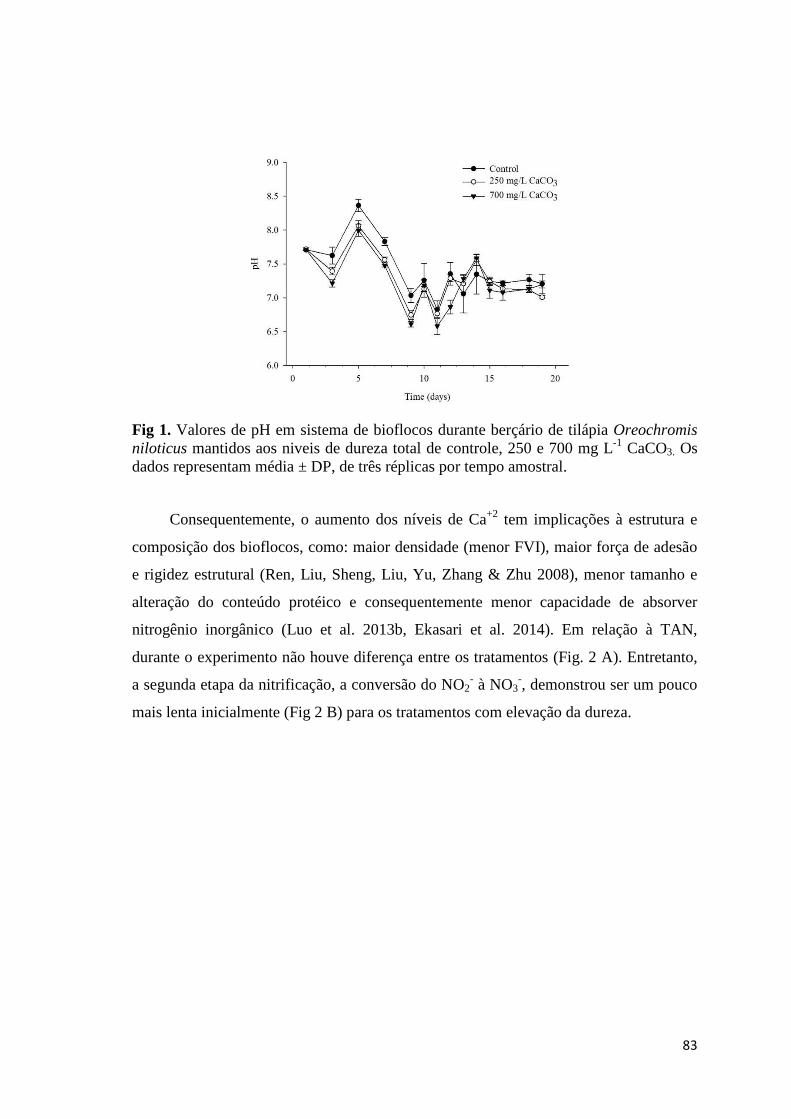
83
Fig 1. Valores de pH em sistema de bioflocos durante berçário de tilápia Oreochromis niloticus mantidos aos niveis de dureza total de controle, 250 e 700 mg L-1 CaCO3. Os dados representam média ± DP, de três réplicas por tempo amostral.
Consequentemente, o aumento dos níveis de Ca+2 tem implicações à estrutura e
composição dos bioflocos, como: maior densidade (menor FVI), maior força de adesão
e rigidez estrutural (Ren, Liu, Sheng, Liu, Yu, Zhang & Zhu 2008), menor tamanho e
alteração do conteúdo protéico e consequentemente menor capacidade de absorver
nitrogênio inorgânico (Luo et al. 2013b, Ekasari et al. 2014). Em relação à TAN,
durante o experimento não houve diferença entre os tratamentos (Fig. 2 A). Entretanto,
a segunda etapa da nitrificação, a conversão do NO2- à NO3
-, demonstrou ser um pouco
mais lenta inicialmente (Fig 2 B) para os tratamentos com elevação da dureza.
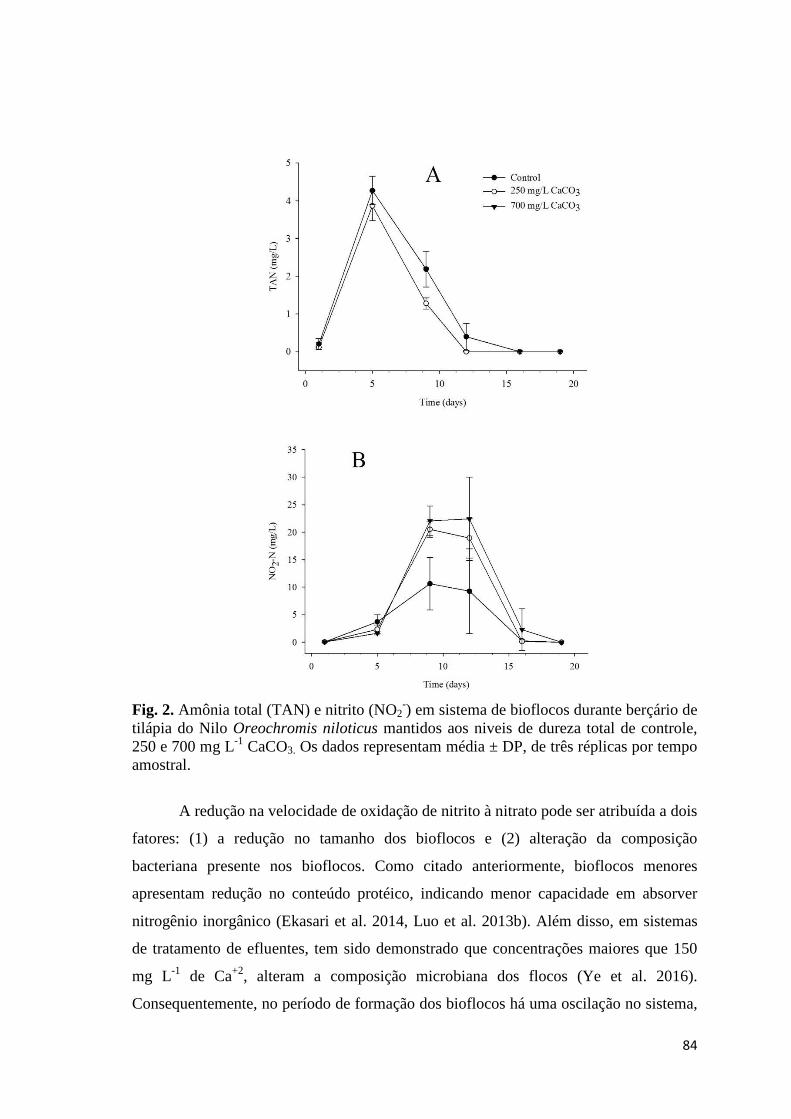
84
Fig. 2. Amônia total (TAN) e nitrito (NO2-) em sistema de bioflocos durante berçário de
tilápia do Nilo Oreochromis niloticus mantidos aos niveis de dureza total de controle, 250 e 700 mg L-1 CaCO3. Os dados representam média ± DP, de três réplicas por tempo amostral.
A redução na velocidade de oxidação de nitrito à nitrato pode ser atribuída a dois
fatores: (1) a redução no tamanho dos bioflocos e (2) alteração da composição
bacteriana presente nos bioflocos. Como citado anteriormente, bioflocos menores
apresentam redução no conteúdo protéico, indicando menor capacidade em absorver
nitrogênio inorgânico (Ekasari et al. 2014, Luo et al. 2013b). Além disso, em sistemas
de tratamento de efluentes, tem sido demonstrado que concentrações maiores que 150
mg L-1 de Ca+2, alteram a composição microbiana dos flocos (Ye et al. 2016).
Consequentemente, no período de formação dos bioflocos há uma oscilação no sistema,
85
devido ao processo de seleção e crescimento das bactérias, que pode ser demorado,
causando redução temporária na taxa de nitrificação.
Devido à utilização de sistema contendo bactérias autotróficas, ao final do
experimento ocorreu acumulo de NO3-, e um tema que deve ser mais explorado é a
fertilização para estimular a absorção de nitrato em BFT, como citado por Schneider,
Sereti, Eding & Verreth (2007) e Luo et al.(2013b). Nossos resultados demonstram que
a menor concentração de NO3- para o controle pode indicar a maior assimilação de TAN
pelas bactérias heterotróficas, comparado aos tratamentos com correção da dureza. Esse
resultado é interessante, pois sugere inibição das heterotróficas ao aumentar o nível de
Ca+2.
Além disso, houve acumulo de PO4- em todos os tratamentos. É bem
estabelecido que a elevação do Ca+2 dissolvido pode favorecer a formação de fosfato de
cálcio, que precipita no sistema (Li, Xu, Parise & Phillips, 2012). Ainda mais,
Schneider, Sereti, Eding & Verreth (2006) demonstraram que ao manter a relação 15:1
(C:N) há favorecimento de absorção de fósforo pelas bactérias heterotróficas.
Entretanto, no presente estudo talvez não tenha ocorrido nenhuma das vias de consumo
do fósforo devido ao curto período experimental e a baixa relação C:N utilizada.
Em sistema BFT, o reuso de água associado à grande quantidade de ração
fornecida, favorece o acumulo de TSS. Para a produção do camarão marinho
Litopennaeus vannamei em BFT, tem sido recomendada a manutenção dos TSS entre
400-600 mg L-1 (Ray, Lewis, Browdy & Leffler 2010; Schveitzer, Arantes, Costódio,
Espírito Santo, Arana, Seiffert & Andreatta 2013). As médias de TSS do presente
estudo permaneceram a níveis que podem ser considerados adequados, embora tenham
demonstrado relação positiva com o aumento da dureza (Fig. 3 A). Isso ocasionou a
clarificação de duas réplicas do tratamento 700, resultando em remoção de aprox. 8 L
m-³ de bioflocos para esse tratamento.
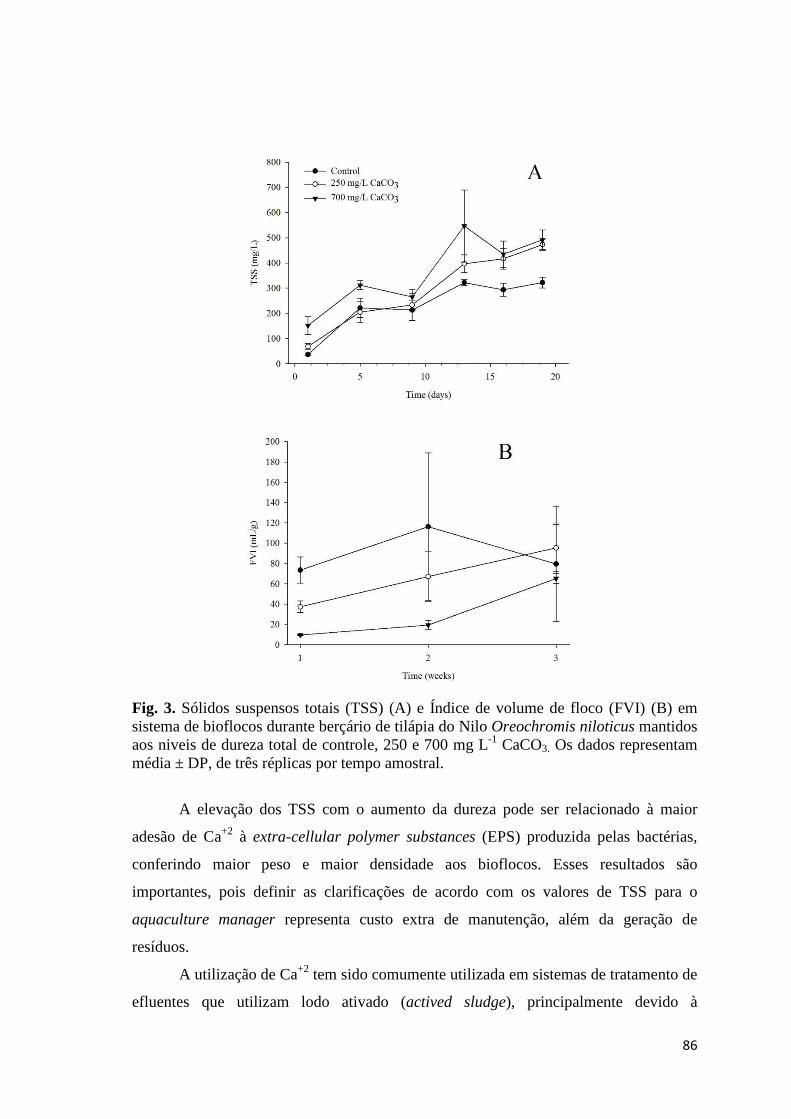
86
Fig. 3. Sólidos suspensos totais (TSS) (A) e Índice de volume de floco (FVI) (B) em sistema de bioflocos durante berçário de tilápia do Nilo Oreochromis niloticus mantidos aos niveis de dureza total de controle, 250 e 700 mg L-1 CaCO3. Os dados representam média ± DP, de três réplicas por tempo amostral.
A elevação dos TSS com o aumento da dureza pode ser relacionado à maior
adesão de Ca+2 à extra-cellular polymer substances (EPS) produzida pelas bactérias,
conferindo maior peso e maior densidade aos bioflocos. Esses resultados são
importantes, pois definir as clarificações de acordo com os valores de TSS para o
aquaculture manager representa custo extra de manutenção, além da geração de
resíduos.
A utilização de Ca+2 tem sido comumente utilizada em sistemas de tratamento de
efluentes que utilizam lodo ativado (actived sludge), principalmente devido à
87
capacidade de aumentar a coagulação-floculação e a sedimentação (Nguyen, Hilal,
Hankins & Novak, 2008). No presente estudo, a capacidade de sedimentação é
representada pelo FVI (Fig 3 B), que apresentou redução (maior densidade) quando
utilizado 700 mg L-1 CaCO3 de dureza. Para o FVI, tem sido considerado ideal o
intervalo entre 40-60 mL g-1 (De Schryver et al. 2008).
Na segunda e terceira semanas, foram verificados aumentos excessivos do FVI
em duas réplicas do tratamento controle, atingindo FVI de aprox. 180 mL g-1 (densidade
extremamente baixa). Em sistemas de tratamento, esse resultado é tratado como o
bulking, e tem sido atribuído ao intenso crescimento de microorganismos filamentosos e
alta produção de EPS, o que confere à estrutura dos bioflocos alta porosidade, baixa
densidade e capacidade de sedimentação (Hu, Qi, An, Xu, Zhang, Bai, Bao, Wen, Gu &
Yang 2013). Em nosso laboratório, tem sido analisado que valores de FVI próximos a
200 mL g-1 (bioflocos com coloração clara e Cone Imhoff > 100 mL) causam
entupimento branquial, e rapidamente causa grande mortalidade de peixes. Liao,
Droppo, Leppard & Liss (2006) demonstraram ser possível evitar o bulking ao reduzir o
tamanho dos flocos, assim, nossos resultados também demonstram que utilizar o Ca+2
para elevar a densidade e reduzir os tamanhos dos bioflocos, é uma alternativa para
prevenir o redução excessiva da densidade (aumento do FVI) em BFT.
Como já citado anteriormente, o intenso consumo de alcalinidade pelas bactérias
ocasiona redução no pH, e a utilização de compostos alcalinizantes resulta em mudança
na composição iônica da água. A tabela 2 apresenta a concentração de Ca+2, Na+ e Cl-
da água no inicio e fim do ensaio. Obviamente, os níveis de Ca+2 e Cl- aumentaram de
acordo com o tratamento testado. Enquanto o Na+ aumentou significativamente ao
longo do experimento, entretanto, assim como o Cl-, a concentração final foi baixa e
possivelmente não representou desafio osmorregulatório às tilápias.
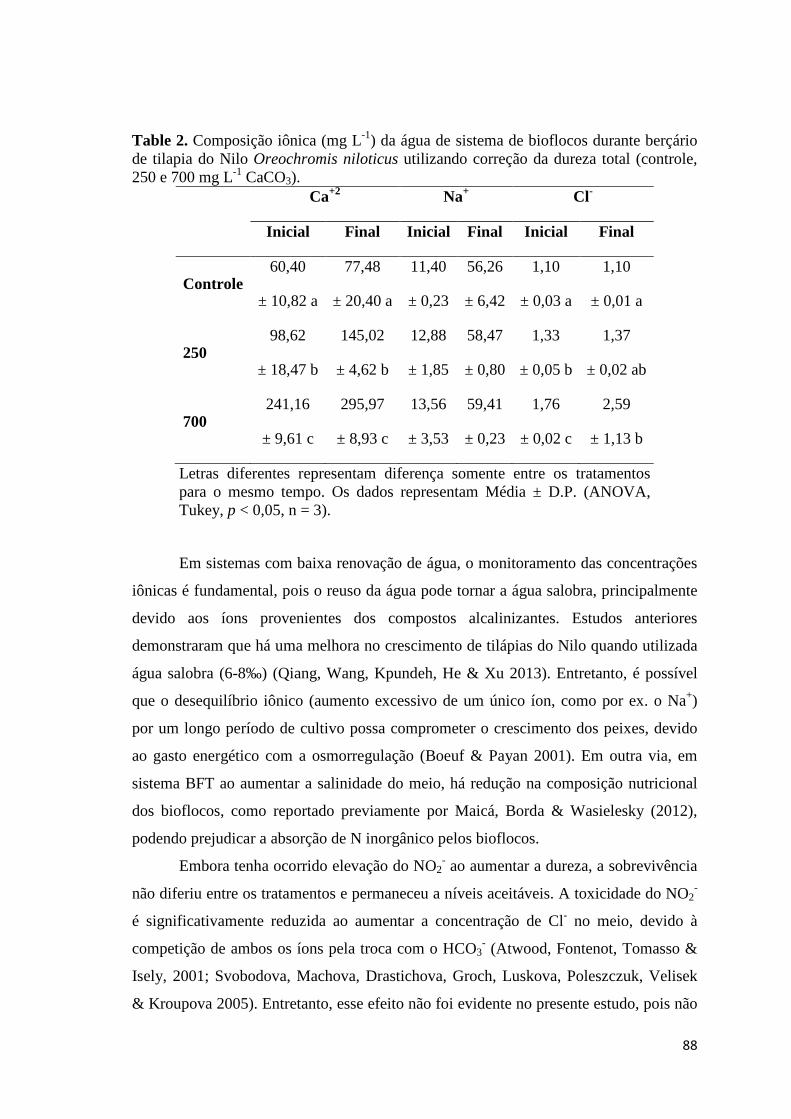
88
Table 2. Composição iônica (mg L-1) da água de sistema de bioflocos durante berçário de tilapia do Nilo Oreochromis niloticus utilizando correção da dureza total (controle, 250 e 700 mg L-1 CaCO3).
Ca+2 Na+ Cl-
Inicial Final Inicial Final Inicial Final
Controle 60,40
± 10,82 a
77,48
± 20,40 a
11,40
± 0,23
56,26
± 6,42
1,10
± 0,03 a
1,10
± 0,01 a
250 98,62
± 18,47 b
145,02
± 4,62 b
12,88
± 1,85
58,47
± 0,80
1,33
± 0,05 b
1,37
± 0,02 ab
700 241,16
± 9,61 c
295,97
± 8,93 c
13,56
± 3,53
59,41
± 0,23
1,76
± 0,02 c
2,59
± 1,13 b
Letras diferentes representam diferença somente entre os tratamentos para o mesmo tempo. Os dados representam Média ± D.P. (ANOVA, Tukey, p < 0,05, n = 3).
Em sistemas com baixa renovação de água, o monitoramento das concentrações
iônicas é fundamental, pois o reuso da água pode tornar a água salobra, principalmente
devido aos íons provenientes dos compostos alcalinizantes. Estudos anteriores
demonstraram que há uma melhora no crescimento de tilápias do Nilo quando utilizada
água salobra (6-8‰) (Qiang, Wang, Kpundeh, He & Xu 2013). Entretanto, é possível
que o desequilíbrio iônico (aumento excessivo de um único íon, como por ex. o Na+)
por um longo período de cultivo possa comprometer o crescimento dos peixes, devido
ao gasto energético com a osmorregulação (Boeuf & Payan 2001). Em outra via, em
sistema BFT ao aumentar a salinidade do meio, há redução na composição nutricional
dos bioflocos, como reportado previamente por Maicá, Borda & Wasielesky (2012),
podendo prejudicar a absorção de N inorgânico pelos bioflocos.
Embora tenha ocorrido elevação do NO2- ao aumentar a dureza, a sobrevivência
não diferiu entre os tratamentos e permaneceu a níveis aceitáveis. A toxicidade do NO2-
é significativamente reduzida ao aumentar a concentração de Cl- no meio, devido à
competição de ambos os íons pela troca com o HCO3- (Atwood, Fontenot, Tomasso &
Isely, 2001; Svobodova, Machova, Drastichova, Groch, Luskova, Poleszczuk, Velisek
& Kroupova 2005). Entretanto, esse efeito não foi evidente no presente estudo, pois não
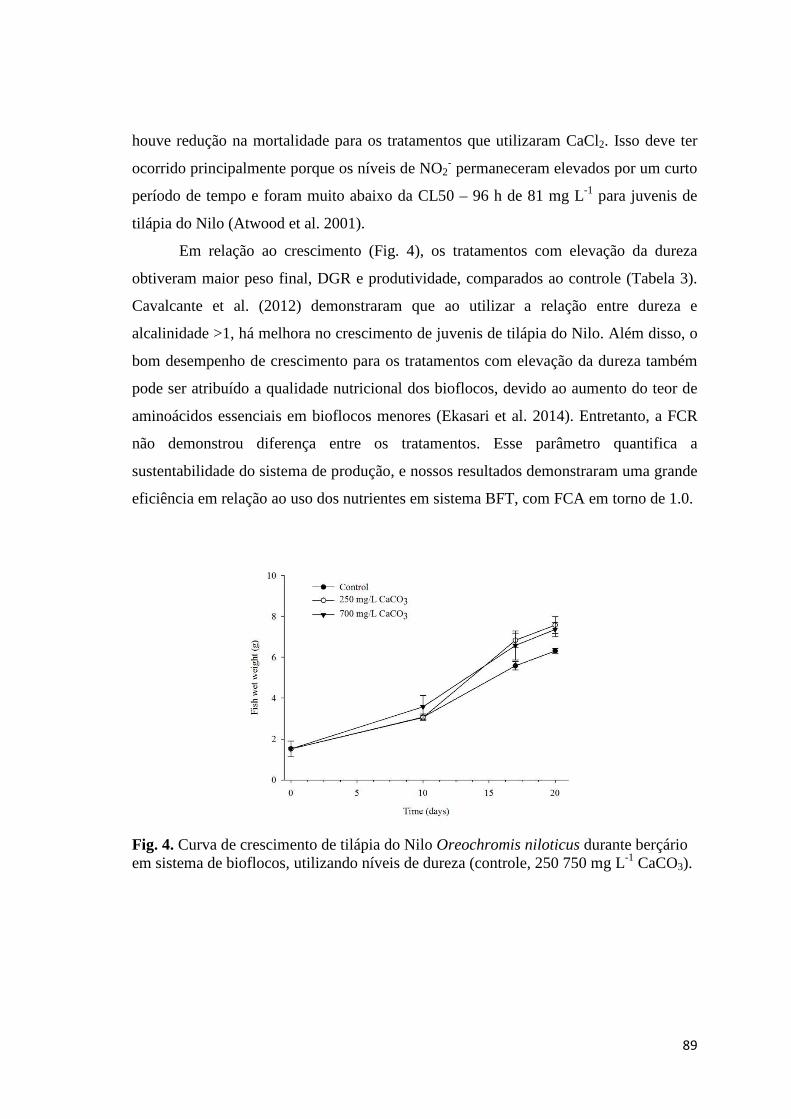
89
houve redução na mortalidade para os tratamentos que utilizaram CaCl2. Isso deve ter
ocorrido principalmente porque os níveis de NO2- permaneceram elevados por um curto
período de tempo e foram muito abaixo da CL50 – 96 h de 81 mg L-1 para juvenis de
tilápia do Nilo (Atwood et al. 2001).
Em relação ao crescimento (Fig. 4), os tratamentos com elevação da dureza
obtiveram maior peso final, DGR e produtividade, comparados ao controle (Tabela 3).
Cavalcante et al. (2012) demonstraram que ao utilizar a relação entre dureza e
alcalinidade >1, há melhora no crescimento de juvenis de tilápia do Nilo. Além disso, o
bom desempenho de crescimento para os tratamentos com elevação da dureza também
pode ser atribuído a qualidade nutricional dos bioflocos, devido ao aumento do teor de
aminoácidos essenciais em bioflocos menores (Ekasari et al. 2014). Entretanto, a FCR
não demonstrou diferença entre os tratamentos. Esse parâmetro quantifica a
sustentabilidade do sistema de produção, e nossos resultados demonstraram uma grande
eficiência em relação ao uso dos nutrientes em sistema BFT, com FCA em torno de 1.0.
Fig. 4. Curva de crescimento de tilápia do Nilo Oreochromis niloticus durante berçário em sistema de bioflocos, utilizando níveis de dureza (controle, 250 750 mg L-1 CaCO3).
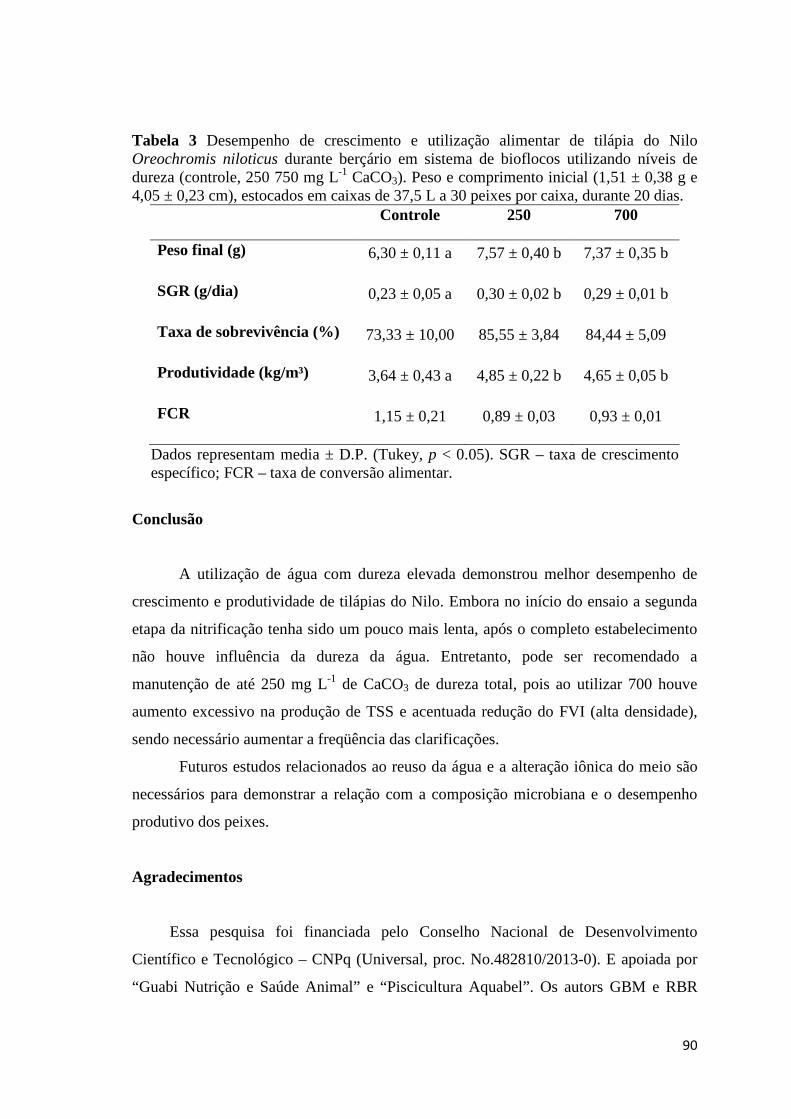
90
Tabela 3 Desempenho de crescimento e utilização alimentar de tilápia do Nilo Oreochromis niloticus durante berçário em sistema de bioflocos utilizando níveis de dureza (controle, 250 750 mg L-1 CaCO3). Peso e comprimento inicial (1,51 ± 0,38 g e 4,05 ± 0,23 cm), estocados em caixas de 37,5 L a 30 peixes por caixa, durante 20 dias.
Controle 250 700
Peso final (g) 6,30 ± 0,11 a 7,57 ± 0,40 b 7,37 ± 0,35 b
SGR (g/dia) 0,23 ± 0,05 a 0,30 ± 0,02 b 0,29 ± 0,01 b
Taxa de sobrevivência (%) 73,33 ± 10,00 85,55 ± 3,84 84,44 ± 5,09
Produtividade (kg/m³) 3,64 ± 0,43 a 4,85 ± 0,22 b 4,65 ± 0,05 b
FCR 1,15 ± 0,21 0,89 ± 0,03 0,93 ± 0,01
Dados representam media ± D.P. (Tukey, p < 0.05). SGR – taxa de crescimento específico; FCR – taxa de conversão alimentar.
Conclusão
A utilização de água com dureza elevada demonstrou melhor desempenho de
crescimento e produtividade de tilápias do Nilo. Embora no início do ensaio a segunda
etapa da nitrificação tenha sido um pouco mais lenta, após o completo estabelecimento
não houve influência da dureza da água. Entretanto, pode ser recomendado a
manutenção de até 250 mg L-1 de CaCO3 de dureza total, pois ao utilizar 700 houve
aumento excessivo na produção de TSS e acentuada redução do FVI (alta densidade),
sendo necessário aumentar a freqüência das clarificações.
Futuros estudos relacionados ao reuso da água e a alteração iônica do meio são
necessários para demonstrar a relação com a composição microbiana e o desempenho
produtivo dos peixes.
Agradecimentos
Essa pesquisa foi financiada pelo Conselho Nacional de Desenvolvimento
Científico e Tecnológico – CNPq (Universal, proc. No.482810/2013-0). E apoiada por
“Guabi Nutrição e Saúde Animal” e “Piscicultura Aquabel”. Os autors GBM e RBR

91
agradecem ao auxílio financeiro de Doutorado e Produtividade em Pesquisa,
respectivamente.
Referências
Aminot A. & Chaussepied, M. (1983) Manuel des analyses chimiques en milieu marin.
Centre National pour L'Exploitation des Oceans. CNEXO, Brest.
APHA (American Public Health Association). (1998) Standard methods for the
examination of water and wastewater, 20st edition, Whashington DC.
Atwood H.L., Fontenot Q.C., Tomasso J.R. & Isely J.J. (2001) Toxicity of nitrite to
Nile Tilapia: effect of fish size and environmental chloride. North American Journal
of Aquaculture 63, 49–51.
Avnimelech Y. (1999) Carbon/nitrogen ratio as a control element in aquaculture
systems. Aquaculture 176, 227–235.
Avnimelech Y. & Kochba, M. (2012) Evaluation of nitrogen uptake and excretion by
tilapia in bio floc tanks, using 15N tracing. Aquaculture 287, 163–168.
Baldisserotto B. (2011) Water pH and hardness affect growth of freshwater teleosts.
Revista Brasileira de Zootecnia 40, 138–144.
Boeuf G. & Payan P. (2001) How should salinity influence fish growth? Comparative
Biochemistry and Physiology C 130, 411–423.
Boyd C. E. (2015) Water quality, an introduction, 2nd edition. Springer, New York,
New York, USA.
Boyd C.E., Tucker C.S. & Someidhivej B. (2016) Alkalinity and Hardness: Critical but
Elusive Concepts in Aquaculture. Journal of the World Aquaculture Society 47 (1).
Cavalcante D.H., Silva S.R., Pinheiro P.D., Akao M.M.F. & Sá M.V.C. (2012) Single
or paired increase of total alkalinity and hardness of water for cultivation of Nile
tilapia juveniles, Oreochromis niloticus. Acta Scientarium Technology 32 (2), 177–
183.
Crab R., Defoirdt T., Bossier P. & Verstraete W. (2012) Biofloc technology in
aquaculture: Beneficial effects and future challenges. Aquaculture 356-357, 351–
356.
92
De Schryver P., Crab R., Defoirdt T., Boon N. & Verstraete W. (2008) The basics of
bio-flocs technology: The added value for aquaculture. Aquaculture 277, 125–137.
Eaton A. D., Clesceri L.S., Rice E.W. & Greenberg A.E. (2005) Standard methods for
the examination of water and wastewater, 21st edition. American Public Health
Association, Washington, District of Columbia, USA.
Ebeling J.M., Timmons M.B. & Bisogni J.J. (2006) Engineering analysis of the
stoichiometry of photoautotrophic, autotrophic, and heterotrophic removal of
ammonia–nitrogen in aquaculture systems. Aquaculture 257, 346–358.
Ekasari J., Angela D., Waluyo S.H., Bachtiar T., Surawidjaja E.H., Bossier P. & De
Schryver P. (2014) The size of biofloc determines the nutritional composition and the
nitrogen recovery by aquaculture animals. Aquaculture 426-427, 105–111.
Furtado P. S., Gaona C.A.P., Poersch L.H. & Wasielesky W. (2014) Application of
different doses of calcium hydroxide in the farming shrimp Litopenaeus vannamei
with the biofloc technology (BFT). Aquaculture International 22, 1009–1023.
Hu B., Qi R., An W., Xu M., Zhang Y., Bai X., Bao H., Wen Y., Gu J. & Yang M.
(2013) Dynamics of the microfauna community in a full-scale municipal wastewater
treatment plant experiencing sludge bulking. European Journal of Protistology 49,
491–499.
Li W., Xu W., Parise J.B. & Phillips B.L. (2012) Formation of hydroxylapatite from co-
sorption of phosphate and calcium by boehmite. Geochimica et Cosmochimica Acta
85, 289–301.
Liao B.Q., Droppo I.G., Leppard G.G. & Liss S.N. (2006) Effect of solids retention
time on structure and characteristics of sludge flocs in sequencing batch reactors.
Water Research 40, 2583–2591.
Luo G., Avnimelech Y., Pan Y. & Tan H. (2013a) Inorganic nitrogen dynamics in
sequencing batch reactors using biofloc technology to treat aquaculture sludge.
Aquacultural Engineering 53, 73–79.
Luo G., Liang W., Tan H., Yao C., Zhang N. & Lu L. (2013b) Effects of calcium and
magnesium addition on the start-up of sequencing batch reactor using biofloc
technology treating solid aquaculture waste. Aquacultural Engineering 57, 32–37.
Maicá P.F., Borda M.R. & Wasielesky W. (2012) Effect of low salinity on microbial
floc composition and performance of Litopenaeus vannamei (Boone) juveniles reared
93
in a zero-water-exchange super-intensive system. Aquaculture Research 43, 361–
370.
Nguyen T.P., Hankins N.P. & Hilal N. (2007) A comparative study of the flocculation
behaviour and final properties of synthetic and activated sludge in waste water
treatment. Desalination 204, 277–295.
Nguyen T.P., Hilal N., Hankins N.P. & Novak J.T. (2008) Characterization of synthetic
and activated sludge and conditioning with cationic polyelectrolytes. Desalination
227, 103–110.
Parra J.E.G. & Baldisserotto B. (2007) Effect of water pH and hardness on survival and
growth of freshwater teleosts. In: Fish osmoregulation (ed. By B. Baldisserotto, J.M.
Mancera & B.G. Kapoor), pp 135–150. Science Publishers, New Hampshire, USA.
Peeters B., Dewil R., Lechat D. & Smets I.Y. (2011) Quantification of the exchangeable
calcium in activated sludge flocs and its implication to sludge settleability.
Separaration and Purification Technology 83, 1–8.
Qiang J., Wang H., Kpundeh M.D., He J. & Xu P. (2013) Effect of water temperature,
salinity, and their interaction on growth, plasma osmolality, and gill Na+, K+-
ATPase activity in juvenile GIFT tilapia Oreochromis niloticus (L.). Journal of
Thermal Biology 38, 331–338.
Ray A.J., Lewis B.L., Browdy C.L. & Leffler J.W. (2010) Suspended solids removal to
improve shrimp (Litopenaeus vannamei) production and an evaluation of a plant-
based feed in minimal-exchange, superintensive culture systems. Aquaculture 299,
89–98.
Ray A.J. & Lotz J.M. (2014) Comparing a chemoautotrophic-based biofloc system and
three heterotrophic-based systems receiving different carbohydrate sources.
Aquacultural Engineering 63, 54–61.
Rebouças V.T., Lima F.R.S., Cavalcante D.H. & Sá M.V.C. (2015) Tolerance of Nile
tilapia juveniles to highly acidic rearing water. Acta Scientarium Animal Sciences 37
(3), 227–233.
Ren T.T., Liu L., Sheng G.P., Liu X.W., Yu H.Q., Zhang M.C., Zhu J.R. (2008)
Calcium spatial distribution in aerobic granules and its effects on granule structure,
strength and bioactivity. Water Research 42 (13), 3343–3352.
94
Santos V.B., Mareco E.A., Silva M.D.P. (2013) Growth curves of Nile tilapia
(Oreochromis niloticus) strains cultivated at different temperatures. Acta Scientarium
Animal Science 35 (3), 235–242.
Schneider O., Sereti V., Eding E., Verreth J. (2006) Molasses as C source for
heterotrophic bacteria production on solid fish waste. Aquaculture 261, 1239–1248.
Schneider O., Sereti V., Eding E.H. & Verreth J.A.J. (2007) Heterotrophic bacterial pro-
duction on solid fish waste: TAN and nitrate as nitrogen source under practical RAS
conditions. Bioresource Technology 98, 1924–1930.
Schveitzer R., Arantes R., Costódio P.F.S., Espírito Santo C.M., Arana L.V., Seiffert,
W.Q. & Andreatta E.R. (2013) Effect of different biofloc levels on microbial
activity, water quality and performance of Litopenaeus vannamei in a tank system
operated with no water exchange. Aquacultural Engineering 56, 59–70.
Sobeck D.C. & Higgins M.J. (2002) Examination of three theories for mechanisms of
catio-induced bioflocculation. Water Research 36, 527–538.
Strickland, J.D.H. & Parsons, T.R. (1972) A Practical Handbook of Seawater Analysis,
310 pp. Ottawa: Bulletin of Fisheries Research Board Canada.
Svobodova Z., Machova J., Drastichova J., Groch L., Luskova V., Poleszczuk G.,
Velisek J. & Kroupova H. (2005) Haematological and biochemical profile of carp
blood following nitrite exposure at different concentration of chloride. Aquaculture
Research 36, 1177–1184.
Tran-Duy A., Dam A.A. & Schrama J.W. (2012) Feed intake, growth and metabolism
of Nile tilapia (Oreochromis niloticus) in relation to dissolved oxygen concentration.
Aquaculture Research 43, 730–744.
Unesco (1983) Chemical methods for use in marine environmental monitoring. Manual
and Guides 12. Intergovernmental Oceanographic Commission, Paris, FR.
Wood C.M. (2001) Toxic response of the gill. In: Target Organ Toxicity in Marine and
Freshwater Teleosts, D. Schlenk and W.H. Benson (eds.). Taylor & Francis, London,
pp. 1–89.
Ye C., Yang X., Zhao F. & Ren L. (2016) The shift of the microbial community in
activated sludge with calcium treatment and its implication to sludge settleability.
Bioresource Technology 207, 11–18.
95
Yousuf, I. (2013) 38th Annual WIOA Qld Water Industry Operations Conference
Parklands, Glod Coast, pp. 95–101.
96
DISCUSSÃO GERAL
O intenso consumo de alcalinidade, e consequente redução do pH, tem sido
relatado por estudos prévios com tilápia do Nilo Oreochromis niloticus em sistema BFT
(Azim & Little 2008, Pérez-Fuentes et al. 2016). Entretanto, para a utilização desse
sistema, é fundamental o correto manejo da alcalinidade e do pH, principalmente
quando em alta densidade de estocagem.
O presente estudo demonstrou melhor desempenho de crescimento quando
utilizados NaHCO3, comparado ao CaCO3, enquanto o Ca(OH)2 foi similar aos demais
tratamentos. Estudos prévios com camarão marinho Litopenaeus vannamei em BFT
demonstram bom desempenho quando utilizados o NaHCO3 ou Ca(OH)2 (Furtado et al.
2011, Zhang et al. 2015), sendo este uma boa alternativa devido ao baixo custo (Furtado
et al. 2014).
A tilápia do Nilo é considerada uma espécie que tolera um amplo intervalo de
pH, entre entre 4,0–11,0 (Mahdi 1973). Entretanto, resultados heterogêneos tem sido
demonstrados para o crescimento de tilápias do Nilo, como o intervalo de pH 4,0–6,0
em viveiros escavados (Rebouças et al. 2015) ou pH 7,0–8,0 de juvenis em aquários (El
Sheriff & El-Feky 2009). Nossos resultados demonstraram desempenho superior de
crescimento quando as tilápias foram mantidas em pH 7,5, comparado ao 8,3, enquanto
o tratamento 6,5 foi similar aos demais.
O desempenho inferior de crescimento ao utilizar CaCO3 ou pH 8,3 foi atribuído
ao excessivo aumento dos sólidos suspensos totais, e redução do teor protéico dos
bioflocos. Há uma estreita relação entre o manejo dos sólidos suspensos e o conteúdo
nutricional dos bioflocos. Ray et al. (2010) estudando camarões marinhos Litopenaeus
vannamei, demonstraram que ao aumentar a freqüência de clarificações, ocorre remoção
de nutrientes do sistema, podendo induzir a redução no conteúdo protéico dos bioflocos.
O controle dos sólidos suspensos é um desafio em sistemas de alta densidade
sem renovação de água, devido à grande entrada de ração no sistema. Como por ex., no
presente estudo a produtividade final dos ensaios que testaram as fontes alcalinizantes e
os níveis de pH, atingiu aprox. 25 kg/m³, e isso representa a entrada de aprox. 1,0 kg de
ração/m³/dia. Portanto, é necessário demonstrar práticas de manutenção que possam
reduzir ao máximo a produção de sólidos suspensos, pois além de alterar a composição
97
nutricional, as clarificações implicam em aumento dos custos de produção e geração de
resíduos (sludge).
Ao avaliar a correção da dureza total, utilizando o controle (sem correção) e os
níveis de 250 e 750 mg/L CaCO3, houve crescimento superior para os tratamentos. O
melhor crescimento pode ser atribuído a dois fatores: (1) aumento no teor de
aminoácidos essenciais e (2) redução de gasto energético com a osmorregulação devido
às perda iônicas.
O aumento do nível de Ca+2 dissolvido resulta em redução do tamanho dos
bioflocos (Luo et al. 2013). Enquanto Ekasari et al. (2014) demonstraram que bioflocos
de tamanho menor possuem conteúdo protéico inferior, entretanto, o teor de
aminoácidos essenciais é superior, comparado aos maiores.
Além disso, o Ca+2 é relacionado ao aumento da coagulação-floculação em
sistema de tratamento que utilizam lodo ativado (Peeters et al. 2011, Ye et al. 2016).
Assim, a maior concentração de Ca+2 pode ser utilizada para estabilizar o índice de
volume de floco (FVI), que para aquicultura pode ser recomendado entre 40-100. Esse
intervalo demonstra bioflocos com boa capacidade de sedimentação, como também
capacidade de permanecer na coluna da água devido à intensidade de mistura (aeração)
do sistema.
No aspecto fisiológico dos peixes, o Ca+2 possui importante função diminuindo a
abertura das tight junctions nas brânquias, o que evita as perdas iônicas (Wood 2001) e
pode reduzir o gasto energético com a osmorregulação (Boeuf & Payan 2001). Ainda
mais, quando em pH acidificado há aumento na permeabilidade branquial, causando
maior perda iônica para o meio, e a elevação da dureza é uma estratégia utilizada para
que isso seja evitado (Baldisserotto 2011).
Os alcalinizantes testados foram eficientes na correção da alcalinidade e do pH,
e não houve diferença na ciclagem do nitrogênio inorgânico dissolvido (TAN e NO2-).
Enquanto ao utilizar pH 6,5 ou dureza total de 250 ou 700, ocorreu uma redução
temporária na velocidade da segunda etapa da nitrificação (NO2- → NO3
-). Isso pode ser
atribuído ao meio desfavorável para o crescimento das bactérias, necessitando mais
tempo para a adaptação e o estabelecimento desses microorganismos. Esses são os
primeiros resultados para a nitrificação em sistema BFT em água doce avaliando níveis
de pH e dureza total, e são abordagens que devem ser mais exploradas.
98
Como forma de reduzir o consumo de composto alcalinizante, pode ser
recomendado o uso de Ca(OH)2, em pH 6,5 e dureza total de até 250 mg/L. Embora não
tenha sido avaliado, os resultados permitem inferir que essa configuração pode
representar consumo de alcalinizante em relação à ração entre 5-8%. Essa relação pode
ser utilizada para estimar o acumulo iônico no sistema, como também para calcular o
custo com o alcalinizante no ciclo de produção.
Os resultados demonstram aumento de Na+ ou Ca+2 ao longo do ensaio,
obviamente de acordo com o alcalinizante utilizado. Entretanto, no presente estudo
esses acúmulos não parecem ter comprometido o desempenho de crescimento dos
peixes. Esses resultados indicam a necessidade de monitoramento das concentrações
iônicas, especialmente quando o sistema opera em alta densidade de estocagem, por
longos períodos de tempo e/ou reutilizando a água.
A avaliação do status fisiológico e bioquímico dos peixes em sistemas
superintensivos é fundamental, pois são ferramentas utilizadas para detectar os possíveis
distúrbios causados aos organismos cultivados. No presente estudo, quando utilizadas as
diferentes fontes alcalinizantes ou níveis de pH, não foram detectadas alterações dos
parâmetros hematológicos (glicose, hematócrito e osmolalidade). Ainda mais, os
valores permaneceram dentro do intervalo considerado normal para tilápia do Nilo
(Bittencourt et al. 2010).
A capacidade antioxidante é determinada pela capacidade de bloquear os efeitos
das espécies reativas de oxigênio, e quando não é efetiva, ocorre o estresse oxidativo
(Jones 2006). O estresse oxidativo tem sido utilizado para avaliar as condições de
cultivo em aquicultura, relacionado aos níveis de amônia (Sinha et al. 2014) e hipóxia
(Welker et al. 2013). Ao avaliar os parâmetros oxidativos (ACAP, LPO, SOD e CAT),
não ocorreram alterações ao utilizar as diferentes fontes alcalinizantes (NaHCO3,
CaCO3 ou Ca(OH)2) ou os níveis de pH (6,5, 7,5 ou 8,3). Isso indica que as condições
de cultivo não impuseram desafio fisiológico aos peixes, pois estão dentro do intervalo
de tolerância da espécie.
Finalmente, durante todos os ensaios não houve renovação de água, apenas
reposições por perdas com evaporação e clarificação. Alem disso, as taxas de conversão
alimentar permaneceram em torno de 1,0 e a sobrevivência dos peixes em aprox. 80%.
Esses resultados demonstram a eficiente utilização de água e nutrientes, atingindo
99
excelente desempenho produtivo, o que confirma a sustentabilidade da tecnologia dos
bioflocos.
REFERÊNCIAS
AZIM , ME & DC LITTLE. 2008. The bioflocs technology (BFT) in indoor tanks: water
quality, bioflocs composition, and growth and welfare of Nile tilapia (Oreochromis
niloticus). Aquaculture, 283: 29–35.
BALDISSEROTTO, B. 2011. Water pH and hardness affect growth of freshwater teleosts.
R. Bras. Zootec., 40: 138–144.
BITTENCOURT, NLR, ML MOLINARI , DO SCOARIS, RB PEDROSO, CV NAKAMURA , T UEDA-
NAKAMURA , BA ABREU FILHO & BP DIAS FILHO. 2003. Haematological and
biochemical values for Nile tilapia Oreochromis niloticus cultured in semi-intensive
system. Acta Sci. Biol. Sci., 25 (2): 385–389.
BOEUF, G & P PAYAN. 2001. How should salinity influence fish growth? Comp.
Biochem. Phys. C, 130: 411–423.
EKASARI, J, D ANGELA, SH WALUYO, T BACHTIAR, EH SURAWIDJAJ, P BOSSIER & P DE
SCHRYVER. 2014. The size of biofloc determines the nutritional composition and the
nitrogen recovery by aquaculture animals. Aquaculture, 426-427: 105–111.
EL-SHERIF, MS & AMI EL-FEKY. 2009. Performance of Nile tilapia (Oreochromis
niloticus) fingerlings. I. Effect of pH. Int. J. Agric. Biol., 11: 297–300.
FURTADO, PS, CAP GAONA, LH POERSCH & W WASIELESKY. 2014. Application of different
doses of calcium hydroxide in the farming shrimp Litopenaeus vannamei with the
biofloc technology (BFT). Aquacult. Int., 22: 1009–1023.
FURTADO, PS, LH POERSCH & W WASIELESKY. 2011. Effect of calcium hydroxide,
carbonate and sodium bicarbonate on water quality and zootechnical performance of
shrimp Litopenaeus vannamei reared in bio-flocs technology (BFT) systems.
Aquaculture, 321: 130–135.
JONES, DP. 2006. Redefining oxidative stress. Antioxid. Redox Signal. 8: 1865–79.
LUO, G, W LIANG, H TAN, C YAO, N ZHANG & L LU. 2013 Effects of calcium and
magnesium addition on the start-up of sequencing batch reactor using biofloc
technology treating solid aquaculture waste. Aquacult. Eng., 57: 32–37.
100
MAHDI , MA. 1973. Studies on factors affecting survival of Nile fish in the Sudan. I. The
effects of hydrogen ion concentration. Mar. Biol., 18: 89–92.
PEETERS, B, R DEWIL, D LECHAT & IY SMETS. 2011. Quantification of the exchangeable
calcium in activated sludge flocs and its implication to sludge settleability. Separ.
Purif. Technol., 83: 1–8.
PÉREZ-FUENTES, JA, MP HERNÁNDEZ-BERGARA, I CARLOS, PÉREZ-ROSTRO & I FOGEL.
2016. C:N ratios affect nitrogen removal and production of Nile tilapia Oreochromis
niloticus raised in a biofloc system under high density cultivation. Aquaculture, 452:
247–251.
RAY, AJ, BL LEWIS, CL BROWDY & JW LEFFLER. 2010. Suspended solids removal to
improve shrimp (Litopenaeus vannamei) production and an evaluation of a plant-
based feed in minimal-exchange, superintensive culture systems. Aquaculture 299,
89–98.
REBOUÇAS, VT, FRS LIMA, DH CAVALCANTE & MCV SÁ. 2015. Tolerance of Nile tilapia
juveniles to highly acidic rearing water. Acta Sci. Anim. Sci., 37 (3): 227–233.
SINHA, AK, H ABDELGAWAD, T GIBLEN, G ZINTA, M DE ROP, H ASARD, R BLUST & G DE
BOECK. 2014. Anti-Oxidative Defences Are Modulated Differentially in Three
Freshwater Teleosts in Response to Ammonia-Induced Oxidative Stress. PLoS ONE,
9(4): e95319.
WELKER, AF, DC MOREIRA, EG CAMPOS, M HERMES-LIMA . 2013. Role of redox
metabolism for adaptation of aquatic animals to drastic changes in oxygen
availability. Comp. Biochem. Physiol. A, 165: 384–404.
WOOD, CM. 2001. Toxic response of the gill. In: D SCHLENK & WH benson (eds.). Target
Organ Toxicity in Marine and Freshwater Teleosts. Taylor & Francis, London, 1–89.
YE, C, X YANG, F ZHAO & L REN. 2016. The shift of the microbial community in activated
sludge with calcium treatment and its implication to sludge settleability. Bioresource
Technol., 207: 11–18.
ZHANG, K, L PAN, W CHEN & C WANG. 2015. Effect of using sodium bicarbonate to adjust
the pH to different levels on water quality, the growth and the immune response of
shrimp Litopenaeus vannamei reared in zero-water exchange biofloc-based culture
tanks. Aquac. Res., 1–15.
101
CONCLUSÃO GERAL
A presente tese demonstra temas ainda pouco explorados para a produção de
tilápias do Nilo em BFT. As conclusões são listadas abaixo.
• A utilização de NaHCO3 ou Ca(OH)2 proporciona o melhor desempenho de
crescimento e produtividade em sistema BFT para juvenis de tilápias do Nilo, sem
comprometer a nitrificação ou o status fisiológico dos peixes. Economicamente, o
uso de Ca(OH)2 pode ser mais vantajoso que NaHCO3, devido ao menor valor de
mercado e utilização relativa à quantidade de ração (7 vs 14%, respectivamente).
• Iniciar a formação dos bioflocos com pH próximo a 8,0 representa vantagens à
nitrificação. Entretanto, após o estabelecimento da nitrificação, pode ser
recomendado a manutenção do sistema em pH 6,5. Isso representa menor utilização
de alcalinizante em relação à ração utilizada, comparando o pH 6,5 ao 8,3 (13 vs
20%, respectivamente). Consequentemente, isso contribui para a preservação da
composição iônica da água, reduzindo a produção de sólidos suspensos totais e a
quantidade de remoções de flocos. Além disso, utilizar pH 6,5 proporciona aumento
no teor protéico dos bioflocos.
• A elevação da dureza total entre 250 e 700 mg/L CaCO3 demonstrou desempenho de
crescimento e produtividade maiores que o controle. Entretanto, há uma relação
positiva entre a dureza e o aumento dos sólidos suspensos, devido a adesão do Ca+2
às substâncias poliméricas extracelulares (EPS) produzidas pelas bactérias.
Consequentemente ocorre redução do tamanho e aumento da densidade (menor FVI)
dos bioflocos. Esses resultados podem ser benéficos devido a três aspectos: (1)
melhora da composição nutricional, (2) evita a redução excessiva da densidade
(bulking, FVI ≈ 200 mL/g) dos bioflocos e (3) demonstra ser possível o reuso da
água mesmo quando a água é extremamente dura (até 700 mg/L CaCO3).
• O monitoramento ao longo do cultivo dos níveis de NO3-, PO4
-, e os íons Na+, Ca+2 e
Cl- são fundamentais, pois por um longo prazo, podem atingir níveis capazes de
causar efeitos deletérios ao crescimento.
102
• Finalmente, ao analisar conjuntamente os resultados, é possível concluir que para
atingir o máximo desempenho de crescimento para juvenis de tilápia do Nilo em
sistema BFT, utilizando peixes com peso inicial entre 1,5 - 3,0 g, densidade inicial de
670–800 peixes m³ ou 1,3–1,6 kg/m³ e densidade final até 25,0 kg/m³, é necessário
manter as seguintes condições:
- Utilizar como composto alcalinizante: NaHCO3 ou Ca(OH)2;
- intervalo de pH: 6,5–7,5;
- intervalo de dureza total: 250–700 mg/L CaCO3;
- sólidos suspensos totais: <800 mg/L
- índice de volume do floco (FVI): 40–80 mL/g.