Embed Size (px)
Citation preview
1
UNIVERSITÀ CATTOLICA DEL SACRO CUORE
MILANO
Dottorato di ricerca in Biotecnologie Molecolari
ciclo XIX
S.S.D. AGR/16
TWO DIFFERENT ASPECTS OF GENOMICS: THE CONSTRUCTION
OF A HIGH-DENSITY RADIATION HYBRID MAP AND THE STUDY OF
THE INVOLVEMENT OF MIRNAS IN THE MAMMARY GLAND
(DUE DIFFERENTI ASPETTI DELLA GENOMICA: LA COSTRUZIONE
DI UNA MAPPA DI IBRIDI DI RADIAZIONE AD ALTÀ DENSITÀ E LO
STUDIO DEL COINVOLGIMENTO DEI MIRNAS NELLA GHIANDOLA
MAMMARIA)
Tesi di dottorato di : SILVERI LICIA
Matricola : 3280012
Anno Accademico 2005/2006
1
UNIVERSITÀ CATTOLICA DEL SACRO CUORE MILANO
Dottorato di ricerca in Biotecnologie Molecolari
ciclo XIX S.S.D. AGR/16
TWO DIFFERENT ASPECTS OF GENOMICS: THE CONSTRUCTION OF A
HIGH-DENSITY RADIATION HYBRID MAP AND THE STUDY OF THE INVOLVEMENT OF MIRNAS IN THE MAMMARY GLAND
(DUE DIFFERENTI ASPETTI DELLA GENOMICA: LA COSTRUZI ONE DI
UNA MAPPA DI IBRIDI DI RADIAZIONE AD ALTÀ DENSITÀ E LO STUDIO DEL COINVOLGIMENTO DEI MIRNAS NELLA GHIANDOLA MAMMA RIA)
Coordinatore: Ch. mo Prof. MORELLI LORENZO
Tesi di dottorato di : SILVERI LICIA Matricola : 3 280012
Anno Accademico 2005/2006

1
Thanks
I would like to thank my supervisor, Paolo Ajmone-Marsan, who gave me the possibility to
join his group and to catch all the formative good opportunities that appeared in this
triennium of doctorate.
A special thanks to Fabienne LeProvost and her group, who followed me and taught me with
care and attention.
I would like to remember also André Eggen, who accepted me in his lab for some months,
and Sandrine Floriot, who helped me in the first months of my stage in France.
A thanks also to all the people of the group of Paolo Ajmone-Marsan, for their affection and
their friendly presence in the lab.
A special thanks to Andrey, for his intellectual and moral support always present, even from
far…and to my mother and my father, for their material and moral help, and for their constant
will to infuse me the faith in my capacities.

Alla piccola Sofia, che è ancora nella mia pancia, ma
ha già portato una nuova gioia nella mia vita,
che mi ha aiutato anche nella scrittura di
questa tesi.
…nella speranza che un giorno lei legga e sia
orgogliosa della sua mamma.
INDEX Sintesi 8
General Introduction: The aims of genomics in the 21’s century era 11 First part : A High-density radiation hybrid map construction 18
I-Introduction 18 I-I The objectives of livestock genomics 18
I-II Genetic maps : brief history 18
I-III Molecular markers 19
I-IV Genetic linkage maps 20
I-V Somatic hybrids and FISH 21
I-VI BAC-based physical maps 22
I-VII Comparative maps 23
I-VIII Radiation hybrid maps 24
I-VIII-a Advantages of RH maps 25
I-VIII-b Principle of construction of RH panels 25
I-VIII-c RH panel characteristics and uses 26
I-VIII-d Software used to construct RH maps 27
I-VIII-e RH bovine panels and maps 27
I-VIII-f Integration of bovine RH map data in the construction of
comparative maps 28
I-VIII-g Integration of bovine RH map data with genetic linkage
maps 30
I-IX International bovine projects 32
I-IX-a International physical map and Bovine sequencing projects 32
I-IX-b The BovGen project 33
II-Objective 35
III-Matherials and Methods 36
III-I Sequencing of ESTs 36
III-II Primer design 36
III-III Screening of the Roslin RH Panel 37
III-IV RH data analyses 37
III-V Mapping of marker associated sequences against the bovine
sequence assembly 37 III-VI Diagrammatic representation of chromosomal maps 38
6
IV-Results 39
IV-I Radiation hybrid map 39
IV-II Comparison with the ILTX RH map 40
IV-III Comparison with MARC 2004 linkage map 41
IV-IV Comparison with the 6X bovine assembly 46
V-Discussion 50 V-I Comparison with other linkage and RH maps 50
V-II Comparison with the sequence assembly 51
V-III Assignements of markers to different chromosomes 52
V-Conclusions 53
VI-Reference 54
Second part : The microRNA in the mammary gland 63
I-Introduction 63 I-I The miRNA 63 I-I-a RNA silencing and miRNA 63
I-I-b The discovery of miRNAs 64
I-I-c Biogenesis and mechanism of action 66
I-I-d Approaches to microRNA discovery 71
I-I-e Strategy to determine biological functions 74
I-I-f MiRNAs and Cell differentiation in mammalian development 78
I-I-g MiRNAs and cancer 81
I-II The mammary gland 84
I-II-a The mammary gland: structure and cellular composition 84
I-II-c The development of mammary gland 85
I-II-d Endocrine control on mammary development 87
I-II-e Role of extracellular matrix on mammary development 90
I-II-f The miRNAs in the mammary gland 92
II-Objective 93
III-Matherials and Methods 94 III-I Animals sampled 94
III-II RNA extraction and Northern Blot analyses 94
III-III Construction of miRNA libraries 95
III-III-a Clonage of low-molecular weight RNAs 96
III-III-b Reverse-transcription and amplification 98
7
III-III-c Ban I digestion and concatamerization 98
III-III-d Ligation and transformation 99
III-III-e PCR from colony 99
III-III-f Preparation of recombinant plasmidic DNA and sequencing
of the inserts 100
III-III-g Analyses of the cloned fragments 100
III-IV-Validation of the potential miRNA 101
III-IV-a Construction of the precursor sequences 101
III-IV-b Construction of the expression vector 102 III-IV-c Ligation, transformation and sequencing 103
III-IV-d DNA plasmidic preparation 104
IV-IV-e Transfection test 104
IV-Results and discussion 105 IV-I Detecting miRNAs in mouse mammary gland 105
IV-II Characterization of miRNA expression profile in MG 107
IV-III Characterization of miRNA expression profile in different organs 112
IV-IV Detecting miRNA cellular origin 113
IV-V Cloning new miRNA in mammary gland 115
IV-VI Validating potential miRNAs 117
IV-VI-a Evaluating the precursor secondary structure 118
IV-VI-b Searching for miRNAs expression 122
IV-VI-c Testing miRNA maturation 126
V-Conclusions 128 V-I State of art about miRNA involvement in mammary gland 128
V-II miRNA expression in mammary gland 129
V-III Characterization of miRNA expression profile 130
V-IV Analysis of organ- or tissue- miRNA specificity 132
V-V Construction of miRNA libraries 133
V-VI Validation of potential miRNA 134
V-VII Perspectives 135
Attached 1 137
VI-Reference 139
Publications 152
8
Sintesi In questa tesi vengono presentati due studi differenti.
Il primo, svolto sotto la supervisione del professore P. Ajmone-Marsan dell’Università
Cattolica del Sacro Cuore di Piacenza, consiste in una ricerca svolta nel quadro di un progetto
finanziato dalla Comunità Europea, chiamato ‘BovGen’, per lo sviluppo di tecnologie utili
allo studio del genoma bovino. In particolare il progetto prevedeva lo sviluppo di un array
contenente 20000 EST (Expressed Sequence Target) bovine non ridondanti, di una mappa RH
(Radiation Hybrids) bovina ad alta risoluzione finalizzata alla costruzione di mappe
comparative uomo-bovino, l’assemblaggio dei frammenti bovini genomici già sequenziati in
un unico contig e il completamento della sequenza dell’intero genoma bovino. Questi
strumenti permettono l’identificazione molecolare e lo studio dell’espressione genica di
caratteri importanti per il miglioramento genetico dei bovini e una migliore qualità della
produzione alimentare.
Nell’ambito di questa tesi inizialmente è stata sviluppata una mappa RH del genoma bovino
ad alta densità di marcatori. In particolare, la mappa è stata costruita attraverso la
caratterizzazione genica di un pannello 3000-rad di 94 linee cellulari ibride bovino-criceto,
precedentemente sviluppato al Roslin Institute di Edimburgo, aggiungendo nuovi marcatori
alla mappa RH bovina di prima generazione (William et al., 2002).
Il pannello è stato tipizzato con marcatori EST: dapprima, un set non ridondante di EST è
stato selezionato da una libreria di cloni a cDNA derivante da cervello bovino (Herwing et al.,
dati non pubblicati); tali EST sono state quindi sequenziate e allineate con la sequenza del
genoma bovino e, tramite il software Polyprimers (http://www.unitus.it/SAG/primers.zip),
sono state disegnate coppie di primer in grado di amplificare le EST nel genoma degli ibridi
bovino-criceto.
A seguito dello screening tramite PCR del pannello RH 2473, ai 30 cromosomi bovini sono
stati assegnati nuovi marcatori che sono stati infine integrati nella mappa precedente: questa
conteneva già 1497 marcatori, di cui 262 marcatori AFLP (Amplified Lenght Polymorphism) e
altri marcatori, tra cui microsatelliti, BAC (Bacterial Artificial Chromosomes), end sequences
e EST già localizzate. La mappa di ogni cromosoma è stata disegnata utilizzando software
quali RH Mapper (Slonim et al., 1997) e Carthagene (Schiex and Gaspin, 1997) ed è
disponibile al sito http://www.thearkdb.org (ArkDB public database).
La lunghezza totale della mappa prodotta è 760 Rays e la distanza media tra due marcatori è
19cR.
La mappa di ogni marcatore è stata allineata e confrontata con la mappa RH Illinois-Texas
(ILTX) (Everts-van der Wind et al., 2004), precedentemente costruita caratterizzando un
pannello RH 5000-rad di 90 linee cellulari ibride (Womack et al., 1997), e con la recente
mappa bovina genetica di linkage MARC 2004 ad alta densità di microsatelliti (Ihara et al.,
2006). Inoltre, la mappa RH sviluppata durante questo lavoro di ricerca è stata confrontata
con la versione più aggiornata della sequenza del genoma bovino (Btau_2.0).
9
Questa analisi ha evidenziato che l’ordine dei marcatori lungo i cromosomi della mappa RH
prodotta è in generale accordo con le prime due mappe, mentre si osservano maggiori
inconsistenze tra la mappa prodotta e il recente assemblaggio della sequenza bovina: questo
ha permesso di individuarne gli errori e di migliorarne la successiva versione.
Il secondo lavoro di ricerca svolto di questa tesi, svolto in Francia presso l’INRA (Institut
National de la Recherche Agronomique) di Jouy-en-Josas sotto la supervisione di F.
LeProvost, ha avuto come oggetto il ruolo dei microRNA durante lo sviluppo della ghiandola
mammaria.
I microRNA sono una classe di piccole molecole regolatrici, e spesso inibitrici,
dell’espressione genica. Dal momento che numerose evidenze sperimentali dimostrano che
questi piccoli RNA non codificanti possiedono un ruolo chiave nei processi di proliferazione,
differenziazione cellulare e organogenesi (Ambros, 2004; Jason et al., 2006 etc..), è stato
ipotizzato un loro coinvolgimento anche nello sviluppo della ghiandola mammaria di topo
durante il ciclo riproduttivo.
Tramite la tecnica Northern blot, è stata esaminata l’espressione nella ghiandola mammaria di
topo di un primo gruppo di 25 microRNA, scelti dalla letteratura tra quelli espressi nella
ghiandola mammaria dell’uomo o perchè differenzialmente espressi in tessuti cancerosi della
mammella umana.
Fra i microRNA testati, 10 sono risultati espressi anche nella ghiandola mammaria del topo e
ne è stata caratterizzata l’espressione durante i diversi stadi dello sviluppo: lo stadio di
vergine a 4 e a 8 settimane; durante la gestazione, a 4, a 6, a 9, a 12 e a 18 giorni; durante la
lattazione, a 1 e a 3 giorni, e, dopo l’allontanamento dei piccoli, durante lo stadio di
involuzione, a 1 , a 3 e a 6 giorni. La quantificazione dell’espressione genica ha dimostrato un
andamento variabile nei diversi stadi del ciclo riproduttivo, che denota un controllo
dell’espressione genica dei microRNA durante lo sviluppo dell’organo.
Ogni microRNA ha un profilo tipico d’espressione; tuttavia sono state osservate alcune
caratteristiche comuni a tutti i piccoli RNA, quali una diminuzione dell’espressione durante la
lattazione e un incremento durante l’involuzione. Questo potrebbe suggerire una correlazione
con lo sviluppo del tessuto epiteliale, che raggiunge il completo differenziamento durante la
lattazione e va in apoptosi allo stadio dell’involuzione, oppure una correlazione con
l’andamento di alcuni ormoni importanti nello sviluppo della ghiandola mammaria, quali la
prolactina.
L’esame dell’espressione dei microRNA è stato approfondito ricercando l’origine cellulare
della loro produzione tramite analisi Northern blot di ghiandole mammarie prive di tessuto
epiteliale di topi precedentemente operati. Il confronto con ghiandole mammarie normali ha
dimostrato che i microRNA analizzati vengono espressi anche in ghiandole mammarie prive
di tessuto epiteliale. Inoltre l’espressione genica di questi microRNA è stata ricercata e
verificata in 9 differenti organi murini ed è stato riscontrato che essi non sono specifici della
ghiandola mammaria.
10
Una libreria di cloni di microRNA è stata costruita a partire da RNA estratto a differenti stadi
dello sviluppo dell’organo (vergine di 8 settimane, gestazione a 2, a6, e a 18 giorni,
involuzione a 1 giorno) seguendo il protocollo di Lagos-Quintana et al., 2003.
Sono stati clonati 64 frammenti non-ridondanti della lunghezza tipica di un microRNA (19-
25 nucleotidi).
Le sequenze dei frammenti clonati sono state analizzate per identificare la loro eventuale
identità o omologia di sequenza con microRNA già depositati nel microRNA Registry
(http://www.sanger.ac.uk/Software/Rfam/mirna): la presenza nella libreria di due piccoli
RNA noti, let-7b e let-7c, ha convalidato la tecnica utilizzata in questo lavoro di tesi.
Allo scopo di identificare e convalidare i microRNA presenti nella libreria, le sequenze dei
frammenti clonati sono state mappate nel genoma murino (http://www.ensembl.org) e, per
una frazione di queste (10 frammenti), è stata predetta, tramite l’uso del programma Mfold,
(www.bioinfo.rpi.edu/applications/ mfold/old/rna), la struttura secondaria tipica del
precursore di un microRNA nella regione genomica di localizzazione.
Successivamente, per 5 potenziali microRNA clonati è stata verificata e caratterizzata
l’espressione a diversi stadi dello sviluppo della ghiandola mammaria e in 9 altri organi
murini. Questi piccoli RNA hanno dimostrato avere un profilo variabile durante lo sviluppo
dell’organo ed essere espressi in tutti i tessuti, anche se prevalentemente nella ghiandola
mammaria.
Infine per altri 2 potenziali microRNA è stata indotta e verificata in vitro la maturazione a
partire dall’espressione del potenziale precursore, dimostrando l’attività dell’enzima che
taglia il precursore generando il microRNA maturo, l’enzima Dicer, e confermandoli quali
candidati microRNA.
11
General introduction: The aims of genomics in the 21’s century era Genomics is the scientific study of structure, function and interrelationships of both individual
genes and the genome in its entirely.
Recognition of DNA as the hereditary material, determination of its structure, elucidation of
the genetic code, development of recombinant DNA technologies and establishment of
increasingly automatable methods for DNA sequencing set in the 1990 the stage for Human
Genome Project (HGP) and parallely the stage for others genome projects regarding
microorganisms, invertebrates, fish and mammals, in particular the mouse, the rat and the
farm animals.
Current progress in genetics, comparative genomics, biochemistry and bioinformatics can
bring insight into the functioning of organism in health and disease at the cellular and DNA
level. The genomics becomes the central and cohesive discipline addressed to biomedical
research and the genome sequences, the complex of information that guides biological
development and function of organisms, lie at the beginning of any molecular discovery.
The main aim of the genomics after the complete sequencing of some model organism
genomes, like, for example, Caenorhabitis elegans, Drosophila melanogaster, Mus musculus
and, ultimately in 2003, Homo sapiens, is to enlarge bases knowledge in order to improve
human health and well-being. In particular the genomics needs to extend the knowledge of all
the components encoded in the human genome, determine how they function in an integrated
manner to perform cellular and organism functions, understand how genome changes and
takes on new functional roles.
Actually the human’s genome structure is extraordinarily complex and its function poorly
understood. Only 1-2% of its bases encode proteins and an equivalent amount of the non-
coding genome is under active selection, suggesting an important function in the controlling
the expression of 30000 protein-coding genes and myriad other functional elements, like non-
coding genes and sequences determinants of chromosome dynamics. Even less is known
about the function of half of the genome, that consists of highly repetitive sequences or the
remaining non-coding, non-repetitive DNA.
A first objective of genomics is to catalogue, characterize and comprehend the entire set of
functional elements encoded in human and other genomes. Comparisons of genome
sequences from evolutionary distant species have emerged as a powerful tool for identifying
functionally important genomic elements; from the vertebrate genome sequences analyses
many previously undiscovered protein-sequencing gene were revealed; mammal-to-mammal
sequence comparisons have revealed large numbers of homologies in non-coding regions,
defining them in functional terms. Not only the study of genome sequences inter- species is
crucial to the functional characterization of the human genome, but also the study of sequence
variation intra- species will be important in defining the functional nature of some sequences.
As a larger knowledge of genome function is acquired new computational tools for the
12
prediction of the identity and behaviour of functional elements has emerged. Moreover
genomics has to understand the interactions between genes and genes products, the complex
networks that give rise to working cells, tissues, organs and organisms.
The finding of the study of simple model organisms, like bacteria and yeast, have been
extended to more complex organisms, such as the mouse and the human. Also few well-
characterized systems in mammals have been useful to discover biological molecular
pathways. A complete understanding of the working cells required information from several
levels : it was necessary to simultaneously monitor the expressions of all genes in a cell and to
measure in real-time the localization, the modifications and activity of the gene products. For
this reason new molecular techniques arose : the microarray, to analyze the transcriptome, the
entire set of transcripts of a cell; the in-situ hybridization, to follow the presence of a protein
in a tissue in vivo; the bidimensional electrophoresis to study the abundance and the
composition of a set of proteins present in a cell or in a tissue, giving birth to the proteomics.
Many other techniques that modulate temporally and/or spatially gene expressions in vitro or
in vivo, like gene-knockout methods, knock-down approaches and the recent use of small-
molecule inhibitors of specific transcript, developed after the discovery of a new regulatory
class of small non-coding RNA and their mechanism of action, generally called the RNA-
interference.
The final objectives will be to identify the genes responsible for human phenotypic
differences, or traits, and in particular the variations in DNA sequence that are correlated to
common diseases and responses to pharmacological agents, even if the expression of a
pathology is a condition that has a complex origin, and involves the interplay between
multiple genetic factors and non-genetic factors, like environmental influences. For these
reasons several projects aimed to identify all the single nucleotides polymorphism (SNP) in
the DNA sequence (i.e. single base deletions and insertions) of the human and model
organisms genome, have been established along the creation of large-scale genetic association
studies.
Moreover it should be considered that the genetic variation responsible of normal and disease
state, is also a result of the modifications of the genome subjected to the forces of evolution.
Thus, a complete elucidation of genome function requires the parallel understanding of the
sequence differences across species, in order to : identify functional elements; provide insight
into the distinct anatomical, physiological and developmental features of different organisms;
define the genetic basis of speciation; characterize the mutational process, which drives not
only long-term evolution, but that is also the cause of inherited genetic disease.
The sequencing of human genome provides an unparalleled opportunity to advance our
understanding about the role of genetic factors in human health and disease, and to apply this
insight to the prevention, diagnosis and treatment of diabetes, cancer, obesity, heart disease,
Alzheimer’s disease, etc. . The actual genomics knowledge and the new molecular tools are
able to understand and reclassify all the human illnesses. In fact, the systematic analyses of
somatic mutations, epigenetic modifications, genes and proteins expression and protein
13
modifications should allow the definition of a new molecular taxonomy of illness, that could
be the basis for developing better methods for the disease detection and more effective
treatments. Such ‘sentinel methods’ might include analysis of gene expression in circulating
leukocytes, proteomics analysis of body fluids, advanced molecular analyses of tissue
biopsies. The genetics discoveries will favour also the therapeutic design and the drug
development, if we consider that at the present the pharmaceuticals on the market target
approximately 500 human products, comparing to the 30000 protein-coding genes present in
the human. A particular promising example of the gene-based approach to therapeutics is the
application of chemical small molecules that act as positive or negative regulators of
individual gene products, pathways or cellular phenotypes, after the screening and the
understanding of biological functions of small RNA molecules, like microRNA (Collins et al.,
2003).
Genomics now provides more and more powerful tools for unravelling the molecular basis of
phenotypic diversity also in domestic animals, but genome research in livestock differs in
several respects from that in humans or in experimental organisms, because it is not oriented
to the identification of monogenic loci responsible of inherited disease. For decades breeders
have altered the genomes of farm animals in search of a desired phenotypic trait and then
selecting for it. This genomic work has already facilitated a reduction in genetic disorders in
farm animals, as many disease carriers are removed from breeding populations by purifying
selection.
Nowadays genomic research in farm animals is oriented to the study of traits of economical
interest, like growth, milk production and meat quality, that have a multifactor background
and that are controlled by an unknown number of quantitative trait loci (QTL).
Quantitative traits, such as weight and length, show a continuous distribution of phenotype
values rather than the discrete values observed for a qualitative trait. They are usually
controlled by multiple genes and influenced by environmental factors. A quantitative trait
locus is defined as a genomic region that contains one or more genes affecting the same
quantitative trait. The number of QTL that controls a given trait is not absolute and, in a
statistical model, could be infinite, each genes carrying an infinitesimal effect on the
phenotype. The main goal of genome research in livestock is to map and to characterize trait
loci controlling various phenotypic traits. This requires powerful genome resources
(Andersson, 2001).
Livestock genomics has followed in the footsteps the human genome research, adopting both
its successful strategies and technologies. In turn, livestock genomics contributes to inform
human genomes and to understand evolutionary history and its underlying mechanisms.
Moreover farm animals were shown to be quite valuable resources as models for pathology
and physiological studies. For example the reproductive physiology of domestic animals is
more similar to humans than that of rodents, because farm animals have longer gestations and
14
pre-pubertal periods than mice; specific physiological traits, such as the digestive system of
the pigs, are similar to those of humans.
In addition agricultural science has a unique responsibility to human health and social
stability, that is feeding an expanding world population while minimizing environmental and
ecological risks. The identification of DNA variation in livestock genomes that predisposes
health and productivity with less reliance on hormones, antibiotics and pesticides, will remain
a concern for some time. Ultimately DNA analysis from animal tissue can be used as an
inexpensive method for tracking the origin of meat sample, providing the quality assurance
for the consumers.
Early attempts to construct whole-genome maps of livestock species were based on the two
technologies underlying the first human genome maps : somatic cells genetics and in situ
hybridizations (Womack and Moll, 1986, Yerle et al., 1995). These early maps defined
synteny (genes on the same chromosome but not necessarily linked) and cytogenetic locations
of sequences hybridizing specific DNA probes. These finding were extremely important for
the first comparative mapping because the markers were genes or gene products highly
conserved across mammalian genomes.
Modern genomics in livestock had its formal origins in a series of conferences in the early
1990 in which international teams of animal geneticists launched both formal and informal
genome projects for some of the most widely used livestock species. From that moment dense
microsatellite maps, large-insert yeast artificial chromosome (YAC) and bacterial artificial
chromosome (BAC) libraries, radiation hybrid panel (RH) were used for some livestock
species, like cattle, pigs, sheep, horses, river buffaloes, goats, rabbit, chicken and some fish
like zebrafish, medaka, pufferfish and the sticklebacks in order to localize trait loci. Linkage
genetic maps, using microsatellite on the first rough genetic maps, the clonage and the
characterization of interesting loci in the BAC and YAC libraries, high-resolution
comparative map using the RH strategy, and the first physical maps were developed.
The development of species-specific array and the production of specific transcript profiles
started after the development of large collection of sequenced cDNA clones and the
corresponding production of the expressed sequence tags (ESTs) for many farm animals.
ESTs are small pieces of cDNA sequence (usually 200-500 nt long), which are useful as
markers for a desired portion of RNA and DNA that can be used for gene identification and
gene localization within a genome. The National Center of Biotechnology Information (NCBI)
provides the most comprehensive EST database for many farm animals, while in the Ensembl
database (http://www.ensembl.org/) is possible to find a summary of current analyses on
coding regions within genomes for selected farm animals. Mapping information are available
on the NCBI site http://www.ncbi.nlm.nih.gov/mapview/map_search.cgi?taxid=? substituting
the last ‘?’ sign with the species taxonomic number (i.e. 9031 for the chicken, 9913 for the
cow, 9823 for the pig, 7955 for the zebrafish, 9940 for the sheep, etc. ..).
15
Selection for desirable traits, or conversely, selection against undesirable traits, has been
practiced since the domestication of animals begun more than 10000 years ago. There has
been a long tradition of collecting and analysing data on phenotypic traits for breeding
purpose in farm animals, and the most common strategy for finding trait loci was to use
existing pedigree. This approach was easy in farm animals because of the large family size;
for example, the artificial insemination in cattle allows to have a 1000 progeny from a single
male. The promise of more accurate, efficient and economical selection that will produce
offspring with desirable phenotypes, underpins a substantial portion of the founding for
livestock genome projects over the past two decades.
The early linkage maps for most livestock species were constructed as tools for mapping traits
and for developing molecular markers useful in marker-assisted selection (MAS). However
the ultimate goal when mapping trait loci, the ultimate marker for MAS, is the identification
of the causative mutations underlying the selected phenotype. Positional candidate cloning is
the main strategy for this purpose. High-resolution mapping is necessary to restrict the region
of interest that could contain the QTL and the number of potential candidate genes.
Information on map location and gene function is then combined to identify more precisely
positional candidate genes, which are subsequently evaluated by mutation screening and
functional analysis. The difficulty in identifying a QTL could increase if the QTL mutations is
situated in regulatory rather than in coding regions and the phenotypic effect is shifty,
compared with simple loss-of-function mutations that cause inherited disorders.
Although mapped QTLs in livestock number in the hundreds, very few mutations underlying
quantitative trait variation have been identified. The trait loci for which the causative gene and
mutation have been identified or for which this is expected in the near future are monogenic
traits of economic and biological interest : the coat colour of the pig, in which the dominant
white colour is determined by a mutation in the KIT gene, encoding the mast/stem-cell growth
factor receptor; the body composition, in particular the relative proportion of muscle to fat
tissue, in pigs, cattle and sheep, in which different genes have been proposed as candidate
genes provoking particular phenotypes, like the double-muscling phenotypes in cattle or the
muscular hypertrophy in sheep; fertility traits are also studied in different species like sheep
and pigs; monogenic disorder like the bovine leukocyte adhesion deficiency, caused by
missense mutations in ITGB2.
Others monogenic disorders have been analysed and the corresponding causative mutations
have been catalogued in the ‘Online Mendelian Inheritance In Animals (OMIA)’ database
(http://www.angis.org.au/oma/). In this site is possible to find the list of all the single-locus
traits mapped in cattle, pig, sheep, horse, and goat, which counts hundreds of genes, and the
relative proportion of genes for which the causative mutations have been identified,
approximately one-third of them. Till October 2006 (Womack et al., 2006) there are only two
example of the causative mutation underpinning the QTLs, both in dairy cattle, and both
controlling the fat composition of milk : the first discovery of quantitative trait nucleotide
16
(QTN) was found in the DGAT1 locus on chromosome 14 (Grisart et al., 2004), and the
second one was found in the ABCG2 gene on chromosome 6 (Cohen-Zinder et al., 2005).
Ultimately the general disease resistance to pathogens is attracting attention both to improve
animal welfare and to reduce losses in production due to disease. Several studies on the
relationship between genetic variation and disease resistance have focused on major
histocompatibility complex genes. Target diseases are the trypanosomiasis in cattle; the
oedema disease in pigs, that is caused by the susceptibility to Escherichia coli infections; the
Marek’s disease (MD) in the chicken, that provoke a lymphoproliferative disease. The
identification of QTLs for disease resistance in livestock may be the next frontier for the
domestic animal genomics, in order to the understand the host-pathogen interaction and the
subsequent improvement of both animal and human health. Linkage disequilibrium mapping
will be a very powerful approach for mapping and finding trait loci in domestic animals once
dense SNP maps become available and the cost for genotyping is reduced. Current initiative
to develop complete BAC contigs of farm animal genomes will produce large-insert contigs
covering the region of interest as soon as a trait locus is mapped. Such large-insert contigs can
then be used to build a preliminary transcript map of the region by high-resolution
comparison with the corresponding region in humans or mice. The completion of the farm
animal genome sequencing will provide the researchers with the possibility to analyze the
phylogenetic conservation of a causative mutation and its functional role, that will be
evaluated later by experimentation. In this way it could be possible to unravel the molecular
basis for a variety of phenotypic traits of agricultural, biological and medical significance.
In this thesis two different studies are proposed.
The first part of my work describes a research included in the E.U. funded project ‘BovGen’,
aimed to develop advanced genomic tools useful to study the molecular and genetic control of
important traits in cattle. In particular, only an aspect of the project is described : the
construction of a high density RH map of bovine genome, which was developed under the
initiative and the responsibility of the Institute of Zootechnics of the Faculty of Agriculture of
the Catholic University of Piacenza, (Italy), having the professor P. Ajmone Marsan as
supervisor.
The second part discusses the involvement of microRNA, an important class of expression
regulatory elements in the genome, during the normal development of the mammary gland in
a model organism, the mouse. The study of these regulatory elements intends to enlarge bases
knowledge about the genetic mechanisms that control the proliferation, differentiation and
apoptosis of cells in the tissues composing mammary gland during the reproductive cycle.
This work was supported and conducted by the Laboratory of Biochemical Genetic and
Cytogenetic (LGBC) at the INRA (Institut National de la Recherche Agronomique) of Jouy-
en-Josas (France) under the responsability of F. LeProvost.
The study of some functional elements of the mouse genome, required mouse sequence
information available on the Ensembl database, thanks to a previous work of construction of
17
physical maps and genome sequencing in the mouse, analogous to what has been done for the
cattle in the BovGen project. The complete genome sequencing of the bovine was considered
an important task in genomic research, a necessary step not only to increase genetic data on
this economically important species, but also because of its general utility in the construction
of comparative maps and in the identification of new genes or new regulatory conserved
elements. Moreover the study of the microRNA function in mammary gland opens the way to
the discovery of biological mechanism of cellular proliferation, that could be correlated to the
development of breast cancer, but also to the discovery of molecular mechanism that guides
epithelial tissue differentiation till the production of milk. In the future it could be possible
that the new finding in the mouse could be applied to the bovine, to increase the milk
production or to control the timing of lactation.
Recently a new study (Clop et al., 2006) about a QTL controlling meatiness in Texel sheep,
demonstrated that the causal mutation in this species is located in the myostatin gene (GDF8)
and that a G to A transition in the 3’ UTR of the gene creates a target site for two known
microRNA, miR-1 and miR-206, which causes translational inhibition of myostatin gene and
the muscular hypertrophy, showing how the knowledge of the mechanism of action of
microRNA and the use of instruments like genetic map can fuse and focus on particular
biological aspects, like the study of economically important QTLs.
18
First part : A High-density radiation hybrid map c onstruction I-Introduction I-I The objectives of livestock genomics The detection of loci affecting economically important traits represents a major objectives in
livestock genomics. It should ultimately lead to more efficient breeding schemes (marker-
assisted selection or MAS) and improve the accuracy and intensity of selection programs
(Georges and Andersson, 1996; Haley, 1995). In this perspective genetic maps have been
constructed in various livestock species, like bovine, sheep and goat, to detect regions
containing genes and QTL. The identification of genes and cloning of the corresponding
genes may be achieved by standard positional cloning, taking advantage of the existence of
large insert libraries and searching for transcribed sequences in these regions.
Cattle are a major economic resource worldwide, therefore there has been considerable
interest in the identification of genes that are involved in improved cattle production.
Numerous reports have identified genomic regions corresponding to economically important
traits in cattle (Georges and Andersson, 1996; Georges, 1999), based on low to medium
density genetic linkage maps of the bovine genome.
I-II Genetic maps : brief history
A genetic map shows the relative position and order of markers along the chromosomes of
the genome. Genetic mapping is based on the examination of a segregating population, that
could be experimental, created for example by cross-breeding experiments, or natural, such as
a family, following the principle of inheritance as first described by Mendel in 1865 in his
two lows of Genetics, about the segregation of independent genes.
The first genetic maps were constructed in the early decades of the 20th century for organisms
such as fruit fly and used simple features inherited on genetic base like markers, even before
the discovery that genes are segments of DNA. Genes were looked on as abstract entities
responsible for the transmission of heritable characteristics from parents to offspring. To be
useful in genetic mapping a heritable characteristic must exist in two alternative forms or
phenotypes, each specified by a different allele of the corresponding gene. In the beginning
the only genes that could be studied were those specifying phenotypes that were distinguished
by visual examinations, like genes for the body color, eye color, wing shape, but soon it was
realized that only a limited number of genes has a clear phenotype and in many cases the
analyses is complicated because more than one gene affects a single physical feature. It was
necessary to find characteristics that were more numerous, more distinctive and less complex
than visual ones. The next markers used were biochemical phenotypes, easy to detect in
19
microbes and humans, like antibiotic resistance or amminoacid request for the bacteria and
yeast growth, or the blood groups and immunological proteins such as human leukocyte
antigens (the HLA systems) in humans.
Soon it was accepted that a map based entirely on simple phenotypes is not detailed because
the genes are widely spaced out in the genome with large gaps between them and moreover
only a fraction of the total number of genes exist in allelic forms that can be distinguished
conveniently.
I-III Molecular markers
Mapped polymorphisms that are not genes are called DNA or molecular markers. To be
useful they must exist in at least two allelic forms.
Many types of molecular markers with different characteristics were developed using
different molecular techniques that analyze the variation in the sequence of DNA.
The first ones were the restriction fragment length polymorphisms (RFLP), produced after
treating the DNA with a restriction endonuclease. The set of fragments produced can vary if
there are single base variations in the DNA sequence of the restriction sites, leading to a
length polymorphism of the fragments.
Others molecular markers that are generated from singular base variations of the sequence of
DNA were developed later and they can be produced after sequencing of DNA, such as the
Single Nucleotide Polymorphism, the SNP markers, or using the PCR (Polymerase Chain
Reaction), like the Random Amplification Polymorphic DNA or RAPD markers, or by a
combined use of restriction endonuclease and PCR, such as the Amplifyed Fragment Length
Polymorphism or AFLP markers.
Another class of molecular markers, widely used in the construction of high-density genetic
map, are the Simple Sequence Length Polymorphism or SSLPs markers, that comprise the
minisatellites and the microsatellites. The SSLPs are tandemly repeated sequences that show
length variation, in the minisatellite the repeats units comprises from tens to a few hundred
nucleotides, while in the microsatellite the repeats are shorter, usually di-, tri- or
tetranucleotide units. These variations of the number of repeat sequences in the DNA take
origin from “errors” during the duplication of DNA during meiosis. It is possible to identify
the SSLPs markers by PCR because the sequence flanking them are usually single copy
sequence in the genome. Microsatellites are more popular and used compared to the
minisatellites, because microsatellites are more conveniently spaced and distributes
throughout the genome and because they are shorter and therefore easily to type by PCR.
20
I-IV Genetic linkage maps
A genetic linkage map is based on the principle of genetic linkage, first discovered by
Bateson, Saunders and Punnet in 1905, but not fully understood until Thomas Hunt Morgan
began his work with fruit flies in 1910-11. This principle sets that chromosome are inherited
as intact units and then pair of genes located on the same chromosome are physically linked
together and should be inherited together if any crossing-over event recombins homologous
portion of two paired chromosomes during the meiosis. The probability that two different
genes localized on the same chromosome are inherited together is proportional to the physical
vicinity of the two genes considered and inversely correlated to the number of crossing over
events that could occur between two genes localized in distant part of a chromosome. The
localizations and orders of markers along a chromosome in genetic linkage map reflect a
measure of probability. The distance between markers is not physical, but it is measured in
centiMorgans (cM), 1 cM corresponding to 1% of frequency recombination between genes.
The real distance in base pair, kilobase or megabase between markers and genes is measured
only in physical maps, that are not produced using information from breeding experiments or
pedigrees, but examining directly the DNA with molecular biology techniques in order to
localize markers on different portions of a chromosome.
SNP and microsatellites, due to their high abundance in the genome, are getting more and
more importance in linkage genetic maps and identification of QTLs. Microsatellites are
excellent genetic markers because of their high polymorphism, different alleles containing
different numbers of repeat units, comparing to the SNP, which has only two alleles.
Genetic linkage maps, based primarily on highly polymorphic, anonymous microsatellite
markers, have been important in identifying chromosomal regions influencing economically
important traits in cattle (Casas et al., 2001; MacNeil and Grosz, 2002; Li et al., 2002).
Cattle genetic linkage maps were constructed in 1997 with 746 markers (Barendse et al., 1997)
and 1250 markers (Kappes et al., 1997), the latter one, spanning 2990 cM, was characterized
by an average interval of nearly 3.0 cM.
This cattle genetic map was probably sufficient to assign hereditary phenotypes to specific
chromosomes, but not to fine-map them. An intensive efforts to develop more markers to
narrow the critical region was required. However, the time, labor and cost per marker of
isolating DNA markers from a specific chromosomal region was substantially greater than
randomly isolating markers.
Thus a random isolation of microsatellite, from microsatellite-enriched libraries (Stone et al.,
1995), was chosen to enrich markers across the genome. The microsatellites were genotyped
and assigned to chromosomes by multipoint linkage analysis using the CRIMAP software and
a new high density bovine genetic map consisting of 3960 markers, including 3802
polymorphic microsatellite and 79 SNPs, with an average marker interval of 1.4 cM, covering
3160 cM for each of the 30 bovine chromosomes, was produced. This map represented a
21
powerful resource for fine-mapping of QTLs and a genetic backbone for the development of
well-annotated gene maps in cattle and other related species.
Recently Ihara et al. (2004) improved this cattle genetic map and developed a microsatellite-
based high-density genetic map on the basis of more than 880000 genotypes across the USDA
MARC cattle reference families with a potential genetic resolution of 0.8 cM at the 95%
confidence level (approximately 800 kb in the bovine genome).
I-V Somatic hybrids and FISH
There are different kind of physical maps, produced with many molecular techniques, that
have different degree of resolution in the assignment of genes to chromosomes.
The first crude mapping of genes on chromosomes was obtained in human by Ruddle in 1972
fusing irradiated human cells with rodent cells and observing the generation of mononucleate
hybrid cell lines capable of indefinite multiplication that, after the application of selective
media, express human biochemical markers in association with the retention of human
chromosomes. In the hybrid cells most of the human chromosomes were rapidly and
preferentially eliminated and with appropriated stained preparations it was possible to identify
the human chromosomes detecting their specific banding patterns (Goss and Harris, 1975).
The correlations between the retention of human biochemical markers in hybrids cells with
the retention of identifiable chromosomes permitted to assign 50 human genes to specific
chromosomes. The identifications of the position of genes within the chromosome has been
achieved in the beginning by exploiting translocations that segregate linked markers (Boone
et al., 1972; Gerald et al., 1974), even if this method couldn’t be applied to every genes, but
only to the genes that are localized into a segment of chromosome large enough to be
identified in a translocations.
Recently a bovine/hamster hybrid cell panel consisting of 30 independent hybrids was
developed to locate genes (Itoh et al., 2003). The characterization of the panel by typing 279
microsatellites markers revealed the presence of all bovine chromosomes in either entire or
fragmented form. The panel was also characterized with EST and 1400 EST were assigned to
specific chromosomes, thus making this panel a useful tool to the regional mapping of new
genes to cattle chromosomes.
The most direct way to localize a genomic segment on a chromosome is to use locus specific-
probes in the in situ hybridizations, that is able to visualize the target within a particular
banding patterns along chromosomes. The recent development of the in situ hybridization is
the fluorescent in situ hybridization, or FISH, able to analyze the position of more than one
probe on chromosomes at the same time, by labeling different probes whit different
fluorescent molecules and the FIBER-FISH, which gives the possibility to hybridize specific
probes directly on a single starnd of DNA attached to a solid support.
22
However the resulting cytogenetic map has lower degree of resolution compared to other
kind of physical map constructed with different techniques, for example analyzing by
restriction-based fingerprinting large fragments of DNA, even of megabase, contained in
BAC clone library.
I-VI BAC-based physical maps
A BAC (Bacterial artificial chromosome) clone is a bacterial clone that contain one artificial
chromosome made fusing casually large fragments of the genome of interest with two arms of
the bacterial chromosome, that have to contain the centromer and the telomer, or only the
telomer, and which carries a marker of selection on each arms.
The wide use of BAC libraries is due to the clone fidelity, to a low level of cloning artifacts,
to the easy of separate the BAC DNA from the host’s DNA, to the fact that often individual
clones contain complete genes embedded in their genomic environment and then the clones
can be used for functional studies in cell lines or transgenic applications.
A bovine artificial chromosome BAC library of 105984 clones was constructed in the vector
pBeloBAC11 and organized in 3-dimensional pools in 2001 at the INRA of Jouy-en-Josas
(France), (Eggen A. et al., 2001). The average insert size was estimated 120 kb after isolation
by field inversion gel electrophoresis (FIGE) of digested fragments of 388 clones. Assuming
that the bovine genome contains 3x10⁹ bp the total library corresponded to a four genome
coverage. The library was also screened by PCR with 164 microsatellite markers to verify the
homogeneous distribution of fragments from all the genome in the clones. FISH was
performed for over 50 BAC clones and no one was found chimeric. This bovine BAC library
contributed to increase the genome coverage of the cattle of the already existing bovine BAC
libraries of 2.7 (Buitkamp et al., 2001), 6 (Cai et al., 1995), 10 (Warren et al., 2000), and 5
(Zhu et al., 1999) genome equivalents, bringing the total coverage of the bovine genome
represented in BAC libraries to 28.
An analogous bovine BAC library was constructed and called the ‘CHORI 240 cattle BAC
library’ (http://www.chori.org/bacpac). This library contains approximately 200000 clones
and was created by cloning partially digested MboI genomic DNA isolated from a Hereford
bull into the BamHI cloning site of the pTARBAC1.3 vector.
Currently BAC libraries have been extensively used to build numerous chromosome specific
or whole genome sequence physical maps by BAC fingerprintings and BAC-end sequencing.
Whole genome maps have been constructed for a number of organisms including rat, cow,
zebrafish, sorghum, maize and tomato (see www.genome.clemson.edu/fpc and
www.bcgsc.edu for links to the corresponding web sites).
A first generation bovine BAC-based physical maps was constructed in 2004 at the INRA of
Jouy-en-Josas (Schibler L. et all., 2004). This map was assembled analyzing the totality of the
23
clones of the bovine BAC library of the INRA and part of the CHORI-240 BAC library
(26500 clones) by fluorescent double digestion fingerprinting and sequence tagged site (STS)
screening.
DNA preparation was performed using a modified alkaline lyses procedure for each clone.
300-400 ng of BAC DNA was submitted to a double digestion (HindIII and HaeIII), which on
average generates about 40 bands of 55 to 750 bp, and simultaneously to a dye labeling. The
restriction profiles of the samples was analyzed by capillary electrophoresis using a 1000
automated 96 capillary DNA sequencer. The runs were analyzed with the Genetic Profiler
software developed to perform the genotyping analyses on the MEGABACE. The map was
constructed starting from an initial stringent build and using an incremental process, which
consisted in joining together assembled and ordered part of DNA sequence, contigs, based on
end-end comparison. The map was validate and the contigs were anchored using the PCR
screening information for a total of 1303 markers (451 microsatellites, 471 genes, 127 EST,
254 BAC ends). The final map, which consisted of 6615 contigs assembled from 100923
clones selected from the two libraries, was considered a valuable tool for genomics research
in ruminants, including targeted marker production, positional cloning or targeted sequencing
of region of specific interest. This map provided also a good framework to initiate a strategy
similar to that of Gregory et al. (Gregory et al., 2002) to establish high-resolution sintenies
among ruminant, human and mouse genomes.
I-VII Comparative maps
An important step for efficiently sequencing a new mammalian genome is to have a high-
quality, comparatively anchored physical map.
Fujiyama et al. (2002) produced a comparative clone-based map of the human and
chimpanzee genomes using paired chimpanzee BAC-end sequences (BESs) aligned by
BLAST with the human genome sequences and founding that approximately 98% of
chimpanzee BESs has BLAST hits in the human genome that identify putative orthologs.
Gregory et al. (2002) produced a detailed comparative physical map of the mouse and human
genomes by combining BAC-end sequencing with a whole-genome BAC contig created by
BAC fingerprinting, revealing remarkable colinearity of the mouse and human genome.
Larkin et al. (2003) used a large-scale BAC-end sequencing strategy to built the first
sequence-based physical and multi-species comparative maps of cattle. They sequenced at
both ends a total of 40224 bovine BAC inserts of the CHORI-240 cattle BAC library and
generated approximately 60500 high-quality cattle BESs whit an average read length of 515
bp. These BESs comprise more than 14 Mbp of non repetitive cattle DNA, thus providing a
resource for anchoring cattle genomic sequences to the human and mouse genomes. The non
repetitive cattle BESs were then tested for similarity to human and mouse genome sequence
(NCBI Build 30) using BLASTN, revealing 29,4% and 10,1% significant hits, respectively
24
and howing that random cattle BESs had 3.3-fold higher similarity hits to the human genome
than the mouse genome. More than 60% of all cattle BES hits in both the human and mouse
genome were shown to be located in within known genes, including coding and non coding
regions.
I-VIII Radiation hybrid maps
In order to construct a high-resolution physical map for each specific chromosome, basic tool
to assist the final high-quality sequence assembly of the genome, and comparative mapping
information from maps of the annotated human and mouse genome can be utilized efficiently.
The location of bovine loci that are homologous of human genes may be predicted from the
current knowledge about the conservation of synteny between genomes, but comparative
mapping can sometimes produce errors, because it is based on the colinearity between two
different genomes even if some genomic regions are not colinear, thus the position of a locus
has to be actually proven by direct mapping on genome.
Radiation hybrid (RH) mapping has been shown to be a powerful tool to integrate
comparative genome data with information from existing genetic and physical maps to
generate high-resolution maps (Itoh et al., 2005).
The technology for generating physical maps using irradiation and fusion gene transfer was
first developed more than 20 years ago by Goss and Harris (1975). This technology was
employed in an isolating mapping experiment of human X chromosome genes ten years later
by Williard et al.(1985), but it was not systematically used as a human gene mapping
instrument until the work of Cox et al. (1990) of construction of a high-resolution map of the
human chromosome 21. This map was constructed using hybrids generated by irradiation
fusion gene transfer between a donor somatic cell hybrid containing a single human
chromosome and the recipient rodent cell line. Mapping the entire human genome with this
approach was impractical because it required a panel of 100-200 hybrids for each
chromosome and a screening of over 4000 hybrids to generate a genomic map. For this reason
Walter et al. (1994) reverted to the original method of whole genome radiation hybrid (WG-
RH) of Goss and Harris, that is the use of diploid cell line like a donor genome at the place of
a single chromosome of interest from a somatic cell hybrid, to demonstrate that a panel of
hybrids of a diploid human cell line with a rodent recipient line could be used to map any
human chromosome. Later Gyapay et al. (1996) and Hudson et al. (1995) demonstrate the
emergence of WG-RHs as stand-alone mapping tools publishing two WG-RH maps of the
human genome opening the way to the RH maps development.
25
I-VIII-a Advantages of RH maps
In contrast to linkage maps, which exploit the frequency of natural recombination between
markers to calculate distances and orders of markers, RH maps are constructed using the
probability of breaks between markers induced by radiation. The retention frequency, that is
the measure of the proportion of donor genome retained in hybrids, of two markers is
proportional to their vicinity in the genome, and inversely correlated to the number of breaks
that could occur between the two markers. The retention pattern of markers for each hybrid is
compared to determine linkage and map distances between markers. These distances are
measured by centiRay, 1 centiRay (N rad) corresponding to a 1% frequency of breakage
between these two markers after exposure to a radiation dose of N rad of X-rays. (McCarthy,
1996).
Radiation hybrids allow a clear determination of a linear order of markers along a
chromosome and radiation hybrid mapping has two major advantages over physical mapping
and genetic mapping: it has much higher resolution and the markers don’t need to be
polymorphic to be included in the map. It is an especially powerful tool for comparative gene
mapping, since chromosomal order can be established for expressed genes that are usually
conserved between species, but often recalcitrant to linkage mapping for lack of allelic
variation. Moreover the radiation hybrids maps bridge the gap between genetic and physical
maps because they offers the possibility to anchor the large DNA insert of the bacterial
artificial chromosome and to identify their orientation.
I-VIII-b Principle of construction of RH panels
To generate RH panels, the donor cell line is irradiated with a lethal dose of X-rays or γ rays,
and fused with the recipient cell line, using either Sendai virus or polyethylene glycol (PEG).
Non-recombinant donor cells die whitin a week of irradiation. The recipient cell line will
contain a selectable marker; the most frequently used are thymidine kinase deficiency (TK-)
or hypoxanthine phosphoribosyl transferase deficiency (HGPRT-). Cells containing either of
this marker will not grow in media containing HAT (hypoxantine, aminopterin, thymidine).
The only post-fusion cells that will grow in HAT medium are recipient cells containing all
their complete genome added with casual portion of donor DNA containing both the wild-
type TK or HPRT gene. The hybrid colonies are expanded for DNA extraction and 96-well
microplates are filled whit the hybrid DNA and the control DNA in order to be screened by
PCR for the retention of genetic markers.
26
I-VIII-c RH panel characteristics and uses
In radiation hybrids the irradiation is utilized both to kill the donor line and to induce
chromosomal breaks producing hybrids with the desired fragments size.
Increasing the irradiation dose from 5 to 25 Krads Siden et al. (1992) observed a 5- to 10-fold
reduction in the size of the fragments, as well as a dramatic reduction in the retention
frequency from 27 to 3%. The optimal radiation doses chosen to construct a panel of radiation
hybrids is dependent upon the intended use of the lines. Low dosages results in decreased
resolution of a chromosome map, while at very high dosages (greater than 10000 rads) no
significant linkage between loci is observed due to extensive fragmentation and loss.
Higher-dosage hybrids which carry small fragments of DNA from a region of biological
interest have been used for constructing recombinant DNA libraries and DNA probes (Florian
et al., 1991).
It is generally believed that breakage along the chromosome, as well as the rejoining of the
broken ends, is a random process (Heddle, 1965). However stabilization of a fragment in the
hybrid requires the rejoining of the fragment with elements needed for replication and stable
mitotic segregations. The preferential retention of the centromere in radiation hybrids has
been observed in a number of radiation hybrids panels (Benham et al., 1989; Goodfellow et
al., 1990; Ceccherini et al. 1992; Abel et al., 1993; etc.).
FISH has been used to determine the number and relative size of human fragments carried in
hybrids. The number of fragments appeared to be independent of the irradiation dose used to
generate the hybrids. FISH was used also as a screening procedure to identify hybrids
containing human DNA, which are subsequently used for marker analyses.
The first issue in the design of a radiation hybrid mapping experiment is the number of
hybrids required to achieve optimal resolution. This problem has been reviewed by Lunetta
and Boehnke (1994). They calculated the resolving power of radiation hybrid panels of
varying sizes as a function of retention frequency, assuming that retention frequency is the
total number of radiation hybrids retaining a given marker divided by the total number of
radiation hybrids tested with the marker. They suggested that a radiation hybrid panels of 90-
100 lines is adequate for most mapping experiments.
The protocol for scoring markers on a radiation hybrids panel is a critical step in building the
map. Markers scored as present (+) or absent (-) are completely informative; thus, false
positives and false negatives bias the map. Ambiguous data can be entered as unknown (?).
Testing of the markers is commonly carried out by visual inspections of ethidium bromide-
stained PCR products from sequence-tagged site (STS) markers. The problem of scoring
many markers across the panel is variation in the relative sensitivity of the marker tested. The
problematic markers are those that show abnormally high or low retention frequency and it is
normal to avoid them as anchor points in initial radiation hybrid map construction.
27
The first phase of analyses is a test of each marker against all the other tested markers, or two-
point analyses. The two-point analyses can be used to estimate distances between markers,
and to identify linkage groups to subject to multipoint analyses, that represent the second
phase of the analyses. Multipoint analyses can define the trial orders of markers inside a
linkage group and between clusters of markers. Normally this analyses is carried out using as
small as possible linkage groups because it is computationally intensive, with N!/2 possible
orders to consider for N markers present in each group. It is efficient to subdivide the
problem into clusters of markers to be ordered within cluster, then order and orient the
ordered clusters (Leach and O’Connell, 1995).
I-VIII-d Software used to construct RH maps
When a marker is tested on the RH panel the pattern of the presence (+) or absence (-) across
the panel defines a cytogenetic placement; those markers with the same pattern of + and – are
localized in the same cytogenetic ‘bin’. Ordering of the bins is carried out either by the
ordering of the known cytogenetic breakpoints, or by minimization of the obligate
breakpoints under the assumption that the majority of the rearranged chromosomes arise from
a single breakage event. These analyses have been carried out in the beginning manually,
nowadays analyses packages are available.
One of the software used to produce RH maps for each chromosome is the Microsoft
Windows versions of ‘Chartagene’ (Schiex et al., 2002), available publicly from
www.inra.fr/bia/T/CarthaGene’.
The other programs available for building radiation hybrid maps are RH map (Vanderstop et
al., 1991), RHMAPPER (Soderlund et al., 1998) and multi-map.
RH, cytogenetic and linkage maps can compared by using Anubis software
(www.roslin.ac.uk/cgi-bin/anubis).
I-VIII-e RH bovine panels and maps
Whole genome-radiation hybrid (WGRH) panels have now been used to create medium to
high resolution chromosomal maps in several species, including human (Gyapay et al., 1996),
mouse (Schmitt et al., 1996; McCarthy et al., 1997), rat (Watanabe et al., 1999), pig (Yerle et
al., 2002), horse (Chowdharhary et al., 2002), chicken (Morrison et al., 2004), zebrafish
(Geisler et al., 1999), dog (Priat et al., 1998) and cattle (Womack et al., 1997; Rexroad et al.,
2000; Williams et al., 2002; Itoh et al., 2005; Band et al., 2001).
Four whole genome radiation hybrid panels available for cattle have been used to construct
RH maps: the Womack-5000 rad panel of 90 RH clones (Womack et al., 1997), the Womack-
28
12000 rad panel of 180 RH clones (Rexroad et al.,1999); the TM112-3000 rad panel of 94 RH
clones (William et al., 2002) the SUNbRH 7000 rad panel of 90 RH clones (Itoh et al., 2005).
The first RH bovine panel was developed in 1997 using like a bovine donor cells a normal
diploid fibroblast culture established from an Angus bull, JEW38. The cells were irradiated
with a cobalt 60 source delivering 185 rad/min for a total dose of 5000 rad. The recipient cell
line was the Chinese hamster TK- fibroblast line A23. Six markers were genotyped in all 101
RH lines.
RH panels are generally characterized and anchored to existing genetic maps using
microsatellite markers. The Womack-5000 rad panel was screened with six markers spanning
each of the linkage maps of bovine chromosome 1, 13 and 19 to create the first whole-
genome-RH radiation bovine hybrid map. Later the same RH panel was used to create a
cattle-human whole-genome comparative map (Band et al., 2000).
Williams et al. (2002) constructed and characterized a 3000-rad RH panel in order to create an
outline bovine RH map. This map was developed testing on the RH panel and incorporating
in the map the majority of markers available on published bovine linkage maps.
This RH panel was constructed using like donor cell line a primary bovine fibroblast cell line
established from a male Holstein calf by explants culture. Cells were exposed to a 3000 rads
of X-rays and fused with the HGPRT-deficient Chinese hamster cell line, Wg3H (Goss and
Harris, 1975). 224 cell lines were established and screened with 33 microsatellite markers. A
subset of 100 hybrids whit higher average retention frequency was selected and a final panel
of 94 hybrids was produced, whose DNA is publicly available for purchase from the Res Gen
Invitrogen Corp (cat no. RH10, Huntsville, Ala., USA).
In order to link the 3000-rad RH panel to the genetic (Barendse et al., 1997; Kappes et al.,
1997, http://www.marc.usda.gov/genome/genome.html, www.cgd.csiro.au) and physical
maps that were published for the cattle till that moment, a total of 1238 markers were typed
by PCR on the RH panel (http://www.roslin.ac.uk/radhyb/), of which 1148 are microsatellite
loci and 90 are genes or markers within genes. Between them 64 could not be placed, so that
1174 markers were included on the RH-maps of 29 autosomes and the two sex chromosomes.
In most cases the order of markers was consistent between the RH maps, the published
linkage maps, the current RH chromosomes maps (chr1: Rexroad et al., 1999; chr 15:
Amarante et al., 2000; chr 19: Yang et al., 1998; chr 23: Band et al., 1998) built by using the
Womack panel, and the low-density whole genome maps of Band et al. (2000).
Itoh et al. (2005) used the whole genome 7000-rad radiation hybrid (RH) panel, SUNbRH
(7000-rad), to build a high-resolution RH map. The Shirakawa-USDA linkage map served as
a scaffold to construct a map of 3216 microsatellites on which 2377 ESTs were ordered. The
resulting RH map provided essentially complete coverage across the genome, with 1 cR7000
corresponding to 114 kb.
29
I-VIII-f Integration of bovine RH map data in the construction of comparative maps
RH maps are considered a useful resource for creating comparative maps between bovine and
human chromosomes through the alignment of the loci derived from coding sequences
(Amaral et al., 2002; Goldammer et al., 2002; Gautier M et al., 2002; Gautier M et al., 2003;
Larkin et al., 2003; Everts-van der Wind et al., 2004; Everts-van der Wind et al., 2005).
Larkin DM et al. used the cattle-hamster 5000-rad RH panel of Womack et al.(1997) to
confirm in silico predictions of cattle chromosome positions of bovine BAC end sequences
(BESs). 60547 BESs were previously anchored to the human and mouse genome by BLASTN
search, like we have already described, thus the cattle chromosome locations had been
predicted for the cattle BESs with significant BLAST hits in the human genome using the
COMPASS Perl scripts software (COMPASS III), producing a virtual map of BESs on the
cattle chromosomes.
The COMPASS strategy (comparative mapping by annotating and sequence similarity)
permits the predictions of chromosome map location based upon sequence similarity of
orthologous genes, if comparative map information is available for two species (Band et al.,
2000; Rebeiz and Lewin, 2000).
In that case the chromosome location of BESs was predicted using data from the first-
generation cattle-human comparative RH map (Band et al., 2000). Furthermore they
confirmed in silico predictions of cattle chromosome location for a total of 109 BESs having a
single high-confidence human hit on HSA11. Oligonucleotides able to discriminate cattle
from rodent sequences were designed for these BESs and 89% of them gave distinct PCR
product after screening of the RH panel. 84 BESs were mapped on BTA15 or BTA29 after
two-point linkage and multipoint map analyses, carried out with RHMAPPER 1.22 (Slonim et
al., 1997) software. Thus the high degree of accuracy (approximately 86%) of BLAST-
COMPASS approach was demonstrated and a cattle-human comparative map with greater
than 1-Mbp resolution was created, 84 BAC ends were added to the existing cattle RH map.
Recently Everts-van der Wind et al. (2005) used the same approach, to construct a high-
resolution whole-genome cattle-human comparative map and to add new markers (cattle
BESs) to the current high resolution cattle 5000-rad RH map (Band et al., 2000; Everts-van
der Wind et al., 2004) collectively known as the Illinois-Texas 5000-rad radiation hybrid
panel (IL-TX RH 5000).
They screened by PCR the RH panel of Womach et al. with BES from the CHORI-240 BAC
library selected by BLAST for having a single significant match in the human genome, distant
one from one other 1 Mbp in the human genome, and having preferentially an orthologous hit
in the mouse genome. Approximately 3000 cattle bacterial artificial chromosome end
sequences were added to the previous RH map, increasing the number of markers 4 time. The
number of comparative points in the human genome was increased 5-fold.
30
An important advance made possible by mapping cattle BESs is that the RH map could be
anchored directly to the whole-genome BAC fingerprinting contig. Comparisons of BES
order on the RH maps and whitin the fingerprinting contigs is used to identify inconsistency
in the maps and markers or clones that are presumably ‘out of place’ on the basis of their
cattle –human comparative map location. This comparison will ultimately be important in
selecting the correct minimum tiling path for the BAC-skim sequencing and correctly
assembling the cattle genome sequence. Moreover also the additional mapping information
coming from the integration of RH and linkage map would greatly improve the bovine
genome sequence assembly (Snelling et al:, 2004; Weikard et al., 2006).
I-VIII-g Integration of bovine RH map data with genetic linkage maps
Linkage maps have been important in identifying chromosomal regions influencing
economically important traits in cattle (Casas et al., 2001; MacNeil et al., 2001; Li et al.,
2002), but because the lack of recombination between closely linked markers limits resolution,
linkage maps are of limited value for ordering closely linked markers and identifying genes
underlying quantitative trait loci. The radiation hybrid mapping provides higher resolution for
ordering close markers, but high breakage frequency RH data are less reliable than linkage
data for ordering widely separated groups of markers (Schiex et al., 2001).
Integrating linkage and RH data into a single map not only will refine marker order to
facilitate genomic sequencing, but will also increase the efficiency of identifying genes
associated with QTL.
Integration of linkage and RH maps has been reported for a number of species (NIH News
Release, http://www.genome.gov/page.cfm?pageID=10506668), like the dog (Breen et al.,
2001), the rat (Steen et al., 1999), the feline (Sun et al., 2001) and individual bovine
chromosomes (Amarante et al., 2000; Rexroad et al., 1999; Drogemuller et al., 2002). The
general approach to integrated mapping has been to score several markers from linkage maps
on the RH panel, then align the independent maps via common markers.
While Nadkarni (1998) and White et al. (1999) described procedures to synthesize
information from multiple independent analyses into a single merged map, Snelling et al.,
(2004), differently, used directly data from independent analyses to contribute to the
construction of two maps and then merged independent data sets with common markers to
built a single integrated map.
Agarwala et al. (2000) developed procedures for integrating RH maps, where markers
common to independent RH panels contributed to the solution of a comprehensive RH map,
while Schiex et al. (2001) developed and released CarthaGene software (CarthaGene home
page, http://www.inra.fr/bia/T/CarthaGene) to merge and solve integrated maps representing
multiple linkage and RH data sets.
31
The bovine chromosome (BTA) 15 was considered interesting and was chosen from Snelling
WM et al. (2004) to study the integration of linkage and RH data and to compare the bovine
and human genome because a QTL for meat tenderness was reported to be present on this
chromosome (Keele et al., 1999; Rexroad et al., 2001) and because comparative mapping
indicated that alternative segments of human chromosome (HAS) 11 are conserved on BTA
15 and 29 (Amarante et al., 2000; Rexroad et al., 2001; Gautier et al., 2002). They used the
second-generation linkage map of bovine genome (Kapper et al., 1997), and the radiation
hybrid data for 109 markers from the ComRad project radiation hybrid panel (94 cells lines,
Williams et al., 2002; Gautier et al., 2002) to construct an integrated BTA15 map representing
145 markers, whose 42 shared by both data sets, 36 unique to the linkage data and 67 unique
to RH data.
Another study that aimed to the construction of a high-resolution map of a specific
chromosome was carried out from Weikard et al. (2006) on the bovine chromosome 6 (BTA 6)
because a number of different QTL for various phenotypic traits, including milk production,
functional, and conformation traits in dairy cattle as well as growth and body composition
traits in meat cattle, have been mapped consistently in the middle region of this chromosome
(Bovine QTL Viewer at texas A&M University 2005, http://bovineqtl.tamu.edu/ ; Reprogen
QTL Mapof Dairy Cattle Traits 2005 http://www.vetsci.usyd.edu.au/reprogen/QTL_Map/ ).
The objective of the study was to construct a high-resolution ‘gene rich’ RH map for the
target chromosomal region of BTA6 containing candidate genes underlying the QTL for milk
production traits (Cohen-Zinder et al., 2005; Olsen et al., 2005; Schnabel et al., 2005;
Weikerd et al., 2005) in order to dissect the different QTL at the gene-based level.
A total number of 237 loci including 115 genes and expressed sequence tags (ESTs) and
markers from the recently published bovine genetic map (Ihara et al., 2004) were typed on the
cattle-hamster 12000-rad WG-RH panel (Rexroad et al., 2000) and the new RH map, with a
total of 234 loci, displayed a substantial increase in loci density compared to existing physical
BTA6 maps. The average retention frequency of the markers was 15.2% and the average
inter-loci interval on the targeted BTA6 region covered on the RH map was 17.8 cR12000,
corresponding to approximately 300 kb. The order of loci determined in the new map for the
targeted BTA 6 region was generally consistent with that reported on previous published RH
(Itoh et al., 2005, Everts-van der Wind et al., 2004) and linkage map (Ihara et al., 2004;
Snelling et al., 2005).
High-resolution RH maps integrate anonymous markers, ESTs, and genes from currently
available bovine linkage and RH maps as well as high number of comparative anchor loci
derived from the orthologous human chromosomes. Although a number of links to the
currently existing genetic, cytogenetic, and RH maps are possible, a multitude of contigs and
scaffolds of the available bovine genome sequences resources still have to be anchored and/or
oriented on the chromosomes. Connecting animal phenotypes associated with the QTL
anchored on genomic level with putative underlying genes would accelerate the identification
32
of sequence polymorphisms and gene variants and the development of SNP markers for
validation of association substantially.
I-IX International bovine projects
I-IX-a International physical map and Bovine sequencing projects
An international bovine physical map project (www.bcgsc.bc.ca/projects/bovine_mapping,
http://www.livestockgenomics.csiro.au/cattle.shtml) was proposed to analyze single digest
fingerprintings obtained from 280000 BAC clones to identify new fusions between contigs
from the two BAC-based physical maps derived from the BAC library of the INRA (Schibler
et al., 2004) and the CHORI-240 BAC library. Additional mapping information can facilitate
the ordering of fingerprinting contigs for the construction of physical BAC maps covering
whole chromosomes and ultimately provides a valuable starting point for whole genome
sequencing projects, like it happened for the human (Cao et al., 1999), for the mouse (Gregory
et al., 2002) and in Drosophila (Hoskins et al., 2000).
The ultimate map for a species is the correctly assembled genome sequence.
The U.S. National Institute of Health (NIH) has given high priority to the complete genome
sequencing of two Cetartiodactyl species, Bos taurus (cattle) and Sus scrofa domestica (pig;
http//www.genome.gov/page.cfm?pageID=10002154) to make progress the mammalian
comparative genomics because the mammalian order Cetartioactyla comprises a
philogenetically distant clade of eutherian mammals relative to primates, having diverged
from a common ancestor approximately 85 million years ago (Kumar and Hedges, 1998), and,
on the basis of a limited amount of sequence information for orthologous regions in a number
of mammals (Thomas et al., 2002), it is clear that a Cetartiodactyl genome will play an
essential role in informing the human genome for conserved non coding structural and
regulatory elements, for properly annotating exon/intron boundaries, and for the identification
of novel genes.
The bovine genome sequencing project started in 2003 and used a combination of whole
genome shotgun sequencing (WGS) and sample sequencing of a minimum tiling path of BAC
clones spanning the genome. An international Bovine Genome Sequencing Consortium was
established.
In october 2004 the initial draft of the bovine genome sequence using was released (NCBI
Bos taurus Genome Resources 2005-http://www.ncbi.nlm.nih.gov/genome/guide/cow/;
Human Genome Sequencing Center at Baylor College of Medecine_Bovine Genome project
2005-http://www.hgsc.bcm.tmc.edu/projects/bovine).
Preliminary assemblies of the current bovine genome sequence update representing a 6x
coverage were established and announced in October 2005 (Pre! Ensembl (Btau 2.0) in NCBI
Bos taurus genome mapview (build 2.1), (Pre! Ensembl Bos taurus Genome Assembly Site
2005, http://www.ensembl.org/Bos taurus/index.html; NCBI Bos taurus Map Viewer Site
33
2005, http://www.ncbi.nlm.nih.gov/mapview/map_search.cgi?taxid=9913), while recently a
new assemblies (build 3.1) is available
(www.livestockgenomics.csiro.au/perl/gbrowse.cgi/bova3/).
I- IX-b The BovGen project
The BovGen project started the first January 2003 and involved the work of European and
extra-european scientific groups belonging to different institutes (Rosline Institute-UK,
University of Alberta-Canada, INRA-France, Catholic University of Piacenza-Italy, Tuscia
University of Viterbo-Italy, Max Planck Institute for Molecular Biology of Berlin, Germany).
The project had the objectives to develop advanced genomic tools to provide the necessary
infrastructure for researchers to study the molecular and genetic control of important traits in
cattle. Information on these traits could then be applied to the selection of cattle that are best
suited to producing healthier food products of the desired quality in appropriate production
systems.
As the project progressed the international project to sequence the bovine genome made very
rapid progress and an addition priority objective was included in the BovGen project: to work
closely with the international Bovine Genome Sequencing Consortium to aid the assembly of
a high quality bovine sequence.
In details the intended molecular tools to improve or create were:
1) the best characterised bovine expression array available with around 20,000 unique
expressed sequences (ESTs) to give the possibility to examine gene expression profiles in
target cells under various physiological conditions such as, fed or starved, healthy and
diseased as an important route to gene discovery and understanding gene function.
It was planned that the expression arrays should contain a non-redundant , or “unigene” set of
20000 unique ESTs identified in cDNA clones from a bovine brain cDNA library. The non-
redundant set of ESTs was created by the Max Planck Institute starting from the brain as it
was supposed that this organ expresses the greatest diversity of genes in the body and the
20000 ESTs were estimated, from the human sequence, to represent about 30-40% of all
genes in the genome.
2) a high resolution RH bovine map which let the construction of cattle-human comparative
map that could contain not only more than 300 and 400 links between bovine and human
genomes, like the actual RH comparative maps has, but at least more than 3000 links, as the
actual mouse-human comparative map, in order to place cattle genomics information on a par
with the mouse-human comparative information.
3) the construction of long genome spanning BAC contigs. In this project the INRA bovine
BAC library, with 105000 clones, including 20000 clones from the CHORI 240 BAC library,
was available and was characterised with the ESTs sequenced to increase the immediate

34
utility of the BAC library and provide access points to BAC clones for local sequencing
objectives.
4) the ultimate bovine genome sequencing. An international consortium competing with the
international Bovine Genome Sequencing Consortium was established to sequence the bovine
genome. The corner stone to the sequencing work was a whole genome BAC contig. The
characterisation of the BAC library in this project was an important input to the assembly of
the genome wide BAC contig. An additional contribution of the Bovgen Project was the
ordering of Sequence scaffolds on chromosomes, which was achieved using markers
identified within the sequences to align them with the chromosomal maps.
Almost the totality of objectives of the project were achieved and 30 publications and
numerous international conference presentations were produced from this work, that made
significant contribution to the international bovine sequencing project.
35
II-Objective
Several approaches can be used to determine the order of loci on chromosomes and hence
develop maps of the genome. However, all mapping approaches are prone to errors either
arising from technical deficiencies or lack of statistical support to distinguish between
alternative orders of loci. Errors in maps can greatly affect the ability to map and isolate genes
for complex and Mendelian traits (Risch and Giuffra 1992; Feakes et al., 1999; Goring and
Terwilliger 2000), for the identification of QTL.
Inaccuracies in genetic maps can result from genotyping errors, as well as from the use of a
limited number of informative meiosis to generate maps. A higher confidence in genetic-map
order can be obtained by creating maps using a likelihood-ratio criterion of >= 3, as opposed
to using a minimum-recombination map (Morton 1955).
Errors in the order of markers on physical maps can be due to problems with assembly or to
incorrect identification of marker positions. Even when the order of markers is known to be
without error, accurate estimates of recombination fractions will play an important role in
linkage and associations studies (Clerget-Darpoux et al., 1986; Risch and Giuffra, 1992;
Goddard et al., 2000; Collins et al., 2001; Reich et al., 2001).
The accuracy of the genome maps could in principle be improved if information from
different maps (genetic, comparative with other species, RH submitted to different radiation
intensity, physical, sequence assembly) was combined to produce integrated maps.
The publicly available bovine genomic sequence assembly is a draft that contains errors.
Correcting the sequence assembly requires extensive additional mapping information to
improved reliability of ordering of sequence scaffolds on chromosomes.
RH panels represent a powerful tool to construct high-resolution maps.
RH panels are generally characterised using microsatellite markers; however the number of
these markers is often insufficient to join all the linkage groups and assemble complete maps,
particularly for high-resolution panels. The development of additional anonymous markers
can be a time-consuming task, and generally other types of markers, particularly ESTs, are
used to saturate RH maps. These ESTs also serve to link the RH map with maps in other
species (Schlapfer et al., 2002; Weikard et al., 2002).
The objective of the work described is the construction of a bovine high-density RH map, one
of the main aim of the BovGen project, which could be used for the construction of an
integrated map and could contribute to the International Sequencing Project to aid the final
assembly of the bovine genome sequence.
It is discussed the presence of possible errors in the RH map comparing with other recently
published RH and genetic maps (the Illinois-Texas (ILTX) RH map and the MARC 2004
linkage map) aligning the sequence of the corresponding mapped markers. All the bovine
maps were aligned with the 6x bovine assembly (Btau_2.0 sequence) to identify its potential
inconsistencies.
36
III-Material and Methods III-I Sequencing of ESTs
A non-redundant “unigene” set of ESTs was selected by oligo-nucleotide fingerprinting and
clustering of cDNAs from a brain library (Herwig et al., manuscript in preparation). This non-
redundant cDNA clone set contains 23040 bovine clones grouped by sequence assembly of
ESTs into 14989 unique cDNA clusters and singletons. The cDNA clones of the “unigene”
set were amplified in a 384-well microplate format by PCR consisting of an initial denaturing
for 2 min at 95°C, denaturing for 45 sec at 94°C, annealing and elongation for 4 min at 65°C
in 30 cycles. PCR primers were complementary to the insert-flanking vector sequences. The
PCR mix contained 5 pmol of forward and reverse primers (table 1), 0,1 mM dNTP’s, 1,5 M
Betain, 1x PCR buffer, 0,1 mM Cresol Red and 1 U per reaction Taq DNA polymerase. PCR
buffer consisted of 0,5 M KCl, 1% Tween20, 15 mM MgCl2, 350 mM TrisBase, 150 mM
Tris/HCl pH 8,3. PCR fragments were subjected to sequence analyses using BigDye-
terminator chemistry (Applied Biosystems) and a 3700 DNA sequencer (Applied Biosystems).
Average sequence read length was 750 bp. The individual EST sequence data were submitted
to GenBank and are publicly available under accession numbers CO871676-CO897060.
Table1. Sequence of primers used to amplify the cDNA inserts
forward primer GGATCTATCAACAGGAGTCCAAGCTCAGCT reverse primer TCACCATCACGGATCCTATTTAGGTGACAC
III-II Primer design
Maximum sequence information for annotation was achieved by aligning the ESTs data with
available public cattle transcript sequences contained in the TIGR bovine gene index. TIGR
clusters and corresponding ESTs cattle sequences produced were aligned and the resulting
14989 cluster sequences (consensus) were used for the subsequent construction of primers.
Cluster sequences were aligned with bovine genomic sequences and only those showing clear
splicing were used to define the precise exon-intron boundaries for the final primer selection.
The primer design was carried out using dedicated software now in the public domain
(Polyprimers, http://www.unitus.it/SAG/primers.zip). The software uses the nearest-
neighbour method (SantaLucia et al., 1996) to predict the complementarity of primers and
secondary structures (dimers, hairpin etc.) and is able to process large number of sequences in
batches, picking primers in designated regions. To minimize the amplification of hamster
DNA contained within the RH panel cell lines, primer pairs were designed with one primer
within exon, the other within the adjacent intron or non coding sequence. The primer design
was standardized to achieve a maximum of uniformity in their amplification conditions.
37
Primer details are available to the public in the ArkDB database (ArkDB Public database
browser, http://www.thearkdb.org ).
III-III Screening of the Roslin RH panel
2473 marker loci were successfully typed on the 94 cell lines of a 3000-rad bovine/hamster
RH panel as described by Williams et al. (Williams et al., 2002). Vectors of 262 AFLP
markers (Gorni C et al., 2004) were added to the dataset.
III-IV RH data analyses
RH vectors were assigned to chromosomes by analysing 2-pt linkage with mapped loci (Gorni
et al., 2004) using RH mapper (Slonim et al., 1997). Multipoint maps were constructed using
the default algorithm of the Carthagene software (Schiex and Gaspin, 1997). The initial multi-
point map was improved by an iterative process of inspection of marker loci and removal and
alternative addition of badly linked or disrupting loci. This process resulted in the removal of
122 loci that could not be reliably fitted into the chromosome maps with highest probability.
The best maps generated by this process were compared to the ComRad RH-map (Gorni et al.,
2004) and the MARC 2004 linkage map (Ihara et al., 2004) and regions showing
discrepancies were examined in detail to identify the presence of problem markers. Marker
positions on the maps of each chromosomes are available from the ArkDB database at
http://www.thearkdb.org.
III-V Mapping of marker associated sequences against the bovine sequence assembly
ESTs sequences used to design the primers for mapped loci were aligned with the assembled
6x bovine sequence assembly (Btau_2.0) using BLAST (Altschul et al.,1990) and Spidey
(Wheelan et al., 2001). To filter out incorrect alignments the BLAST e-value was set to a
maximum of 1e-20 and minimum percent identity to 90%. In addition, the relative length of
the BLAST hit (i.e. coverage, or length of the hit divided by the length of the query sequence)
had to be at least 80%. Where ambiguous alignments were observed higher stringency filters
were applied (sequence similarity higher than 97.5% and coverage higher than 90%).
38
III-VI Diagrammatic representation of chromosomal maps
Visual representation of map alignments for figures 2-5 was achieved using cMap (GMOD
Generic Software Components for Model Organism Database, http://www.gmod.org/cmap/).
For figure 1, a custom ruby script was used in combination with the bioruby toolkit (BioRuby
http://www.bioruby.org).
39
IV-Results
IV-I Radiation hybrid map A total of 2735 markers were added to those, 1231 markers, on the first-generation whole-
genome RH maps (Williams et al., 2002), of which 2473 are newly mapped loci and 262 are
previously reported AFLP markers (Gorni et al., 2004), giving a total of 3966 markers, of
which 1999 are within genes, 1072 are microsatellite loci, 262 are AFLP markers, 376 are
BAC end sequences and 257 are from ESTs sequences that do not show convincing similarity
to the annotated bovine sequence (table 1). The RH maps for the 30 bovine chromosomes
constructed from this data can be viewed and information can be downloaded from the
ArkDB database (http:// www.thearkdb.org ).
The total length of the RH map, including all bovine autosomes and the X chromosome is 760
Rays (R). The map of BTA 28 is the shortest one, 1141 cR, and the longest one is that of
BTA7, 4408 cR. The average marker interval over the whole genome is 19 cR ranging
between 12 cR (BTA29) to 29 cR (BTA20). Distance comparisons between common markers
on the RH map, MARC linkage map and the bovine sequence suggests, on average, that 1 cR
on the BovGen RH map is equivalent to 0,04 cM and 23 Kbp respectively, although this
varies considerably across the genome.
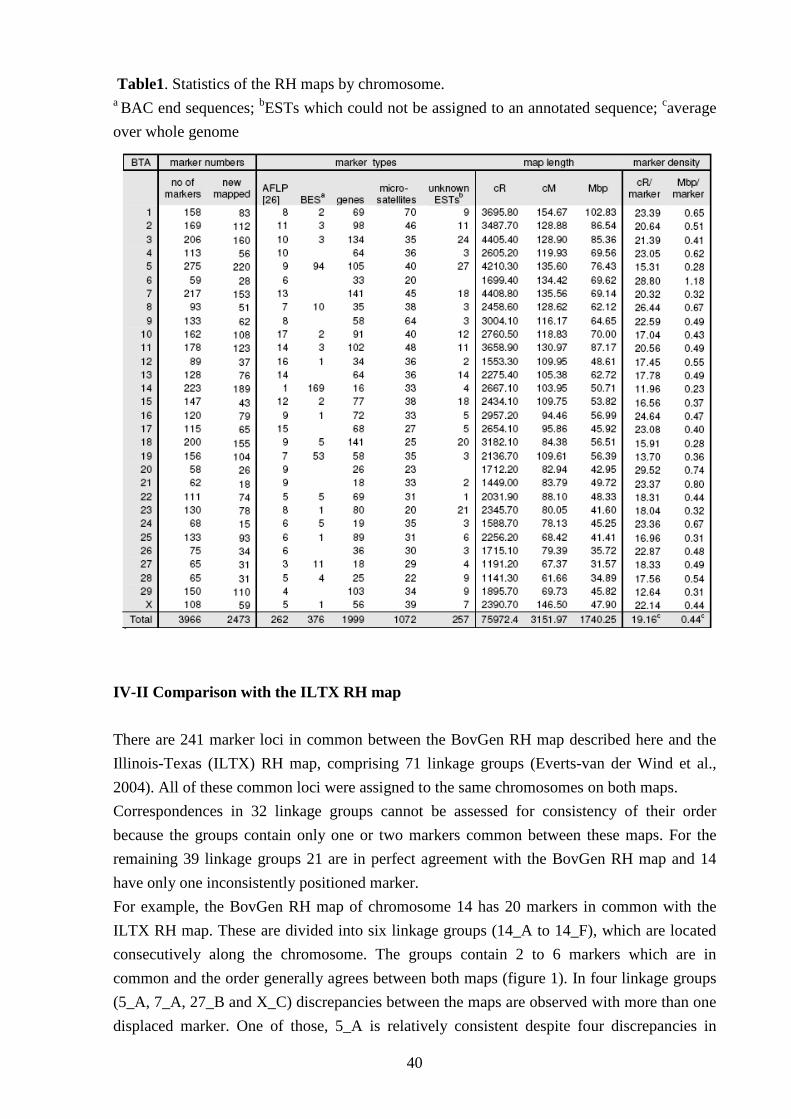
40
Table1. Statistics of the RH maps by chromosome. a BAC end sequences; bESTs which could not be assigned to an annotated sequence; caverage
over whole genome
IV-II Comparison with the ILTX RH map
There are 241 marker loci in common between the BovGen RH map described here and the
Illinois-Texas (ILTX) RH map, comprising 71 linkage groups (Everts-van der Wind et al.,
2004). All of these common loci were assigned to the same chromosomes on both maps.
Correspondences in 32 linkage groups cannot be assessed for consistency of their order
because the groups contain only one or two markers common between these maps. For the
remaining 39 linkage groups 21 are in perfect agreement with the BovGen RH map and 14
have only one inconsistently positioned marker.
For example, the BovGen RH map of chromosome 14 has 20 markers in common with the
ILTX RH map. These are divided into six linkage groups (14_A to 14_F), which are located
consecutively along the chromosome. The groups contain 2 to 6 markers which are in
common and the order generally agrees between both maps (figure 1). In four linkage groups
(5_A, 7_A, 27_B and X_C) discrepancies between the maps are observed with more than one
displaced marker. One of those, 5_A is relatively consistent despite four discrepancies in
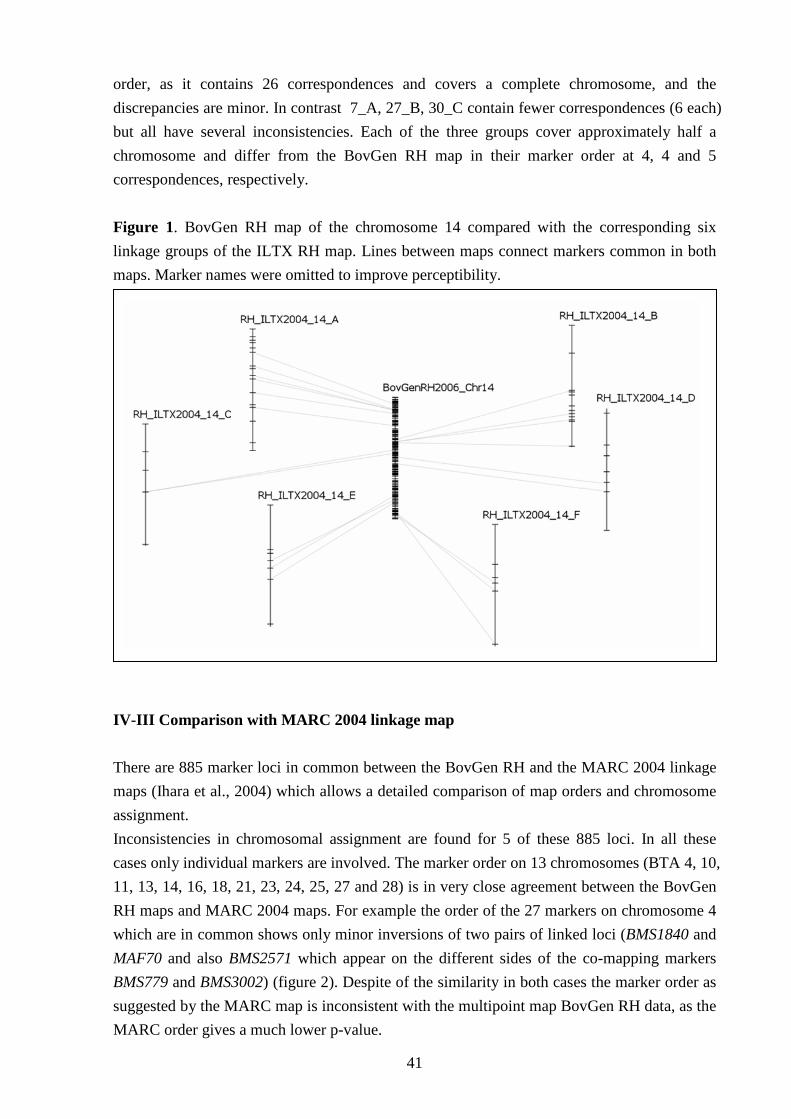
41
order, as it contains 26 correspondences and covers a complete chromosome, and the
discrepancies are minor. In contrast 7_A, 27_B, 30_C contain fewer correspondences (6 each)
but all have several inconsistencies. Each of the three groups cover approximately half a
chromosome and differ from the BovGen RH map in their marker order at 4, 4 and 5
correspondences, respectively.
Figure 1. BovGen RH map of the chromosome 14 compared with the corresponding six
linkage groups of the ILTX RH map. Lines between maps connect markers common in both
maps. Marker names were omitted to improve perceptibility.
IV-III Comparison with MARC 2004 linkage map
There are 885 marker loci in common between the BovGen RH and the MARC 2004 linkage
maps (Ihara et al., 2004) which allows a detailed comparison of map orders and chromosome
assignment.
Inconsistencies in chromosomal assignment are found for 5 of these 885 loci. In all these
cases only individual markers are involved. The marker order on 13 chromosomes (BTA 4, 10,
11, 13, 14, 16, 18, 21, 23, 24, 25, 27 and 28) is in very close agreement between the BovGen
RH maps and MARC 2004 maps. For example the order of the 27 markers on chromosome 4
which are in common shows only minor inversions of two pairs of linked loci (BMS1840 and
MAF70 and also BMS2571 which appear on the different sides of the co-mapping markers
BMS779 and BMS3002) (figure 2). Despite of the similarity in both cases the marker order as
suggested by the MARC map is inconsistent with the multipoint map BovGen RH data, as the
MARC order gives a much lower p-value.
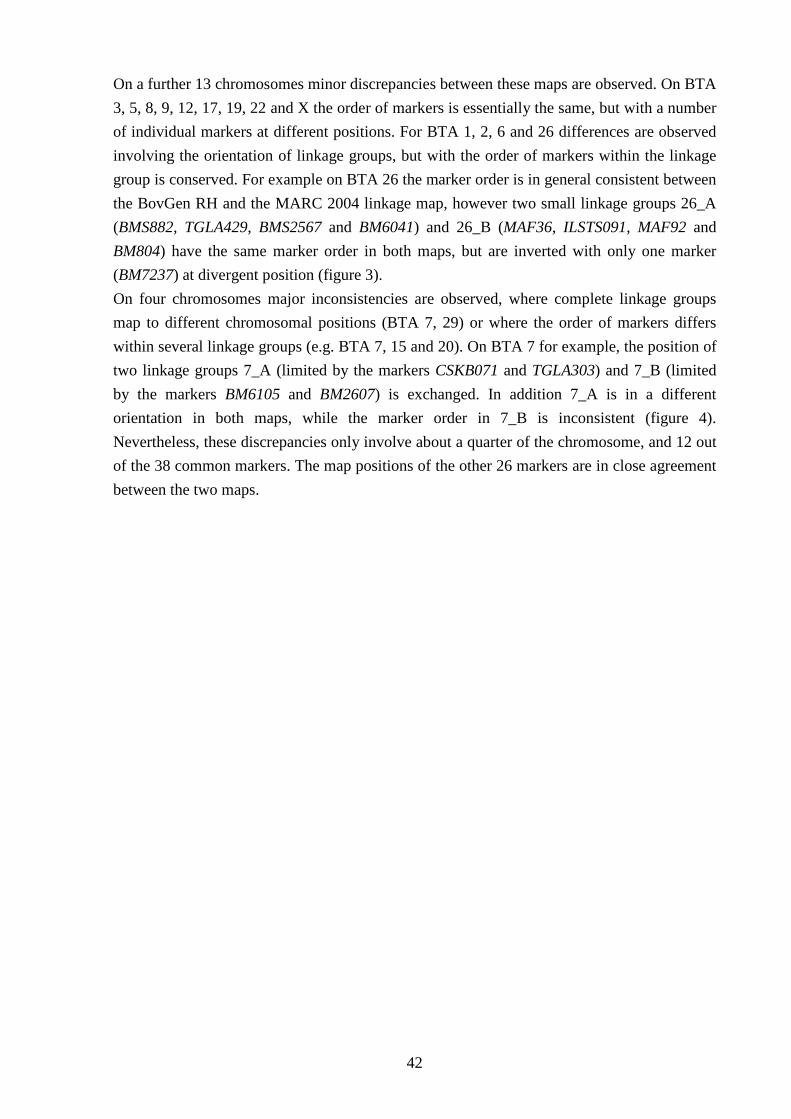
42
On a further 13 chromosomes minor discrepancies between these maps are observed. On BTA
3, 5, 8, 9, 12, 17, 19, 22 and X the order of markers is essentially the same, but with a number
of individual markers at different positions. For BTA 1, 2, 6 and 26 differences are observed
involving the orientation of linkage groups, but with the order of markers within the linkage
group is conserved. For example on BTA 26 the marker order is in general consistent between
the BovGen RH and the MARC 2004 linkage map, however two small linkage groups 26_A
(BMS882, TGLA429, BMS2567 and BM6041) and 26_B (MAF36, ILSTS091, MAF92 and
BM804) have the same marker order in both maps, but are inverted with only one marker
(BM7237) at divergent position (figure 3).
On four chromosomes major inconsistencies are observed, where complete linkage groups
map to different chromosomal positions (BTA 7, 29) or where the order of markers differs
within several linkage groups (e.g. BTA 7, 15 and 20). On BTA 7 for example, the position of
two linkage groups 7_A (limited by the markers CSKB071 and TGLA303) and 7_B (limited
by the markers BM6105 and BM2607) is exchanged. In addition 7_A is in a different
orientation in both maps, while the marker order in 7_B is inconsistent (figure 4).
Nevertheless, these discrepancies only involve about a quarter of the chromosome, and 12 out
of the 38 common markers. The map positions of the other 26 markers are in close agreement
between the two maps.
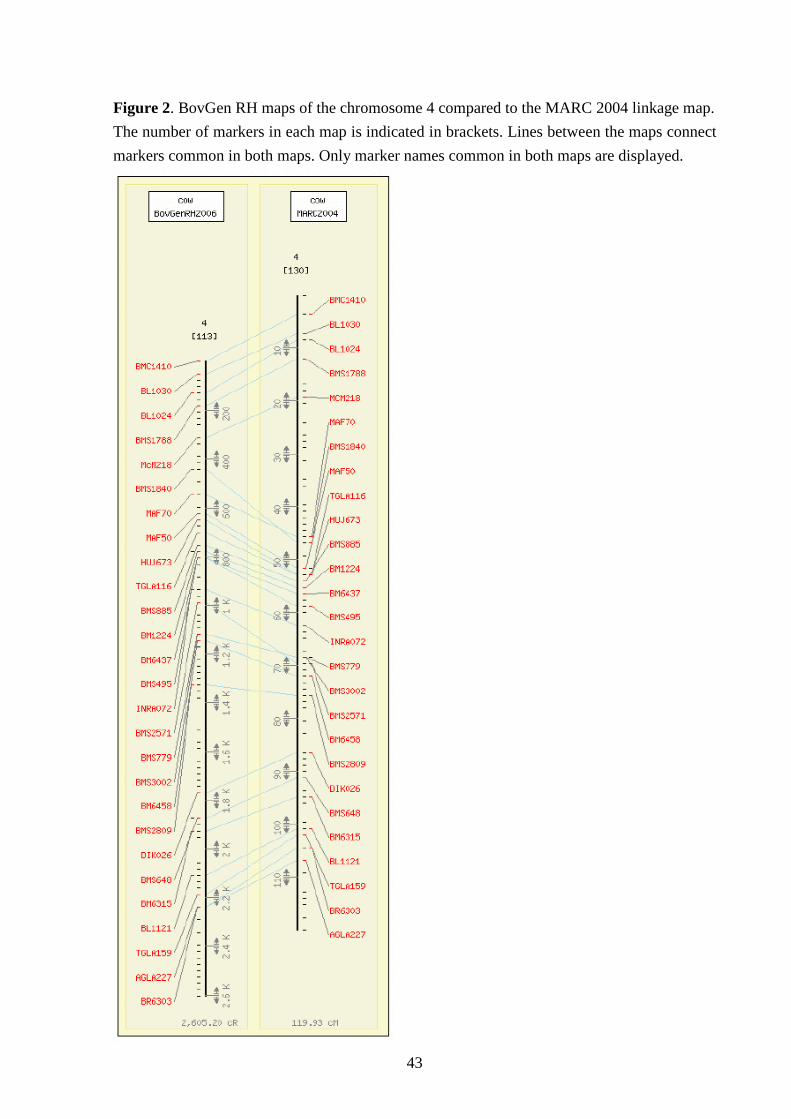
43
Figure 2. BovGen RH maps of the chromosome 4 compared to the MARC 2004 linkage map.
The number of markers in each map is indicated in brackets. Lines between the maps connect
markers common in both maps. Only marker names common in both maps are displayed.
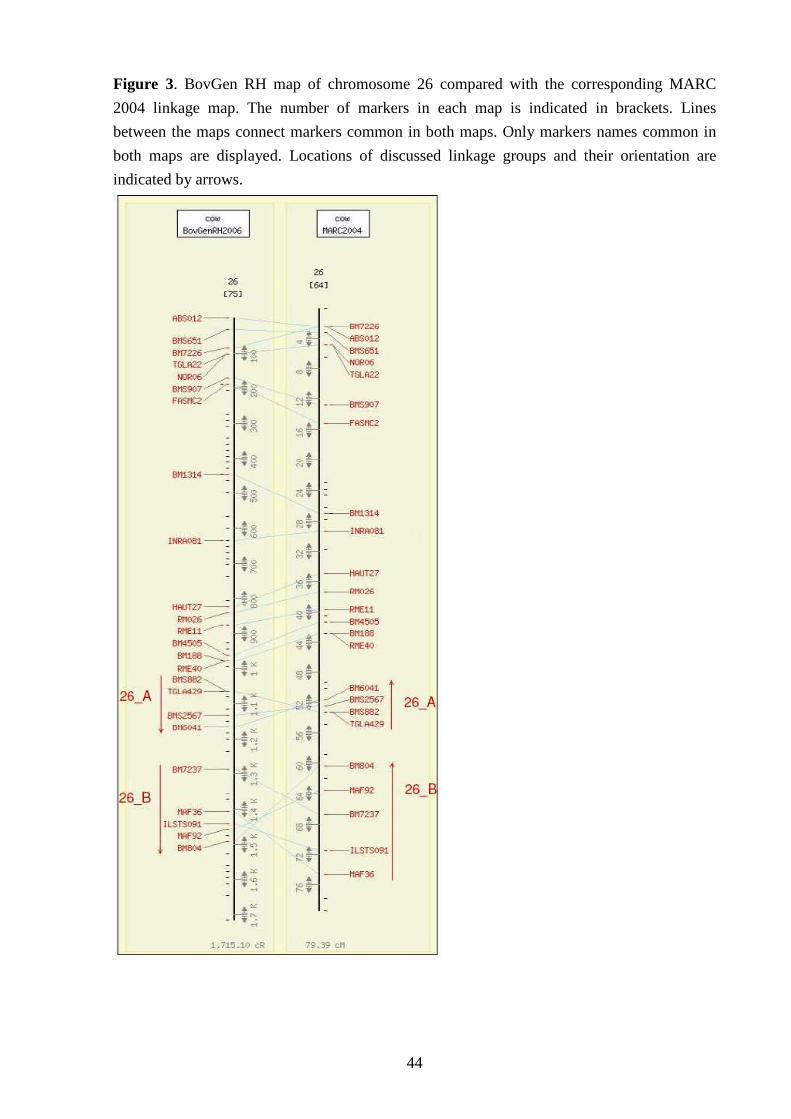
44
Figure 3. BovGen RH map of chromosome 26 compared with the corresponding MARC
2004 linkage map. The number of markers in each map is indicated in brackets. Lines
between the maps connect markers common in both maps. Only markers names common in
both maps are displayed. Locations of discussed linkage groups and their orientation are
indicated by arrows.
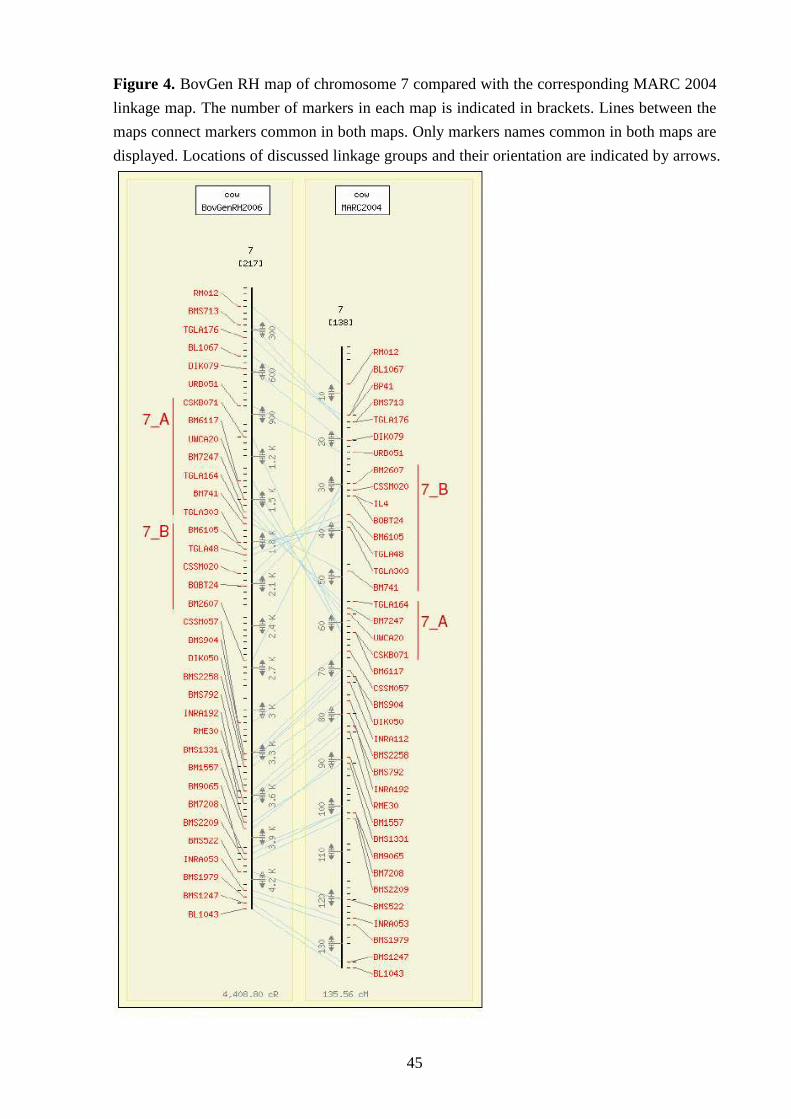
45
Figure 4. BovGen RH map of chromosome 7 compared with the corresponding MARC 2004
linkage map. The number of markers in each map is indicated in brackets. Lines between the
maps connect markers common in both maps. Only markers names common in both maps are
displayed. Locations of discussed linkage groups and their orientation are indicated by arrows.
46
IV-IV Comparison with the 6x bovine assembly
Of the 3966 markers successfully included in the RH map, 2898 could be unequivocally
assigned to a position in Btau_2.0 bovine sequence, 2767 were assigned to the same
chromosome, but 131 mapped on different chromosomes between the BovGen RH map and
the sequence. On seven chromosomes inconsistent assignments involving groups with three or
more markers were observed (table 2).
On most chromosomes there were many differences between the map order and the sequence:
only on two chromosomes, BTA 9 and 14, the discrepancies were minor, involving a few
individual markers in a different order. On most chromosomes large discrepancies involving
complete linkage groups and/or large numbers of individual loci were seen particularly on
chromosomes 5, 7, 16, 22, 25 and 29. On chromosome 16, six linkage groups are located at
different position on the sequence compared with the BovGen RH maps (figure 5).
When markers that were at inconsistent positions between the BovGen RH and either the
ILTX or MARC linkage maps were removed, 217 common markers with the ILTX RH map
and 771 common markers with the MARC2004 linkage map remained where the available
mapping data were in agreement. The mapping order of these markers was then compared
with the order in the bovine sequence. Using only the markers that are consistent between the
BovGen and other RH or linkage maps, the comparison with the Btau_2.0 sequence reveals
considerable discrepancies across the whole genome. On chromosome 5 six markers which
could be assigned to positions in the sequence assembly appeared with inconsistent positions
(BP1, AGLA293, ILSTS022, CSSM022, ILSTS066). The remaining markers are in close
agreement between the three maps and reveal significant inconsistencies with the sequence
assembly (figure 6).
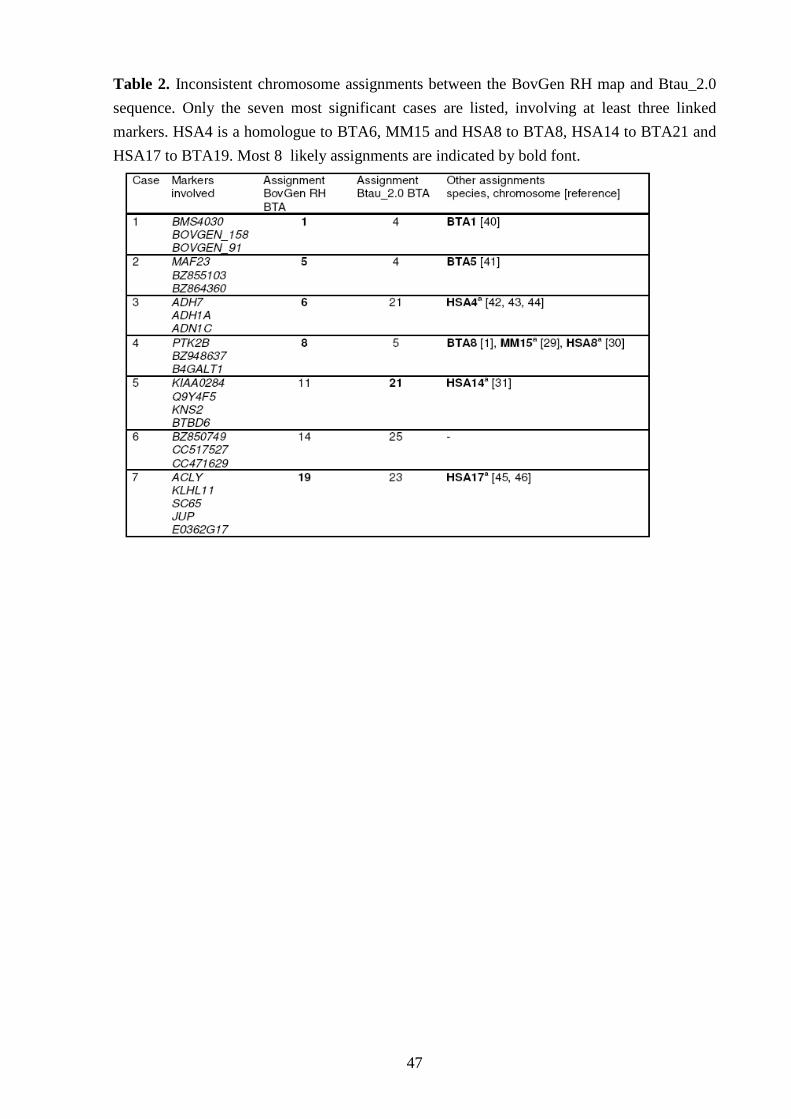
47
Table 2. Inconsistent chromosome assignments between the BovGen RH map and Btau_2.0
sequence. Only the seven most significant cases are listed, involving at least three linked
markers. HSA4 is a homologue to BTA6, MM15 and HSA8 to BTA8, HSA14 to BTA21 and
HSA17 to BTA19. Most 8 likely assignments are indicated by bold font.
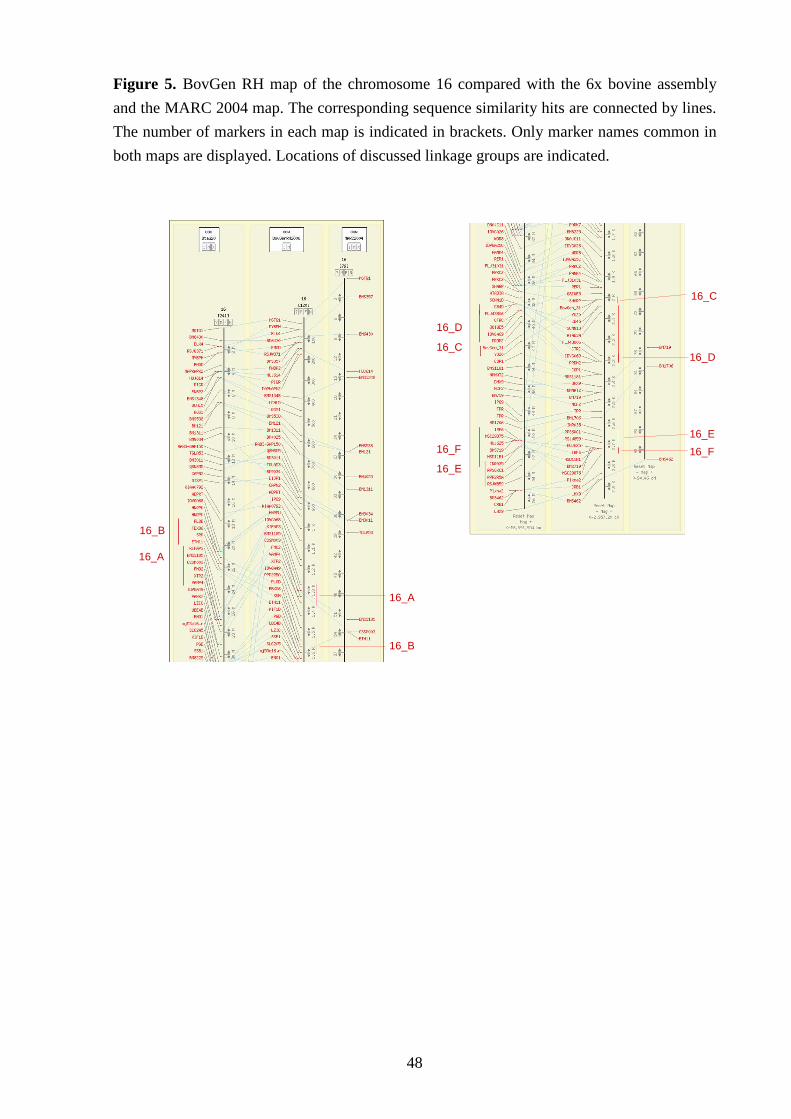
48
Figure 5. BovGen RH map of the chromosome 16 compared with the 6x bovine assembly
and the MARC 2004 map. The corresponding sequence similarity hits are connected by lines.
The number of markers in each map is indicated in brackets. Only marker names common in
both maps are displayed. Locations of discussed linkage groups are indicated.
16_B
16_A
16_D
16_C
16_F
16_E
16_A
16_B
16_D
16_C
16_F
16_E
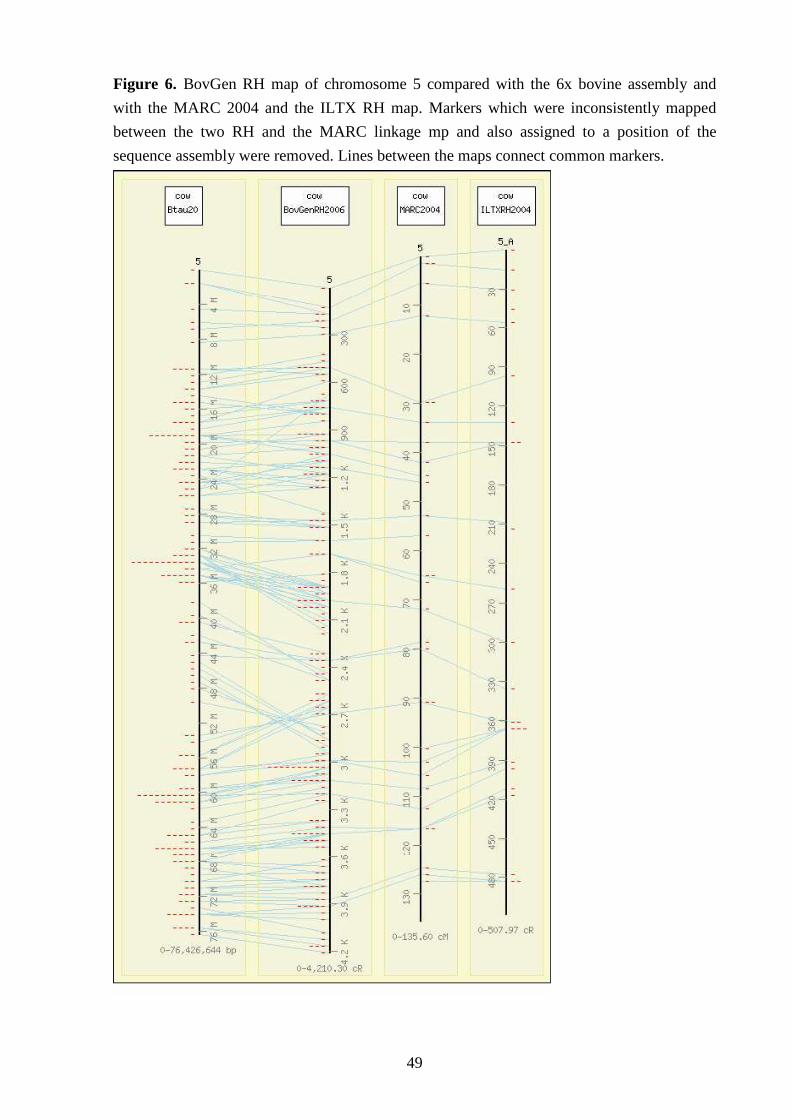
49
Figure 6. BovGen RH map of chromosome 5 compared with the 6x bovine assembly and
with the MARC 2004 and the ILTX RH map. Markers which were inconsistently mapped
between the two RH and the MARC linkage mp and also assigned to a position of the
sequence assembly were removed. Lines between the maps connect common markers.
50
V-Discussion
The resolution of genome maps differs between approaches, and all approaches, including the
assembly of a whole genome sequence, are prone to errors: in some cases insufficient
information is available to assign the correct order or positioning of loci, while data errors can
introduce distortions in the maps. The ultimate genome map of a species is the correctly
ordered DNA sequence. Achieving the correct sequence assembly uses several levels of
information. Sequence information from other species, including the human genome could be
used as a template, but should be treated with extreme caution as local species specific
variations are known (Ranz et al., 2001).
Direct sequence information is used for local assembly of shot-gun sequence reads into
contigs, and these contigs are then assembled into scaffolds using additional information, such
as overlapping clones, and sequences from paired clone ends. The ordering of these scaffolds
on chromosomes and assembly of the final sequence relies on additional mapping information,
including BAC fingerprint contig maps, linkage maps and RH maps.
In this work it was described a RH map with approximately 4000 mapped loci which will
contribute to the assembly of the bovine genome sequence.
V-I Comparison with other linkage and RH maps
The reliability of different maps can be assessed by examining consistency in alignment of
common loci, however it is important that the information used when assembling the maps is
independent, as circular arguments can give a false measure of agreement. In contrast to the
approach of Itoh et al. (2005) it was not used a linkage map as template for the construction of
the RH maps presented here because the aim was to assemble the most likely maps using only
the RH information. This independent data can then be used to assess potential errors across
different maps. It was carried out an alignment of the BovGen RH maps with the other
available maps of the bovine genome and with the Btau_2.0 sequence assembly, but only after
the maps were constructed. This approach could result in maps that are less consistent with
other published information, but it is important to realise that is the only way to contribute
new information. This independent mapping information can be used to develop a combined
map which carries a measure of map confidence, based on similarity and differences between
maps using independent data.
The BovGen and ILTX RH maps (Band et al., 2000; Everts-van der Wind et al., 2004; Everts-
van der Wind et al., 2005) appear to be more consistent with each other than with the MARC
2004 linkage map. Some inconsistencies between linkage and RH maps may be due to the
different mapping approaches, however; the observation of the apparent higher consistency
between the RH maps must be treated with care. The BovGen RH map has fewer loci in
common with the ILTX map than with the MARC 2004 linkage map and so fewer
51
discrepancies could be detected. Moreover, the ILTX map consists of 71 unordered linkage
groups which are a major source of the inconsistencies.
V-II Comparison with the sequence assembly
Sequence similarity search algorithms used to align maps with Btau_2.0 have a considerable
risk of errors as the algorithms might also detect gene duplications or similar motifs in
different genes. To minimize this problem it was used very stringent parameters for minimum
homology and maximized the required length of overlap between sequences. In addition
sequence matches were assessed manually before accepting hits as correct. Thus the loci
aligned between the different maps and the sequence carry a very high probability of correctly
assigned homology. Differences in the position of individual markers in different maps could
be simple technical variations explained by using different parameters and algorithms to
construct the multipoint maps. Inconsistencies in the chromosomal assignment of individual
markers may also have simple explanations, such as poor primer design resulting in
amplification of related loci, and not the target locus. Of greater importance for the
interpretation of the map information are inconsistencies affecting whole linkage groups. To
minimise the propagation of errors in individual maps we eliminated markers that were
inconsistently mapped from further analyses against the sequence assembly.
While the BovGen RH map is in general agreement with the ILTX map and the MARC 2004
map, chromosomal regions of high agreement with the Btau_2.0 sequence are quite rare.
Many differences in the marker order between the Btau_2.0 sequence and the BovGen RH
map cannot be detected when comparing the two RH and the MARC linkage map. Therefore,
after eliminating regions and markers that were inconsistent between these maps, we found
that there was poor overall consistency between the RH and linkage maps with the Btau_2.0
bovine sequence assembly. For example on chromosome 4 the marker order on the BovGen
RH map is in agreement with the MARC 2004 and ILTX map, but is inconsistent with the
sequence assembly. The extent of the inconsistencies detected with the sequence assembly
reveals the need for improvement by inclusion of further combined mapping information
(figure 6).
If we consider regions where there are inconsistencies between the different mapping methods,
e.g. on chromosomes 7, 25 and 29, the assembled sequence is most consistent with the
linkage map. Recalculating the maps for these three chromosomes using only markers that
can be located in the bovine sequence gives a map length for chromosomes 7, 25 and 29 of
3780,7 cR, 1788,5 cR and 1683,1 cR respectively, when the markers are ordered according to
the original BovGen RH maps. If the common markers are forced into the order they appear
in the sequence assembly: the map lengths increases to 567,.6 cR for chromosome 7, 2680,5
cR for chromosome 25 and 2683,3 cR for chromosome 29, and the log10 likelihood decreases
from -1306,58 to -1615,01 (BTA 7), from -763,13 to –982,82 (BTA 25) and from -741,18 to -
976,64 (BTA 29). The marker order suggested by the bovine assembly and the MARC
52
linkage map is therefore incompatible with the data underlying the BovGen RH maps for
these chromosomes.
V-III Assignment of markers to different chromosomes
The most significant problem in the genome assembly is that of erroneous chromosome
assignments. By comparing assignments among different RH and linkage maps and also using
comparative human or mouse information, it seems likely that the assignment in the bovine
assembly is most often at fault (table 2). For example the markers PTK2B, BZ948637 and
B4GALT1 (table 2, case 4) are closely linked on the BovGen RH map of BTA 8 and the
linkage map of Barendse et al. (1997) which also locates the genes on BTA 8. This is also
consistent with data from Fiedorek and Kay (1995) who mapped PYK2B (alias PTK2B or
Fadk) on murine chromosome 15 and Inazawa et al. (1996) who mapped the gene on human
chromosome 8 at positions which share conservation of synteny with BTA 8 (Everts-van der
Wind et al., 2005).
In contrast these marker loci are placed on chromosome 5 in the Btau_2.0 sequence assembly.
All three markers are located on a single sequence scaffold (chr 5.80), suggesting that the
chromosomal assignment of this scaffold is wrong.
The linkage group formed by the markers KIAA0284, Q9Y4F5, KNS2 and BTBD6 was
assigned to chromosome 11 on the BovGen RH maps; however the assignment is not
consistent with other mapping data (table 2, case 5). The human homologues of these loci
map to human chromosome 14 (Goedert et al., 1996) suggests that this group is correctly
assigned in the Btau_2.0 sequence to chromosome 21 and that the BovGen RH assignment is
incorrect. Nevertheless the linkage of this group to other markers on BTA 11 is convincing
with LOD linkage values up to 13,8 between the extreme marker KIAA0284 and the
neighbouring markers on the BovGen RH map. If this linkage group is tested with markers
located on BTA 21 using the BovGen RH datasets it shows no linkage. In the Btau_2.0
assembly this linkage group is at an extreme telomeric position and suggests that the
statistical support for this assignment is weak and may have been made on the expected
position derived from the supposed conservation of synteny between human and cattle
chromosomes.
The markers BZ850749, CC517527 and CC471629 are assigned to chromosome 14 on the
BovGen RH map and to chromosome 25 in the Btau_2.0 sequence assembly (table 2, case 6).
These markers are derived from BAC end sequences of clones from the CHORI-240 library
and are not present on other maps which could be used for comparison. All these markers are
assigned to the scaffold Chr25.84 and are in a chromosomal region of the assembly with a
low density of corresponding markers. In contrast on the BovGen RH map, the markers in the
same region are at a higher density. This suggests that these markers are more tightly linked
on the BovGen RH map and correctly positioned. No further information is available to
resolve this inconsistency.
53
VI-Conclusions
There is striking consistency between the RH maps presented here, the MARC linkage map
and the ILTX RH map. Using this data it is possible to identify possible errors in the assembly
of the current bovine genome sequence and hence aid the improvement of the next sequence
build. The inconsistencies between the BovGen RH, the Illinois-Texas RH and the MARC
linkage maps fall into three categories, markers that are assigned to different chromosomes,
which are few, minor rearrangements, which account for the majority of discrepancies, and
major rearrangements of marker, or linkage group order, which also are few. When the major
discrepancies between these maps are removed a large number of inconsistencies still remain
with the bovine sequence assembly. Using the combined mapping information available from
the high-resolution RH maps presented here together with the additional map data available
from publicly available RH and linkage maps should allow the next assemble of the bovine
genome sequence to be improved considerably.
54
VII-Reference Abel KJ, Boehnke M, Prahalad M, Ho P, Flejter WL, Watkins M, VanderStoep J, Chandrasekharappa SC, Collins FS, Glover TW, et al. A radiation hybrid map of the BRCA1 region of chromosome 17q12-q21. Genomics. 1993;17: 632-41. Agarwala R, Applegate DL, Maglott D, Schuler GD, Schaffer AA. A fast and scalable radiation hybrid map construction and integration strategy. Genome Res. 2000; 10: 350-64. Altschul SF, Gish W, Miller W, Myers EW, Lipman DJ. Basic local alignment search tool. J. Mol. Biol. 1990; 215: 403-410. Amaral ME, Kata SR, Womack JE. A radiation hybrid map of bovine X chromosome (BTAX). Mamm. Genome 2002; 13: 268-271. Amarante MR, Yang YP, Kata SR, Lopes CR, Womack JE. RH maps of bovine chromosomes 15 and 29: conservationofhumanchromosomes11and5. Mamm Genome. 2000; 11: 364-8. Andersson L. Genetic dissection of phenotypic diversity in farm animals. Nat. Genetics 2001; 2: 130-137. ArkDB Public database browser (http://www.thearkdb.org). Band M, Larson JH, Womack JE, Lewin HA. A radiation hybrid map of BTA23: identification of a chromosomal rearrangement leading to separation of the cattle MHC class II subregions.Genomics. 1998; 53: 269-75. Band MR, Larson JH, Rebeiz M, Green CA, Heyen DW, Donovan J, Windish R, Steining C, Mahyuddin P, Womack JE, Lewin HA. An ordered comparative map of the cattle and human genomes. Genome Res. 2000;10: 1359-68. Barendse W, Vaiman D, Kemp SJ, Sugimoto Y, Armitage SM, Williams JL, Sun HS, Eggen A, Agaba M, Aleyasin SA, Band M, Bishop MD, Buitkamp J, Byrne K, Collins F, Cooper L, Coppettiers W, Denys B, Drinkwater RD, Easterday K, Elduque C, Ennis S, Erhardt G, Ferretti L, Flavin N, Gao Q, Georges M, Gurung R, Harlizius B, Hawkins G, Hetzel J, Hirano T, Hulme D , Jorgensen C, Kessler M, Kirkpatrick BW, Konfortov B, Kostia S, Kuhn C, Lenstra JA, Leveziel H, Lewin H, Leyhe B, Lil L, Martin Burriel I, McGraw RA, Miller JR, Moody DE, Moore SS, Nakane S, Nijman IJ, Olsaker I, Pomp D, Rando A, Ron M, Shalom A, Teale AJ, Thieven U, Urquhart BGD, Vage DI, Van de Weghe A, Varvio S, Velmala R, Vilkki J, Weikard R, Woodside C, Womack JE. A medium-density genetic linkage map of the bovine genome. Mamm. Genome 1997; 8: 21-28. Benham F, Hart K, Crolla J, Bobrow M, Francavilla M, Goodfellow PN. A method for generating hybrids containing non selected fragments of human chromosomes.Genomics. 1989; 4: 509-17. BioRuby (http://www.bioruby.org). Boone C, Chen TR, Ruddle FH. Assignment of three human genes to chromosomes (LDH-A to 11, TK to 17, and IDH to 20) and evidence for translocation between human and mouse chromosomes in somatic cell hybrids (thymidine kinase-lactate dehydrogenase A-isocitrate
55
dehydrogenase-C-11, E-17, and F-20 chromosomes). Proc. Natl. Acad. Sci. U S A. 1972; 69: 510-4. Breen M, Jouquand S, Renier C, Mellersh CS, Hitte C, Holmes NG, Cheron A, Suter N, Vignaux F, Bristow AE, Priat C, McCann E, Andre C, Boundy S, Gitsham P, Thomas R, Bridge WL, Spriggs HF, Ryder EJ, Curson A, Sampson J, Ostrander EA, Binns MM, Galibert F. Chromosome-specific single-locus FISH probes allow anchorage of an 1800-marker integrated radiation-hybrid/linkage map of the domestic dog genome to all chromosomes. Genome Res. 2001;11: 1784-95. Buitkamp J, Kollers S, Durstewitz G, Welzel K, Schafer K, Kellermann A, Lehrach H, Fries R. Construction and characterization of a gridded cattle BAC library. Anim. Genet. 2000; 31: 347-51. Cai L, Taylor JF, Wing RA, Gallagher DS, Woo SS, Davis SK. Construction and characterization of a bovine bacterial artificial library. Genomics 1995; 29: 413-425. Cao Y, Kang HL, Xu X, Wang M, Dho SH, Huh JR, Lee BJ, Kalush F, Bocskai D, Ding Y, Tesmer JG, Lee J, Moon E, Jurecic V, Baldini A, Weier HU, Doggett NA, Simon MI, Adams MD, Kim UJ. A 12-Mb complete coverage BAC contig map in human chromosome16p13.1-p11.2. Genome Res. 1999; 9: 763-74 Casas E, Stone RT, Keele JW, Shackelford SD, Kappes SM, Koohmaraie M. A comprehensive search for quantitative trait loci affecting growth and carcass composition of cattle segregating alternative forms of the myostatin gene. J. Anim. Sci. 2001; 79: 854-60. Ceccherini I, Matera I, Sbrana M, Di Donato A, Yin L, Romeo G. Radiation hybrids for mapping and cloning DNA sequences of dista l16p. Somat. Cell. Mol. Genet. 1992; 18: 319-24. Chowdhary BP, Raudsepp T, Kata SR, Goh G, Millon LV, Allan V, Piumi F, Guerin G, Swinburne J, Binns M, Lear TL, Mickelson J, Murray J, Antczak DF, Womack JE, Skow LC. The first-generation whole-genome radiation hybrid map in the horse identifies conserved segments in human and mouse genomes. Genome Res. 2003 Apr;13(4):742-51. Erratum in: Genome Res. 2003;13:1258. CHORI-240 Bovine BAC Library (http://bacpac.chori.org/bovine240.htm). Clerget-Darpoux F, Bonaiti-Pellie C, Hochez J. Effects of misspecifying genetic parameters in lod score analysis. Biometrics. 1986; 42: 393-9. Cohen-Zinder M, Seroussi E, Larkin DM, Loor JJ, Everts-van der Wind A, Lee JH, Drackley JK, Band MR, Hernandez AG, Shani M, Lewin HA, Weller JI, Ron M. Identification of a missense mutation in the bovine ABCG2 gene with a major effect on the QTL on chromosome 6 affecting milk yield and composition in Holstein cattle. Genome Res. 2005; 15: 936-44. Collins FS, Green ED, Guttmacher AE, Guyer MS. A vision for the future of genomics research. Nature 2003; 422: 835-847.
56
Cox DR, Burmeister M, Price ER, Kim S, Myers RM. Radiation hybrid mapping: a somatic cell genetic method for constructing high-resolution maps of mammalian chromosomes. Science 1990; 250: 245-50. Clop A, Marcq F, Takeda A, Pirottini D, Tordoir X, Bibé B, Bouix J, Caiment F, Elsen JM, Eychenne F, Larzul C, Laville E, Meish F, Milenkovic D, Tobin J, Charlier C, Georges M. A mutation creating a potential illegitimate microRNA target site in the myostatin gene affects muscularity in sheep. Nat. Genetics 2006; 38: 813-818. DeWan AT, Parrado AR, Matise TC, Leal SM. The Map Problem: A comparison of Genetic and Sequence-Based Physical Maps. Am. J. Hum. Genet. 2002; 70: 101-107. Drogemuller C, Bader A, Wohlke A, Kuiper H, Leeb T, Distl O. A high-resolution comparative RH map of the proximal part of bovine chromosome 1. Anim Genet. 2002 ; 33: 271-9. Eggen A, Gautier M, Billaut A, Petit E, Hayes H, Laurent P, Urban C, Pfister-Genskow M, Eilertsen K, Bishop MD. Construction and characterization of a bovine BAC library with four genome equivalente coverage. Genet. Sel. Evol. 2001; 33: 543-548. Everts-van der Wind A, Larkin DM, Green CA, Elliot JS, Olmstead CA, Chiu R, Schein JE, Marra MA, Womack JE, Lewin HA. A high-resolution whole-genome cattle-human comparative map reveals details of mammalian chromosome evolution. PNAS 2005; 102: 18526-18531. Everts-van der Wind A, Kata SR, Band MR, Rebeiz M, Larkin DM, Everts RE, Green CA, Liu L, Natarajan S, Goldammer T, Lee JH, McKay S, Womack JE, Lewin HA. A 1463 gene cattle-human comparative map with anchor points defined by human genome sequence coordinates. Genome Res. 2004; 14: 1424-1437. Fadiel A, Anidi I, Eichenbaum KD. Farm animals genomics and informatics: an update. Nucleic Acids Res. 2005; 33: 6308-6318. Feakes R, Sawcer S, Chataway J, Coraddu F, Broadley S, Gray J, Jones HB, Clayton D, Goodfellow PN, Compston A. Exploring the dense mapping of a region of potential linkage in complex disease: an example in multiple sclerosis. Genet Epidemiol. 1999; 17: 51-63. Fiedorek FT Jr, Kay ES. Mapping of the focal adhesion kinase (Fadk) gene to mouse chromosome 15 and human chromosome 8. Mamm Genome. 1995; 6: 123-6. Florian F, Hornigold N, Griffin DK, Delhanty JD, Sefton L, Abbott C, Jones C, Goodfellow PN, Wolfe J. The use of irradiation and fusion gene transfer (IFGT) hybrids to isolate DNA clones from human chromosome region9q33-q34. Somat Cell Mol Genet. 1991; 17: 445-53. Fujiyama A, Watanabe H, Toyoda A, Taylor TD, Itoh T, Tsai SF, Park HS, Yaspo ML, Lehrach H, Chen Z, Fu G, Saitou N, Osoegawa K, de Jong PJ, Suto Y, Hattori M, Sakaki Y. Construction and analysis of a human-chimpanzee comparative clone map. Science. 2002; 295: 131-4.
57
Gautier M, Hayes H, Eggen A. An extensive and comprehensive radiation hybrid map of bovine Chromosome 15: comparison with human Chromosome 11. Mamm. Genome 2002; 13: 316-319. Gautier M, Hayes H, Bonsdorff T, Eggen A. Development of a comprehensive comparative radiation hybrid map of bovine chromosome 7 (BTA 7) versus human chromosomes 1 (HSA 1), 5 (HSA 5) and 19 (HSA 19). Cytogenet. Genome Res. 2003; 102: 25-31. Geisler R, Rauch GJ, Baier H, van Bebber F, Bross L, Dekens MP, Finger K, Fricke C, Gates MA, Geiger H, Geiger-Rudolph S, Gilmour D, Glaser S, Gnugge L, Habeck H, Hingst K, Holley S, Keenan J, Kirn A, Knaut H, Lashkari D, Maderspacher F, Martyn U, Neuhauss S, Neumann C, Nicolson T, Pelegri F, Ray R, Rick JM, Roehl H, Roeser T, Schauerte HE, Schier AF, Schonberger U, Schonthaler HB, Schulte-Merker S, Seydler C, Talbot WS, Weiler C, Nusslein-Volhard C, Hafft r P. A radiation nhybrid map of the zebrafish genome. Nat. Genet. 1999; 23:86-9. Georges M, Andersson L. Livestock genomics comes of age. Genome Res. 1996; 6: 907-21. Georges M. Towards marker assisted selection in livestock. Reprod. Nutr. Dev. 1999; 39: 555-61. Gerald PS, Brown JA. Proceedings: Report of the Committee on the Genetic Constitution of the X Chromosome. Cytogenet. Cell. Genet. 1974; 13: 29-34. Goedert M, Marsh S, Carter N. Localization of the human kinesin light chain gene (KNS2) to chromosome14q32.3byfluorescenceinsituhybridization. Genomics. 1996; 32: 173-5. Goldammer T, Kata SR, Brunner RM, Dorroch U, Sanftleben H, Schwerin M, Womack JE. A comparative radiation hybrid map of bovine chromosome 18 and homologous chromosomes in human and mice. Proc. Natl. Acad. Sci. U S A. 2002; 99:.2106-2111. Goring HH, Terwilliger JD. Linkage analysis in the presence of errors III: marker loci and their map as nuisance parameters. Am J Hum Genet. 2000; 66:1298-309. Gorni C, Williams JL, Heuven HCM, Negrini R, Valentini A, van Eijk MJT, Waddington D, Zevenbergen M, Ajmone Marsan P, Peleman JD. Application of AFLP®1 technology to radiation hybrid mapping. Chromosome Res. 2004; 12: 285-297. Goss SJ, Harris H. New method for mapping genes in human chromosomes. Nature 1975; 225: 680-684. Gregory SG, Sekhon M, Schein J, Zhao S, Osoegawa K, Scott CE, Evans RS, Burridge PW, Cox TV, Fox CA, Hutton RD, Mullenger IR, Phillips KJ, Smith J, Stalker J, Threadgold GJ, Birney E, Wylie K, Chinwalla A, Wallis J, Hillier L, Carter J, Gaige T, Jaeger S, Kremitzki C, Layman D, Maas J, McGrane R, Mead K, Walker R, Jones S, Smith M, Asano J, Bosdet I, Chan S, Chittaranjan S, Chiu R, Fjell C, Fuhrmann D, Girn N, GR C, Guin R, Hsiao L, Krzywinski M, Kutsche R, Lee SS, Mathewson C, McLeavy C, Messervier S, Ness S, Pandoh P, Prabhu AL, Saeedi P, Smailus D, Spence L, Stott J, Taylor S, Terpstra W, Tsai M, Vardy J, Wye N, Yang G, Shatsman S, Ayodeji B, Geer K, Tsegaye G, Shvartsbeyn A, Gebregeorgis E, Krol M, Russell D, Overton L, Malek JA, Holmes M, Heaney M, Shetty J, Feldblyum T, Nierman WC, Catanese JJ, Hubbard T, Waterston RH, Rogers J, de Jong PJ, Fraser CM,
58
Marra M, McPherson JD, Bentley DR. A physical map of the mouse genome. Nature 2002; 418: 743-750. Grisart B, Farnir F, Karim L, Cambisano N, Kim JJ, Kvasz A, Mni M, Simon P, Frere JM, Coppieters W, Georges M. Genetic and functional confirmation of the causality of the DGAT1 K232A quantitative trait nucleotide in affecting milk yield and composition. Proc. Natl. Acad. Sci. U S A. 2004; 101: 2398-403. Haley CS. Livestock QTLs--bringing home the bacon? Trends Genet. 1995; 11: 488-92. Gyapay G, Schmitt K, Fizames C, Jones H, Vega-Czarny N, Spillett D, Muselet D, Prud'homme JF, Dib C, Auffray C, Morissette J, Weissenbach J, Goodfellow PN. A radiation hybrid map of the human genome. Hum. Mol. Genet. 1996; 5: 339-46. Heddle JA. Randomness in the formation of radiation-indued chromosome aberrations. Genetics. 1965; 52:1329-34. Hoskins RA, Nelson CR, Berman BP, Laverty TR, George RA, Ciesiolka L, Naeemuddin M, Arenson AD, Durbin J, David RG, Tabor PE, Bailey MR, DeShazo DR, Catanese J, Mammoser A, Osoegawa K, de Jong PJ, Celniker SE, Gibbs RA, Rubin GM, Scherer SE. A BAC-based physical map of the major autosomes of Drosophila melanogaster.Science. 2000 ; 287: 2271-4. Hudson TJ, Stein LD, Gerety SS, Ma J, Castle AB, Silva J, Slonim DK, Baptista R, Kruglyak L, Xu SH, Hu X, Colbert AM, Rosenberg C, Reeve-Daly MP, Rozen S, Hui L, Wu X, Vestergaard C, Wilson KM, Bae JS, Maitra S, Ganiatsas S, Evans CA, DeAngelis MM, Ingalls KA, Nahf RW, Horton LT Jr, Anderson MO, Collymore AJ, Ye W, Kouyoumjian V, Zemsteva IS, Tam J, Devine R, Courtney DF, Renaud MT, Nguyen H, O'Connor TJ, Fizames C, Faure S, Gyapay G, Dib C, Morissette J, Orlin JB, Birren BW, Goodman N, Weissenbach J, Hawkins TL, Foote S, Page DC, Lander ES. An STS-based map of the human genome. Science. 1995; 270: 1945-54. Ihara N, Takasuga A, Mizoshita K, Takeda H, Sugimoto M, Mizoguchi Y, Hirano T, Itoh T, Watanabe T, Reed KM, Snelling WM, Kappes SM, Beattie CW, Bennet GL, Sugimoto Y. A Comprehensive genetic Map of the Cattle Genome Based on 3802 Microsatellites. Genome Res. 2004; 14: 1978-1998. Inazawa J, Sasaki H, Nagura K, Kakazu N, Abe T, Sasaki T. Precise localization of the human gene encoding cell adhesion kinase beta (CAK beta/PYK2) to chromosome 8 at p21.1 by fluorescence in situ hybridization. Hum Genet. 1996; 98:508-10. Itoh T, Takasuga A, Watanabe T, Sugimoto Y. Mapping of 1400 expressed sequence tags in the bovine genome using a somatic cell hybrid panel. Anim. Genet. 2003; 34: 362-370. Itoh T, Watanabe T, Ihara N, Mariani P, Beattie CW, Sugimoto Y, Takasuga A. A comprehensive radiation hybrid map of the bovine genome comprising 5593 loci. Genomics 2005; 85:413-424. Kappes SM, Keele JW, Stone RT, McGraw RA, Sonstegard TS, Smith TP, Lopez-Corrales NL, Beattie CW. A second-generation linkage map of the bovine genome. Genome Res. 1997; 7: 235-249.
59
Kumar S, Hedges SB. A molecular time scale for vertebrate evolution. Nature. 1998; 392: 917-20. Larkin DM, Everts-van der Wind A, Reibeiz M, Schweitzer PA, Bachman S, Green C, Wright CL, Campos EJ, Benson LD, Edwards J, Liu L, Osoegawa K, Womack JE, de Jong PJ, Lewin HA. Cattle-Human Comparative Map Built with Cattle BAC-Ends and Human Genome Sequence. Genome Res. 2003; 13: 1966-1972. Leach RJ, O’Connel P. Mapping of Mammalian Genomes with Radiation (Goss and Harris) Hybrids. Advances in Genetics 1995; 33: 63-103. Li C, Basarab J, Snelling WM, Benkel B, Murdoch B, Moore SS. The identification of common haplotypes on bovine chromosome 5 within commercial lines of Bos taurus and their associations with growth traits. J. Anim. Sci. 2002; 80: 1187-94. Lunetta KL, Boehnke M. Multipoint radiation hybrid mapping: comparison of methods, sample size requirements, and optimal study characteristics. Genomics. 1994; 21: 92-103. McCarthy L. Whole genome radiation hybrid mapping. Comment 1996; 12: 491-493. McCarthy LC, Terrett J, Davis ME, Knights CJ, Smith AL, Critcher R, Schmitt K, Hudson J, Spurr NK, Goodfellow PN. A first-generation whole genome-radiation hybrid map spanning the mouse genome. Genome Res. 1997; 7: 1153-61. MacNeil MD, Grosz MD. Genome-wide scans for QTL affecting carcass traits in Hereford x composite double backcross populations. J. Anim. Sci. 2002; 80: 2316-24. McPherson JD, Marra M, Hillier L, Waterston RH, Chinwalla A, Wallis J, Sekhon M, Wylie K, Mardis ER, Wilson RK, Fulton R, Kucaba TA, Wagner-McPherson C, Barbazuk WB, Gregory SG, HumphR SJ, French L, Evans RS, Bethel G, Whittaker A, Holden JL, McCann OT, Dunham A, Soderlund C, Scott CE, Bentley DR, Schuler G, Chen HC, Jang W, Green ED, Idol JR, Maduro VV, Montgomery KT, Lee E, Miller A, Emerling S, Kucherlapati, Gibbs R, Scherer S, Gorrell JH, Sodergren E, Clerc-Blankenburg K, Tabor P, Naylor S, Garcia D, de Jong PJ, Catanese JJ, Nowak N, Osoegawa K, Qin S, Rowen L, Madan A, Dors M, Hood L, T 1 rask B, Friedman C, Massa H, Cheung VG, Kirsch IR, Reid T, Yonescu R, Weissenbach J, Bruls T, Heilig R, Branscomb E, Olsen A, Doggett N, Cheng JF, Hawkins T, Myers RM, Shang J, Ramirez L, Schmutz J, Velasquez O, Dixon K, Stone NE, Cox DR, Haussler D, Kent WJ, Furey T, Rogic S, Kennedy S, Jones S, Rosenthal A, Wen G, Schilhabel M, Gloeckner G, Nyakatura G, Siebert R, Schlegelberger B, Korenberg J, Chen XN, Fujiyama A, Hattori M, Toyoda A, Yada T, Park HS, Sakaki Y, Shimizu N, Asakawa S, Kawasaki K, Sasaki T, Shintani A, Shimizu A, Shibuya K, Kudoh J, Minoshima S, Ramser J, Seranski P, Hoff C, Poustka A, Reinhardt R, Lehrach H; International Human Genome Mapping Consortium. A physical map of the human genome. Nature 2001; 409: 934-941. Morisson M, Jiguet-Jiglaire C, Leroux S, Faraut T, Bardes S, Feve K, Genet C, Pitel F, Milan D, Vignal A. Development of a gene-based radiation hybrid map of chicken Chromosome 7 and comparison to humanandmouse. Mamm Genome. 2004; 15: 732-9. Morton Ne. The inheritance of human birth weight. Ann Hum Genet. 1955; 20: 125-34. Nadkarn P. Mapmerge: merge genomic maps. Bioinformatics 1998;14:310-6.
60
Olsen HG, Lien S, Gautier M, Nilsen H, Roseth A, Berg PR, Sundsaasen KK, Svendsen M, Meuwissen TH. Mapping of a milk production quantitative trait locus to a 420-kb region on bovine chromosome 6. Genetics 2005; 169:2 75-83. Priat C, Hitte C, Vignaux F, Renier C, Jiang Z, Jouquand S, Cheron A, Andre C, Galibert F. A whole-genome radiation nhybrid map of the dog genome. Genomics. 1998; 54: 361-78. Ranz JM, Casals F, Ruiz A. How malleable is the eukaryotic genome? Extreme rate of chromosomal rearrangement in the genus Drosophila. Genome Res. 2001; 11: 230-9. Rebeiz M, Lewin HA. Compass of 47,787 cattle ESTs. Anim Biotechnol. 2000; 1: 75-241. Rexroad CE, Schlapfer JS, Yang Y, Harlizius B, Womack JE. A radiation hybrid map of bovine chromosome one. Anim Genet. 1999; 30:325-332. Rexroad CE 3rd, Owens EK, Johnson JS, Womack JE. A 12,000 rad whole genome radiation hybrid panel for high resolution mapping in cattle: characterization of the centromeric end of chromosome 1. Anim. Genet. 2000; 31: 262-5. Risch N, Giuffra L. Model misspecification and multipoint linkage analysis. Hum Hered. 1992; 42: 77-92. Ruddle FH. Linkage analysis using somatic cell hybrids.Adv. Hum. Genet. 1972; 30: 173-235. SantaLucia JJ, Allawi HT, Seneviratne PA. Improved nearest-neighbor parameters for predicting DNA duplex stability. Biochemistry 1996; 35: 3555-3562. Schiebler L, Roig A, Mahé MF, Save JC, Gautier M, Taourit S, Boichard D, Eggen A, Cribiu EP. A first generation bovine BAC-based physical map. Genet. Sel. Evol. 2004; 36: 105-122. Schiex T, Gaspin C. Carthagene: constructing and joining maximum likelihood genetic maps. In Proceedings of ISMB'97, Halkidiki, Greece Porto Carras 1997: 258–267. Schlapfer J, Stahlberger-Saitbekova N, Comincini S, Gaillard C, Hills D, Meyer RK, Williams JL, Womack JE, Zurbriggen A, Dolf G. A higher resolution radiation hybrid map of bovine chromosome 13. Genet. Sel. Evol. 2002; 34: 255-67. Schnabel RD, Sonstegard TS, Taylor JF, Ashwell MS. Whole-genome scan to detect QTL for milk production, conformation, fertility and functional traits in two US Holstein families. Anim Genet. 2005; 36: 408-16. Siden TS, Kumlien J, Schwartz CE, Rohme D. Radiation fusion hybrids for human chromosomes 3 and X generated at various irradiation doses. Somat. Cell. Mol. Genet. 1992; 18: 33-44 Slonim D, Kruglyak L, Stein L, Lander E. Building human genome maps with radiation hybrids. J. of Computational Biology 1997; 4: 487-504. Snelling WM, Gautier M, Keele JW, Smith TP, Stone RT, Harhay GR, Bennet GL, Ihara N, Takasuga A, Takeda H, Sugimoto Y, Eggen A. Integrating linkage and radiation hybrid mapping data for bovine chromosome 15. BMC Genomics 2004; 5:77-90.
61
Soderlund C, Lau T, Deloukas P. Z extensions to the RHMAPPER package. Bioinformatics 1998; 14: 538-9. Steen RG, Kwitek-Black AE, Glenn C, Gullings-Handley J, Van Etten W, Atkinson OS, Appel D, Twigger S, Muir M, Mull T, Granados M, Kissebah M, Russo K, Crane R, Popp M, Peden M, Matise T, Brown DM, Lu J, Kingsmore S, Tonellato PJ, Rozen S, Slonim D, Young P, Jacob HJ, et al. A high-density integrated genetic linkage and radiation hybrid map of the laboratory rat. Genome Res. 1999; 9:793. Stone RT, Pulido JC, Duyk GM, Kappes SM, Keele JW, Beattie CW. A small-insert bovine genomic library highly enriched for microsatellite repeat sequences. Mamm. Genome 1995; 6: 714-24. Sun S, Murphy WJ, Menotti-Raymond M, O'Brien SJ. Integration of the feline radiation hybrid and linkage maps. Mamm Genome 2001; 12:436-41. Thomas JW, Prasad AB, Summers TJ, Lee-Lin SQ, Maduro VV, Idol JR, Ryan JF, Thomas PJ, McDowell JC, Green ED. Parallel construction of orthologous sequence-ready clone contig maps in multiple species. Genome Res. 2002; 12:1277-85 Walter MA, Spillett DJ, Thomas P, Weissenbach J, Goodfellow PN. A method for constructing radiation hybrid maps of whole genomes. Nat. Genet. 1994; 7: 22-8. Warren W, Smith TPL, Rexroad III CE, Fahrenkrub SC, Allison T, Shu CL, Catanese J, De Long PJ. Construction of and characterization of a new bovine bacterial artificial chromosome library with 10 genome-equivalent coverage. Mamm. Genome 2000; 11: 662-663. Watanabe TK, Bihoreau MT, McCarthy LC, Kiguwa SL, Hishigaki H, Tsuji A, Browne J, Yamasaki Y, Mizoguchi-Miyakita A, Oga K, Ono T, Okuno S, Kanemoto N, Takahashi E, Tomita K, Hayashi H, Adachi M, Webber C, Davis M, Kiel S, Knights C, Smith A, Critcher R, Miller J, Thangarajah T, Day PJ, Hudson JR Jr, Irie Y, Takagi T, Nakamura Y, Goodfellow PN, Lathrop GM, Tanigami A, James MR. A radiation hybrid map of the rat genome containing 5,255 markers.Nat Genet. 1999; 22: 27-36. Weikard R, Goldmammer T, Laurent P, Womack JE, Kuehn C. A gene-based high-resolution comparative radiation hybrid map as a framework for genome sequence assembly of a bovine chromosome 6 region associated with QTL for growth, body composition, and milk performance traits. BMC Genomics 2006; 7: 53-67. Wheelan SJ, Church DM, Ostell JM. Spidey: a tool for mRNA-to-genomic alignments. Genome Res. 2001; 11: 1952-1957. Williams JL, Eggen A, Ferretti L, Farr J, Gautier M, Amati G, Ball G, Caramorr T, Critcher R, Costa S, Hextall P, Hills D, Jeulin A, Kiguwa SL, Ross O, Smith AL, Saunier K, Urquhart B, Waddington D. A bovine whole-genome radiation hybrid panel and outline map. Mamm. Genome 2002; 13:469-474. Womack JE. Advances in livestock genomics: Opening the barn door. Genome Res. 2005; 15: 1699-1705. Womack JE, Johnson JS, Owens EK, Rexroad CE, Sclapfer J, Yang YP. Mamm. Genome 1997; 8: 854-856.
62
Womack JE, Moll YD. Gene map of the cow: conservation of linkage with mouse and man. J Hered. 1986; 77: 2-7. Yang YP, Rexroad CE 3rd, Schlapfer J, Womack JE. An integrated radiation hybrid map of bovine chromosome 19 and ordered comparative mapping with human chromosome 17. Genomics. 1998; 48: 93-9. Yerle M, Lahbib-Mansais Y, Mellink C, Goureau A, Pinton P, Echard G, Gellin J, Zijlstra C, De Haan N, Bosma AA, et al. The PiGMaP consortium cytogenetic map of the domestic pig (Sus scrofa domestica). Mamm. Genome. 1995; 6: 176-86. Yerle M, Pinton P, Delcros C, Arnal N, Milan D, Robic A. Generation and characterization of a 12,000-rad radiation hybrid pane for fine mapping in pig. Cytogenet. Genome Res. 2002; 97: 219-28. Zhu B, Smith JA, Tracey SM, Konfortov BA, Welzel K, Schalkwyk LC, Lehrach H, Kollers S, Masabanda J, Buitkamp J, Fries R, Williams JL, Miller JR. A 5x genome coverage bovine BAC library: production, characterization,anddistribution. Mamm. Genome. 1999;10: 706-9.
.
63
Second Part: The microRNA in the mammary gland
I-Introduction
I-I The miRNA
I-I-a RNA silencing and miRNA
From the discovery of the structure of DNA (1953, Watson and Crick) to our days, big steps
have been done in discovering the biological mechanisms with which DNA can carry the
genetic information, can transmit it from one cell to one other and transfer it in a molecule of
RNA and later in the structure of a protein, the final functional actor of the biology of a cell.
Even if the recent completion of the human, mouse and other eukaryotic genomes were
important scientific milestones towards the understanding of eukaryotic biology, it’s not easy
to assess which regions of DNA have simply structural functions, which are really transcribed
and code from a protein, how many genes are presents in a genome. In the human the last
reported genome annotation has identified only 20000-25000 protein-coding genes
(International Human Genome Sequencing Consortium, 2004), in contrast with previous
higher estimate (Fields et al., 1994) and this raise some questions about the real definition of
an eukaryotic gene. A possible answer could be found in the presence of alternative-splicing
and of many non-coding RNA gene that do not have any clear “Open Reading Frame”(ORF)
and are very difficult to predict from genomic sequences (Costa, 2005).
For many years RNA was considered to be just accessory molecules involved in mediating
transcription and translation. RNA molecules are very versatile and their chemical properties
allow them to form complex tertiary structures capable of performing several roles that were
thought to be under the exclusive domain of proteins (Szymanski et al., 2003). They can
interact with different proteins forming ribocomplexes, they can associate with specific DNA
and/or other RNA sequences, controlling several aspects of gene regulation and different
molecular connections in cells that are only partially discovered (Mattick, 2004).
In 1969, Britten and Davidson for the first time proposed that RNAs can solve the problem of
eukaryotic gene regulation determine which genes are turned off and on by base-pairing
against DNA (Britten and Davidson, 1969). The idea was abandoned with the discovery of a
large class of protein transcription factors.
It was only in the 1990 that two different groups discovered for the first time the mechanism
of RNA silencing like an internal mechanism of defense in petunia observing a
‘cosuppression’ of a transgenic and an endogenous gene after the introduction of the first one
in the plant (Napoli et al, 1990; van der Krol et al., 1990). In some years this phenomenon
was discovered in a broad spectrum of eukaryotes, from fungi to flies (Zamore and Haley,
2005) and it was shown to be involved in a plethora of mechanism like the regulation of
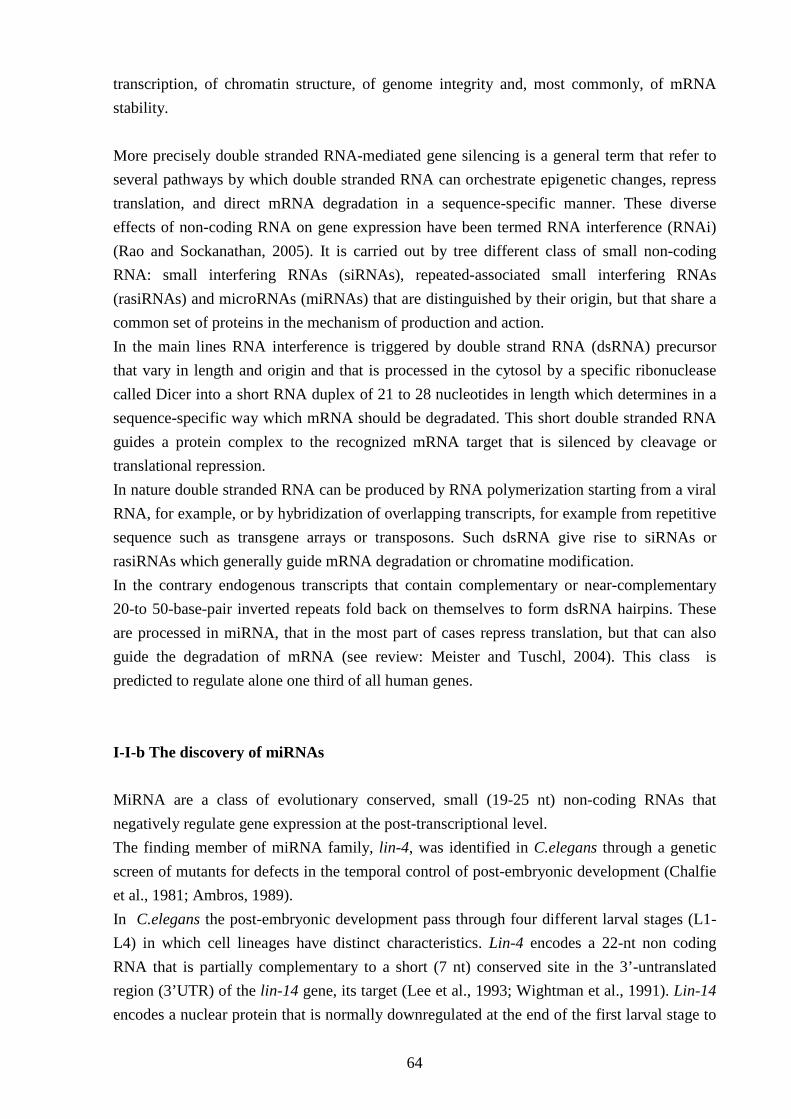
64
transcription, of chromatin structure, of genome integrity and, most commonly, of mRNA
stability.
More precisely double stranded RNA-mediated gene silencing is a general term that refer to
several pathways by which double stranded RNA can orchestrate epigenetic changes, repress
translation, and direct mRNA degradation in a sequence-specific manner. These diverse
effects of non-coding RNA on gene expression have been termed RNA interference (RNAi)
(Rao and Sockanathan, 2005). It is carried out by tree different class of small non-coding
RNA: small interfering RNAs (siRNAs), repeated-associated small interfering RNAs
(rasiRNAs) and microRNAs (miRNAs) that are distinguished by their origin, but that share a
common set of proteins in the mechanism of production and action.
In the main lines RNA interference is triggered by double strand RNA (dsRNA) precursor
that vary in length and origin and that is processed in the cytosol by a specific ribonuclease
called Dicer into a short RNA duplex of 21 to 28 nucleotides in length which determines in a
sequence-specific way which mRNA should be degradated. This short double stranded RNA
guides a protein complex to the recognized mRNA target that is silenced by cleavage or
translational repression.
In nature double stranded RNA can be produced by RNA polymerization starting from a viral
RNA, for example, or by hybridization of overlapping transcripts, for example from repetitive
sequence such as transgene arrays or transposons. Such dsRNA give rise to siRNAs or
rasiRNAs which generally guide mRNA degradation or chromatine modification.
In the contrary endogenous transcripts that contain complementary or near-complementary
20-to 50-base-pair inverted repeats fold back on themselves to form dsRNA hairpins. These
are processed in miRNA, that in the most part of cases repress translation, but that can also
guide the degradation of mRNA (see review: Meister and Tuschl, 2004). This class is
predicted to regulate alone one third of all human genes.
I-I-b The discovery of miRNAs
MiRNA are a class of evolutionary conserved, small (19-25 nt) non-coding RNAs that
negatively regulate gene expression at the post-transcriptional level.
The finding member of miRNA family, lin-4, was identified in C.elegans through a genetic
screen of mutants for defects in the temporal control of post-embryonic development (Chalfie
et al., 1981; Ambros, 1989).
In C.elegans the post-embryonic development pass through four different larval stages (L1-
L4) in which cell lineages have distinct characteristics. Lin-4 encodes a 22-nt non coding
RNA that is partially complementary to a short (7 nt) conserved site in the 3’-untranslated
region (3’UTR) of the lin-14 gene, its target (Lee et al., 1993; Wightman et al., 1991). Lin-14
encodes a nuclear protein that is normally downregulated at the end of the first larval stage to
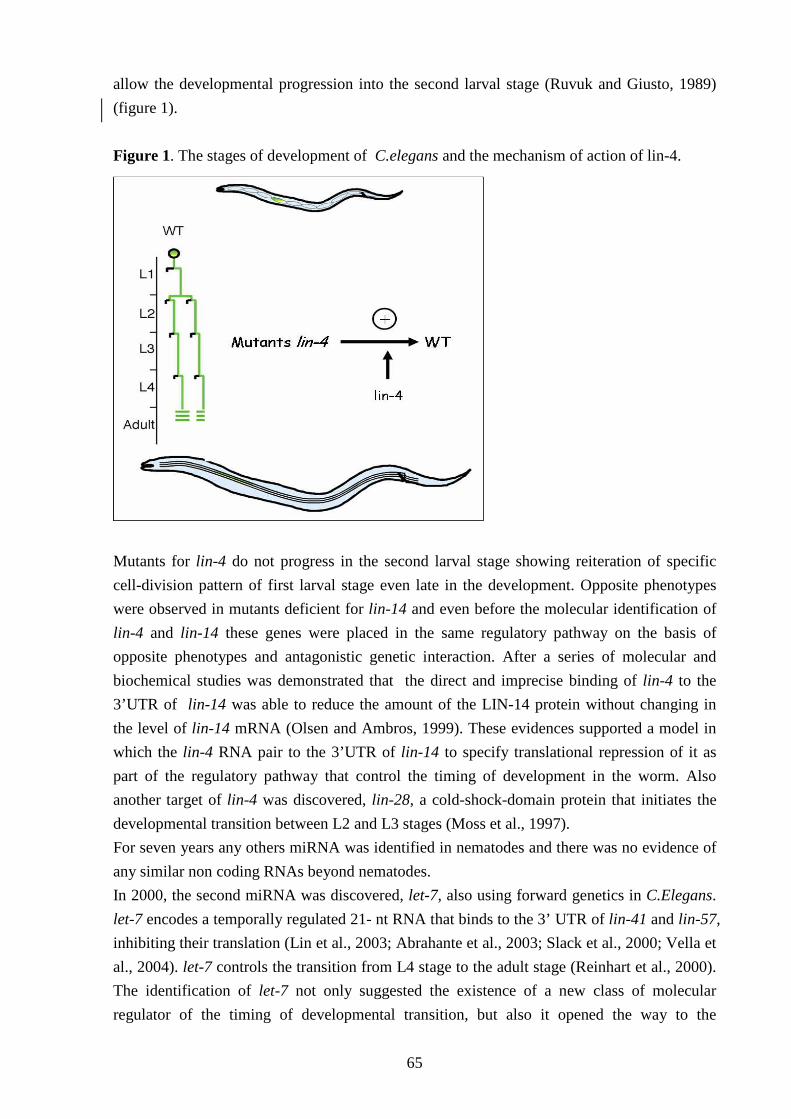
65
allow the developmental progression into the second larval stage (Ruvuk and Giusto, 1989)
(figure 1).
Figure 1. The stages of development of C.elegans and the mechanism of action of lin-4.
Mutants for lin-4 do not progress in the second larval stage showing reiteration of specific
cell-division pattern of first larval stage even late in the development. Opposite phenotypes
were observed in mutants deficient for lin-14 and even before the molecular identification of
lin-4 and lin-14 these genes were placed in the same regulatory pathway on the basis of
opposite phenotypes and antagonistic genetic interaction. After a series of molecular and
biochemical studies was demonstrated that the direct and imprecise binding of lin-4 to the
3’UTR of lin-14 was able to reduce the amount of the LIN-14 protein without changing in
the level of lin-14 mRNA (Olsen and Ambros, 1999). These evidences supported a model in
which the lin-4 RNA pair to the 3’UTR of lin-14 to specify translational repression of it as
part of the regulatory pathway that control the timing of development in the worm. Also
another target of lin-4 was discovered, lin-28, a cold-shock-domain protein that initiates the
developmental transition between L2 and L3 stages (Moss et al., 1997).
For seven years any others miRNA was identified in nematodes and there was no evidence of
any similar non coding RNAs beyond nematodes.
In 2000, the second miRNA was discovered, let-7, also using forward genetics in C.Elegans.
let-7 encodes a temporally regulated 21- nt RNA that binds to the 3’ UTR of lin-41 and lin-57,
inhibiting their translation (Lin et al., 2003; Abrahante et al., 2003; Slack et al., 2000; Vella et
al., 2004). let-7 controls the transition from L4 stage to the adult stage (Reinhart et al., 2000).
The identification of let-7 not only suggested the existence of a new class of molecular
regulator of the timing of developmental transition, but also it opened the way to the
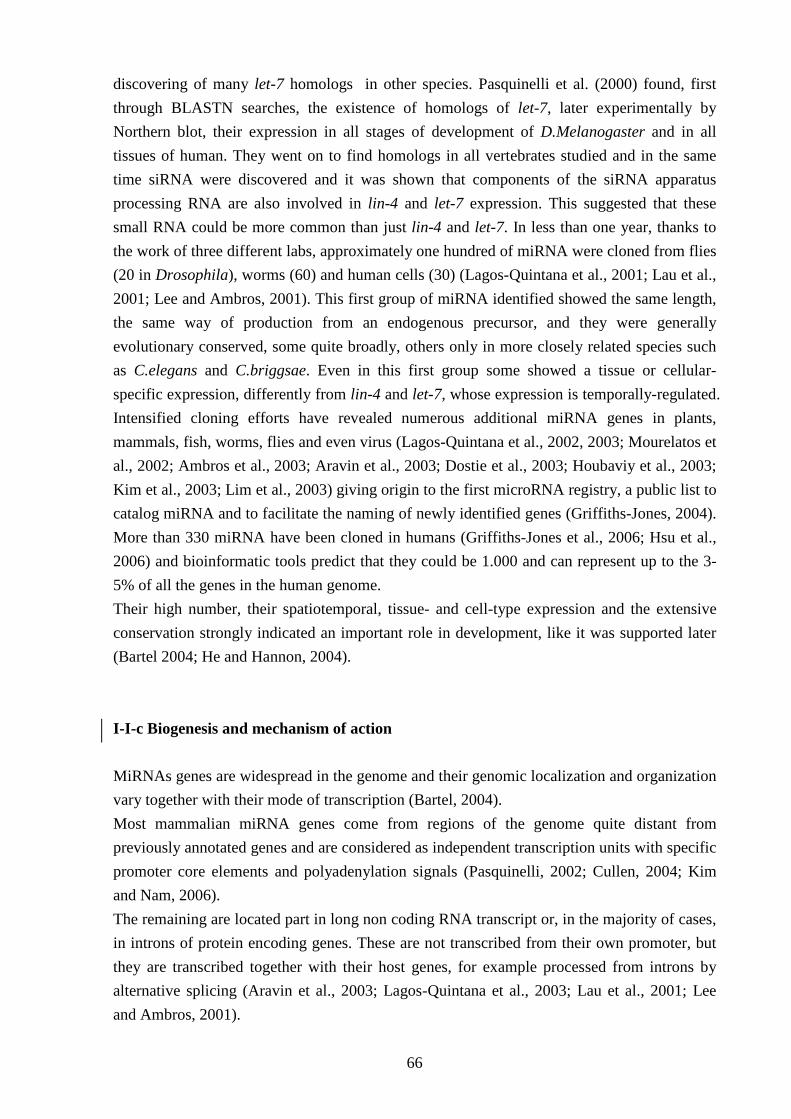
66
discovering of many let-7 homologs in other species. Pasquinelli et al. (2000) found, first
through BLASTN searches, the existence of homologs of let-7, later experimentally by
Northern blot, their expression in all stages of development of D.Melanogaster and in all
tissues of human. They went on to find homologs in all vertebrates studied and in the same
time siRNA were discovered and it was shown that components of the siRNA apparatus
processing RNA are also involved in lin-4 and let-7 expression. This suggested that these
small RNA could be more common than just lin-4 and let-7. In less than one year, thanks to
the work of three different labs, approximately one hundred of miRNA were cloned from flies
(20 in Drosophila), worms (60) and human cells (30) (Lagos-Quintana et al., 2001; Lau et al.,
2001; Lee and Ambros, 2001). This first group of miRNA identified showed the same length,
the same way of production from an endogenous precursor, and they were generally
evolutionary conserved, some quite broadly, others only in more closely related species such
as C.elegans and C.briggsae. Even in this first group some showed a tissue or cellular-
specific expression, differently from lin-4 and let-7, whose expression is temporally-regulated.
Intensified cloning efforts have revealed numerous additional miRNA genes in plants,
mammals, fish, worms, flies and even virus (Lagos-Quintana et al., 2002, 2003; Mourelatos et
al., 2002; Ambros et al., 2003; Aravin et al., 2003; Dostie et al., 2003; Houbaviy et al., 2003;
Kim et al., 2003; Lim et al., 2003) giving origin to the first microRNA registry, a public list to
catalog miRNA and to facilitate the naming of newly identified genes (Griffiths-Jones, 2004).
More than 330 miRNA have been cloned in humans (Griffiths-Jones et al., 2006; Hsu et al.,
2006) and bioinformatic tools predict that they could be 1.000 and can represent up to the 3-
5% of all the genes in the human genome.
Their high number, their spatiotemporal, tissue- and cell-type expression and the extensive
conservation strongly indicated an important role in development, like it was supported later
(Bartel 2004; He and Hannon, 2004).
I-I-c Biogenesis and mechanism of action
MiRNAs genes are widespread in the genome and their genomic localization and organization
vary together with their mode of transcription (Bartel, 2004).
Most mammalian miRNA genes come from regions of the genome quite distant from
previously annotated genes and are considered as independent transcription units with specific
promoter core elements and polyadenylation signals (Pasquinelli, 2002; Cullen, 2004; Kim
and Nam, 2006).
The remaining are located part in long non coding RNA transcript or, in the majority of cases,
in introns of protein encoding genes. These are not transcribed from their own promoter, but
they are transcribed together with their host genes, for example processed from introns by
alternative splicing (Aravin et al., 2003; Lagos-Quintana et al., 2003; Lau et al., 2001; Lee
and Ambros, 2001).
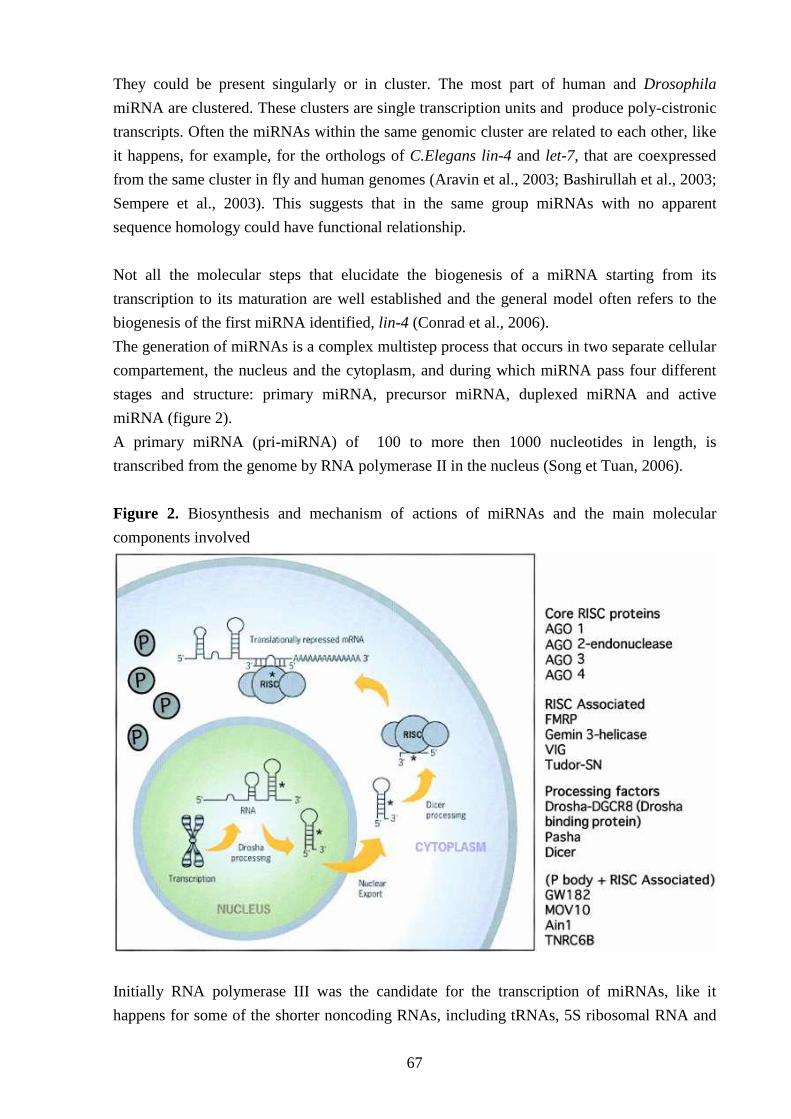
67
They could be present singularly or in cluster. The most part of human and Drosophila
miRNA are clustered. These clusters are single transcription units and produce poly-cistronic
transcripts. Often the miRNAs within the same genomic cluster are related to each other, like
it happens, for example, for the orthologs of C.Elegans lin-4 and let-7, that are coexpressed
from the same cluster in fly and human genomes (Aravin et al., 2003; Bashirullah et al., 2003;
Sempere et al., 2003). This suggests that in the same group miRNAs with no apparent
sequence homology could have functional relationship.
Not all the molecular steps that elucidate the biogenesis of a miRNA starting from its
transcription to its maturation are well established and the general model often refers to the
biogenesis of the first miRNA identified, lin-4 (Conrad et al., 2006).
The generation of miRNAs is a complex multistep process that occurs in two separate cellular
compartement, the nucleus and the cytoplasm, and during which miRNA pass four different
stages and structure: primary miRNA, precursor miRNA, duplexed miRNA and active
miRNA (figure 2).
A primary miRNA (pri-miRNA) of 100 to more then 1000 nucleotides in length, is
transcribed from the genome by RNA polymerase II in the nucleus (Song et Tuan, 2006).
Figure 2. Biosynthesis and mechanism of actions of miRNAs and the main molecular
components involved
Initially RNA polymerase III was the candidate for the transcription of miRNAs, like it
happens for some of the shorter noncoding RNAs, including tRNAs, 5S ribosomal RNA and
68
the U6 snRNA, but numerous evidences supported the activity of the RNA polymerase II (see
review: Di Leva et al., 2006). In the beginning several long transcripts comprising miRNAs
were identified in expressed sequence tags and their complex expression control was typical
of those transcribed by RNA polymerase II, later the association with this enzyme was
demonstrated clearly. Until now only a few different pri-miRNA have been isolated and
characterized, three from human, one from C.Elegans, one from plants and they all are capped,
polyadenylated and apparently noncoding (Cullen, 2004).
In the nucleus the pri-miRNA is converted to precursor miRNA or pre-miRNA , a 60-70
nucleotides stem loop intermediate, through the cleavage activity of the Drosha enzyme, a
nuclear Ribonuclease III endonuclease which cleaves the flank regions of pri-miRNA (Lee et
al., 2002, 2003; Zeng and Cullen, 2003).
Drosha can cut only pri-miRNAs that have a large terminal loop (>10 nt) in the hairpin and a
stem region one turn bigger than the precursor, 5’ and 3’ single-stranded RNA extensions at
the base of the future miRNAs (Filipowicz et al., 2005, Tomari and Zamore 2005). The
hypothesis is that Drosha recognizes the primary precursor through the stem-loop structure
and then cleaves the stem at a fixed distance from the loop, liberating the pre-miRNA and
determining one end of the mature miRNA. It’s not clear in which way Drosha recognizes the
pri-miRNA stem-loop from stem-loop of other RNAs. The pre-miRNA presents a 5’
phosphate and 3’hydroxy termini and two or three nucleotides with single-stranded
overhanging ends, classic characteristics of Ribonuclease III cleavage of dsRNAs (Di Leva et
al., 2006). It is 60-70 nucleotides long with an imperfect stem-loop structure. In the stem part
of one of the two arm is present the sequence of the mature miRNA and in the other arm the
near complementary miRNA* that will be later eliminated.
The pre-miRNA is actively transported from the nucleus to the cytoplasm. Pre-miRNA
interacts with the export receptor Exportin-5 (Exp5) (Kim, 2004) and RanGTP forming a
nuclear heterotrimer that promote the stabilization of pre-miRNA and is exported to the
cytoplasm. Once the heterotrimer reach the cytoplasm through the nuclear pore, the RanGTP
is hydrolyzed to RanGDP and the pre-miRNA is released (Di Leva et al., 2006).
In the cytoplasm the pre-miRNA is processed into 18-22 nucleotide imperfect double strand
RNA duplex (miRNA: miRNA*) by the cytoplasmic Ribonuclease III, Dicer, that acts, in
humans, with the trans activator RNA (tar)-binding protein , TRBP (Chendrimada et al. 2005).
Dicer contains a putative helicase domain, a DUF283 domain, a PAZ (Piwi-Argonaute-Zwille)
domain, two tandem RNase-III domains and a dsRNA-binding domain 8 (dsRBD). The PAZ
domain is responsible of the interaction of Dicer with the 2-nucleotide 3’ overhangs of
dsRNA such as the pre-miRNA. The efficient Dicer cleavage also requires the presence of the
overhangs and a minimal stem length. The model assumes that the PAZ domain of Dicer
recognizes the end of the pre-miRNA and can position the site of the second cleavage on the
stem of the precursor. The variable size of the product, from 18 to 22 nt, results from the
69
presence of bulges and mismatches on the pre-miRNA. Efficient cleavage requires dimerized
RNase III domains because the functional catalytic site resides in the interface of the dimmer
(see review: He and Hannon, 2004).
Like Dicer also Drosha has two tandem RNase-II domains. The exact biochemical mechanism
that guides the cleavage has not been elucidate, but it’s probable that it shares closely related
mechanism for processing miRNA.
In plant no Drosha homologues have been found and it suggests that the maturation of
miRNA from long primary transcript should occur differently comparing to the animal model.
However there are four Dicer homologues in Arabidopsis thaliana, DCL1, DCL2, DCL3,
DCL4, two of which contain nuclear localization signals. It seems possible that in plant the
Drosha function is carried out by one or more specialized Dicer. In plants deficient for DCL1
not only the production of some miRNA is reduced, but also is not detected the accumulation
of the corresponding pre-miRNA. A model in which Dicer specialised enzymes catalyse both
Drosha and Dicer cleavage for the maturation of miRNAs inside the nucleus has been built.
The functional specificity of different Dicer enzymes in organisms with multiple Dicer
homologues has recently been indicated also in Drosophila and the function of Dicer seems
not simply restricted to the cleavage, but also correlated to the initiation of RNA-silencing in
the effector complex (see review: He and Hannon, 2004).
Only one strand of the dsRNA contains the miRNA that preferentially enters the RNA-
induced silencing complex (RISC), the effector protein complex in which the miRNA pairs
the mRNA target and produces its degradation or the inhibition of its translation into a protein
(see review: He and Hannon, 2004).
This effector complex shares so much core components with that of siRNA that it’s generally
called RISC for siRNA and miRNA even if in humans it’s called miRNP, miRNA
ribonucleoprotein, after the identification of the proteins that constitute it (Hutvagner and
Zamore, 2002; Mourelatos et al., 2002). Several proteins have been purified and identified as
essential components of RISC, but only a few have been functionally characterized (see
review: Di Leva et all., 2006). RISC has been purified in many organisms and it always
contains a member of the Argonaute protein family, which is thought to be a core component.
Many Argonaute proteins were already identified in worms, fungi and plants and shown to be
implicated in the mechanism of RNA silencing. These evolutionary conserved proteins of
approximately 100 kDa are called also PPD proteins because they all share the PAZ and PIWI
domains. The first one domain has the function to bind weakly to
single-stranded RNA and also to double stranded RNA; this suggest that this protein can have
the ability to bind miRNA before and after its association with the mRNA target. Structural
and biochemical studies have proved that the Argonaute proteins are the target-cleaving
endonuclease of RISC, and that the complex is coordinated also by other proteins whose
functions are not really understood, like the RNA-binding protein VIG, the Fragile-X related
protein in Drosophila, the exonuclease Tudor-SN, and many other putative helicases (Nelson
70
et al., 2003). In humans miRNP is constituted by the Argonaute protein called eIF2C2
(Martinez et al., 2002), and other two helicases, Gemin3 and Gemin4.
When the miRNA strand of the miRNA: miRNA* duplex is loaded into the RISC the
miRNA* is unwind and rapidly degraded. The target specificity and probably also the
functional efficiency of a miRNA requires that the mature miRNA strand from the duplex be
selectively incorporated into the RISC for target recognition (see review: Bartel, 2004). What
is the mechanism for choosing which of the two strand enters the RISC? Some evidences
show that the strand that enter is nearly always the one whose 5’ end is less tightly paired
(Khvorova et al., 2003; Schwarz et al., 2003). After the cleavage of Dicer the stability of the
5’ ends of the two strand of the duplex is usually different. It seems that helicases present in
the RISC take with the same frequencies both the end of the two strand before beginning to
unwind the duplex and that finally the relative ease of unwind the less stable facilitate its
preferential incorporation into the RISC, determining the asymmetrical assembly of the
complex.
The precise mechanism that underlies post-transcriptional repression by miRNAs still remain
unknown. We know that two processes exist for miRNA-mediated gene regulation:
degradation of the target mRNA and translational repression, depending largely on the degree
of the complementarity between the miRNA and the target. The miRNA will specify cleavage
if the mRNA has sufficient complementarity to the miRNA or it will repress productive
translation if the mRNA is only partially complementary, but has a sufficient number of
miRNA complementary sites (Hutvagner and Zamore, 2002; Zeng et al., 2002, 2003; Doench
et al., 2003). This model is supported from many evidences, but it can not be considered a
general rule because there was at least one case of a plant miRNA, miR-172 in A.thaliana,
that regulates APETALA2 via translational repression despite the near-perfect
complementarity between the miRNA and the target (Aukerman and Sakai, 2003; Chen,
2003).
When miRNA guides the cleavage the cut happens in a precise position, between the
nucleotide pairing to residues 10 and 11 of the miRNA, like it happens for siRNA (Kasschau
et al., 2003; Hutvagner and Zamore, 2002; Llave et al., 2002) and it appears to be determined
relative to miRNA residues, not to miRNA: target base pairs. After cleavage of the mRNA the
miRNA remains intact and can guide the recognition and destruction of additional mRNA
(Tang et al., 2003).
The mechanism of translational inhibition was first observed and studied looking at the RNA-
silencing of lin-4 over lin-14 in C.Elegans. It was observed that in the animal kingdom
miRNA typically mediate translational repression rather than mRNA cleavage, that is more
common in plants, even if recently one miRNA in Drosophila, miR-196, was found to direct
mRNA cleavage of its target, Hoxb8 (Yekta et al., 2004). It seems that in animal generally the
miRNAs have a lower degree of complementary to mRNA targets comparing to the nearly
71
perfect base pairing of plant miRNA to the corresponding target, that in plants generally
guides to its destruction (Hake, 2003). It was observed that the cooperative action of multiple
RISC provide the most efficient translational inhibition (Doench et al., 2003). This correlates
with the presence of multiple miRNA complementary sites in most genetically and
computationally identified targets of metazoan miRNA. It has been proposed that different
miRNA can regulate the same target and that exists a combinatorial control (Reinhart et al.,
2000; Abrahante et al., 2003; Lin et al., 2003).
We know that the complementary sites for the known metazoan targets reside in the 3’ UTR
of mRNA, in contrast with the target complementary sites in plants, that are located
throughout the transcribed regions of the target gene (see review: Bartel, 2004). It was
demonstrated that in metazoan the most important site of complementarity to the target on the
miRNA sequence is a short portion at the 5’ end of seven nucleotides, from residues 2 to 8.
Actually this short sequence is the most conserved among homologous metazoan miRNA
(Lewis et al., 2003; Lim et al., 2003), it was observed to be perfectly complementarity to
multiple 3’ UTR sites involved in post-transcriptional repression also in invertebrate (Lai,
2000), moreover this heptamer seems to be the most useful to productive prediction of target
mRNA and is the most important complementary site also in plant miRNA. We don’t know
why the complementarity to the 5’end is so universally important, but understanding the
mechanism of pairing of miRNA to the mRNA in the RISC will also help to reveal the
process of translational repression.
I-I-d Approaches to microRNA discovery (see review : Berezikov et al., 2006)
The first step to discover and understand the biology of miRNA is to isolate and identify the
miRNAs expressed in the cells and organisms of interest. Since the discovery of the first
miRNA, lin-4, in C. Elegans, many miRNAs have been identified or predicted in a wide array
of organism. In 2003, the rapid growth of the number of miRNA genes led to the creation of a
comprehensive an searchable database of published miRNA sequences via a web interface :
miRNA Registry (http://microrna.sanger.ac.uk/sequences) (Griffiths-Jones, 2004). This was
created with two objectives: to avoid to assign unique names to distinct miRNAs and to
provide a database for all miRNAs sequences, including the stem-loop sequences, the
genomic location, homologous sequences and possible target predictions. The miRNAs are
annotated with numerical identifiers based on sequence similarity. For homolog miRNAs in
different organisms, itm is usual to assign the same nameon the similarity of the 22-nt mature
sequence. Identical mature forms are assigned the same name and, if identical miRNAs are
produced from different genomic loci they are differentiated by suffixes, such as “miR-16-1”
and “miR-16-2”; if there are differences in one or two bases they are denominated with a
final different letter such as “miR-181a” and “miR-181b”. If two miRNA derive from the two
arms of the same precursor it is added to the miRNA name the suffix 5p and 3p to identify the
72
two different arms, until the data will confirm which form is predominantly expressed, while
the species less expressed is normally denoted by an asterix (Di Leva et al., 2006).
In October 2006 the miRNA Registry contained 4.361 entries from 40 organism including
viruses and mammals, counting 332 human miRNA (Croce, 2006).
It was necessary a uniform definition of miRNA to annotate new “candidate miRNA” like
true miRNA to prevent misclassification of other types of small non coding RNA like
miRNAs (see review: Berezikov et al., 2006).
MiRNAs were defined as non coding RNAs that fulfill the following combination of
expression and biogenesis criteria:
1) mature miRNA should be expressed as a distinct transcript of approximately 22 nt that
is detectable experimentally (by Northern blot analyses, cloning, real-time quantitative
PCR. in situ hybridisation, primer extension..);
2) mature miRNA should originate from a precursor with a characteristic secondary
structure, such as hairpin or fold-back, without any large internal loops or bulges, and
miRNAs should occupy the stem part of the hairpin;
3) mature miRNA should be processed by Dicer (Ambros et al., 2003).
The definition implies that miRNA should have a demonstrated function, however biological
function has been elucidated only for a few miRNA and the criteria established for miRNA
classification (Ambros et al., 2003) do not include the requirement of a biological role.
Instead, an optional but commonly used criterion is the phylogenetic conservation of the
mature miRNA, an indirect indication of a possible function. Strictly speaking the term
“candidate miRNA” should be used as long as the function of miRNA is unknown, but
practically evidences of expression of a 22-nt transcript and of the presence of an hairpin
precursor are sufficient to classify a sequence as a miRNA.
All approaches to discovering miRNAs are based on these definition and can be split in two
groups:
1) experiment-driven methods, in which the expression of small miRNA is first
experimentally established and structural requirements for the precursor are searched
later by bioinformatic tools;
2) computation-driven approaches, in which candidate miRNA are first predicted in
genome sequence using structural features and expression is demonstrated later
experimentally (Berezikov et al., 2006).
In the beginning forward genetics methods were able to identify the first miRNAs genes, lin-4
and let-7, but since then only four additional miRNAs, bantam, miR-14 and miR-278 in
Drosophila melanogaster (Brennecke et al., 2003; Xu et al., 2003; Teleman and Cohen, 2006)
and lys-6 in C.elegans (Johnston and Hobert, 2003), have been discovered by forward
genetics approaches. The inefficiency of this methods can be explained by the difficulties in
targeting by spontaneous or induced mutagenesis the miRNA sequence and specially the
“seed sequence” of 7 nucleotide determinant for their functionality, considering their
73
redundancy (Abbott et al., 2005), which often tolerate mutations that does affect the ‘seed
sequence’ and does not result in strong variation in the phenotype of the mutants.
The preferred approach to the identification of miRNAs is to sequence size-fractionated
cDNA libraries. An initial protocol useful for cloning small interfering RNA (Elbashir et al.,
2001) was shown to be adapt also for identifying many miRNA (Lagos-Quintana, 2001).
Later little variations of it were developed independently (Lau et al., 2001; Lee and Ambros,
2001) but all these successful protocols follow the same principles (Aravin and Tuschl, 2005).
In the main lines an RNA sample is separated in a denaturing polyacrylamide gel and the size
fraction corresponding to the miRNA is recovered. Then 5’ and 3’ adapters were attached to
the RNAs and a RT-PCR is carried out. The fragments are cloned into vectors to create a
cDNA library. The clones are sequenced and analyzed to search the genomic origin of the
small RNAs. Bioinformatic tools are required to check if the hairpin precursor is encoded in
the genomic regions where the small RNAs have been localized and if this precursor is
conserved in other species. This analyses is complicated because hairpin structure are
common in eukaryotes and are not a unique features of miRNAs (Lin et al., 2006; Shen et al.,
1995) and moreover miRNAs should be distinguished from others types of endogenous small
RNAs (Aravin and Tuschl, 2005; Kim and Nam, 2006).
The limit of cloning protocol is the difficulty to discover miRNAs that are expressed at a low
level, in specific stages or specific cell types. Moreover some miRNAs could be hard to clone
due to physical properties correlated to sequence composition or post-transcriptional
modifications, such as editing or methylation (Luciano et al., 2004; Yang et al., 2006).
Surveying genomic sequences to predict miRNAs became popular after initial cloning efforts
generated sufficient information about miRNA properties to recognize a set of distinctive
miRNA features (Berezikov and Plasterk, 2005; Bentwich, 2005). On the basis of the
particular features of miRNAs different approaches have been developed to predict miRNA,
but all of them use secondary structure information, many rely on phylogenetic conservation
of both miRNA sequence and structure, other methods asses the thermodynamic stability of
hairpins and refers to sequence and structure similarity of known miRNAs, or search miRNAs
on the genome near known miRNAs already localized.
Many software, like MiRScan, snarloop, miRSeeker were developed to search miRNA on the
basis of conservation criteria referring to hairpins structure. The genome of C. Elegans (Lim
et al., 2003; Grad et al., 2003), of D. melanogaster (Lai et al., 2003) and the human (Lim et al.,
2003) were analysed and the number of predicted miRNA strongly extended on the basis of
haipin sequence similarity to experimentally confirmed miRNAs. The potential target
sequences of miRNAs have been analyzed in the 3’UTR of genes in search of complementary
sequence to ‘seed sequences’ of known miRNAs. Using conserved motifs that did not match
to any known miRNAs it was possible to predict other miRNAs candidates in human (Xie et
al., 2005). Similar approaches have been recently applied to the prediction of miRNAs in
A.Thaliana (Adai et al., 2005), flies and worms (Chan et al., 2005).

74
On the basis of the lower free energies of folding of miRNAs comparing to tRNAs and
rRNAs (Bonnet et al., 2004) was set a new software that combines thermodynamic stability
criteria with conservation criteria, Rnas (Washietl et al., 2005a, 2005b), that was successful to
predict additional miRNAs in various organisms (Hsu et al., 2006; Missal et al., 2006).
Recently other alignment-type methods have been develop to identify homologs of known
miRNAs “aligning” potential miRNA with known one at both sequence and structural level
(Legendre et al., 2005; Nam et al., 2005; Wang et al., 2005).
All methods that rely on phylogenetic conservation can not predict non conserved miRNAs.
For this reason some new ab initio approaches were developed that use only intrinsic
structural features of miRNAs and not external informations (Bentwich et al., 2005; Sewer et
al., 2005; Xue et al., 2005; Pfeffer et al., 2005). Each of these methods builds classifiers that
can measure how a candidate miRNA is similar to known miRNAs on the basis of several
features, such as free energy of folding, length of the perfect longest stem, average size of
symmetrical loops, proportion of different nucleotides in the stem, etc..(Sewer et al., 2005), to
which a model assigns different weights and an overall score result is measured for each
candidate miRNA.
All these computationally predicted miRNAs need to be validate experimentally. Validation
approaches can be split in two categories: those that demonstrate only miRNAs expression,
like Northern blot analyses (Lagos-Quintana et al., 2001; Lau et al., 2001; Lee and Ambros,
2001) and in situ hybridization (Wienholds et al., 2005; Kloosterman et al., 2006; Nelson et
al., 2006), and others determine the exact sequence of the mature miRNA in the precursor
sequence, like cloning strategy and primer extension assay (Seitz et al., 2004) or RNA-primed
array-based Klenow extension (RAKE) (Nelson et al., 2004).
I-I-e Strategy to determine biological functions (see review : Krutzfeldt et al., 2006)
The elucidation of the general mechanism of miRNA function in the regulation of gene
expression suggests a gene regulatory model in which nuclearly encoded genetic information
is not only transcribed and translated into proteins, but at the same time regulates these
processes through non coding miRNA. This paradigm adds a new level of regulation and fine
control of gene expression that is likely to be important for the maintenance of many, if not all,
cellular functions.
In spite of our ability to identify miRNA and elucidate their biogenesis and the basic
mechanism of actions, very little is known regarding miRNA function. With the near
completion of the miRNA inventory the focus is shifting to elucidation of their biological role.
For this purpose other scientific aspects have been studied, and the corresponding technology
have been developed, including the analyses of the possible miRNA target by bioinformatics
prediction algorithms, preliminary inspections of the localization and the effects of their
75
expression by in vitro or in vivo expression studies, by reporter assays, in situ hybridizations,
over expression and silencing technologies.
Different complementary strategies can be useful to begin to study a miRNA of interest: it is
possible to examine the profile of its expression in different cellular contexts, and indirectly
make a first hypothesis on its possible role, predict or identify its molecular target, strictly
connected to its function, before over expressing or silencing a miRNA in vivo and in vitro,
that is a task that requires a defined model and precise technical competences, even if the
technology is now available.
From the first study in C. Elegans and in D. Melanogaster was evident that miRNA has not
only-spatio-temporal, but also tissue and cell-type specific expression. For this reason many
commercially miRNA microarrays including the content found in Sanger miRBase 7.0
(http://microorna.sanger.ac.uk) were developed making it possible to monitor tissue-specific
miRNA expression and regulatory changes in developmental, physiological and disease states.
First results using oligonucleotide microarray confirmed the existence of several tissue-
specific miRNAs (BaskerVille and Bartel, 2005; Barad et al., 2004; Nelson et al., 2004;
Thomson et al., 2004) that may suggest that some of them have an organ- or cell type-
specific functions. Microarrays have also been used to study miRNA expression profile
during differentiation of cells, such as myoblasts (Chen et al., 2006) and preadipocytes (Esau
et al., 2004) or in disease state, most notably human cancer, such as in B cell chronic
lymphocytic leukemia (Calin et al., 2002), in colon carcinomas (Michael et al., 2003), in
small lung carcinomas (Johnson et al., 2005; Takamizawa et al., 2004). It was shown for few
specific miRNA that their level of expression can decrease or increase typically in a particular
differentiation cellular stage or neoplastic tissue raising the idea that miRNA profiling could
contribute to more precise tumor classifications and predict therapeutic outcomes in the future.
Several techniques have been developed to visualize miRNA expression in vivo. In C. elegans,
it was possible to study the activity of the miRNA promoter of miRNAs using reporter
cassette that contains the miRNA promoter regions fused with the sequence of the green
fluorescence protein (GFP) or β-galactosidase, the reporter gene (Johnson et al., 2003). A
method to detect the presence of a specific miRNA in tissues uses the “sensor” transgene,
which constitutively express a reporter gene that contains sequences complementary to the
miRNA of interest in its 3’ UTR region (Mansfield et al., 2004). In this case in the tissues or
cells in which the miRNA is expressed the activity of the reporter gene will be blocked. This
method has potentially excellent spatial temporal resolution, but it is not known if it can be
used for the detection of low expressed miRNAs. The most frequently applied method to
visualize miRNA expression to date is in situ hybridization and in particular a variation of it
that uses special probes Locked Nucleic Acid- (LNA) modified probes able to detect short
sequences like miRNAs. This technique has already been applied successfully to identify
miRNA expression in mouse embryos (Kloostermam et al., 2006).
76
Even if several independent groups have established computational algorithms designed to
predict target genes of miRNA sequences (John et al., 2004; Kiriakidou et al., 2004; Krek et
al., 2005; Rajewsky, 2006; Lewis et al., 2003) there is a big lack of experimental evidence
that validate this sequences like the corresponding target of miRNAs.
Moreover, also due to the functional mechanism of miRNA, that do not require necessary a
strong degree of sequence complementarity to the target and that do not exclude binding of
multiple miRNA to the same mRNA, the computational prediction of a target is difficult and
on average 200 genes have been predicted to be regulated by a single miRNA (Krek et al.,
2005; Lewis et al., 2003).
To date several methods have been established to show experimentally the miRNA regulation
of a putative target. One of the most used is the luciferase reporter construct, containing the
target 3’UTR with the putative binding site downstream of the reporter coding region. These
constructs are used to transfect cells expressing the relevant miRNA, along with vectors
carrying mutant versions of binding sites. Evidence for miRNA activity can be demonstrated
if wild-type reporters have less activity than their respective mutants. One other approach uses
antisense 2’-O-methyl modified oligoribonucleotides to inhibit miRNA expression and
provokes some loss-of-function effect (Chen et al., 2006; Poy et al., 2004; Schratt et al., 2006).
Another approach tries to determine miRNA target increasing the intracellular concentration
of a miRNA by transfection of homologous synthetic short interfering RNAs or recombinant
adenoviral infection and measuring differential gene expression by microarray (Krutzfeldt et
al., 2005; Lim et al., 2005).
Induced expression of miRNAs was the initial step that identified miRNA function in many
model organisms or mammalian cell systems.
Transient overexpression in cell-based assays is easily achieved by transfection of a double-
stranded RNA similar to Dicer cleavage product, but long-term overexpression in cultured
cells or mouse models depends on the transfection of a plasmidic vector that carry a specific
construct for the expression of a miRNA. This construct is relatively simple and is the same
used for protein-coding mRNA; introducing the sequence of the precursor together with a
strong constitutive promoter is sufficient to overexpress a miRNA (He et al., 2005; Hayashita
et al., 2005). It is possible to introduce these vectors into adenovirus or retrovirus (Chen et al.,
2004) system and then transfect cultured cells or inject them in mouse tissues in vivo. Tissue-
specific overexpression of a miRNA in vivo can be obtained also generating transgenic mice,
even if the technology requires time and higher competences.
Studies that are based only on overexpression must be taken with caution because
misexpression of miRNA could target genes otherwise not affected in physiological context
and the results should be confirmed by loss-of-function experiments.
The technologies to silence miRNA and generate loss-of-function mutants can be divided in
genetic and nongenetic approaches.
77
The first class developed with the parallel development of DNA recombinant technology and
the recent generation of mutant mice has been invaluable in the elucidation of miRNA gene
function.
In particular three class of experiment can be design to disrupt miRNA-mediated gene
regulation and infer their possible role.
1) The generation of mice with mutated alleles of Dicer1 leads to the deficiency of all
mature miRNAs (Kanellopoulou et al., 2005; Harfe et al., 2005; Harris et al., 2006); the
phenotypes analysed show the important collective functional role of miRNAs in many
developing tissues, but can not provide information on the exact role of individual
miRNA. For this reason the injection of a singular miRNA in Dicer-null mutant can
restore the expression of a specific miRNA and discover the contribution of individual
miRNA. This approach has been successful in zebrafish (Giraldez et al., 2005).
2) The generation of a knockout mutant for a miRNA that exist in cluster can interfere with
the
proper folding and processing of the polycistronic transcript, affecting the expression of
neighboring miRNAs and provoking a visible changing in the phenotype (Ying et al., 2005).
To date there is no evidence for any miRNA knockout in any animal models.
3) The generation of mutants with mutating binding sites in the 3’UTR of the target gene,
but also this approach is not actuated till now.
Nongenetic approaches to silence miRNA function use the transfection or injection of
synthetic oligonucleotides that act like chemical inhibitors of miRNAs.
1) 2’-O-methyl-modified oligoribonucleotides complementary to the miRNA act irreversibly
like stoichiometric inhibitors and have been used in cell lines (Meister et al., 2004), C.
elegans (Hutvagner et al., 2004) and D. melanogaster (Leaman et al., 2005).
2) ‘antagomiRs’, cholesterol-conjugated single-stranded RNAs complementary to miRNAs
have been injected in mouse tissues in vivo (Krutzfeldt et al., 2005). This silencing is dose-
dependent, can be observed within 24 hours and last 3 weeks. Even if it is not clear till now in
which way the cells take up antagomiRs this approach can allow the study of individual
miRNA. This technology was successful in the mouse for the functional study of miR-122.
4) Recently new antisense oligonucleotides, (ASOs) (Esau et al., 2006), unconjugated
single-stranded RNAs that carry complete phosphorothioate backbones and 2’-O-
methoxyethyl modifications, have been developed to target miRNAs in vivo and for the
moment they have been used only in liver tissues, confirming the results about miR-122
obtained with the ‘antagomiRs’.
78
I-I-f MiRNAs and Cell differentiation in mammalian development (see review : Song
and Tuan, 2006)
Animal development requires the establishment of a highly regulated spatiotemporal gene
expression network in order to convert the totipotent zygote into an animal containing
various specialized tissues functioning in a concerted manner (Lee et al., 2006). One
important feature of this regulatory scheme is the specific expression of factors that are
required for each developmental window. However, it is also crucial to inhibit the
expressions of genes that are not required for particular developmental stages or which may
promote alternative differentiation pathways (O’Rourke et al., 2006).
At a cellular level the tissue development is produced by cell differentiation. The ability of a
precursor cell to differentiate into different cell types actually depends on upregulation of
factors required for one lineage combined with the downregulation of others specific for a
different fate.
It has long been thought that this process is regulated primarily at the level of transcription,
but it is also possible that posttranscriptional mechanism are required to drive cell
commitment. miRNAs may serve as a switch to determine the developmental program of
precursor cells; alternatively they may function to maintain the identity of differentiated cell
types (O’Rourke et al., 2006).
Here I will summarize the recent data on miRNA involved in cellular differentiation during
mammalian development.
Embryonic stem (ES) cells are totipotent cells that resides in the inner cell mass of the
blastocysts that have the capacity to generate precursor cells of endoderm, ectoderm and
mesoderm. In vitro, ES murine and human cells lines can be induced to generate germ and
somatic cells of both the three layers, reproducing part of the in vivo embryonic development.
ES cells present great potential in clinical and biological applications, even if the molecular
mechanism governing their differentiation is poorly understood. A possible role for miRNA
came from the identification of ES cell-specific miRNAs in mouse screening of two miRNA
libraries from undifferentiated and differentiated mouse ES cells (Houbaviy et al., 2003). 6
miRNAs (miR-290, miR-291-as, miR-292-as, miR-293, miR-294, miR-295) were found
expressed in pluripotent cells and silenced or downregulated after differentiation. Later
miRNA libraries from human ES cells were analysed and 17 novel miRNA were identified
(Suh et al., 2004). 12 of them were found localized in two genomic cluster that are
transcribed in two polycistronic primary transcript whose level decreases when ES cells
develop into embryonic bodies, suggesting the specificity of these miRNAs for
undifferentiated cells.
miRNAs play a key role also in maintaining the differentiation state of pluripotent ES cells
as demonstrated by the loss of stem cells and early lethality of Dicer-null mice embryos
79
(Murchison et al., 2005). In vitro Dicer-null ES cells did not differentiate indicating that lack
of Dicer and endogenous miRNAs compromise the differentiation potential of ES cells.
The first indication of the involvement of miRNAs in limb development in mammals came
from an in situ hybridization study on mouse embryos (Schulman et al., 2005). An ortholog
of the worm lin-41 was detected and localized in the embryo in the posterior region of the
limb bud, while in embryo at the same stage let-7, the corresponding negative regulator, is
expressed in the anterior region of the limbs. Their reciprocal expression patterns implied that
they play a role in limb development.
Using microarray analyses Hornstein et al. (2005) identified a miRNA, miR-196, which is
preferentially expressed in the hindlimb. It was shown that miR-196 can direct the cleavage
of a known transcription factor that mediate anteroposterior polarity in fore- and hindlimb
buds, Hoxb8, only in the hindlimb, but not in the forelimb, regulating the limb development.
Adipocyte differentiation can be reproduced in vitro using primary subcutaneous
preadypocytes
that exposed to hormonal stimuli develop in mature adipocytes. Esau et al. (2004) use this
systems to assess the effects of several miRNAs on adypocyte differentiation transfecting
preadipocytes with 2’-O-methoxy-ethyl phosphorothioate-modified antisense RNA
oligonucleotides targeting specific miRNAs. They found that miR-143 is involved in the
maturation of preadipocytes, like it was confirmed by its upregulation in differentiated
adipocytes. ERK5 is probable the gene target and its protein level is elevated in cells with
decreased miR-143 expression. This was the first time that antisense oligonucleotides were
used successfully to determine the function of miRNAs.
Cardiomyocyte differentiation and cardiogenesis require sequential activation and repression
of transcriptional factors such as serum response factor (SFR), MyoD, Mef2. Zhao et al.
(2005) identified, by a combination of in silico and experimental approaches, miR-1-1 and
miR-1-2, whose expression was specific of in the heart and skeletal muscle of adult mice.
Overexpression of miR-1 demonstrated is essential role in cardiogenesis and its molecular
target, Hand2. It was also analysed the regulation of its expression and it was found that
potential binding sites exist in the enhancer region of miR-1 for the transcription factors Mef2,
SFR and MyoD. A model was proposed in which miR-1 functions in the SFR-myocardin-
dependent pathways in cardiac progenitor cells and is responsive to MyoD/Mef2 in skeletal
muscle precursor. Recently another miRNA, miR-181, was discovered to be upregulated
during terminal differentiation of myoblasts (Naguibneva et al., 2006). Loss-of-function
assays in vitro using antisense oligonucleotide against miR-181 completely abolished the
myoblast differentiation of cells. Since miR-181 expression was not detected in resting
muscle cells in vivo it is probable that it plays a role only in the establishment of the
differentiated phenotype, but not in its maintenance.
80
Regulation of hematopoietic differentiation is a complex process that involves the
commitment, proliferation, apoptosis and maturation of hematopoietic stem/progenitor cells
and a variety of regulatory molecules including miRNA. Several miRNA were detected
preferentially in specific hematopoietic cell lineages: miR-181 in differentiated B
lymphocytes, miR-142s in B-lymphoid and myeloid, miR-223 in myeloid (Chen et al., 2004).
In particular miR-181 seems to be a positive regulator for B-cell differentiation, as its ectopic
expression led to a doubling of cells in the B-lymphoid lineage without changing of T-
lymphoid lineage both in vitro and in vivo.
Mice with defective Dicer function show abnormal epithelium morphogenesis, both in the
skin and in the lung. Yi et al. (2006) saw that mice with defective Dicer activity in their skin
progenitor cells exhibited abnormal epidermis and hair follicles. In a other study Harris et al.
(2006) observed that Dicer inactivation led to dramatic branching effects in the lung. An
increased and prolonged cell death was observed in both skin and lung epithelia in the mutant
mice, but it is not known how this
contributes to the abnormal morphogenesis and which are the miRNA responsible.
Several miRNAs were found exclusively (miR-9, miR-142a, miR-124b, miR-135, miR-153,
miR-183, miR-219) or highly expressed (miR-9*, miR-125a, miR-125b, miR-128, miR-132,
miR-137, miR-139) in mouse and human brain tissues and some are also upregulated in
embryonal carcinoma cells (Sempere et al., 2004). Overexpression and inactivation of three
of them, miR-124a, miR-9, miR-125b, in neuronal progenitor cells dramatically change the
relative fraction of astroglial-like cells and neuronal cells, confirming their critical role in
neuronal differentiation.
To explain their mechanism of function it was proposed that they promote neuronal
differentiation by suppressing the expression of non-neuronal transcripts. Experiment of
overexpression and inactivation of the same miRNAs led to trace a model in which miR-125a
and miR-125b are responsible of neuronal differentiation targeting the 3’UTR of lin-28 and
altering both its translational efficiency and its mRNA levels. It was also demonstrated
(Krichevsky et al., 2006) that the phosphorylation state of STAT3, a transcription factor that
when phosphorylated inhibits neuronal terminal differentiation and promotes glial-like cells
differentiation, is controlled by miR-9. To balance the formation of neuronal and glial cells in
mammalian brain, expression of miRNA is tightly controlled. It was shown that the RE1
silencing transcription factor, REST, can switch the differentiation lineages cells between
neuronal and glial cells and that it is correlated to the expression of the miRNA studied.
Moreover miR-134 was found to be a negative regulator of dendritic spine development in
hippocampal neurons and the protein kinase Limk1 was proposed as its target (Schratt et al.,
2006).
81
I-I-g MiRNAs and cancer (see review : Esquela-Kerscher and Slack, 2006)
Cancer is caused by uncontrolled proliferation and inappropriate survival of damaged cells,
which results in tumour formation. Many regulatory factors switch on or off genes that direct
cellular proliferation and differentiation. Damage to these genes, which are referred to as
tumor-suppressor genes and oncogenes, is elected for in cancer. Recent evidence indicates
that miRNAs might also function as tumor suppressor and oncogenes. They have been shown
to control cell growth, differentiation and apoptosis, consequently impaired miRNA
expression has been implicated in tumorigenesis (Esquela-Kerscher and Slack, 2006).
Components of the miRNA-machinery have been found involved in tumorigenesis. For
example, expression of Dicer has been shown to be downregulated in lung cancer (Karube et
al., 2005), suggesting a potential indirect role of Dicer in tumor formation that result from the
collective reduction of miRNAs. The Argonaute proteins have also been associated with
various cancer. Three
human Argonaute genes are frequently deleted in Wilms tumors of the kidney and have been
also associated with neuroectodermal tumors. In particular it is supposed that Argonaute 1
(AGO1) is involved in developing lung, kidney and renal tumors. An additional human
argonaute gene, HIWI, maps to a genomic region associated with testicular germ-cell cancer
and might normally control the proliferation and maintenance of germ cells.
The biological role of only a small fraction of identified miRNAs have been elucidated to date.
These miRNAs regulate cancer-related processes such as cell-growth and tissue
differentiation and therefore might themselves function as oncogenes.
Interestingly the mammalian homologues of lin-4 and let-7 have been shown to control cell
proliferation in human cell lines (Lee et al., 2005; Takamizawa et al., 2004) and are also
associated with various cancer (Johnson et al., 2005; Calin et al., 2004; Iorio et al., 2005;
Sonoki et al., 2005). In D. Melanogaster, bantam induces tissue growth by both stimulating
cell proliferation and inhibiting apoptosis (Brennecke et al., 2003; Hipfner et al., 2002), miR-
14 suppress strongly apoptosis (Xu et al., 2003), and these are features of oncogenes. Other
characterized miRNAs have essential functions during development and differentiation of
cells into various tissues.
A recent study showed that about 50% of annotated human miRNAs are located in areas of
the genome, known as fragile sites, that are associated with cancer. For example miR-125b-1
is located in a region that is deleted in a subset of patients with breast, lung, ovarian and
cervical cancers (Calin et al., 2004) and recently it has also been associated with leukaemia.
The first indication that miRNAs could function as tumor suppressors came from a report that
showed that patients diagnosed with the B-cell chronic lymphocytic leukaemia, (CLL), often
82
have deletions or downregulation of two clustered miRNA genes, miR-15a and miR-16-1
(Calin et al., 2002). Deletions within this locus occur also in 50% of mantle cell lymphomas
cases, 16-40% of multiple myelomas and 60% of prostate cancers cases. It was predicted that
a tumor-suppressor gene reside in this region. Later Cimmino et al. (2005) showed that miR-
15 and miR-16-1 negatively regulate BCL2, an anti-apoptotic gene that is often overexpressed
in many types of human cancers, including leukaemias and lymphomas, supporting a tumor-
suppressor role for these two miRNAs.
Additional studies have shown a strong correlation between abrogated expression of miRNAs
and oncogenesis. For example, miR-143 and miR-145 are significantly reduced in colorectal
tumours (Michael et al., 2003).
The let-7 miRNAs family were the first group of miRNAs shown to regulate the expression of
an oncogene, the Ras gene. Ras protein are membrane associated GTPase signalling proteins
that regulate cellular growth and differentiation. About 15-30% of human tumors possess
mutations in Ras genes. The 12 human homologous miRNAs of let-7 family map to fragile
sites associated with
lung, breast, urothelial and cervical cancers (Calin et al., 2004). In particular the transcripts of
certain let-7 were downregulated in human lung cancer (Takamizawa et al., 2004). Later
studies in C. Elegans found that the 3’UTR of Ras genes contains multiple complementary
sites for the let-7 family and that let-7 and Ras expression is inversely correlated in tumours
(Grosshans et al., 2005; Johnson et al., 2005).
The MYC oncogene, which encodes a basic helix-loop-helix transcription factor, is often
mutated or amplified in human cancers and has been shown to function as an important
regulator of cell growth owing to its ability to induce both cell proliferation and apoptosis
(Pelengaris et al., 2002). It seems that there is a correlation between miRNAs and the
increased expression of MYC in the development of B-cell malignancies. MiR-142 and miR-
155 are associated to MYC overexpression in the development of B-cell cancers, in Burkitt
and Hodgkin lymphoma. MiR-155 is also involved in breast carcinomas, indicating other
roles for this miRNA outside of the hematopoietic system. Recently He et al. (2005) and
O’Donnell et al. (2005) describe a more direct relationship between miRNAs, MYC and
cancer identifying a transcript that was preferentially upregulated in cancers and that encode
the miR-17-92 clusters. By overexpression experiment it was shown that miRNAs within the
miR-17-19b-1 cluster function cooperatively as oncogenes, possibly by targeting apoptotic
factors activated in response to MYC overexpression and thus indirectly provoking
uncontrollable cell proliferation. Surprisingly two miRNA gene in this cluster were shown to
block indirectly the cell proliferation acting on the transcription factor E2F1. The double
nature of the miR-17-92 cluster, the tumor-suppressing and the oncogenic one, emphasizes
the complexity of cancer progression as well as the intricacies of miRNA-mediated gene
regulation. These results might also reflect the fact that a single miRNA can control many
unrelated gene targets, resulting in the control of opposing activities such as cellular
proliferation and differentiation. A recent report (Felli et al., 2005) describes the ability of
83
miR-221 and miR-222 to downregulate the KIT oncogene and future studies will reveal that
miRNA function as key regulators of many cancer-related genes like BCL2, Ras, E2F1, MYC
and KIT. Therefore miRNAs might be powerful drug target that could be used in a broad
range of cancer therapies.
As Northern blot and microarrays analyses have already been used to determine tissue
specific ‘signatures’ of miRNA genes in humans (Pasquinelli et al., 2000; Lagos-Quintana et
al., 2003; Lim et al., 2003; Liu ret al., 2004; Nelson et al., 2004; Thomson et al., 2004;
Krichevsky et al., 2003; Miska et al., 2004; Sempere et al., 2004; SmiRnova et al., 2005; Sun
et al., 2004; Monticelli et al., 2005; Babak et al., 2004), researchers are now using miRNA-
expression signatures to classify cancers and to define miRNA markers that might predict
favourable prognosis (Takamizawa et al., 2004; Iorio et al., 2005; Calin et al., 2002; Lu et al.,
2005; Ciafre et al., 2005; Chan et al., 2005; He et al., 2005; O’Donnel et al., 2005; Calin et al.,
2005).
A recent report from Lu et al. (2005) found that the expression profile of a relatively few
miRNAs (200) can be sufficient to accurately classify human cancers.
Following comparison of the expression level of miRNAs in normal and tumorous tissues it
was shown that in general miRNA are downregulated in tumorous tissues, supporting a model
in which miRNAs drive cells in more differentiated state and can be marker of the degree of
cell differentiation. These studies define miRNA more like oncomiRs and imply that
abnormalities in miRNA expression might directly result in de-differentiation of cells,
allowing tumour formation (Esquela-Kerscher and Slack, 2006).
The emergence of miRNAs as important cancer-prevention genes is likely to have a large
effect on gene therapies designed to block tumour progression. Large-scale expression screen
to compare miRNA levels in tumours versus normal tissues will be useful in identifying novel
miRNAs involved in cancer. In the future the administration of synthetic anti-sense
oligonucleotides that encodes sequences complementary to oncogenic miRNAs, the anti-
miRNA-oligonucleotides (AMOs), could inactivate miRNAs in tumours or slow their growth.
The antagomiRs, that are AMOs conjugated with cholesterol, have already used to inhibit
miRNA activity in various organs after injection into mice (Krutzfeldt et al., 2005), and might
be a promising therapeutic agents. At contrary, techniques to overexpressed tumor-suppressor
could be used to treat specific tumours. More development of these methods is needed before
miRNAs treatment can move from the laboratory bench to the bedside. Even if we do not
know if miRNAs will become a ‘magic bullet’ in the future, research in this area will
undoubtedly provide insight into the underlying mechanism of oncogenesis.
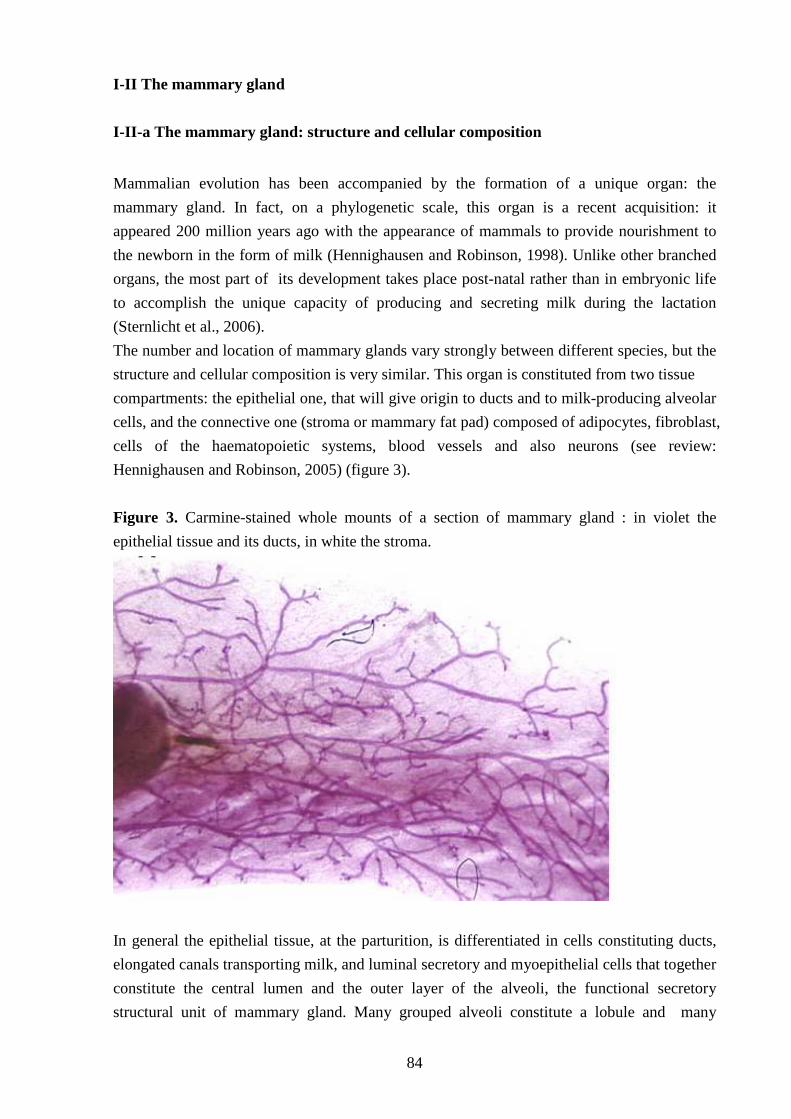
84
I-II The mammary gland
I-II-a The mammary gland: structure and cellular composition
Mammalian evolution has been accompanied by the formation of a unique organ: the
mammary gland. In fact, on a phylogenetic scale, this organ is a recent acquisition: it
appeared 200 million years ago with the appearance of mammals to provide nourishment to
the newborn in the form of milk (Hennighausen and Robinson, 1998). Unlike other branched
organs, the most part of its development takes place post-natal rather than in embryonic life
to accomplish the unique capacity of producing and secreting milk during the lactation
(Sternlicht et al., 2006).
The number and location of mammary glands vary strongly between different species, but the
structure and cellular composition is very similar. This organ is constituted from two tissue
compartments: the epithelial one, that will give origin to ducts and to milk-producing alveolar
cells, and the connective one (stroma or mammary fat pad) composed of adipocytes, fibroblast,
cells of the haematopoietic systems, blood vessels and also neurons (see review:
Hennighausen and Robinson, 2005) (figure 3).
Figure 3. Carmine-stained whole mounts of a section of mammary gland : in violet the
epithelial tissue and its ducts, in white the stroma.
In general the epithelial tissue, at the parturition, is differentiated in cells constituting ducts,
elongated canals transporting milk, and luminal secretory and myoepithelial cells that together
constitute the central lumen and the outer layer of the alveoli, the functional secretory
structural unit of mammary gland. Many grouped alveoli constitute a lobule and many
85
lobules are grouped in many bigger lobuloalveolar units. This branched structure is similar to
the lung structure.
Each alveoli has a spherical structure inside which a monolayer of epithelial cells secrete milk
in the central lumen. The milk is transported into the ducts by the contractile actions of
myoepithelial cells, and is delivered to the body surface through the nipple. The extensive
system of ducts and alveoli is embedded in the stroma, that supports the epithelial tissue and
provides nourishment to epithelial cells (see review: Hennighausen and Robinson, 2005).
In the mouse there are five pairs of mammary gland located just below the skin, which extend
from the thoracic (three pairs) to the inguinal (two pairs) regions of the animal along what is
termed the milk or mammary line (Richert et al., 2000). Apart a nipple and a ductal-alveolar
system, each gland has a limph node that is often used as a landmark when examining
histological sections or whole mounts (Russo IH and Russo J, 1996). There is a gradient of
differentiation among the glands, with the first thoracic gland being the least differentiated
and the fifth inguinal gland the most (Bolander, 1990).
I-II-c The development of mammary gland
The mammary gland is a dynamic organ the structure of which changes throughout the female
reproductive cycle. The development of the gland occurs in distinct stages, defined
fundamentally by hormones, that are connected to the sexual development and reproduction:
embryonic, prepubertal and pubertal stages, pregnancy, lactation and involution (see review:
Hennighausen and Robinson, 1998).
In the main lines at birth the anlage consists of a few rudimentary ducts in the vicinity of
nipple, pronounced ductal outgrowth and branching commences at puberty, in pregnancy and
expanded lobulo-alveolar compartment develops. Functional differentiation of the secretory
epithelium coincides with parturition and large amounts of milk are produced and secreting
during lactation.
After weaning of the young the entire alveolar epithelium compartment is remodelled to
resemble a virgin-like state. With each pregnancy a new round of lobulo-alveolar
development occurs.
The epithelium and the surrounding stroma are derived from ectoderm and mesoderm,
respectively (Parmar and Cunha, 2004).
In mice the mammary gland first appears embryonically as an epithelium bud that penetrates
the underlying mesenchyme. The first morphological signs of mammary rudiments are lens-
like placodes that form around embryonic day 11 and protrude slightly from the body wall
(Robinson, 2004). This rudiment becomes bulb-shaped, they elongates and invades the
86
mesenchym to form a simple ductal tree with several branching ducts. This first phase of
development is indipendent of hormonal signals (Richert et al., 2000).
In mice at birth the mammary gland consists of the epithelial cords and the stroma. While the
first one is rudimentary (Topper and Freeman, 1980; Russo IH and Russo J, 1996) the stroma
is thick and dense around epithelial structures and consists of eosinophilic fibrous connective
tissue and fibroblast and in the early stage of development is filled with large adipocytes. Also
present are lymphatics and blood vessels, the last will increase in number during pregnancy
and lactation (Matsumoto et al., 1992).
The period of most rapid growth occurs during puberty from approximately 3-6 weeks of age
in the mouse. The ducts lengthen and branch to form secondary and tertiary ducts that
ultimately extend to fill the mammary fat pad by approximately 3 months of age. The terminal
end buds (TEBs) appear at 3 weeks at the tips of growing ducts and are the sites of highest
epithelial proliferation in the gland (Richert et al., 2000). From this bulbous structure cells are
capable to migrate, to proliferate and differentiate in luminal and ductal epithelial cells
(Daniel and Silberstein, 1987). This migration and proliferation result both in elongation of
ducts and invasion of the fat pad; the differentiation in the TEBs is also responsible of
branching (Gordon and Bernfield, 1980; Silberstein and Daniel, 1982) and formation of
lateral and alveolar buds, that eventually subdivide to form rudimentary alveolar structure in
the post-pubertal glands, after 10-12 weeks of age, in response to cyclic secretion of ovarian
hormones at each estrous cycle (Andres and Strange, 1999).
The peak of mammary differentiation occurs during the 19-21 days of pregnancy and
culminates with formation of alveoli and a fully lactating gland at parturition (Nandi, 1958).
In the beginning of pregnancy, a massive proliferation of ductal branches and the formation of
alveolar buds, like in the postpubertal stage, could be observed. The epithelial to adipocyte
ratio increase.
During the second half of pregnancy the alveolar buds progressively cleave and differentiate
into individual alveoli that in the late pregnancy fill the majority of the fat pad. By the day 18
of pregnancy the alveolar epithelial cells are producing milk proteins and lipid, in preparation
for lactation. The amount of stroma is greatly decreased, allowing more contact of the
epithelium with adipocytes (Neville et al., 1998; Elias et al., 1973).
As lactation begins the milk in the lumen of alveoli is forced into the ducts (Asch HL and
Asch BB, 1985; Richardson, 1949; Dulbecco et al., 1986), the fat in the adipocytes is
metabolized and the alveoli expand to completely fill the gland (Neville, 1999). In normal
condition the process of lactation continues for approximately 3 weeks, until the pups are
weaned. At this moment the gland goes through a process of death and remodelling, the
involution. This process is initiated by milk stasis once milk removal has ceased (Quarrie et
al., 1996).
87
Forced weaning is often chosen as a model for involution because it is more controlled than
natural weaning and allows for more precise timing of structural changes.
In the first day of involution big morphological changes is not observed, except for the
flattening of the epithelium due to engorgement of the alveoli with milk. After 2 days the
gland begins the irreversible sequence of cell death and remodelling: the secretory epithelial
cells of the alveoli go in apoptosis and can be cleared by neighbouring epithelial cells or
invading macrophages (Burwen and Pitelka, 1980; Richards and Benson, 1971; Fadok, 1999).
At the day 4 the alveoli collapse into clusters of epithelial cells, while the adipocytes appear to
be refilling. The epithelium progressively disorganize and decrease while adipocytes and
stroma increase (Richert et al., 2000). At the day 6 of involution all the alveoli have collapsed
and both epithelium and stroma are rearranged (Strange et al., 1992) as the majority of cell
death has already occurred; the involution of alveoli continue till the day 21 of involution,
when the gland resemble the prepregnant mature gland.
With each pregnancy a new round of lobulo-alveolar development occurs, together with the
cycle of proliferation-secretion and involution of the epithelial tissue.
I-II-d Endocrine control on mammary development
While in embryo the initial stages of mammary development are independent of systemic
endocrine signals and rather depends on reciprocal signalling between the epithelium and the
mesenchym, the most part of development, that occurs after birth during pregnancy, is under
control of steroid and peptide hormones.
Both the role of systemic hormones and the influence of the stroma on mammary epithelium
have been recognized for some time (Mackie et al., 1987), actually the study of endocrine
control of mammopoiesis and lactogenesis began more than 100 years ago.
The first demonstration that ovarian steroids and pituitary hormones can determine breast
development and lactation came from an experiment of ovariectomy and transplantation of
ovaries in mouse in 1900 (Halban and Knauer, 1900). The responsible bioactive compounds
extracted were the progesterone and estrogen (Allen, 1924).
Later it became clear that other factors than ovarian hormones were required for
mammopoiesis and in 1928, Stricker and Grueter induced milk secretion artificially in
castrated virgin rabbits by injection of pituitary extract (Stricker and Grueter, 1928). Five
years later Riddle and collegues purified the prolactin from this extract (Riddle et al., 1933).
From the 1906 it was known that also the placenta can secrete mammotrophic substances
(Lane-Claypton and Starling, 1906), like placental lactogens, estrogens, progesterone and
gonadotrophins. It was shown for the first time in 1980, by the introduction of in vitro
mammary organ cultures, that it is a synergy of insulin, hydrocortisone and prolactin that
controls the differentiation of secretory mammary epithelium (Topper and Freeman, 1980). In
88
the same year steroid and peptide hormone receptors were cloned and in 1990 downstream
signalling components were identified, providing a basis for the understanding of signal
transduction pathways.
Ductal elongation in the first days after birth originates from a few small TEBs and is
probably the result of residual effects of maternal and fetal hormones (Hennighausen and
Robinson, 1998). The acceleration of ductal growth during puberty and the strong lobulo-
alveolar proliferation during pregnancy are controlled mainly by ovarian steroid hormones
(Daniel and Silberstein, 1987), respectively by the oestrogen and progesterone, that act
regulating cell proliferation and cellular turnover.
Progesterone is secreted in the beginning of pregnancy from the yellow body and its level is
low in the beginning, increases during this phase and decreases brutally near the parturition,
when the placenta and the yellow body involute (Martinez and Houdebine, 1994, chap.1).
The level of estradiol is high during puberty, in pregnancy the concentrations of estrogens
secreted from the placenta is lower, but sufficient to cooperate with the progesterone in
inducing the growth of lobulo-alveolar systems till the parturition, when estrogen level
decreases rapidly (Martinez and Houdebine, 1994, chap.1).
Both estrogen and progesterone have pleiotropic actions in the uterus, ovaries and the
hypothalamic-pituitary axis in regulation of sexual development. Since the need for a
functioning mammary gland is dependent on a successful pregnancy, the evolutionary process
use the same set of hormones for both developmental process (Hennighausen and Robinson,
2001).
The primary mechanism of steroid hormone action is through their specific nuclear receptors,
which function as transcription factors when bound to their ligands (Hennighausen and
Robinson, 2005).In post-natal mammary tissue not only most epithelial cell express receptors
for estrogen (ER) and progesterone (PR), but also cells of stroma.
Both ER and PR have two isoform, ERα and β, PR-A and -B, that have different functions
during the development of mammary gland.
Studies from knockout mice for ERα demonstrated that both stromal and epithelial ERα are
required for normal ductal elongation and outgrowth during puberty (Bocchinfuso et al.,
2000), even if ERα is not necessary for pregnancy alveolar expansion (Mueller et al., 2002).
Recombinant tissue experiment showed that estradiol elicits epithelial mitogenesis indirectly
through ER stromal cells (Cunha et al., 1997).
Knockout mice showed that is the PR-B form responsible of proliferative effects on
mammary epithelium, in particular to expansion of the alveolar compartment, and only in
minor part to ductal elongation and branching (Mulac-Jericevic et al., 2003).
In early pregnancy PR cells are found in closely proximity to proliferating cells, suggesting a
paracrine effects for progesterone. Progesterone seems to induce the production of a signal
that guides the proliferation of neighbouring cells. One possible candidate is the receptor
89
activator of nuclear factor kB (NF-kB)-ligand or RANK-L (Mulac-Jericevic et al., 2003),
belonging to the tumor necrosis factor (TNF) family.
It is now clear that estrogen induce the receptor for progesterone in epithelial cells, increasing
the sensibility of cells to this hormone.
Prolactin (PRL) signalling is essential for the proliferation and functional differentiation of
lobulo-alveolar structures during pregnancy (Topper and Freeman, 1980).
PRL is produced mainly by the lactotrophs in the anterior pituitary gland, even if also local
production of PRL by mammary epithelium has been reported (Vonderhaar, 1999).
Its level is relatively low during the most part of the pregnancy, but in the last part increases
and reaches high level at the parturition (Martinez and Houdebine, 1994, chap.1).
It has two roles in reproduction : the maintenance of corpus luteum, through which the
secretion of estrogen and progesterone is ensured, and the induction of mammary
development. After birth PRL is essential for maintaining lactation.
By the use of knockout mice the four independent components of prolactin pathway have
been identified : the ligand itself (Horseman et al., 1997), the receptor (PRLR) (Ormandy et
al., 1997), a transmembrane protein of the class I cytokine receptor family, the transcription
factors Stat5a (Liu et al., 1997) and Stat5b (Udy et al., 1997).
Binding of PRL to its receptor leads to receptor dimerization and the activation of the Janus
kinase 2 (JAK2), Fyn, a specific tyrosine kinase associated to the PRLR. JAK2
phosphorylates the two Stat5 isoforms that dimerize and migrate in the nucleus to induce
transcription of target genes, such as genes for the caseines and genes containing γ-interferon
activation sites (GAS). As well as Stat5, PRLR can signal through the mitogen-activated
protein kinase (MAPK) pathways and others that are dependent of JAK2 (Hennighausen and
Robinson, 2005).
Current evidence indicates that PRL present a generic signal that activates transcriptional
programmes that are shared between several cytokine receptors, and even if these pathways
have some cell-specific components they mediate general responses like proliferation and cell
survival. Moreover not only PRL activate STAT5, leading to a developmental program that
ends with the production of milk-secreting cells, but also other placental lactogens and
members of the EGF family, whose effecte is mediated by EGF receptor such as ERBB1 and
ERBB4, both necessary for mammalian development during pregnancy. In particular ERBB4
was shown to have a more prominent role in the functional luminal cell during lactation than
PRL has (Long et al., 2003).
The signalling pathway activated by hormones is quite understood, but the mechanism by
which it is negatively modulated is not well known. Recently evidences suggest that member
of the SOCS family are involved in the inhibition of PRL signalling (Linderman et al., 2001;
tonko-Geymayer et al., 2002).
90
Mammary development is not only controlled by systemics hormones, like estrogen,
progesterone and PRL, but also by peptide that are produced either in the stromal or epithelial
compartment, such as the osteoclast differentiation factor RANKL (Fata et al., 2000),
inhibinβB (Robinson et al., 1997) and member of the TGFβ family (Nguyen and Pollard et al.,
2000).
Several evidence from knockout mice suggest that RANKL, compared to PRL, induces
identical or related developmental programs during pregnancy (Humphreys et al., 1999; Fata
et al., 2000).
The growth factors, like transforming growth factor α and β, TGFα and TGFβ, mammary
derived growth factor 1, MDGF1, and epidermal growth factor, EGF, are present in the
mammary epithelium, secreted by the epithelial cells. The MDGF1, TGFα and the TGFβ are
autocrine and mitogenic factors secreted by epithelial cells in order to stimulate the
production of the collagen IV, an essential component of the basal membrane, where
epithelial cells lie and proliferate in a polarized way during the alveolar development
(Martinez and Houdebine, 1994, chap.1). Estrogen control indirectly the synthesis of collagen
IV and the activity of the growth factors throughout the degradation of the basal membrane
which supports epithelial cells.
At the moment of parturition strong changing in the concentrations of hormones occurs :
The progesterone, that negatively controls the PRL secretion and the local synthesis of caseins
and other milk components, disappears, while PRL reaches high concentration; the level of
estrogen increase progressively and stimulate the secretion of PRL; glucocorticoids are
produced to amplify the PRL action; other hormones not specific of the lactation are involved,
like the growth factor, (GH), and thyroid hormones (Martinez and Houdebine, 1994, chap.1).
I-II-e Role of extracellular matrix on mammary development
The multihormonal control on the mammary epithelium development and on the secretion of
milk proteins was observed and studied relatively early due to the fact that the glands could be
analysed easily in vivo (Dembinski and Shiu, 1987; Houdebine et al., 1985; Neville and
Neifert, 1983; Topper and Freeman, 1980). However it must be recognized that a substantial
proportion of epithelial hormonal responses reflects the modulation imparted by a complex
extracellular compartment, that can exert its influence on mammary epithelium through
several mechanisms : the mediation of hormonal signals via stromal hormone receptors; the
local elaboration of soluble agonist/antagonist factors; the provision of a supporting vascular
network; the contribution to a bed of basement membrane proteins on which epithelial cells
are positioned (Russell and Vonderhaar, 2002). Moreover the importance of cell to cell
interactions and cell to extracellular compartment interactions is gaining importance since
functional cell cultures in vitro were developed (Martinez and Houdebine, 1994, chap.4).
91
At every stage of mammary development the duct or the alveoli lie on a basal membrane. It is
possible that the interactions stroma-epithelium in vivo are mediated through the structure and
composition of this extracellular matrix (MEC), that is the surface and the region of contact
between the two tissues. The study of the biochemical composition and the structure of the
MEC (Hassell et al., 1985; Kleinman et al., 1986; Miller and Gay, 1987) show that this basal
membrane is not a passive layer, but in the contrary is an active membrane that receive
structural and functional message to direct the behaviour of stromal and epithelial cells (Bissel
and Aggeler, 1981; Bissel and Hall, 1987; Bissel aet al., 1982; Hay, 1981; IngBer and
Jamieson, 1985; Wicha, 1984) .
This basement membrane underlying epithelial cells in vivo consists of 3 separate layers
(Sakakura, 1991) : in contact with epithelium there is the lamina lucida, a thin space under
which is located the lamina densa. Together they constitute the basal lamina. Adjacent to the
basal lamina is the stroma-associated layer of variable thickness, the reticula lamina.
Based on in vitro study and immunolocalization experiments it was long assumed that
components of the basal lamina, such as laminin, heparin sulphate proteoglycans and type IV
collagen, were all derived from epithelial cells and that components of reticula lamina, such
as collagen types I and III, fibronectin and tenascin, were derived from the stroma (Russell
and Vonderhaar, 2002). Recent studies have assessed that the stroma is the primary source of
extracellular matrix proteins and that also collagen I, IV and laminin derived from stroma
(Keely et al., 1995). These finding define even the time of production of these
macromolecule: collagen I is expressed in early puberty and early pregnancy, collagen IV
during pregnancy and laminin during lactation. Moreover the expression of fibronectin from
the stroma seems to be regulated by ovarian steroid hormones in association with epithelial-
stromal interactions (Woodward et al., 2001). It is not clear if this dynamic construction of
basal membrane during the mammary gland development is the result or the cause of the
epithelial morphogenesis.
It is clear that various components of this basal membrane regulates the formation and
function of epithelial cells and their response to external signals, such as ovarian steroid
hormones or growth factors (Woodward et al., 2000). Even if we do not know the exact
contribution of these extracellular proteins at a cellular level a general model establishes that
the extracellular matrix exert its influence interacting with transmembrane proteins, able to
communicate with the cytoscheleter and the nucleus of epithelial cells (Martinez and
Houdebine, 1994, chap.4).
92
I-II-f The miRNAs in the mammary gland
An implication of miRNA in mammary gland biology is suggested from the data of some few
recent reports, most of them focusing more on pathological situations, such as the appearance
of breast cancer, than on the normal mammary development.
Liu et al. (2004) analyzed the gene expression profile of 18 adult and 2 fetal normal human
tissues using a microchip containing the oligonucleotides for 248 miRNA (161 derived from
human, 84 from mouse, 3 from Arabidopsis). They showed that each tissue has a specific
pattern of miRNome expression (defined like the totality of miRNA present in a cell) that can
be quantified. The mammary gland was one of the tissue analyzed and it was revealed that its
specific signatures is characterized by the expression profile of only 23 miRNAs, the lowest
number of miRNA detected in any tissue.
Other indirect evidences of miRNA involvement in the biology of mammary gland come
from studies about breast tumors.
It was analyzed the genomic localization of 186 human miRNA (Calin et al., 2004), 52,5 % of
them are present in cancer-associated genomic regions or in fragile sites and between them 15
miRNA are located in regions involved in human breast cancers. It was quantified (Jiang et al.,
2005) by real-time PCR the expression of 222 pre-miRNA in 32 human cancerous cell lines, 5
derived from breast cancer, and it was observed that let-7f-1 expression was 7-fold higher in
epithelial-derived breast, lung and colorectal cancer cells comparing to the mean of the
remaining cell lines. Moreover another study used microarray technology to measure the
differential expression of miRNA in normal and neoplastic human breast tissue and 29
miRNAs were found to be differentially regulated, 15 of which could be used with 100%
accuracy to predict the tumor (Iorio et al., 2005). In particular miR-125b have a decreased
expression level in samples derived from breast cancer primary tumors comparing to normal
breast tissue (Lee et al., 2005).
To date any reports deals about the expression of miRNAs in normal mammary gland during
the stages of its development.
93
II-Objective
To establish the genetic and functional network of a more comprehensive developmental
model of the mammary gland the genomics approaches should identify new putative control
genes and gene manipulation, in combination with tissue transplants, should evaluate their
physiological role. It should be important to evaluate also the time windows during which a
particular gene product is needed.
Taking in mind that many genetics pathways that control the development of mammary tissue
are used in organ systems that appeared earlier in evolution and considering the big
evolutionary conservation of miRNAs throughout every kingdoms and their involvement in
various mechanism of organogenesis, it was chosen to address the attention to miRNAs, in
order to discover putative regulatory molecule of the mammary gland development.
The study of miRNA in the mammary gland began analysing the expression of a first group of
conserved miRNAs, during different stages of mammary development in mouse; then the
expression profile during all the gland development has been studied in search for their
potential regulatory role in determining the passage from one phase to one other. Later it was
examined the cellular origin of their production.
The second objective of this work was the identification of mammary gland specific miRNA,
the idea was supported from the finding of organ- and tissue- specific miRNA (Lagos-
Quintana et al., 2002; Liu et al., 2004; Sempere et al., 2004; Pay et al., 2004; Frederikde et al.,
2006; Ryan et al., 2006; Chen et al., 2006, Ramkisson et al., 2006; Coutinho et al., 2006; Xu
et al., 2006; Gu et al., 2006) and also from the recent discovery of new specific primate
miRNAs (Devor, 2006). After having constructed a cDNA library of small RNA extracted at
different stages of mouse mammary gland, the expression of ‘candidate miRNAs’ was
characterized and a composite analyses, in part using bioinformatics and experimentally tools,
has been realized in order to validate them like miRNAs.
94
III-Materials and methods III-I Animals sampled Wild-type mice on FVBN genetic background have been used. All animals were housed and
handled according to the approved protocol established by the Institutional Animal Care and
Use Committee and NIH guidelines.
For the mammary gland expression analyses of the miRNA the fifth pair of mammary gland
of 2 mice was taken out after taking away the lymph node. The tissue was frozen using liquid
nitrogen and conserved at –80° C or immediately used for RNA extraction.
The stages analyzed were: Virgin 4 and 8 weeks, Gestation 2, 4-6-9-12-18-days, Lactation 1,
3 days, Involution 1-3-6 days. The involution was provoked taking away the offspring after
three days of lactation.
For the organ-expression analyses of the miRNAs 2 mice were sacrificed and the brain, heart,
liver, lung, muscle, kidney, ovaries, spleen and thyme were taken out, frozen and conserved
like for the mammary gland.
In the ‘clear fat pad experiment’ the mice, after an anesthesia, were operated at one of the two
mammary glands of the fifth pair : in the stage of early virgin, when the mice weight less than
18 grams, the rudimentary tree of the epithelial tissue is taken away. 2 mice were sacrificed
for each of the stages considered in this experiment: virgin 18 weeks, gestation 12 and 18
days, lactation 1 day.
The growing epithelial tissue taken away from these mice was spread on glass slides, fixed,
colored and observed at the microscope to verify its shape and the occurrence of the complete
removal of it.
The epithelial tissue on the glass slide is fixed for 2 to 4 hours at room temperature in
Carnoy’s fixative composed of 6 parts of 100% ethanol, 3 parts of chloroform, 1 part of
glacial acetic acid. Later it is washed sequentially in solution containing decreasing
concentration of ethanol: 15 minutes in a solution of 50% of ethanol, 15 minutes in another at
30%, 5 minutes in water. Later it is stained in Carmin Aluminium Staining overnight and the
following day it is washed 15 minutes in 3 solutions with increasing concentration of ethanol:
70, 95 and 100%. After that it is mounted on glass slides with Permount (Sigma).
III-II RNA extraction and Northern Blot analyses
The total RNA has been isolated with the reagent RNA NOWTM (Biogentex).
The reagent includes a cocktail of chaotropic agents, such as guanidinium salt derivative
compound, which works synergistically to effectively alter the secondary and tertiary
structures of proteins and polysaccharides and permits the extraction of RNA from other
organic components.
95
A piece of tissue of approximately 0,5 cm of diameter was disrupted in 2 ml of reagent by a
mechanical homogenizer. The RNA extraction occurs after the addition of 0,5 volume of
chloroform during a centrifugation of 10 minutes at 15000 rpm at 4° C. The RNA is
recovered in the aqueous phase. The precipitation of RNA occurs adding one volume of
isopropanol and leaving the RNA at -20° C overnight.
The day later the RNA is precipitated and washed one time with 70% ethanol, the pellet is
dried and resuspended at 65° C for 5 minutes in 50 µl of distilled water.
The quality of extraction of RNA has been evaluated by testing samples by electrophoresis on
1% agarose gel with Ethidium Bromide. The concentration has been measured using a
spectrometer and a range of 0,5-5 µg/µl was obtained. The less concentrated samples have
been precipitated overnight at -20° C in a solution of ethanol and NaCl 0,3 M before Northern
Blot analyses.
20 µg of total RNA of each sample has been fractionated using a 15 % denaturing
poyacrylamid gel. 75 µl of ammonium persulfate (10% wight/volume) and 12 µl of temed
(from a solution of 99% of concentration, Sigma) are added after melting 12 ml of gel, to
favor the polymerization. The RNA contained within the gel has been transferred overnight to
nitrocellulose membrane (Hybond-N+ , Amersham Bionsciences) by capillarity. The RNA
has been fixed to the membrane under UV radiation for 3 minutes.
15 pmol of 20-22 nucleotides probes have been labeled with γ- 32P dATP (Perkin Elmer) in a
final volume reaction of 50 µl using 20 units of T4 polynucleotide kinase (Roche
Diagnostices) and 5 µl of 10X reaction buffer for 30 minutes at 37° C. Pre-hybridizations and
hybridizations have been carried on at 55° C for half an hour and overnight, respectively, in a
phosphate buffer solution (0,5 M pH 7,2) added with sodium dodecyl phosphate (SDS) (7%).
The membranes have been washed 5 minutes two times at 55° C in a pre-warmed aqueous
solution of SSC 2X (SSC 1X : sodium chloride 150 mM; sodium citrate 15 mM, pH 7).
The revelation has been effected at the red light developing an auto-radiographic film
(Hyperfilm, Amersham) in contact with the membrane in a closed cassette or using Phosphor
Screen and the StormScan software, that produces an image on the computer starting from the
data of the Phosphoimager, a scanner able to count the radioactivity of the Phosphor Screen.
The hybridized membranes have been deshybridized in contact with a boiling aqueous
solution of SSC 0,1% and SDS 0,1% and reused for 3-4 subsequent hybridizations.
III-III Construction of miRNA libraries
There are different protocol and variations of them to built miRNA libraries. In this case it
was followed the way 2a and 3a.
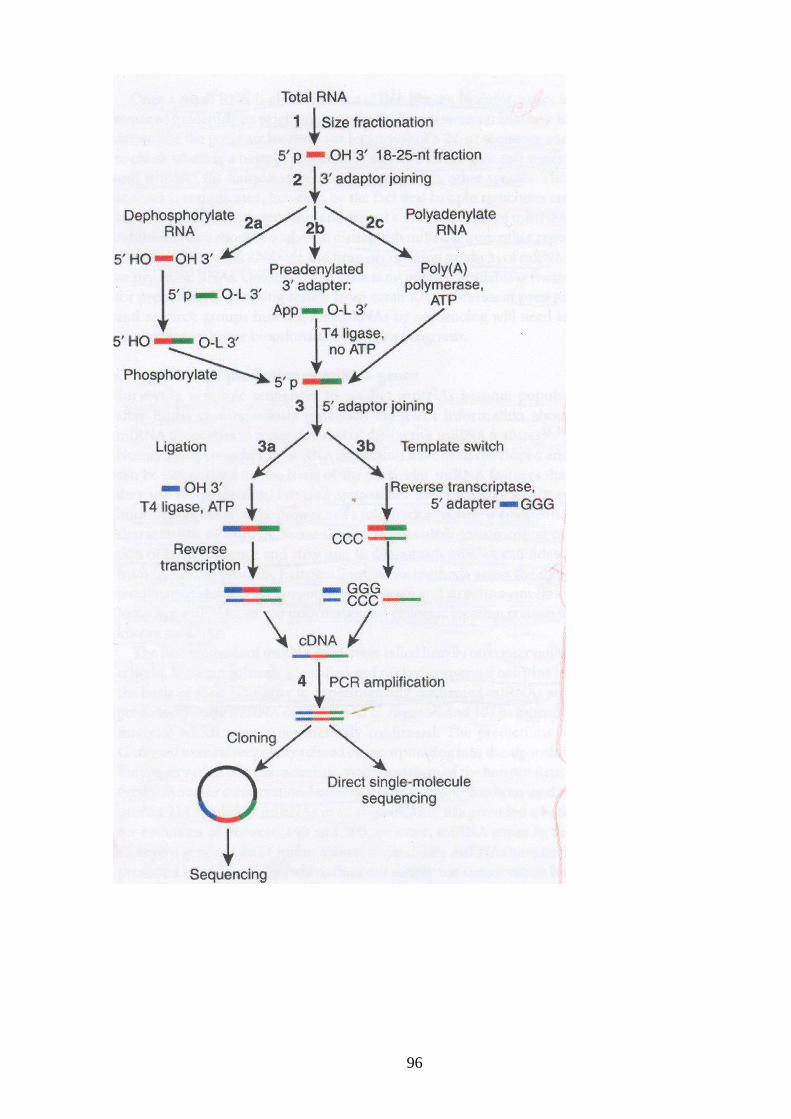
96

97
III-III-a Clonage of low-molecular weight RNAs
Low-molecular weight RNA, <200 nucleotides, has been prepared from 100-200 mg of
mammary gland tissue using the miRVanaTM miRNA Isolation kit (Ambion). The quality and
concentration of extractions has been evaluated in 15% denaturing polyacrylamid gel and 40-
50 µg of low-molecular weight RNA has been used to isolate 19-25 nucleotides RNA
following the instructions of the Lagos-Quintana 2003 cloning protocol.
The RNA has been separated in 15% denaturing polyacrylamid gel and RNA of 19- to 25-nt
size has been recovered with a scalpel from the gel by the aid of an RNA size marker γ32P
ATP previously labeled using the kit Decade (Ambion). The gel containing small RNA has
been eluted overnight in 600 µl of an aqueous solution of NaCl 0,3 M at 4° C, the RNA
precipitated with 3 volumes of ethanol 100% and glycogen at the final concentration of 40
µg/ml at -20° C for 1 hour. The pellet was redissolved in distilled water. Following a
dephosphorilation at the 3’ extremities of the RNA (30 minutes at 50° C in a buffer solution
of final volume of 30 µl with 10 units of alkaline phosphates, Roche) a first 5’ phosphorylated
3’adapter (table 1), previously labeled radioactively with γ32P ATP, has been ligated to the
RNA (after an heat-shock of 30 seconds at 90° C without the ligase, the reaction is carried on
for 1 hour at 37° C in a finale volume of 20 µl with 2 µl of 10X reaction buffer, 25 units of T4
RNA ligase, Amersham-Pharmacia, 100 pmol of 3’ labeled adapter, 1 nmol of 3’ adapter,
15% of DMSO). The reaction has been stopped adding 20 µl of stop solution.
After a second separation of the oligonucleotide RNA-3’adapter by electrophoresis the band
of 37-42 nucleotides is recovered, eluted, precipitated like before. A 5’ phosphorylation of the
RNA-3’ adapter oligonucleotides has been carried on ( 30 minutes at 37° C in a final volume
reaction of 20 µl with 2 µl of 10X reaction buffer, 2 mM ATP and 5 units of T4
polynucleotide kinase, NEB; the reaction has been stopped adding 40 µl of a 0,5M NaCl
solution). After a purification using the Wizard purification kit (Promega), and the
precipitation of the RNA oligonucleotides, the ligation of the 5’adapter (table 1) to the RNA-
3’ adapter was effected in the same conditions such as for the 3’ adapter using 1 nmol of a 5’
adapter not radioactively labeled.
The RNA oligonucleotides have been separated by electrophoresis and the band of 55-60
nucleotides was recovered from the gel, eluted, precipitated and resuspended in distilled water
like before.
Table 1. Names and composition of the two adapters used in the cloning protocol (UUU=
RNA, bold characters= DNA)
Name Composition
3’ adapter 5’ phosphateUUUAACCGCGAATTCCAG 3’ 5’ adapter 5’ ACGGAATTCCTCACT AAA 3’
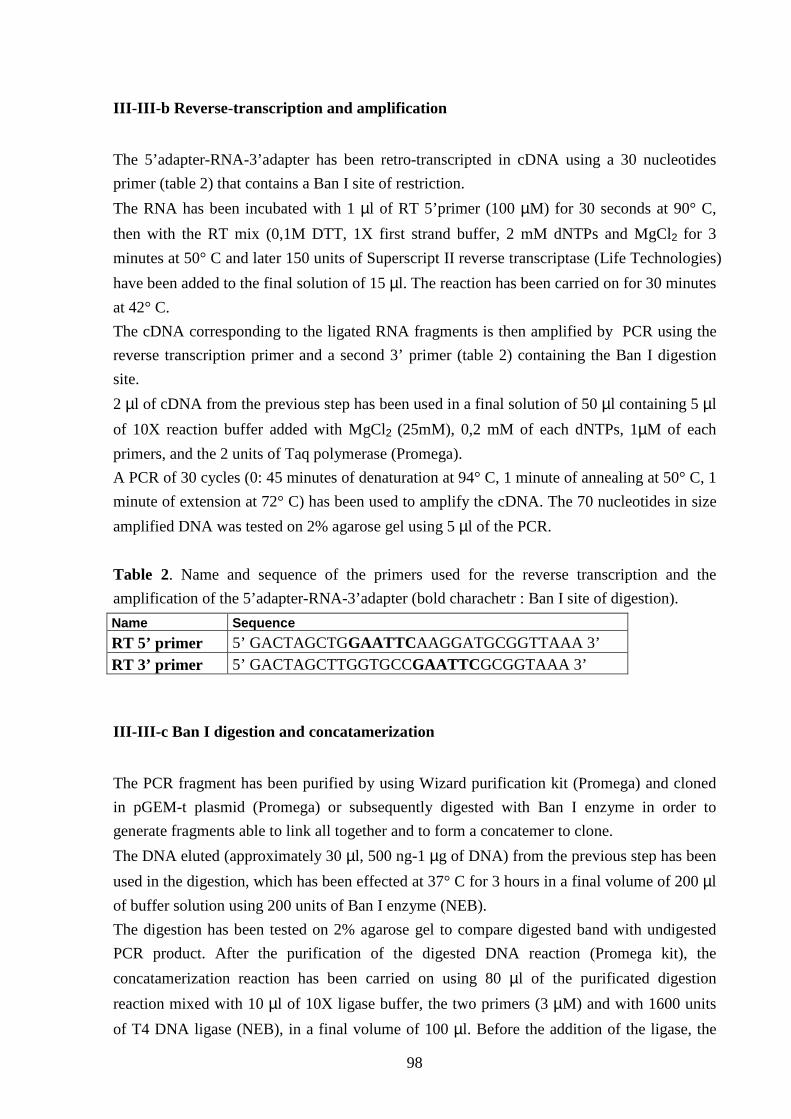
98
III-III-b Reverse-transcription and amplification
The 5’adapter-RNA-3’adapter has been retro-transcripted in cDNA using a 30 nucleotides
primer (table 2) that contains a Ban I site of restriction.
The RNA has been incubated with 1 µl of RT 5’primer (100 µM) for 30 seconds at 90° C,
then with the RT mix (0,1M DTT, 1X first strand buffer, 2 mM dNTPs and MgCl2 for 3
minutes at 50° C and later 150 units of Superscript II reverse transcriptase (Life Technologies)
have been added to the final solution of 15 µl. The reaction has been carried on for 30 minutes
at 42° C.
The cDNA corresponding to the ligated RNA fragments is then amplified by PCR using the
reverse transcription primer and a second 3’ primer (table 2) containing the Ban I digestion
site.
2 µl of cDNA from the previous step has been used in a final solution of 50 µl containing 5 µl
of 10X reaction buffer added with MgCl2 (25mM), 0,2 mM of each dNTPs, 1µM of each
primers, and the 2 units of Taq polymerase (Promega).
A PCR of 30 cycles (0: 45 minutes of denaturation at 94° C, 1 minute of annealing at 50° C, 1
minute of extension at 72° C) has been used to amplify the cDNA. The 70 nucleotides in size
amplified DNA was tested on 2% agarose gel using 5 µl of the PCR.
Table 2. Name and sequence of the primers used for the reverse transcription and the
amplification of the 5’adapter-RNA-3’adapter (bold charachetr : Ban I site of digestion).
Name Sequence
RT 5’ primer 5’ GACTAGCTGGAATTC AAGGATGCGGTTAAA 3’ RT 3’ primer 5’ GACTAGCTTGGTGCCGAATTC GCGGTAAA 3’
III-III-c Ban I digestion and concatamerization
The PCR fragment has been purified by using Wizard purification kit (Promega) and cloned
in pGEM-t plasmid (Promega) or subsequently digested with Ban I enzyme in order to
generate fragments able to link all together and to form a concatemer to clone.
The DNA eluted (approximately 30 µl, 500 ng-1 µg of DNA) from the previous step has been
used in the digestion, which has been effected at 37° C for 3 hours in a final volume of 200 µl
of buffer solution using 200 units of Ban I enzyme (NEB).
The digestion has been tested on 2% agarose gel to compare digested band with undigested
PCR product. After the purification of the digested DNA reaction (Promega kit), the
concatamerization reaction has been carried on using 80 µl of the purificated digestion
reaction mixed with 10 µl of 10X ligase buffer, the two primers (3 µM) and with 1600 units
of T4 DNA ligase (NEB), in a final volume of 100 µl. Before the addition of the ligase, the
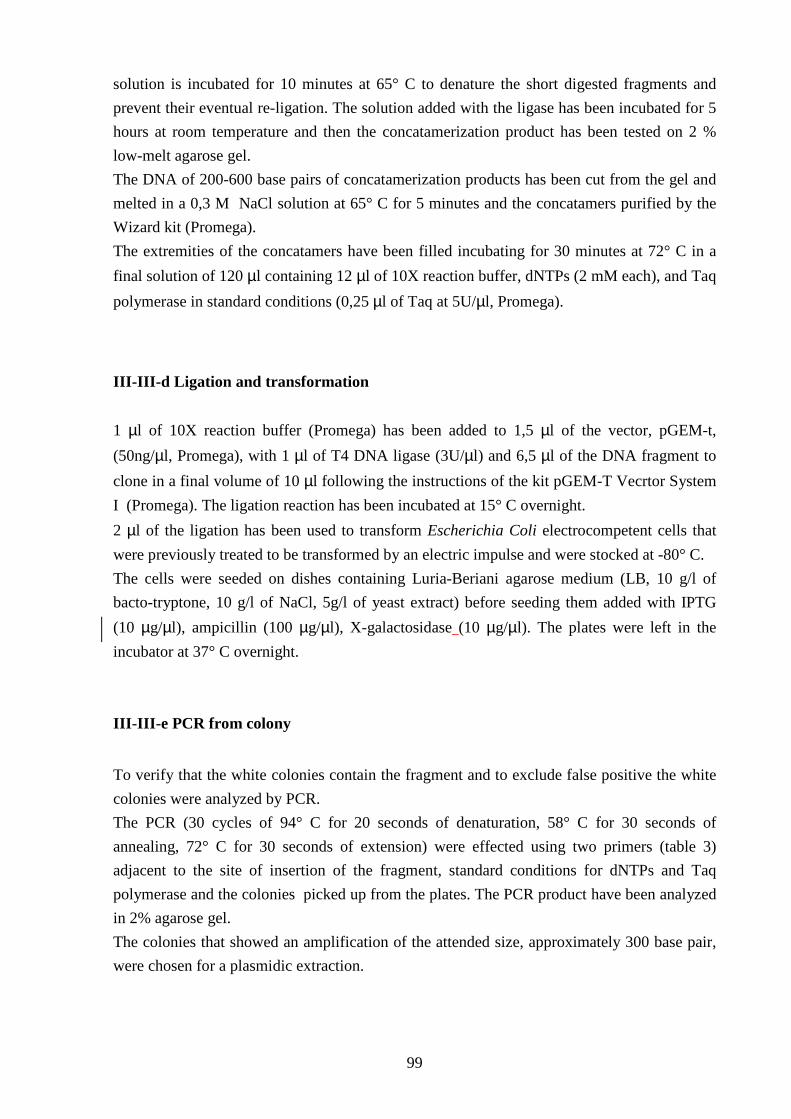
99
solution is incubated for 10 minutes at 65° C to denature the short digested fragments and
prevent their eventual re-ligation. The solution added with the ligase has been incubated for 5
hours at room temperature and then the concatamerization product has been tested on 2 %
low-melt agarose gel.
The DNA of 200-600 base pairs of concatamerization products has been cut from the gel and
melted in a 0,3 M NaCl solution at 65° C for 5 minutes and the concatamers purified by the
Wizard kit (Promega).
The extremities of the concatamers have been filled incubating for 30 minutes at 72° C in a
final solution of 120 µl containing 12 µl of 10X reaction buffer, dNTPs (2 mM each), and Taq
polymerase in standard conditions (0,25 µl of Taq at 5U/µl, Promega).
III-III-d Ligation and transformation
1 µl of 10X reaction buffer (Promega) has been added to 1,5 µl of the vector, pGEM-t,
(50ng/µl, Promega), with 1 µl of T4 DNA ligase (3U/µl) and 6,5 µl of the DNA fragment to
clone in a final volume of 10 µl following the instructions of the kit pGEM-T Vecrtor System
I (Promega). The ligation reaction has been incubated at 15° C overnight.
2 µl of the ligation has been used to transform Escherichia Coli electrocompetent cells that
were previously treated to be transformed by an electric impulse and were stocked at -80° C.
The cells were seeded on dishes containing Luria-Beriani agarose medium (LB, 10 g/l of
bacto-tryptone, 10 g/l of NaCl, 5g/l of yeast extract) before seeding them added with IPTG
(10 µg/µl), ampicillin (100 µg/µl), X-galactosidase (10 µg/µl). The plates were left in the
incubator at 37° C overnight.
III-III-e PCR from colony
To verify that the white colonies contain the fragment and to exclude false positive the white
colonies were analyzed by PCR.
The PCR (30 cycles of 94° C for 20 seconds of denaturation, 58° C for 30 seconds of
annealing, 72° C for 30 seconds of extension) were effected using two primers (table 3)
adjacent to the site of insertion of the fragment, standard conditions for dNTPs and Taq
polymerase and the colonies picked up from the plates. The PCR product have been analyzed
in 2% agarose gel.
The colonies that showed an amplification of the attended size, approximately 300 base pair,
were chosen for a plasmidic extraction.
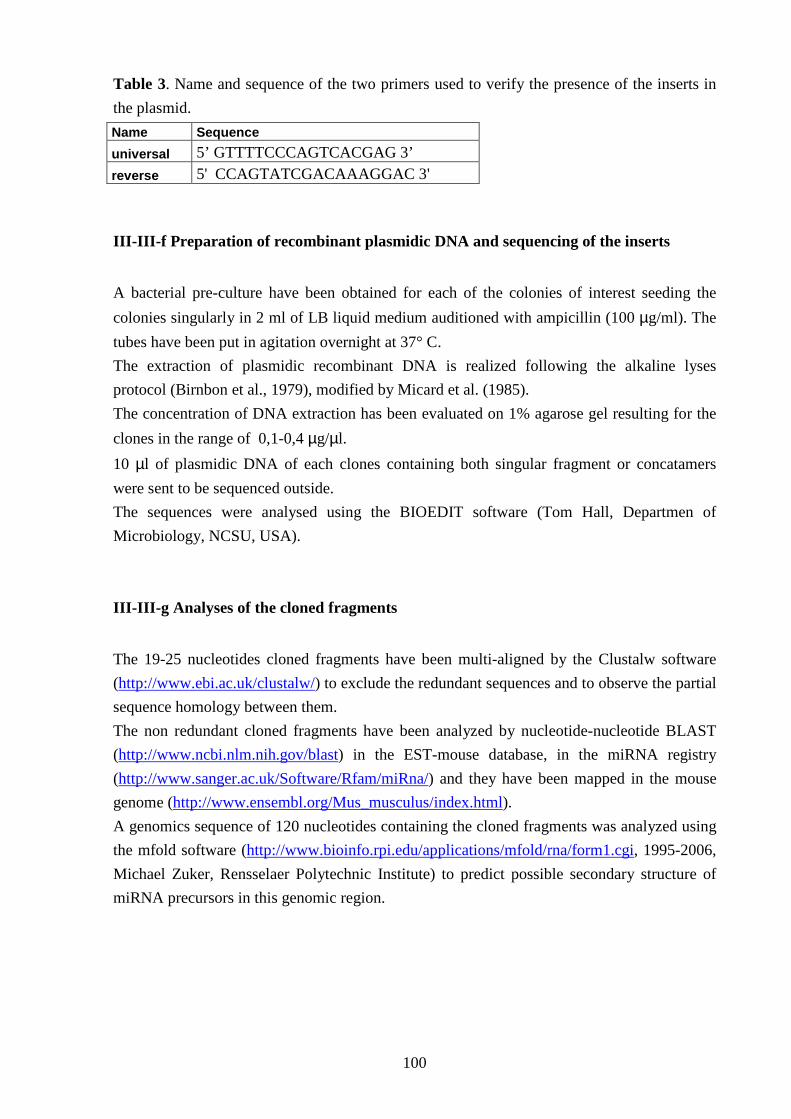
100
Table 3. Name and sequence of the two primers used to verify the presence of the inserts in
the plasmid.
Name Sequence
universal 5’ GTTTTCCCAGTCACGAG 3’
reverse 5' CCAGTATCGACAAAGGAC 3'
III-III-f Preparation of recombinant plasmidic DNA and sequencing of the inserts
A bacterial pre-culture have been obtained for each of the colonies of interest seeding the
colonies singularly in 2 ml of LB liquid medium auditioned with ampicillin (100 µg/ml). The
tubes have been put in agitation overnight at 37° C.
The extraction of plasmidic recombinant DNA is realized following the alkaline lyses
protocol (Birnbon et al., 1979), modified by Micard et al. (1985).
The concentration of DNA extraction has been evaluated on 1% agarose gel resulting for the
clones in the range of 0,1-0,4 µg/µl.
10 µl of plasmidic DNA of each clones containing both singular fragment or concatamers
were sent to be sequenced outside.
The sequences were analysed using the BIOEDIT software (Tom Hall, Departmen of
Microbiology, NCSU, USA).
III-III-g Analyses of the cloned fragments
The 19-25 nucleotides cloned fragments have been multi-aligned by the Clustalw software
(http://www.ebi.ac.uk/clustalw/) to exclude the redundant sequences and to observe the partial
sequence homology between them.
The non redundant cloned fragments have been analyzed by nucleotide-nucleotide BLAST
(http://www.ncbi.nlm.nih.gov/blast) in the EST-mouse database, in the miRNA registry
(http://www.sanger.ac.uk/Software/Rfam/miRna/) and they have been mapped in the mouse
genome (http://www.ensembl.org/Mus_musculus/index.html).
A genomics sequence of 120 nucleotides containing the cloned fragments was analyzed using
the mfold software (http://www.bioinfo.rpi.edu/applications/mfold/rna/form1.cgi, 1995-2006,
Michael Zuker, Rensselaer Polytechnic Institute) to predict possible secondary structure of
miRNA precursors in this genomic region.
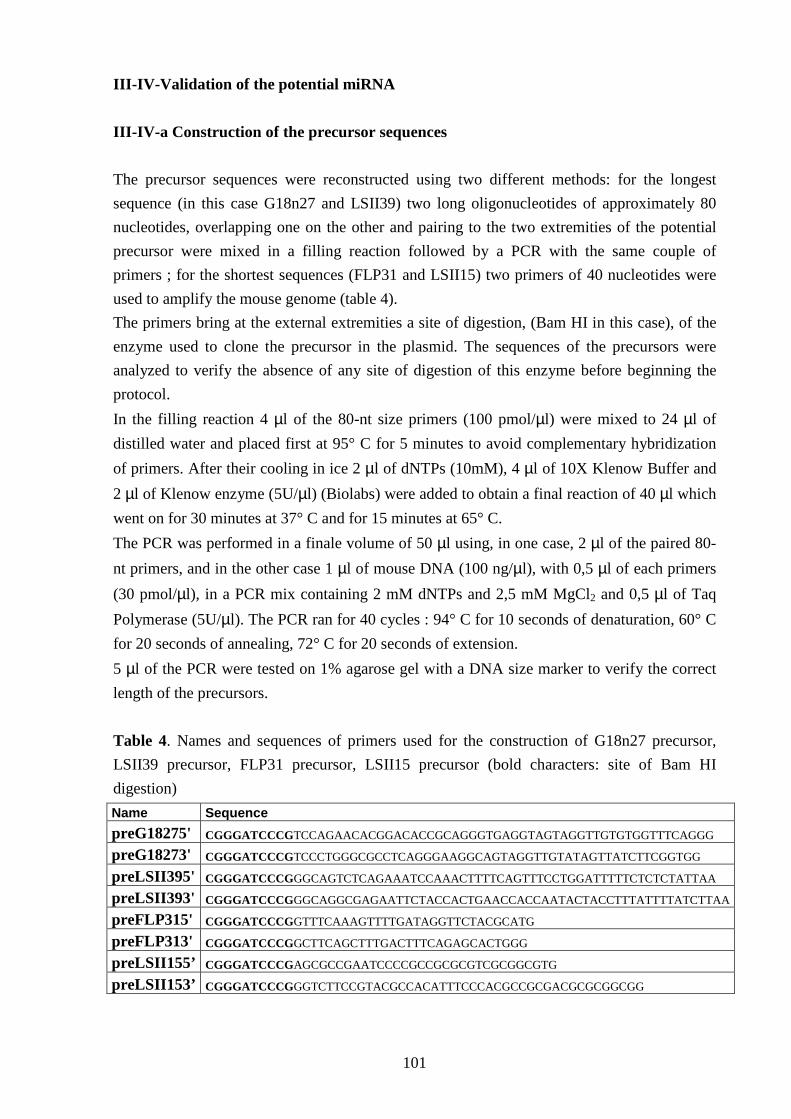
101
III-IV-Validation of the potential miRNA
III-IV-a Construction of the precursor sequences
The precursor sequences were reconstructed using two different methods: for the longest
sequence (in this case G18n27 and LSII39) two long oligonucleotides of approximately 80
nucleotides, overlapping one on the other and pairing to the two extremities of the potential
precursor were mixed in a filling reaction followed by a PCR with the same couple of
primers ; for the shortest sequences (FLP31 and LSII15) two primers of 40 nucleotides were
used to amplify the mouse genome (table 4).
The primers bring at the external extremities a site of digestion, (Bam HI in this case), of the
enzyme used to clone the precursor in the plasmid. The sequences of the precursors were
analyzed to verify the absence of any site of digestion of this enzyme before beginning the
protocol.
In the filling reaction 4 µl of the 80-nt size primers (100 pmol/µl) were mixed to 24 µl of
distilled water and placed first at 95° C for 5 minutes to avoid complementary hybridization
of primers. After their cooling in ice 2 µl of dNTPs (10mM), 4 µl of 10X Klenow Buffer and
2 µl of Klenow enzyme (5U/µl) (Biolabs) were added to obtain a final reaction of 40 µl which
went on for 30 minutes at 37° C and for 15 minutes at 65° C.
The PCR was performed in a finale volume of 50 µl using, in one case, 2 µl of the paired 80-
nt primers, and in the other case 1 µl of mouse DNA (100 ng/µl), with 0,5 µl of each primers
(30 pmol/µl), in a PCR mix containing 2 mM dNTPs and 2,5 mM MgCl2 and 0,5 µl of Taq
Polymerase (5U/µl). The PCR ran for 40 cycles : 94° C for 10 seconds of denaturation, 60° C
for 20 seconds of annealing, 72° C for 20 seconds of extension.
5 µl of the PCR were tested on 1% agarose gel with a DNA size marker to verify the correct
length of the precursors.
Table 4. Names and sequences of primers used for the construction of G18n27 precursor,
LSII39 precursor, FLP31 precursor, LSII15 precursor (bold characters: site of Bam HI
digestion)
Name Sequence
preG18275' CGGGATCCCGTCCAGAACACGGACACCGCAGGGTGAGGTAGTAGGTTGTGTGGTTTCAGGG
preG18273' CGGGATCCCGTCCCTGGGCGCCTCAGGGAAGGCAGTAGGTTGTATAGTTATCTTCGGTGG
preLSII395' CGGGATCCCGGGCAGTCTCAGAAATCCAAACTTTTCAGTTTCCTGGATTTTTCTCTCTATTAA
preLSII393' CGGGATCCCGGGCAGGCGAGAATTCTACCACTGAACCACCAATACTACCTTTATTTTATCTTAA
preFLP315' CGGGATCCCGGTTTCAAAGTTTTGATAGGTTCTACGCATG
preFLP313' CGGGATCCCGGCTTCAGCTTTGACTTTCAGAGCACTGGG
preLSII155’ CGGGATCCCGAGCGCCGAATCCCCGCCGCGCGTCGCGGCGTG
preLSII153’ CGGGATCCCGGGTCTTCCGTACGCCACATTTCCCACGCCGCGACGCGCGGCGG
102
The remaining 45 µl of the PCR were mixed to 2,5 volumes of Ethanol 100%/Acetate of Na
(2,5 mM) and let at -20° C overnight to precipitate. The day later the DNA was centrifuged
for 15 min at 15000 rpm at 4° C and washed one time with ethanol 70%. The pellet was dried
at the room temperature and resuspended in 10 µl of distilled water leaving the DNA for 5
minutes at 65° C.
The precursor sequence was ligated in the pGEM-t vector and the correct sequence was
verified like described in the paragraphs III-IV to III-VII.
III-IV-b Construction of the expression vector
For the in vitro expression studies the precursors were cloned in the Bam HI digestion site of
the 5021 base pair pUHG 17-1 plasmid which contains an ubiquitous promoter, CMV. rtTA
and Β-globin sequences are adjacent to the site of insertion. The precursor sequence and the
vector were prepared independently before the ligation.
The precursor sequence was recovered digesting the pGEM-t plasmid of the sequenced
colonies containing the correct precursor sequence. In a final volume of 120 µl 20 µl of the
plasmidic DNA (1 µg/µl) were digested using 10 µl of Bam HI enzyme (20u/µl, NEB)and 12
µl of 10X reaction buffer (NEB). All the digestion reactions were charged on a 2% low-melt
agarose gel and the precursor fragments (from 110 to 200 nucleotides, depending on the
precursor) were recovered from the gel with a scalpel. The DNA was eluted from the gel like
described before and purified by the aid of Wizard kit (Promega). 40 µl of purified DNA were
recovered and concentrated under vacuum (speed-vac) to a final volume of 17 µl, whose 4 µl
were tested on a 2% agarose gel (10 ng/µl).
2 µl of pUHG plasmid (1,5 µg/µl) were digested in a final volume reaction of 200 µl with 20
µl of Bam HI enzyme (20U/µl) and 20 µl of 10X reaction buffer (NEB). 5 µl of the digestion
were tested on a 1% agarose gel together with 0,2 µl of non digested plasmid to verify the
different run of the two plasmid.
To confirm the plasmid linearization 15 µl of the digested plasmid were subjected to a second
digestion with Hind III in a finale volume reaction of 100 µl with 5 µl of enzyme (20U/µl,
NEB). 6 µl of this second reaction were tested on a 1% agarose gel along with a marker size
and the two fragment of digestion of 940 and 4081 base pair were observed at the correct
position.
The remaining 180 µl of the Bam HI digestion were then purified by the Wizard kit (Promega)
and eluted in 140 µl of distilled water.
The digested and purified plasmid was then subjected to a dephosphorilation in a finale
volume reaction of 200 µl with 9 U of alkaline phosphatase(Roche) and 20 µl of 10X reaction
103
buffer (Roche) at 50° C for 40 minutes. The reaction was purified and eluted in a volume of
33 µl of distilled water. 3 µl were tested on a 1% agarose gel with a size marker and 0,3 µl of
non digested pUHG and the concentration of the digested dephosphorilated plasmid was
estimated to be approximately 150 ng/µl.
III-IV-c Ligation, transformation and sequencing
6 µl of each purified insert (the precursor) were mixed to 2 µl of the dephosporilated and
linearized pUHG plasmid in a finale volume reaction of 10 µl adding 1 µl of 10X reaction
buffer and 1 µl of ligase (3U/µl). The reaction went on for 10-15 hours at 37° C. A negative
control was provided from a tube in which the fragment of insertion was not added.
Escherichia Coli cells were transformed with the engineered plasmid and cultivated on plates
of LB agarose medium added with ampicillin (100 µg/ml) like it is described in the
paragraphs III-III-d.
A PCR test (30 cycles : 94° C for 30 seconds of denaturation, 58° C for 30 seconds of
annealing and 74° C for 40 seconds of extension) was effected like described in the paragraph
III-III-e on a series of colonies to select the transformed ones using primers pairing on the
rtTA and Βglobin sequences.
The plasmidic DNA was prepared like described in the paragraph III-III-f.
The plasmidic DNA were tested by PCR to determine the orientation of each precursor in the
site of insertion of the plasmid.
1 µl of each DNA plasmidic preparation was subjected to a couple of PCR with primers (table
5) pairing on the precursor and, respectively, one primers pairing on rtTA or on Β-globin
sequences. The PCR of 30 cycles (in the same condition as for testing the positive colonies,
but with an extension temperature of 72° C) was effected in a finale volume of 25 µl using 0,5
µl of each primers (30 pmol/µl) and standard buffer and Taq polymerase conditions.
The PCR was tested on 2% agarose gel and the different size of PCR product indicated the
orientation of the precursor in the plasmid.
10 µl of recombinant plasmidic DNA from the positive colonies for both orientations of each
precursor were sent to sequencing using both the rtTA and the B-globin primers to sequence
the insertion fragments in both directions. The sequences were analysed by BIOEDIT.
Table 5. Primers used to test the orientations of the inserts
rtTA/1 GATGCCCTTGGAATTGACGAG B-glob/2 TATAACATGAATTTTTCAATAGCG
.
104
III-IV-d DNA plasmidic preparation
After the analyses of the sequences 1 positive colony for each precursor in both orientation
was chosen for a first pre-bacterial culture and a subsequent bacterial culture in 100 ml of LB
liquid medium added with ampicillin (100 µg/ml), which was put at 37° C overnight seeding
inside the 2 ml of pre-culture.
Large amount of plasmidic DNA was extracted using the alkaline lyses method following the
protocol of the Nucleobond PC100 plasmid DNA purification kit (Marcherey Nagel). The
DNA was tested on a 1% agarose gel with a circular gamma range of plasmidic DNA and was
estimated to be in the range of 0,5-1 µg/µl.
IV-IV-e Transfection test
For the in vitro studies COS-7 cells (cellular line derived from ‘afric green’ monkey kidney
transformed by the SV40, this line express the T antigen, it was established from CV-1
monkey cells and has a fibroblasts morphology) have been used.
The cells have been grown in 10 cm of diameter dishes (Orange Scientific) in Dulbecco’s
Modified Eagle’s medium (DMEM) with the addition of 10% of SVF, 2 mM glutamine,
penicillin 10U/µl and streptomycine 100U/µl incubating them in a thermostat at 37° C (5% of
CO2) until a confluence of 40-60% was observed at the optical microscope after 24/48 hours.
Transfection tests have been made using the jetPEITM cationic reagent (PolyPlus transfection)
and following the instructions relative to the reagent.
The cells have been seeded in 6 multi-wells plates and when a 40-60% confluence is noticed
each wells has been transfected with plasmidic recombinant DNA carrying a different
precursor in one orientation. The negative control was provided by a wells of cells non
transfected. Both DNA and the jetPEITM were diluted in two independent 100 µl 150 mM
NaCl sterile solution. 6 µl of jetPEITM were necessary to transfect 3 µg of plasmidic DNA.
The jetPEITM solution was added to the DNA solution and the mixed solution was left 15-30
minutes at room temperature before being added to 2 ml of the medium of each well. The
cells are left in the incubator at 37° C and the transfection went on for 2 days.
0.8 ml of RNA NOW reagent were added to the medium containing cells of each wells and
the total RNA was extracted, tested on 1% agarose gel (1-2 µg/µl) for its quantity and quality
and used to analyze by Northern blot, like it is described in the paragraph III-II, the in vitro
expression of the miRNAs corresponding to the transfected precursors.
105
IV -Results and discussion The involvement of miRNAs in the mouse mammary gland was analyzed in two
different ways: i) it was examined the expression of a set of known miRNAs during the
stages of development of this organ, ii) in order to identify organ-specific miRNA,
libraries of microRNA, extracted from different stages of the developing mammary
gland, were constructed and some new ‘candidate miRNAs’ were characterized.
IV-I Detecting miRNAs in mouse mammary gland
In order to defined the role of miRNA during the development of mammary gland (MG),
first the expression of some miRNAs already described in literature and present in the
microRNA registry was analyzed.
A group of 25 miRNAs was selected : between them 12 are human miRNAs (Lagos-
Quintana et al., 2001) 100% identical to part of sequences of cDNA derived from the
mammary gland in the EST mouse bank; 9 are highly expressed in human breast tissue
(Liu et al., 2004), the remaining show an involvement in tumor breast tissue (Iorio et al.,
2005; Lee et al., 2005; Cimmino et al., 2005). For the mammary human miRNAs the
homologous murine miRNAs were searched and the complementary sequences were
ordered and used like probes for the hybridizations (table 1).
Table 1. Mouse miRNA tested, their bibliography origin, their corresponding probes.
Name miRNA Sequence Origin Name probe Sequenze
mmu-miR7.1 TGGAAGACTAGTGATTTTGTT Lagos-Quintana et al, 2001 miR7.1as AACAAAATCACTAGTCTTCCA
mmu-miR92.1 TATTGCACTTGTCCCGGCCTGT " miR92.1as ACAGGCCGGGACAAGTGCAATA
mmu-miR130a CAGTGCAATGTTAAAAG " miR130aas CTTTTAACATTGCACTG
mmu-miR140 GTGGTTTTACCCTATGGTAG " miR140as CTACCATAGGGTAAAACCAC
mmu-miR142 CATAAAGTAGAAAGCACTAC " miR142as GTAGTGCTTTCTACTTTATG
mmu-miR145 GTCCAGTTTTCCCAGGAATCCC " miR145as GGGATTCCTGGGAAAACTGGAC
mmu-miR203 TGAAATGTTTAGGACCAC " miR203as TGGTCCTAAACATTTCA
mmu-miR212 TAACAGTCTCCAGTCAC " miR212as GTGACTGGAGACTGTTA
mmu-miR216 CTCAGCTGGCAACTGTG " miR216as CACAGTTGCCAGCTGAG
mmu-miR217 CTGCATCAGGAACTGATTGG " miR217as CCAATCAGTTCCTGATGCAG
mmu-let7b TGAGGTAGTAGGTTGTGTGGTT " let7bas AACCACACAACCTACTACCTCA
mmu-let7c TGAGGTAGTAGGTTGTATGGTT " let7cas AACCATACAACCTACTACCTCA
mmu-let7a TGAGGTAGTAGGTTGTATAGTT Liu et al., 2004 let7aas AACTATACAACCTACTACCTCA
mmu-miR23b ATCACATTGCCAGGGATTACCAC " miR23bas GTGGTAATCCCTGGCAATGTGAT
mmu-miR24-2 TGGCTCAGTTCAGCAGGAACAG " miR24-2as CTGTTCCTGCTGAACTGAGCCA mmu-miR26a-1 TTCAAGTAATTCAGGATAGGCT " miR26a-1as AGCCTATCCTGGATTACTTGAA
mmu-miR26b TTCAAGTAATTCAGGATAGGTT " miR26bas AACCTATCCTGAATTACTTGA
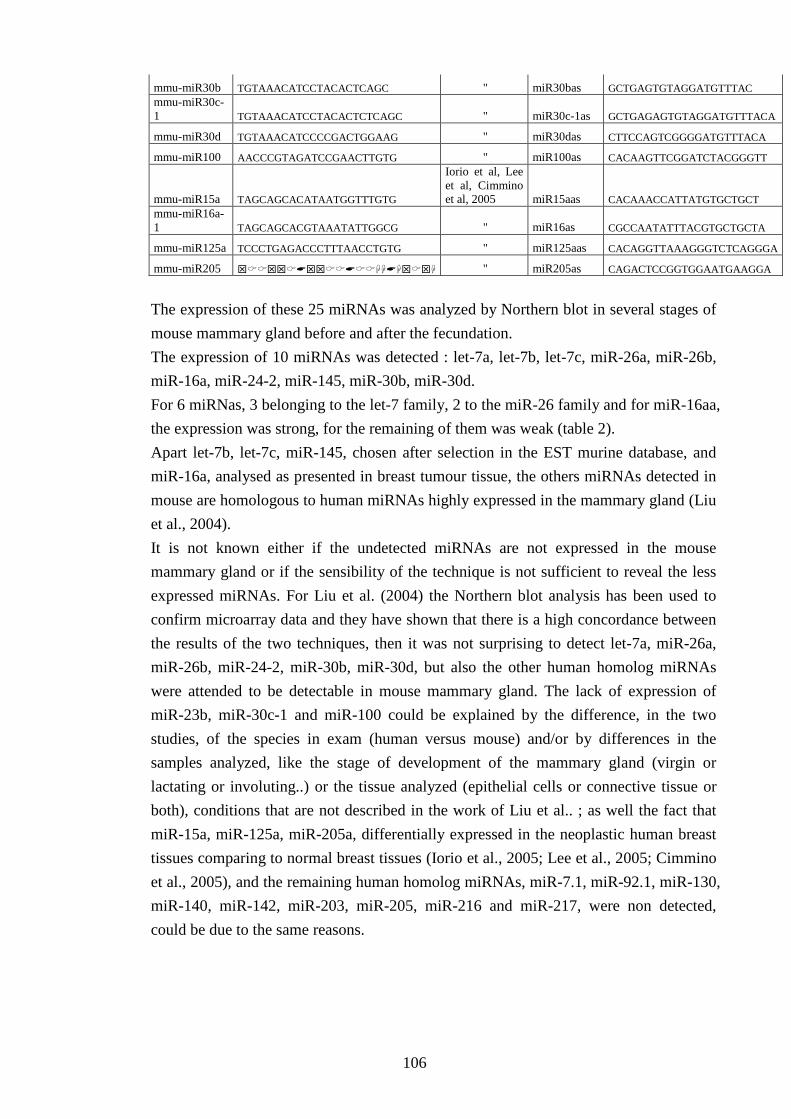
106
mmu-miR30b TGTAAACATCCTACACTCAGC " miR30bas GCTGAGTGTAGGATGTTTAC mmu-miR30c-1 TGTAAACATCCTACACTCTCAGC " miR30c-1as GCTGAGAGTGTAGGATGTTTACA
mmu-miR30d TGTAAACATCCCCGACTGGAAG " miR30das CTTCCAGTCGGGGATGTTTACA
mmu-miR100 AACCCGTAGATCCGAACTTGTG " miR100as CACAAGTTCGGATCTACGGGTT
mmu-miR15a TAGCAGCACATAATGGTTTGTG
Iorio et al, Lee et al, Cimmino et al, 2005 miR15aas CACAAACCATTATGTGCTGCT
mmu-miR16a-1 TAGCAGCACGTAAATATTGGCG " miR16as CGCCAATATTTACGTGCTGCTA
mmu-miR125a TCCCTGAGACCCTTTAACCTGTG " miR125aas CACAGGTTAAAGGGTCTCAGGGA
mmu-miR205 ���������������������� " miR205as CAGACTCCGGTGGAATGAAGGA
The expression of these 25 miRNAs was analyzed by Northern blot in several stages of
mouse mammary gland before and after the fecundation.
The expression of 10 miRNAs was detected : let-7a, let-7b, let-7c, miR-26a, miR-26b,
miR-16a, miR-24-2, miR-145, miR-30b, miR-30d.
For 6 miRNas, 3 belonging to the let-7 family, 2 to the miR-26 family and for miR-16aa,
the expression was strong, for the remaining of them was weak (table 2).
Apart let-7b, let-7c, miR-145, chosen after selection in the EST murine database, and
miR-16a, analysed as presented in breast tumour tissue, the others miRNAs detected in
mouse are homologous to human miRNAs highly expressed in the mammary gland (Liu
et al., 2004).
It is not known either if the undetected miRNAs are not expressed in the mouse
mammary gland or if the sensibility of the technique is not sufficient to reveal the less
expressed miRNAs. For Liu et al. (2004) the Northern blot analysis has been used to
confirm microarray data and they have shown that there is a high concordance between
the results of the two techniques, then it was not surprising to detect let-7a, miR-26a,
miR-26b, miR-24-2, miR-30b, miR-30d, but also the other human homolog miRNAs
were attended to be detectable in mouse mammary gland. The lack of expression of
miR-23b, miR-30c-1 and miR-100 could be explained by the difference, in the two
studies, of the species in exam (human versus mouse) and/or by differences in the
samples analyzed, like the stage of development of the mammary gland (virgin or
lactating or involuting..) or the tissue analyzed (epithelial cells or connective tissue or
both), conditions that are not described in the work of Liu et al.. ; as well the fact that
miR-15a, miR-125a, miR-205a, differentially expressed in the neoplastic human breast
tissues comparing to normal breast tissues (Iorio et al., 2005; Lee et al., 2005; Cimmino
et al., 2005), and the remaining human homolog miRNAs, miR-7.1, miR-92.1, miR-130,
miR-140, miR-142, miR-203, miR-205, miR-216 and miR-217, were non detected,
could be due to the same reasons.
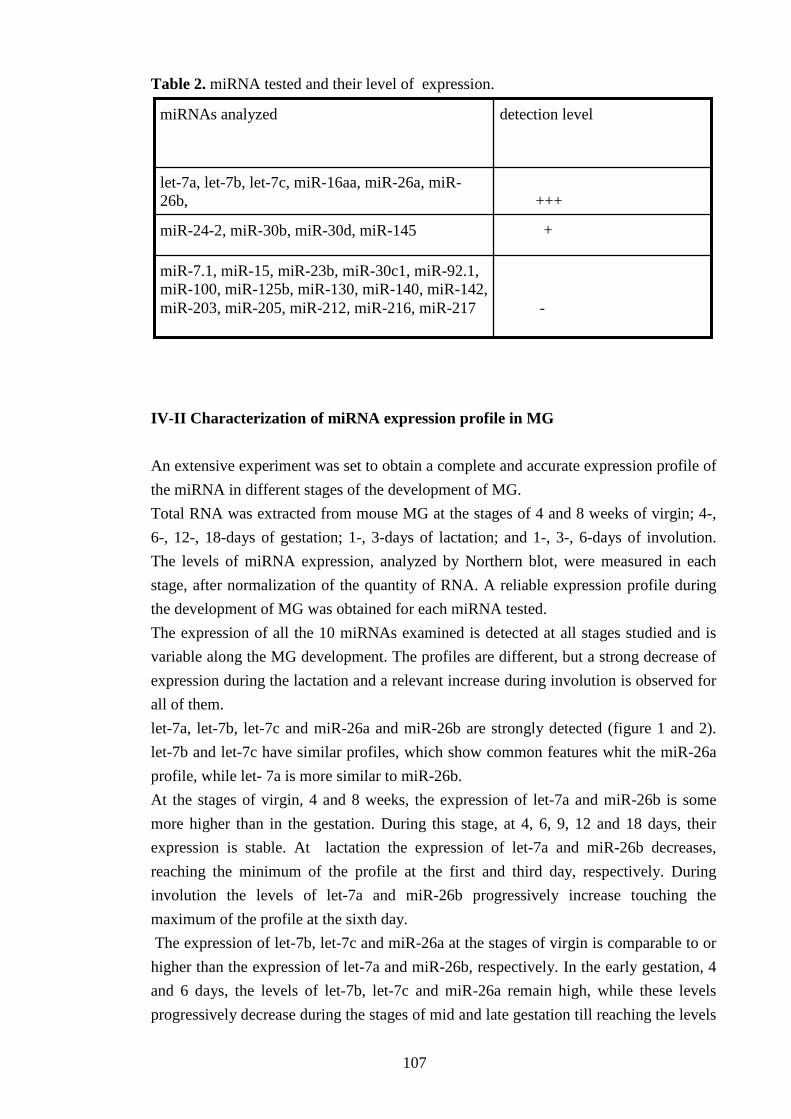
107
Table 2. miRNA tested and their level of expression.
IV-II Characterization of miRNA expression profile in MG
An extensive experiment was set to obtain a complete and accurate expression profile of
the miRNA in different stages of the development of MG.
Total RNA was extracted from mouse MG at the stages of 4 and 8 weeks of virgin; 4-,
6-, 12-, 18-days of gestation; 1-, 3-days of lactation; and 1-, 3-, 6-days of involution.
The levels of miRNA expression, analyzed by Northern blot, were measured in each
stage, after normalization of the quantity of RNA. A reliable expression profile during
the development of MG was obtained for each miRNA tested.
The expression of all the 10 miRNAs examined is detected at all stages studied and is
variable along the MG development. The profiles are different, but a strong decrease of
expression during the lactation and a relevant increase during involution is observed for
all of them.
let-7a, let-7b, let-7c and miR-26a and miR-26b are strongly detected (figure 1 and 2).
let-7b and let-7c have similar profiles, which show common features whit the miR-26a
profile, while let- 7a is more similar to miR-26b.
At the stages of virgin, 4 and 8 weeks, the expression of let-7a and miR-26b is some
more higher than in the gestation. During this stage, at 4, 6, 9, 12 and 18 days, their
expression is stable. At lactation the expression of let-7a and miR-26b decreases,
reaching the minimum of the profile at the first and third day, respectively. During
involution the levels of let-7a and miR-26b progressively increase touching the
maximum of the profile at the sixth day.
The expression of let-7b, let-7c and miR-26a at the stages of virgin is comparable to or
higher than the expression of let-7a and miR-26b, respectively. In the early gestation, 4
and 6 days, the levels of let-7b, let-7c and miR-26a remain high, while these levels
progressively decrease during the stages of mid and late gestation till reaching the levels
-
miR-7.1, miR-15, miR-23b, miR-30c1, miR-92.1, miR-100, miR-125b, miR-130, miR-140, miR-142, miR-203, miR-205, miR-212, miR-216, miR-217
+
miR-24-2, miR-30b, miR-30d, miR-145
+++
let-7a, let-7b, let-7c, miR-16aa, miR-26a, miR-26b,
detection level miRNAs analyzed
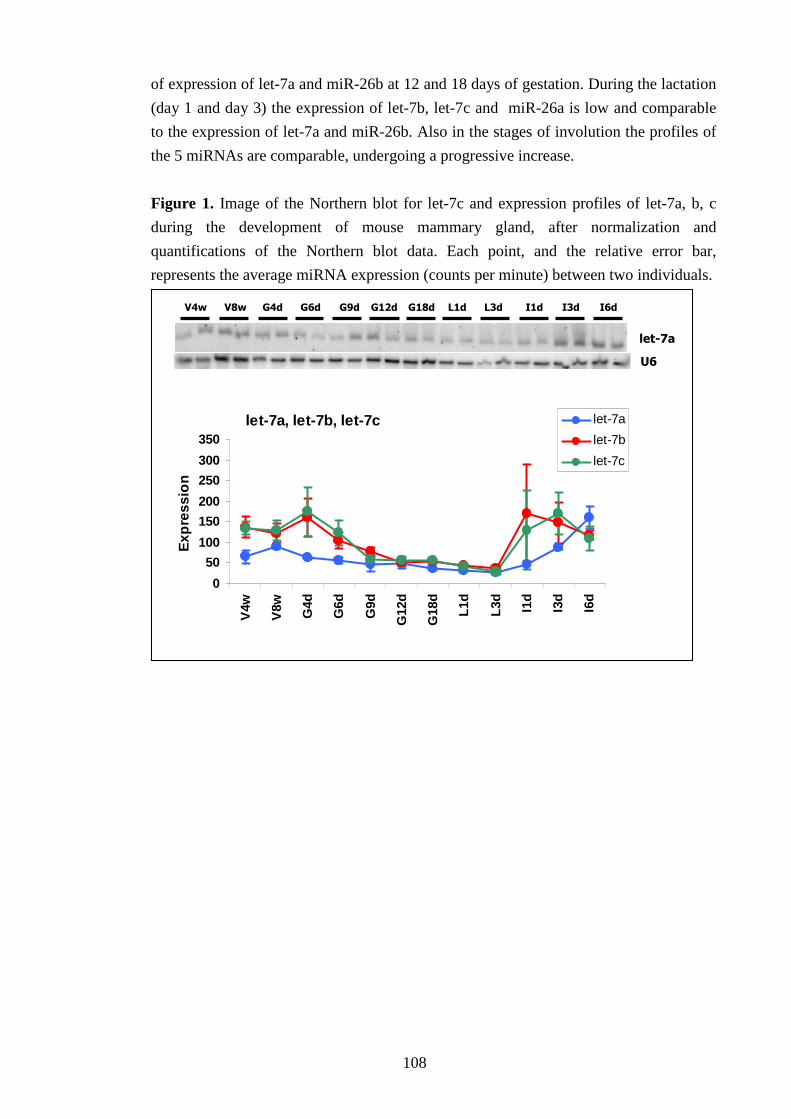
108
of expression of let-7a and miR-26b at 12 and 18 days of gestation. During the lactation
(day 1 and day 3) the expression of let-7b, let-7c and miR-26a is low and comparable
to the expression of let-7a and miR-26b. Also in the stages of involution the profiles of
the 5 miRNAs are comparable, undergoing a progressive increase.
Figure 1. Image of the Northern blot for let-7c and expression profiles of let-7a, b, c
during the development of mouse mammary gland, after normalization and
quantifications of the Northern blot data. Each point, and the relative error bar,
represents the average miRNA expression (counts per minute) between two individuals.
V8w G4d G6d G9d G12d G18d L1d L3d I1d I3d I6d V4w
let-7a
U6
let-7a, let-7b, let-7c
0
50
100
150
200
250
300
350
V4w
V8w G4d
G6d
G9d
G12
d
G18
d
L1d
L3d
I1d
I3d
I6d
Exp
ress
ion
let-7a
let-7b
let-7c
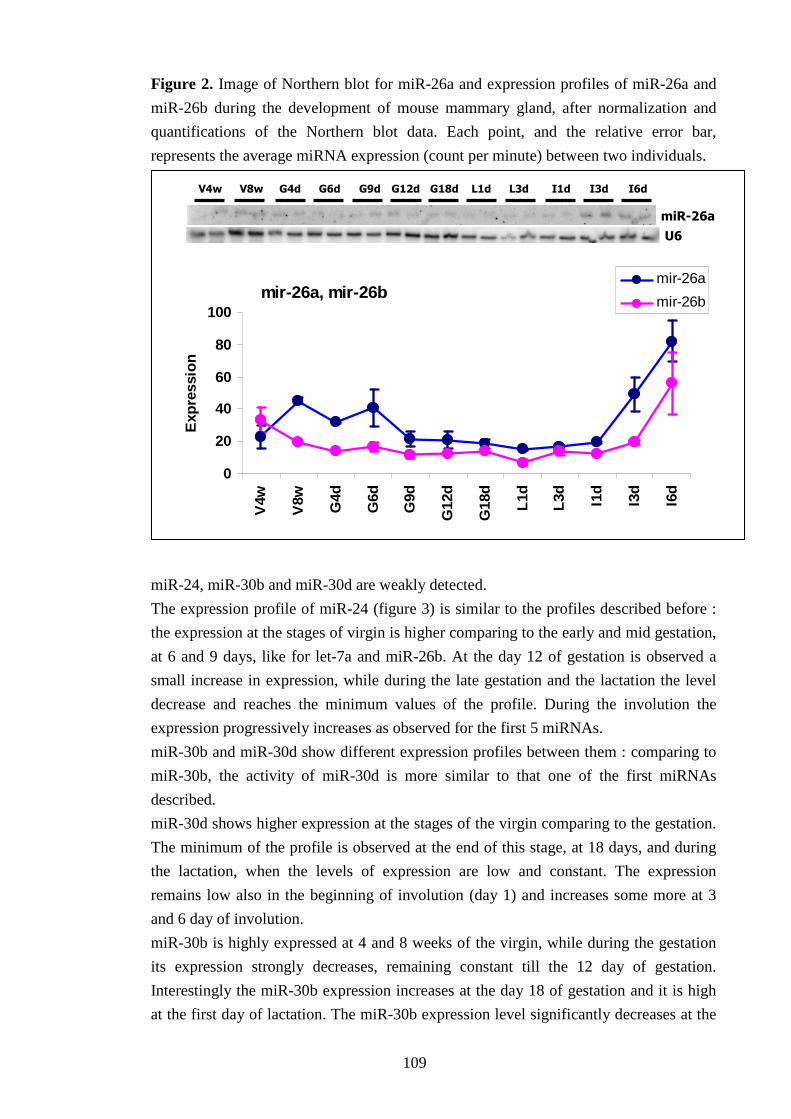
109
Figure 2. Image of Northern blot for miR-26a and expression profiles of miR-26a and
miR-26b during the development of mouse mammary gland, after normalization and
quantifications of the Northern blot data. Each point, and the relative error bar,
represents the average miRNA expression (count per minute) between two individuals.
miR-24, miR-30b and miR-30d are weakly detected.
The expression profile of miR-24 (figure 3) is similar to the profiles described before :
the expression at the stages of virgin is higher comparing to the early and mid gestation,
at 6 and 9 days, like for let-7a and miR-26b. At the day 12 of gestation is observed a
small increase in expression, while during the late gestation and the lactation the level
decrease and reaches the minimum values of the profile. During the involution the
expression progressively increases as observed for the first 5 miRNAs.
miR-30b and miR-30d show different expression profiles between them : comparing to
miR-30b, the activity of miR-30d is more similar to that one of the first miRNAs
described.
miR-30d shows higher expression at the stages of the virgin comparing to the gestation.
The minimum of the profile is observed at the end of this stage, at 18 days, and during
the lactation, when the levels of expression are low and constant. The expression
remains low also in the beginning of involution (day 1) and increases some more at 3
and 6 day of involution.
miR-30b is highly expressed at 4 and 8 weeks of the virgin, while during the gestation
its expression strongly decreases, remaining constant till the 12 day of gestation.
Interestingly the miR-30b expression increases at the day 18 of gestation and it is high
at the first day of lactation. The miR-30b expression level significantly decreases at the
V8w G4d G6d G9d G12d G18d L1d L3d I1d I3d I6d V4w
miR-26a
U6
mir-26a, mir-26b
0
20
40
60
80
100
V4w
V8w G4d
G6d
G9d
G12
d
G18
d
L1d
L3d
I1d
I3d
I6d
Exp
ress
ion
mir-26a
mir-26b
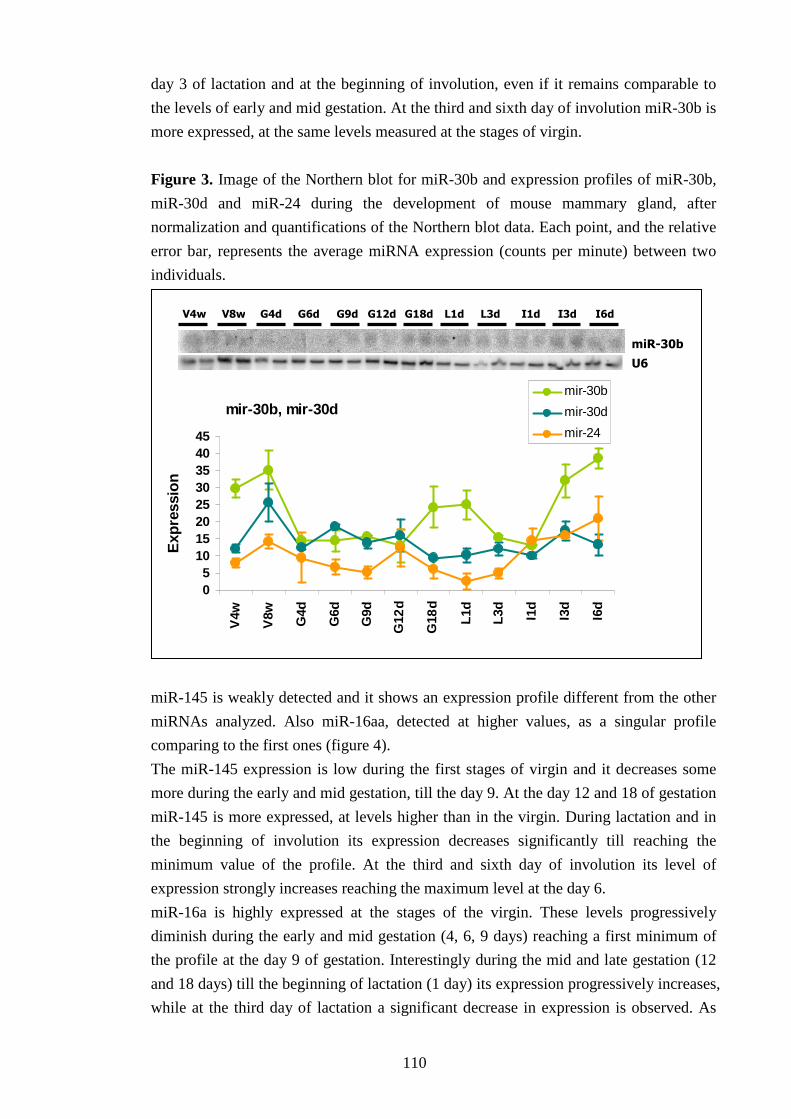
110
day 3 of lactation and at the beginning of involution, even if it remains comparable to
the levels of early and mid gestation. At the third and sixth day of involution miR-30b is
more expressed, at the same levels measured at the stages of virgin.
Figure 3. Image of the Northern blot for miR-30b and expression profiles of miR-30b,
miR-30d and miR-24 during the development of mouse mammary gland, after
normalization and quantifications of the Northern blot data. Each point, and the relative
error bar, represents the average miRNA expression (counts per minute) between two
individuals.
miR-145 is weakly detected and it shows an expression profile different from the other
miRNAs analyzed. Also miR-16aa, detected at higher values, as a singular profile
comparing to the first ones (figure 4).
The miR-145 expression is low during the first stages of virgin and it decreases some
more during the early and mid gestation, till the day 9. At the day 12 and 18 of gestation
miR-145 is more expressed, at levels higher than in the virgin. During lactation and in
the beginning of involution its expression decreases significantly till reaching the
minimum value of the profile. At the third and sixth day of involution its level of
expression strongly increases reaching the maximum level at the day 6.
miR-16a is highly expressed at the stages of the virgin. These levels progressively
diminish during the early and mid gestation (4, 6, 9 days) reaching a first minimum of
the profile at the day 9 of gestation. Interestingly during the mid and late gestation (12
and 18 days) till the beginning of lactation (1 day) its expression progressively increases,
while at the third day of lactation a significant decrease in expression is observed. As
mir-30b, mir-30d
05
1015202530354045
V4w
V8w G4d
G6d
G9d
G12
d
G18
d
L1d
L3d I 1d
I 3d
I6d
Exp
ress
ion
mir-30b
mir-30d
mir-24
V8w G4d G6d G9d G12d G18d L1d L3d I1d I3d I6d V4w
miR-30b
U6
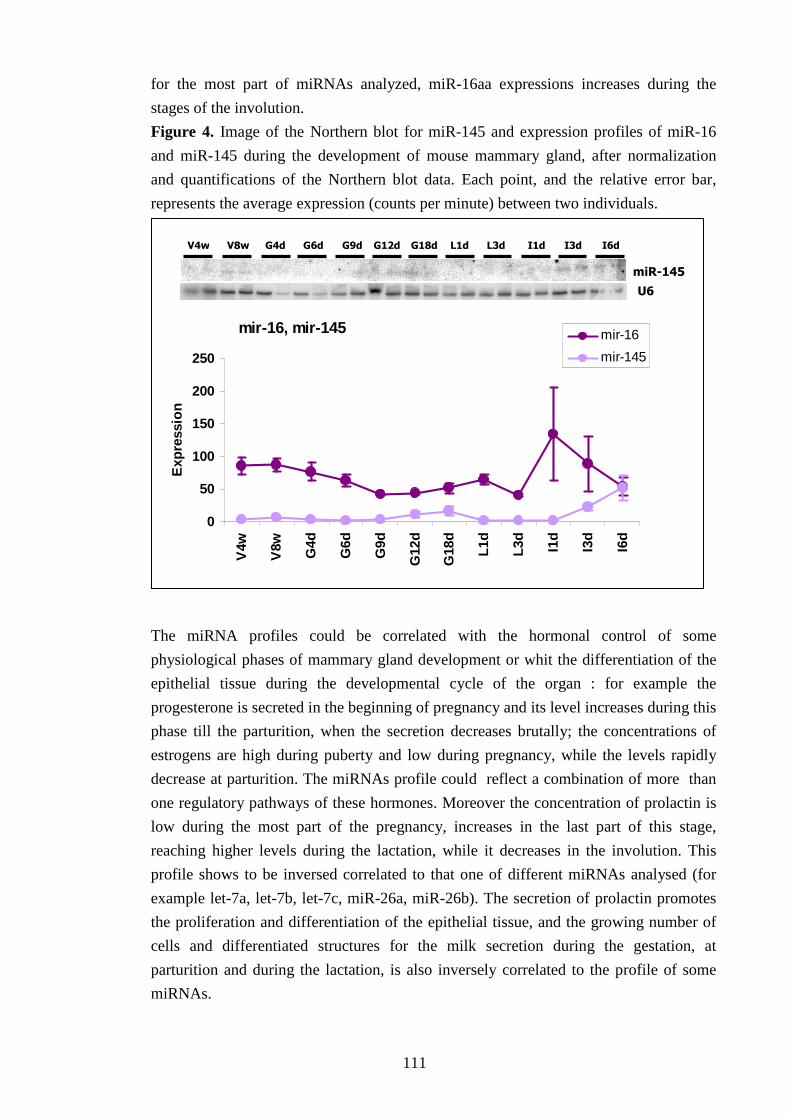
111
for the most part of miRNAs analyzed, miR-16aa expressions increases during the
stages of the involution.
Figure 4. Image of the Northern blot for miR-145 and expression profiles of miR-16
and miR-145 during the development of mouse mammary gland, after normalization
and quantifications of the Northern blot data. Each point, and the relative error bar,
represents the average expression (counts per minute) between two individuals.
The miRNA profiles could be correlated with the hormonal control of some
physiological phases of mammary gland development or whit the differentiation of the
epithelial tissue during the developmental cycle of the organ : for example the
progesterone is secreted in the beginning of pregnancy and its level increases during this
phase till the parturition, when the secretion decreases brutally; the concentrations of
estrogens are high during puberty and low during pregnancy, while the levels rapidly
decrease at parturition. The miRNAs profile could reflect a combination of more than
one regulatory pathways of these hormones. Moreover the concentration of prolactin is
low during the most part of the pregnancy, increases in the last part of this stage,
reaching higher levels during the lactation, while it decreases in the involution. This
profile shows to be inversed correlated to that one of different miRNAs analysed (for
example let-7a, let-7b, let-7c, miR-26a, miR-26b). The secretion of prolactin promotes
the proliferation and differentiation of the epithelial tissue, and the growing number of
cells and differentiated structures for the milk secretion during the gestation, at
parturition and during the lactation, is also inversely correlated to the profile of some
miRNAs.
mir-16, mir-145
0
50
100
150
200
250
V4w
V8w G4d
G6d
G9d
G12
d
G18
d
L1d
L3d
I1d
I3d
I6d
Exp
ress
ion
mir-16
mir-145
V8w G4d G6d G9d G12d G18d L1d L3d I1d I3d I6d V4w
miR-145
U6
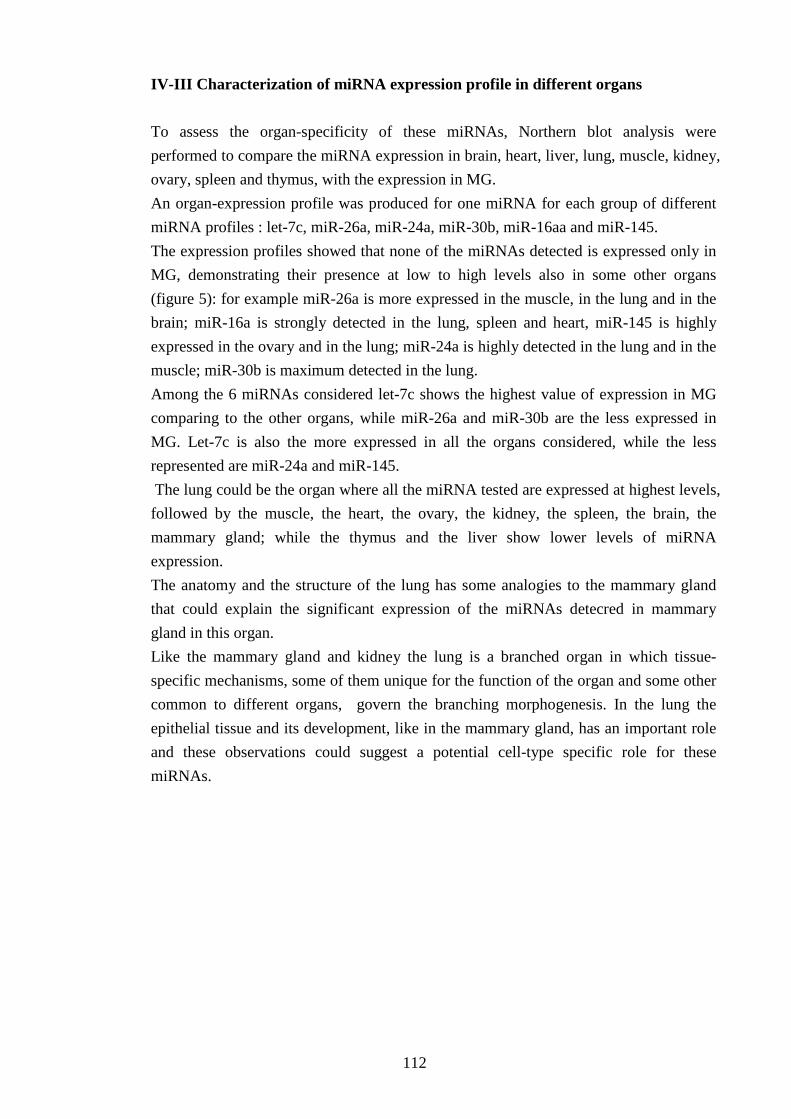
112
IV-III Characterization of miRNA expression profile in different organs
To assess the organ-specificity of these miRNAs, Northern blot analysis were
performed to compare the miRNA expression in brain, heart, liver, lung, muscle, kidney,
ovary, spleen and thymus, with the expression in MG.
An organ-expression profile was produced for one miRNA for each group of different
miRNA profiles : let-7c, miR-26a, miR-24a, miR-30b, miR-16aa and miR-145.
The expression profiles showed that none of the miRNAs detected is expressed only in
MG, demonstrating their presence at low to high levels also in some other organs
(figure 5): for example miR-26a is more expressed in the muscle, in the lung and in the
brain; miR-16a is strongly detected in the lung, spleen and heart, miR-145 is highly
expressed in the ovary and in the lung; miR-24a is highly detected in the lung and in the
muscle; miR-30b is maximum detected in the lung.
Among the 6 miRNAs considered let-7c shows the highest value of expression in MG
comparing to the other organs, while miR-26a and miR-30b are the less expressed in
MG. Let-7c is also the more expressed in all the organs considered, while the less
represented are miR-24a and miR-145.
The lung could be the organ where all the miRNA tested are expressed at highest levels,
followed by the muscle, the heart, the ovary, the kidney, the spleen, the brain, the
mammary gland; while the thymus and the liver show lower levels of miRNA
expression.
The anatomy and the structure of the lung has some analogies to the mammary gland
that could explain the significant expression of the miRNAs detecred in mammary
gland in this organ.
Like the mammary gland and kidney the lung is a branched organ in which tissue-
specific mechanisms, some of them unique for the function of the organ and some other
common to different organs, govern the branching morphogenesis. In the lung the
epithelial tissue and its development, like in the mammary gland, has an important role
and these observations could suggest a potential cell-type specific role for these
miRNAs.
113
Figure 5. Images of two Northern blot, for miR-16a and miR-26a and expression data
of let-7c, miR-26a, miR-24a, miR-30b, miR-16a and miR-145, in ten different mouse
organs, after quantifications of Northern blot data. Each column, and the relative error
bar, represents the average value (counts per minute) between two individuals.
IV-IV Detecting miRNA cellular origin
The miRNAs expression profiles in the developing MG demonstrate a temporal control
of miRNA expression, that could show indirectly a possible miRNA regulatory role on
the succeeding stages of MG development.
The MG is composed of two main tissue-compartment : the stroma, or ‘fat pad’,
constituted by different cellular types, such as fibroblast, adipocytes and cells of
connective tissue, and the epithelial tissue.
In order to get deeper insight about the expression of the miRNAs in MG it was
examined their cellular origin.
The aim of the experiment was to discover if the expression of miRNAs is specific of
one of the two main tissue-compartment.
let-7c, mir-26a, mir-24a, mir-30b, mir-16, mir-145
0
10
20
30
40
50
60
Brain
HeartLiv
e r
Mam.gl
and
Musc le
Ovary
Lung
Spleen
Kidney
Thym
us
Exp
ress
ion
let-7c
mir-26a
mir-24a
mir-30b
mir-16
mir-145
Brain Heart Liver Mam. gl. Muscle Ovary Lung Spleen Kidney Thymus
miR-
U6
Brain Heart Liver Mam. gl. Muscle Ovary Lung Spleen Kidney Thymus
miR-26a
U6
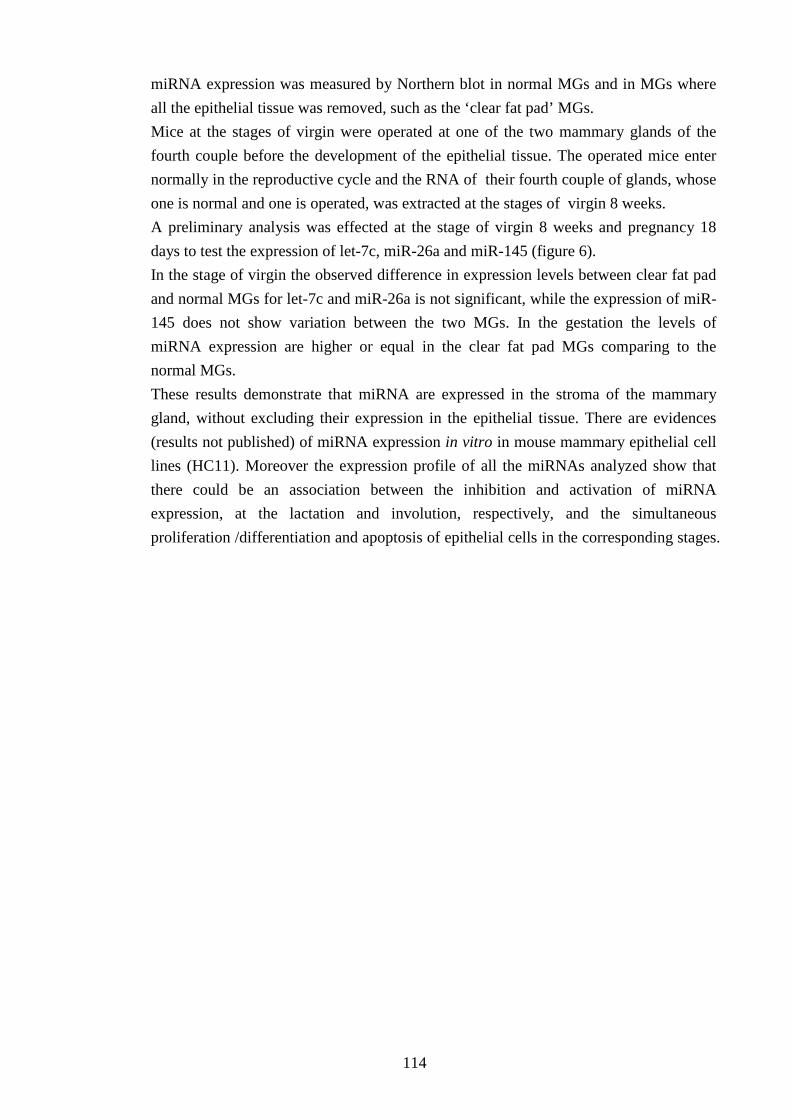
114
miRNA expression was measured by Northern blot in normal MGs and in MGs where
all the epithelial tissue was removed, such as the ‘clear fat pad’ MGs.
Mice at the stages of virgin were operated at one of the two mammary glands of the
fourth couple before the development of the epithelial tissue. The operated mice enter
normally in the reproductive cycle and the RNA of their fourth couple of glands, whose
one is normal and one is operated, was extracted at the stages of virgin 8 weeks.
A preliminary analysis was effected at the stage of virgin 8 weeks and pregnancy 18
days to test the expression of let-7c, miR-26a and miR-145 (figure 6).
In the stage of virgin the observed difference in expression levels between clear fat pad
and normal MGs for let-7c and miR-26a is not significant, while the expression of miR-
145 does not show variation between the two MGs. In the gestation the levels of
miRNA expression are higher or equal in the clear fat pad MGs comparing to the
normal MGs.
These results demonstrate that miRNA are expressed in the stroma of the mammary
gland, without excluding their expression in the epithelial tissue. There are evidences
(results not published) of miRNA expression in vitro in mouse mammary epithelial cell
lines (HC11). Moreover the expression profile of all the miRNAs analyzed show that
there could be an association between the inhibition and activation of miRNA
expression, at the lactation and involution, respectively, and the simultaneous
proliferation /differentiation and apoptosis of epithelial cells in the corresponding stages.
115
Figure 6. Image of the Northern blot for let-7c and expression data of let-7c, miR-26a
and miR-145, represented like column after normalization of Northern blot data, in clear
fat pad, C, MGs, and in normal, N, MGs at the stage of virgin 8 weeks and gestation 18
days. Each column, and the relative error bar, represents the average value (counts per
minute) between two individuals.
IV-V Cloning new miRNA in mammary gland
The mammary gland is an evolutionary recent organ that accomplish the lactation, a
unique function that characterizes mammals.
Recent evidences about organ- and tissue-specific miRNAs (Lagos-Quintana et al.,
2002; Liu et al., 2004; Sempere et al., 2004; Pay et al., 2004; Frederikde et al., 2006;
Ryan et al., 2006; Chen et al., 2006, Ramkisson et al., 2006; Coutinho et al., 2006; Xu
et al., 2006; Gu et al., 2006) and primate-specific miRNAs (Devor, 2006) suggested the
existence of miRNAs specific of the MG, other than the conserved miRNAs already
noted in the microRNA registry and/or discovered in other species.
For this reason libraries of miRNAs extracted from mouse mammary gland at some
stages of its development have been built. These libraries were screened in search for
inserts corresponding to reliable miRNAs; ultimately different approaches were used to
validate these ‘candidate miRNAs’, describing their expression in mammary gland and
their maturation from the potential precursor in vitro.
let-7c, mir-26a, mir-145
020406080
100120140160180
let-7c mir-26a mir-145 let-7c mir-26a mir-145
V8w G18d
Exp
ress
ion
clear fat pad
normal
V8wC V8wC V8wN V8wN G18dC G18dN G18dC G18dN
let-7c
U6
116
The cloning protocol was performed on RNA samples of mammary glands of mouse at
the stage of virgin 8 weeks, gestation 2-, 6- and 18-days and involution 1-day, in order
to cover as much as possible the cycle of MG development.
Between the colonies potentially transformed, 340 of them (13,6%) resulted positive to
a PCR test for the insertion in the vector of an insert of the attended size (70
nucleotides).
The inserts of these 340 colonies were sequenced.
The nucleotide sequences were analyzed and, after a preliminary alignment (CLUSTAL
W, attached 1), which was performed to identify the redundant sequences, 88 clones
(26% of the total sequenced), whose 24 were redundant, showed an insertion fragment
of the characteristic length of miRNAs (19 to 25-27 nucleotides) (table 6).
In the multiple alignment some fragments have very similar sequence (90% of identity)
between them, but all the inserts having at least 1 nucleotide different were considered
like independent fragments. Many fragments share a significant part (25-90% : 5-18
nucleotides on an average sequence of 22) of the sequence, positioned in the beginning,
in the center or in the end of the sequence.
In the microRNA registry miRNAs with identical mature sequence or with sequences
different for one or two nucleotides have the same name, even if they are cloned from
different species or if they originate from separate genomic loci. These miRNAs are
grouped in the same family, thus it could be possible to consider only a small number of
the inserts cloned belonging to the same family.
The inserts with more different sequences, but which share an homology of 8-18
nucleotides could have sequence similarity in the hairpin portion of the primary
transcript and could originate from the same hairpin precursor, for example from the
two arms of it, like it is reported in literature (Lau et al., 2001; Lagos-Quintana et al.,
2002).
A miRNA common target in animals could be present for all the miRNAs which have a
consecutive string of 7-8 nucleotides, the ‘seed’ or ‘nucleus’ string, at the 5’end of their
sequence, which is responsible of the pairing to the mRNA target.
The sequences aligned often share a ‘seed sequence’ and it could be suggested a similar
role for some of them.
The 340 cloned fragments were divided in : 55 clones whose insert was extracted from
the total RNA at the stage of virgin at 8 weeks, 93 from the gestation at 2 days, 54 from
the stage of gestation at 6 days and 91 at 18 days, 47 from the involution at the first day
(table 5).
The half of the 64 clones selected were extracted from the stage of gestation at 18 days,
while the other half is divided in equal fractions in clones from the stages of virgin 8
weeks, gestation 2 days, involution 1 day, and only a minority (2 clones) come from the
stage of gestation 6 days.
117
It is evident from these data that not all the stages contributed at the same level to the
production of a cDNA library of potential miRNAs. In particular, in relations to the
number of clones sequenced, a significant fraction of clones from the stages of gestation
at 18 days and the involution at 1 day contains potential miRNAs, the stages of virgin
and gestation at 2 days contributed at inferior level, while the stage of gestation at 6
days does not contribute substantially to the construction of miRNA libraries.
It is not known why most part (25 and 33%, respectively) of the 64 clones derived from
the stages of gestation 18 days and involution 1 day, and only in modest part from the
stages of virgin and gestation 2 days. It is possible to suppose that miRNAs are more
abundant in late gestating and involuting mouse mammary glands, but it is also
important to note that the cloning protocol was not applied at the same time for all the
samples, increasing an already high number of variables present in this long and
difficult technique.
Table 5. Distribution of the number of sequenced clones, including the redundant and
the clones bringing the insertion fragment of the correct length, and the relative
percentage of this category in each of the stage of extraction.
Stage N°clones sequenced N° clones inserts of 19-27 nt
%clones relative to 64
Virgin 8w 55 8 11% Gest. 2d 93 12 19% Gest. 6d 54 2 3% Gest. 18d 91 30 48% Invol.1d 47 12 19% Total 340 64 100%
The remaining sequenced clones (252) are : 180 clones (53% of the total sequenced)
that contain only primers used for the cloning; 65 clones (19.1% of the total sequenced)
that contain short inserts of 12-18 nucleotides, that could be RNA fragments coming
from degradation of RNA transcripts or ribosomal, like it was verified for some of them
blasting their sequence in the mouse genome database; 2 clones that have a longer (35-
40 nt) insertion fragments (0.6% of the total sequenced) and 5 clones (1.5% of the total
sequenced) that contain a fragment not sequencable.
IV-VI Validating potential miRNAs
Different approaches have been described in literature to confirm a miRNA, based on
the definition of its most important features. The following characteristics need to be
demonstrated : the miRNAs should have a precursor of 60-80 nucleotides, with a typical
imperfect stem-loop structure in which the miRNAs is located in the stem part of one of
the two arms (1); a miRNAs should be expressed like a transcript of 19-25 nucleotides
118
(2); the miRNA should be matured from the stage of miRNA precursor (pre-miR) by
the activity of Dicer enzyme in the cytoplasm (3).
It was planned a combinatorial strategy, in part using bioinformatics tools and in part
experimental, to confirm some of the fragments cloned like candidate miRNAs.
IV-VI-a Evaluating the precursor secondary structure
A necessary requirement to confirm a short RNA sequence as a miRNA is the detection
of the typical pre-miR having a particular length and secondary structure.
An in silico analysis was performed for each of the 64 cloned inserts to localize them in
the mouse genome and to find the presence of a miRNA precursor in this identified
genomic region.
First the sequences of these cloned fragments were blasted in the murine EST database,
to search if they are part of studied genes. Secondly the sequences were searched in the
miRNA registry, to know if they are already annotated and discover eventual
similarities or identities (table 6).
In the EST-mouse database the 64 fragments matched, with higher or lower similarity,
inside cDNA clones of different kind of mouse cDNA library.
A second analysis in the miRNA registry was effectuated to verify that the cloned
fragments were not miRNA already known and annotated and to search eventually
similarity with others miRNAs.
Blasting the short sequence of each insertion fragment the software provided a list of
the most similar miRNA present in the registry. In the table is reported for each cloned
inserts the most similar match found, and the sequence homology to the corresponding
miRNA.
For 24 fragments (37% of the total) the software did not find any match or found some
miRNA that were weakly similar to the fragment of interest (sequence homology <
50%), that were not inserted in the table.
For 40 fragments (63% of the total) it is reported a match with a miRNA, even if the
degree of sequence homology is highly variable, ranging from the 50% to the 86%, with
a 100% of identity for G18n273 and V11 (from the stage of gestation 18 days and virgin
8 weeks), respectively to the sequence of let-7b and let-7c, two ubiquitous miRNAs
belonging to the same family, finding which constituted a positive control of the cloning
protocol.
Amongst the 40 more interesting fragments 14 (33%) match with mouse miRNAs, 16
( 41%) with humans miRNAs, the remaining 10 (26%) match with miRNAs of different
species, such as Drosofila or Caenorabditis elegans and others.
Some fragments with similar sequence match with the same miRNA.
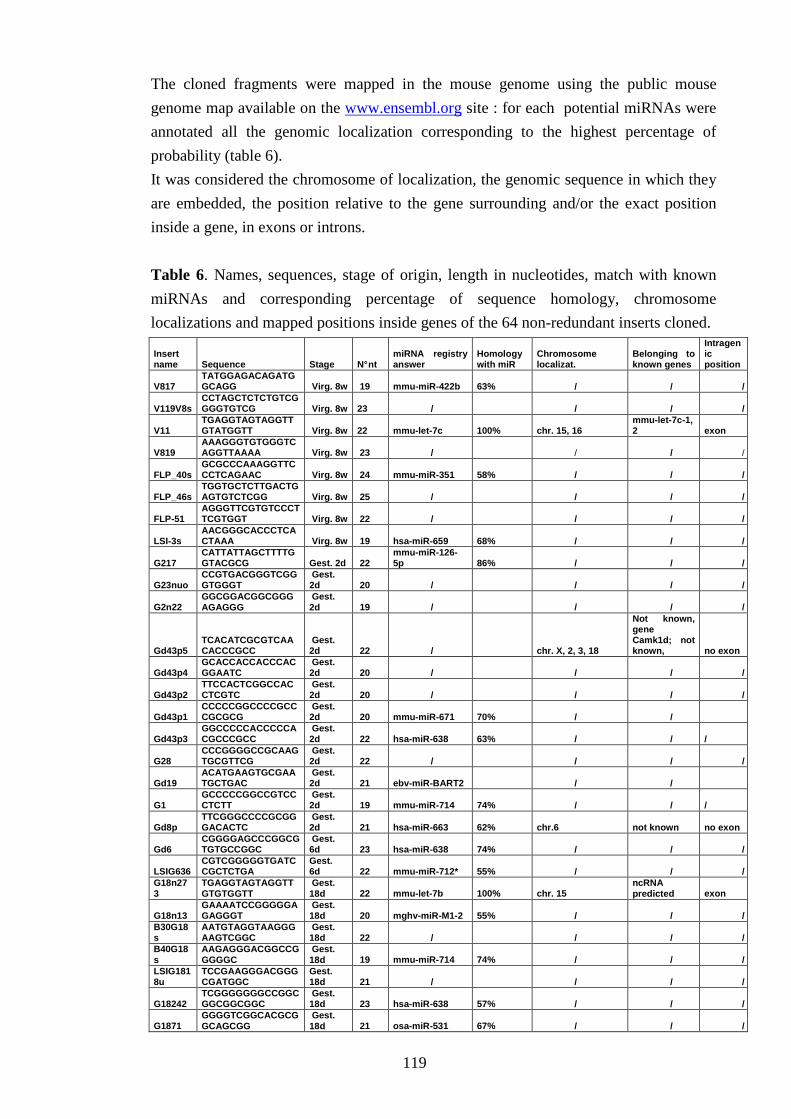
119
The cloned fragments were mapped in the mouse genome using the public mouse
genome map available on the www.ensembl.org site : for each potential miRNAs were
annotated all the genomic localization corresponding to the highest percentage of
probability (table 6).
It was considered the chromosome of localization, the genomic sequence in which they
are embedded, the position relative to the gene surrounding and/or the exact position
inside a gene, in exons or introns.
Table 6. Names, sequences, stage of origin, length in nucleotides, match with known
miRNAs and corresponding percentage of sequence homology, chromosome
localizations and mapped positions inside genes of the 64 non-redundant inserts cloned.
Insert name Sequence Stage N° nt
miRNA registry answer
Homology with miR
Chromosome localizat.
Belonging to known genes
Intragenic position
V817 TATGGAGACAGATGGCAGG Virg. 8w 19 mmu-miR-422b 63% / / /
V119V8s CCTAGCTCTCTGTCGGGGTGTCG Virg. 8w 23 / / / /
V11 TGAGGTAGTAGGTTGTATGGTT Virg. 8w 22 mmu-let-7c 100% chr. 15, 16
mmu-let-7c-1, 2 exon
V819 AAAGGGTGTGGGTCAGGTTAAAA Virg. 8w 23 / / / /
FLP_40s GCGCCCAAAGGTTCCCTCAGAAC Virg. 8w 24 mmu-miR-351 58% / / /
FLP_46s TGGTGCTCTTGACTGAGTGTCTCGG Virg. 8w 25 / / / /
FLP-51 AGGGTTCGTGTCCCTTCGTGGT Virg. 8w 22 / / / /
LSI-3s AACGGGCACCCTCACTAAA Virg. 8w 19 hsa-miR-659 68% / / /
G217 CATTATTAGCTTTTGGTACGCG Gest. 2d 22
mmu-miR-126-5p 86% / / /
G23nuo CCGTGACGGGTCGGGTGGGT
Gest. 2d 20 / / / /
G2n22 GGCGGACGGCGGGAGAGGG
Gest. 2d 19 / / / /
Gd43p5 TCACATCGCGTCAACACCCGCC
Gest. 2d 22 / chr. X, 2, 3, 18
Not known, gene Camk1d; not known, no exon
Gd43p4 GCACCACCACCCACGGAATC
Gest. 2d 20 / / / /
Gd43p2 TTCCACTCGGCCACCTCGTC
Gest. 2d 20 / / / /
Gd43p1 CCCCCGGCCCCGCCCGCGCG
Gest. 2d 20 mmu-miR-671 70% / /
Gd43p3 GGCCCCCACCCCCACGCCCGCC
Gest. 2d 22 hsa-miR-638 63% / / /
G28 CCCGGGGCCGCAAGTGCGTTCG
Gest. 2d 22 / / / /
Gd19 ACATGAAGTGCGAATGCTGAC
Gest. 2d 21 ebv-miR-BART2 / /
G1 GCCCCCGGCCGTCCCTCTT
Gest. 2d 19 mmu-miR-714 74% / / /
Gd8p TTCGGGCCCCGCGGGACACTC
Gest. 2d 21 hsa-miR-663 62% chr.6 not known no exon
Gd6 CGGGGAGCCCGGCGTGTGCCGGC
Gest. 6d 23 hsa-miR-638 74% / / /
LSIG636 CGTCGGGGGTGATCCGCTCTGA
Gest. 6d 22 mmu-miR-712* 55% / / /
G18n273
TGAGGTAGTAGGTTGTGTGGTT
Gest. 18d 22 mmu-let-7b 100% chr. 15
ncRNA predicted exon
G18n13 GAAAATCCGGGGGAGAGGGT
Gest. 18d 20 mghv-miR-M1-2 55% / / /
B30G18s
AATGTAGGTAAGGGAAGTCGGC
Gest. 18d 22 / / / /
B40G18s
AAGAGGGACGGCCGGGGGC
Gest. 18d 19 mmu-miR-714 74% / / /
LSIG1818u
TCCGAAGGGACGGGCGATGGC
Gest. 18d 21 / / / /
G18242 TCGGGGGGGCCGGCGGCGGCGGC
Gest. 18d 23 hsa-miR-638 57% / / /
G1871 GGGGTCGGCACGCGGCAGCGG
Gest. 18d 21 osa-miR-531 67% / / /
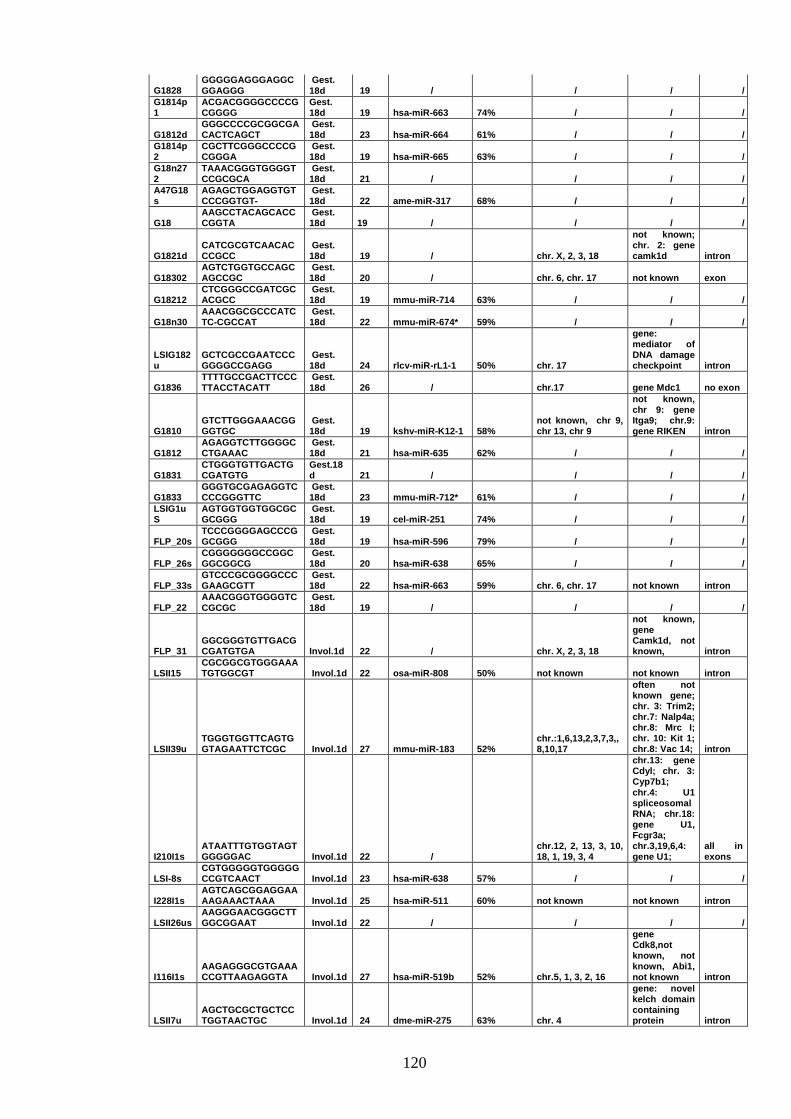
120
G1828 GGGGGAGGGAGGCGGAGGG
Gest. 18d 19 / / / /
G1814p1
ACGACGGGGCCCCGCGGGG
Gest. 18d 19 hsa-miR-663 74% / / /
G1812d GGGCCCCGCGGCGACACTCAGCT
Gest. 18d 23 hsa-miR-664 61% / / /
G1814p2
CGCTTCGGGCCCCGCGGGA
Gest. 18d 19 hsa-miR-665 63% / / /
G18n272
TAAACGGGTGGGGTCCGCGCA
Gest. 18d 21 / / / /
A47G18s
AGAGCTGGAGGTGTCCCGGTGT-
Gest. 18d 22 ame-miR-317 68% / / /
G18 AAGCCTACAGCACCCGGTA
Gest. 18d 19 / / / /
G1821d CATCGCGTCAACACCCGCC
Gest. 18d 19 / chr. X, 2, 3, 18
not known; chr. 2: gene camk1d intron
G18302 AGTCTGGTGCCAGCAGCCGC
Gest. 18d 20 / chr. 6, chr. 17 not known exon
G18212 CTCGGGCCGATCGCACGCC
Gest. 18d 19 mmu-miR-714 63% / / /
G18n30 AAACGGCGCCCATCTC-CGCCAT
Gest. 18d 22 mmu-miR-674* 59% / / /
LSIG182u
GCTCGCCGAATCCCGGGGCCGAGG
Gest. 18d 24 rlcv-miR-rL1-1 50% chr. 17
gene: mediator of DNA damage checkpoint intron
G1836 TTTTGCCGACTTCCCTTACCTACATT
Gest. 18d 26 / chr.17 gene Mdc1 no exon
G1810 GTCTTGGGAAACGGGGTGC
Gest. 18d 19 kshv-miR-K12-1 58%
not known, chr 9, chr 13, chr 9
not known, chr 9: gene Itga9; chr.9: gene RIKEN intron
G1812 AGAGGTCTTGGGGCCTGAAAC
Gest. 18d 21 hsa-miR-635 62% / / /
G1831 CTGGGTGTTGACTGCGATGTG
Gest.18d 21 / / / /
G1833 GGGTGCGAGAGGTCCCCGGGTTC
Gest. 18d 23 mmu-miR-712* 61% / / /
LSIG1uS
AGTGGTGGTGGCGCGCGGG
Gest. 18d 19 cel-miR-251 74% / / /
FLP_20s TCCCGGGGAGCCCGGCGGG
Gest. 18d 19 hsa-miR-596 79% / / /
FLP_26s CGGGGGGGCCGGCGGCGGCG
Gest. 18d 20 hsa-miR-638 65% / / /
FLP_33s GTCCCGCGGGGCCCGAAGCGTT
Gest. 18d 22 hsa-miR-663 59% chr. 6, chr. 17 not known i ntron
FLP_22 AAACGGGTGGGGTCCGCGC
Gest. 18d 19 / / / /
FLP_31 GGCGGGTGTTGACGCGATGTGA Invol.1d 22 / chr. X, 2, 3, 18
not known, gene Camk1d, not known, intron
LSII15 CGCGGCGTGGGAAATGTGGCGT Invol.1d 22 osa-miR-808 50% not known no t known intron
LSII39u TGGGTGGTTCAGTGGTAGAATTCTCGC Invol.1d 27 mmu-miR-183 52%
chr.:1,6,13,2,3,7,3,,8,10,17
often not known gene; chr. 3: Trim2; chr.7: Nalp4a; chr.8: Mrc I; chr. 10: Kit 1; chr.8: Vac 14; intron
I210I1s ATAATTTGTGGTAGTGGGGGAC Invol.1d 22 /
chr.12, 2, 13, 3, 10, 18, 1, 19, 3, 4
chr.13: gene Cdyl; chr. 3: Cyp7b1; chr.4: U1 spliceosomal RNA; chr.18: gene U1, Fcgr3a; chr.3,19,6,4: gene U1;
all in exons
LSI-8s CGTGGGGGTGGGGGCCGTCAACT Invol.1d 23 hsa-miR-638 57% / / /
I228I1s AGTCAGCGGAGGAAAAGAAACTAAA Invol.1d 25 hsa-miR-511 60% not known not known intron
LSII26us AAGGGAACGGGCTTGGCGGAAT Invol.1d 22 / / / /
I116I1s AAGAGGGCGTGAAACCGTTAAGAGGTA Invol.1d 27 hsa-miR-519b 52% chr.5, 1, 3, 2, 16
gene Cdk8,not known, not known, Abi1, not known intron
LSII7u AGCTGCGCTGCTCCTGGTAACTGC Invol.1d 24 dme-miR-275 63% chr. 4
gene: novel kelch domain containing protein intron
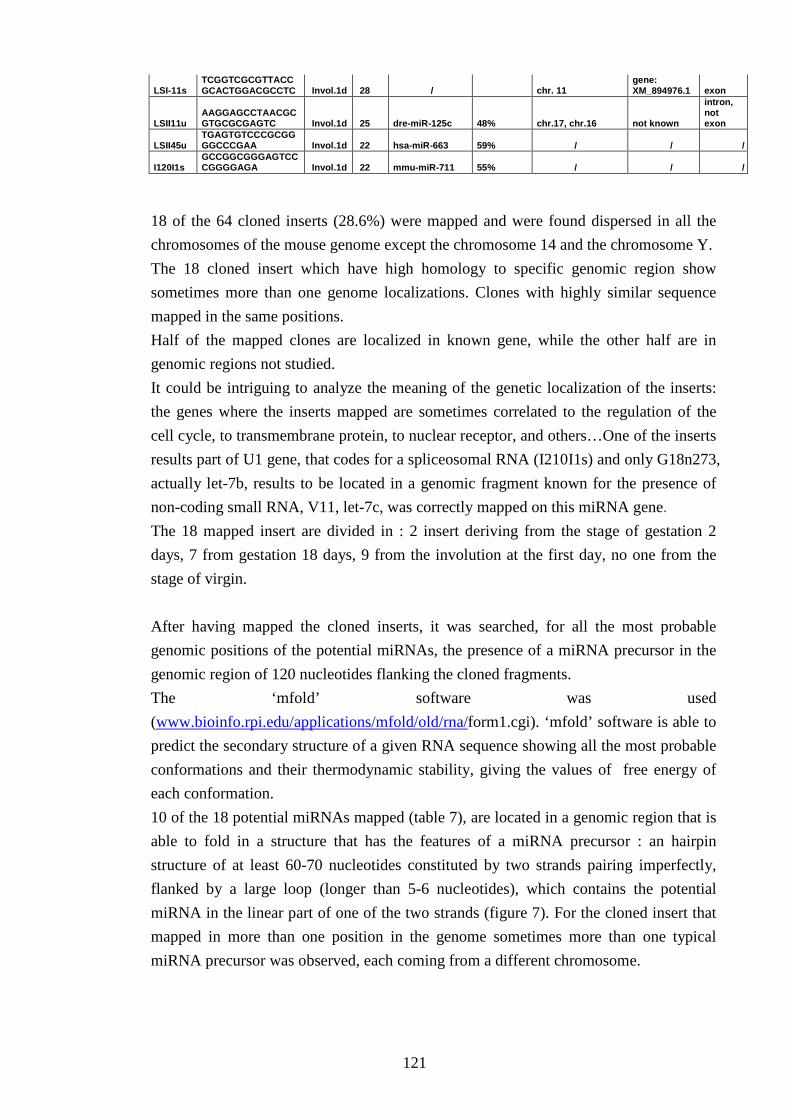
121
LSI-11s TCGGTCGCGTTACCGCACTGGACGCCTC Invol.1d 28 / chr. 11
gene: XM_894976.1 exon
LSII11u AAGGAGCCTAACGCGTGCGCGAGTC Invol.1d 25 dre-miR-125c 48% chr.17, chr.16 not known
intron, not exon
LSII45u TGAGTGTCCCGCGGGGCCCGAA Invol.1d 22 hsa-miR-663 59% / / /
I120I1s GCCGGCGGGAGTCCCGGGGAGA Invol.1d 22 mmu-miR-711 55% / / /
18 of the 64 cloned inserts (28.6%) were mapped and were found dispersed in all the
chromosomes of the mouse genome except the chromosome 14 and the chromosome Y.
The 18 cloned insert which have high homology to specific genomic region show
sometimes more than one genome localizations. Clones with highly similar sequence
mapped in the same positions.
Half of the mapped clones are localized in known gene, while the other half are in
genomic regions not studied.
It could be intriguing to analyze the meaning of the genetic localization of the inserts:
the genes where the inserts mapped are sometimes correlated to the regulation of the
cell cycle, to transmembrane protein, to nuclear receptor, and others…One of the inserts
results part of U1 gene, that codes for a spliceosomal RNA (I210I1s) and only G18n273,
actually let-7b, results to be located in a genomic fragment known for the presence of
non-coding small RNA, V11, let-7c, was correctly mapped on this miRNA gene.
The 18 mapped insert are divided in : 2 insert deriving from the stage of gestation 2
days, 7 from gestation 18 days, 9 from the involution at the first day, no one from the
stage of virgin.
After having mapped the cloned inserts, it was searched, for all the most probable
genomic positions of the potential miRNAs, the presence of a miRNA precursor in the
genomic region of 120 nucleotides flanking the cloned fragments.
The ‘mfold’ software was used
(www.bioinfo.rpi.edu/applications/mfold/old/rna/form1.cgi). ‘mfold’ software is able to
predict the secondary structure of a given RNA sequence showing all the most probable
conformations and their thermodynamic stability, giving the values of free energy of
each conformation.
10 of the 18 potential miRNAs mapped (table 7), are located in a genomic region that is
able to fold in a structure that has the features of a miRNA precursor : an hairpin
structure of at least 60-70 nucleotides constituted by two strands pairing imperfectly,
flanked by a large loop (longer than 5-6 nucleotides), which contains the potential
miRNA in the linear part of one of the two strands (figure 7). For the cloned insert that
mapped in more than one position in the genome sometimes more than one typical
miRNA precursor was observed, each coming from a different chromosome.
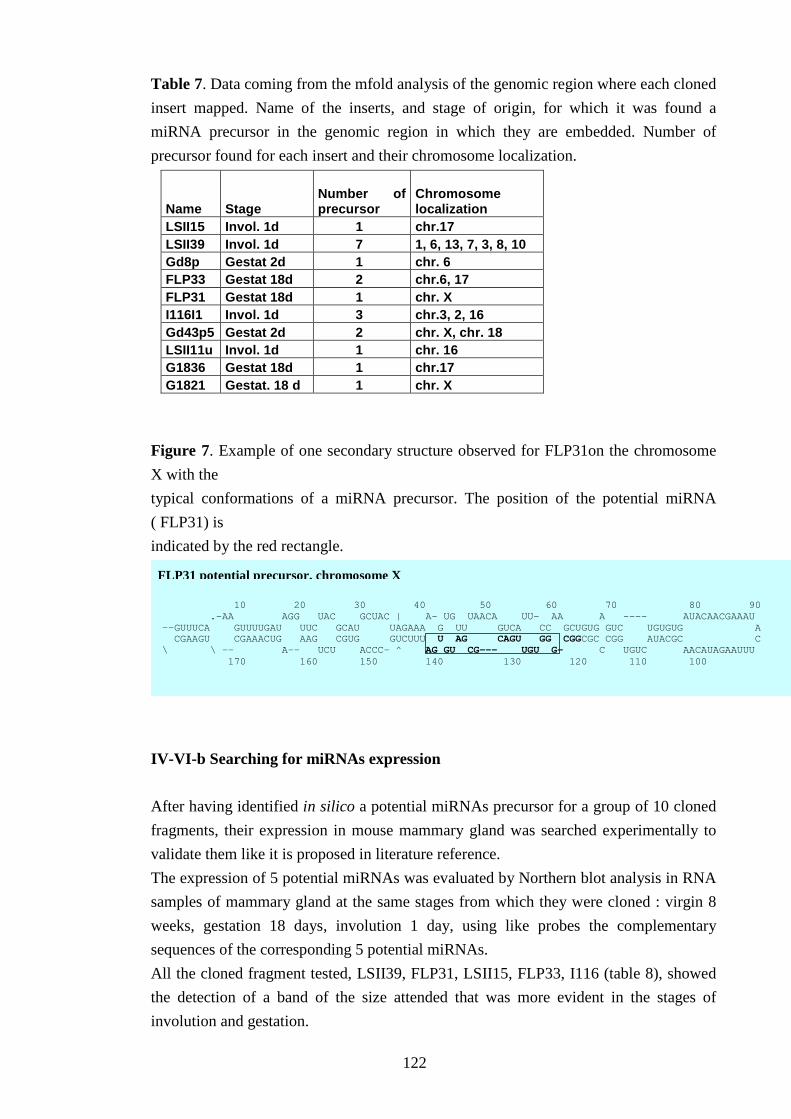
122
Table 7. Data coming from the mfold analysis of the genomic region where each cloned
insert mapped. Name of the inserts, and stage of origin, for which it was found a
miRNA precursor in the genomic region in which they are embedded. Number of
precursor found for each insert and their chromosome localization.
Name Stage
Number of precursor
Chromosome localization
LSII15 Invol. 1d 1 chr.17 LSII39 Invol. 1d 7 1, 6, 13, 7, 3, 8, 10 Gd8p Gestat 2d 1 chr. 6 FLP33 Gestat 18d 2 chr.6, 17 FLP31 Gestat 18d 1 chr. X I116I1 Invol. 1d 3 chr.3, 2, 16 Gd43p5 Gestat 2d 2 chr. X, chr. 18 LSII11u Invol. 1d 1 chr. 16 G1836 Gestat 18d 1 chr.17 G1821 Gestat. 18 d 1 chr. X
Figure 7. Example of one secondary structure observed for FLP31on the chromosome
X with the
typical conformations of a miRNA precursor. The position of the potential miRNA
( FLP31) is
indicated by the red rectangle.
IV-VI-b Searching for miRNAs expression
After having identified in silico a potential miRNAs precursor for a group of 10 cloned
fragments, their expression in mouse mammary gland was searched experimentally to
validate them like it is proposed in literature reference.
The expression of 5 potential miRNAs was evaluated by Northern blot analysis in RNA
samples of mammary gland at the same stages from which they were cloned : virgin 8
weeks, gestation 18 days, involution 1 day, using like probes the complementary
sequences of the corresponding 5 potential miRNAs.
All the cloned fragment tested, LSII39, FLP31, LSII15, FLP33, I116 (table 8), showed
the detection of a band of the size attended that was more evident in the stages of
involution and gestation.
10 20 30 40 50 60 70 80 90 .-AA AGG UAC GCUAC | A- UG UAACA UU- AA A ---- AUACAACGAAAU --GUUUCA GUUUUGAU UUC GCAU UAGAAA G UU GUCA CC GCUGUG GUC UGUGUG A CGAAGU CGAAACUG AAG CGUG GUCUUU U AG CAGU GG CGGCGC CGG AUACGC C \ \ -- A-- UCU ACCC- ^ AG GU CG--- UGU G- C UGUC AACAUAGAAUUU 170 160 150 140 130 120 110 100
FLP31 potential precursor, chromosome X
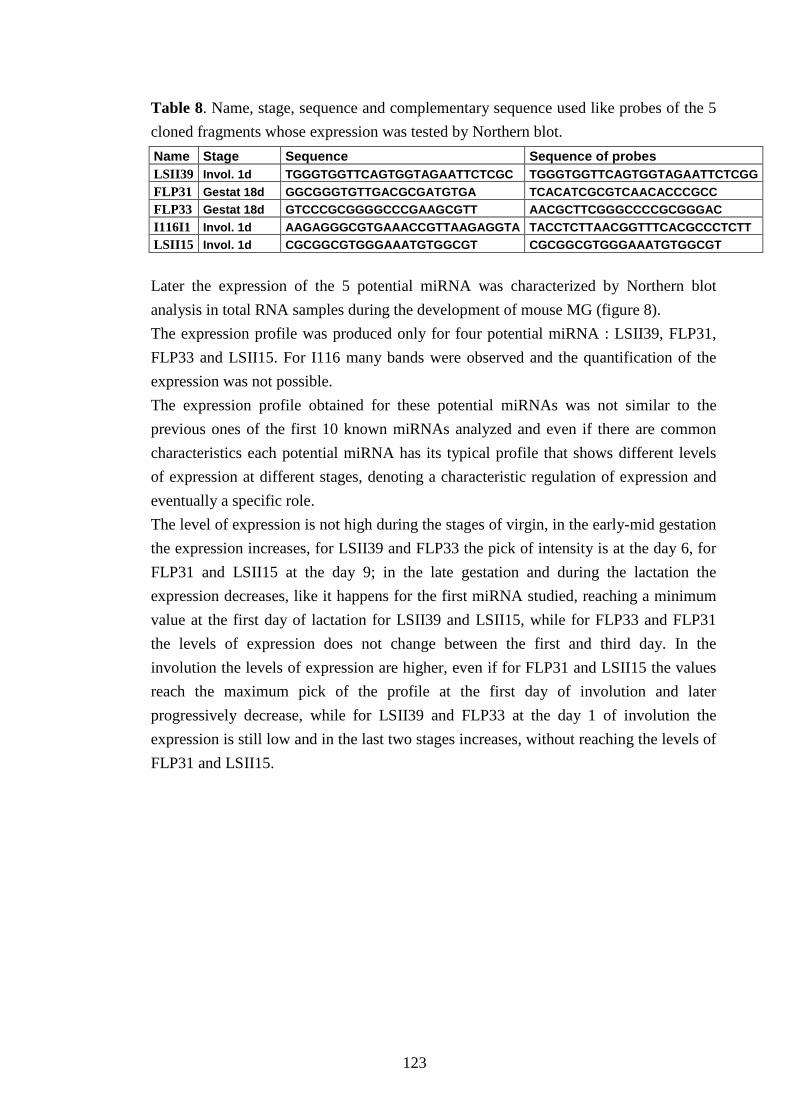
123
Table 8. Name, stage, sequence and complementary sequence used like probes of the 5
cloned fragments whose expression was tested by Northern blot.
Name Stage Sequence Sequence of probes LSII39 Invol. 1d TGGGTGGTTCAGTGGTAGAATTCTCGC TGGGTGGTTCAGT GGTAGAATTCTCGG FLP31 Gestat 18d GGCGGGTGTTGACGCGATGTGA TCACATCGCGTCAACAC CCGCC FLP33 Gestat 18d GTCCCGCGGGGCCCGAAGCGTT AACGCTTCGGGCCCCGC GGGAC I116I1 Invol. 1d AAGAGGGCGTGAAACCGTTAAGAGGTA TACCTCTTAACGGTTTCACGCCCTCTT LSII15 Invol. 1d CGCGGCGTGGGAAATGTGGCGT CGCGGCGTGGGAAATGTG GCGT
Later the expression of the 5 potential miRNA was characterized by Northern blot
analysis in total RNA samples during the development of mouse MG (figure 8).
The expression profile was produced only for four potential miRNA : LSII39, FLP31,
FLP33 and LSII15. For I116 many bands were observed and the quantification of the
expression was not possible.
The expression profile obtained for these potential miRNAs was not similar to the
previous ones of the first 10 known miRNAs analyzed and even if there are common
characteristics each potential miRNA has its typical profile that shows different levels
of expression at different stages, denoting a characteristic regulation of expression and
eventually a specific role.
The level of expression is not high during the stages of virgin, in the early-mid gestation
the expression increases, for LSII39 and FLP33 the pick of intensity is at the day 6, for
FLP31 and LSII15 at the day 9; in the late gestation and during the lactation the
expression decreases, like it happens for the first miRNA studied, reaching a minimum
value at the first day of lactation for LSII39 and LSII15, while for FLP33 and FLP31
the levels of expression does not change between the first and third day. In the
involution the levels of expression are higher, even if for FLP31 and LSII15 the values
reach the maximum pick of the profile at the first day of involution and later
progressively decrease, while for LSII39 and FLP33 at the day 1 of involution the
expression is still low and in the last two stages increases, without reaching the levels of
FLP31 and LSII15.
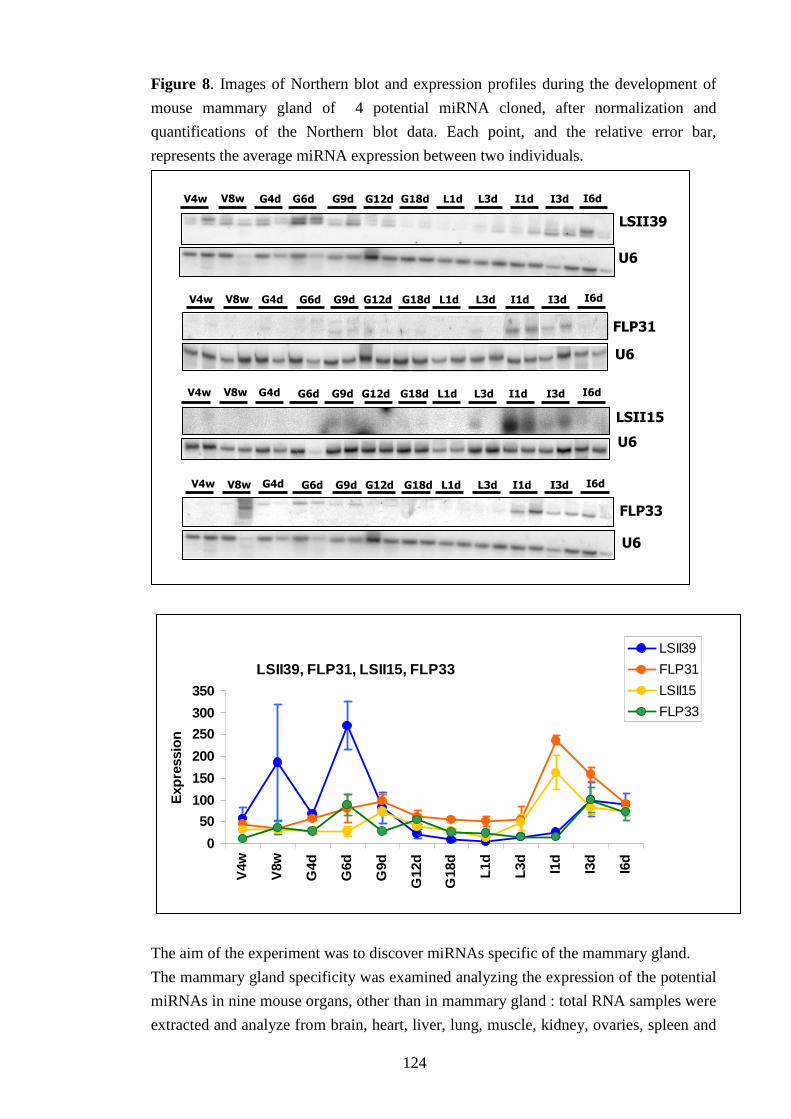
124
Figure 8. Images of Northern blot and expression profiles during the development of
mouse mammary gland of 4 potential miRNA cloned, after normalization and
quantifications of the Northern blot data. Each point, and the relative error bar,
represents the average miRNA expression between two individuals.
The aim of the experiment was to discover miRNAs specific of the mammary gland.
The mammary gland specificity was examined analyzing the expression of the potential
miRNAs in nine mouse organs, other than in mammary gland : total RNA samples were
extracted and analyze from brain, heart, liver, lung, muscle, kidney, ovaries, spleen and
LSII39, FLP31, LSII15, FLP33
0
50
100
150
200
250
300
350
V4w
V8w
G4d
G6d
G9d
G12
d
G18
d
L1d
L3d
I1d
I3d
I6d
Exp
ress
ion
LSII39
FLP31
LSII15
FLP33
FLP31
U6
V4w V8w G4d G6d G9d G12d G18d L1d L3d I1d I3d I6d
LSII15
U6
V4w V8w G4d G6d G9d G12d G18d L1d L3d I1d I3d I6d
V4w V8w G4d G6d G9d G12d G18d L1d L3d I1d I3d I6d
LSII39
U6
FLP33
U6
V4w V8w G4d G6d G9d G12d G18d L1d L3d I1d I3d I6d
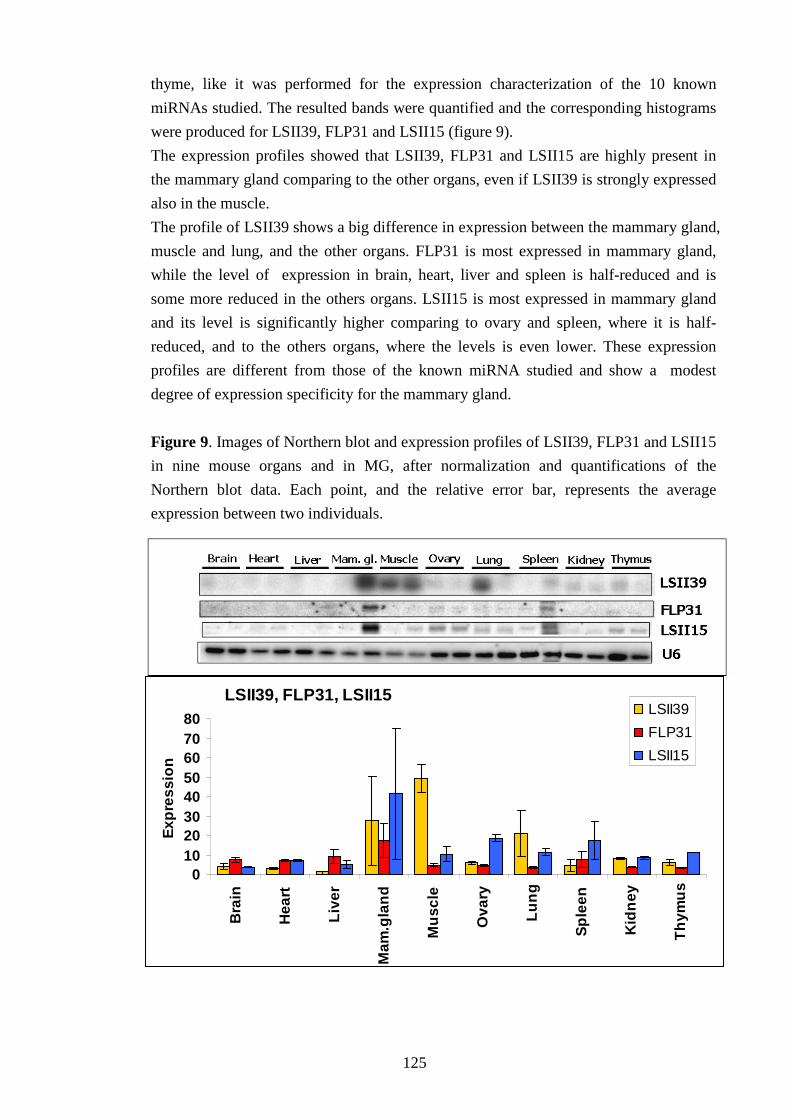
125
thyme, like it was performed for the expression characterization of the 10 known
miRNAs studied. The resulted bands were quantified and the corresponding histograms
were produced for LSII39, FLP31 and LSII15 (figure 9).
The expression profiles showed that LSII39, FLP31 and LSII15 are highly present in
the mammary gland comparing to the other organs, even if LSII39 is strongly expressed
also in the muscle.
The profile of LSII39 shows a big difference in expression between the mammary gland,
muscle and lung, and the other organs. FLP31 is most expressed in mammary gland,
while the level of expression in brain, heart, liver and spleen is half-reduced and is
some more reduced in the others organs. LSII15 is most expressed in mammary gland
and its level is significantly higher comparing to ovary and spleen, where it is half-
reduced, and to the others organs, where the levels is even lower. These expression
profiles are different from those of the known miRNA studied and show a modest
degree of expression specificity for the mammary gland.
Figure 9. Images of Northern blot and expression profiles of LSII39, FLP31 and LSII15
in nine mouse organs and in MG, after normalization and quantifications of the
Northern blot data. Each point, and the relative error bar, represents the average
expression between two individuals.
LSII39, FLP31, LSII15
01020304050607080
Bra
in
Hea
rt
Live
r
Mam
.gla
nd
Mu
scle
Ova
ry
Lun
g
Spl
een
Kid
ney
Th
ymu
s
Exp
ress
ion
LSII39
FLP31
LSII15
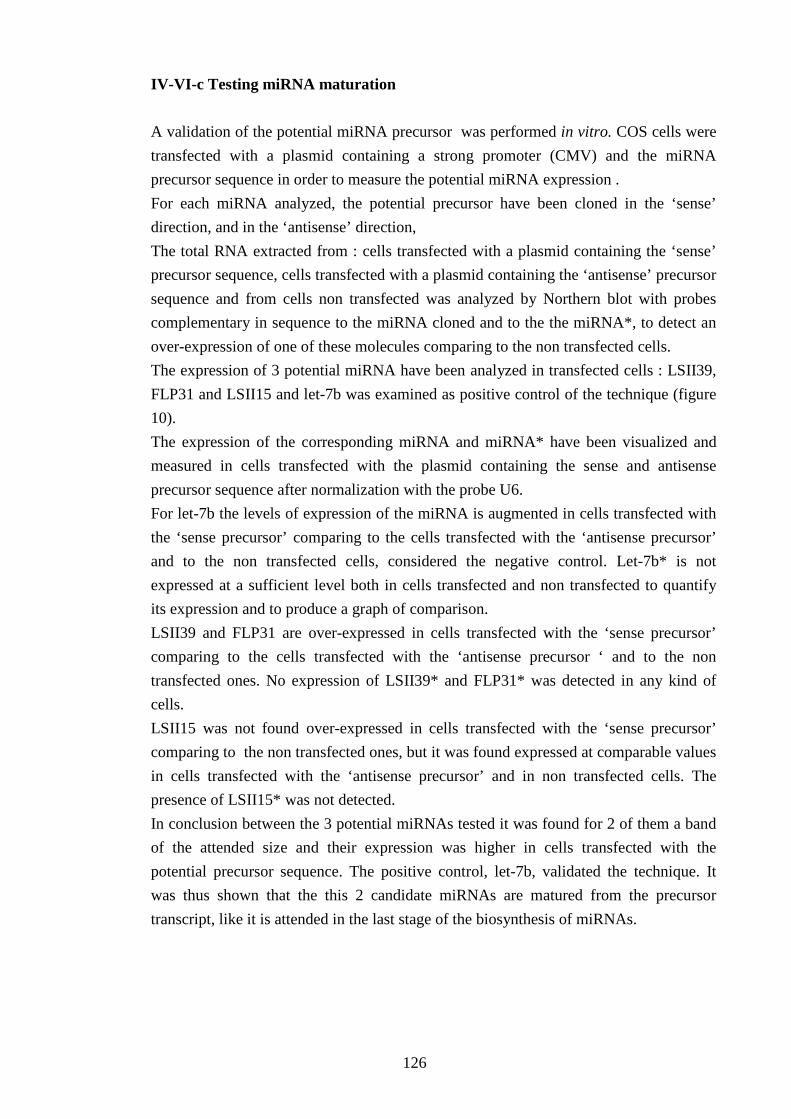
126
IV-VI-c Testing miRNA maturation
A validation of the potential miRNA precursor was performed in vitro. COS cells were
transfected with a plasmid containing a strong promoter (CMV) and the miRNA
precursor sequence in order to measure the potential miRNA expression .
For each miRNA analyzed, the potential precursor have been cloned in the ‘sense’
direction, and in the ‘antisense’ direction,
The total RNA extracted from : cells transfected with a plasmid containing the ‘sense’
precursor sequence, cells transfected with a plasmid containing the ‘antisense’ precursor
sequence and from cells non transfected was analyzed by Northern blot with probes
complementary in sequence to the miRNA cloned and to the the miRNA*, to detect an
over-expression of one of these molecules comparing to the non transfected cells.
The expression of 3 potential miRNA have been analyzed in transfected cells : LSII39,
FLP31 and LSII15 and let-7b was examined as positive control of the technique (figure
10).
The expression of the corresponding miRNA and miRNA* have been visualized and
measured in cells transfected with the plasmid containing the sense and antisense
precursor sequence after normalization with the probe U6.
For let-7b the levels of expression of the miRNA is augmented in cells transfected with
the ‘sense precursor’ comparing to the cells transfected with the ‘antisense precursor’
and to the non transfected cells, considered the negative control. Let-7b* is not
expressed at a sufficient level both in cells transfected and non transfected to quantify
its expression and to produce a graph of comparison.
LSII39 and FLP31 are over-expressed in cells transfected with the ‘sense precursor’
comparing to the cells transfected with the ‘antisense precursor ‘ and to the non
transfected ones. No expression of LSII39* and FLP31* was detected in any kind of
cells.
LSII15 was not found over-expressed in cells transfected with the ‘sense precursor’
comparing to the non transfected ones, but it was found expressed at comparable values
in cells transfected with the ‘antisense precursor’ and in non transfected cells. The
presence of LSII15* was not detected.
In conclusion between the 3 potential miRNAs tested it was found for 2 of them a band
of the attended size and their expression was higher in cells transfected with the
potential precursor sequence. The positive control, let-7b, validated the technique. It
was thus shown that the this 2 candidate miRNAs are matured from the precursor
transcript, like it is attended in the last stage of the biosynthesis of miRNAs.
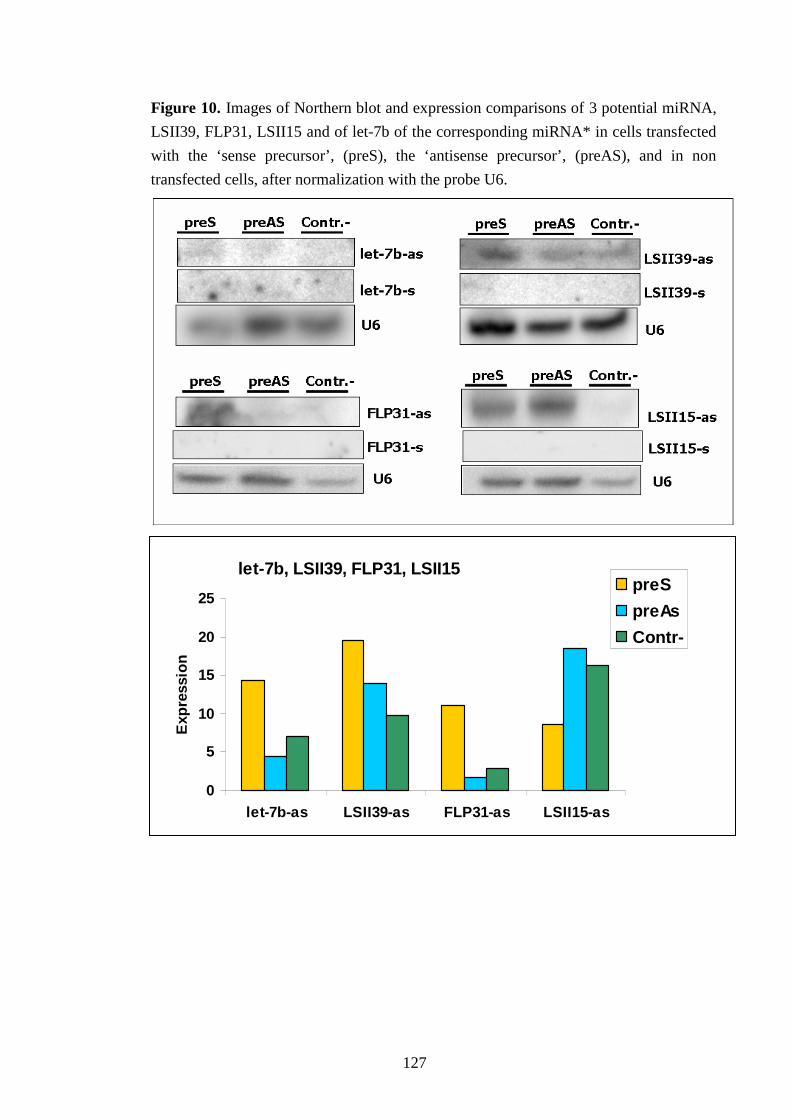
127
Figure 10. Images of Northern blot and expression comparisons of 3 potential miRNA,
LSII39, FLP31, LSII15 and of let-7b of the corresponding miRNA* in cells transfected
with the ‘sense precursor’, (preS), the ‘antisense precursor’, (preAS), and in non
transfected cells, after normalization with the probe U6.
let-7b, LSII39, FLP31, LSII15
0
5
10
15
20
25
let-7b-as LSII39-as FLP31-as LSII15-as
Exp
ress
ion
preS
preAs
Contr-

128
V-Conclusions
V-I State of art about miRNA involvement in mammary gland
The study of the tissue-specific miRNA expression signatures began few years
ago in mouse and humans (Lee and Ambros, 2001; Lagos-Quintana et al., 2002;
2003; Lim et al., 2003; Krichevsky et al., 2003; Liu et al., 2004; Nelson et al.,
2004; Thomson et al., 2004; Sun et al., 2004; Miska et al., 2004; Sempere et al.,
2004; Babak et al., 2004; SmiRnova et al., 2005; Monticelli et al., 2005) with the
development of techniques and tools like tissue-specific cloning, microchip
containing oligonucleotides corresponding to known miRNAs, and using
Northern Blot analysis and real-time RT-PCR.
It was found that in some tissues or in some organs, or in a precise physiological
or pathological state of a tissue, one or a group of miRNAs is exclusively
expressed or differentially over-/under-expressed comparing to the expression
levels of all the others studied miRNAs analysed : for example the miR-1 family
in heart, the miR-122 family in liver, miR-124 variants in brain, etc...
In humans the tissues of the eye (Ryan et al., 2006), the brain, the lung, the liver,
the skeletal muscle (Sempere et al., 2004), the haematopoietic cell (Ramkissoon et
al., 2006), the pancreatic endocrine cells (Poy et al., 2004) etc.. has recently been
analysed, while with the development of recent genome sequence assembly of
other mammalian species of economical interest, like for example chicken and
bovine, new tissue-specific miRNAs have been discovered (Xu et al., 2006;
Coutinho et al., 2006).
The research of tumour-specific miRNAs has attracted more attention and many
works dealing about differential miRNA expression in normal to cancerous tissue
or cell lines have been published (Calin et al., 2002; Michael et al., 2003;
Takamizawa et al., 2004; He et al., 2005 ; O’Donnell et al. 2005; Iorio et al., 2005;
Lu et al., 2005; Ciafre et al., 2005; Chan et al., 2005; Calin et al., 2005) most of
all focusing on humans.
Among the tumours analysed the breast cancer was investigated as well. It was
proved that the miRNA were present in genomic regions involved in human breast
cancers (Calin et al., 2004), that some miRNAs showed differential expression in
human breast cancer cell lines (Jiang et al., 2005; Scott et al., 2006; Hossain et al.,
2006) and in human cancer breast tissues (Iorio et al., 2005; Zhang et al., 2006;
Mattie et al., 2006; Volinia et al., 2006; tsuchiya et al., 2006).
Till now the researches of miRNA expression in normal breast tissue are few : the
breast was analysed together with other human tissues using a miRNA-specific
microchip (Liu et al., 2004) and a set of differentially over-expressed miRNA
was identified, while in the mouse only one work compares the miRNA
129
expression in mammary gland tissue with the miRNA expression of other mouse
and human tissues (Gu et al., 2006).
V-II miRNA expression in mammary gland
In this thesis the attention was focused on the miRNAs expressed in the normal
mammary gland and, for the first time, their regulation in the different stages of its
development.
The work was devoted to the study of a possible miRNA involvement in the
regulation of the development of this organ. The mammary gland of mouse was
chosen like model to dissect its developmental cycle in several stages and
investigate miRNA activity during the progression of this cycle. The mouse
mammary gland consists of two main tissues, the stroma and the epithelial tissue.
The epithelial compartment occupying, from the stage of gestation till the
involution, an important physical portion of this organ and developing into a
secretor tissue whose differentiation reflects the functional state of the organ.
Considering the strong association of miRNA expression to general mechanism
such as cell differentiation and organogenesis (Song and Tuan, 2006) it was
suspected to discover different expressed miRNA at different physiological and
functional states of this organ.
In total the 40% of the miRNAs tested, 10 over the 25, showed a detectable
expression by Northern blot analyses.
Moreover the most part of miRNAs found to be highly expressed in human breast
by microarray analysis (Liu et al., 2004) are also detectable in mouse breast,
demonstrating a similar miRNA activation in the two species. The efficacy of the
technique used is validated from the fact that the microarray data of Liu et al.
were confirmed by Northern blot and this technique is normally used to verify the
singular miRNA expression and the quantification of expression after a first
screening of differential activity of a large group of miRNA (Ryan et al., 2006;
Frederikse et al., 2006; Sempere et al., 2004; Xu et al., 2006; ec..). In this case a
first experimental selection of expressed miRNA from a wide group of miRNA
was avoided and the literature data were used to chose a little group of 25
miRNAs and to proceed directly towards a singular analysis of the expression
levels in mammary gland.
Some miRNAs were detected at high levels (let-7a, let-7b, let-7c, miR-26a, miR-
26b, miR-16a), other at weak levels (miR-24-2, miR-30b, miR-30d and miR-145).
Let-7a, b, and c were highly detected, this was not surprising because the miRNA
of the let-7 family are ubiquitously expressed at high level in many tissues
(Lagos-Quintana et al., 2003). MiR-16a was found down-regulated in patients
130
with B cell chronic lymphocyte leukaemia (Calin et al., 2002, Cimmino et al.,
2005) and in tumour breast cell lines (Jiang et al., 2005), while in the normal
mammary gland its expression results easily detectable. A deeper comparison of
quantification data of miR-16aa expression in tumoral and healty mammary gland
could reveal a cell-differentiation state specific mechanism of expression .
Surprisingly miR-125b was not detected in mammary gland, in disagreement with
recent evidences about its high expression in human differentiated cells and tissue
(Lee et al., 2005; Iorio et al., 2005), including the mammary gland.
These results were compared to those (Jiang et al., 2005) of the quantification by
real-time RT-PCR of pre-miRNA in 32 commonly used human cell lines,
including 5 breast cancer ones. Some miRNA detected in the normal mammary
gland were weakly expressed in the tumour breast cell lines, whereas others not
detected in the normal mammary gland were strongly expressed in the tumour
cells. This may suggests the existence of miRNAs which could be used like
molecular markers of the healthy or cancerous state of the breast tissue, like it was
proposed for some miRNAs in other tissues (Iorio et al., 2005). However the
detection techniques used and the detected RNA (pre- versus miRNA) are
different, making the evaluation of the significance of this observation difficult.
It was supposed for the 15 miRNAs not detected in the mammary gland that they
could be not expressed or, that they could be expressed at not sufficient level to be
detected.
All the 10 miRNAs detected were present at each developmental stage studied.
This could be interpreted in different ways : these miRNAs could have no direct
implication on the development and /or differentiation of the mammary gland, or
the overall miRNA expression patterns observed might hide cell-type specific
miRNA regulation, considering the different cell-type of the tissues composing
the mammary gland.
V-III Characterization of miRNA expression profile
A potential variation of miRNA expression during different stages of development
of mammary gland, according to the hypothesis of miRNA spatial / temporal
control has been studied for 10 miRNAs. The profiles obtained demonstrate that
the presence of each miRNA is variable along the development of the organ and it
suggests the existence of a precise control of miRNA expression. This indirectly
could suggest a role for these miRNAs in regulating a set of target mRNAs with
specific functions in the development of mammary gland.
The miRNAs expression profiles produced are different, someone showing
stronger level variations in virgin comparing to gestation stages, but they all share

131
a common characteristic : in the lactation the miRNA expression is always low
and during involution is high.
The miRNAs analyzed belonging to the same family, like let-7a, let-7b, let-7c and
miR-26a, miR-26b have highly similar profiles and very similar sequences
between them, thus it is probable that they act regulating the same targets.
Among the 10 miRNAs analyzed the profiles more variable comparing to those of
the let-7 and miR-26 family are those ones of miR-145 and of miR-30b and miR-
30d. The different profiles of miR-30b and miR-30d, even if belonging to the
same family and sharing the 80% of the sequence, is intriguing and suggests a
potential different target of action.
The identification of the miRNA targets is a difficult task. The in silico prediction
of the possible targets is not sufficient to indicate a potential candidate gene, but it
can be useful only to identify a large group (till 200 genes) of candidates. It is
now (Yoon and De Micheli, 2006) accepted that each miRNAs could have a large
spectrum of mRNA targets and, vice versa, the activity of an mRNA could be
negatively repressed by a set of different miRNAs. The non-univocal mechanism
of action and the redundancy of miRNAs could explain the similarity of the
expression profiles and it could indicate a common target for all the miRNAs
analysed, or at least a common task to inhibit a set of mRNA during the involution
and to release this inhibition during the lactation. In the mammary gland the
endocrine control of some physiological states of the development it is well
known. The profile of secretion of the prolactin, strictly correlated to the
proliferation and differentiation of epithelial cells, seems to be inversely
associated to the miRNA expression profile, thus suggesting a potential target
gene of miRNAs. The activity of estrogen and of progesterone has some common
features, at least in the first part of the developmental cycle till the lactaion, with
the miRNA expression profile and this could suggest a miRNA synergistic
mechanism during the development of mammary gland.
It could be intriguing to identify one or a set of mRNAs which show an
expression profile inversed compared to that one of the miRNAs, during the
mammary gland development, even if in the animals the miRNAs show more
often a mechanism of inhibition of translation of mRNAs more than a degradation
of the target mRNAs (Bartel, 2004), making more difficult the observations of a
decrease of mRNA levels and more probable a decrease in the corresponding
protein levels. In the mammary gland the genes for the caseins are highly
expressed during the lactation, as well some inhibitors of the prolactin activity,
such as Stat5, are inhibited in the lactation, thus suggesting a cellular necessity to
control important mechanisms of gene expression, like the inactivation of Stat5, in
critical stages of the mammary gland development. The individuation of the
miRNA targets is addressed to genotype-phenotype association studies in
132
transgenic animals. Up to now it is not possible to obtain a knock-out animal for a
specific miRNA, but it is possible to block the production of a set of miRNAs,
blocking the activity of Dicer enzyme (Bernstein et al., 2003; Murchison et al.,
2005), and over- or under-express a miRNA using, respectively, adapted
construction with strong promoters or RNA silencing specific constructions
(Krutzfeldt, 2006).
V-IV Analysis of organ- or tissue- miRNA specificity
It was also investigated the potential organ- and tissue-specificity of miRNA
expression. Their presence in other 9 mouse organs, and the tissue-compartment
of their production in the mammary gland was analyzed.
The miRNA levels of expression in brain, heart, liver, lung, muscle, kidney, ovary,
spleen and thymus showed that almost all of them are not differentially over-expressed
in mammary gland, with the exception of let-7c, which shows the highest expression
in mammary gland.
The tissue-specificity was investigated in order to have deeper insight about miRNA
expression that could help in the interpretation of their profile.
The comparison of let-7c, miR-26a and miR-145 expression in normal and ‘clear fat
pad’, such as devoid of epithelial tissue, mammary glands reveals that the miRNA
expression is not specific of the epithelial tissue.
The mammary gland accomplish the lactation with a milk-secretor epithelial tissue that
characterizes this organ and develops during the mammary gland cycle passing through
stages of cell proliferation, differentiation, apoptosis. It was supposed a miRNA
expression in this tissue, and eventually a epithelial-specific expression, supported from
recent findings about miRNA expression in mouse epithelial mammary cell lines (HC11,
results not published) and from all the evidencespresent in the literature of cell-
differentiation and tissue-specific miRNA expression. This hypothesis was not
confirmed. However it is known that miRNAs are responsible of the regulation of
fundamental mechanism like cell-proliferation and differentiation also acting far from
the molecules that promote directly these phenomenon. Moreover the epithelial tissue
and the stroma are two tissue-compartments that interact between each others and there
are many evidences of molecular signals passing between them (Parmar and Cunha,
2004). It is not excluded a miRNA expression in both of the two tissues.
133
V-V Construction of miRNA libraries
Lactation is a late emerging function during evolution. miRNA implication in the
control of such a physiological process could involve the regulation by evolutionary
conserved miRNA of new genes or alternatively by cell- and stage-specific miRNA
(Wienholds and Plasterk, 2005) not evolutionary conserved. The existence of new
miRNA specie-specific, such as primate, was supported by recent evidences (Bentwich
et al., 2005; Devor, 2006). cDNA cloning permits to identify this class of miRNAs
specific of an organ or a tissue of interest in the more evoluted species, like mammals.
It was constructed the first cDNA library of mammary gland potential miRNAs
following a cloning protocol (Lagos-Quintana et al., 2003)
64 non-redundant cloned fragments in the libraries have a sequence length of 19-25 nt,
typical of miRNAs.
This strategy to isolate miRNAs was validated comparing the 64 potential miRNAs
with the annotated miRNAs present in the microRNA registry and finding, among them,
let-7b and let-7c, already detected by Northern blot in the mammary gland. All the
remaining cloned fragments did not identify any other known miRNA, even if the a
significant portion showed a sequence similarity of the 50 to the 86% to known
miRNAs, most of them belonging to the human and mouse genome. The sequence
similarity of most of them to known miRNAs was encouraging. Some of them with
similar sequence matched to the same known miRNA and it confirmed the abundance
of a fragment or a group of similar fragments in the cells, underlying their importance.
The miRNAs which did not match to any known miRNAs were not excluded from the
library of potential miRNAs because they could be not-evolutionary conserved miRNAs
typical of the mammary gland.
V-VI Validation of potential miRNA
Following the examples present in the literature (Lagos-Quintana et al., 2003; Yi et al.,
2005; Xu et al., 2006; Guy et al., 2006; Cummins et al., 2006) the potential miRNAs
cloned were submitted to an in silico and to a preliminary experimental analysis in order
to identify which ones between them fulfill the criteria (Wienholds and Plasterk, 2005)
to be classified as newly identified miRNAs.
Their characterization proceeds mapping the potential miRNAs in the mouse genome.
Only 28% of fragments (18) of the library were mapped in the mouse genome, the
others were excluded because their sequence did not correspond to any known genomic
sequence.
For the fractions of mapped cloned fragments it was found their chromosome
localizations, the genes where they are hosted and the intragenic localization, in intron
134
or exons. In the 80% of cases they are localized in introns and in some few cases in
exons. This is in agreement with the literature data (Bartel, 2004), that show that in
mammals, and in particular in humans, at least the 50% of miRNAs are localized in
introns. In literature several models have been described (Hornstein and Shomron, 2006)
based to experimental evidences to interpret the miRNAs mechanism of expression in
association to the expression of the regulated genes : miRNAs could be coexpressed
with the target gene or the target gene could be under-expressed in the tissue where the
miRNA is specifically activated. MiRNAs are sometimes coexpressed with the gene to
which they belong from the activity of the same promoter, but this is not an evidence
that their target is the gene in which they are hosted, so that it is difficult to give a
precise meaning to their genetic localizations. Often miRNAs in mammals are localized
in the genome in the same cluster and these miRNAs are coexpressed (Lagos-Quintana
et al., 2001; 2002; Lau et al., 2001; Lee et al., 2002) and show similar activity and target,
but in this case any cloned fragment was found in cluster in the mouse genome.
Among the 18 potential miRNAs mapped in the mouse genome 11 showed in silico the
presence of at least one characteristic miRNA precursor stem-loop secondary structure
in the genomic flanking sequences. For some potential miRNAs localized in more than
one positions in the mouse genome more than one typical miRNAs precursor was
identified. The set of precursors obtained from the same potential miRNAs is variable in
sequence, at contrary in the works of Xu et al. (2006) it is discussed the presence of 3
copies for a miRNA gene (miR-757) in the chicken genome, 2 of which have the same
precursor sequence and structure.
The phylogenetic conservation of the identified precursor sequences was not searched in
other species, while in other studies (Xu et al., 2006; Cumminis et al., 2006; Guy et al.,
2006) homologous sequences have been found in human, chimpanzee, cow, mouse, rat,
dog, chicken, pufferfish and zebrafish genome. In the work of Guy et al. (2006) it is
proposed the existence of a rodent specific cloned miRNA on the basis of the lack of its
sequence conservations in other species, supporting the idea that by cloning size
selected RNAs it is possible to isolate new specie-specific miRNAs.
The ‘biogenesis’ and ‘expression’ criteria recently put forward by Ambros et al. (2003)
for miRNA annotation were fulfilled for some of the 11 potential miRNA by examining
their expression in mammary gland. 5 potential miRNA analyzed by Northern blot were
expressed and visualized like short transcripts, for 4 of them the expression patterns
during different stages of development of mammary gland was characterized. The
quantification of the level of expression demonstrate a typical profile for each potential
miRNAs and variable presence in different stages, thus underlying a mechanism of
expression regulation and a potential role in the developing mammary gland, like it was
verified for the known miRNAs. For 3 potential miRNA the expression is high during
the involution, most of all at the first day, and all of them have the lowest expression in
the lactation, thus showing also a similar ‘behaviour’ comparing to the known miRNA
135
found expressed in the mammary gland and confirming their reliability like new
miRNAs.
The organ-specificity was verified examining the expression pattern of 3 potential
miRNAs in 10 different mouse organs, included the mammary gland : even if it is not
possible to define them mammary-gland specific, they are over-expressed in mammary
gland comparing to the other organs, with the exception of a high expression in the
muscle for one of them.
To further validate these potential miRNA an in vitro experiment to over-express the
miRNAs, by transfecting its precursor associated with a strong promoter, was
performed for 3 of the potential miRNAs. Preliminary results confirmed the
augmentation of the expression in transfected cells for 2 of them, thus implicating the
activation of part of the miRNA biosynthetic mechanism, in particular the activity of the
Dicer enzyme, able to cut the precursor after its transcription from the plasmid, and to
produce the mature form of the cloned miRNA.
V-VII Perspectives
In this work it was verified the expression of some miRNAs in normal mouse mammary
gland and their temporal regulated expression could suggest a role in the development
of this organ. Their expression was described also in other organs.
A cDNA library of mammary gland potential miRNA was build and four cloned
potential miRNA were validated by identifying the precursor hairpin-like structure and
by verifying experimentally their expression in mammary gland. Their expression
profile was also characterized at different stage of the mammary gland cycle.
The temporal and spatial characterization of the expression pattern is the first step
towards the understanding of the role of these molecules. The next step towards a better
understanding of the known and new miRNAs function in mammary gland could be the
in situ localization of their activity in the different cell-type of the mammary gland
tissues, like it was recently done in other studies (Guy et al., 2006) with the
development of new probes, locked nucleic acid (LNA) probes, for the detection of
small size RNA, such as the miRNA.
An eventual miRNA cell-type specific expression could help in the selection of a set of
candidate target genes both in their in silico predictions and in experimental studies.
The analysis of the transcriptome and of the proteome of the cells in which the miRNAs
are expressed during the developing mammary gland could identify the less present
transcript or protein, without the necessity of the time-consuming production of
transgenic animals and/or Dicer conditional mutant animals.
The validation of other potential miRNAs present in the cDNA library and their
expression characterization could add important information to go deeper in the
136
understanding of an eventual common mechanism of actions which all the miRNAs
analyzed seems to share during some stages of the development of mammary gland.
The characterization of other potential miRNA is in course.
In this work we described the identification of four candidate genes starting from a
miRNA library, thus depicting the mammary gland like a miRNA enriched organ, while
before the attention was focused more on other organs, and only recently (Gu et al.,
2006) the tissue of mouse mammary gland, together with the brain and the mouse eye,
appears to be enriched of expressed miRNAs like the brain, the lung, and the human eye.
However the breast is an interesting subject of study in relation to the appearance of the
cancerous pathologies, being the breast tumor one of the most frequent cancer in the
woman and one of the most studied. Further understanding of the synergistic interaction
of the miRNAs with other regulatory pathways of gene expression in this organ will
lead to more in-depth knowledge on the regulation of cellular function and
differentiation, as well it can facilitate the development of clinical applications and of
drugs based on the mechanism of RNA interference.
Currently the study of miRNAs in mouse normal mammary gland are proceeding
towards a better understanding of their biological functions.
In vitro experiments with epithelial mammary cell lines derived from rabbit are aimed
to examine miRNA expression in un-differentiated cells versus differentiated cells,
after the induction of this stage by hormonal stimulation.
The microinjection technology applied to mice give the possibility to obtain transgenic
animals expressing or over-expressing a gene of interest. Currently a lineage of
transgenic mouse over-expressing in the mammary gland some interesting miRNA
genes, such as the gene for miR-145 or for let-7c, under the action of a strong
mammary-gland specific promoter, is in preparation. The phenotype, the transcriptome
and the proteome of these transgenic mice will be evaluated in search of a-typical
characteristics, differential expressed molecules and different set of protein comparing
to normal mice. The same studies will be performed on mice bringing a mutated allele
for the Dicer gene, mutation that should interfere with the maturation of a large set of
miRNAs, producing a global disruption in the miRNA mechanism of biosynthesis and
relevant changes at morphological and physiological level. The study of the
transcriptome will also profit of the miRNAs specific microarray now available on the
market.
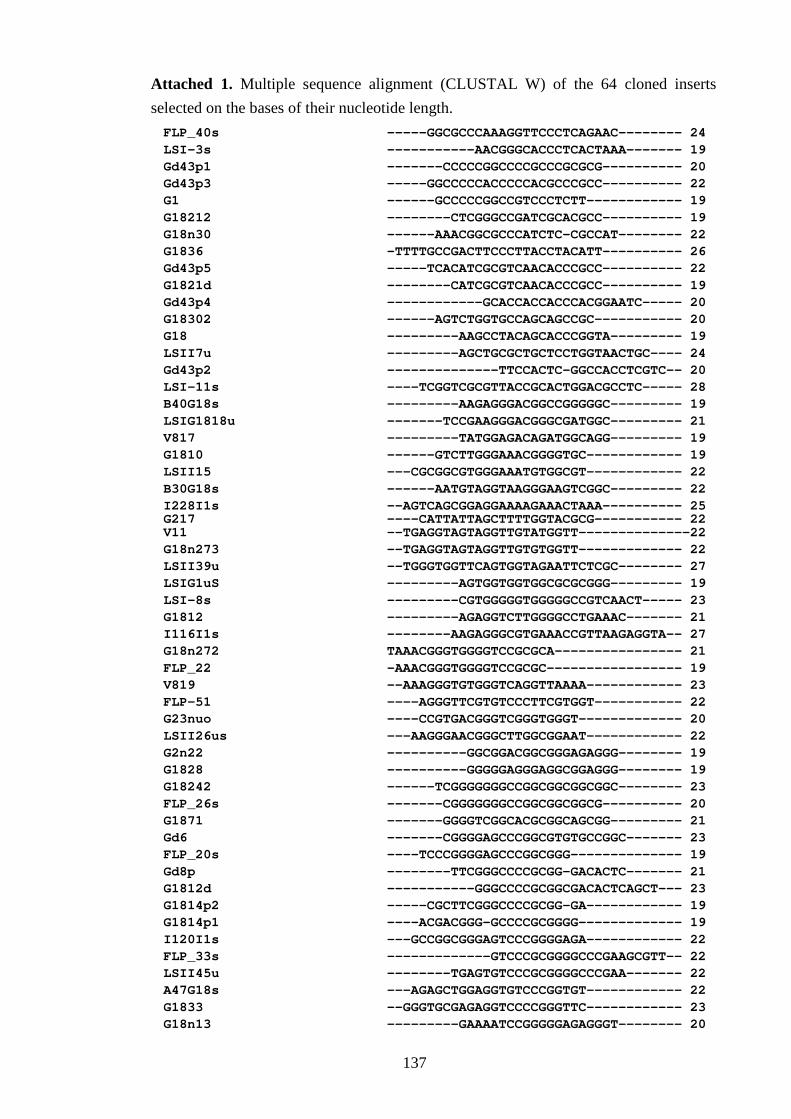
137
Attached 1. Multiple sequence alignment (CLUSTAL W) of the 64 cloned inserts
selected on the bases of their nucleotide length.
FLP_40s -----GGCGCCCAAAGGTTCCCTCAGAAC-------- 24 LSI-3s -----------AACGGGCACCCTCACTAAA------- 19 Gd43p1 -------CCCCCGGCCCCGCCCGCGCG---------- 20 Gd43p3 -----GGCCCCCACCCCCACGCCCGCC---------- 22 G1 ------GCCCCCGGCCGTCCCTCTT------------ 19 G18212 --------CTCGGGCCGATCGCACGCC---------- 19 G18n30 ------AAACGGCGCCCATCTC-CGCCAT-------- 22 G1836 -TTTTGCCGACTTCCCTTACCTACATT---------- 26 Gd43p5 -----TCACATCGCGTCAACACCCGCC---------- 22 G1821d --------CATCGCGTCAACACCCGCC---------- 19 Gd43p4 ------------GCACCACCACCCACGGAATC----- 20 G18302 ------AGTCTGGTGCCAGCAGCCGC----------- 20 G18 ---------AAGCCTACAGCACCCGGTA--------- 19 LSII7u ---------AGCTGCGCTGCTCCTGGTAACTGC---- 24 Gd43p2 --------------TTCCACTC-GGCCACCTCGTC-- 20 LSI-11s ----TCGGTCGCGTTACCGCACTGGACGCCTC----- 28 B40G18s ---------AAGAGGGACGGCCGGGGGC--------- 19 LSIG1818u -------TCCGAAGGGACGGGCGATGGC--------- 21 V817 ---------TATGGAGACAGATGGCAGG--------- 19 G1810 ------GTCTTGGGAAACGGGGTGC------------ 19 LSII15 ---CGCGGCGTGGGAAATGTGGCGT------------ 22 B30G18s ------AATGTAGGTAAGGGAAGTCGGC--------- 22 I228I1s --AGTCAGCGGAGGAAAAGAAACTAAA---------- 25 G217 ----CATTATTAGCTTTTGGTACGCG----------- 22 V11 --TGAGGTAGTAGGTTGTATGGTT--------------22 G18n273 --TGAGGTAGTAGGTTGTGTGGTT------------- 22 LSII39u --TGGGTGGTTCAGTGGTAGAATTCTCGC-------- 27 LSIG1uS ---------AGTGGTGGTGGCGCGCGGG--------- 19 LSI-8s ---------CGTGGGGGTGGGGGCCGTCAACT----- 23 G1812 ---------AGAGGTCTTGGGGCCTGAAAC------- 21 I116I1s --------AAGAGGGCGTGAAACCGTTAAGAGGTA-- 27 G18n272 TAAACGGGTGGGGTCCGCGCA---------------- 21 FLP_22 -AAACGGGTGGGGTCCGCGC----------------- 19 V819 --AAAGGGTGTGGGTCAGGTTAAAA------------ 23 FLP-51 ----AGGGTTCGTGTCCCTTCGTGGT----------- 22 G23nuo ----CCGTGACGGGTCGGGTGGGT------------- 20 LSII26us ---AAGGGAACGGGCTTGGCGGAAT------------ 22 G2n22 ----------GGCGGACGGCGGGAGAGGG-------- 19 G1828 ----------GGGGGAGGGAGGCGGAGGG-------- 19 G18242 ------TCGGGGGGGCCGGCGGCGGCGGC-------- 23 FLP_26s -------CGGGGGGGCCGGCGGCGGCG---------- 20 G1871 -------GGGGTCGGCACGCGGCAGCGG--------- 21 Gd6 -------CGGGGAGCCCGGCGTGTGCCGGC------- 23 FLP_20s ----TCCCGGGGAGCCCGGCGGG-------------- 19 Gd8p --------TTCGGGCCCCGCGG-GACACTC------- 21 G1812d -----------GGGCCCCGCGGCGACACTCAGCT--- 23 G1814p2 -----CGCTTCGGGCCCCGCGG-GA------------ 19 G1814p1 ----ACGACGGG-GCCCCGCGGGG------------- 19 I120I1s ---GCCGGCGGGAGTCCCGGGGAGA------------ 22 FLP_33s -------------GTCCCGCGGGGCCCGAAGCGTT-- 22 LSII45u --------TGAGTGTCCCGCGGGGCCCGAA------- 22 A47G18s ---AGAGCTGGAGGTGTCCCGGTGT------------ 22 G1833 --GGGTGCGAGAGGTCCCCGGGTTC------------ 23 G18n13 ---------GAAAATCCGGGGGAGAGGGT-------- 20
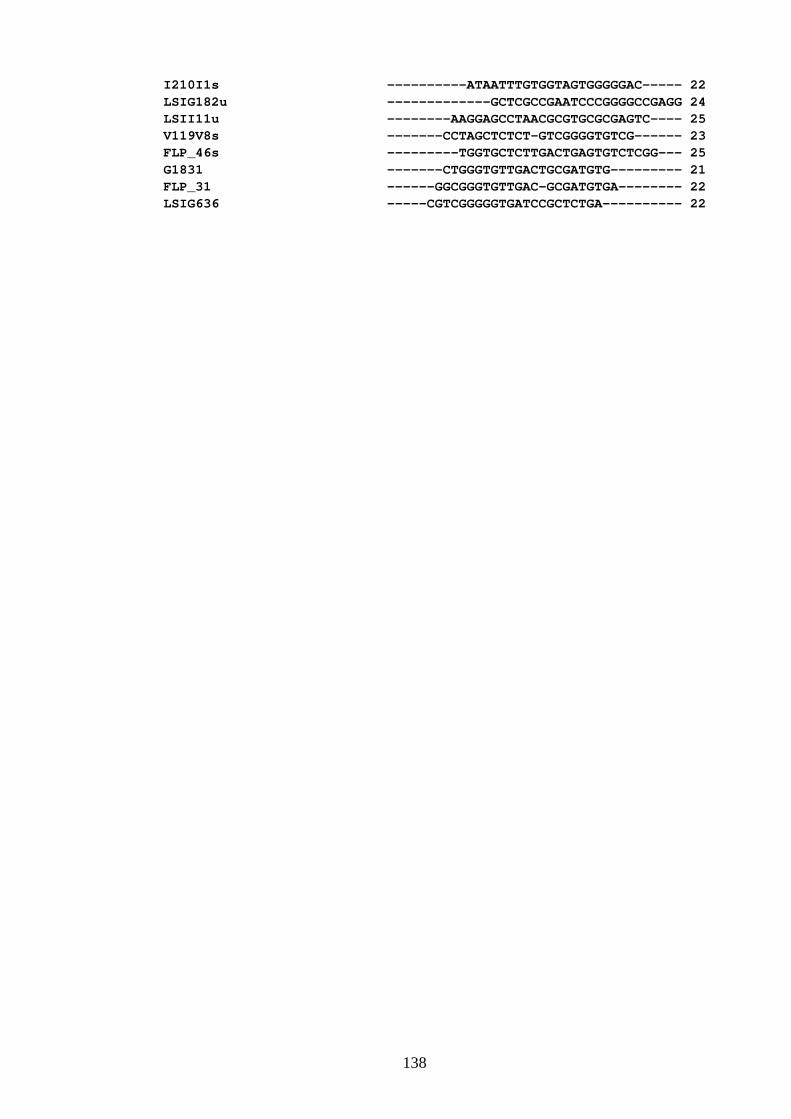
138
I210I1s ----------ATAATTTGTGGTAGTGGGGGAC----- 22 LSIG182u -------------GCTCGCCGAATCCCGGGGCCGAGG 24 LSII11u --------AAGGAGCCTAACGCGTGCGCGAGTC---- 25 V119V8s -------CCTAGCTCTCT-GTCGGGGTGTCG------ 23 FLP_46s ---------TGGTGCTCTTGACTGAGTGTCTCGG--- 25 G1831 -------CTGGGTGTTGACTGCGATGTG--------- 21 FLP_31 ------GGCGGGTGTTGAC-GCGATGTGA-------- 22 LSIG636 -----CGTCGGGGGTGATCCGCTCTGA---------- 22
139
VI-Reference Abbott AL, Alvarez-Saavedra E, Miska EA, Lau NC, Bartel DP, Horvitz HR, Ambros V. The let-7 MicroRNA family members mir-48, mir-84, and mir-241 function together to regulate developmental timing in Caenorhabditis elegans. Dev Cell. 2005; 9: 403-14. Abrahante JE, Daul AL, Li M, Volk ML, Tennessen JM, Miller EA, Rougvie AE. The Caenorhabditis elegans hunchback-like gene lin-57/hbl-1 controls developmental time and is regulated by microRNAs. Dev. Cell. 2003;4: 625-37. Adai A, Johnson C, Mlotshwa S, Archer-Evans S, Manocha V, Vance V, Sundaresan V. Computational prediction of miRNAs in Arabidopsis thaliana. Genome Res. 2005; 15:78-91. Ambros V. A hierarchy of regulatory genes controls a larva-to-adult developmental switch in C. elegans.Cell. 1989; 57: 49-57. Ambros V, Lee RC, Lavanway A, Williams PT, Jewell D. MicroRNAs and other tiny endogenous RNAs in C. elegans. Curr Biol. 2003; 13:807-18. Ambros V. MicroRNA pathways in flies and worms: growth, death, fat, stress, and timing. Cell. 2003; 113: 673-6. Ambros V. The functions of animal microRNAs. Nature 2004; 431: 350-355. Ambros V, Bartel B, Bartel DP, Burge CB, Carrington JC, Chen X, Dreyfuss G, Eddy SR, Griffiths-Jones S, Marshall M, Matzke M, Ruvkun G,Tusch lT. A uniform system for micro RNA annotation. RNA. 2003 Mar;9(3):277-9. Andres AC, Strange R. Apoptosis in the estrous and menstrual cycles. J Mammari Gland Biol Neoplasia. 1999; 4: 221-8. Aravin AA, Lagos-Quintana M, Yalcin A, Zavolan M, Marks D, Snyder B, Gaasterland T, Meyer J, Tuschl T. The small RNA profile during Drosophila melanogaster development. Dev Cell. 2003; 5: 337-50. Aravin A, Tuschl T. Identification and characterization of small RNAs involved in RNA silencing. FEBS Lett. 2005; 579:5830-40. Asch HL, Asch BB. Heterogeneity of keratin expression in mouse mammary hyperplastic alveolar nodules and adenocarcinomas. Cancer Res. 1985; 45: 2760-8. Ason B, Darnell DK, Wittbrodt B, Berezikov E, Kloosterman WP, Wittobrodt J, Antin PB, Plasterk RH. Differences in vertebrate microRNA expression. Proc. Natl. Acad. SCi. USA 2006; 103: 14385-14389. Aukerman MJ, Sakai H Regulation of flowering time and floral organ identity by a MicroRNA and its APETALA2-like target genes. Plant Cell. 2003; 15: 2730-41. Barad O, Meiri E, Avniel A, Aharonov R, Barzilai A, Bentwich I, Einav U, Gilad S, Hurban P, Karov Y, Lobenhofer EK, Sharon E, Shiboleth YM, Shtutman M, Bentwich Z, Einat P.
140
MicroRNA expression detected by oligonucleotide microarrays: system establishment and expression profiling in human tissues. Genome Res. 2004; 14: 2486-94. Bartel DP. MicroRNAs: Genomics, Biogenesis, Mechanism, and Function. Cell 2004; 116: 281-297. Bashirullah A, Pasquinelli AE, Kiger AA, Perrimon N, Ruvkun G, Thummel CS. Coordinate regulation of small temporal RNAs at the onset of Drosophila metamorphosis. Dev Biol. 2003; 259 :1-8. Baskerville S, Bartel DP. Microarray profiling of microRNAs reveals frequent coexpression with neighboring miRNAs and hostgenes. RNA. 2005; 11: 241-7. Bentwich I. Prediction and validation of microRNAs and their targets. FEBS Lett. 2005; 579:5904-10. Bentwich I, Avniel A, Karov Y, Aharonov R, Gilad S, Barad O, Barzilai A, Einat P, Einav U, Meiri E, Sharon E, Spector Y, Bentwich Z. Identification of hundreds of conserved and nonconserved human microRNAs. Nat Genet. 2005; 37:766-70. Berezikov E, Plasterk RH. Camels and zebrafish, viruses and cancer: a microRNA update. Hum Mol Genet. 2005;14 Spec No. 2:R183-90. Berezikov E, Cuppen E, Plasterk RH. Approaches to micro RNA discovery. Nat Genet. 2006 Jun; 38 Suppl:S2-7. Bocchinfuso WP, Lindzey JK, Hewitt SC, Clark JA, Myers PH, Cooper R, Korach KS. Induction of mammary gland development in estrogen receptor-alpha knockout tmice.Endocrinology. 2000; 141: 2982-94. Bolander FF Jr. Differential characteristics of the thoracic and abdominal mammary glands from mice. Exp Cell Res. 1990; 189: 142-4. Bonnet E, Wuyts J, Rouze P, Van de Peer Y. Evidence that microRNA precursors, unlike other non-coding RNAs,have lower folding free energies than random sequences. Bioinformatics. 2004; 20: 2911-7. Brennecke J, Hipfner DR, Stark A, Russell RB, Cohen SM. bantam encodes a developmentally regulated microRNA that controls cell proliferation and regulates the proapoptotic gene hid in Drosophila. Cell. 2003; 113: 25-36 Britten RJ, Davidson EH. Gene regulation for higher cells: a theory. Science. 1969; 165:3 49-57. Burwen SJ, Pitelka DR. Secretory function of lactating mouse mammary epithelial cells cultured on collagen gels.Exp Cell Res. 1980; 126: 249-62. Calin GA, Dumitru CD, Shimizu M, Bichi R, Zupo S, Noch E, Aldler H, Rattan S, Keating M, Rai K, Rassenti L, Kipps T, Negrini M, Bullrich F, Croce CM. Frequent deletions and down-regulation of micro- RNA genes miR15 and miR16 at 13q14 in chronic lymphocytic leukemia. Proc Natl Acad Sci USA. 2002; 99: 15524-9.
141
Calin GA, Sevignani C, Dumitru CD, Hyslop T, Noch E, Yendamuri S, Shimizu M, Rattan S, Bullrich F, Negrini M, Croce CM. Human microRNA genes are frequently located at fragile sites and genomic regions involved in cancers. Proc Natl Acad Sci U S A. 2004 ; 101: 2999-3004. Calin GA, Liu CG, Sevignani C, Ferracin M, Felli N, Dumitru CD, Shimizu M, Cimmino A, Zupo S, Dono M, Dell'Aquila ML, Alder H, Rassenti L, Kipps TJ, Bullrich F, Negrini M, Croce CM. MicroRNA profiling reveals distinct signatures in B cell chronic lymphocytic leukemias. Proc Natl Acad Sci U S A. 2004; 101: 11755-60. Calin GA, Ferracin M, Cimmino A, Di Leva G, Shimizu M, Wojcik SE, Iorio MV, Visone R, Sever NI, Fabbri M, Iuliano R, Palumbo T, Pichiorri F, Roldo C, Garzon R, Sevignani C, Rassenti L, Alder H, Volinia S, Liu CG, Kipps TJ, Negrini M, Croce CM. A MicroRNA signature associated with prognosis and progression in chronic lymphocytic leukaemia. N. Engl. J. Med. 2005; 353: 1793-801. Chalfie M, Horvitz HR, Sulston JE. Mutations that lead to reiterations in the cell lineages of C. elegans. Cell. 1981; 24: 59-69. Chan CS, Elemento O, Tavazoie S. Revealing posttranscriptional regulatory elements through network-level conservation. PLoS Comput Biol. 2005; 1:e69. Chen X. A microRNA as a translational repressor of APETALA2 in Arabidopsis flower development. Science. 2004; 303 : 2022-5. Chen CZ,Lodish HF. MicroRNAs as regulators of mammalian hematopoiesis. Semin Immunol. 2005; 17: 155-65. Chen JF, Mandel EM, Thomson JM, Wu Q, Callis TE, Hammond SM, Conlon FL, Wang DZ. The role of microRNA-1 and microRNA-133 in skeletal muscle proliferation and differentiation. Nat Genet. 2006; 38: 228-33. Chen CH, Guo M, Hay BA. Identifying microRNA regulators of cell death in Drosophila. Methods Mol Biol. 2006; 342: 229-40. Chendrimada TP, Gregory RI, Kumaraswamy E, Norman J, Cooch N, Nishikura K, Shiekhattar R. TRBP recruits the Dicer complex to Ago2 for microRNA processing and gene silencing. Nature. 2005; 436: 740-4. Cimmino A, Calin GA, Fabbri M, Iorio MV, Ferracin M, Shimizu M, Wojcik SE, Aqeilan S, Zupo S, Dono M, Rassenti L, Alder H, Volinia S, Liu C, Kipps TJ, Negrini M, Croce CM. miR-15 and miR-16 induce apoptosis by targeting BCL2. PNAS 2005; 13944-13949. Conrad R, Barrier M, Ford LP. Role of miRNA Processing Factors in Development and Disease. Birth Defects Res. 2006; 78: 107-117. Costa FF. Non-coding RNAs: New players in eukaryotic biology. Gene 2005; 357: 83-94. Cullen BR. Transcription and processing of human microRNA precursors. Mol Cell. 2004; 16:861-5.
142
Cumminis JM, He Y, Leary RJ Pagliarini R, Diaz LA, Sjoblom T, Barard O, Bentwich Z, Szafranska AE, Labourier E, Raymond CK, Roberts BS, Juhl H, Kinzler KW, Vogelstein B, Velculescu VE. The colorectal microRNAome. PNAS 2006; 103: 3687-3692. Devor EJ. Primate MicroRNAs miR-220 and miR-492 Lie within Processed Pseudogenes. Journal of Heredity 2006; 97: 186-190. Di Leva G, Calin GA, Croce CM. MicroRNAs: Fundamental Facts and Involvement in Human Disease. Birth Defects Research 2006; 78: 180-189. Doench JG, Petersen CP, Sharp PA. siRNAs can function as miRNAs. Genes Dev. 2003; 17: 438-42. Dostie J, Mourelatos Z, Yang M, Sharma A, Dreyfuss G. Numerous microRNPs in neuronal cells containing novel microRNAs. RNA. 2003;9: 180-6. Dulbecco R, Allen WR, Bologna M, Bowman M. Marker evolution during the development of the rat mammary gland: stem cells identified by markers and the role of myoepithelial cells. Cancer Res. 1986; 46:2449-56. Elias EG, Sepulveda F, Mink IB. Increasing the efficiency of cancer chemotherapy with heparin: "clinicalstudy". J Surg Oncol. 1973; 5: 189-93. Esau C, Kang X, Peralta E, Hanson E, Marcusson EG, Ravichandran LV, Sun Y, Koo S, Perera RJ, Jain R, Dean NM, Freier SM, Bennett CF, Lollo B, Griffey R. MicroRNA-143 regulates adipocyte differentiation. J Biol Chem. 2004 ; 279: 52361-5. Esau C, Davis S, Murray SF, Yu XX, Pandey SK, Pear M, Watts L, Booten SL, Graham M, McKay R, Subramaniam A, Propp S, Lollo BA, Freier S, Bennett CF, Bhanot S, Monia BP. miR-122 regulation of lipid metabolism revealed by in vivo antisense targeting. Cell Metab. 200 ; 3: 87-98. Esquela-Kerscher A, Slack F. Oncomirs-microRNAs with a role in cancer. Nature 2006; 6: 259-269. Fadok VA. Clearance: the last and often forgotten stage of apoptosis. J Mammary Gland Biol Neoplasia. 1999 ;4:203-11. Fata JE, Kong YY, Li J, Sasaki T, Irie-Sasaki J, Moorehead RA, Elliott R, Scully S, Voura EB, Lacey DL, Boyle WJ, Khokha R, Penninger JM. The osteoclast differentiation factor osteoprotegerin-ligand is essential for mammary gland development. Cell. 2000; 103: 41-50. Felli N, Fontana L, Pelosi E, Botta R, Bonci D, Facchiano F, Liuzzi F, Lulli V, Morsilli O, Santoro S, Valtieri M, Calin GA, Liu CG, Sorrentino A, Croce CM, Peschle C. MicroRNAs 221 and 222 inhibit normal erythropoiesis and erythroleukemic cell growth via kit receptor down-modulation. Proc Natl Acad Sci U S A. 2005; 102: 18081-6. Fields C, Adams MD, White O, Venter JC. How many genes in the human genome? Nat Genet. 1994; 7:345-6. Filipowicz W. RNAi: the nuts and bolts of the RISC machine. Cell. 2005; 122:17-20.
143
Fjose A, Drivenes O. RNAi and MicroRNAs: From Animal Models to Disease Therapy. Birth Defects Res. 2006; 78: 150-171. Gordon JR, Bernfield MR. The basal lamina of the postnatal mammary epithelium contains glycosaminoglycans in a precise ultra structural organization. Dev Biol. 1980; 74: 118-35. Grad Y, Aach J, Hayes GD, Reinhart BJ, Church GM, Ruvkun G, Kim J. Computational and experimental identification of C.elegans microRNAs. Mol Cell. 2003; 11: 1253-63. Griffiths-Jones S. The microRNA Registry. Nucleic Acids Res. 2004; 32: 109-111. Griffiths-Jones S. miRBase: the microRNA sequence database. Methods Mol Biol. 2006;342: 129-38. Grosshans H, Johnson T, Reinert KL, Gerstein M, Slack FJ. The temporal patterning microRNA let-7 regulates several transcription factorsat the larval to adult transitionin C.elegans. Dev Cell. 2005;8:321-30. Gu J, He T, Pei Y, Li F, Wang X, Zhang J, Zhang X, Li Y. Primary transcripts and expressions of mammal intergenic microRNAs detected by mapping ESTs to their flanking sequences. Mamm Genome. 2006; 17: 1033-41. Hayashita Y, Osada H, Tatematsu Y, Yamada H, Yanagisawa K, Tomida S, Yatabe Y, Kawahara K, Sekido Y, Takahashi T. A polycistronic microRNA cluster, miR-17-92, is overexpressed in human lung cancers and enhances cell proliferation. Cancer Res. 2005; 65: 9628-32. He L, Hannon GJ. MicroRNAs: Small RNAs with a big role in gene regulation. Nature Genetics 2004; 5. 522-531. He H, Jazdzewski K, Li W, Liyanarachchi S, Nagy R, Volinia S, Calin GA, Liu CG, Franssila K, Suster S, Kloos RT, Croce CM, de la Chapelle A. The role of microRNA genes in papillary thyroid carcinoma. Proc Natl Acad Sci U S A. 2005; 102: 19075-80. Henningausen L, Robinson GW. Think globally, act locally: the making of a mouse mammary gland. Genes and Development 1998; 12: 449-455. Henningausen L, Robinson GW. Information networks in the mammary gland. Nature Mol. Cell Biol. 2005; 6: 715-725. Hornstein E, Mansfield JH, Yekta S, Hu JK, Harfe BD, McManus MT, Baskerville S, Bartel DP, Tabin CJ. The microRNA miR-196 acts upstream of Hoxb8 and Shh in limb development.Nature. 2005; 438: 671-4. Hornstein E, Shomron N. Canalization of development by microRNAs. Nature Genetics 2006; 38: 20-24. Houbaviy HB, Murray MF, Sharp PA. Embryonic stem cell-specific MicroRNAs. Dev Cell. 2003; 5: 351-8.
144
Hsu PW, Huang HD, Hsu SD, Lin LZ, Tsou AP, Tseng CP, Stadler PF, Washietl S, Hofacker IL. miRNAMap: genomic maps of microRNA genes and their target genes in mammalian genomes. Nucleic Acids Res. 2006; 34 (Database issue):D135-9. Hutvagner G, Zamore PD. A microRNA in a multiple-turnover RNAi enzyme complex. Science. 2002; 297:2056-60. Hutvagner G, Simard MJ, Mello CC, Zamore PD. Sequence-specific inhibition of small RNA function. PLoS Biol. 2004; 2: E98 Iorio MV, Ferracin M, Liu C, Veronese A, Spizzo R, Sabbioni S, Magri E, Pedriali M, Fabbri M, Campiglio M, Mènard S, Palazzo JP, Rosenberg A, Musiani P, Volinia s, Nenci I, Calin GA, Querzolo P, Negrini M, Croce CM. Cancer Res. 2005; 65: 7065-7070. Jiang J, Lee EJ, Gusev Y, Schmittgen TD. Real-time expression profiling of microRNA precursor in human cancer cell lines. Nucleic Acid Res. 2005, 33: 5394-53403. John B, Enright AJ, Aravin A, Tuschl T, Sander C, Marks DS.Human MicroRNA targets. PLoS Biol. 2004; 2:e363. Johnson SM, Lin SY, Slack FJ. The time of appearance of the C. elegans let-7 microRNA is transcriptionally controlled utilizing a temporal regulatory element in its promoter. Dev Biol. 2003; 259: 364-79. Johnson SM, Grosshans H, Shingara J, Byrom M, Jarvis R, Cheng A, Labourier E, Reinert KL, Brown D, Slack FJ. RAS is regulated by the let-7 microRNA family. Cell. 2005 ; 120: 635-47. Johnston RJ, Hobert O. A microRNA controlling left/right neuronal asymmetry in Caenorhabditis elegans. Nature. 2003; 426: 845-9. Karube Y, Tanaka H, Osada H, Tomida S, Tatematsu Y, Yanagisawa K, Yatabe Y, Takamizawa J, Miyoshi S, Mitsudomi T, Takahashi T. Reduced expression of Dicer associated with poor prognosis in lung cancer patients.Cancer Sci. 2005; 96: 111-5. Kasschau KD, Xie Z, Allen E, Llave C, Chapman EJ, Krizan KA, Carrington JC. P1/HC-Pro, a viral suppressor of RNA silencing, interferes with Arabidopsis development and miRNA unction. Dev Cell. 2003; 4: 205-17. Kim VN. MicroRNA precursors in motion: exportin-5 mediates their nuclear export. Trends Cell Biol. 2004; 14: 156-9. Kim J, Krichevsky A, Grad Y, Hayes GD, Kosik KS, Church GM, Ruvkun G. Identification of many microRNAs that copurify with polyribosomes in mammalian neurons.Proc Natl Acad Sci U S A. 2004 Jan 6; 101: 360-5. Kim VN, Nam JW. Genomics of microRNA. Trends Genet. 2006; 22:165-73. Kiriakidou M, Nelson PT, Kouranov A, Fitziev P, Bouyioukos C, Mourelatos Z, Hatzigeorgiou A. A combined computational-experimental approach predicts human micro RNA targets. Genes Dev. 2004 ; 18: 1165-78.
145
Khvorova A, Reynolds A, Jayasena SD. Functional siRNAs and miRNAs exhibit strand bias.Cell. 2003 ; 115: 209-16. Kloosterman WP, Wienholds E, de Bruijn E, Kauppinen S, Plasterk RH. In situ detection of miRNAs in animal embryos using LNA-modified oligo nucleotide probes. Nat Methods. 2006 Jan;3(1):27-9. Krek A, Grun D, Poy MN, Wolf R, Rosenberg L, Epstein EJ, MacMenamin P, da Piedade I, Gunsalus KC, Stoffel M, Rajewsky N. Combinatorial microRNA target predictions. Nat Genet. 2005; 37: 495-500. Krichevsky AM, Sonntag KC, Isacson O, Kosik KS. Specific microRNAs modulate embryonic stem cell-derived neurogenesis. Stem Cells. 2006 ; 24: 857-64. Krutzfeldt J, Rajewsky N, Braich R, Rajeev KG, Tuschl T, Manoharan M, Stoffel M. Silencing of microRNAs in vivo with ‘antagomirs’. Nature 2005, 438: 685-689. Krutzfeldt J, Poy MN, Stoffel M. Strategies to determine the biological function of microRNAs. Nature genetics 2006; 38: 14-19. Lagos-Quintana M, Rauhut R, Lendeckel W, Tuschl T. Identification of novel genes coding for small expressed RNAs. Science 2001; 294: 853-862. Lagos-Quintana M, Rauhut R, Yalcin A, Meyer J, Lendeckel W, Tuschl T. Identification of tissue-specific microRNAs from mouse. Curr Biol. 2002; 12: 735-9. Lagos-Quintana M, Rauhut R, Meyer J, Borkhardt A, Tuschl T. New microRNAs from mouse and human. RNA 2003; 9: 175-179. Lai EC, Tomancak P, Williams RW, Rubin GM. Computational identification of Drosophila microRNA genes. Genome Biol. 2003; 4: R42. Lau NC, Lim LP, Weinstein EG, Bartel DP. An abundant class of tiny RNAs with probable regulatory roles in Caenorhabditis elegans. Science. 2001;294 :858-62. Leaman D, Chen PY, Fak J, Yalcin A, Pearce M, Unnerstall U, Marks DS, Sander C, Tuschl T, Gaul U. Antisense-mediated depletion reveals essential and specific functions of microRNAs in Drosophila development. Cell. 2005; 121: 1097-108. Lee RC, Feinbaum RL, Ambros V. The C. elegans heterochronic gene lin-4 encodes small RNAs with antisense complementarity to lin-14.Cell. 1993; 5: 843-54. Lee RC, Ambros V. An extensive class of small RNAs in Caenorhabditis elegans. Science. 2001 Oct 26; 294: 862-4. Lee Y, Jeon K, Lee JT, Kim S, Kim VN. MicroRNA maturation: stepwise processing and subcellular localization. EMBO J. 2002 ; 21:4663-70. Lee C, Risom T, Strauss WM. MicroRNAs in mammalian development. Birth Defects Res. 2006; 78: 129-139.
146
Legendre M, Lambert A, Gautheret D. Profile-based detection of microRNA precursors in animal genomes.Bioinformatics. 2005; 21: 841-5. Lewis BP, Shih IH, Jones-Rhoades MW, Bartel DP, Burge CB. Prediction of mammalian microRNA targets. Cell. 2003; 115:787-98. Lim LP, Glasner ME, Yekta S, Burge CB, Bartel DP. Vertebrate microRNA genes. Science 2003; 299: 1540. Lim LP, Lau NC, Weinstein EG, Abdelhakim A, Yekta S, Rhoades MW, Burge CB, Bartel DP. The microRNAs of Caenorhabditis elegans. Genes Dev. 2003; 17: 991-1008. Lim LP, Lau NC, Garrett-Engele P, Grimson A, Schelter JM, Castle J, Bartel DP, Linsley PS, Johnson JM. Microarray analysis shows that some microRNAs downregulate large numbers of target mRNAs. Nature. 2005 ; 433: 769-73. Lin SY, Johnson SM, Abraham M, Vella MC, Pasquinelli A, Gamberi C, Gottlieb E, Slack FJ. The C elegans hunchback homolog, hbl-1, controls temporal patterning and is a probable microRNA target. Dev Cell. 2003; 4: 639-50. Lin SL, Chang DC, Ying SY. Isolation and identification of gene-specific microRNAs. Methods Mol Biol. 2006;342:313-20. Liu C, Calin GA, Meloon B, Gamliel N, Sevignani C, Ferracin M, Dumitru CD, Shimizu M, Zupo S, Dono M, Alder H, Bullrich F, Negrini M, Croce CM. An oligonucleotide microchip for genome-wide microRNA profiling in human and mouse tissues. PNAS 2004; 101: 9740-9744. Llave C, Xie Z, Kasschau KD, Carrington JC. Cleavage of Scarecrow-like mRNA targets directed by a class of Arabidopsis miRNA. Science. 2002; 297: 2053-6. Long W, Wagner KU, Lloyd KC, Binart N, Shillingford JM, Hennighausen L, Jones FE. Impaired differentiation and lactational failure of Erbb4-deficient mammary glands identify ERBB4 as an obligate mediator of STAT5.Development. 2003; 130: 5257-68. Lu J, Qian J, Chen F, Tang X, Li C, Cardoso WV. Differential expression of components of th microRNA machinery during mouse organogenesis. Bioch. Bioph. Res. Comm. 2005; 334. 319-323. Luciano DJ, Mirsky H,Vendetti NJ,Maas S.RNA editino of a miRNA precursor. RNA. 2004 ;10:1174-7. Mackie EJ, Chiquet-Ehrismann R, Pearson CA, Inaguma Y, Taya K, Kawarada Y, Sakakura T. Tenascin is a stromal marke for epithelial malignancy in the mammary gland. Proc Natl Acad Sci U S A. 1987 Jul; 84: 4621-5. Mansfield JH, Harfe BD, Nissen R, Obenauer J, Srineel J, Chaudhuri A, Farzan-Kashani R, Zuker M, Pasquinelli AE, Ruvkun G, Sharp PA, Tabin CJ, McManus MT. MicroRNA-responsive 'sensor' transgenes uncover Hox-like and other developmentally regulated patterns of vertebrate microRNA expression. Nat Genet. 2004; 36: 1079-83. Martinez J, Houdebine LM. Biologie de la Lactation. INRA Editions. 1994.
147
Matsumoto M, Nishinakagawa H, Kurohmaru M, Hayashi Y, Otsuka J. Effects of estrogen and progesterone on the development of the mammary gland and the associated blood vessels in ovariectomized mice. J Vet Med Sci. 1992; 54: 1117-24. Mattick JS. RNA regulation: a new genetics? Nat Rev Genet. 2004; 5: 316-23. Meister G, Tuschl T. Mechanism of gene silencing by double-stranded RNA. Nature 2004; 431: 343-349. Michael MZ, O' Connor SM, van Holst Pellekaan NG, Young GP, James RJ. Reduced accumulation of specific microRNAs in colorectal neoplasia. Mol Cancer Res. 2003;1: 882-91. Missal K, Zhu X, Rose D, Deng W, Skogerbo G, Chen R, Stadler PF. Prediction of structured non-coding RNAs in the genomes of the nematodes Caenorhabditis elegans and Caenorhabditis briggsae.J Exp Zoolog B Mol Dev Evol. 2006; 306: 379-92. Mourelatos Z, Dostie J, Paushkin S, Sharma A, Charroux B, Abel L, Rappsilber J, Mann M, Dreyfuss G. miRNPs: a novel class of ribonucleoproteins containing numerous microRNAs. Genes Dev. 2002; 16: 720-8. Mueller SO, Clark JA, Myers PH, Korach KS. Mammary gland development in adult mice requires epithelial and stromal estrogen receptor alpha. Endocrinology. 2002 ; 143:2357-65. Mulac-Jericevic B, Lydon JP, DeMayo FJ, Conneely OM. Defective mammary gland morphogenesis in mice lacking the progesterone receptor B isoform. Proc Natl Acad Sci U S A. 2003; 100: 9744-9. Murchison EP, Partridge JF, Tam OH, Cheloufi S, Hannon GJ. Characterization of Dicer-deficient murine embryonic stem cells. Proc Natl Acad Sci U S A. 2005; 102: 12135-40. Naguibneva I, Ameyar-Zazoua M, Polesskaya A, Ait-Si-Ali S, Groisman R, Souidi M, Cuvellier S, Harel-Bellan A. The microRNA miR-181 targets the homeobox protein Hox-A11 during mammalian myoblast differentiation. Nat Cell Biol. 2006; 8: 278-84. Nam JW, Shin KR, Han J, Lee Y, Kim VN, Zhang BT. Human microRNA prediction through a probabilistic co-learning model of sequence and structure. Nucleic Acids Res. 2005; 33: 3570-81. Napoli C, Lemieux C, Jorgensen R. Introduction of a Chimeric Chalcone Synthase Gene into Petunia Results in Reversible Co-Suppression of Homologous Genes in trans. Plant Cell. 1990; 2:279-289. Nelson P, Kiriakidou M, Sharma A, Maniataki E, Mourelatos Z. The microRNA world: small is mighty. Trends Biochem. Sci. 2003; 28: 534-40. Nelson PT, Hatzigeorgiou AG, Mourelatos Z. miRNP:mRNA association in polyribosomes in a human neuronal cell line. RNA. 2004; 10: 387-94. Nelson PT, Baldwin DA, Scearce LM, Oberholtzer JC, Tobias JW, Mourelatos Z. Microarray-based, high-throughput gene expression profiling of microRNAs. Nat Methods. 2004; 1: 155-61.
148
Nguyen DA, Neville MC. Tight junction regulation in the mammary gland. J Mammary Gland Biol Neoplasia. 1998l;3:233-46. Olsen PH, Ambros V. The lin-4 regulatory RNA controls developmental timing in Caenorhabditis elegans by blocking LIN-14 protein synthesis after the initiation of translation. Dev Biol. 1999; 16: 671-80. O'Donnell KA, Wentzel EA, Zeller KI, Dang CV, Mendell JT. c-Myc-regulated microRNAs modulate E2F1 expression. Nature. 2005; 435: 839-43. O’Rourke J, Swason MS, Harfe BD. MicroRNAs in mammalian development and tumorigenesis. Birth Defects Res. 2006; 78: 172-179. Parmar H, Cunha GR. Epithelial-stromal interactions in the mouse and human mammary gland in vivo. Endochrine-Related Cancer 2004; 11: 437-458. Pasquinelli AE, Reinhart BJ, Slack F, Martindale MQ, Kuroda MI, Maller B, Hayward DC, Ball EE, Degnan B, Muller P, Spring J, Srinivasan A, Fishman M, Finnerty J, Corbo J, Levine M, Leahy P, Davidson E, Ruvkun G. Conservation of the sequence and temporal expression of let-7 heterochronic regulatory RNA. Nature. 2000; 408: 86-9. Pasquinelli AE. MicroRNAs: deviants no longer. Trends Genet. 2002;18: 171-3. Pelengaris S, Khan M, Evan G. c-MYC: more than just a matter of life and death. Nat Rev Cancer. 2002; 2: 764-76. Pfeffer S, Sewer A, Lagos-Quintana M, Sheridan R, Sander C, Grasser FA, van Dyk LF, Ho CK, Shuman S, Chien M, Russo JJ, Ju J, Randall G, Lindenbach BD, Rice CM, Simon V, Ho DD, Zavolan M, Tuschl T. Identification of microRNAs of the herpes virus family. Nat Methods. 2005; 2:269-76. Poy MN, Eliasson L, Krutzfeldt J, Kuwajima S, Ma X, Macdonald PE, Pfeffer S, Tuschl T, Rajewsky N, Rorsman P, Stoffel M. A pancreatic islet-specific microRNA regulates insulin secretion. Nature 2004 ; 432: 226-30. Rajewsky N. MicroRNA target predictions in animals. Nature Genetics 2006; 38: 8-13. Rao M, Sockanathan S. Molecular mechanisms of RNAi: implications for development and disease. Birth Defects Res C. Embryo Today 2005; 7: 28-42. Reinhart BJ, Slack FJ, Basson M, Pasquinelli AE, Bettinger JC, Rougvie AE, Horvitz HR, Ruvkun G. The 21-nucleotide let-7 RNA regulates developmental timing in Caenorhabditis elegans.Nature. 2000; 403: 901-6. RICHARDSON KC. The effector contractile tissues of the mammary gland. J Endocrinol. 1949; 6: Suppl, xxv. Richards RC, Benson GK. Involvement of the macrophage system in the involution of the mammary gland in the albino rat. J Endocrinol. 1971; 51: 149-56
149
Richert MM, Schwertfeger KL, Ryder JW, Anderson SM. An atlas of mouse mammary gland development. Journal of Mammary Gland Biology and Neoplasia 2000; 5: 227-241. Robinson GW. Identification of signaling pathways in early mammary gland development by mouse genetics. Breast Cancer Res. 2004; 6: 105-8. Russo IH, Russo J. Mammary gland neoplasia in long term rodent studies. Environ Health Perspect. 1996;104:938-67. Ruvkun G, Giusto J. The Caenorhabditis elegans heterochronic gene lin-14 encodes a nuclear protein that forms a temporal developmental switch. Nature. 1989; 338: 313-9. Schulman BR, Esquela-Kerscher A, Slack FJ. Reciprocal expression of lin-41 and the microRNAs let-7 and mir-125 during mouse embryogenesis. Dev Dyn. 2005; 234: 1046-54. Seitz H, Royo H, Bortolin ML, Lin SP, Ferguson-Smith AC, Cavaille J. A large imprinted microRNA gene cluster at the mouse Dlk1-Gtl2 domain. Genome Res. 2004; 14: 1741-8. Shen LX, Cai Z, Tinoco IJr.RNA structure at high resolution. FASEB J. 1995; 9:1023-33. Schratt GM, Tuebing F, Nigh EA, Kane CG, Sabatini ME, Kiebler M, Greenberg ME. A brain-specific microRNA regulates dendritic spine development. Nature. 2006 ; 439: 283-9. Schwarz DS, Hutvagner G, Du T, Xu Z, Aronin N, Zamore PD. Asymmetry in the assembly of the RNAi enzyme complex. Cell. 2003; 115: 199-208 Sempere LF, Sokol NS, Dubrovsky EB, Berger EM, Ambros V. Temporal regulation of microRNA expression in Drosophila melanogaster mediated by hormonal signals and broad-Complex gene activity. Dev Biol. 2003; 259: 9-18. Sempere LF, Freemantle S, Pitha-Rowe I, Moss E, Dmitrovsky E, Ambros V. Expression profiling of mammalian microRNAs uncovers a subset of brain-expressed microRNAs with possible roles in murine and human neuronal differentiation. Genome Biol. 2004; 5:R13. Sewer A, Paul N, Landgraf P, Aravin A, Pfeffer S, Brownstein MJ, Tuschl T, van Nimwegen E, Zavolan M. Identification of clustered microRNAs using an ab initio prediction method. BMC Bioinformatics. 2005; 6:267. Silberstein GB, Daniel CW. Investigation of mouse mammary ductal growth regulation using slow-release plastic implants. J Dairy Sci. 1987; 70: 1981-90. Slack FJ, Basson M, Liu Z, Ambros V, Horvitz HR, Ruvkun G. The lin-41 RBCC gene acts in the C. elegans heterochronic pathway between the let-7 regulatory RNA and the LIN-29 transcription factor. Mol Cell. 2000; 5: 659-69. Song L, Tuan RS. MicroRNAs and cell differentiation in mammalian development. Birth Defects Res. 2006, 78: 140-149. Sonoki T, Iwanaga E, Mitsuya H, Asou N. Insertion of microRNA-125b-1, a human homologue of lin-4, into a rearranged immunoglobulin heavy chain gene locus in a patient with precursor B-cell acute lymphoblastic leukemia. Leukemia. 2005; 19: 2009-10.
150
Sternlicht MD, Kouros-Mehr H, Lu P, Werb Z. Hormonal and local control of mammary branching morphogenesis.Differentiation. 2006; 74: 365-81. Strange R, Li F, Saurer S, Burkhardt A, Friis RR. Apoptotic cell death and tissue remodelling during mouse mammary gland involution. Development. 1992; 115: 49-58. Suh MR, Lee Y, Kim JY, Kim SK, Moon SH, Lee JY, Cha KY, Chung HM, Yoon HS, Moon SY, Kim VN, Kim KS. Human embryonic stem cells express a unique set of microRNAs. Dev Biol. 2004 ; 270: 488-98. Szymanski M, Barciszewski J. Regulation by RNA. Int. Rev. Cytol. 2003;.231:.197-258. Takamizawa J, Konishi h, Yanagisawa K, Tomida S, Osada H, Endoh H, Harano T, Yatabe Y, Nagino M, Nimura Y, Mitsudomi T, Takahashi T. Reduced expression of the let-7 microRNAs in human lung cancers in association with shortened postoperative survival. Cancer res. 2004; 64: 3753-3756. Tang G, Reinhart BJ, Bartel DP, Zamore PD. A biochemical framework for RNA silencing in plants. Genes Dev. 2003; 17: 49-63. Teleman AA, Maitra S, Cohen SM. Drosophila lacking microRNA miR-278 are defective in energy homeostasis.Genes Dev. 2006; 20: 417-22. Thomson JM, Parker J, Perou CM, Hammond SM. A custom microarray platform for analysis of microRNA gene expression. Nat Methods. 2004;1:47-53. Tomari Y, Zamore PD. MicroRNA biogenesis: drosha can't cut it without a partner. Curr Biol. 2005 ;15:R61-4. Topper YJ, Freeman CS. Multiple hormone interactions in the developmental biology of the mammary gland. Physiol Rev. 1980; 60: 1049-106. van der Krol AR, Mur LA, Beld M, Mol JN, Stuitje AR. Flavonoid genes in petunia: addition of a limited number of gene copies may lead to a suppression of gene expression. Plant Cell. 1990; 2: 291-9. Vella MC, Choi EY, Lin SY, Reinert K, Slack FJ. The C. elegans microRNA let-7 binds to imperfect let-7 complementary sites from the lin-41 3'UTR. Genes Dev. 2004 ;18:132-7. Wang X, Zhang J, Li F, Gu J, He T, Zhang X, Li Y. MicroRNA identification based on sequence and structure alignment. Bioinformatics. 2005; 21: 3610-4. Wheeler G, Ntounia-Fousara S, Granda B, Rathjen T, Dalmay T. Identification of new central nervous system specific moue microRNAs. FEBS Letters 2006; 580: 2195-2200. Wienholds E, Plasterk HA. MicroRNA function in animal development. FEBS Letters 2005; 579: 5911-5922. Wightman B, Burglin TR, Gatto J, Arasu P, Ruvkun G. Negative regulatory sequences in the lin-14 3'-untranslated region are necessary to generate a temporal switch during Caenorhabditis elegans development. Genes Dev. 1991; 5: 1813-24.
151
Xie X, Lu J, Kulbokas EJ, Golub TR, Mootha V, Lindblad-Toh K, Lander ES, Kellis M. Systematic discovery of regulatory motifs in human promoters and 3' UTRs by comparison of several mammals. Nature 2005; 434: 338-45. Xu H, Wang X, Du Z, Li N. Identification of microRNAs from different tissues of chicken embryo and adult chicken. FEBS Letter 2006; 580: 3610-3616. Xue C, Li F, He T, Liu GP, Li Y, Zhang X. Classification of real and pseudo microRNA precursors using local structure-sequence features and support vector machine. BMC Bioinformatics. 2005;6:310. Yang Z, Ebright YW, Yu B, Chen X. HEN1 recognizes 21-24 nt small RNA duplexes and deposits a methyl group on to the 2'OH of the3' terminal nucleotide. Nucleic Acids Res. 2006 Jan 30;34(2):667-75 Yekta S, Shih IH, Bartel DP. MicroRNA-directed cleavage of HOXB8 mRNA. Science 2004; 304: 594-6. Yi R, O’Carrol D, Pasolli HA, Zhang Z, Dietrich FS, Tarakhovsky A, Fuchs E. Morphogenesis in skin is governed by discrete sets of differentially expressed microRNAs. Nature Genetics 2005; 38: 356-362. Yi R, O'Carroll D, Pasolli HA, Zhang Z, Dietrich FS, Tarakhovsky A, Fuchs E. Morphogenesis in skin is governed by discrete sets of differentially expressed microRNAs. Nat Genet. 2006; 38: 356-62. Yoon S, De Micheli G. Computational Identifications of microrNAs and their targets. Birth Defects Res. 2006, 78: 118-128. Zamore P, Haley B. Ribo-gnome: the big world of small RNAs. Science 2005; 309: 1519-1524. Zeng Y, Cullen BR. Sequence requirements for micro RNA processing and function in human cells. RNA. 2003; 9:112-23. Zeng Y, Yi R, Cullen BR. MicroRNAs and small interfering RNAs can inhibit mRNA expression by similar mechanisms. Proc. Natl. Acad. Sci. U S A. 2003; 100: 9779-84.
152
Publications Crepaldi L., Silveri L., Calzetti F., Pinardi C., Cassatella M.A. .Molecular basis of the synergistic production of IL-1 receptor antagonist by human neutrophils stimulated with IL-4 and IL-10. International Immunology 2002 Oct; 14(10):1145-53; Calvo JH, Martinez-Royo A, Silveri L, Floriot S, Eggen A, Marcos-Caravilla A, Serrano M. Isolation, mapping and identificationof SNPs for four genes (ACP6, CGN, ANXA9, SLC27A3) from a bovine QTL region on BTA3.Cytogenet Genome Res. 2006; 114(1): 39-43. Licia Silveri, Gaelle Tilly, Jean-Luc Vilotte and Fabienne LeProvost. MicroRNAs involvement in mammary gland development and breast cancer. Reprod. Nutr.Dev, 2006 sept ; 5: 1-10. Jann OC, Aerts J, Jones M, Hastings N, Law A, McKay S, Marques E, Prasad A, Yu J, Moore SS, Floriot S, Mahe MF, Eggen A, Silveri L, Negrini R, Milanesi E, Ajmone-Marsan P, Valentini A, Marchitelli C, Savarese MC, Janitz M, Herwig R, Hennig S, Gorni C, Connor EE, Sonstegard TS, Smith T, Drogemuller C, Williams JL. A second generation radiation hybrid map to aid the assembly of the bovine genome sequence. BMC Genomics 2006 Nov; 7:283.

153