Embed Size (px)
Citation preview

UNIVERSITÀ DEGLI STUDI DI VERONA FACOLTA’ DI MEDICINA E CHIRURGIA
Dipartimento di Scienze Morfologico-Biomediche Sezione di Anatomia e Istologia
DOTTORATO DI RICERCA IN Imaging Multimodale in Biomedicina
CICLO XXI
TITOLO DELLA TESI DI DOTTORATO
An integrated system for video and telemetric EEG recording, measuring behavioural and physiological parameters, as a tool in Safety Pharmacology testing for assessing CNS-side effects
S.S.D. BIO/16 – ANATOMIA UMANA
Coordinatore: Prof. Andrea Sbarbati Tutor: Prof. Paolo Francesco Fabene
Dottoranda: Dott.ssa Elena Moscardo
28 Febbraio 2009

2
“Esistono uomini sui quali l’irraggiungibile esercita una particolare attrazione. Di solito non sono esperti: le loro ambizioni e fantasie sono abbastanza forti da spazzare via i dubbi che uomini piu’ prudenti potrebbero nutrire. Le loro armi piu’ efficaci sono la determinazione e la fede. Nel migliore dei casi, questi uomini
sono considerati degli eccentrici, nel peggiore dei folli.”
WALT UNSWORTH Everest
“...Non ero troppo sicuro di cosa potessi raggiungere con la sola tenacia e poche altre capacita’, ma mi ponevo obiettivi molto impegnativi e ogni fallimento non faceva che rafforzare la mia
determinazione a realizzare almeno uno dei miei grandi sogni...”
EARL DENMAN Alone to Everest

3
All the experiments described into this research work were conducted in the
Research and Development Centre of GlaxoSmithKline Verona, Italy, in the
Laboratories of Safety Pharmacology Group within the Safety Assessment
Department. All experiments were carried out in accordance with Italian regulation
governing animal welfare and protection and the European Directive 86/609/EEC,
and according to internal GlaxoSmithKline Committee on Animal Research &
Ethics (CARE) review.
4
Table of Contents 1. Objectives and Aim ...................................................................................................... 5 2. Introduction................................................................................................................... 6
Electroencephalography .................................................................................................. 6 Video Recording............................................................................................................... 7 Radio-telemetry................................................................................................................7 Identification of the measuring sites in discrete brain areas............................................. 8
3. Methodology............................................................................................................... 10
The EEG-Video-Telemetry Model .................................................................................. 10 Advantages and Disadvantages of the Methodology..................................................... 11
4. Experimental activities................................................................................................ 12
Objectives and Rationale ............................................................................................... 12 Part I:.................................................................................................................................. 14 Equipment Set-up and Technical Verification .................................................................... 14
Materials and Methods................................................................................................... 15 Acquisition and Analysis of Data ................................................................................ 19
Discussion...................................................................................................................... 24 PART II:.............................................................................................................................. 25 Animals’ Surgical Preparation ............................................................................................ 25
Materials and Methods................................................................................................... 26 Animals and Housing ................................................................................................. 26 Antibiotic cover and analgesic treatment.................................................................... 26 Telemetric probes implantation .................................................................................. 26 Recording and analysis of videos and telemetric signals........................................... 32 Post-mortem investigation.......................................................................................... 34
Results ........................................................................................................................... 35 Analysis of the videos................................................................................................. 35 Analysis of the Telemetric traces ............................................................................... 40
Post mortem analysis..................................................................................................... 44 Discussion...................................................................................................................... 45
PART III:............................................................................................................................. 47 Pharmacological Validation................................................................................................ 47
Materials and Methods................................................................................................... 48 Reference compounds and doses rationale............................................................... 48 Pentylentetrazole (GABAA receptor antagonist)......................................................... 48 4-Amynopiridine (K+ receptor antagonist).................................................................. 49 Imipenem/cilastatin..................................................................................................... 49 Animals and Housing ................................................................................................. 50 Study design............................................................................................................... 50 Clinical observations and Body weights ..................................................................... 52 Telemetric measurements and video recordings ....................................................... 52
Results and Discussion.................................................................................................. 53 Final Remarks and Conclusions ........................................................................................ 54
References.....................................................................................................................56

5
Objectives and Aim
The aim of present research activities is the setting up, assessment and the validation of a
new EEG-Video-Telemetry Model in the Rat. In particular, the potentialities of this model to
combine and synchronise the acquisition and the analysis of both physiological-
electroencephalographic parameters by telemetry and behavioural patterns by video
images was investigated, in order to assess brain’s activity both in physiological and
pathological conditions.
The main focus of the present research is the potential future application/use of this Model
in Safety Pharmacology testing for assessing CNS-side effects, in particular the pro-
convulsing liability and sleep disorders following new chemical entities (NCEs)
administration.
This research had two principal objectives:
1. Relation between seizures and convulsions. Analyze the relation between
seizures and convulsions (EEGs traces versus behavioural observations) in
animals (rats mainly) with the scope to understand the power of the EEG-telemetry
Model for assessing the pro-convulsive potential risk of New Chemical Entities
(NCEs). This model could refine in Tier II CNS testing the conventional models for
pro-convulsive potential assessment (i.e., tests of chemical and electrical induction
of seizures).
2. EEGs traces versus behavioural patterns. Analyze the relation between brain’s
electrical activity (the amount of electrical power in the different frequency bands of
the EEG) and behaviour in animals for assessing specific CNS side effects. This
activity could contribute in the CNS Tier II for the assessment of drug-related sleep
disruption and impairments on learning, memory and visual and auditory functions
following NCEs administration.

6
1. Introduction
The behaviour is considered to form the ultimate integration of nervous system functions
at the level of the intact organism (Mello, 1975; Niesink et al 1998), while the physiology
gives insight into phenomena that are hard to see by a simple observation.
Studying this organ system of unparalleled complexity (Santiago Ramon y Cajal, 1897) is
often the combination of physiology and behaviour that makes research more interesting
and valuable and allows a complete and coherent assessment of nervous system
functionalities and alterations.
To properly assess Central Nervous System activities/functionalities a system capable to
assess simultaneously the behavioural and the electrophysiological activities of the brain
should be used by an integrated acquisition and analysis of EEGs physiological traces and
the behaviour in freely moving animals.
Electroencephalography
The electroencephalography is the neurophysiologic measurement of the electrical activity of the brain by recording from electrodes placed on the scalp, on the cortex or on
deep areas of the brain. The resulting traces are known as electroencephalogram (EEG) and represent so-called brainwaves. The EEGs are used by neuroscientists and
psychiatrists since 1875 to study the function of the brain by recording brainwaves during
controlled behaviours in humans and in laboratory animals, mainly to investigate EEG-
sleep and EEG-epilepsy patterns.
The first EEG recording in human, obtained by Hans Berger in 1929
EEG limitations: electrodes are not sensitive enough to pick out individual action
potentials of a neuron, the electric unit of signaling in the brain, or whether the resulting
electrical activity is releasing inhibitory, excitatory or modulatory neurotransmitters.
Instead, the EEG picks up synchronization of neurons (amplitude of about 100 µV on the
scalp and about 1-2 mV on the surface of the brain).

7
EEG has limited anatomical specificity. Some anatomical specificity with EEG topography,
which uses a large number of electrodes to triangulate the source of the electrical activity
(side effects!).
EEG advantages: The time resolution is very high (down to sub-millisecond). The brain is
thought to work through its electric activity and EEG is the only method to measure it
directly. Newer research typically combines EEG or MEG with MRI or PET to get high
temporal and spatial resolution.
Video Recording
The video image is the most innovative method, which allows to capture the behaviour of
alive organisms into their environment.
Video recording of behaviour/activity of a freely moving and undisturbed animal can help in
the correct definition/analysis and for the improvement of knowledge of behavioural
patterns.
The dedicated software-hardware Observer and EthoVision (by Noldus Technology) allow
quantitatively and qualitatively measuring and analyzing the behavioural
activities displayed by the animal.
Radio-telemetry
The radio-telemetry is a technology of radio-signals recording from chronically implanted
transmitters in freely moving animals widely used to investigate physiological parameters.
Telemetry system have progressed over the last 25 years from simple devices allowing
the measurement of one physiological parameter to more complex system capable of
simultaneously monitoring several variables (BP, ECG or EEG, BT, LA) in large and small
animals.
The fully implantable radio-telemetry is an alternative technique to that of the non-
implantable jacket telemetry and the head tether in obtaining EEG measurements from
freely moving animals.

8
Figure 1. A scheme of the telemetric recording system.
Identification of the measuring sites in discrete brain areas
In general, for the experimental in vivo procedures where the application of
electrochemical (i.e., voltametry, micro-dialysis) and electrophysiological (i.e., cell firing,
electroencephalography) techniques are used, the [micro]probes are inserted in discrete
brain’s area by a stereotaxic guide in order to record and analyse the signals which come
from this discrete areas.
At the end of the experimental period, it is scientifically relevant and fundamental the
correct localisation and identification of the exact position of the surgically implanted
active-probe. It is recommended, therefore, to verify post-mortem the anatomical source
and the validity of the recorded and analysed signals. The active-probe is the terminal
portion or tip of the probe which is involved into the molecular exchange for the micro-
dialysis fiber or into the electrical exchange and conduction for the electrodes of
voltametry and electrophysiology (metallic probes in platinum, silver, carbonium, stained
steel or tungsten) between the tissue and acquisition system. The diameter of the tip of the
active-probe can be from approximately 10-20 μm up to 100-200 μm.
The method to identify post-mortem the anatomical position into the deep area of the brain
of the active-probe (Jeanblanc J. et al., 2002; Stamford J. et al., 1992; Crespi. F et al.,
1988; Borland LM et al., 2005) consists in transferring to the brain’s tissue a micro-current

9
of 10 mA (generated by a generator of current pulses) directly thought the deep metallic
electrode, which allows the electrical conduction, and applying this current for a short
period of approximately 10-15 seconds. This procedure allows generating a slight and
local burst of few μm of neurons around the position site of the electrode’s tip. The
procedure is performed with the animals in deep anaesthesia.
Then when the animal in still under deep anesthesia is killed by decapitation and the brain
is taken, frozen and preserved at -20°C. Fresh brains are sectioned with a cryostat in few
µm slices and the Nissl staining method is then used for the detection of Nissl body in the
cytoplasm of neurons. The Nissl body of cells is a large granular body found in neurons by
the German neurologist Franz Nissl (1860-1919) and is the extranuclear RNA. This
method is commonly used for identifying the basic neuronal structure in the brain and
spinal cord tissue, because it is able to stain purple-blue the perikaryon in soma and
dendrites of neurons, though not in the axon or axon hillock.

10
2. Methodology
The EEG-Video-Telemetry Model
The EEG-Telemetry Model uses both the Radio-telemetry for physiological parameters
recording and video-images technologies. The system allows:
- Making videos and telemetric acquisition simultaneously and synchronised for all
filmed subjects;
- Videos and telemetric recording length of 24 hours or more in continuous;
- Start and stop of videos and telemetric data recording can be authomatised (e.g.,
start during the dark phase without disturb animals);
- Analyze all physiological signals having video images on the screen and the
contrary;
- Analyze all videos (ideally automatically) in order to identify specific
occurrences/episodes;
- Score manually detailed behaviors around these occurrences synchronized with
physiological signals.
A chronically implanted three bio-potential transmitter (TL10M3-F50-EEE by Data Science
International DSI) is used for continuous and simultaneous recording of cortical and
intracranial/deep EEGs traces, electromyogram (EMG) and locomotor activity (LA) in
freely moving adult rats.
This methodological and technical approach allows distinguishing between cortical and
limbic (hippocampus) epileptiform activity, considered an essential issue when the
initiation and spread of seizures is under evaluation (JF Bastlund et al., 2004, AM White et
al., 2006, P Williams et al., 2006). In addition, the use of deep electrodes positioned in
specific areas of the brain allows investigations of the electrical activity in relation to
specific behaviors in which these areas are known to be mainly involved (e.g.,
hippocampus for long-term memory processes, amygdale in emotional processes).

11
Advantages and Disadvantages of the Methodology
The methodology selected for the EEG-Video-Telemetry Model has the following
advantages:
• EEG has a very high time resolution (down to sub-millisecond) and therefore is the
only method able to meaure directly the very fast brain’s activity;
• The quality of the EEG traces is improved by reducing movements artifacts (cable
noises);
• Allows prolonged observation periods (continuous sampling) up to 3 months
continuously (the duration of the transmitter’s battery);
• Avoids methods causing discomfort to animals (e.g., restraint, handling,
complications of externalized apparatus, etc);
• Reduces the inter-individual variability; the physiological parameters recorded
continuously on the same individual animal also provide chronobiology information;
• Avoids use of other pharmacological entities or electrical stimulation that can cause
unwanted effects as secondary lesions resulting from abnormal activity of neurons
or acute neurotoxic effects;
• EEG traces directly related to defined aspects of behavior, because animals can
be involved in specific behavioral tests and they are completely free to move and
respond to different exercises/tests with no differences versus not implanted
animals.
And the disadvantages detailed below:
• EEG has limited spatial/anatomical specificity, because electrodes pick up
synchronization of neurons (amplitude of about 100 µV on the scalp and about 1-2
mV on the surface of the brain);
• More labor intensive, technologically complex and expensive;
• DSI transmitters currently available for small animals generate a maximum of three
bio-potential channels, therefore focal seizure initiation and spread can not be
investigated (limited anatomical specificity to triangulate the source of the electrical
activity);
• EEG-telemetry is very innovative and therefore its successful validation is complex
and carries some risks, even if other competitor Pharmas seem to be working in
this direction in efficacy and safety pre-clinical assessments.

12
3. Experimental activities
Objectives and Rationale
The activities described into this research work were associated with the technical and
pharmacological validation of the EEG-Video-Telemetry Model, in order to use the model
as a tool for the proper assessment of CNS-related unwanted effects.
The model was technically validated in terms of equipment set-up (PART I) and animals’
surgical preparation (PART II), as follows:
(PART I) the selected equipment (hardware and software) for the simultaneous
and continuous (i.e., periods longer than 24 hours) recording and analysis of
physiological parameters (EEG, EMG and LA) by radio-telemetry and the video
images by dedicated video cameras was installed and technically verified for their
correct functionality.
(PART II) the surgical preparation, the pre- and post-operative care and conditions
of animals after the implantation of telemetric devices were tested/refined to
improve as much as possible the implantation technique of telemetric devices
(model TL10M3-F50-EEE) for physiological signals (e.g., cortical and
intracranial/deep EEGs, electromyography EMG) recording and to establish the
time required for their complete recovery (in terms of health status and quality of
telemetric signals). To this end, the physiological parameters obtained by telemetry
and the general activity by videos were recorded continuously and analysed from
the day after surgery up to 15 days after surgery (this is the time currently
considered necessary for rats to completely recover), in order to follow implanted
animals in their post-surgery recovery period.
It was started the pharmacological validation of the model by the preliminary selection of
the appropriate doses of known pro-convulsive reference compounds (PART III) and the
following use of these compounds on telemetric rats, as follows:
(PART III) Three known pro-convulsing reference compounds (i.e.,
Pentylentetrazole a GABAA receptor antagonist, 4-Amynopiridine a K+ receptor
antagonist and Imipenem/cilastatin a carbapenem antibiotic), were administered to

13
male CDTM rats approximately 12 weeks old, in order to identify the seizure-
inducing potentials following systemic administration and to establish the
relationship between behavioural and clinical signs preceding and accompanying
the convulsive episode and paroxismal activity of EEG traces.
14
Part I:
Equipment Set-up and Technical Verification

15
Methods and Materials
This part of the research was dedicated to select, integrate, install and validate the EEG-
Video-Telemetry system equipment.
It has been formed the hypothesis of a system capable to simultaneously assess the
animal behaviour and the electrophysiological activities of the brain by an integrated
acquisition and analysis of EEGs physiological traces and the behaviour in freely moving
animals. This system integrating the two technologies of Radio-telemetry and Video
recording should allow:
- Making videos and telemetric acquisition simultaneously and synchronised for all
filmed subjects;
- Providing videos and telemetric recording of 24 hours length or more and in
continuous;
- Starting and stopping videos and telemetric data recording automatically (e.g., for
eventual starts during the dark phase without disturbing animals);
- Analysing both physiological signals and videos having all data on the computer
screen;
- Analysing all videos (ideally automatically) in order to identify specific
occurrences/episodes of an interest;
- Scoring manually detailed behaviors around these occurrences synchronized with
physiological signals.

16
The initial set-up (Figure 2) proposed by suppliers was refined by a “tests and errors
method” to arrive finally at the set up, used to conduct all experiments described in this
research work.
Figure 2: The initial set-up for video and telemetric data simultaneus recording.
In the final set-up (Figure 3) the major refinements were:
- the inclusion of an additional camera for each PhenoLab cage (Ikegami black/white
camera ICD-49E with Spacecom ottica varifocal manual iris 3-8 mm, F1.4, IR correct)
positioned laterally to collect images in full-resolution allowing the detailed analysis of the
behaviour;
- the use of multiplexes (Panasonic WJ-MS424 Colour Quad System) for collecting three
top-videos in one image, in order to perform on these images the automatic tracking of
video data.
The Computer System selected to acquire telemetric signals was the Data Science
International Dataquest ART Gold 4.01, while the MPEG4 Encoder and The Observer XT
connected directly with PhenoLab cages were the selected system to acquire video data.

17
Sync signal Sync signal
Dataquest ART The Observer 1 The Observer 2
Top videos Top videos
C12V C12V
MATRIX MATRIX
Lateral videos Lateral videos
Physiological signals
Integrated analysis software
multiplex multiplex
Physiological signals
Figure 3: The final set-up for video and telemetric data simultaneus recording.
The components of the installed EEG-Video-Telemetry set-up are:
- Video Acquisition system
- 2 Observer XT with External data module and multiple video module, to control 3
PhenoLab cages (by Noldus Information Technology) each
- 2 The Observer XT multi MPEG-4 Encoder (by Noldus Information Technology)
- 6 PhenoTyper cages for rat with camera top unit (by Noldus Information
Technology)
- 1x PhenoTyper Control Unit (by Noldus Information Technology)
- 2 Multiplexers Quad system, each receives images from 3 camera top unit (by
Panasonic)
- 6 lateral cameras b/w (by Ikegami)
- Telemetry Acquisition system
- 1 ART Dataquest Gold 4.1 (by Data Science International)
- 2 Interface cable Com port to ART Dataquest (by Data Science International)

18
- 2 Matrix, each controls 3 receivers and 1 synchroniser C12V (by Data Science
International)
- 6 receivers RPM-1 (by Data Science International)
- 2 synchronisers C12V (by Data Science International)
A complete video and telemetric set-up for 6 rats singly housed was installed with videos
and telemetric traces recorded simultaneously and continuously for up to 24-48 hrs or
longer periods (few days) (Figure 4).
Figure 4: The final EEG-video-telemetry system installed in our laboratory.

19
DAQ
Synchronization signal
Exp Export file physiological data + sync signal
Dataquest ART The Observer PC
Time code signal (Observer PC clock)
Data Acquisition and Analysis The telemetric and video system can acquire synchronised data by a time code signal
(corresponding to the Observer PC clock), which is sent continuously during the data
acquisition from The Observer PC to the Dataquest ART PC (Figure 5). This time code is
then recognised by the Observer software allowing the time synchronisation of the videos
with the physiological telemetric data, and all data can be shown on the screen during the
analysis.
Figure 5: How the synchronistation of video and telemetry sistems works.
During the acquisition of video data, each Observer system receives video signals from 3
PhenoLab cage cameras top units (3 animals), which are multiplexed to generate a single
video signals, and 3 full resolution video signals from 3 lateral cameras (Figure 6). The
video images can be first of all analysed with EthoVision XT v5.1 for Windows OS (Noldus
Information Technology), which makes an automatic identification of parameters like
velocity, distance moved, mobility, movement, elongation thought all the video length (24
hours) (Figure 7). Then, analysis results of the automatic video tracking can be exported
into Excel for following statistical analysis and graphs.

20
Figure 6: The screen of The Observer PC during the acqusition of video signals. The first 3 images come from the lateral cameras, while the fouth image is the multiplexed results of signals from 3 Phenolab cameras top units. Figure 7: The authomatic video tracking performed using EthoVision XT software on the multiplexed video signal which come from 3 Phenolab cameras top units.

21
Video data can also be rearranged for being imported into The Observer XT using an
Excel Macro developed by Noldus, which allows identification of specific
occurrences/episodes of a particular interest (e.g. episode with high mobility and high
velocity, episode with immobility and high elongation, etc). The episodes/occurrences (short video tracts) selected using the Excel Macro or analysing the physiological traces or
based on the time, etc, together with synchronized physiological signals can be imported
into The Observer XT (Figure 8). Video data can be then analysed manually in order to
score detailed behaviors around these occurrences and during this observation-based
analysis, having both the images of the animal from the top and lateral cameras.
Figure 8: Specific seleced episode/occurences together with synchronized physiological signals (EEGs traces) can be imported into The Observer XT for the manual detailed analysis.
During the acquisition of telemetry data, the ART Dataquest Gold system receives signals
from 6 transmitters (6 animals) and the associated receivers which are positioned under
the Phenolab cages from 2 synchronisers C12V (quad signals), one for each Observer PC
(Figure 9).
22
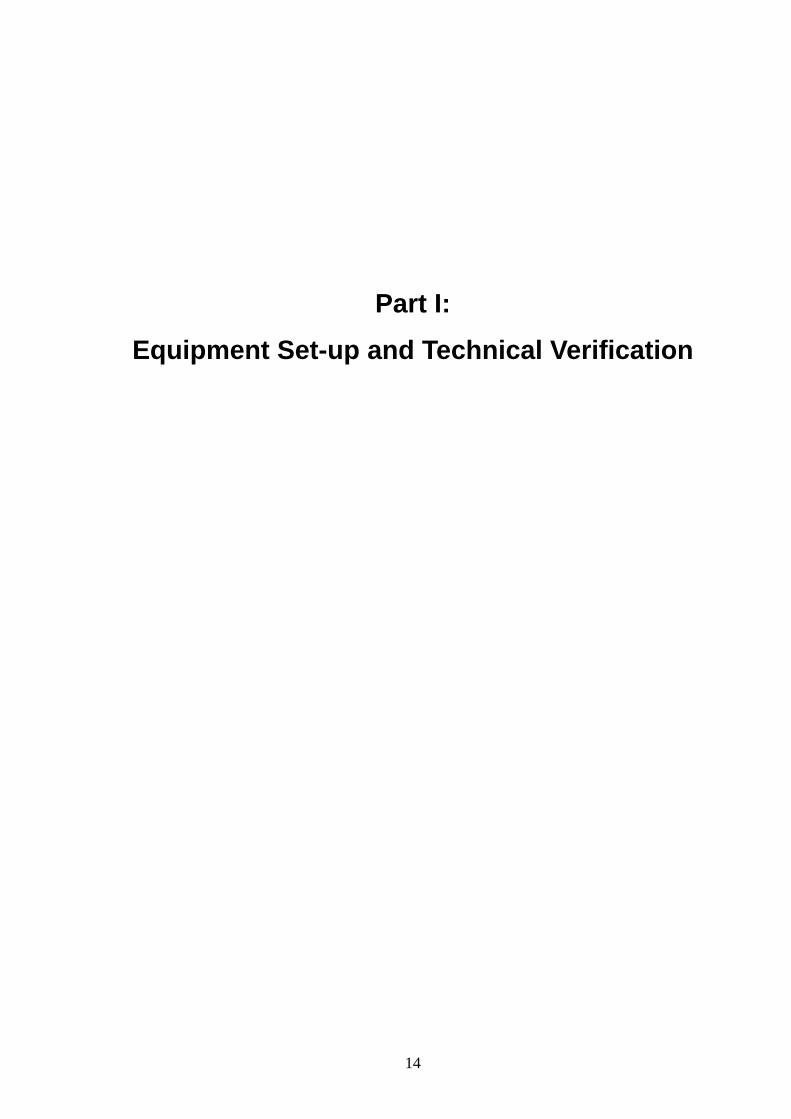
Figure 9: The screen of ART Dataquest PC during the acqusition of telemetric signals. The first 2 are the synchronisers quad signls form the 2 Observer PC, the other 6 are the telemetric EEGs, EMG, Activity signals from 6 animals.
The EEGs and EMG physiological traces by telemetry should be ideally analysed having
videos on the screen using dedicated software. Video information allows visual
assessment of the subject’s behaviour, confirmation of scoring events (Weak, Sleep,
REM-Sleep), classification of seizure types and more. Currently physiologic waveforms
data acquired with Dataquest ART can’t be easily imported into an EEG-analysis software
(e.g. SleepSign by Kissei America) together with synchronized video data.
Using the Neuroscore DSI software videos and the synchronised physiological traces can
be shown at the same time on the screen (Figure 10), but a duplicate video acquisition (in
addition to that obtained with The Observer) is necessary, therefore this option was
excluded in our current EEG-Video-Telemetry system set-up.

23
Figure 10: The screen of Neuroscore DSI software as appears during the analysis of telemetric signals with the sysncronised video data.

24
Discussion
The video-telemetric set-up allows to analyse the physiological traces by telemetry using
dedicated software (i.e., Sleep-Sign, Neuroscore) with videos on the screen, and also it
allows analysing the video images using dedicated software (i.e., Ethovision and The
Observer) with telemetric traces on the screen.
The installed EEG-video-telemetry set-up has shown the following advantages:
- EEG traces directly related to defined aspects of behaviour and animals can be
involved in specific behavioral tests;
- the quality of the EEG traces is improved by reducing movements artifacts (cable
noises);
- prolonged observation periods are allowed (continuous sampling);
- methods causing discomfort to animals are avoided (e.g., restraint, handling,
complications of externalised apparatus);
- the inter-individual variability is reduced because physiological parameters and
behavioural activities are recorded continuously on the same individual animals
also providing chronobiology information.
Also limitations have been evidenced by the system set-up:
- Labor intensive and technological complexity;
- DSI transmitters currently generate a maximum of three bio-potential channels
(electrical activity of more than two-three discrete brain’s areas can not be
investigated in small animals);
- Noldus video recording allows a limited number of videos for each Observation
system (a maximum of 3 animals - 3 top multiplexed + 3 lateral videos - or 4
animals - 4 top videos at full resolution);
- Integration of acquired data is not fully complete/free and easy (e.g., not simple
and/or possible to import video data acquired with The Observer XT into the Sleep,
Epilepsy analysis software together with synchronised DSI physiologic data; DSI
data must be converted into .txt files (hours are request!) to be imported into The
Observer XT);
- Large amount of video data (storage and archive considerations!);
- The technological complexity of the EEG-video-telemetry system makes hard the
GLP-validation.

25
PART II:
Animals’ Surgical Preparation

26
Materials and Methods
Animals and Housing Twenty-three male CDTM rats (Crl:CD (SD) IGS BR) supplied by Charles River Italia, Calco
(LC), Italy were used for surgical implantation of telemetric devices. They had approx. 7 to
8 weeks age on the day of surgery and a body weight of approx. 225 to 250 grams.
An acclimatisation period of 5 days before surgery was applied when animals were
housed in groups of 4 into solid bottomed plastic cages with sawdust litter. They were
housed into solid bottomed plastic cages with clean absorbent tissue (alpha-dri) during the
first 8 days of the recovery/post-surgery period and into PhenoTyper cages with clean
absorbent tissue (Cellu Dri Soft) during the days of the recording of data.
A temperature range of 20-22°C (19-23°C for less than 24 hours) and a relative humidity
range of 45-65% (40-70% for less than 24 hours) with fluorescent lighting illumination from
approximately 06:00 to 18:00 hours daily were applied as husbandry environmental
conditions.
As diet Gamma irradiated Rat and Mouse No. 1 Expanded Diet (Special Diet Services
[SDS] Ltd., England) was provided ad libitum. Drinking filtered water from normal domestic
supply was provided ad libitum. Animals were not fasted prior to surgery and they had
given access to food and water approximately 1 hour after surgery.
Antibiotic cover and analgesic treatment The day of surgical preparation animals received:
- RimadylTM (Carprofen 50 mg/mL) 5.0 mg/kg (sc) at 1mL/kg, Pfizer Inc. U.S.A.; animals
received one subcutaneous dose immediately before surgery;
- RubrocillinaTM Veterinaria, Nuova ICC, Italy at 0.1 mL/rat (benzylpenicilline benzatinica
125,000 U.I./mL plus dihydrostreptomycin sulphate 50 mg/mL); animals received one
subcutaneous dose immediately before surgery;
- Sodium Cloride 0.9% w/v solution, 5 mL/animal was administered subcutaneously
immediately after surgery.
Starting from the day of surgical preparation (Day 1) until Day 3 animals received
RubrocillinaTM Veterinaria 1.0 mL/kg (sc) and RimadylTM 5 mg/kg (sc) once daily.
Telemetric probes implantation Animals were selected for surgery on the basis of their clinical conditions and general
behaviour. Implantation was performed under aseptic conditions, anaesthesia was

27
induced by 5% isoflurane (Forane, Abbott) vaporised in 1.5-2 L/min O2 and was
maintained throughout the surgical procedure under 1.5-2% isoflurane anaesthesia
(Forane, Abbott), vaporised in 1.5-2 L/min O2; this level of isoflurane was adjusted as
required to maintain an appropriate level of anaesthesia.
Material preparation and general information
All instruments and accessories were be autoclaved before use. During the surgical
procedure the body core temperature of the animal was be maintained with a
homoeothermic blanket system, thermostatically controlled (regulated at 37±1°C) by
means of rectal thermocouple. The surfaces over and around each of the incision sites
was shaved and the skin treated with Betadine solution (Iodiopovidone 7.5 g/100 mL -
10% iodide – glycerine, nonilfenossipoliethilenoxyethanol sodium phosphate, citric acid
monohydrate; ASTA Medica S.p.A., Italy) and then with Citrosil Alcolico Azzurro
(Benzalkonium chloride 2.5 mg/mL, ethylic alcohol 700 mg/mL; L.Manetti, H. Roberts & C.
Italy). The animals were then secured to the operating table to allow access to all incision
points and covered with adhesive incise drapes to avoid contact with any non-sterile
surface by the operator. The implant was removed from its sterile packaging or from the
sterilising solution (2.5% gluteraldehyde solution, overnight) and submerged in sterile
saline for at least 15 minutes before implantation.
Transducer Preparation
The three-channel PhysioTel® Multiplus series transmitter type TL10M3-F50-EEE
(Transoma Medical, US) was used. For all leads the silicone coating was peeled back to
expose approximately 5 mm of the helical steel lead. The tip of the ground electrode, the
negative and positive leads of channel 3 (cortical EEG biopotential) and the negative lead
(white) of channel 2 (hippocampus EEG biopotential) were yielded to create an angle of
approximately 90°. A deep electrode (stainless steel electrode E363/2, Plastics One) was
crimped onto the positive lead (red) of channel 2 (hippocampus EEG biopotential) (Figures
11-12). Electrodes of channel 1 was used for EMG recording.

28
Figure 11. The stained steel electrode used to record
hippocampal EEG.
Figure 12. The telemetric transducer type
TL10M3-F50-EEE prepared for cortical
EEG (channel 3), hippocampal EEG
(channel 2) and EMG (channel 1)
recordings.
Surgical Transducer Implantation
The animal was placed on the heating pad in supine position and a 5-6 cm midline
abdominal incision was made through the skin and muscle along the linea alba. The
transmitter body was placed into the peritoneum parallel to the long axis of the body with
the leads directed rostral and it was fixed to the inner peritoneal wall with 4-0 silk suture.
The three-couple of leads were passed subcutaneously through the muscle abdominal
incision, and then the incision was closed using absorbable suturing thread (Vicryl 3-0).
A 2 cm lateral incision was made just below the shoulder blades, the site of the EMG leads
placement. A 2 cm mid-saggital incision was made on the scalp from the bridge of the
nose to the posterior end of the cranium, the site of the two-couples of EEG leads
placement (Figure 13). The two incisions were temporary protected/covered using saline
(previously heated to approximately 37°C) moistened gauze sponges. A hollow trocar was
used to tunnel subcutaneously through the flank region the leads, directed to the incisions
on the head and the neck of the animal.

29
The two electrodes for EMG recording were
secured to the underlying musculus
cervicoauricolaris (neck muscle) by 4-0 silk
suture. The skin incision was closed using
absorbable suturing thread (Vicryl 3-0).
The animal was then secured in the sterotaxic
apparatus. The skin on the scalp was
reflected using a retractor to expose the entire
dorsal portion of the skull. The periostium was
removed and haemostasis achieved with
sterile cotton-tip applicators and a cautery pen
where necessary. Five holes were drilled in
the skull surface. One hole was used to
position the ground lead placed supradurally
over the right frontal lobes behind Lambda.
Figure 13. Two incisions for placement of the
EEGs leads on the scalp and EMG leads on the
back of the neck for EMG.
The two electrodes for the cortical EEG recording were placed supradurally on the right
hemisphere, both 3mm lateral to bregma and the positive lead (red) at 2mm and the
negative lead (white) at 6mm posterior to bregma over the parietal association cortex (red:
AP –2.0mm, L 3.0mm ; white: –6.0mm, L 3.0mm). The two electrodes tips were pressed
into the predrilled holes in the skull, touching the dura, and were initially hold in place with
a drop of tissue adhesive (3M Vetbond, St.Paul , MN, US) and a small quantity of gel
cyanoacrylate gel (RS Components, Northants, UK).
An intra-hippocampal 10mm length stainless steel electrode (E363/2 by Plastics One) was
attached to a guide wire and using stereotaxic coordinates (AP -4.0mm, L -2.5mm, V
3.8mm), was placed deep in the granule cell layer of the dorsal dentate gyrus of the left
hippocampus and was initially hold in place with a small quantity of cyanoacrylate gel (RS
Components, Northants, UK). Then the electrode was connected to the positive radio-
telemetry lead (red) by direct mechanical contact. The negative lead (white) was placed
supradurally at approximately 3mm lateral and 7mm caudal from the hippocampus lead
(AP -7.0mm, L -3mm) (Figures 14-15-16).

30
Figure 14. The intra-hippocampus
electrode attached to a guide wire is
positioned deep in the left hippocampus.
Figure 15. The intra-hippocampus
electrode is hold in place with a small
quantity of cyanoacrylate gel.
Figure 16. The intra-hippocampus
electrode is connected to the positive
radio-telemetry lead (red) by mechanical
contact. The negative lead (white) is
placed supradurally caudal from the
hippocampus lead.
Figure 17. All electrodes are covered
and fixed to the skull with dental acrylic
cement.

31
All electrodes were then covered and fixed to the skull with dental acrylic cement (Denture
Reline Material self-curing by SC Stratford-Cookson Company) (Figure 17). The skin
incision on the scalp was closed using absorbable suturing thread (Vicryl 3-0). The excess
lead was placed in a pocket under the abdominal skin to prevent tangling of leads and
intestines. Finally the skin abdominal incision was closed using absorbable suturing thread
(Vicryl 3-0). After completion of the transmitter implantation, no external device is visible
(Figure 18-19).
Figure 18: A scheme of stereotaxic positioning of all the telemetric leads on the cranium.
Figure 19: A scheme of the surgical implantation of the telemetric transmitter in the rat.

32
Post-surgical recovery
At the end of the surgery the abdominal suture was moistened with Citrosil Alcolico
Azzurro (benzalkonium chloride 2.5 mg/mL, ethylic alcohol 700 mg/mL; L.Manetti, H.
Roberts & C. Italy). After surgery the animals were placed in the incubators with warm
environment and observed until they were awake.
Recording and analysis of videos and telemetric signals On 23 implanted animals, EMG, cortical EEG and hippocampus EEG signals by telemetry
and the general activity data by video were recorded during the recovery/post-surgery 15
days period to assess the quality of the signals and to collect background data on the
recovery process from this type of surgery. In particular, recordings of these parameters
were made on each occasion continuously for approximately 24 hours on Day 1, 6 and 15
after surgery.
Video data were collected using the MPEG4 Encoder and The Observer XT connected
directly with the PhenoLab cages (Noldus Information Technology). Video data were
analysed using the automatic video-tracking software Ethovision XT. From the 23
subjects, 19 rats were selected and for both the whole 24 hours period and in time bins of
30 minutes of length the following parameters were evaluated and reported:
- Distance moved (the distance of the animal’s center-body point movement);
- Elongation (the time spent by animals in a contracted, normal and stretched body
position, with thresholds at 80 and 20%);
- Mobility (the duration of mobile animal, with thresholds at 3 - immobile);
- Movement (the duration of moving of the center-body point);
- Velocity (velocity of the animal’s center-body point, with thresholds at 2 and 1.7
cm/s).

33
Telemetric data were collected using the hardware-software acquisition system Dataquest
ART Gold 4.01 (Data Science International). Telemetric EEGs and EMG traces of 7
implanted rats were analysed for the whole 24 hours period and sleep stages wake (W),
sleep (SWS) and REM-Sleep or Paradoxical-sleep (P) were evaluated using the software
Neuroscore v.2.0 (Data Science International) and applying the Rodent Sleep Scoring
detector (Figure 20).
Figure 20: The Rodent Sleep Scoring detector applied to telemetric data for sleep analysis.
Using the software Neuroscore v.2.0 also an automatic identification of electrical artifacts
duration on the telemetric traces was performed. In addition a manual-visual verification of
the quality of signals was performed to compare telemetric traces recorded on Day 1 and
those recorded on Day 15.

34
Post-mortem investigation Under deep isoflurane anaesthesia a low current of 10mA for approximately 10-20
seconds were administered thought the deep electrode at all animals involved in previous
experimental activates; then the animals were killed by decapitation. The brain was taken,
frozen in an isopentane solution (approximately -30 °C) and then preserved at -20°C. After
cryostat sectioning of 14µm slices, Nissl (cresyl violet)-stained histological sections were
made in order to identify the correct positioning of the deep electrode into the left
hippocampus (dentate gyrus) at -4.16 mm from the Bregma following the coordinates of
the Paxinos & Watson Atlas (Figure 21).
Figure 21: The desired position of the deep electrode into the left hippocampus (dentate gyrus) based on stereotaxic coordinates of the Paxinos & Watson Atlas.

35
Distance moved
0.00
500.00
1000.00
1500.00
2000.00
2500.00
3000.00
3500.00
4000.00
1 2 3 4 5 6 7 8 9 10 11 12 13 14 15 16 17 18 19 20 21 22 23 24
Time (h)
dist
ance
(cm
)
Day 1Day 6Day 15
6:00 pm 6:00 am
Results
Analysis of the videos The analysis of video data during the 24 hours period comparing Day 1, Day 6 and Day 15
showed no significant changes in the mean distance of the animals’ movement (Graph 1)
during the whole recovery period.
Graph 1: Mean distance moved and standard errors during the whole 24 hours period.
From the analysis in time bins of 30 minutes of length was noted a trend to increase the
distance of locomotion from Day 1 to Day 15 after surgery and on Day 15 during the last
hours of the activity phase (dark phase from 6:00 pm to 6:00 am) the distance of
movement was particularly high. However, this parameter showed that the light-dark
circadian cycle, with rats less active during the day and active during the night, was
maintained starting from Day 1 after surgery (Graph 2).
Graph 1: Mean distance moved each 30 minutes to follow the trend of the whole 24 hours period.
Distance moved
0.00
100.00
200.00
300.00
400.00
500.00
600.00
700.00
800.00
Day 1 Day 6 Day 15
dist
ance
(m)
36
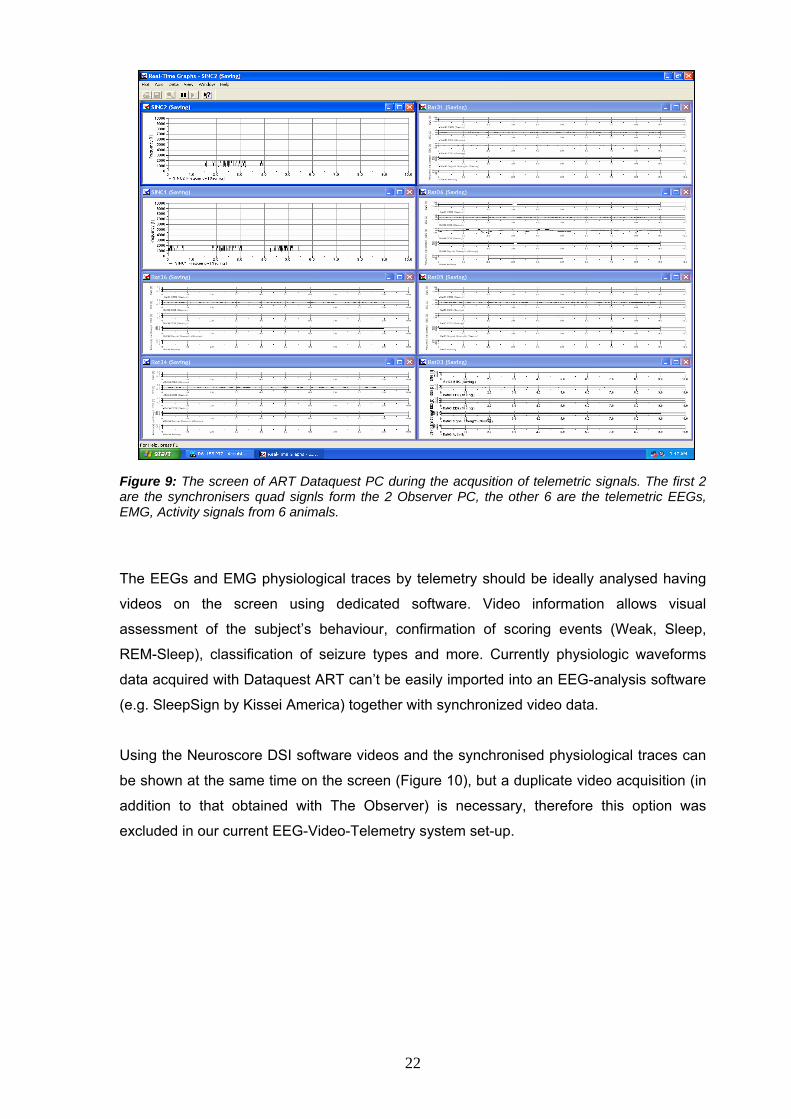
The analysis of movement which represent the mean duration of moving of rats during the
24 hours period showed a significant increase of this parameter on Day 15 when
compared both with Day 1 and Day6, but the mean values of this parameter were no
significantly different between Day 1 and Day 6 (Graph 3).
Graph 3: Mean duration of moving and standard errors during the whole 24 hours period.
** p<0.01 Day 6 vs Day 15; ** p<0.01 Day 1 vs Day 15 (t-Student for pair-wise comparisons).
The analysis of the duration of moving every 30 minutes showed an increase of the time
spent moving by animals from Day 1 to Day 15 after surgery particularly evident during the
active night phase (from 6:00 pm to 6:00 am), while no significant difference was noted
between Day 1 and Day 6. As the distance moved, also this parameter showed that the
light-dark circadian cycle was maintained starting from Day 1 after surgery (Graph 4) and
rats were active longer in terms of time during the dark phase compared with the light
phase.
Graph 4: Mean time spent moving each 30 minutes.
***
Movement
0.00
20.00
40.00
60.00
80.00
100.00
120.00
140.00
160.00
180.00
200.00
Day 1 Day 6 Day 15
Dura
tion
(min
) **
**
Movement
0.00
50.00
100.00
150.00
200.00
250.00
300.00
350.00
400.00
450.00
500.00
1 2 3 4 5 6 7 8 9 10 11 12 13 14 15 16 17 18 19 20 21 22 23 24
Time (h)
dura
tion
(sec
)
Day 1Day 6Day 15
6:00 pm 6:00 am
37
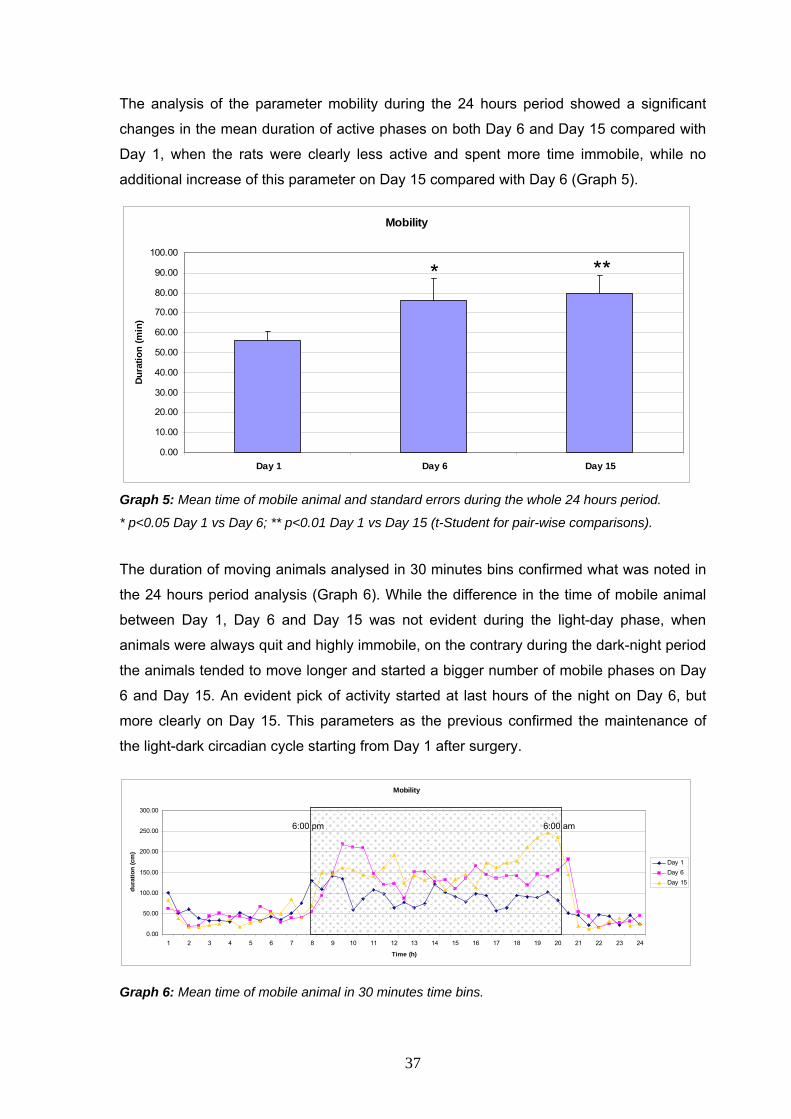
The analysis of the parameter mobility during the 24 hours period showed a significant
changes in the mean duration of active phases on both Day 6 and Day 15 compared with
Day 1, when the rats were clearly less active and spent more time immobile, while no
additional increase of this parameter on Day 15 compared with Day 6 (Graph 5).
Graph 5: Mean time of mobile animal and standard errors during the whole 24 hours period.
* p<0.05 Day 1 vs Day 6; ** p<0.01 Day 1 vs Day 15 (t-Student for pair-wise comparisons).
The duration of moving animals analysed in 30 minutes bins confirmed what was noted in
the 24 hours period analysis (Graph 6). While the difference in the time of mobile animal
between Day 1, Day 6 and Day 15 was not evident during the light-day phase, when
animals were always quit and highly immobile, on the contrary during the dark-night period
the animals tended to move longer and started a bigger number of mobile phases on Day
6 and Day 15. An evident pick of activity started at last hours of the night on Day 6, but
more clearly on Day 15. This parameters as the previous confirmed the maintenance of
the light-dark circadian cycle starting from Day 1 after surgery.
Graph 6: Mean time of mobile animal in 30 minutes time bins.
Mobility
0.00
10.00
20.00
30.00
40.00
50.00
60.00
70.00
80.00
90.00
100.00
Day 1 Day 6 Day 15
Dura
tion
(min
)
* **
Mobility
0.00
50.00
100.00
150.00
200.00
250.00
300.00
1 2 3 4 5 6 7 8 9 10 11 12 13 14 15 16 17 18 19 20 21 22 23 24
Time (h)
dura
tion
(cm
)
Day 1Day 6Day 15
6:00 am6:00 pm

38
The mean velocity of the animals during the 24 hours period increased significantly from
Day 1 to Day 15 passing from approximately 45-50 cm/min on Day 1 and Day 6 to
approximately 70-75 cm/min on Day 15, without a difference between Day 1 and Day 6
(Graph 7) when the velocity remained substantially unchanged.
Graph 7: Mean velocity of animals and standard errors during the whole 24 hours period. ** p<0.01 Day 1 vs Day 15; ** p<0.01 Day 6 vs Day 15 (t-Student for pair-wise comparisons).
The velocity analysed in 30 minutes time bins showed an high increase on Day 15
compared with Day 1 and Day 6, evident only during the active night phase (from 6:00 pm
to 6:00 am), while no significant difference was noted between the recording days during
the non-active day phase (from 6:00 am to 6:00 pm). Also this parameter clearly showed
that the light-dark circadian cycle was maintained for the whole post-surgery recovery
period (Graph 8).
Graph 8: Mean velocity of animals calculated in 30 minutes time bins.
Velocity
0.00
0.10
0.20
0.30
0.40
0.50
0.60
0.70
0.80
0.90
Day 1 Day 6 Day 15
(m/m
in)
****
Velocity
0.00
0.50
1.00
1.50
2.00
2.50
3.00
1 2 3 4 5 6 7 8 9 10 11 12 13 14 15 16 17 18 19 20 21 22 23 24
Time (h)
cm/s
ec Day 1Day 6Day 15
6:00 pm 6:00 am

39
The analysis of the parameter elongation gave information on the position maintained by
the rat during the recovery period. In particular, it was noted that preferred position of
animals on Day 1 post-surgery is the normal position, probably due to the abdominal pain
caused by the laparotomy. The stretched position decrease from Day 1 with an associated
significant increase of the contracted position on Day 6 and Day 15, with no difference
between these two days (Graph 9).
Graph 9: Times spent by the animal in different positions (contracted, normal and stretched) during the whole 24 hours period. ** p<0.01 Day 1 vs Day 6 and Day 15 (t-Student for pair-wise comparisons).
****
Elongation
0.00
200.00
400.00
600.00
800.00
1000.00
1200.00
Day 1 Day 6 Day 15
Elon
gatio
n (m
in)
ContractedNormalStretched
** **

40
EEG Artifacts
0.00
5.00
10.00
15.00
20.00
25.00
30.00
35.00
Day 1 Day 6 Day 15
dura
tion
(min
)
Analysis of the Telemetric traces The quality of the EEGs signals on Day 15 was satisfactory both for the cortical EEG
(channel 3) and the hippocampus EEG (channel 2), on which the prevalent Theta activity
(3.5-7.5 Hz) is clearly identifiable (Figure 22).
Figure 22: The telemetric EEG traces recorded on Day 15 after surgery; in blue is the cortical EEG, in black the hippocampus EEG.
During the recording 24 hours period the automatic research of artifacts on the telemetric
traces (EEGs and EMG) using the Neuroscore software showed no difference in terms of
duration of bad signals between Day 1, Day 6 and Day 15 (Graph 10). Approximately 20-
25 minutes of the whole recording period were not readable and analyzable.
Graph 10: Times of artifacts on the telemetric signals (EEGs and EMG) during the recording 24 hours period. During the manual review of telemetric traces was noted that on Day 1 the EMG signal
appeared clearly disturbed by the electrocardiographyc (ECG) signal, both during the
Sleep (Slow Wave Sleep) and the REM or Paradoxical Sleep (Figure 23-25). These
electrical alterations were not still present on the EMG trace on Day 15 after surgery
(Figure 24-26).

41
Figure 23: Day 1, telemetric traces during SLEEP stages with an evidently disturbed EMG signal.
Figure 24: Day 15, telemetric traces during SLEEP stages with a good quality of EMG signal.

42
Figure 25: Day 1, telemetric traces during Rem-SLEEP stages with an EMG signal clearly influenced by the ECG signal. Figure 26: Day 15, telemetric traces during Rem-SLEEP stages with an EMG signal clearly influenced by the ECG signal.

43
EEG Stages
0.00
100.00
200.00
300.00
400.00
500.00
600.00
700.00
800.00
900.00
1000.00
Day 1 Day 6 Day 15
dura
tion
(min
)
WakeRem-SleepSleep
Hypnogram Rat 10
Day 1
Day 5
Day 6
Day 15
10:00 A M 12:00 PM 02:00 PM 04:00 P M 06:00 PM 08:00 PM 10:00 PM 12:00 A M 02:00 A M 04:00 A M 06:00 A M 08:00 A M 10:00 A M
X
W
A
P
S
Rod
ent
Sle
ep
10:00 A M 12:00 PM 02:00 P M 04:00 P M 06:00 P M 08:00 P M 10:00 PM 12:00 A M 02:00 A M 04:00 A M 06:00 A M 08:00 A M
X
W
A
P
S
Rod
ent
Sle
ep
09:36 A M 12:00 PM 02:24 PM 04:48 P M 07:12 P M 09:36 P M 12:00 A M 02:24 A M 04:48 A M 07:12 A M 09:36 A M
X
W
A
P
S
Rod
ent
Sle
ep
The analysis of the three EEG stages – wake, sleep and REM or paradoxical sleep – on
the whole 24 hours recording period of telemetric traces, showed no significant changes
between Day 1, Day 6 and Day15 (Graph 11). In a day-time the duration of the wake-
active and sleep-inactive stages were similar on each of the recording occasions, with
approximately 12 hours for sleeping and 12 hours dedicated to be awake, and
approximately from 25 to 90 minutes in REM-sleep.
Graph 11: Times spent by the animal in different EEG stages (weake, REM-sleep and sleep) during the whole 24 hours period.
Hypnograms confirmed that the light-dark circadian cycle was maintained for the whole
post-surgery recovery period, without marked differences from Day 1 to Day 15.

44
▼
Post mortem analysis
Nissl-stained histological sections of brains showed that the deep electrode was correctly
positioned as desired into the dentate gyrus of the left hippocampus (Figure 27-28).
Figure 27: The trace leaved by the deep electrode from the cortex down to the neurons of the dentate gyrus of the left hippocampus (Nissl, 2.5X).
Figure 28: A particular on the position of the electrode’s active tip (Nissl, 10X and 40X).

45
Discussion
The surgical technique that was developed and applied to rats to record simultaneously
cortical and hippocampus EEGs required 15 days for the complete recovery of animals
both in terms of health status and quality of telemetric signals.
From the behavioural-motor activities analysis using the video data also appeared that 15
days is an appropriate period for the complete recovery of the rat from the implantation of
DSI transmitters using the selected surgical technique. During the post-surgery recovery
period increases of duration of moving, time of mobile animal and velocity were noted and
were significant from Day 6 or Day 15. For the most of these parameters there were no
significant differences between Day 6 and Day 15 as mean values calculated on the whole
24 hours recording period, but their increased values were notable during the dark-active
phase (from 6:00 pm to 6:00 am). On Day 6, but more clearly on Day 15, a rapid increase
of motor-activities was recorded starting at last hours of the night. These results indicate a
gradual and rapid recovery of animals after the telemetric device implantation, with no
major alteration of the physiological behavioural-motor activities, which are a good index of
the health conditions.
The position maintained by the rat during the recovery period changed from Day 1 to Day
6 and Day 15. On Day 1 animals had preferred stretched position, probably due to the
abdominal pain caused by the laparotomy. On Day 6 and Day 15 animals sent more time
in the physiological contracted and normal positions, which should demonstrated the full
recovery from the surgical pain.
Using a mechanical connection between the deep electrode and the DSI electrode, the
telemetric recording system is able to acquire EEGs and EMG signals of good quality after
15 days from the surgical implantation. After this period of stabilisation, the system also
clearly discriminated the differences between the cortical and the hippocampus traces. In
fact, in the hippocampus EEG was clearly identifiable the prevalent Theta activity (3.5-7.5
Hz) of neurons of this area of the brain. The cortical EEG could be used for an appropriate
automatic analysis using the Neuroscore software, with approximately 4% of the whole
recording trace unreadable due to electrical artefacts, starting from Day 1. The EMG
signal, used by the software for the automatic analysis, was clearly influenced by the ECG
signal on Day 1, and this disturb was still present on Day 6, even if with a lower
magnitude. Therefore, based on the results of this research in order to have an easier and
more accurate detection of EEGs stages, it is suggested to perform the experimental
activities, record and analyse of telemetric traces from Day 15 post-surgery.

46
For all the post-surgery recovery period, on the whole 24 hours animals dedicated
approximately 12 hours for sleeping, 12 hours to be awake and approximately from 25 to
90 minutes in REM-sleep. The three EEG stages time durations showed no significant
changes between Day 1, Day 6 and Day15.
All the videos (behavioural-motor activities) and telemetric (hypnogram) parameters
recorded during the recovery period showed and confirmed each other the maintenance of
the light-dark circadian cycle of animals, which is present on Day 1 just after surgery, with
no substantial changes until Day 15 post-surgery.
These results confirm that the applied surgical technique for the implantation of telemetric
transmitter type TL10M3-F50-EEE for the simultaneous recording of cortical, hippocampus
electroencephalograms and electromiogram in freely moving rats, allows a gradual, but
rapid recovery of animals within 15 days. The fact that during all this recovery period there
were no changes of the light-dark circadian cycle of animals, confirm the good quality of
the technique and its possible application in different research areas to obtain
simultaneously good physiological and behavioural-motor activities data.
Post-mortem verification of the position of the deep electrode confirmed that following the
selected stereotaxic coordinates, the active-recording tip of the electrode was correctly
positioned in the dentate gyrus cells lyer.

47
PART III:
Pharmacological Validation

48
Methods and Materials
Reference compounds and doses rationale Three pro-convulsing reference compounds were preliminary tested on non-telemetric rats
in order to define the doses of Pentylentetrazole (GABAA receptor antagonist), 4-
Amynopiridine (a K+ receptor antagonist) and of Imipenem/cilastatin (a carbapenem
antibiotic) causing convulsions in the male CD™ rats approximately 12 weeks old and to
analyze clinical and behavioural signs preceding and accompanying the convulsive
episode. These doses were selected as the most appropriate doses to be administered in
the pro-convulsing validation studies using implanted telemetric animals.
Pentylentetrazole (GABAA receptor antagonist) Pentylentetrazole (GABAA receptor antagonist) from Sigma-Aldrich (Milano, Italy) was
administered intraperitoneally, because this is one of the most widely used routes for
administration of this pro-convulsive compound to laboratory animals in the literature
(Nehlig A. and Vasconcelos A.P., 1996, Van Camp N. et al, 2003, Arrieta O. et al., 2005).
For selecting appropriate doses of PTZ, it was taken into account that the susceptibility to
PTZ-induced seizures is age-dependent (Klioueva et al., 2001; Veliskova et al., 1996) and
the telemetered implanted CDTM rats involved in this study were 7-9 months old.
In previous investigative studies, PTZ was administered intraperitoneally to male CDTM rats
of approximately 12 weeks, at 100, 80, 50, 30, 25, 10 and 5 mg/kg. The dose of 100 mg/kg
induced clonic-tonic convulsions which resulted in the death of animals. Doses of 80 and
50 mg/kg caused clinical signs, such as subdued behaviour, walking in a flatted position,
half-closed eyes and piloerection up to 2-3 hours post-dose, while no behavioural changes
were noted at doses ≤ 30 mg/kg.
Based on these results doses of 10, 20 and 40 mg/kg of PTZ were used to treat
intraperitoneally 6 telemetered implanted rats at a dose volume of 10 mL/kg. As vehicle
0.9% w/v Sodium Cloride was used. The low, intermediate and high doses were selected
to provide from none to subconvulsive effects-signs until the development of a single short
and recoverable generalized tonic-clonic convulsion.

49
4-Amynopiridine (K+ receptor antagonist) The 4-aminopyridine (K+ receptor antagonist) from Sigma-Aldrich (Milano, Italy) was
administered intraperitoneally, because this is one of the most widely used routes for
administration of this pro-convulsive compound to laboratory animals in the literature
(Mihály A. et al., 2001, Fragoso-Veloz J. et Tapia R., 1992, Fabene P. et al., 2006).
In previous investigative studies, 4-AP was administered to male CDTM rats of
approximately 12 weeks, intraperitoneally at 0.3, 1, 3, 5, 10 or 20 mg/kg. Doses ≥ 5 mg/kg
induced clonic-tonic convulsion which resulted in the death of animals. The dose of 3
mg/kg caused clinical signs such as all body tremors, jerks, tiptoe walking and a slight
subdued behaviour from 2 hours up to 4 or 6 hours post-dose, when all these clinical signs
were completely recovered. No changes related to 4-AP administration were noted at ≤ 1
mg/kg.
Based on these results doses of 1, 2.5 and 4 mg/kg of 4-AP were used to treat
intraperitoneally 6 telemetered implanted rats at a dose volume of 10 mL/kg. As vehicle
0.9% w/v Sodium Cloride was used. The low, intermediate and high doses were selected
to provide from none to subconvulsive effects-signs until the development of a single short
and recoverable generalized tonic-clonic convulsion.
Imipenem/cilastatin IMIPEMTM from Neopharmed (500mg/500mg i.m.) (imipenem monohydrate/cilastatin
sodium salts), is the prototype of the carbapenem antibiotics class (imipenem)
administered in combination with the renal dipeptidase inhibitor cilastatin. This reference
compound was administered intravenously (bolus injection) because it was reported that in
intravenous (IV) injection studies the compound produced seizure discharged on
electroencephalogram (EEG) accompanied with behavioural clonic convulsions in rats
(Williams et al., 1988, Dupuis et al., 2001, Horiuchi M. et al., 2006).
In previous investigative studies, imipenem/cilastatin was administered to male CDTM rats
of approximately 12 weeks, intravenously at 200/200, 400/400, 750/750 and
800/800 mg/kg. The doses of 750/750 and 800/800 mg/kg Imipenem/cilastatin caused
repetitive, severe and long lasting episodes of clonic-tonic convulsions. The dose of 700
mg/kg caused evident and characteristic clinical signs (i.e., alertness, awareness, tiptoe

50
gait, piloerection, tremors, twitches, wet dog shakes and ears flicking). No changes related
to Imipenem/cilastatin administration were noted at ≤ 400/400 mg/kg.
Based on these results doses of 100/100, 400/400 and 700/700 mg/kg of
imipenem/cilastatin were used to treat intravenously 6 telemetered implanted rats at a
dose volume of 10 mL/kg. As vehicle 0.9% w/v Sodium Cloride was used. The low,
intermediate and high doses were selected to provide from none to subconvulsive effects-
signs until the development of a single short and recoverable generalized tonic-clonic
convulsion.
Animals and Housing Male CDTM rats (Crl:CD (SD) IGS BR) supplied by Charles River Italia, Calco (LC), Italy
were used. In the study with PTZ, animals had approx. 7-9 months age on the day of first
dose-administration and a body weight of approx. 550 to 650 grams. In the studies with 4-
AP and Imipenem/cilastatin, animals had approx. 11-12 weeks age on the day of first
dose-administration and a body weight of approx. 450 to 550 grams. An acclimatisation
period of 5 days before surgery was applied when animals were housed in groups of 4 into
solid bottomed plastic cages with. They were housed into solid bottomed plastic cages
with sawdust litter during the not recording days and into PhenoTyper cages with clean
absorbent tissue (Cellu Dri Soft) during the days of the recording of data.
The cortical and hippocampal electroencephalogram, the electromyogram EMG and
general activity by telemetry and the general activity by videos were recorded on the day
of treatment starting from approximately 30 minutes before dosing and continuously until
24 hours post-dose.
Study design For each study using one of the three selected reference compounds, six stock animals
chronically implanted with a three bio-potential transmitter (TL10M3-F50-EEE) were
selected, on the basis of their clinical conditions, the quality of telemetric signals and
general behaviour.

51
Animal numbers used for the study with PTZ are indicated below:
Animal no.
Date of arrival Date of surgical preparation
Transmitter S/N
1 09 Jan 2008 (VR0800002) 14 Jan 2008 39089
2 09 Jan 2008 (VR0800002) 15 Jan 2008 28766
3 09 Jan 2008 (VR0800002) 14 Jan 2008 37788
4 19 Mar 2008 (VR0800189) 26 Mar 2008 25349
5 19 Mar 2008 (VR0800189) 27 Mar 2008 25220
6 19 Mar 2008 (VR0800189) 27 Mar 2008 37932
Animal numbers used for the study with 4-AP are indicated below:
7 01 Oct 2008 (VR-0800549) 6 Oct 2008 10254
8 01 Oct 2008 (VR-0800549) 6 Oct 2008 27000
9 01 Oct 2008 (VR-0800549) 7 Oct 2008 28873
10 01 Oct 2008 (VR-0800549) 8 Oct 2008 13543
11 01 Oct 2008 (VR-0800549) 8 Oct 2008 34476
12 01 Oct 2008 (VR-0800549) 9 Oct 2008 47488
Animal numbers used for the study with imipenem/cilastatin are indicated below:
13 01 Oct 2008 (VR-0800549) 6 Oct 2008 10736
14 01 Oct 2008 (VR-0800549) 7 Oct 2008 28078
15 01 Oct 2008 (VR-0800549) 7 Oct 2008 40612
16 01 Oct 2008 (VR-0800549) 8 Oct 2008 32165
17 01 Oct 2008 (VR-0800549) 9 Oct 2008 23812
18 01 Oct 2008 (VR-0800549) 9 Oct 2008 10335

52
A rising-dose regimen was followed for the administration of the three reference
compounds as follow:
Treatment 1st 2nd
3rd
4th
Rat 1 Vehicle Low dose Mid dose High dose
Rat 2 Vehicle Low dose Mid dose High dose
Rat 3 Vehicle Low dose Mid dose High dose
Rat 4 Vehicle Low dose Mid dose High dose
Rat 5 Vehicle Low dose Mid dose High dose
Rat 6 Vehicle Low dose Mid dose High dose
Each treatment was performed weekly after a washout period of 7 days and all animals
received vehicle and the three doses.
On each occasion data acquisition started at approximately 8:30-9:00 am and dosing
started at 9.30-10:00 am.
Clinical observations and Body weights Animals were subjected to clinical check at least once daily. Clinical observations were
performed on each dosing occasion, before dosing (BD), immediately after dosing (IAD),
continuously for the first hour post-dose and approximately at 2, 4, 6 and 24 hours after
dosing (end of telemetric and video recording).
The body weights were collected on each day of dosing, prior to treatment, in order to
adjust the dose to be administered.
Telemetric measurements and video recordings On each day of treatment telemetric signals (EMG, cortical EEG and hippocampal EEG
traces) and videos were recorded simultaneously for approximately 1 hour before dosing
and 24 hours post-dose, in order to analyse and classify in details any behavioural and
EEG change noted.
Telemetric and video recordings were made with the animals singly housed in their
PhenoLab cages and all the EEG-video-Telemetry system previously described (Part I)
was used.

53
Results and Discussion
A different clinical and behavioural appearance of the convulsion in PTZ, 4-AP and
Imipenem/cilastatin treated animals was noted from the analysis of all clinical observations
collected.
In particular, PTZ at 50 mg/kg caused a single generalised tonic-clonic convulsion in 2/4
rats, completely recovered within 24 hours post-dosing. At lower doses (25 and 5 mg/kg)
were observed dose-related in severity clinical signs (i.e., half-closed eyes, subdued
behaviour, piloerection, walking in flattened position) between 5-10 minutes and 2 hours
post-dosing.
The doses of 3, 1 and 0.3 mg/kg 4-AP caused dose-related in severity clinical signs (i.e.,
alertness, awareness, tiptoe gait, piloerection, tremors, twitches) between 30-40 minutes
and 4 hours post-dosing.
The doses of 750 and 800 mg/kg Imipenem/cilastatin caused repetitive, severe and long
lasting episodes of clonic-tonic convulsions. The dose of 700 mg/kg caused evident and
characteristic clinical signs (i.e., alertness, awareness, tiptoe gait, piloerection, tremors,
twitches, wet dog shakes and ears flicking).
This information is used to select the appropriate doses of PTZ, 4-AP and
Imipenem/cilastatin to be administered to implanted telemetric rats in the pro-convulsing
validation studies. The analysis of telemetric data and videos collected from these treated
telemetric rats (6 for each reference compounds) is currently ongoing.

54
Final Remarks and Conclusions All the experiments described into this research work were conducted in the Research and
Development Centre of GlaxoSmithKline Verona, Italy, in the Laboratories of Safety
Pharmacology Group within the Safety Assessment Department. All experiments were
carried out in accordance with Italian regulation governing animal welfare and protection
and the European Directive 86/609/EEC, and according to internal GlaxoSmithKline
Committee on Animal Research & Ethics (CARE) review.
These results of this research confirm that the settled-up integrated video-telemetric
system (Part I) and the applied surgical technique for the implantation of telemetric
transmitter type TL10M3-F50-EEE (Part II) for the simultaneous and synchronised
recording of cortical, hippocampus electroencephalograms and electromiogram in freely
moving rats, can find appropriate and innovative applications in different research areas,
where is of particular interest to obtain simultaneously physiological and behavioural data.
In particular, the EEG-video-telemetry system could be applied in Safety Pharmacology
testing for assessing central nervous system (CNS) side effects.
The first interesting application in this area of safety, is that related to the analysis of the
relationship between seizures (EEGs traces) and convulsions, where the model could
contribute in refining the conventional models (i.e., tests of chemical and electrical
induction of seizures) to assess the pro-convulsive potential risk of New Chemical Entities
(NCEs), but also in the behavioural characterisation of seizure activities of brain.
This application was only started during this research (Part III), when the EEG-Video-
Telemetry system was used to investigate physiological and behavioral correlations
following administration of pro-convulsive reference compounds (i.e. Pentylentetrazole, 4-
Aminopyridine and Imipenem/cilastatin) in rats. In this area the system should allow the
identification of the seizure-inducing potential, until convulsive threshold doses and the
establishment of relationship between behavioral and clinical signs preceding and
accompanying convulsive episodes and paroxismal activity of the brain.
A second future possible application of the EEG-video-telemetry system in the CNS-
safety, is that related to the analysis of the relationship between EEGs traces and
behavioral patterns, where the model could contribute in assessing specific CNS side

55
effects such as drug related sleep disruption, impairments on learning and memory, visual
and auditory functions alterations.
The system should give to researchers lots of ideas for innovative possible applications
also in routine research areas. For example it could be used for analyzing the influence of
post-operative care procedures, housing environmental conditions and training procedures
on the experimental collected data and results.
Telemetric waveforms and the activities of animals collected with this integrated system
provide unprecedented insight into the correlations between phonotypical-behavioural and
electrical brain activities. The system should reduce the number of animals used,
improve/refine the data quality by maximizing the amount of information gained from each
experimental animal and reduce animal stress and discomfort (3Rs).

56
References
Bastlund J.F., Jennum P., Mohapel P., Vogel V. and Watson W.P. (2004). Measurement
of cortical and hippocampal epileptiform activity in freely moving rats by means of
implantable radiotelemetry. Journal of Neuroscience Methods, 138, 65-72.
Borland LM, Shi G, Yang H Michael AC (2005). Voltammetric study of extracellular
dopamine near microdialysis probes acutely implanted in the striatum of the anesthetized
rat. J Neurosci Methods, 146:149-158.
Crespi. F.; Martin, K.F.; Marsden, C.A. (1988). Nafion coated carbon fibre electrodes
combined with differential pulse voltammetry measure 5HT release in vivo. Neuroscience
27, 885-896.
Dupuis et al., (2001). Pharmacokinetic-Pharmacodynamic Modeling of the
Electroencephalogram Effect of Imipenem in Healthy Rats. Antimicrobial Agents and
Chemotheraphy, 45 (6) 1682-1687.
Fabene P. et al., (2006). Structural and functional MRI following 4-aminopyridine-induced
seizures: A comparative imaging and anatomical study. Neurobiology of Disease, 21, 80-
89.
Fragoso-Veloz J. et Tapia R., (1992). NMDA receptor antagonists protect against seizures
and wet-dog shakes induced by 4-aminopyridine. European Journal of Pharmacology,
221, 275-280.
Heinrichs S.C. and Seyfried T.N. (2006). Behavioural seizure correlates in the animal
models of epilepsy: A road map for assay selection, data interpretation, and the search for
causal mechanisms. Epilepsy and Behavior, 8 5-38.
Horiuchi M. et al., (2006) Absence of Convulsive Liability of Doripenem, a New
Carbapenem Antibiotic, in Comparison with β-Lactam Antibiotics. Toxicology, 222 114-
124.

57
Jeanblanc J. Hoeltzel A. Louilot A. (2002). Dissociation in the involvement of dopaminergic
neurons innervating the core and shell subregions of the nucleus accumbens in latent
inhibition and affective perception. Neuroscience 2002, 111(2):315-323.
Klioueva I.A. et al. (2001). PTZ induced seizure in rats: effects of age and strain.
Physiology and Behaviour, 72 421-426.
Mihály A. et al., (2001). Time-dependent distribution and neuronal localization of the c-fos
protein in the rat hippocampus following 4-aminopyridine seizures. Epilepsy Research, 44
97-108.
Nehlig A and Vasconcelos A.P., (1996). The model of pentylenterazol-induced status
epilepticus in the immature rat: short- and long-term effects. Epilepsy Research, 26, 93-
103.
Stamford, J.; Crespi, F.; Marsden, C.A. (1992). In vivo voltammetric methods for
monitoring monoamine release and metabolism. In: Practical Approach Series Monitoring
Neuronal Activity. Irl Press at Oxford University Press: Oxford U.K. pp.113-145.
Van Camp N. et al., (2003). Simultaneus electroencephalographic recording and functional
magnetic resonance imaging during pentylentetrazol-induced seizures in rat. NeuroImage,
19, 627-636.
Veliskova J. et al., (1996). Age specific effect of baclofen on pentylentetrazol-induced
seizures in developing rats. Epilepsia, 37 718-722.
White A.M., Williams P.A., Ferraro D.J., Clark S., Kadam S.D., Dudek F.E. Staley K.J.
(2006). Efficient unsupervised algorithms for the detection of seizures in continuous EEG
recordings from rats after brain injury. Journal of Neuroscience Methods. 152, 255-266.
Williams et al., (1988). Animals Model for Evaluationg the Convulsive Liability of β-Lactam
Antibiotics. Antimicrobial Agents and Chemotheraphy, 32 (5) 758-760
Williams P.A., White A.M., Ferraro D.J., Clark S., taley K. and Dudek F.E. (2006). The use
of radiotelemetry to evaluate electrographic seizures in rats with kainite-induced epilepsy.
Journal of Neuroscience Methods, 155 39-48.

58
Ringraziamenti
Questo lavoro di ricerca non avrebbe mai potuto essere realizzato se la mia amatissima
famiglia, mio marito Alessandro e i miei due figli Francesca e Michele, non mi avessero
concesso per lavorarci parte del tempo che doveva essere a loro riservato, e non
avessero pazientemente sopportato i miei malumori e momenti di nervosismo conseguenti
alle notti quasi insonni passate a pensare e a lavorare a questo progetto.
Uno speciale ringraziamento pieno di affetto va alla mia amica e collega la Dott.ssa Chiara
Rostello, che mi ha affiancata costantemente ed infaticabilmente nella valutazione dei
disegni sperimentali, nelle attivita’ pratiche e nella elaborazione dei dati sperimentali,
sempre dandomi la sua opinione sincera e professionale e mettendo spesso in luce i lati a
volte troppo fantasiosi ed irrealizzabili delle mie ipotesi di ricerca.
Grazie al mio collega Luciano Cunego per l’insostituibile e brillante capacita’ di aiutarmi in
tutto quello che ha a che fare con la tecnologia – dal cavo elettrico giusto che e’ sempre
capace di trovare, al computer piu’ complesso che per lui non ha segreti. Sono molto grata
ad Eric Rieux e Marco Boscaro di Data Science International e a Reinko Roelofs di Noldus
Information Thecnology per il valido supporto tecnico datomi nel superamento rapito e
proattivo dei problemi per arrivare da un’idea iniziale alla realizzazione concreta di un
sistema complesso, capace di integrare la telemetria con l’acquisizione ed elebarozazione
delle immagini.
Non posso dimenticare di ringraziare il Dott. Renzo Carletti per i concetti di neuroanatomia
che mi ha insegnato e per l’aiuto datomi nella reaizzazione dei preparati istologici,
colorazioni e fotografie.
Grazie a Devid Sokal per l’aiuto datomi nell’apprendimento dei rudimenti della tecnica di
impianto di elettrodi cerebrali profondi, e a Francesco Crespi per la metodologia di
indagine post-mortem del loro corretto posizionamento.
Infine grazie a Eddie Vedder dei Pearl Jam, che con la sua straordinaria voce mi ha
accompagnato con le canzoni dell’album “Into the Wild” durante l’elaborazione dei dati,
che spesso ha richiesto lunghe ore passate davanti allo schermo del mio computer e nella
stesura finale di questo lavoro.