Embed Size (px)
Citation preview
I
UNIVERSITÀ DEGLI STUDI DI NAPOLI FEDERICO II
Dipartimento di Medicina Veterinaria e Produzioni Animali
Dottorato di ricerca in
Organismi modello nella ricerca biomedica e veterinaria XXV Ciclo
IDENTIFICATION OF A NOVEL GENE EXPRESSED
DURING MOUSE PANCREAS DEVELOPMENT
Candidata: Maria Teresa De Angelis Relatore: Ch.mo Prof. Geppino Falco
2010-2013

I

II

I
Index
Introduction
1. Pancreas: Histology .................................................................................. 1
2. Mouse pancreatic development ................................................................ 2
2.1 Pre-pancreatic endoderm patterning .................................................... 2
2.2 Dorsal pancreas induction .................................................................... 3
2.3 Ventral pancreas induction ................................................................... 4
2.4 The primary transition ........................................................................... 5
2.5 Transcriptional program ........................................................................ 7
2.6 Signalling pathways involved in pancreatic development .................... 13
2.7 The secondary and third transition ....................................................... 14
2.8 Endocrine specification ......................................................................... 15
2.9 Exocrine development .......................................................................... 18
3. Comparison between the human and mouse pancreas development ...... 19
4. Injury-Induced Reprogramming ................................................................. 20
5. In vitro differentiation of embryonic stem cells .......................................... 21
5.1 Endoderm induction ............................................................................. 22
5.2 Pancreatic specification ....................................................................... 23
Aim of Thesis
Materials and Methods
1. Embryo dissection and embedding .......................................................... 26
2. Immunofluorescence ................................................................................ 26
3. Laser capture microdissection and RNA isolation .................................... 27
4. RNA amplification, labeling and hybridization ........................................... 31
5. RNA extraction from embryos or cell cultures .......................................... 39
6. RT–PCR and quantitative PCR (qPCR) Analyses ................................... 39
7. In situ Hybridization .................................................................................. 42
8. ES cell culture and differentiation ............................................................ 43
II
9. DNA genomic extraction .......................................................................... . 45
10. -galactosidase staining ......................................................................... 45
11. Southern Blot .......................................................................................... 45
Results
1. Capture of dorsal pancreas bud by LCM .................................................. 47
2. Global gene expression profile of dorsal pancreatic bud .......................... 49
3. Characterization of Nepn expression in the early stages of pancreas
development ................................................................................................. 52
4. Differentiation of mESCs towards pancreatic lineage in vitro ................... 54
Discussion
References

Introduction
1
Introduction
1. Pancreas: Histology
The pancreas is a compound gland of the digestive system that consists of several
functionally and morphologically distinct cell populations derived from the endoderm.
The exocrine part represents 95-99% of the total pancreatic mass. It consists of:
- acinar cells, arranged into clusters at the end of the ducts, that produce digestive
enzymes (amylase, lipase, phospholipase) as well as pro-enzymes (elastase,
procarboxypeptidase, trypsinogen, pepsinogen, deoxyribonuclease, ribonuclease),
which are stored in zymogen granules located in their apical pole;
- dutal cells, which secrete mucus, chloride and bicarbonate, and compose the
complex tubular system that drains acinar secretions to the to the duodenum, for the
intestinal digestion of nutrients.
The endocrine compartment is organized in islets of Langerhans scattered within the
exocrine tissue, representing 1-5% of the pancreatic mass. Adult islets are composed
of different cell types characterized by the production of specific hormones: the
glucagon-secreting α-cell, insulin-secreting β-cell, somatostatin-releasing δ-cell,
ghrelin-producing ε -cell, and finally the pancreatic polypeptide-secreting PP-cells.
Insulin and glucagon control blood glucose levels, whereas PP and ghrelin are
orexigenic hormones and somatostatin regulates the secretion of insulin, glucagon
and PP (Fig.1).
The endocrine cells aggregate to form the islets of Langerhans, which are
intermingled with blood vessels, neurons, and a mesodermally-derived stromal
component. The intimate interaction between endocrine and vascular cells regulates
hormone release, establishing a fine-tuned glucose homeostasis in the body [1].

Introduction
2
Fig.1 A pancreatic islet embedded in exocrine tissue.
2. Mouse pancreatic development
2.1 Pre-pancreatic endoderm patterning
During embryonic development, from the inner cell mass (ICM) of the blastocyst will
develop the epiblast which undergoes gastrulation and forms the three principal germ
layers: the ectoderm, which forms the skin and central nervous system; the
mesoderm which forms the blood, heart and bones and the endoderm which forms
the respiratory and digestive system [2]. The first sign of gastrulation is the formation
of the primitive streak (PS) at day E5.5. It is characterized as a furrow in which
epiblast cells will go on to form the mesoderm and endoderm through an epithelial-to-
mesenchymal transition (EMT) [3]. Nodal, a member of the transforming growth
factor-beta (TGF) family, promotes mesoderm and endoderm formation [4,5]. The
Wnt signalling pathway is involved in the mesoderm versus endoderm cell fate
choice; indeed, embryos lacking -catenin, a key effector of the canonical Wnt
pathway, have ectopic mesoderm cells in the endoderm germ layer [6].
In mouse, the transcription factors involved in endoderm formation, that act
downstream of the Nodal and Wnt signals are: Mixl1 [7], Foxa2 [8], Goosecoid (Gsc)
[9], Gata4 [10] and Sox17 [11].
In the mouse embryo at E7.5, the structure of the endoderm, consisting of 500-1000
cells, surrounds the mesoderm and ectoderm. At E8.5 the primordial epithelium of
the primitive gut tube originates from the definitive endoderm, that is divided in three

Introduction
3
parts along the anterior-posterior axis (A-P): the foregut, the midgut and the hindgut.
The evaginations arising from these different domains of the foregut will give rise to
organs, such as the thyroid, lung, liver, and pancreas [12,13]. Fibroblast growth
factor (FGF) [14], Wnt [15], Hedgehog (Hh) [16] and Retinoic acid (RA) [17,18,19]
signalling pathways have been implicated in formation and patterning of the foregut.
There are reports that FGF4 suppresses the expression of Nkx2.1 and Hhex, which
are required for foregut endoderm formation, and it promotes the expression of Pdx1
and Cdx1/Cdx2.
In Xenopus embryos, Wnt/β-catenin activity must be suppressed in anterior
endoderm to maintain foregut identity and to allow liver and pancreas development,
whereas high Wnt/ β-catenin activity in the posterior endoderm promotes intestinal
fate.
RA promotes pancreas organ allocation; indeed, blocking RA signaling inhibits
pancreas specification. In Raldh2 null mice, which lack a critical RA-synthesizing
enzyme, the dorsal pancreas fails to bud and the early glucagon-positive cells do not
develop. RA is also required to maintain the pancreatic progenitors and to promote
the commitment of these progenitors to Ngn3-positive endocrine progenitors [20,21].
2.2 Dorsal pancreas induction
At E8.0, inductive signals (RA) from the paraxial mesoderm, together with
suppression of Shh in the dorsal endoderm by FGF2 and Activin 2 from the
notochord, are required to establish the dorsal pre-pancreatic domain. At first the
inhibition of Shh is required for early pancreas specification, after its activity is
needed to expand the pancreatic epithelium and to regulate the expression of insulin
in the mature -cells [22,23].
At 8.5, VEGF produced in the early dorsal aorta and vitelline veins induces the initial
stages of pancreas development; it promotes the expression of Pdx1 and Ptf1a in
pre-pancreatic endoderm. In the absence of VEGF-A in the Pdx1-positive pancreatic
epithelium, the endocrine cells signal back to the adjacent endothelium to induce a
dense network of fenestrated capillaries within the islet [24,25].

Introduction
4
By E9.5, condensation of the dorsal mesenchyme results in the evagination of the
dorsal pancreatic rudiment. FGF10 stimulates bud outgrowth and proliferation of the
pancreatic progenitor pool, inducing expression of the Ptf1a [26].
2.3 Ventral pancreas induction
The ventral endoderm forms ventral pancreatic endoderm receiving signals from
cardiac mesoderm and the septum transversum mesenchyme (Fig. 2). Liver and
ventral pancreas may diverge from an early common population of bipotential
progenitors in the ventral foregut endoderm [27]. Probably, the ‘‘default fate’’ of
ventral foregut endoderm is pancreas. In this way can be considered two aspects,
the first is that the endodermal interaction with cardiac mesoderm is required for
hepatic differentiation, and the second that the septum transversum mesenchyme
produces BMPs that are necessary to induce a liver gene expression program and to
allow some progenitor cells within a specific region of the ventral foregut endoderm to
escape the pancreatic fate instruction.
A tissue-migration morphogenetic process allows part of the ventral endoderm to
avoid hepatic-inducing signals; in fact, locking the relative movement of the ventral
lateral foregut endoderm (the prospective ventral pancreas) prevents ventral
pancreas specification from occurring.
Recent studies demostrate a strong link between the extrahepatobiliary (EHB)
system (including gall bladder primordium, extrahepatic bile duct, cystic duct) and the
ventral pancreas, more than with the liver. Sox17, a major regulator of endoderm
formation, is required to establish and maintain distinct boundaries between the liver,
EHB, and ventral pancreas domain.
Loss of Sox17 function after gastrulation leads to biliary agenesis and ectopic
pancreas formation, whereas Sox17 misexpression suppresses pancreas
development by promoting ectopic biliary-like tissue within the posterior foregut
region that expresses Pdx1. Sox17 upregulates Hes1 levels in Pdx1 expressing
endoderm; Hes1 then establishes a negative feedback loop to restrict Sox17+ biliary
Introduction
5
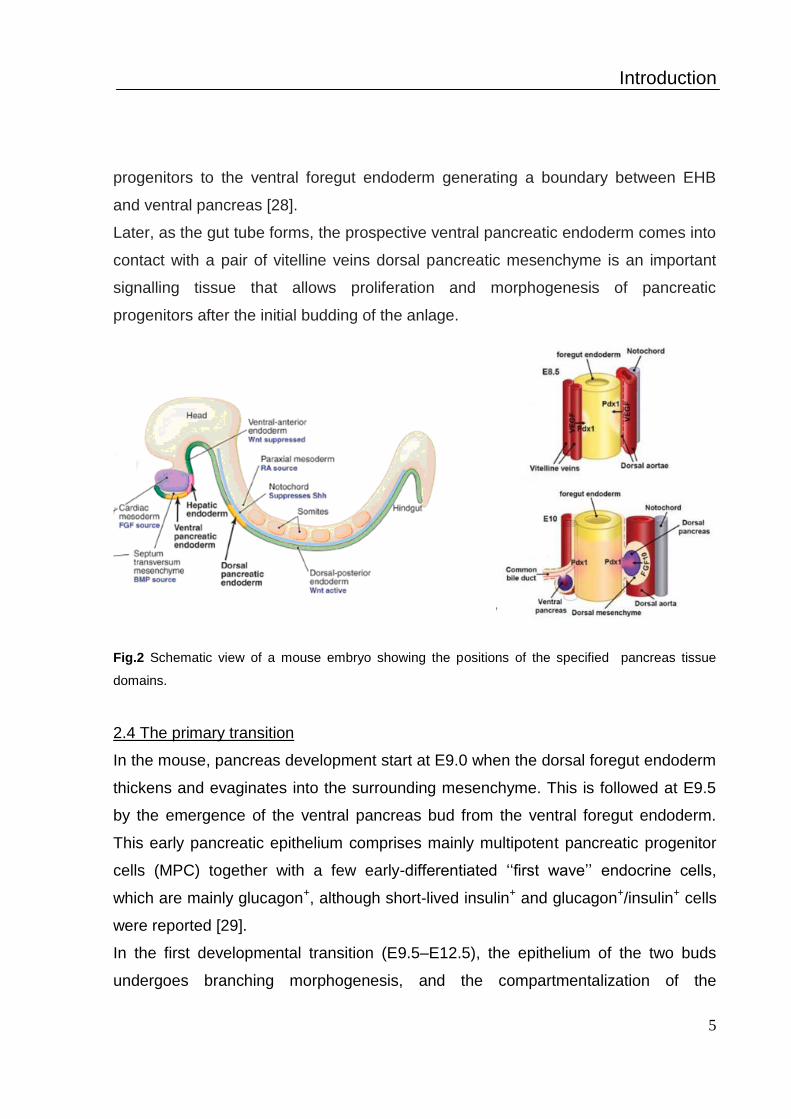
progenitors to the ventral foregut endoderm generating a boundary between EHB
and ventral pancreas [28].
Later, as the gut tube forms, the prospective ventral pancreatic endoderm comes into
contact with a pair of vitelline veins dorsal pancreatic mesenchyme is an important
signalling tissue that allows proliferation and morphogenesis of pancreatic
progenitors after the initial budding of the anlage.
Fig.2 Schematic view of a mouse embryo showing the positions of the specified pancreas tissue
domains.
2.4 The primary transition
In the mouse, pancreas development start at E9.0 when the dorsal foregut endoderm
thickens and evaginates into the surrounding mesenchyme. This is followed at E9.5
by the emergence of the ventral pancreas bud from the ventral foregut endoderm.
This early pancreatic epithelium comprises mainly multipotent pancreatic progenitor
cells (MPC) together with a few early-differentiated ‘‘first wave’’ endocrine cells,
which are mainly glucagon+, although short-lived insulin+ and glucagon+/insulin+ cells
were reported [29].
In the first developmental transition (E9.5–E12.5), the epithelium of the two buds
undergoes branching morphogenesis, and the compartmentalization of the

Introduction
6
pancreatic epithelium commences, defining the epithelium into distinct ‘‘tip’’ and
‘‘trunk’’ domains. While the tip domains contain multipotential pancreatic cells (MPC),
which are then believed to change into acinar-fated progenitors, the trunk domain
consists of an endocrine-duct bipotential progenitor pool [30]. The
comprtmentalization starting from a simple bud, the epithelium moves through a
transient stratification. Tube formation starts at E10.75 when apical polarization of
single cells occurs stochastically in the bud. These polarized epithelial cells undergo
dramatic cell shape changes and rearrangements, forming “epithelial rosettes” that
rather rapidly produce proper lumens at their common apical surface. The
microlumens expand and eventually fuse, converting the epithelium through a multi-
lumen intermediate into a complex epithelial network or plexus. Tubulogenesis sets
up the initial tip (future acinar location) versus trunk compartmentalization. The
progenitors that are in close proximity to the mesenchyme and receive a longer
integrated exposure to extracellular matrix (ECM) acquire acinar fate, whereas
progenitors receiving less mesenchyme exposure have a higher bias towards
forming endocrine cells. At E12.0-E15.0, the tubular epithelial network expands and
undergoes remodeling, generating the mature acinar and ductal cells. About the
branching morphogenesis, it was proposed that ∼85% of branching in these early
stages was via lateral branching mechanism, and only about 15% by terminal
bifurcation [31]. The lateral branching seemed frequent near the extending tip
epithelium, which could include cells that have substantial “retained MPC-like”, in
fact, these cells retain expression of the “primary multipotency markers” Pdx1 and
Ptf1a. The trunk epithelial domain, contains a pool of cells with duct/endocrine
bipotency, scattered cells within the trunk epithelium upregulate Ngn3 expression
and commit to becoming endocrine precursors, that subsequently delaminate from
the epithelial cord during the secondary transition. The remaining non-delaminating
HNF1β+ Sox9+ Nkx6.1+ trunk cells are fated to become duct cells. The resolution of
Nkx6.1 and Ptf1a expression into exclusive trunk and tip compartments, respectively,
appears to correlate with the progressive restriction of trunk and tip cells towards the
future duct/endocrine (trunk), or acinar (tip) lineages.
Introduction
7
The progenitor cells allocated to the pancreas primordium in the first wave of
development determines the final size of the mature pancreas [32], this type of organ
size control is distinct from the ‘‘regulative programs’’ seen in other organs (e.g., liver,
blood, central nervous system), in which reduction of progenitor numbers can be
compensated by extensive proliferation, reduced apoptosis, with substantial effects
from extrinsic factors [33].
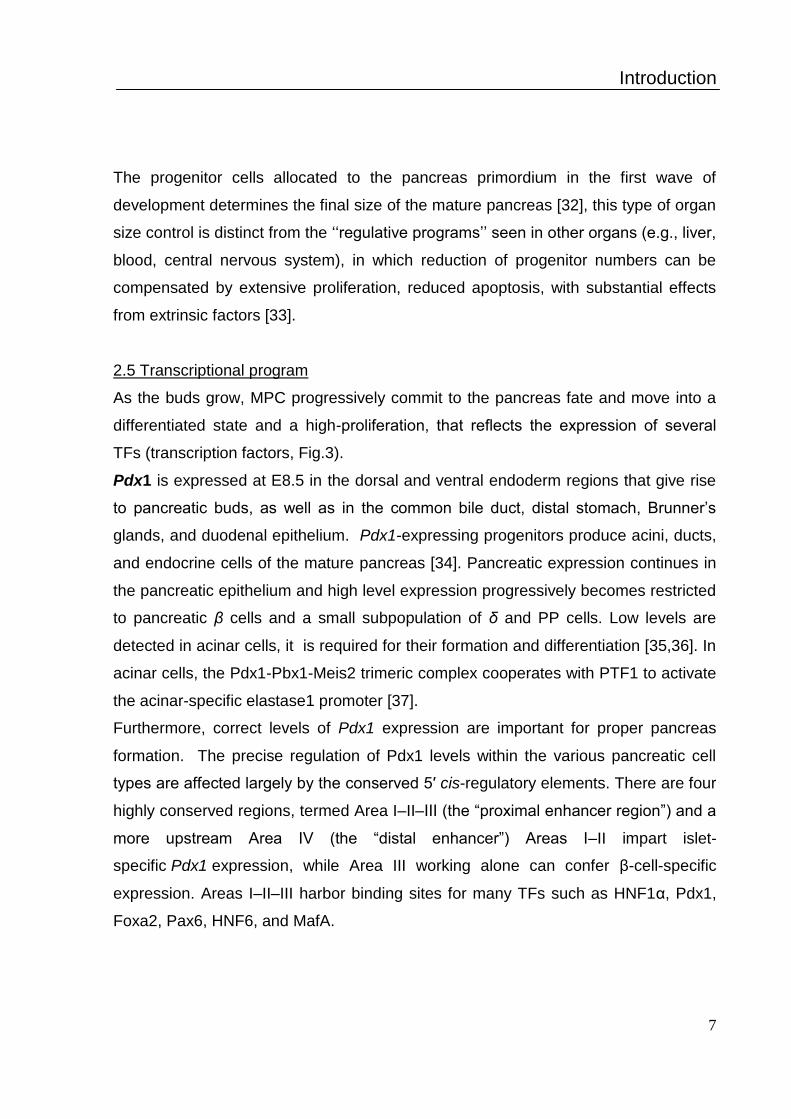
2.5 Transcriptional program
As the buds grow, MPC progressively commit to the pancreas fate and move into a
differentiated state and a high-proliferation, that reflects the expression of several
TFs (transcription factors, Fig.3).
Pdx1 is expressed at E8.5 in the dorsal and ventral endoderm regions that give rise
to pancreatic buds, as well as in the common bile duct, distal stomach, Brunner’s
glands, and duodenal epithelium. Pdx1-expressing progenitors produce acini, ducts,
and endocrine cells of the mature pancreas [34]. Pancreatic expression continues in
the pancreatic epithelium and high level expression progressively becomes restricted
to pancreatic β cells and a small subpopulation of δ and PP cells. Low levels are
detected in acinar cells, it is required for their formation and differentiation [35,36]. In
acinar cells, the Pdx1-Pbx1-Meis2 trimeric complex cooperates with PTF1 to activate
the acinar-specific elastase1 promoter [37].
Furthermore, correct levels of Pdx1 expression are important for proper pancreas
formation. The precise regulation of Pdx1 levels within the various pancreatic cell
types are affected largely by the conserved 5′ cis-regulatory elements. There are four
highly conserved regions, termed Area I–II–III (the “proximal enhancer region”) and a
more upstream Area IV (the “distal enhancer”) Areas I–II impart islet-
specific Pdx1 expression, while Area III working alone can confer β-cell-specific
expression. Areas I–II–III harbor binding sites for many TFs such as HNF1α, Pdx1,
Foxa2, Pax6, HNF6, and MafA.

Introduction
8
Area IV and is required for expansion and differentiation of pancreatic progenitors
while Area III binding is linked more to the differentiation and function of mature β-
cells [38].
Dorsal pancreas development arrests after initial budding in Pdx1 null mutants,
resulting in a highly abrogated, developmentally retarded tissue, and a “ventral
pancreas rudiment” cannot be found [39].
Hlxb9 is expressed in the dorsal bud prior to the dorsal induction of Pdx1. Between
E10.5 and E12.5, its expression declines in both buds, but later is expressed in
mature β cells. Hb9 is an essential intrinsic signal for dorsal pancreas evagination as
well as for initiation of the pancreatic program.
In mice lacking Hlxb9, the dorsal pancreas is entirely absent, Pdx1 is not expressed,
and the epithelium does not bud. The ventral pancreas, remarkably, develops
normally until later stages. This may reflect an intrinsic difference between the dorsal
and ventral buds, but because Hlxb9 is also expressed in the notochord, which is
known to promote dorsal pancreas development [40], its role in pancreas
development may be indirect.
Ptf1a. The trimeric Pancreas Transcription Factor 1 complex (PTF1) comprises a
tissue-specific bHLH protein, Ptf1a, the distinct mammalian Suppressor of Hairless
(RBP-J) protein, or the RBP-JL paralog. Ptf1a is expressed as early as E9.5 in most
cells of the nascent pancreatic buds, and appears to play an important role in early
specification of pancreatic progenitor cells and later, in regulating exocrine
differentiation. Mice lacking the Ptf1a/p48 bHLH transcription factor exhibit normal
dorsal bud formation, whereas the ventral pancreas not only fails to bud but becomes
integrated into the surrounding duodenum. In addition to the complete lack of acinar
cells, endocrine cell numbers are greatly reduced [41].
During early stages of organogenesis, the RBP-J form is required for pancreas
specification and progenitor maintenance. PTF1-RBP-J complexes activate the
expression of RBP-JL, and increased RBP-JL then begins to displace RBP-J,
switching PTF1-RBP-J to PTF1-RBP-JL and initiating the acinar differentiation
program [42]. It is interesting to notice that these events are concomitant with the lost

Introduction
9
of multipotency of the Cpa1+ tip cells suggesting that the switch of Rbpj partner into
the PTF1 complex may play a role in this specification into a single lineage.
Sox9 is a member of the SRY/HMG box (Sox) family, is involved in the proliferation,
survival, and maintenance of pancreatic progenitors. Sox9 expression is first
detected at ∼E10.5 in the early pancreatic MPC, and lineage tracing revealed that the
“first-wave” Sox9+ progenitors, like Pdx1+ and Ptf1a+ progenitors, produce cells of all
three pancreatic lineages. In the adult pancreas, Sox9 expression is maintained in a
duct epithelium subpopulation. The pancreas-specific Sox9 inactivation caused
hypoplasia of both buds, through the decreased proliferation and increased cell death
of progenitors, so it is essential in MPC proliferation and survival. Sox9 regulates the
expression of several TF genes in the primary pancreatic MPC such
as Onecut1/Hnf6, Tcf2/Hnf1β, Foxa2 and Ngn3 expression suggesting a role in
initiation of endocrine differentiation [43].
Hnf1β is expressed broadly through the foregut-midgut region at E8.0, and in the
liver and both pancreas anlagens at E9.5. Hnf1β-expressing pool is multipotent and
can seed all three compartments: acinar, duct, and endocrine. During the secondary
transition, Hnf1β expression becomes confined to the duct/endocrine bipotent
progenitor domain of the central epithelial cord. In the absence of Hnf1β, there is the
transient formation of a dorsal pancreas bud that expresses Pdx1 and Mnx1, but
these progenitors fail to expand; the ventral bud is absent [44]. In addition
to Ptf1a, Hnf1β seems to form a transcription regulatory cascade with Hnf6 in
controlling pancreatic progenitor generation and endocrine progenitor induction [45].
Gata4 and Gata6 are initially expressed broadly over the early foregut endoderm,
and later in the pancreatic anlagen. During the secondary
transition, Gata4 and Gata6 expression becomes uncoupled and restricted to distinct
pancreatic domains. Gata4 expression is restricted to acini between E13.5-E18.5. In
the adult pancreas, Gata4 is expressed in a subset of α and β-cells and is no longer
detectable in acinar cells. Gata6 mRNA is detected in the bipotential central epithelial
cord of the secondary transition.

Introduction
10
In Gata4 nulls, the ventral pancreas is not specified while the dorsal pancreas bud
forms essentially normally. Gata6 nulls exhibit a similar phenotype with a few
detectable Pdx1+ ventral foregut cells compared to none in the Gata4 null [46].
Mnx1 is expressed at E8.0 within the notochord and the entire dorsal and ventral
endoderm at the prospective pancreatic level, the expression remaining in both
pancreatic buds and the stomach until E12.5, becoming confined to Pax6+ endocrine
precursors during the secondary transition. In adult pancreas, Mnx1 is expressed in
mature β-cells.
Mnx1 expression in the dorsal pancreatic rudiment precedes Pdx1. Mnx1 null mice
show dorsal bud agenesis and the normal Pdx1 upregulation during early bud
formation does not occur.
Mnx1 expression in the ventral pancreatic rudiment occours after Pdx1. In Mnx1 null
mice, ventral pancreas development proceeds normally, producing all pancreatic cell
types, but with increased δ-cells and reduced β-cell numbers that are are immature
in that they lack Pdx1, Nkx6.1, and Glut2 [47].
Ngn3 is expressed exclusively in endocrine precursor cells, and subsequently down-
regulated during differentiation. Ngn3 promotes endocrine fate in cells descended
from Pdx1 progenitor cells.
Notch signaling has two major functions during the development of the pancreas: a
role in the maintenance of early progenitor cell in an undifferentiated state and a role
in lateral inhibition, allowing selection of endocrine cells between non-endocrine cells.
Regarding the first function, Notch signaling appears to control directly and indirectly
the expression of Ngn3.
In the mechanism of lateral inhibition, Notch signaling inhibits the expression of
Ngn3, leading to maintenance of the population of precursors, because preventing
differentiation. This mechanism is triggered by the expression of Ngn3 in
commissioned cells to differentiate, with the production of an extracellular ligand of
Notch, Delta-like ligand 1 (Dll-1), which activates the NOTCH1 receptor in
surrounding cells by cutting an intracellular domain of the receptor. This domain
Introduction
11
interacts with RBP-J activating the expression of Hes1, which inhibits the promoter
of Ngn3 [48].
Mice deficient for Notch signaling pathway components such as RBP-Jk, Dll1, or
Hes1, display increased numbers of Ngn3-positive cells, premature endocrine
differentiation and a hypoplastic pancreas that is likely the result of premature
depletion of pancreatic precursor cells [49,50,51].
Hes1 encodes a bHLH transcription factor, present in the pancreas from the day
E9.5. It has been observed that the number of pancreatic endocrine cells in Hes1 null
mouse increases. So that Hes1 have a role in suppressing the development of
endocrine cells through a pathway involving Notch. In Hes1 null mouse Ngn3
expression is high both in stomach and in intestine, confirming the conflicting effect of
Hes1 and Ngn3 on endocrine cells development. The reduced expression of Hes1
could, therefore, facilitate the differentiation of pancreatic endocrine cells and this
hypothesis was confirmed by conversion of the developing biliary system in the
pancreatic tissue in Hes1 deficient mice [52].
Hnf6 is expressed in the epithelial cells at the stage E9.5, and subsequently its
expression becomes specific of the ductal and exocrine cells.
Hnf6 mutant mice lack most Ngn3-expressing cells during development and instead
accumulate primitive, undifferentiated epithelium; the block to endocrine
differentiation in Hnf6 mutants is only temporary, and islets begin to bud out of the
abnormal epithelium shortly after birth.
Nkx2.2 is expressed early in developing pancreatic buds and is later restricted to α-,
β-, and PP cells of islets. Nkx2.2 mutants completely lack insulin expression; in place
of normal β-cells, islets contain a large population of cells apparently arrested of β-
cell fate.
Nkx6.1 is expressed primarily in β-cells of adult islets. Nkx6.1 mutants have a
phenotype with a small number of insulin-producing cells during early pancreatic
development, the normally exponential increase in β-cell generation that initiates
during the secondary transition is completely absent, and no immature β-like cells are
formed.

Introduction
12
Beta2/NeuroD1 is a key regulator of insulin gene transcription in pancreatic β-cells.
Beta2/NeuroD expression occurs in a subset of pancreatic epithelial cells as early as
E9.5, co-localizing with glucagon expression. On E14.5, expression appears within
and in proximity to ductal epithelium, and by E17.5, expression is restricted to islets.
Mice homozygous for a targeted disruption of the Beta2/NeuroD gene survive to
birth, but die within 3–5 days post partum of severe hyperglycemia. The islets of
these mice are dysmorphic and have markedly diminished numbers of endocrine
cells arranged in streaks and irregular.
Pax4 is expressed at E9.5 in both ventral and dorsal buds of the developing
pancreas, and by the time of birth, expression is restricted to β-cells. The Pax4-null
mice survive birth, but die within 3 days of hyperglycemia and dehydration. There is a
virtual absence of β- and δ-cells, but α-cells are increased. Pdx1 expression in Pax4-
null pancreas is absent, a finding consistent with the absence of differentiated β-cells.
Thus, Pax4 functions early in the development of islet cells to promote the
differentiation of β- and δ-cells.
Pax6 is expressed early in the epithelium of the developing pancreas on E9.0 in both
dorsal and ventral pancreatic buds and is expressed in differentiated α-, β-, δ-, and
PP cells. Knockout Pax6 mouse dies within minutes of birth. These animals fail to
form islets. The disorganization of islets is proposed to relate to a possible function of
Pax6 in the regulation of cell adhesion molecules.
Brn4 (Pou3f4) regulates the promoter of the glucagon. Its expression begins in the
pancreas at E10.0, prior to that of Pax6, which is believed to be the first gene that is
expressed specifically in glucagon-positive cells of the pancreas. However, the
defective mice to Brn4 develop normally the endocrine portion, so that the expression
of this gene is considered not necessary to determine the fate of glucagon-positive
cells [53].

Introduction
13
Fig.3 Flow of transcription factors during pancreatic development.
2.6 Signalling pathways involved in pancreatic development
The default fate of embryonic pancreatic epithelium is endocrine, and that this fate is
redirected by mesenchymal signals to allow production of exocrine fates.
During early stages (E9.5), the fibroblast growth factor receptor 2b (Fgfr2b)
expression is detected in the epithelium, and its high affinity ligand Fgf10 is
expressed in the pancreatic mesenchyme. Transgenic mice expressing dominant-
negative Fgfr2b under the inducible metallothionein promoter, or mutants that lack
either Fgf10 or Fgfr2b, display pancreatic hypoplasia [54,55], while, excess FGF10
signaling leads to sustained Notch activation and promotes proliferation at the
progenitor state [56,57].
Mesenchyme-derived BMP4/7, which signals through the epithelial ALK3 receptor, is
also critical for pancreatic epithelium expansion and branching morphogenesis in
mouse and chick. Inhibiting BMP signaling, either by over-expression of Noggin or a
dominant-negative BMP receptor (dnALK3), causes severe pancreas hypoplasia,
reduced epithelial branching, and excessive endocrine differentiation [58].
Isl1 plays a pancreas development-promoting role, both as an extrinsic factor
produced by the dorsal mesenchyme, and intrinsically expressed in pancreatic
progenitors. Targeted disruption of Isl1 renders the mesenchyme unable to condense
Introduction
14
around the dorsal pancreatic bud. In absence of Isl1, no endocrine cells differentiate.
In addition, exocrine cells appear only in the ventral bud.
The activin-follistatin system plays an important role in the intrinsic regulation of
pancreatic branching morphogenesis and for the determination between exocrine
and endocrine balance. Activins are expressed in early gut endoderm, and also in
early pancreatic rudiment and then localize to the developing endocrine pancreas
[59]. Inversely, Follistatin, an activin-binding protein that acts as an antagonist, is
expressed by early pancreatic mesenchyme [60]. Exogenous activin profoundly
alters epithelial branching morphogenesis; it causes severe disruption of normal
lobulation patterns in vitro whereas Follistatin counteracts its effect [61].
2.7 The secondary and third transition
Between E13 and E14, the dorsal and ventral pancreata rotate and fuse into a single
organ (Fig.4). During E14.5 and E15.5, the exocrine pancreas differentiates from the
ductal epithelium; at E15.5, acinar cells arise from the extending tip epithelium and
continue to undergo active proliferation to increase the number of acinar tips by
duplication processes acini are clearly discernible from ducts. Endocrine cells are
present from the very beginning of development (E9.5), but up until E14.0 they are
arrayed as single cells within the ductal epithelium, after which they undergo
extensive proliferation (second developmental transition).
In general, the first endocrine cells to form mature cells are α cells, Gcg-positive
cells, followed by β cells (E13.5), the δ cells (E15.5) and finally PP cells (E17.0).
Once differentiated, endocrine cells leave the epithelium and migrate to the
extracellular matrix, thought an epithelial-to-mesenchymal transition (EMT) where
they recognize and are aggregated to form the islet of Langerhans [62]. This cluster
of endocrine cells and the subsequent formation of the islet is realized (E18.5) just
before the birth (third developmental transition).
In the mouse, predominantly -cells form the islet core, and they are surrounded by
mantle of α, δ, and PP-cells, whereas the very minor ε-cell population is dispersed
throughout the islet. About 80% of the islet cell mass present at birth is generated by
Introduction
15
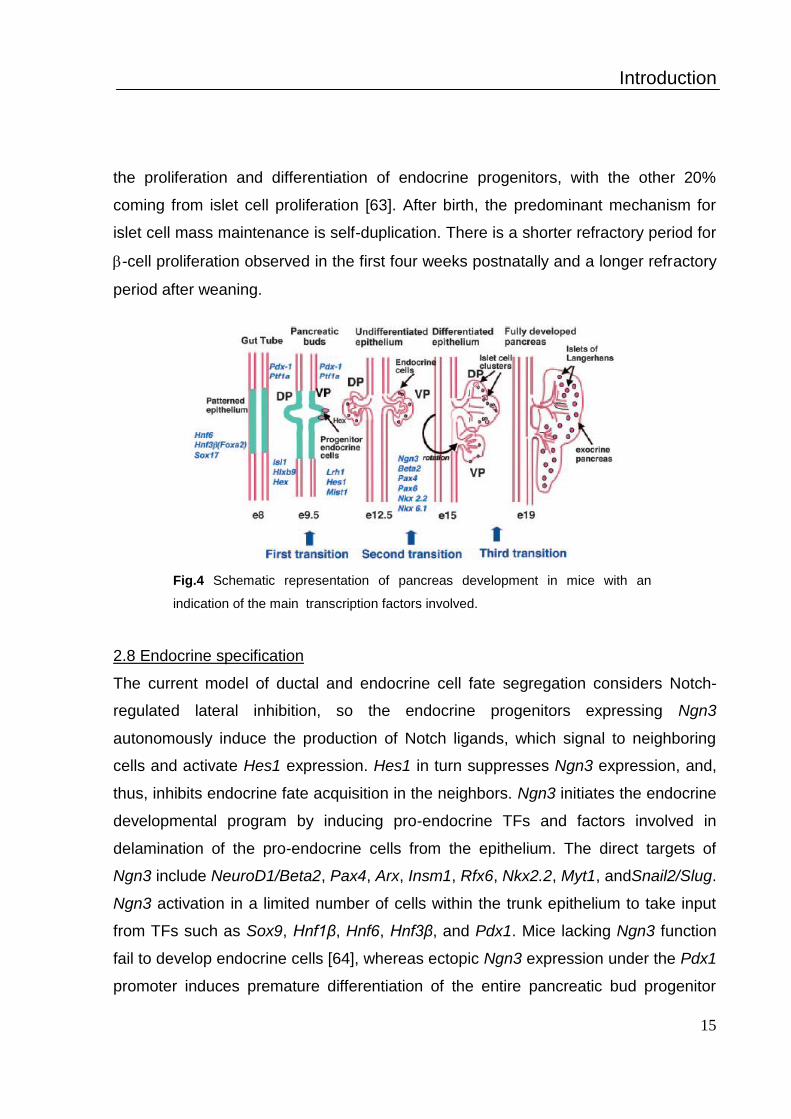
the proliferation and differentiation of endocrine progenitors, with the other 20%
coming from islet cell proliferation [63]. After birth, the predominant mechanism for
islet cell mass maintenance is self-duplication. There is a shorter refractory period for
-cell proliferation observed in the first four weeks postnatally and a longer refractory
period after weaning.
Fig.4 Schematic representation of pancreas development in mice with an
indication of the main transcription factors involved.
2.8 Endocrine specification
The current model of ductal and endocrine cell fate segregation considers Notch-
regulated lateral inhibition, so the endocrine progenitors expressing Ngn3
autonomously induce the production of Notch ligands, which signal to neighboring
cells and activate Hes1 expression. Hes1 in turn suppresses Ngn3 expression, and,
thus, inhibits endocrine fate acquisition in the neighbors. Ngn3 initiates the endocrine
developmental program by inducing pro-endocrine TFs and factors involved in
delamination of the pro-endocrine cells from the epithelium. The direct targets of
Ngn3 include NeuroD1/Beta2, Pax4, Arx, Insm1, Rfx6, Nkx2.2, Myt1, andSnail2/Slug.
Ngn3 activation in a limited number of cells within the trunk epithelium to take input
from TFs such as Sox9, Hnf1β, Hnf6, Hnf3β, and Pdx1. Mice lacking Ngn3 function
fail to develop endocrine cells [64], whereas ectopic Ngn3 expression under the Pdx1
promoter induces premature differentiation of the entire pancreatic bud progenitor

Introduction
16
pool into endocrine cells with predominantly α-cells. Lineage tracing studies showed
that all endocrine cell types seem to be born from Ngn3-expressing endocrine
progenitors. The inducible Ngn3 expression under the control of the Pdx1 promoter in
the Ngn3 null background, to demonstrate that early Ngn3+ progenitors (E8.75)
produce α-cells, whereas endocrine progenitors acquire the competence to make β-
cells and PP cells at ∼E11.5 and E12.5, respectively, with much increased
competence towards the β-cell fate at E14.5. Endocrine progenitors become
competent to produce δ-cells at E14.5.
Three classes of endocrine regulators may be divided, based upon our current
understanding of the phenotype:
- general endocrine differentiation (NeuroD1, Islet1, Insm-1, Rfx6, Nkx6.1).
NeuroD mutant mice have arrested endocrine cell development during the secondary
transition, with reduced numbers of all endocrine cell types. The remaining endocrine
cells fail to form islets [65]. Such deficiencies are also observed in Insulinoma-
associated antigen 1 (Insm1), Regulatory X-box binding 6 (Rfx6), and Islet1 (Isl1)
mutants.
Nkx6 family TF genes (Nkx6.1 and Nkx6.2) could be the only non-Ngn3 direct target
that fall into this class. The Nkx6.1 null has substantially reduced β-cell numbers
while both β and α-cells are reduced in Nkx6.1/Nkx6.2 double null mice,
demonstrating an intriguing overlapping yet distinct requirement for the different Nkx6
TFs. The number of Ngn3 endocrine progenitors and islet precursors are reduced
dramatically in these mutants, suggesting that Nkx6 might act upstream of Ngn3.
These studies also proposed that Nkx6 factors promote β-cell fate specification from
Pdx1 progenitors and that Ngn3 subsequently promotes cell differentiation by
initiating cell cycle exit.
- lineage-allocation (Pdx1, Pax4, Arx, Nkx2.2).
Lineage-specific factors control the flux of endocrine progenitors towards a specific
endocrine type. As a consequence of removing factors such as Nkx2.2, Pax4, Arx,
and Pdx1, endocrine cell numbers are largely unaffected, but fractional islet
allocations are often severely altered. In Pax4 null mice, β and δ-cells are lost

Introduction
17
concomitant with a remarkable increase in α-cell and ghrelin+ ε-cell numbers. The
increased ε-cell number is similar to the Nkx2.2 null pancreas, suggesting possible
genetic interactions between Pax4 and Nkx2.2.
Pax4 and Arx induce, respectively, either an α-to-β or β-to-α conversion upon
misexpression in terminally differentiated mature endocrine cell types. Thus, Pax4
and Arx are required for β and α-cell fate allocation, respectively. Although Pax4 null
mice also lack somatostatin+ δ-cells, a positive selective role for Pax4 in δ-cell
development remains unclear. In addition, Pax4/Arx double null mice show a
massive increase in δ-cells, which suggests that δ-cell terminal differentiation
requires the absence of Pax4 and Arx [66].
Pdx1, apart from its early roles in MPC outgrowth and expansion, is also required for
β-cell proliferation and survival. Deleting Pdx1 function specifically in β-cells leads to
a dramatic reduction in β-cell number concomitant with α/δ-cell overgrowth.
- maturation factors (MafA, MafB, Foxa1, Foxa2, NeuroD1).
Loss of these factors causes little or no defect during endocrine cell lineage
diversification, but the cells begin to show aberrant function postnatally or in
adulthood. During development, β-cells move from a MafB+ immature state to
MafA+/MafB+, and finally, to a MafA+ mature state. Thus, MafB is essentially absent
from mature adult β-cells and its expression is restricted to α-cells in the adult
pancreas. MafA mutants have no effect on endocrine cell development but the mice
become glucose-intolerant postnatally [67]. MafB−/− mice have reduced α and β-cell
numbers, as well as some form of apparently delayed β-cell development [68].
Conditional inactivation of Foxa2 (Foxa2-cKO) in early pancreatic epithelial
precursors does not affect MPC development but leads to late-arising defects in α-
cell terminal differentiation. Initial specification of α-cells in the Foxa2-cKO proceeds
normally but differentiation is blocked with 90% reduction of glucagon expression and
complete lack of prohormone convertase 2 (PC2) production in these mutant mice.
The resultant neonatal Foxa2 mutants die shortly after birth from severe
hyperinsulinemic hypoglycemia.
Introduction
18
Deleting N-cadherin in the Pdx1 expression territory results in reduced insulin
granules and impaired insulin secretion in β-cells. This suggests that cell adhesion or
perhaps coordinated β-cell communication amongst the population is critical for
proper regulation of insulin granule turnover.
The NeuroD1 null islets responded poorly to glucose and displayed a glucose
metabolism profile similar to immature β-cells. Therefore, NeuroD1 is required for the
complete transition to β-cell maturity, and maintenance of full glucose-
responsiveness [69].
Some of the TF mutants show more than one phenotype, suggesting multiple
functions during endocrine development.
2.9 Exocrine development
The mature ductal network has four subcompartments: a main duct as the common
conduit to the duodenum; the interlobular ducts connected to the main duct;
intralobular ducts draining exocrine enzymes into the interlobular ducts; intercalated
ducts, also called terminal ducts or centroacinar cells (CAC), which connect the acini
with intralobular ducts. Extensively abnormal duct development was reported in both
global and pancreas-specific Hnf6 gene inactivation [70], although these duct defects
are likely relatively directly connected to an earlier problem in the development and
maturation of the secondary transition trunk epithelium, and not in the differentiation
program of duct cells. Indeed, the cells in the “duct epithelial” tissue of the secondary
transition trunk epithelium transiently represents a bipotent pool of endocrine and
duct-competent progenitors. Deleting Pdx1 function at progressively later stages
using an on-off doxycycline-regulated transgenic/knock-in system allows formation of
interlobular ducts first, followed by intralobular ducts. It is possible that the large
cystic ducts formed in the Pdx1 and Ptf1 null mutants adopted a common bile duct or
intestinal character, and thereby lost the competence and microenvironment to
produce the proper numbers of second-wave endocrine cells, but this hypothesis
remains to be tested. Acinar differentiation starts at the distal tip epithelium at around
E13.5. At this stage, the tip MPC undergo a switch to the pro-acinar fate by down-

Introduction
19
regulating sets of progenitor-specific TFs that maintain MPC status, while
upregulating expression of Ptf1a and various digestive enzymes [71]. In comparison
to endocrine development, fewer transcription factors have been shown to be
involved in acinar development. Ptf1a is the key player in acinar formation;
PTF1RBP-J switching to PTF1RBP-JL initiates the pro-acinar differentiation program
during the secondary transitionits. The loss of Ptf1a causes acinar agenesis. The
PTF1RBP-JL complex can bind promoters of all the genes encoding secretory
zymogens, including Amylase, Elastases 1 and 2, CpaI, chymotrypsin B, trypsin.
Mist1, a bHLH factor, is required to establish proper apical-basal polarity and full
acinar differentiation. Initiation of acinar development occurs in Mist1-deficient mice,
suggesting action downstream of Ptf1a. However, acini in Mist1−/− mice do not
acquire the typical rosette-like morphology, possibly as a consequence of loss of
functional gap junctions that was attributed to reduced connexin-32 levels. To date,
canonical Wnt signaling is the only reported extrinsic cue with direct implication on
acinar development. Acinar differentiation fails early on in the absence of β-catenin
[72].
3. Comparison between the human and mouse pancreas
development
Human pancreas formation largely mimics the process in the mouse. Dorsal and
ventral pancreas budding is first evident at 26–35 dpc (day post coitum), and fusion
of the anlagen occurs at 6 weeks of gestation (G6w, gestation 6 weeks). The dorsal
bud produces most of the head, body, and tail of the mature pancreas, whereas the
ventral bud contributes to the inferior part of the head of the organ [73].
The spatio-temporal patterns of key TFs suggest that similar transcriptional
regulatory mechanisms operate in both human and mice. Pdx1 is found in pancreatic
progenitors broadly through the epithelium from G7w, and later in insulin-producing
cells. Ngn3+ cells are found scattered in the epithelium at G9w, concomitant with the
emergence of β-cells first at G8w, which are followed by α-cells and δ-cells at G9w. A
Introduction
20
rare population (<5%) of insulin+/glucagon+ cells was also reported in the early
human fetal pancreas.
Islet-like clusters appear from approximately G11w in human pancreas, the
aggregated insulin and glucagon-expressing cells in the human fetal islets (around
G14–16w) seem to be arranged similarly to the mouse adult islet, with a β-cell core
and peripheral mantle of α and δ-cells. However, at G19w, it is proposed that there is
a transient separation of the peripheral α-cells and δ-cells, away from the β-cell core,
to form homogeneously mono-hormone-producing clusters. Presumably, the mono-
hormone islets reintegrate amongst each other after G22w, and there is significant
intermixing to generate the adult islet architecture [74].
4. Injury-Induced Reprogramming
Four main hypotheses were proposed for the origin of β-cells during the response to
injury, including:
- replication of pre-existing β-cells. Under normal physiological conditions, β-cell
turnover is slow and decreases progressively with age. Upon injury, it appears that at
least some β-cells can re-enter the cell cycle. Under partial pancreatectomy
conditions, have demonstrated that duplication of pre-existing β-cells represents a
predominant mechanism of generating new β-cells in normal pancreas and under
injury response [75].
- neogenesis from duct epithelium. The adult pancreatic ductal cells could give rise to
insulin-producing cells upon injury, as a neogenetic birth process. Pancreatic duct
ligation (PDL) is an injury model that generates tissue damage and cellular
responses similar to those in acute pancreatitis. Ngn3+ cells were induced in the duct
epithelium after PDL, and thus identified a potential source of new endocrine cells in
vivo. These Ngn3+ duct cells, upon isolation, could produce all endocrine cell types
when cultured in Ngn3 null pancreatic bud explants in vitro [76].
- acini-to-endocrine or acini-to-duct-to-endocrine transdifferentiation. Several in vitro
acinar cell culture studies demonstrated a potential acinar to endocrine/duct
conversion when treated with EGF, nicotinamide, or TGF-α [77]. Upon caerulein
Introduction
21
treatment in vivo, acinar cells transiently dedifferentiate to a progenitor-like state,
based on the observation of Pdx1, Foxa2, Sox9, and Hes1 positivity [78]. In this
case, transient dedifferentiation of acinar cells is followed by acinar regeneration with
no contribution of acinar lineage to ductal and endocrine lineages.
- endocrine cell interconversion, for example, α-to-β cells. With the expression of the
diphtheria toxin (DT) receptor and the administration of the DT to achieve ∼99% β-
cell destruction, the α-cells move through a bihormonal glucagon+/insulin+ state on
their way to generate authentic insulin+ β-cells [79].
5. In vitro differentiation of embryonic stem cells
The most important characteristics of Embryonic stem cells (ESCs) include the
capacity to self-renew and the potential to differentiate into all embryonic cell types, a
potential termed pluripotency, under in vivo and in vitro conditions. High serum
composition medium and the presence of the Leukemia Inhibitory Factor (LIF) are
the most common method to maintain the undifferentiated state and the self renewal
ability of the murine ESCs (mESCs)in culture.
However, directed differentiation of ESCs toward specific cell lineages has proven to
be a challenging task. This is in part because directed induction of a desired cell type
has to be balanced with the inhibition of the formation of unwanted cell fates. These
protocols have been based on the findings obtained from decades of developmental
biology research that has outlined a cascade of signaling molecules and transcription
factors that guide undifferentiated progenitor cells toward fully mature, functional
cells.
During in vitro differentiation, both murine and human ESCs recapitulate early stages
of embryonic development [80].
5.1 Endoderm induction
The first crucial step in the differentiation of ESCs toward the pancreatic lineage is
the specification of DE.

Introduction
22
In vivo, BMP4, Wnt and Nodal signallings were shown to be involved in both PS and
mesendoderm formation. In ESC cultures, BMP4 and Wnt signalling induced the
formation of a PS-like population. Then, incubation with Activin A a member of the
TGFβ superfamily - induced a PS-like population and, depending on the strength of
the signal, the subsequent formation of endoderm or mesoderm, as it occurs in vivo
through Nodal signalling.
Nevertheless, successful formation of DE by Activin A treatment is significantly
affected by different parameters, such as contaminating constituents in culture media
during Activin A application, Activin A concentration, time and duration of treatment,
and differentiation models used. Serum at high level negatively influences endoderm
induction by Activin A. Insulin/insulin-like growth factor (IGF) contained in FCS or
KSR, respectively, were inhibiting the Activin A-dependent DE induction through
activation of the phosphatidylinositol 3-kinase (PI3K) pathway [81]. It was established
that concentrations higher than 30 ng/ml and up to 100 ng/ml are sufficient to induce
DE in mESCs.
In the differentiation studies the time and duration of Activin A application vary
substantially and depend on the culture system used.
Wnt3a was supplemented within the first days of Activin A treatment in order to
increase the efficiency of mesendoderm specification and the synchrony of DE
formation [82].
The formation of DE can be confirmed by testing for the up-regulation of endodermal
markers, including Sox17, Foxa2, Gata4.
5.2 Pancreatic specification
The next desired step after the formation of primitive gut endoderm is the induction of
pancreatic epithelium. Suppression of the activity of Shh, a member of the Hedgehog
signaling pathway, is required for the initial specification of pancreatic buds in vivo.
Hedgehog inhibition can be mimicked in cell culture via treatment with Cyclopamine
(CYC), a cholesterol analog known to block the function of Smoothened, an essential
element of the Hedgehog signaling cascade. Addition of CYC to the differentiation

Introduction
23
media at this stage promotes the formation of pancreatic endoderm marked by the
expression of Pdx1, the earliest marker of pancreatic epithelium, among a collection
of other transcription factors important for pancreas organogenesis. All trans retinoic
acid (RA) is added to promote the commitment of the Pdx1-positive pancreas
progenitors toward the endocrine lineage over pancreatic exocrine cells. Later on,
FGF signalling is implicated in the proliferation of the pancreatic progenitors at the
expenses of differentiation [83].
Accordingly, d’Amour et al. applied successfully in ESCs a combination of CYC with
FGF10 and RA to direct DE induced by Activin A into the pancreatic lineages,
showing once again that in vivo data can be reproduced in vitro.
The combination of RA-CYC-FGF10 has been extensively applied in pancreatic
differentiation protocols using variable concentrations of these molecules. For
instance, FGF10 is usually used at 10 to 50 ng/ml, CYC at 0.25 to 2.5 µM and RA,
between 0.1 and 2 µM. In addition, the timing for the pancreatic specification step
varies between 2, 3, 4 or 6 days.

Aim of Thesis
24
Aim of Thesis
Cell therapy offers good prospects for the treatment of pancreatic diseases, for this
reason more attention has been given to the pancreatic progenitor cells. Several
studies show the improvement of differentiation of embryonic stem cells towards the
definitive endoderm and pancreatic progenitors, but the identification of new
molecular markers could further facilitate differentiation.
The aim of this study is to find new molecular markers involved in pancreatic
specification. Therefore, our efforts will be directed towards in vitro and in vivo
assessment of signature genes that would target the specification formation of
pancreatic progenitor cells .
Our approach to identify in vivo pancreas progenitor cell markers will be based on
the analysis of global gene expression profile of dorsal pancreatic buds isolated from
E10.5 mouse embryos.
There is a significant gap in our knowledge on the endodermal players that act in the
time window between the early stages of endoderm formation and the regionalized
expression of the posterior-foregut/pancreas marker gene Pdx1. Development of
more precise lineage-tracing tools allow a deeper focus on the functional delineation
between stages and mechanisms of specification, commitment, lineage allocation,
and differentiation.
In particular, conditional gene knockout strategy will be used to characterize spatio-
temporal function of the putative markers during pancreatic specification.
The study will be followed by in vitro characterization of a candidate during
differentiation of embryonic stem cells into the pancreatic lineage. We propose to
develop a protocol based on the sequential activation of signaling pathways that
recapitulate pancreatic development in vitro, through the definitive endoderm
formation, the pancreatic specification.
We aim to generate genetically modified ES cell line expressing the beta-
galactosidase under the promoter of the gene candidate to enable the stain and the

Aim of Thesis
25
collection of the cell population that expresses the novel putative marker of
pancreatic cell specification.
In this way, we would like to characterize both the global molecular signature of those
cells, and eventually evaluate their ability to repopulate a diseased and/or damaged
pancreas after current transplantation procedures.

Materials and Methods
26
Materials and Methods
1. Embryo dissection and embedding
Embryos were collected at E10.5 from C57/Bl6 mice; midday on the day of vaginal
plug appearance was considered E0.5. All animals employed for the experiments
were used in accordance with regulations and guidelines of Italy and the European
Union and were approved by the local ethical committee. After dissection in cold
phosphate-buffered saline (PBS), embryos were treated with 30% sucrose overnight
at 4°C. They were rinsed in PBS, placed in sterile cryomolds biopsy and embedded
in OCT (Sakura).
2. Immunofluorescence
8 μm thick frozen sections were collected on polylysine glass slides (Menzel-Gläser)
and fixed with 4% paraformaldehyde (PFA) for 15 minutes. After, the sections were
permeabilizated in 0.1% Triton X-100 in PBS (PBT) twice for 10 minutes and then
fixed with 4% PFA for 5 minutes. The sections were pre-incubated in Protein block
serum-free (DakoCytomation) at room temperature for 15 minutes. This product
inhibits non-specific staining during the immunofluorescence detection of antigens. It
may be especially useful when staining connective tissue, epithelial tissue,
adipocytes, or other types of tissues susceptible to high background. The sections
were incubated with primary antibodies monoclonal Rat anti-E-Cadherin 1:2500
(ECCD-2, Calbiochem), Rabbit Polyclonal anti-Pdx1 1:1000 (abcam) at room
temperature for 2 hours; followed by the incubation with secondary antibodies
Fluorescein-5-isothiocyanate (FITC) conjugated AffiniPure Donkey Anti-Rat IgG
1:200 (Jackson ImmunoResearch), Texas red dye-conjugated AffiniPure Goat Anti-
Rabbit IgG 1:200 (Jackson ImmunoResearch) at room temperature for 30 minutes.
Then the sections were treated with 4',6-Diamidino-2-Phenylindole, DAPI (Sigma
Aldrich), diluted 1:10000 in PBS at room temperature for 5 minutes. After each
incubation the sections were washed in PBS.

Materials and Methods
27
Slides were mounted with Fluorescent mounting medium (Dako Cytomation).
The images were Acquired with Zeiss Axioplan2 microscope at different
magnifications and processed by AxioVision Rel.4.8 program.
Rat anti E-cadherin has a periplasmatic localization, it is expressed in the
endodermic tissues such us pancreas, thyroid, lung, intestine.
Rabbit Polyclonal anti-Pdx1 is a nuclear protein, it has a pancreas specific
expression.
FITC is fluorescein isothiocyanate, detected as green signal (Absorption max: 492
nm; Emission max=520 nm).
Texas Red, derives from sulforodhamine and is detected as a red signal (Absorption
max=596 nm; Emission max= 620 nm).
DAPI (4',6-diamidino-2-phenylindole) label DNA with blue emission.
3. Laser capture microdissection and RNA isolation
The embryos were equilibrated in the cryostat (-25°C) for 5 minutes and mounted on
the specific support. They were dissected from right to left (pancreas is localized in
left side) at 8 μm in thickness. When the central part of lung bud was visualized,
indicating that the plane of sectioning was close to the midline, sections were
collected on slides. The first section is collected on a slide destined to
immunofluorescence analysis, the next three are collected on a slide for the LCM
technique, and so on. The slides were immediately put on dry-ice and stored at -80°C
overnight. During sectioning was minimized the room temperature section exposure
time.
Before sections dehydration, all surfaces, and instruments were treated with RNase
Zap (Ambion) for 5 minutes followed by 70% EtOH and 100% EtOH, to eliminate the
extrinsic RNasees. The other utensils were treated, with RNase Zap for 5 minutes
followed by two washings with H2O-DEPC (water treated with 0.1% of
diethylpyrocarbonate, a potent RNase inhibitor) and one washing with 100% EtOH.
The utensils were keep at 60°C up to use, instead the surfaces and the instruments
were allow to air dry.
Materials and Methods
28
In the step of dehydration, the slides were incubated sequentially in 75% EtOH
(100% EtOH in ddH2O) for 30 seconds, ddH2O for 30 seconds, 75% EtOH for 30
seconds, 95% EtOH for 30 seconds, 100% EtOH for 30 seconds and Xylene for 5
minutes. Allow slides dry for 5 minutes under a hood. Dehydration is crucial to
stabilize the tissues and to allow the capture.
Laser capture microdissection (LCM) of dorsal pancreatic buds was performed in a
maximum time of 60 minutes after dehydration and with a 36% of relative humidity in
the room [84]. These parameters are important because a high ambient humidity
could rehydrate the sections and reactivate endogenous RNases and the absorption
of moisture of the atmosphere seems to cause the degradation of RNA and an LCM
inefficient. LCM was performed using the PixCell II system (Arcturus) under 20x
magnification with a laser spot size of 10 μm, laser output power of 100 mW and
pulse duration of 1.5 ms. The LCM technique is performed by placing a thermoplastic
film 12 μm above the dehydrated tissue section, this position serves to maintain the
capture area above the surface of the section, avoiding direct contact. The cells of
interest are localized with an inverted microscope, and on cells are directed pulses
generated by an infrared laser at low energy to avoid damaging the tissue and
therefore cells from which to extract RNA. Dorsal pancreas buds dissected from three
embryos were captured with one cap. After that, the whole sections without
pancreatic buds were scraped with a scalpel and collected in a 0,5 ml tube. Then, a
cell extraction device ExtractSure (Arcturus) is placed on the film, creating a room for
the extraction buffer. The extraction buffer, pre-heated at 42°C, should be applied to
the cells immediately after the LCM to stabilize the RNA.
According to manufacturer's protocol of Pico-Pure RNA isolation kit:
Dispense 10 μl of Extraction Buffer (XB) on each sample and place a new 0.5 ml
microcentrifuge tube onto the CapSure-ExtracSure assembly and incubate at 42°C in
the thermoblock for 30 minutes. Centrifuge the microcentrifuge tube with the
CapSure-ExtracSure assembly at 800 g for 2 minutes to collect cell extract into the
same. During the incubation of the samples, the RNA Purification Column needs to
be pre-conditioned. Pipette 250 μl of Conditioning Buffer (CB) onto the purification
Materials and Methods
29
column filter membrane. Incubate the RNA Purification Column with Conditioning
Buffer for 5 minutes at room temperature. Centrifuge the purification column in the
provided collection tube at 16000 g for 1 minute. After that is possible to proceed with
the RNA isolation protocol. Pipette 10 μl of 70% EthOH into the cell extract, mix well
by pipetting up and down and do not centrifuge. Pipette the cell extract and EtOH
mixture into the preconditioned purification column.
To bind RNA, centrifuge for 2 minutes at 100 g, immediately followed by a
centrifugation at 16000 g for 30 seconds to remove flow through. Pipette 100 μL
Wash Buffer 1 (W1) into the purification column and centrifuge for 1 minute at 8000
g. At this step DNA may be removed. The DNase treatment utilizing the RNase-Free
DNase Set (Qiagen). Pipette 5 μL DNase I Stock Solution to 35 μl Buffer RDD
(provided with RNase-Free DNase Set). Mix by gently inverting. Pipette the 40 μl
DNase incubation mix directly into the purification column membrane. Incubate at
room temperature for 15 minutes. Finally pipette 40 μl PicoPure RNA Kit Wash Buffer
1 (W1) into the purification column membrane. Centrifuge at 8000g for 15 seconds
and proceed with the RNA isolation protocol. Pipette 100 μl Wash Buffer 2 (W2) into
the purification column and centrifuge for one minute at 8000 g. Pipette another 100
μl Wash Buffer 2 (W2) into the purification column and centrifuge for 3 minutes at
16000 g. Transfer the purification column to a new 0.5 ml microcentrifuge tube
provided in the kit. Pipette 20 μl of Elution Buffer (EB) directly onto the membrane of
the purification column (Gently touch the tip of the pipette to the surface of the
membrane while dispensing the elution buffer to ensure maximum absorption of EB
into the membrane) and incubate the column for 1 minute at room temperature.
Centrifuge the column for 1 minute at 1000 g to distribute EB in the column, and then
spin for 1 minute at 16000 g to elute RNA. The entire sample may be used
immediately or stored at –80°C until use.
RNA yields were about 5 ng from 3 dorsal buds. RNA quality and integrity was
determined by an Agilent 2100 Bioanalyzer (Agilent Technologies, Santa Clara, CA)
on RNA Pico Chips (Agilent Technologies).

Materials and Methods
30
According to manufacturer's protocol:
Cleaning the electrodes
Before running assay decontaminate the electrodes through the chip washing for 5
minutes with 350 μl of RNase Zap. Wash the pins with another chip washing for 2
minutes with 350 μl of RNase free water. To dry the pins leave the lid open for 2
minutes.
Preparing gel matrix
For the preparation of gel matrix allow all reagents to equilibrate to room temperature
for 30 minutes. Place 600 μl of RNA 6000 Pico gel matrix (red) into the top receptacle
of a spin filter and centrifuge for 10 minutes at 4000 rpm (rate is stable for one
month).
Preparing the Gel-Dye Mix
Vortex and spin the tube RNA 6000 Pico dye concentrate (blue). Aliquot 65 μl filtered
gel (gel matrix) in a tube 0.5 ml. Add 1 μl of RNA 6000 Pico dye concentrate to an
aliquot of filtered gel (gel matrix), centrifuge for 10 minutes at 13000 rpm and keep in
the dark.
Loading the Gel-Dye Mix
Denature 1.5 μl of each sample for 2 minutes at 70°C. Take an RNA Pico chip and
place it on the chamber pressure. Pipette 9 μl of the gel-dye mix at the bottom of the
well marked G and dispense the gel-dye mix. Set the timer to 30 seconds, make sure
that the plunger is positioned at 1 ml and then close the chip priming station. Press
the plunger of the syringe down until it is held the clip. Wait 30 seconds and release
the clip. Slowly pull back the plunger of the syringe to 1 ml position. Open the
chamber and pipette another 9 μl gel-dye mix in the other 2 wells G. Pipette 9 μl of
the RNA 6000 Pico conditioning solution (white) into the well marked CS. Pipette 5 μl
of RNA 6000 Pico Marker (green) into the 11 sample wells and the well marked with
a ladder symbols. Load 1 μl of the diluted RNA 6000 Pico ladder into the well marked
with the ladder symbols and 1 μl of each sample into each of the 11 sample wells.
Centrifuge 1 minute at 2400 rpm the chip on vortex, and then insert it into the
machine.
Materials and Methods
31
Using the software
The 2100 expert software screen shows that you have inserted a chip and closed the
lid by displaying the chip icon at the top left of the Instrument context. In the
Instrument context, select the appropriate Assay about RNA and the type of chip (in
this case, Pico).
Click the Start button and wait for the outcome of the run. Assess the integrity of RNA
through the presence 18s and 28s bands. The Bioanalyzer uses software that
implements an algorithm of analysis obtaining from each electrophoresis a number,
the RIN (RNA integrity number), representative of the quality of the sample (1, low
quality; 10, highest quality). The quality of RNA extracted from cells obtained by LCM
showed bands 18s and 28s, indicating that there is not deterioration in the quality of
RNA and a good value of the RIN.
Three biological replicates with RNA integrity numbers (RIN) higher than 7 were
considered to obtain labeled sense-strand cDNA (ss cDNA).
4. RNA amplification, labeling and hybridization
RNA samples obtained by LCM were amplified with the RiboAmp HS PLUS RNA
Amplification Kit (Arcturus), for the second cycle of cDNA amplification and hydrolysis
was used the Ambion WT Expression Kit (Ambion) and finally, to labeling ss cDNA
was used the Affymetrix GeneChip WT Terminal Labeling Kit (Affymetrix). The
RiboAmp HS PLUS Kit provides sensitivity in linear amplification of small samples
and enables the production of microgram quantities of amplified antisense RNA
(aRNA) from picogram or low nanogram amounts of total RNA. The total RNA input
recommended for RiboAmp amplification is 500 pg to 5 ng that allow to obtain over
than 30 μg of aRNA. The success of amplification using the RiboAmp HS PLUS RNA
Amplification Kit depends on the quality of the source RNA. Integrity is affected by
exposure to internal and external sources of RNases. The three kits listed above
generate labeled ss cDNA ready for microarray experiments and other downstream
analysis methods. RNA amplification and labeling can be illustrated as in figure
(Fig.5).

Materials and Methods
32
The RiboAmp HS PLUS RNA Amplification Kit utilizes two rounds of a five-step
process for linear amplification:
1. 1st strand synthesis reaction that yields cDNA incorporating a T7 promoter
sequence;
2. 2nd strand synthesis reaction utilizing exogenous primers that yields double-
stranded cDNA;
3. cDNA purification using specially designed MiraCol™ Purification Columns;
4. In vitro transcription (IVT) utilizing T7 RNA polymerase yields antisense RNA
(aRNA);
5. aRNA isolation with the MiraCol Purification Columns.
Fig. 5 Molecular events that occurs during RNA Amplification, Labeling and Hybridization.

Materials and Methods
33
According to manufacturer's protocol:
Round 1: first strand cDNA synthesis
RNA input amount was 4.5 ng. The input samples were prepared with H2O DEPC in
a final volume of 10 μl in 0.2 ml tubes and put at 4°C. Then add to each sample 1 μl
of Primer 1 (Grey), titillate and spin. Incubate at 65°C for 5 minutes and then at 4°C
for 1 minute. At the end spin and put in the cold block (4°C).
Prepare the first strand synthesis mix. The mix for a single sample is composed of 2
μl Enhancer (Yellow E), 5 μl 1st strand master mix (Red-1), 1 μl 1st strand enzyme
mix (Red-2) and 1 μl SuperScript III Enzyme Invitrogen (200 U/μl). Titillate and spin
the mix and add 9 μl of the mix to each sample. Incubate the samples at 42°C for 1
hour followed by 4°C for 1 minute. Then spin the samples and put them in the cold
block.
Add 2 μl of 1st Strand Nuclease Mix (Gold) to the samples and incubate at 37°C for
30 minutes, 95°C for 5 minutes and 4°C for 1 minute. Spin the samples and put them
in the cold block.
Round 1: second strand cDNA synthesis
Add to the samples 1 μl of Primer 2 (Grey-2), titillate, spin and incubate at 95°C for 2
minutes followed by 4°C for 2 minutes. Spin the samples and put them in the cold
block. Prepare the second strand synthesis mix. The mix for a single sample is
composed of: 29 μl of 2nd strand Master Mix (White-1) and 1 μl of 2nd Strand
Enzyme Mix (White-2). Titillate and spin the mix and add 30 μl of the mix to each
sample. Incubate the sample at 25°C for 10 minutes, 37°C for 30 minutes, 70°C for 5
minutes and 4°C for 2 minutes.
Round 1: cDNA purification
Incubate the purification column with 250 μl of DNA Binding Buffer (DB) for 5 minutes
and then centrifuge at 16000 g for 1 minute.
Add 200 μl of DB to each sample, mix up and down and pipette the whole sample on
Materials and Methods
34
a column. Centrifuge at 100 g for 2 minutes followed by 10000 g for 1 minute.
Eliminate the eluted DB.
Add 250 μl of DNA Wash Buffer to each sample and centrifuge at 16000 x g for 3
minutes. Put the column on a 0,5 ml tube and add 11 μl of Elution Buffer (DE).
Incubate at room temperature for 1 minute and then centrifuge at 1000 g for 1 minute
and 1 minute at 16000 g.
Round one: in vitro transcription
Prepare the IVT Reaction Mix. The mix for a single sample is composed of: 2 μl of
IVT Buffer (Blue-1), 6 μl of IVT Master Mix (Blue-2), 2 μl of IVT Enzyme Mix (Blue-3)
and 2 μl of Enhancer (Yellow-E), titillate and spin the mix. Add 12 μl of the mix to
each sample and incubate at 42°C for 6 hours and at 4°C for 2 minutes or overnight.
Add 1 μl of DNase Mix (Blue-4) to each sample, titillate, spin and incubate at 37°C for
15 minutes and then put the samples on a cold block. Proceed immediately with the
aRNA purification.
Round one: aRNA purification
Incubate the purification column with 250 μl of RNA Binding Buffer (RB) for 5 minutes
at room temperature and then centrifuge at 16000 g for 1 minute. Add 120 μl of RB
to the samples, mix up and down. Pipette the whole sample on the membrane of the
column and centrifuge at 100 g for 2 minutes followed by 1 minute at 10000 g.
Eliminate the eluted RB.
Add 200 μl of RNA Wash Buffer (RW) to each sample and centrifuge at 16000 g for 3
minutes.
Put the column on a 0.5 ml tube and add 12 μl of RNA Elution Buffer (RE). Incubate
at room temperature for 1 minute and then centrifuge at 1000 g for 1 minute and 1
minute at 16000 g.
Round 2: 1st strand cDNA synthesis
Add 1 μl of Primer 2 (Grey) to each sample, titillate, spin and incubate at 65°C for 5

Materials and Methods
35
minutes followed by 4°C for 1 minute. Spin the samples and put them in a cold block.
Prepare the 1st Strand Synthesis Mix. The mix for a single sample is composed of: 2
μl of Enhancer (Yellow-E), 5 μl of 1st Strand Master Mix (Red-1), 1 μl of 1st Strand
Enzyme Mix (Red-), 1 μl of SuperScript III Enzyme. Titillate and spin the mix. Add 9
μl of the mix to each sample, titillate, spin and incubate at 25°C for 10 minutes, 37°C
for 1 hour and 4°C for 1 minute.
Round 2: 2nd strand cDNA synthesis
Add 1 μl of Primer 3 (Grey) to each sample, titillate, spin and incubate at 95°C for 5
minutes and at 4°C for 2 minutes.
Prepare the 2nd Strand Synthesis Mix. The mix for a single sample is composed of:
29 μl of 2nd Strand Master Mix and 1 μl of 2nd Strand Enzyme Mix. Titillate and spin
the mix. Add 30 μl of the mix to each sample, titillate spin and incubate at 37°C for 30
minutes, followed by 70°C for 5 minutes and 4°C for 30 minutes.
Round 2: cDNA purification
Incubate the purification column with 250 μl of DNA Binding Buffer (DB) for 5 minutes
and then centrifuge at 16000 g for 1 minute.
Add 200 μl of DB to each sample, mix up and down and pipette the whole sample on
a column. Centrifuge at 100 g for 2 minutes followed by 10000 g for 1 minute.
Eliminate the eluted DB.
Add 250 μl of DNA Wash Buffer to each sample and centrifuge at 16000 g for 3
minutes. Put the column on a 0.5 ml tube and add 11 μl of Elution Buffer (DE).
Incubate at room temperature for 1 minute and then centrifuge at 1000 g for 1 minute
and 1 minute at 16000 g.
Round 2: in vitro transcription
Prepare the IVT Reaction Mix. The mix for a single sample is composed of: 2 μl of
IVT Buffer (Blue-1), 6 μl of IVT Master Mix (Blue-2), 2 μl of IVT Enzyme Mix (Blue-3)
and 2 μl of Enhancer (Yellow-E), titillate and spin the mix. Add 12 μl of the mix to

Materials and Methods
36
each sample and incubate at 42°C for 6 hours followed by 4°C for 10 minutes.
Add 1 μl of DNase Mix (Blue-4) to each sample, titillate, spin and incubate at 37°C for
15 minutes and then put the samples on a cold block. Proceed immediately with the
aRNA purification.
Round 2: aRNA purification
Incubate the purification column with 250 μl of RNA Binding Buffer (RB) for 5 minutes
at room temperature and then centrifuge at 16000 g per 1 minute. Add 120 μl of RB
to the samples, mix up and down. Pipette the whole sample on the membrane of the
column and centrifuge at 100 g for 2 minutes followed by 1 minute at 10000 g.
Eliminate the eluted RB.
Add 200 μl of RNA Wash Buffer (RW) to each sample and centrifuge at 16000 g for 3
minutes.
Put the column on a 0,5 ml tube and add 30 μl of RNA Elution Buffer (RE). Incubate
at room temperature for 1 minute and then centrifuge at 1000 g for 1 minute and 1
minute at 16000 g. Store the samples at -80°C overnight.
At this step samples can be quantized with the Nanodrop instrument.
Using Ambion WT Expression Kit, sense-strand cDNA is synthesized by the reverse
transcription of aRNA using random primers. The sense-strand cDNA contains dUTP
at a fixed ratio relative to dTTP. 10 μg of aRNA is required for 2nd-cycle cDNA
synthesis.
According to manufacturer's protocol:
Synthesize 2nd-cycle cDNA
Prepare aRNA samples in a final volume of 22 μl (in Elution Buffer-Arcturus) in which
the final amount of aRNA is 10 μg. Add 2 μl of Random Primers and incubate at 70°C
for 5 minutes, followed by 25°C for 5 minutes and 4°C for 2 minutes.
Prepare 2nd cycle Master Mix. A mix for a single sample is composed of: 8 μl of 2nd
Cycle Buffer Mix and 8 μl of 2nd Cycle Enzyme Mix. Titillate and spin the mix. Add 16
μl of the mix to each sample, titillate, spin and incubate at 25°C for 10 minutes, 42°C

Materials and Methods
37
for 90 minutes, 70°C for 10 minutes and 4°C for 2 minutes.
Hydrolyze using RNase H
In this procedure, RNase H degrades the aRNA template leaving single-stranded
cDNA.
Add 2 μl of RNase H to each sample and incubate at 37°C for 45 minutes followed by
95°C for 5 minutes and 4°C for 2 minutes.
Purify 2nd cycle cDNA
After synthesis, the second-strand cDNA is purified to remove enzymes, salts, and
unincorporated dNTPs. This step prepares the cDNA for fragmentation and labeling.
Before beginning the cDNA purification pre-heat the Elution Solution at 58°C for 10
minutes. Vortex the Nucleic Acid Binding Beads vigorously before use to ensure they
are fully dispersed. Add to each sample 18 μl of H2O Nuclease-Free, 10 μl of Nucleic
Acid Binding Beads and 50 μl of Nucleic Acid Buffer Concentrate, for a final volume
of 60 μl. Transfer each sample to a well of a U-bottom plate. Add 120 μl of 100%
EtOH to each sample. Pipette up and down 3 times to mix. Gently shake for 2
minutes on the thermomixer. The cDNA in the sample binds to the Nucleic Acid
Binding Beads during this incubation. Move the plate to a magnetic stand to capture
the magnetic beads. When the capture is complete (~5 minutes), the mixture is
transparent, and the Nucleic Acid Binding Beads form pellets against the magnets in
the magnetic stand. Carefully aspirate and discard the supernatant without disturbing
the magnetic beads.
Add 100 μl of Nucleic Acid Wash Solution to each sample, then shake the samples at
moderate speed for 1 minute. Move the plate to a magnetic stand to capture the
Nucleic Acid Binding Beads. Carefully aspirate and discard the supernatant without
disturbing the Nucleic Acid Binding Beads. Move the plate to a shaker, then shake
the plate vigorously for 1 minute to evaporate residual ethanol from the beads. Dry
the solution until no liquid is visible. Elute the purified cDNA from the Nucleic Acid
Binding Beads by adding 30 μl of pre-heated Elution Solution to each sample.

Materials and Methods
38
Incubate for 2 minutes at room temperature without shaking. Vigorously shake the
plate for 3 minutes. Transfer the supernatant, which contains the eluted cDNA, to a
nuclease-free multiwell plate.
Using the Affymetrix GeneChip WT Terminal Labeling Kit is possible to fragment,
label and hybridize the ss cDNA samples on the GeneChip® Mouse Gene 1.0 ST
Array. The latter is the product in the family of Affymetrix expression arrays offering
whole-transcript coverage. Each of the 28.853 genes is represented on the array by
approximately 27 probes spread across the full length of the gene, providing a more
complete and more accurate picture of gene expression than 3'-based expression
array designs.
According to manufacturer's protocol:
ss cDNA fragmentation
Prepare the ss cDNA in a final volume of 31.2 μl (in H2O RNase Free) in which the
final amount of ss cDNA is 5l5 μg. Add for each sample 10 μl of H2O RNase free, 48
μl of 10x cDNA Fragmentation Buffer, 1 μl of UDG (10 U/μl) and 1 μl of APE (1000
U/μl). Incubate at 37°C for 60 minutes, 93°C for 2 minutes and 4°C for 2 minutes.
ss cDNA labeling
Add to each sample 12 μl of 5X TdT Buffer, 2 μl of TdT and 1 μl of DNA Labeling
Reagent (5 mM). Incubate at 37°C for 60 minutes, 70°C for 10 minutes and 4°C for 2
minutes.
Hybridization
Each sample was hybridized on a GeneChip® Mouse Gene 1.0 ST Array at 42°C for
16 hours. Chips were then washed and scanned.
Materials and Methods
39
5. RNA extraction from embryos or cell cultures
In order to perform total RNA extraction, the samples were collected and preserved
in TRIzol (Invitrogen, a monophasic solutions of phenol and guanidine isothiocyanate
suitable for isolating total RNA, DNA and proteins). After homogenization in TRIzol,
the samples were treated with 200 µl of chloroform, vortexed for 15 seconds and
centrifuged at 12000 rpm for 10 minutes; this step is required to remove any trace of
phenol. In order to precipitate RNA, 500 µl of isopropanol were added to the upper
phase obtained from the previous step; the samples were incubated for 10 minutes at
room temperature and centrifuged at 12000 rpm for 10 minutes. After the removal of
the surnatant, pellets were washed with 1ml of EtOH 75% for 10 minutes at 14000
rpm and then resuspended in H2O-DEPC.
RNA qualitative control by denaturing agarose gel electrophoresis
To check the integrity of RNA, each sample was analyzed by electrophoresis on
agarose gel in denaturing conditions. Agarose was dissolved in H2O-DEPC, then
MOPS buffer 1x (MOPS buffer 10x: MOPS pH 7.0 200 mM, NaAc 200 mM, EDTA pH
8.0 10 mM) and of 37% formaldheide (J.T.Baker, the denaturing agent), were added.
Samples (800 ng) RNA were prepared adding 3 volumes of Loading dye 1x (500µl
formamide, 100 µl MOPS 10x, 150 µl 37% formaldehyde, 100 µl DYE 10x, 1 µl
ethidium bromide 10 mg/ml). Samples were denatured at 65°C for 5 minutes and
loaded on the gel; the electrophoresis was performed at 100 V for about 30 minutes.
6. RT–PCR and quantitative PCR (qPCR) Analyses
One microgram of RNA was reverse transcribed with QuantiTect Reverse
Transcription Kit (Qiagen) to obtain cDNA in 200 μl, 5 μl of which (25 ng per reaction)
was used for qualitative PCR and quantitative PCR analysis.
Materials and Methods
40
According to manufacturer's protocol:
Elimination of genomic DNA
The purified RNA sample is briefly incubated in gDNA Wipeout Buffer at 42°C for 2
minutes to effectively remove contaminating genomic DNA. In contrast to other
methods, the RNA sample is then used directly in reverse transcription.
Reverse transcription
After genomic DNA elimination, the RNA sample is ready for reverse transcription
using a master mix prepared from Quantiscript Reverse Transcriptase, Quantiscript
RT Buffer, and RT Primer Mix. The entire reaction takes place at 42°C for 30 minutes
and is then inactivated at 95°C for 3 minutes.
Primers were designed with the Primer 3 program and their sequences are listed in
Table 1.
PCR reactions were performed using a commercial Taq DNA polymerase and
reaction conditions were as follows: initial denaturation at 95°C for 5 minutes, then for
35 cycles of amplification (30 seconds at denatured temperature of 94°C, followed by
30 seconds at annealing temperature of 60°C and 30 seconds at extension
temperature of 72°C) and 10 minutes at 72°C for a final extension. The PCR
products were analyzed using 2 % agarose gel electrophoresis and visualized by
staining with ethidium bromide.
Quantitative PCR were performed in duplicate with the power SYBR Green PCR
Master Mix (Applied Biosystems). The number of cycles of threshold (Ct) was
measured with 7900 HT System (Applied Biosystems). The Ct is defined as the
fractional cycle number at which the fluorescence passes the fixed threshold as PCR
amplification proceeds. The data were processed using SDS 2.3 software. The
distinct dissociation curve of each product was used to determine the specificity of its
amplification. All quantifications (ΔCt) were normalized with the Gapdh mRNA level,
then the fold induction was calculated by the ΔΔCt method as described in the
original paper [85].
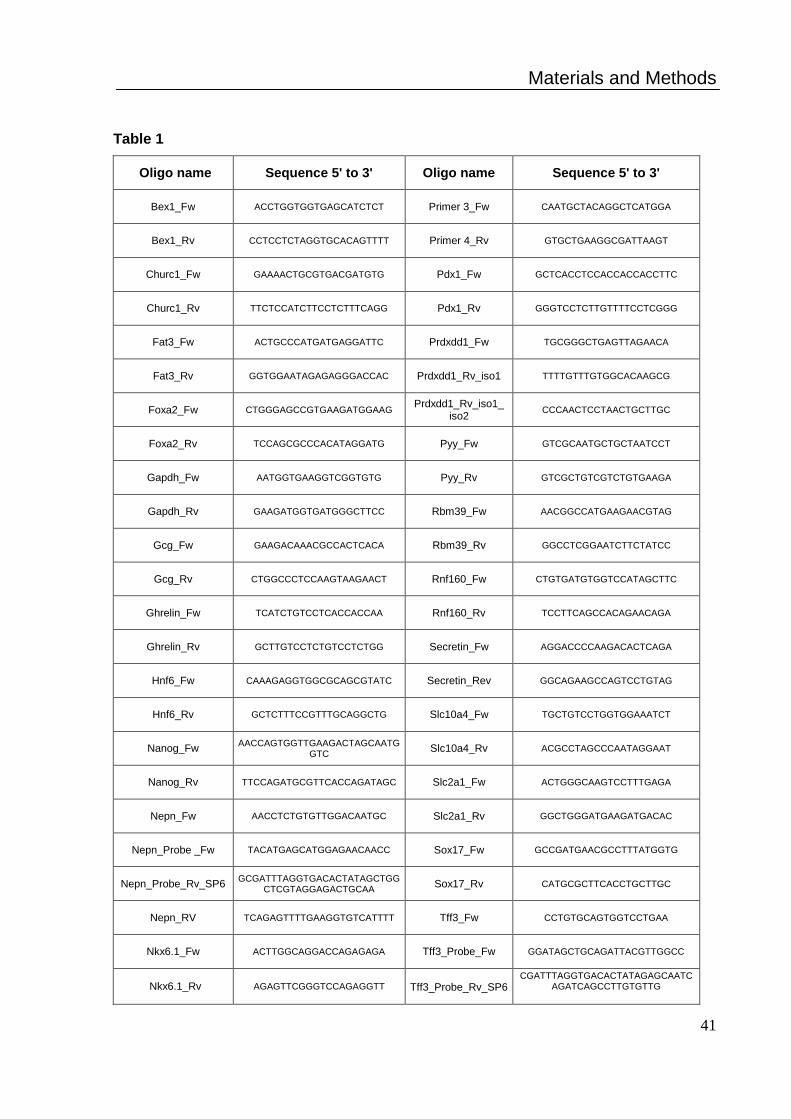
Materials and Methods
41
Table 1
Oligo name Sequence 5' to 3' Oligo name Sequence 5' to 3'
Bex1_Fw ACCTGGTGGTGAGCATCTCT Primer 3_Fw CAATGCTACAGGCTCATGGA
Bex1_Rv CCTCCTCTAGGTGCACAGTTTT Primer 4_Rv GTGCTGAAGGCGATTAAGT
Churc1_Fw GAAAACTGCGTGACGATGTG Pdx1_Fw GCTCACCTCCACCACCACCTTC
Churc1_Rv TTCTCCATCTTCCTCTTTCAGG Pdx1_Rv GGGTCCTCTTGTTTTCCTCGGG
Fat3_Fw ACTGCCCATGATGAGGATTC Prdxdd1_Fw TGCGGGCTGAGTTAGAACA
Fat3_Rv GGTGGAATAGAGAGGGACCAC Prdxdd1_Rv_iso1 TTTTGTTTGTGGCACAAGCG
Foxa2_Fw CTGGGAGCCGTGAAGATGGAAG Prdxdd1_Rv_iso1_
iso2 CCCAACTCCTAACTGCTTGC
Foxa2_Rv TCCAGCGCCCACATAGGATG Pyy_Fw GTCGCAATGCTGCTAATCCT
Gapdh_Fw AATGGTGAAGGTCGGTGTG Pyy_Rv GTCGCTGTCGTCTGTGAAGA
Gapdh_Rv GAAGATGGTGATGGGCTTCC Rbm39_Fw AACGGCCATGAAGAACGTAG
Gcg_Fw GAAGACAAACGCCACTCACA Rbm39_Rv GGCCTCGGAATCTTCTATCC
Gcg_Rv CTGGCCCTCCAAGTAAGAACT Rnf160_Fw CTGTGATGTGGTCCATAGCTTC
Ghrelin_Fw TCATCTGTCCTCACCACCAA Rnf160_Rv TCCTTCAGCCACAGAACAGA
Ghrelin_Rv GCTTGTCCTCTGTCCTCTGG Secretin_Fw AGGACCCCAAGACACTCAGA
Hnf6_Fw CAAAGAGGTGGCGCAGCGTATC Secretin_Rev GGCAGAAGCCAGTCCTGTAG
Hnf6_Rv GCTCTTTCCGTTTGCAGGCTG Slc10a4_Fw TGCTGTCCTGGTGGAAATCT
Nanog_Fw AACCAGTGGTTGAAGACTAGCAATG
GTC Slc10a4_Rv ACGCCTAGCCCAATAGGAAT
Nanog_Rv TTCCAGATGCGTTCACCAGATAGC Slc2a1_Fw ACTGGGCAAGTCCTTTGAGA
Nepn_Fw AACCTCTGTGTTGGACAATGC Slc2a1_Rv GGCTGGGATGAAGATGACAC
Nepn_Probe _Fw TACATGAGCATGGAGAACAACC Sox17_Fw GCCGATGAACGCCTTTATGGTG
Nepn_Probe_Rv_SP6 GCGATTTAGGTGACACTATAGCTGG
CTCGTAGGAGACTGCAA Sox17_Rv CATGCGCTTCACCTGCTTGC
Nepn_RV TCAGAGTTTTGAAGGTGTCATTTT Tff3_Fw CCTGTGCAGTGGTCCTGAA
Nkx6.1_Fw ACTTGGCAGGACCAGAGAGA Tff3_Probe_Fw GGATAGCTGCAGATTACGTTGGCC
Nkx6.1_Rv
AGAGTTCGGGTCCAGAGGTT
Tff3_Probe_Rv_SP6
CGATTTAGGTGACACTATAGAGCAATCAGATCAGCCTTGTGTTG
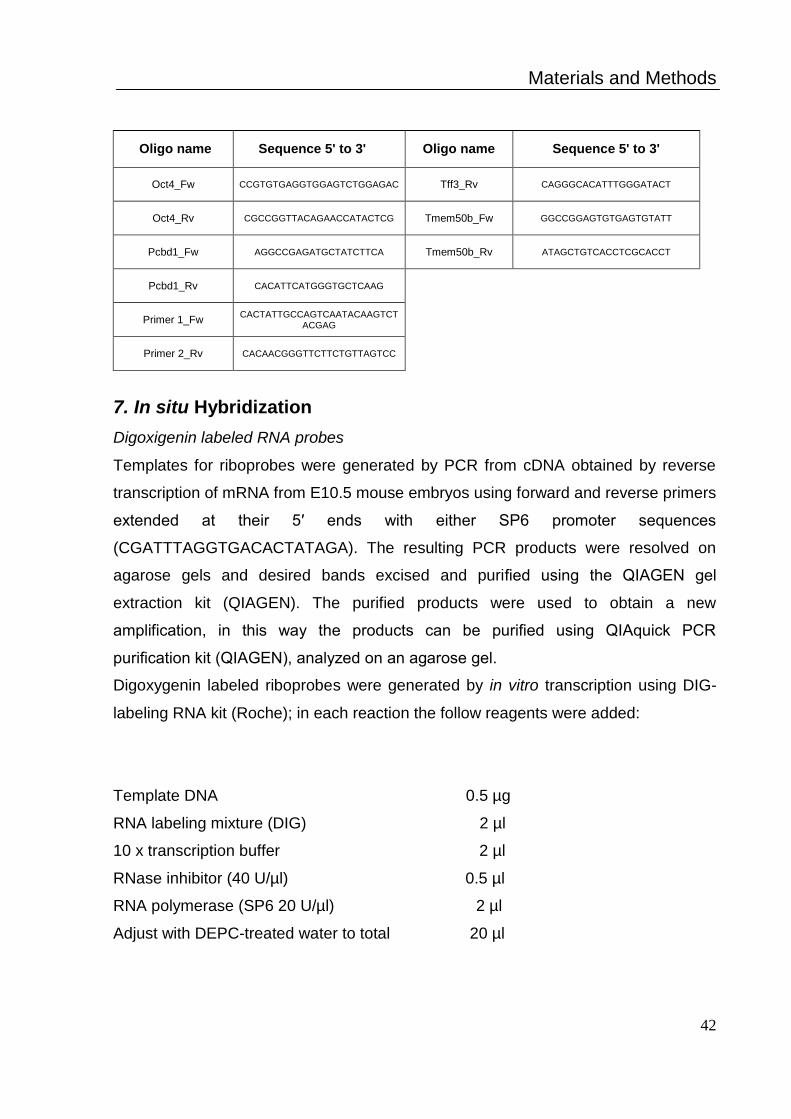
Materials and Methods
42
Oligo name
Sequence 5' to 3'
Oligo name
Sequence 5' to 3'
Oct4_Fw CCGTGTGAGGTGGAGTCTGGAGAC Tff3_Rv CAGGGCACATTTGGGATACT
Oct4_Rv CGCCGGTTACAGAACCATACTCG Tmem50b_Fw GGCCGGAGTGTGAGTGTATT
Pcbd1_Fw AGGCCGAGATGCTATCTTCA Tmem50b_Rv ATAGCTGTCACCTCGCACCT
Pcbd1_Rv CACATTCATGGGTGCTCAAG
Primer 1_Fw CACTATTGCCAGTCAATACAAGTCT
ACGAG
Primer 2_Rv CACAACGGGTTCTTCTGTTAGTCC
7. In situ Hybridization
Digoxigenin labeled RNA probes
Templates for riboprobes were generated by PCR from cDNA obtained by reverse
transcription of mRNA from E10.5 mouse embryos using forward and reverse primers
extended at their 5′ ends with either SP6 promoter sequences
(CGATTTAGGTGACACTATAGA). The resulting PCR products were resolved on
agarose gels and desired bands excised and purified using the QIAGEN gel
extraction kit (QIAGEN). The purified products were used to obtain a new
amplification, in this way the products can be purified using QIAquick PCR
purification kit (QIAGEN), analyzed on an agarose gel.
Digoxygenin labeled riboprobes were generated by in vitro transcription using DIG-
labeling RNA kit (Roche); in each reaction the follow reagents were added:
Template DNA 0.5 µg
RNA labeling mixture (DIG) 2 µl
10 x transcription buffer 2 µl
RNase inhibitor (40 U/µl) 0.5 µl
RNA polymerase (SP6 20 U/µl) 2 µl
Adjust with DEPC-treated water to total 20 µl
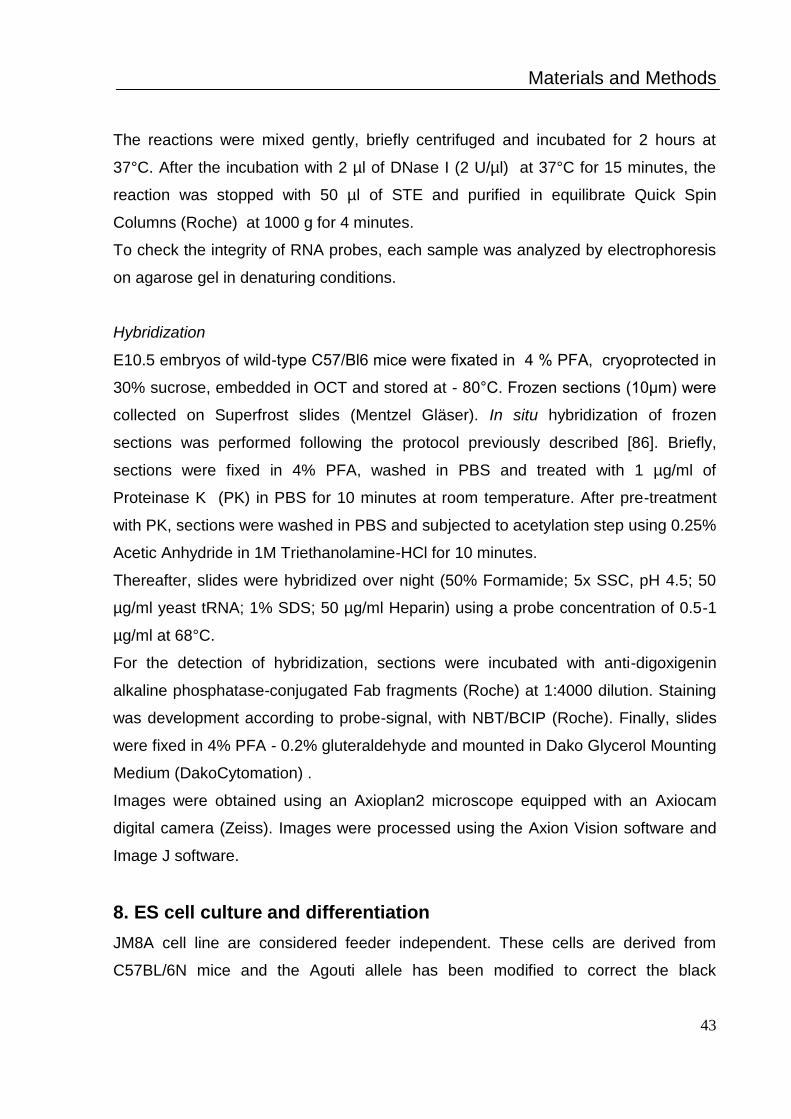
Materials and Methods
43
The reactions were mixed gently, briefly centrifuged and incubated for 2 hours at
37°C. After the incubation with 2 µl of DNase I (2 U/µl) at 37°C for 15 minutes, the
reaction was stopped with 50 µl of STE and purified in equilibrate Quick Spin
Columns (Roche) at 1000 g for 4 minutes.
To check the integrity of RNA probes, each sample was analyzed by electrophoresis
on agarose gel in denaturing conditions.
Hybridization
E10.5 embryos of wild-type C57/Bl6 mice were fixated in 4 % PFA, cryoprotected in
30% sucrose, embedded in OCT and stored at - 80°C. Frozen sections (10μm) were
collected on Superfrost slides (Mentzel Gläser). In situ hybridization of frozen
sections was performed following the protocol previously described [86]. Briefly,
sections were fixed in 4% PFA, washed in PBS and treated with 1 µg/ml of
Proteinase K (PK) in PBS for 10 minutes at room temperature. After pre-treatment
with PK, sections were washed in PBS and subjected to acetylation step using 0.25%
Acetic Anhydride in 1M Triethanolamine-HCl for 10 minutes.
Thereafter, slides were hybridized over night (50% Formamide; 5x SSC, pH 4.5; 50
µg/ml yeast tRNA; 1% SDS; 50 µg/ml Heparin) using a probe concentration of 0.5-1
µg/ml at 68°C.
For the detection of hybridization, sections were incubated with anti-digoxigenin
alkaline phosphatase-conjugated Fab fragments (Roche) at 1:4000 dilution. Staining
was development according to probe-signal, with NBT/BCIP (Roche). Finally, slides
were fixed in 4% PFA - 0.2% gluteraldehyde and mounted in Dako Glycerol Mounting
Medium (DakoCytomation) .
Images were obtained using an Axioplan2 microscope equipped with an Axiocam
digital camera (Zeiss). Images were processed using the Axion Vision software and
Image J software.
8. ES cell culture and differentiation
JM8A cell line are considered feeder independent. These cells are derived from
C57BL/6N mice and the Agouti allele has been modified to correct the black

Materials and Methods
44
mutation. Mice derived from these cells will have Agouti coat color and are
heterozygous for the Agouti allele (A/a). The Nepn mouse strain used for this
research project was created from ES cell clone EPD0686_5_C01 obtained from
Komp Repository and generated by the Wellcome Trust Sanger Institute (Fig.6). This
gene has 2 wild type transcripts, of which 2 are protein-coding. Following removal of
the floxed region, 2 transcripts are predicted to produce a truncated protein product
of which 0 may be subject to non-sense mediated decay (NMD).
Fig.6 Strategy of homolog ricombination to obtain ES cell clones with conditional potential.
mESCs were cultured at 37°C in a 5% CO2 atmosphere on 0,1% gelatine in ES
medium composed of Knockout DMEM high glucose (Gibco) supplemented with 15%
fetal bovine serum (Gibco), 0.1 mM 2(β)-Mercaptoethanol (Sigma), 1mM non-
essential amino acids (Gibco), 2 mM glutamine (Gibco), and 1000 units/ml leukemia
inhibitory factor (Millipore). Culture media was changed every day and cultures
passaged every two days.
For differentiation, 1 million of mESCs were plated in 35 mm dishes, as a feeder free
monolayer. The differentiation medium consists of the in DMEM Low Glucose (Gibco)
supplemented with 5% fetal bovine serum, 0.1 mM 2(β)-Mercaptoethanol, 1mM non-
essential amino acids, 2 mM glutamine, depleted of LIF, overlayed with 200 μg/ml
Matrigel (BD Biosciences) and treated with various factors sequentially.
These factors included Activin A (50 ng/ml, R&D Systems), all trans retinoic acid
(RA, 10 μM, Sigma), fibroblast growth factor 10 (Fgf10, 10 ng/ml, R&D Systems),
Cyclopamine (CYC, 10 μM, Sigma), N-N-(3,5-difluorophenacetyl)-L-
alanylsphenylglycinet-butylesterm (DAPT, 5 μM, Sigma). Medium was changed
every two days.

Materials and Methods
45
9. DNA genomic extraction
The lysis buffer (50mM Tris Hcl pH 8.5, 25 mM EDTA, 1% SDS, 1M NaCl, 1mg/ml
Proteinase K) was added in 60 mm dishe of cell culture. Digestion is complete after 4
hours at 60°C with agitation (1000 rpm). The sample was centifuged, at full speed at
4°C for 10 minutes, after adding 250 μl of NaCl 6M and 1 ml of Isopropanol. The
pellet was washed with 1 ml of cold 70% EtOH, then dried at room temperature.
Finally suspended in 100 μl of MilliQ water on a mixer and then store at 4°C.
10. -galactosidase staining
Cells were fixed with a fixation solution (formaldehyde 37%, glutaraldehyde 25% in
PBS) for 2 minutes, then washed with PBS and incubated overnight with a PBS
solution containing Potassium ferro-cyanide (5 mM), Potassium ferri-cyanide (5mM);
MgCl2 (2 mM) and X-Gal (1 mg/ml) at 37°C.
11. Southern Blot
Restriction digestion of genomic DNA
40 µg genomic DNA was digested in 300 µl total volume with 5 units restriction
enzyme (SacII and AccI, Biolabs) per µg DNA at 37°C overnight.
The digestion was purified adding the same volume of
Phenol:Chloroform:Isoamylalcohol solution and then centrifuged. In the surnatant
were added 0.1 volume NaAc 3M pH 5.2 and 2.5 volumes ice-cold 100% EtOH,
precipitated at -20°C for 2 hours. After 20 minutes of centrifugation, pellet was
washed with 1 ml of cold 70% EtOH, then dried at room temperature. Finally
suspended in 30 μl of MilliQ water on a mixer.
Agarose gel electrophoresis and transfer to Nylon membrane
The digested samples were runned on a 0.8% agarose gel without Ethidium
Bromide, and transferred to a nylon membrane as described previously [88]. Briefly,
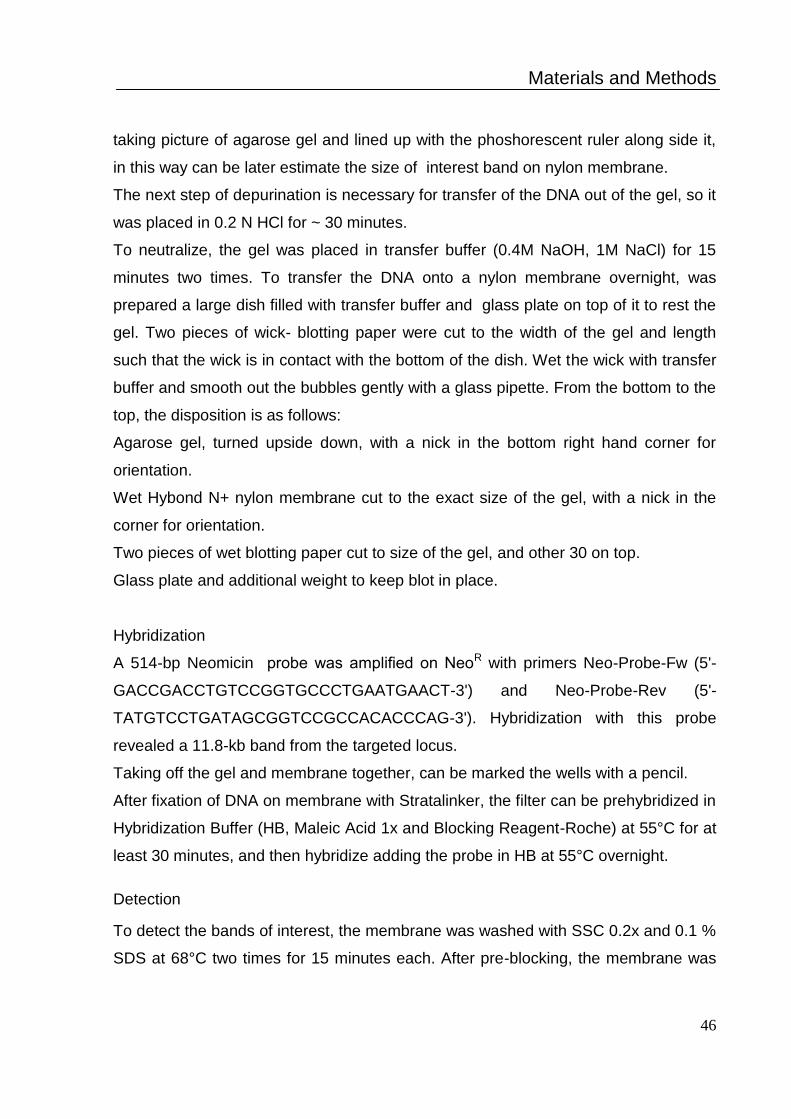
Materials and Methods
46
taking picture of agarose gel and lined up with the phoshorescent ruler along side it,
in this way can be later estimate the size of interest band on nylon membrane.
The next step of depurination is necessary for transfer of the DNA out of the gel, so it
was placed in 0.2 N HCl for ~ 30 minutes.
To neutralize, the gel was placed in transfer buffer (0.4M NaOH, 1M NaCl) for 15
minutes two times. To transfer the DNA onto a nylon membrane overnight, was
prepared a large dish filled with transfer buffer and glass plate on top of it to rest the
gel. Two pieces of wick- blotting paper were cut to the width of the gel and length
such that the wick is in contact with the bottom of the dish. Wet the wick with transfer
buffer and smooth out the bubbles gently with a glass pipette. From the bottom to the
top, the disposition is as follows:
Agarose gel, turned upside down, with a nick in the bottom right hand corner for
orientation.
Wet Hybond N+ nylon membrane cut to the exact size of the gel, with a nick in the
corner for orientation.
Two pieces of wet blotting paper cut to size of the gel, and other 30 on top.
Glass plate and additional weight to keep blot in place.
Hybridization
A 514-bp Neomicin probe was amplified on NeoR with primers Neo-Probe-Fw (5'-
GACCGACCTGTCCGGTGCCCTGAATGAACT-3') and Neo-Probe-Rev (5'-
TATGTCCTGATAGCGGTCCGCCACACCCAG-3'). Hybridization with this probe
revealed a 11.8-kb band from the targeted locus.
Taking off the gel and membrane together, can be marked the wells with a pencil.
After fixation of DNA on membrane with Stratalinker, the filter can be prehybridized in
Hybridization Buffer (HB, Maleic Acid 1x and Blocking Reagent-Roche) at 55°C for at
least 30 minutes, and then hybridize adding the probe in HB at 55°C overnight.
Detection
To detect the bands of interest, the membrane was washed with SSC 0.2x and 0.1 %
SDS at 68°C two times for 15 minutes each. After pre-blocking, the membrane was

Materials and Methods
47
placed with Anti-Digoxigenin-AP-Fab (Roche). The signal was developed with CDP-
Star (Roche) according to manufacturer's instructions.

Results
48
Results
1. Capture of dorsal pancreas bud by LCM
In order to dissect the dorsal pancreatic bud at E10.5, and considering the small size
of the organ at this stage, it was necessary to proceed with LCM.
To identify the structure of pancreas at E10.5, we performed immunofluorescence
experiments using two genes as markers: E-cadherin and Pdx1. E-cadherin is
expressed in endodermic tissues as pancreas, intestine, lung, thyroid, and Pdx1 is
specific of pancreas. The localization of Pdx1 protein is nuclear, while E-Cadherin
localizes at periplasmatic level.
In particular, we progressively collected the 10 μm sections to perform both bud
localization through immunofluorescence, and bud microdissection through LCM;
while in the last case sections were stored in dry ice during the cutting, for
immunofluorescence we optimized a protocol on the other sections (Fig.9). The
immunofluorescence protocol has been developed considering that the embryos
have been included after treatment with sucrose, without any fixtation in
paraformaldehyde. Because of the restricted number of sections in which the
pancreas dorsal bud is distinguishable, we referred to the progression of branchial
arches, to define the starting and the ending point of pancreas containing sections
(Fig.7). In particular, the ventral pancreas bud appears when the third branchial arch
disappears; in the same sections the right lung and thyroid buds appear; while the
dorsal pancreatic bud appears when the second branchial arch, thyroid bud and
trachea disappear. In the following sections the dorsal pancreatic bud is present until
the second branchial arches and left lung bud reappear. Using this methodology we
tightly estimated the section coordinates and thickness of several endoderm buds.
The thickness in which is present the entire pancreatic structure is about 140 µm, so
we can collect 14 sections of 10 µm. In fact, we find sections only with the dorsal
pancreas bud or only the ventral pancreas bud. Then, there are sections in which
both buds are present; near the ventral bud we identify also the gall bladder (Fig.8).
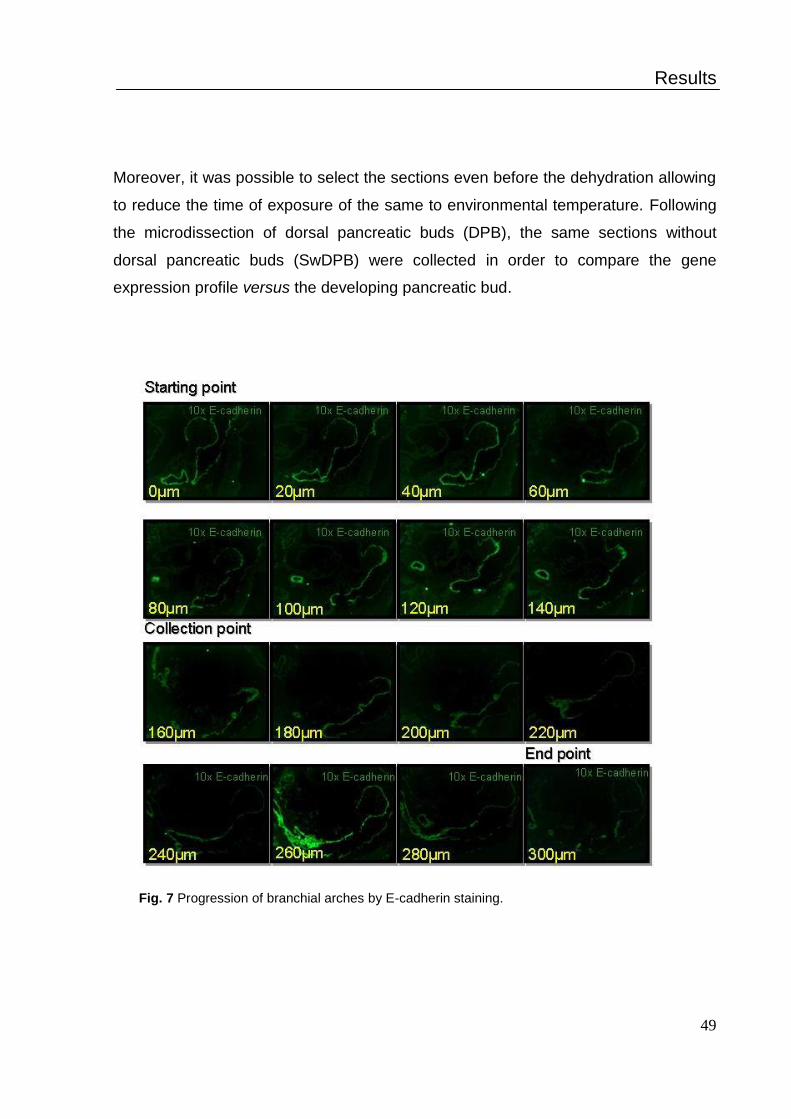
Results
49
Moreover, it was possible to select the sections even before the dehydration allowing
to reduce the time of exposure of the same to environmental temperature. Following
the microdissection of dorsal pancreatic buds (DPB), the same sections without
dorsal pancreatic buds (SwDPB) were collected in order to compare the gene
expression profile versus the developing pancreatic bud.
Fig. 7 Progression of branchial arches by E-cadherin staining.
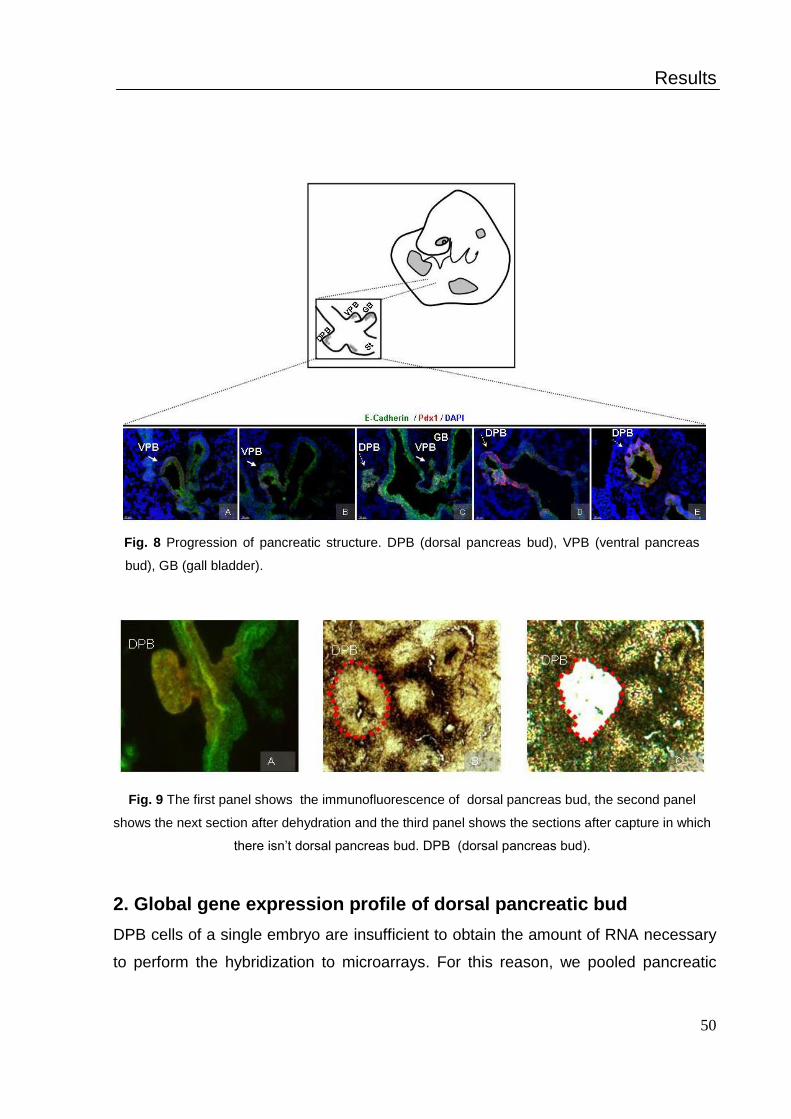
Results
50
Fig. 8 Progression of pancreatic structure. DPB (dorsal pancreas bud), VPB (ventral pancreas
bud), GB (gall bladder).
Fig. 9 The first panel shows the immunofluorescence of dorsal pancreas bud, the second panel
shows the next section after dehydration and the third panel shows the sections after capture in which
there isn’t dorsal pancreas bud. DPB (dorsal pancreas bud).
2. Global gene expression profile of dorsal pancreatic bud
DPB cells of a single embryo are insufficient to obtain the amount of RNA necessary
to perform the hybridization to microarrays. For this reason, we pooled pancreatic
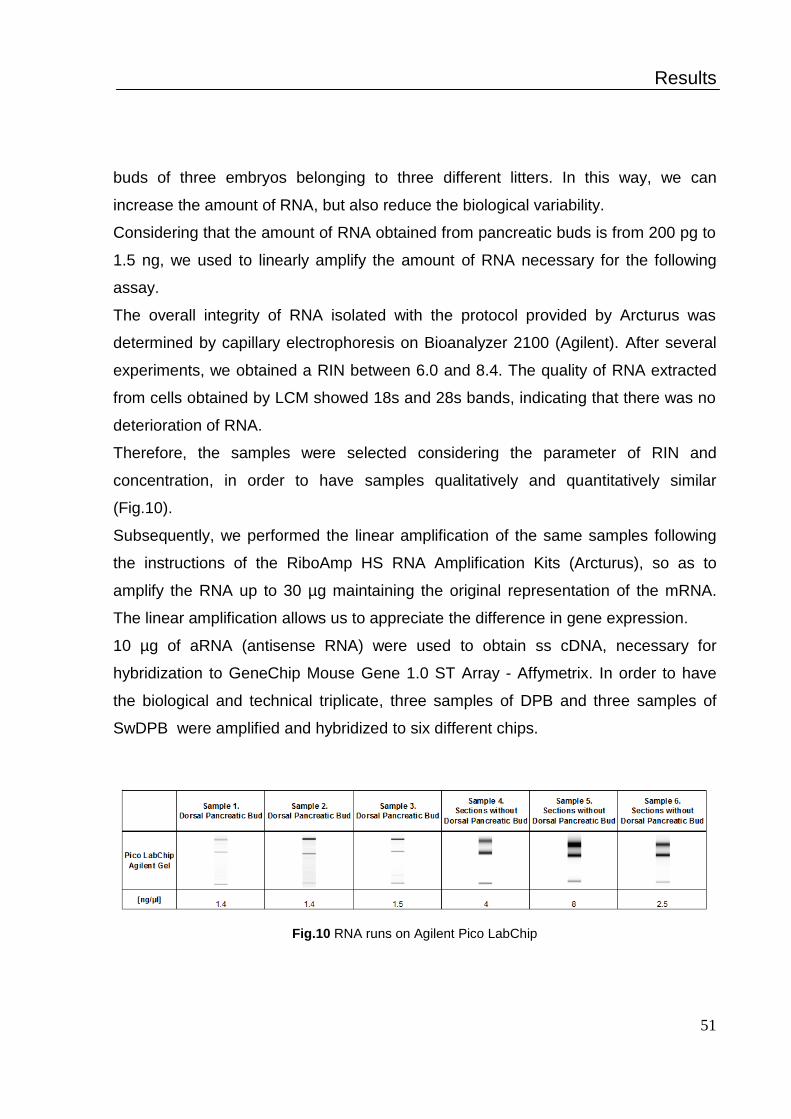
Results
51
buds of three embryos belonging to three different litters. In this way, we can
increase the amount of RNA, but also reduce the biological variability.
Considering that the amount of RNA obtained from pancreatic buds is from 200 pg to
1.5 ng, we used to linearly amplify the amount of RNA necessary for the following
assay.
The overall integrity of RNA isolated with the protocol provided by Arcturus was
determined by capillary electrophoresis on Bioanalyzer 2100 (Agilent). After several
experiments, we obtained a RIN between 6.0 and 8.4. The quality of RNA extracted
from cells obtained by LCM showed 18s and 28s bands, indicating that there was no
deterioration of RNA.
Therefore, the samples were selected considering the parameter of RIN and
concentration, in order to have samples qualitatively and quantitatively similar
(Fig.10).
Subsequently, we performed the linear amplification of the same samples following
the instructions of the RiboAmp HS RNA Amplification Kits (Arcturus), so as to
amplify the RNA up to 30 µg maintaining the original representation of the mRNA.
The linear amplification allows us to appreciate the difference in gene expression.
10 µg of aRNA (antisense RNA) were used to obtain ss cDNA, necessary for
hybridization to GeneChip Mouse Gene 1.0 ST Array - Affymetrix. In order to have
the biological and technical triplicate, three samples of DPB and three samples of
SwDPB were amplified and hybridized to six different chips.
Fig.10 RNA runs on Agilent Pico LabChip

Results
52
To find specific genes during pancreas development, we compared the expression
level of each transcript in DPB with that in the SwDPB and sorted out transcripts with
an expression level, in DPB, at least 1.2-fold higher than that in the whole embryo.
By this procedure we detected 162 genes enriched in the DPB.
Considering that the entire embryo is a mixture of all three germ layers, with this
approach, we can find an enrichment of general epithelial determinants in addition to
organ specific transcripts.
To validate the results of the
analysis we considered genes with
fold change (FC) greater than 1.6
as shown in the panel.
In particular, we confirmed by
qPCR the expression of both
specific pancreatic markers known
at E10.5 as Pyy, Gcg, Sct, Ghrl,
and the expression of markers
unknown as Bex1, Nepn, Pcbd1,
Prdxdd1, Rnf160, Slc2a1, Tff3
(Fig. 12).
Fig.11 Expression heatmap showing
representative genes of DPB.
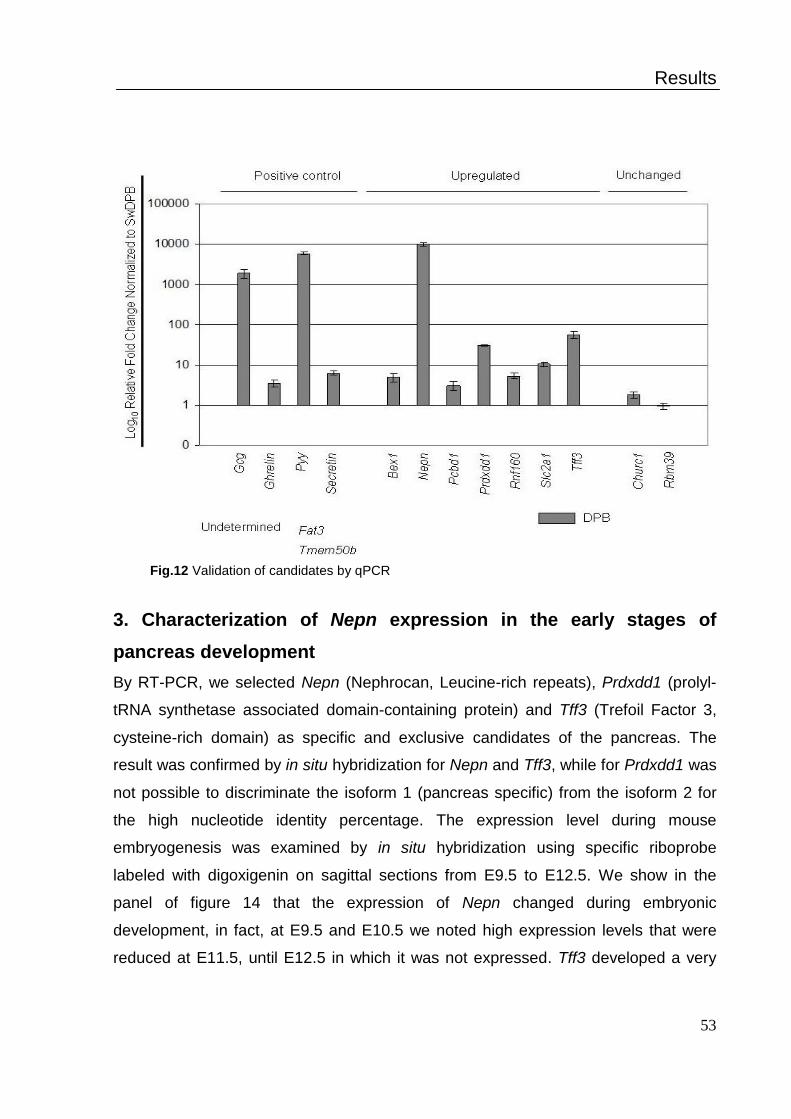
Results
53
Fig.12 Validation of candidates by qPCR
3. Characterization of Nepn expression in the early stages of
pancreas development
By RT-PCR, we selected Nepn (Nephrocan, Leucine-rich repeats), Prdxdd1 (prolyl-
tRNA synthetase associated domain-containing protein) and Tff3 (Trefoil Factor 3,
cysteine-rich domain) as specific and exclusive candidates of the pancreas. The
result was confirmed by in situ hybridization for Nepn and Tff3, while for Prdxdd1 was
not possible to discriminate the isoform 1 (pancreas specific) from the isoform 2 for
the high nucleotide identity percentage. The expression level during mouse
embryogenesis was examined by in situ hybridization using specific riboprobe
labeled with digoxigenin on sagittal sections from E9.5 to E12.5. We show in the
panel of figure 14 that the expression of Nepn changed during embryonic
development, in fact, at E9.5 and E10.5 we noted high expression levels that were
reduced at E11.5, until E12.5 in which it was not expressed. Tff3 developed a very

Results
54
weak signal, this did not allow us to characterize very well this gene during early
pancreas development (data not shown).
Fig.13 Validation of candidates by RT-PCR.
Fig.14 Validation of Nepn on developing pancreas by in situ hybridization, magnification 20x.
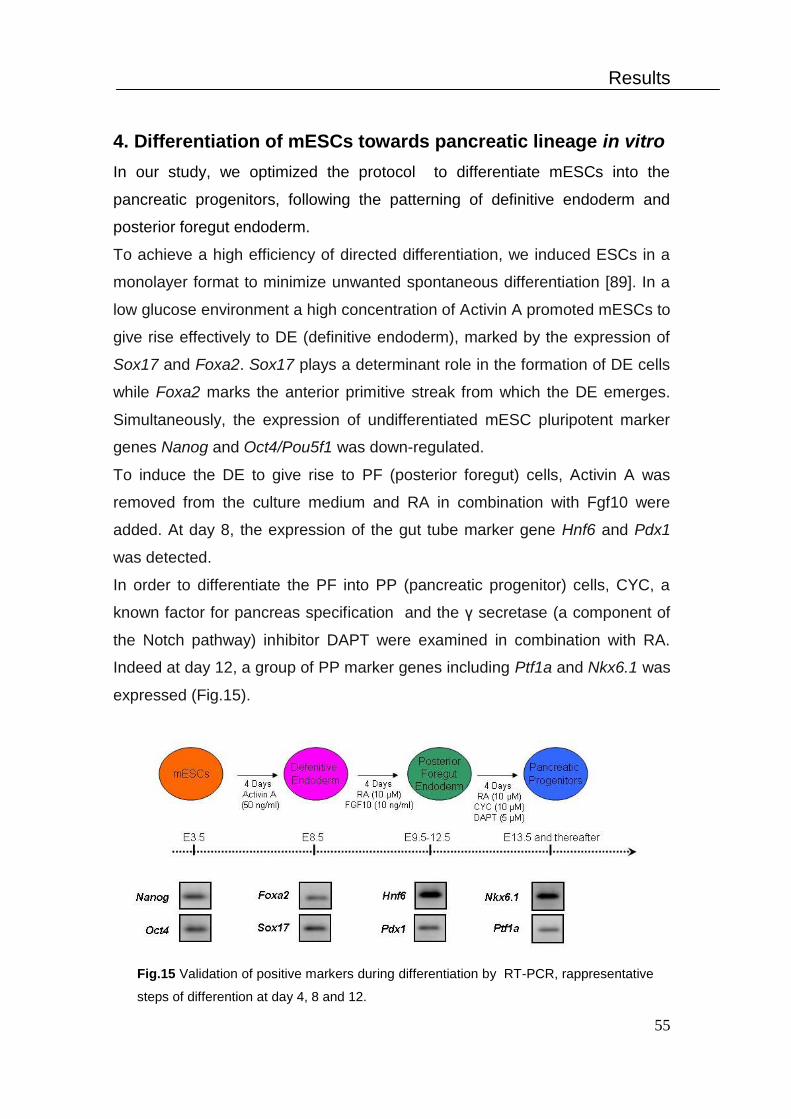
Results
55
4. Differentiation of mESCs towards pancreatic lineage in vitro
In our study, we optimized the protocol to differentiate mESCs into the
pancreatic progenitors, following the patterning of definitive endoderm and
posterior foregut endoderm.
To achieve a high efficiency of directed differentiation, we induced ESCs in a
monolayer format to minimize unwanted spontaneous differentiation [89]. In a
low glucose environment a high concentration of Activin A promoted mESCs to
give rise effectively to DE (definitive endoderm), marked by the expression of
Sox17 and Foxa2. Sox17 plays a determinant role in the formation of DE cells
while Foxa2 marks the anterior primitive streak from which the DE emerges.
Simultaneously, the expression of undifferentiated mESC pluripotent marker
genes Nanog and Oct4/Pou5f1 was down-regulated.
To induce the DE to give rise to PF (posterior foregut) cells, Activin A was
removed from the culture medium and RA in combination with Fgf10 were
added. At day 8, the expression of the gut tube marker gene Hnf6 and Pdx1
was detected.
In order to differentiate the PF into PP (pancreatic progenitor) cells, CYC, a
known factor for pancreas specification and the γ secretase (a component of
the Notch pathway) inhibitor DAPT were examined in combination with RA.
Indeed at day 12, a group of PP marker genes including Ptf1a and Nkx6.1 was
expressed (Fig.15).
Fig.15 Validation of positive markers during differentiation by RT-PCR, rappresentative
steps of differention at day 4, 8 and 12.
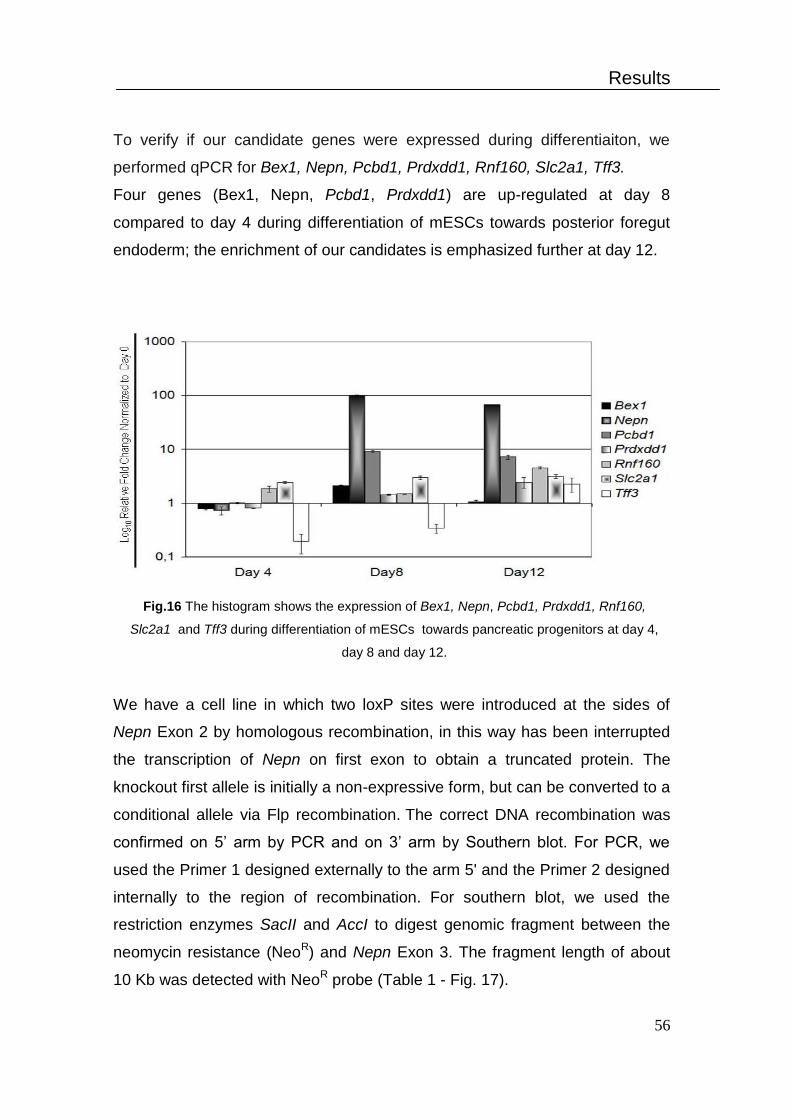
Results
56
To verify if our candidate genes were expressed during differentiaiton, we
performed qPCR for Bex1, Nepn, Pcbd1, Prdxdd1, Rnf160, Slc2a1, Tff3.
Four genes (Bex1, Nepn, Pcbd1, Prdxdd1) are up-regulated at day 8
compared to day 4 during differentiation of mESCs towards posterior foregut
endoderm; the enrichment of our candidates is emphasized further at day 12.
Fig.16 The histogram shows the expression of Bex1, Nepn, Pcbd1, Prdxdd1, Rnf160,
Slc2a1 and Tff3 during differentiation of mESCs towards pancreatic progenitors at day 4,
day 8 and day 12.
We have a cell line in which two loxP sites were introduced at the sides of
Nepn Exon 2 by homologous recombination, in this way has been interrupted
the transcription of Nepn on first exon to obtain a truncated protein. The
knockout first allele is initially a non-expressive form, but can be converted to a
conditional allele via Flp recombination. The correct DNA recombination was
confirmed on 5’ arm by PCR and on 3’ arm by Southern blot. For PCR, we
used the Primer 1 designed externally to the arm 5' and the Primer 2 designed
internally to the region of recombination. For southern blot, we used the
restriction enzymes SacII and AccI to digest genomic fragment between the
neomycin resistance (NeoR) and Nepn Exon 3. The fragment length of about
10 Kb was detected with NeoR probe (Table 1 - Fig. 17).
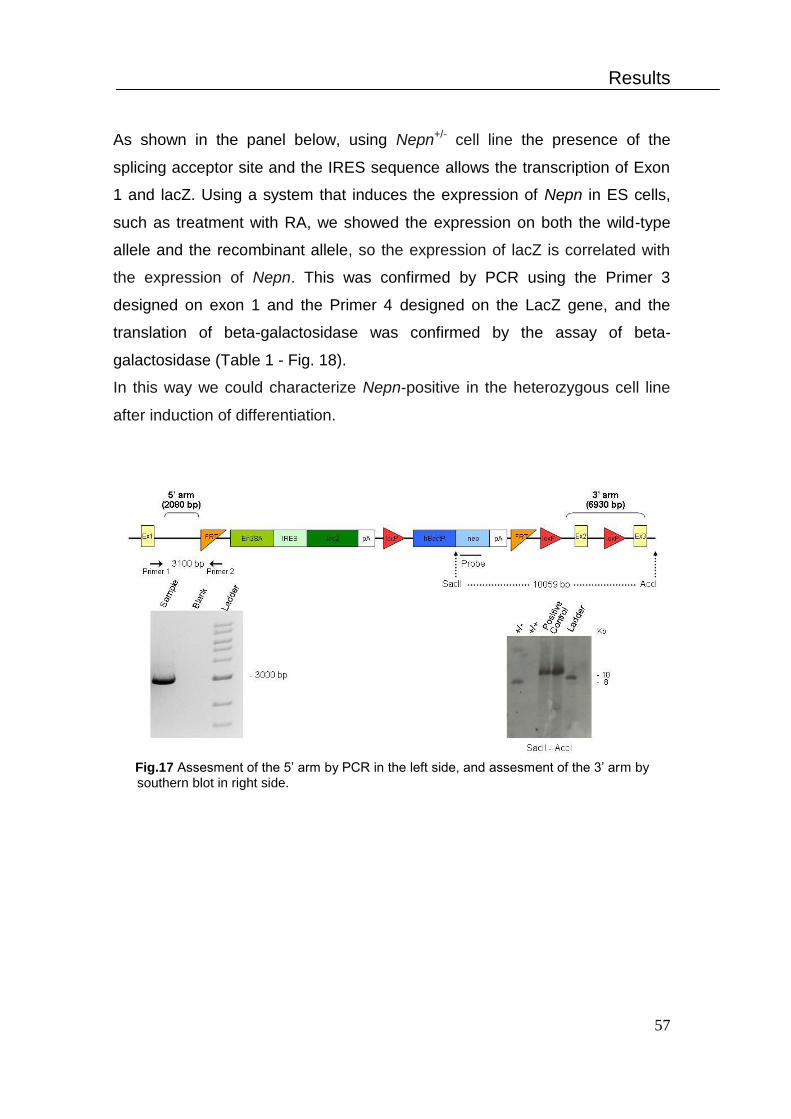
Results
57
As shown in the panel below, using Nepn+/- cell line the presence of the
splicing acceptor site and the IRES sequence allows the transcription of Exon
1 and lacZ. Using a system that induces the expression of Nepn in ES cells,
such as treatment with RA, we showed the expression on both the wild-type
allele and the recombinant allele, so the expression of lacZ is correlated with
the expression of Nepn. This was confirmed by PCR using the Primer 3
designed on exon 1 and the Primer 4 designed on the LacZ gene, and the
translation of beta-galactosidase was confirmed by the assay of beta-
galactosidase (Table 1 - Fig. 18).
In this way we could characterize Nepn-positive in the heterozygous cell line
after induction of differentiation.
Fig.17 Assesment of the 5’ arm by PCR in the left side, and assesment of the 3’ arm by
southern blot in right side.

Results
58
Fig.18 Expression of Nepn in the cell line Nepn+/-
.

Discussion
59
Discussion
The pace of development of molecular analytical techniques has been rapid in recent
years. High throughput methods such as DNA microarrays (“DNA chip technology”)
and proteomics have enormous potential for revolutionizing the study of molecular
events associated with physiological and pathological processes.
Although the technology has become increasingly sophisticated, the accuracy of the
results obtained is still largely influenced by the selection of appropriate study
material.
Tissues are composed of many different cell types, from which it is necessary to
obtain a pure sample of the cells of interest to acquire meaningful data.
In this way, the cell specific expression is masked, especially if the cell type of
interest represents only a small fraction of the entire sample, or if gene expression is
elevated or suppressed.
Many techniques have been used in attempts to isolate cell populations, including
cell culture studies, xenografts, flow cytometry, and various microdissection methods
such as laser capture microdissection (LCM).
We considered the cell population that forms the dorsal pancreatic bud at E10.5
because the aim of our work is based on identification of signature genes involved in
pancreas development.
To identify mouse dorsal pancreas bud at the stage E10.5, in which different
transcription factors are expresses, some unknown and others known as Pdx1 which
is tissue-specific; Pdx1 was used as a marker of the pancreas in the different
experiments such as immunofluorescence and LCM.
We used LCM technology to microdissect these cells from mouse embryos because
the size of the pancreas, at this stage, is reduced; it’s impossible to dissect surgically.
To pick out cells of a specific type from the midst of others in the same
microenviroment is a necessary step for subsequent molecular analysis. LCM
provides a good way to collect a well defined cell population from a heterogeneous
and complex tissue organization. The technique reported in this study provides a

Discussion
60
simple and rapid method that combine excellent tissue morphology with good
preservation of RNA.
Microarray require up to 10 µg of cellular RNA, and this is a barrier to the analysis of
gene expression in low density cell population. To overcome this barrier, we
performed the linear amplification of mRNA to increase the amount of product
expression.
After hybridization to GeneChip Mouse Gene 1.0 ST Array, to find new genes
expressed during pancreas development we compared the gene expression profile of
DPB with the gene expression profile of SwDPB. Among the candidate genes we
focused our attention on Nepn whose spatio-temporal expression was confirmed by
both qPCR and in situ hybridization.
Nephrocan, a novel member of the small leucine-rich repeat protein family, is an
inhibitor of TGF-beta/Smad signaling. Nepn is expressed in kidney in adult mice, and
during mouse embryogenesis, the expression was markedly increased at E11.5
when early kidney development takes place. In the adult mouse kidney, Nepn protein
was located in distal tubules and collecting ducts [90].
It was found that Nepn is highly enriched in endoderm by in situ hybridization at
E8.5–E9.0, Nepn expression level reaches the highest in the midgut. At E9.5, the
signal is retained but is down-regulated [91].
In situ hybridization for Nepn at E14.5 reveals epithelial expression at the pylorus.
Expression is more robust toward the stomach and is primarily localized to epithelial
cells closer to the basement membrane. Nephrocan expression at E16.5 is restricted
to the base of the developing epithelial glands in stomach and developing villi in
intestine [92].
Nepn expression increases in the Nkx2.2-/- pancreas at E12.5, E13.5, E14.5, and
E15.5, its expression is detectable in exocrine compartment and overlaps with the
elastase expression domain. In both wild type and Nkx2.2-/- pancreas the expression
of gene was already considerably lower at E15.5 when compared to E13.5, although
even at E15.5, Nepn levels were still significantly higher in the mutant pancreas
Discussion
61
compared to wild type. This would suggest that Nepn is transiently up-regulated in
the exocrine pancreas of the Nkx2.2-/- mice [93].
In future experiments we will propose the in vivo characterization of Nepn and its
possible role in the pancreas development. The heterozygous ESCs clone for Nepn
was microinjected into C57BL/6 blastocysts to generate chimeric mice, in particular
we generate 3 mice with a high index of chimerism.
To generate Nepn null mutant mice, heterozygous mutant mice will intercross, and
the genotypes of 30-day-old offspring will be determined by PCR.
At the same time, we propose the in vitro characterization of the cell population that
expresses Nepn during differentiation of mESCs towards the pancreatic progenitors.
In this case, we would like to sort Nepn-positive cells and define them by RNA-seq
and qPCR.
We would like to evaluate the potential of Nepn-/- ES cells to differentiate in
pancreatic progenitors compared to Nepn+/- cells.
Whereas preliminary data suggest that Nepn is not expressed in the adult pancreas,
we will induce damage to the adult pancreas in order to observe whether there is a
reactivation of the gene by RT-PCR and in situ hybridization. In this case, cells sorted
will be injected in the damaged organ to verify a possible facilitated regeneration.
Among our candidates Tff3 and Pcbd1 are enriched during differentiation of mESCs
towards the pancreatic progenitors. Mice homozygous for Tff3 results in impaired
intestinal mucosal healing and death from colitis after administration of dextran
sulfate sodium. Mice show poor epithelial regeneration after injury.
Mice homozygous for Pcbd1 display hyperphenylalaninemia, are mildly glucose
intolerant, and are predisposed to cataract formation.
For this reason we propose in vitro characterization of the cell population that
expresses them.
References
62
References
1. Nikolova et al. 2006. The vascular basement membrane: a niche for insulin gene
expression and Beta cell proliferation. Dev Cell 10:397-405.
2. Tam et al. 1992. Establishment and organization of germ layers in the gastrulating
mouse embryo. Ciba Found Symp 165: 27-41.
3. Shook et al. 2003. Mechanisms, mechanics and function of epithelial-mesenchymal
transitions in early development. Mech Dev. 120:1351-83.
4. Ang et al. 2004. A gene network establishing polarity in the early mouse embryo.
Semin Cell Dev Biol. 15:555-61.
5. Zorn et al. 2007. Molecular basis of vertebrate endoderm development. Int Rev Cytol.
259:49-111.
6. Lickert et al. 2002. Formation of multiple hearts in mice following deletion of beta-
catenin in the embryonic endoderm. Dev Cell 3:171-81.
7. Hart et al. 2002. Mixl1 is required for axial mesendoderm morphogenesis and
patterning in the murine embryo. Development 129:3597-608.
8. Ang et al. 1993. The formation and maintenance of the definitive endoderm lineage in
the mouse: involvement of HNF3/forkhead proteins. Development 119:1301-15.
9. Blum et al. 1992. Gastrulation in the mouse: the role of the homeobox gene
goosecoid. Cell 69:1097-106.
10. Bossard et al. 1998. GATA transcription factors as potentiators of gut endoderm
differentiation. Development 125:4909-17.
11. Kanai-Azuma et al. 2002. Depletion of definitive gut endoderm in Sox17-null mutant
mice. Development 129:2367-79.
12. Grapin-Botton et al. 2000. Endoderm development: from patterning to organogenesis.
Trends Genet. 16:124-30.
13. Lewis et al. 2006. Definitive endoderm of the mouse embryo: formation, cell fates,
and morphogenetic function. Dev Dyn. 235:2315-29.
14. Dessimoz et al. 2006. FGF signaling is necessary for establishing gut tube domains
along the anterior-posterior axis in vivo. Mech Dev. 123:42-55.
15. McLin et al. 2007. Repression of Wnt/beta-catenin signaling in the anterior endoderm
is essential for liver and pancreas development. Development 134:2207-17.
16. Ramalho-Santos et al. 2000. Hedgehog signals regulate multiple aspects of
gastrointestinal development. Development 127:2763-72.

References
63
17. Martin et al. 2005. Dorsal pancreas agenesis in retinoic acid deficient Raldh2 mutant
mice. Dev Biol. 284:399-411.
18. Molotkov et al. 2005. Retinoic acid generated by Raldh2 in mesoderm is required for
mouse dorsal endodermal pancreas development. Dev Dyn. 232:950-7.
19. Wang et al. 2006. Retinoic acid regulates morphogenesis and patterning of posterior
foregut derivatives. Dev Biol. 297:433-45.
20. Bayha E et al. 2009. Retinoic acid signalling organizes endodermal organ
specification along the entire anteroposterior axis. PLoS One 4:e5845.
21. Ostrom M et al. 2008. Retinoic acid promotes the generation of pancreatic endocrine
progenitor cells and their further differentiation into beta-cells. PLoS One 3:e2841.
22. Thomas MK et al. 2001. Hedgehog signalling regulation of homeodomain protein islet
duodenum homeobox-1 expression in pancreatic beta-cells. Endocrinology 142:1033-
1040.
23. Lau J et al. 2010. Hedgehog signalling in pancreas epithelium regulates embryonic
organ formation and adult beta-cell function. Diabetes 59: 1211-1221.
24. Lammert E et al. 2003. Role of VEGF-A in vascularization of pancreatic islets. Curr
Biol 13:1070-1074.
25. Nikolova G et al. 2006. The vascular basement membrane: a niche for insulin gene
expression and Beta cell proliferation. Dev Cell 10:397-405.
26. Jacquemin P et al. 2006. An endothelial-mesenchymal relay pathway regulates early
phases of pancreas development. Dev Biol 290: 189-199.
27. Deutsch G et al. 2001. A bipotential precursor population for pancreas and liver within
the embryonic endoderm. Development 128:871-881.
28. Spence JR et al. 2009. Sox17 regulates organ lineage segregation of ventral foregut
progenitor cells. Dev Cell 17:62-74.
29. Herrera PL et al. 2000. Adult insulin- and glucagon-producing cells differentiate from
two independent cell lineages. Development 127:2317-2322.
30. Zhou Q et al. 2007. A multipotent progenitor domain guides pancreatic
organogenesis. Dev Cell 13:103-114.
31. Puri S et al. 2007. Dynamics of embryonic pancreas development using real-time
imaging. Dev Biol 306:82-93.
32. Stanger et al. 2007. Organ size is limited by the number of embryonic progenitor cells
in the pancreas but not the liver. Nature 445:886-891.
References
64
33. Conlon I et al. 1999. Size control in animal development. Cell. 96:235-244.
34. Gu G et al. 2002. Direct evidence for the pancreatic lineage: NGN3+ cells are islet
progenitors and are distinct from duct progenitors. Development 129:2447-2457.
35. Holland AM et al. 2002. Experimental control of pancreatic development and
maintenance. Proc Natl Acad Sci USA 99:12236-12241.
36. Hale MA et al. 2005. The homeodomain protein PDX1 is required at mid-pancreatic
development for the formation of the exocrine pancreas. Dev Biol 286:225-237.
37. Liu Y et al. 2001. DNA binding and transcriptional activation by a
PDX1.PBX1b.MEIS2b trimer and cooperation with a pancreas- specific basic helix-
loop-helix complex. J Bio Chem 276:17985–17993.
38. Gao N et al. 2008. Dynamic regulation of Pdx1 enhancers by Foxa1 and Foxa2 is
essential for pancreas. Genes Dev 22:3435–3448.
39. Offield MF et al. 1996. PDX-1 is required for pancreatic outgrowth and differentiation
of the rostral duodenum. Development 122:983–995.
40. Kim SK et al. 1997. Notochord to endoderm signaling is required for pancreas
development. Development 124:4243-52.
41. Kawaguchi Y et al. 2002. The role of the transcriptional regulator Ptf1a in converting
intestinal to pancreatic progenitors. Nat Genet 32:128-134.
42. Masui T et al. 2010. Replacement of Rbpj with Rbpjl in the PTF1 complex controls the
final maturation of pancreatic acinar cells. Gastroenterology 139:270-280.
43. Lynn FC et al. 2007. Sox9 coordinates a transcriptional network in pancreatic
progenitor cells. Proc Natl Acad Sci USA 104:10500-10505.
44. Haumaitre C et al. 2005. Lack of TCF2/vHNF1 in mice leads to pancreas agenesis.
Proc Natl Acad Sci USA 102:1490-1495.
45. Poll AV et al. 2006. A vHNF1/TCF2-HNF6 cascade regulates the transcription factor
network that controls generation of pancreatic precursor cells. Diabetes 55:61-69.
46. Watt AJ et al. 2007. Development of the mammalian liver and ventral pancreas is
dependent on GATA4. BMC Dev Biol 7:37.
47. Harrison KA et al. 1999. Pancreas dorsal lobe agenesis and abnormal islets of
Langerhans in Hlxb9-deficient mice. Nat Genet 23:71-75.
48. Lee JC et al. 2001. Regulation of the pancreatic pro-endocrine gene neurogenin3.
Diabetes 50:928-36.

References
65
49. Apelqvist A et al. 1997. Sonic hedgehog directs specialised mesoderm differentiation
in the intestine and pancreas. Curr Biol 7:801-804.
50. Jensen J et al. 2000b. Control of endodermal endocrine development by Hes-1. Nat
Genet 24:36-44.
51. Fujikura J et al. 2006. Notch/ Rbp-j signaling prevents premature endocrine and
ductal cell differentiation in the pancreas. Cell Metab 3:59-65.
52. Sumazaki R et al. 2004. Conversion of biliary system to pancreatic tissue in Hes1-
deficient mice. Nat Genet 36:83-87.
53. Heller et al. 2004. The role of Brn4/Pou3f4 and Pax6 in forming the pancreatic
glucagon cell identity. Dev Biol 268(1): 123-34.
54. Bhushan et al. 2001. Fgf10 is essential for maintaining the proliferative capacity of
epithelial progenitor cells during early pancreatic organogenesis. Development
128:5109-5117.
55. Revest et al. 2001. Development of the thymus requires signaling through the
fibroblast growth factor receptor R2-IIIb. J Immunol 167:1954-1961.
56. Hart A et al. 2003. Fgf10 maintains notch activation, stimulates proliferation, and
blocks differentiation of pancreatic epithelial cells. Dev Dyn 228:185-193.
57. Norgaard et al. 2003. FGF10 signaling maintains the pancreatic progenitor cell state
revealing a novel role of Notch in organ development. Dev Biol 264:323-338.
58. Ahnfelt-Ronne J et al. 2010. Mesenchymal bone morphogenetic protein signaling is
required for normal pancreas development. Diabetes 59:1948-1956.
59. Furukawa et al. 1995. Expression of immunoreactive activin A in fetal rat pancreas.
Endocr J 42(1): p. 63-8.
60. Miralles et al. 1998. Follistatin regulates the relative proportions of endocrine versus
exocrine tissue during pancreatic development. Development 125(6): p. 1017-24.
61. Ritvos et al. 1995. Activin disrupts epithelial branching morphogenesis in developing
glandular organs of the mouse. Mech Dev 1995. 50(2-3): p. 229-45.
62. Rukstalis et al. 2007. Snail2, a mediator of epithelial-mesenchymal transitions,
expressed in progenitor cells of the developing endocrine pancreas. Gene Expr
Patterns 7:471-479.
63. Bouwens et al.2005. Regulation of pancreatic beta-cell mass. Physiol Rev 85:1255-
1270.
References
66
64. Gradwohl G et al. 2000. Neurogenin3 is required for the development of the four
endocrine cell lineages of the pancreas. Proc Natl Acad Sci USA 97:1607-1611.
65. Naya FJ et al. 1997. Diabetes, defective pancreatic morphogenesis, and abnormal
enteroendocrine differentiation in BETA2/neuroD-deficient mice. Genes Dev 11:2323-
2334.
66. Collombat et al. 2003. Opposing actions of Arx and Pax4 in endocrine pancreas
development. Genes Dev 17:2591-2603.
67. Zhang C et al. 2005. MafA is a key regulator of glucose-stimulated insulin secretion.
Mol Cell Biol 25:4969-4976.
68. Artner I et al. 2006. MafB: an activator of the glucagon gene expressed in developing
islet alpha- and beta-cells. Diabetes 55:297-304.
69. Gu et al. 2010. Pancreatic beta cells require NeuroD to achieve and maintain
functionalmaturity. Cell Metab 11:298-310.
70. Jacquemin et al. 2003. The Onecut transcription factor HNF-6 (OC-1) is required for
timely specification of the pancreas and acts upstream of Pdx-1 in the specification
cascade. Dev Biol 258:105-116.
71. Seymour PA et al. 2007. SOX9 is required for maintenance of the pancreatic
progenitor cell pool. Proc Natl Acad Sci USA 104:1865-1870.
72. Murtaugh LC et al. 2005. Beta-catenin is essential for pancreatic acinar but not islet
development. Development 132:4663-4674.
73. Piper K et al. 2004. Beta cell differentiation during early human pancreas
development. J Endocrinol 181:11–23.
74. Jeon J et al. 2009. Endocrine cell clustering during human pancreas development. J
Histochem Cytochem 57:811–824.
75. Teta M et al. 2005. Very slow turnover of beta-cells in aged adult mice. Diabetes
54:2557-2567.
76. Xu X et al. 2008. Beta cells can be generated from endogenous progenitors in injured
adult mouse pancreas. Cell 132:197-207.
77. Minami K et al. 2005. Lineage tracing and characterization of insulin-secreting cells
generated from adult pancreatic acinar cells. Proc Natl Acad Sci USA 102:15116-
15121.
78. Jensen JN et al. 2005. Recapitulation of elements of embryonic development in adult
mouse pancreatic regeneration. Gastroenterology 128:728-741.

References
67
79. Thorel F et al. 2010. Conversion of adult pancreatic alpha-cells to beta-cells after
extreme betacell loss. Nature 464:1149-1154.
80. Murry et al. 2008. Differentiation of embryonic stem cells to clinically relevant
populations: lessons from embryonic development. Cell, 132(4): p. 661-80.
81. Evans et al. 1981. Establishment in culture of pluripotential cells from mouse
embryos. Nature, 292(5819): p. 154-6.
82. McLean et al. 2007. Activin a efficiently specifies definitive endoderm from human
embryonic stem cells only when phosphatidylinositol 3-kinase signaling is
suppressed. Stem Cells, 25(1): p. 29-38.
83. D'Amour et al. 2006. Production of pancreatic hormoneexpressing endocrine cells
from human embryonic stem cells. Nat Biotechnol. 24(11): p. 1392-401.
84. Bevilacqua et al. 2010. Maintaining RNA integrity in a homogeneous population of
mammary epithelial cells isolated by Laser Capture Microdissection. BMC Cell
Biology 11:95
85. Livak et al. 2001. Analysis of Relative Gene Expression Data Using Real-Time
Quantitative PCR and the 2-Ct. Methods 25:402-408.
86. Little et al. 2007. A high-resolution anatomical ontology of the developing murine
genitourinary tract. Gene Expr. Patterns 7:680-699.
87. Mortensen et al. 1992. Production of homozygous mutant ES cells with a single
targeting construct. Mol. Cell. Biol. 12:2391-2395.
88. Yamanaka et al. 2000. Essential role of NAT1/p97/DAP5 in embryonic differentiation
and the retinoic acid pathway. EMBO J. 19:5533-5541.
89. Fang-Xu Jiang et al. 2012. Directed Differentiation of Embryonic Stem Cells Allows
Exploration of Novel Transcription Factor Genes for Pancreas Development. Stem
Cell Rev and Rep. 8:803-812.
90. Yoshiyuki Mochida et al. 2006. Nephrocan, a Novel Member of the Small Leucine-rich
Repeat Protein Family, Is an Inhibitor of Transforming Growth Factor-Signaling. The
journal of biological chemistry 281: 36044–36051.
91. Juan Hou et al. 2007. A systematic screen for genes expressed in definitive
endoderm by Serial Analysis of Gene Expression (SAGE). BMC Developmental
Biology 7:92.

References
68
92. Xing Li et al. 2009. Dynamic Patterning at the Pylorus: Formation of an Epithelial
Intestine–Stomach Boundary in Late Fetal Life. Developmental dynamics 238:3205–
3217.
93. Keith R Anderson et al. 2009. Identification of known and novel pancreas genes
expressed downstream of Nkx2.2 during development. BMC Developmental Biology
9:65.

69