Embed Size (px)
Citation preview
Università degli Studi di Napoli Federico II Facoltà di Ingegneria
Giusy Terracciano
YIELD AND ULTIMATE ROTATIONS OF BEAM-TO-COLUMN END-PLATE CONNECTIONS
Tesi di Dottorato XXV ciclo
Il Coordinatore Prof. Ing. Luciano Rosati
Tutor: Prof. Ing. Raffaele Landolfo
Co-tutors: Dr. Ing. Gaetano Della Corte, Dr. Ing. Gianmaria Di Lorenzo
Dottorato di Ricerca in Ingegneria delle Costruzioni

i
TABLE OF CONTENTS
i LIST OF FIGURES ......................................................................................... v LIST OF TABLES ........................................................................................... xi ABSTRACT ..................................................................................................... xv ACKNOWLEDGMENTS ......................................................................... xvii ABOUT THE AUTHOR ............................................................................. xix MOTIVATIONS AND OBJECTIVES ....................................................... 1 1 INTRODUCTION ...................................................................................... 3
1.1 Displacement based design for moment resisting frame steel structures ........................................................................................................ 3 1.2 Joint Modelling: the component method ............................................ 4
1.2.1 Basic principles and components of joints ................................. 4 1.2.2 Prediction of flexural resistance and initial rotational stiffness . .......................................................................................................... 6 1.2.1 Implementation of Eurocode 3 component method within Mathcad .................................................................................................... 12
1.3 Moment – rotation curve representation .......................................... 13 1.4 Definitions of limit state rotations ..................................................... 14 1.5 Analysis methodology .......................................................................... 15
2 EXPERIMENTAL DATA COLLECTION ......................................... 17 2.1 Extended end-plate connections ........................................................ 17
2.1.1 Tests by Ghobarah et al. (1990) .................................................. 17 2.1.1.1 Description of specimens and test setup ......................... 17 2.1.1.2 Experimental results ........................................................... 20
2.1.1.2.1 Specimen A-1 ............................................................... 20 2.1.1.2.2 Specimen A-2 ............................................................... 21 2.1.1.2.3 Specimen A-3 ............................................................... 22 2.1.1.2.4 Specimen A-4 ............................................................... 24 2.1.1.2.5 Specimen A-5 ............................................................... 25
2.1.2 Test by Sumner and Murray (2002) ........................................... 26 2.1.2.1 Description of specimen and test set up .......................... 26 2.1.2.2 Experimental results ........................................................... 27
2.1.3 Tests by Nogueiro et al. (2006) ................................................... 28
ii
2.1.3.1 Description of specimens and test set up ........................ 28 2.1.3.2 Experimental results ........................................................... 31
2.1.3.2.1 Specimens J-1 ............................................................... 31 2.1.3.2.2 Specimens J-3 ............................................................... 33
2.1.4 Tests by Shi et al. (2007 a) ........................................................... 35 2.1.4.1 Description of specimens and test set up ........................ 35 2.1.4.2 Experimental results ........................................................... 38
2.1.4.2.1 Specimen EPC-1 .......................................................... 38 2.1.4.2.2 Specimen EPC-2 .......................................................... 39 2.1.4.2.3 Specimen EPC-3 .......................................................... 41 2.1.4.2.4 Specimen EPC-4 .......................................................... 43 2.1.4.2.5 Specimen EPC-5 .......................................................... 45
2.1.5 Tests by Shi et al. (2007 b) ........................................................... 47 2.1.5.1 Description of specimens and test set up ........................ 47 2.1.5.2 Experimental results ........................................................... 49
2.1.5.2.1 Specimen JD2 ............................................................... 49 2.1.5.2.2 Specimen JD3 ............................................................... 51 2.1.5.2.3 Specimen JD4 ............................................................... 52 2.1.5.2.4 Specimen JD5 ............................................................... 53 2.1.5.2.5 Specimen JD6 ............................................................... 54 2.1.5.2.6 Specimen JD7 ............................................................... 55 2.1.5.2.7 Specimen JD8 ............................................................... 56
2.2 Flush end-plate connections ............................................................... 57 2.2.1 Tests by Broderick and Thomson (2002) ................................. 57
2.2.1.1 Description of specimens and test setup ......................... 57 2.2.1.2 Experimental results ........................................................... 58
2.2.1.2.1 Specimen EP1 .............................................................. 58 2.2.1.2.2 Specimen EP2 .............................................................. 59 2.2.1.2.3 Specimens EP3 and EP4 ............................................ 60 2.2.1.2.4 Specimen EP5 .............................................................. 61 2.2.1.2.5 Specimens EP6, EP7 and EP8 .................................. 61
2.2.2 Test by da Silva et al. (2004) ........................................................ 63 2.2.2.1 Description of specimens and test setup ......................... 63 2.2.2.2 Experimental results ........................................................... 65
2.2.3 Tests by Broderick and Thomson (2005) ................................. 66 2.2.3.1 Description of specimens and test setup ......................... 66 2.2.3.2 Experimental results ........................................................... 67
2.2.3.2.1 Specimens FP1 and FP2 ............................................. 67 2.2.3.2.2 Specimens FP3 and FP4 ............................................. 69
iii
2.2.3.2.3 Specimens FP5 and FP6 ............................................. 70 2.2.3.2.4 Specimens FP7 and FP8 ............................................. 72
2.2.4 Test by Shi et al. (2007) ................................................................ 73 2.2.4.1 Description of specimen and test setup ........................... 73 2.2.4.2 Experimental results ........................................................... 75
2.3 Digital database ..................................................................................... 76 3 THEORETICAL PREDICTIONS AND COMPARISON WITH EXPERIMENTAL RESULTS ..................................................................... 79
3.1 Extended end-plate connections ........................................................ 79 3.1.1 Tests by Ghobarah et al. (1990) .................................................. 79
3.1.1.1 Specimen A-1 ....................................................................... 79 3.1.1.2 Specimen A-2 ....................................................................... 82 3.1.1.3 Specimen A-3 ....................................................................... 85 3.1.1.4 Specimen A-4 ....................................................................... 88 3.1.1.5 Specimen A-5 ....................................................................... 90
3.1.2 Test by Sumner and Murray (2002) ........................................... 93 3.1.3 Tests by Nogueiro et al. (2006) ................................................... 95
3.1.3.1 Specimens J1 ........................................................................ 95 3.1.3.2 Specimens J3 ........................................................................ 97
3.1.4 Tests by Shi et al. (2007 a) ........................................................... 99 3.1.4.1 Specimen EPC-1 ................................................................. 99 3.1.4.2 Specimen EPC-2 ............................................................... 102 3.1.4.3 Specimen EPC-3 ............................................................... 105 3.1.4.4 Specimen EPC-4 ............................................................... 107 3.1.4.5 Specimen EPC-5 ............................................................... 110
3.1.5 Tests by Shi et al. (2007 b) ......................................................... 112 3.1.5.1 Specimen JD2 .................................................................... 112 3.1.5.2 Specimen JD3 .................................................................... 115 3.1.5.3 Specimen JD4 .................................................................... 118 3.1.5.4 Specimen JD5 .................................................................... 121 3.1.5.5 Specimen JD6 .................................................................... 123 3.1.5.6 Specimen JD7 .................................................................... 126 3.1.5.7 Specimen JD8 .................................................................... 128
3.2 Flush end-plate connections ............................................................. 131 3.2.1 Tests by Broderick and Thomson (2002) ............................... 131
3.2.1.1 Specimen EP1 .................................................................... 131 3.2.1.2 Specimen EP2 .................................................................... 133 3.2.1.3 Specimens EP3 and EP4 .................................................. 135 3.2.1.4 Specimen EP5 .................................................................... 137
iv
3.2.1.5 Specimen EP6, EP7 and EP8.......................................... 139 3.2.2 Test by da Silva et al. (2004) ...................................................... 141 3.2.3 Tests by Broderick and Thomson (2005) ............................... 143
3.2.3.1 Specimens FP1 and FP2................................................... 143 3.2.3.2 Specimens FP3 and FP4................................................... 146 3.2.3.3 Specimens FP5 and FP6................................................... 148 3.2.3.4 Specimens FP7 and FP8................................................... 151
3.2.4 Test by Shi et al. (2007) .............................................................. 153 3.3 Concluding remarks ........................................................................... 155
4 ANALYTICAL STUDY OF YIELD ROTATIONS ........................ 161 4.1 Analytical equations ............................................................................ 161
4.1.1 Basic assumptions ...................................................................... 161 4.1.2 Bolt failure ................................................................................... 164 4.1.3 End-plate failure ......................................................................... 165 4.1.4 Column flange failure ................................................................ 166 4.1.5 Beam failure ................................................................................ 167 4.1.6 Analytical equations accuracy ................................................... 167
4.2 Parametric analyses and design tools ............................................... 168 4.2.1 Basic assumptions ...................................................................... 168 4.2.2 Design tools ................................................................................ 170 4.2.3 Comparison of different joint configurations ........................ 175
5 ULTIMATE ROTATIONS ................................................................... 177 5.1 Analysis criteria ................................................................................... 177 5.2 Plastic rotation capacity of extended end-plate connections ....... 178 5.3 Concluding Remarks .......................................................................... 182
6 CONCLUSIONS ..................................................................................... 185 REFERENCES ............................................................................................. 189 APPENDIX A .............................................................................................. 193 APPENDIX B ............................................................................................... 205
v
LIST OF FIGURES
Figure 1.1: Components of end-plate beam-to-column joints ................... 5 Figure 1.2: Eurocode 3 mechanical models ................................................... 6 Figure 1.3: Yield line patterns and effective length of the end-plate T-
stub for the first bolt row in tension .......................................... 7 Figure 1.4: Yield line patterns and effective length of the column flange
T-stub for the first bolt row in tension ...................................... 7 Figure 1.5: T-Stub mechanisms and design resistance for each failure
mode ............................................................................................... 8 Figure 1.6: Design resistance of column web in tension ............................. 8 Figure 1.7: Design resistance of beam web in tension ................................. 9 Figure 1.8: Design resistance of column web in compression ................... 9 Figure 1.9: Design resistance of beam flange and web in compression .. 10 Figure 1.10: Design resistance of unstiffened column web panel in shear
....................................................................................................... 10 Figure 1.11: Additional resistance of the column web panel in shear for
column web transverse stiffeners ............................................. 10 Figure 1.12: Yield rotation of end-plate connections ................................. 14 Figure 1.13: Rotation capacity and ultimate rotation ................................. 15 Figure 2.1: Details of specimens ................................................................... 18 Figure 2.2: a) Test specimen, and b) test set-up .......................................... 19 Figure 2.3: Loading protocol ......................................................................... 20 Figure 2.4: a) Beam load versus beam tip displacement curve and b)
failure mode for A-1 ................................................................... 21 Figure 2.5: Beam load versus beam tip displacement curve and failure
mode for A-2 ............................................................................... 22 Figure 2.6: Beam load versus beam tip displacement curve and failure
mode for A-3 ............................................................................... 23 Figure 2.7: Beam load versus beam tip displacement curve and failure
mode for A-4 ............................................................................... 24 Figure 2.8: a) Beam load versus beam tip displacement curve and b)
failure mode for A-5 ................................................................... 25 Figure 2.9: Test set up and loading protocol ............................................... 27
vi
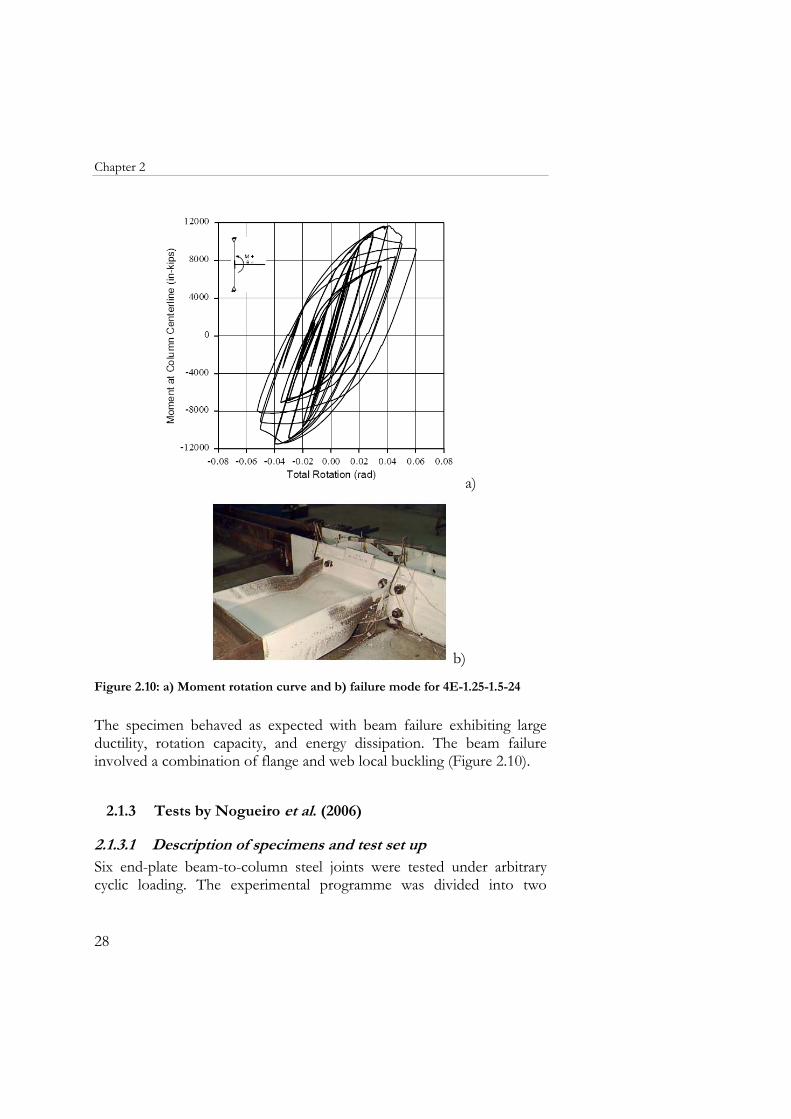
Figure 2.10: a) Moment rotation curve and b) failure mode for 4E-1.25-1.5-24 ............................................................................................ 28
Figure 2.11: Details of the joint for Group 1 .............................................. 29 Figure 2.12: Details of the joint for Group 3 .............................................. 29 Figure 2.13: Test set-up .................................................................................. 30 Figure 2.14: Results of the J-1.1 monotonic test ........................................ 31 Figure 2.15: a) Final shear deformation of the column web panel and b)
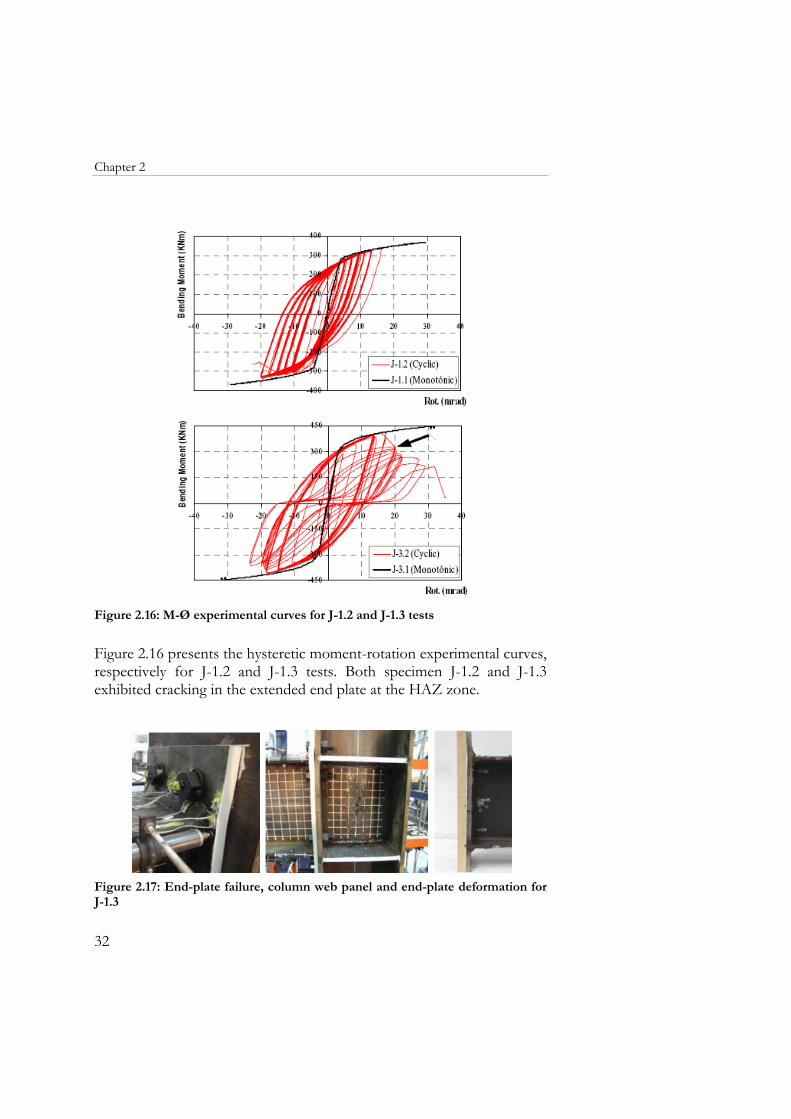
end-plate fracture ........................................................................ 31 Figure 2.16: M-Ø experimental curves for J-1.2 and J-1.3 tests ............... 32 Figure 2.17: End-plate failure, column web panel and end-plate
deformation for J-1.3 .................................................................. 32 Figure 2.18: Results of the J-3.1 monotonic test ........................................ 33 Figure 2.19: Moment-rotation curves for a) J-3.2 and b) J-3.3 tests ........ 34 Figure 2.20: Column web panel, end-plate and bolt failure for J-3.2 ...... 35 Figure 2.21: Column web panel, beam flange failure and end-plate
deformation for J-3.3 .................................................................. 35 Figure 2.22: Connection details ..................................................................... 36 Figure 2.23: Test setup ................................................................................... 37 Figure 2.24: Moment-rotation curve for EPC-1 ......................................... 38 Figure 2.25: Failure mode for EPC-1 ........................................................... 38 Figure 2.26: a) Moment-shearing rotation and b) moment–gap rotation
for EPC-1 ..................................................................................... 39 Figure 2.27: Moment-rotation curve for EPC-2 ......................................... 40 Figure 2.28: Failure mode for EPC-2 ........................................................... 40 Figure 2.29: a) Moment-shearing rotation and b) moment–gap rotation
for EPC-2 ..................................................................................... 41 Figure 2.30: Moment-rotation curve for EPC-3 ......................................... 42 Figure 2.31: Failure mode for EPC-3 ........................................................... 42 Figure 2.32: a) Moment-shearing rotation and b) moment gap rotation
for EPC-3 ..................................................................................... 42 Figure 2.33: Moment rotation curve for EPC-4 ......................................... 43 Figure 2.34: Failure mode for EPC-4 ........................................................... 44 Figure 2.35: a) Moment--shearing rotation (b) and moment – gap
rotation for EPC-4 ...................................................................... 44 Figure 2.36: Moment-rotation curve for EPC-5 ......................................... 45 Figure 2.37: Moment-rotation curve and failure mode for EPC-5 .......... 45 Figure 2.38: a) Moment-shearing rotation and b) moment–gap rotation
for EPC-5 ..................................................................................... 46 Figure 2.39: Connection details ..................................................................... 47
vii
Figure 2.40: Test setup and loading arrangement ....................................... 49 Figure 2.41: a) Moment–rotation curve, b) moment–shearing rotation
curve, c) moment–gap rotation curve and d) failure mode for JD2 ................................................................................................ 50
Figure 2.42: a) Moment–rotation curve, b) moment–shearing rotation curve, c) moment–gap rotation curve and d) failure mode for JD3 ................................................................................................ 51
Figure 2.43: a) Moment–rotation, b) Moment–shearing rotation curve, c) Moment–gap rotation curve and d) failure mode for JD4 ... 52
Figure 2.44: a) Moment–rotation curve, b) Moment–shearing rotation b) curve, c) Moment–gap rotation curve and d) failure mode for JD5 ................................................................................................ 53
Figure 2.45: a) Moment–rotation curve, b) Moment–shearing rotation curve, c) Moment–gap rotation curve and d) failure mode for JD6 ................................................................................................ 54
Figure 2.46:a) Moment–rotation curve b) Moment–shearing rotation curve, c) Moment–gap rotation curve and d) failure mode for JD7 ................................................................................................ 55
Figure 2.47: a) Moment–rotation curve, b) moment–shearing rotation curve, c) moment–gap rotation curve and d) failure mode for JD8 ................................................................................................ 56
Figure 2.48: a) Connection details and b) test setup .................................. 58 Figure 2.49: Moment rotation curve for EP2 ............................................. 59 Figure 2.50: Moment rotation curve for EP3 ............................................. 60 Figure 2.51: Moment rotation curve for EP4 ............................................. 60 Figure 2.52: Moment rotation curve for EP6 ............................................. 62 Figure 2.53: Moment rotation curve for EP7 ............................................. 62 Figure 2.54: Moment rotation curve for EP8 ............................................. 63 Figure 2.55: Layout of the joint ..................................................................... 64 Figure 2.56: Experimental test setup ............................................................ 65 Figure 2.57: Moment - rotation curve for FE1 ........................................... 65 Figure 2.58: a) Connection details and b) test setup .................................. 66 Figure 2.59: Moment rotation curve for FP1 .............................................. 68 Figure 2.60: Moment rotation curve for FP2 .............................................. 68 Figure 2.61: Moment rotation curve for FP3 .............................................. 70 Figure 2.62: Moment rotation curve for FP4 .............................................. 70 Figure 2.63: Moment rotation curve for FP5 .............................................. 71 Figure 2.64: Moment rotation curve for FP6 .............................................. 71 Figure 2.65: Moment rotation curve for FP7 .............................................. 72
viii
Figure 2.66: Moment rotation curve for FP8 .............................................. 73 Figure 2.67: Details of specimen JD1 ........................................................... 74 Figure 2.68: Test setup ................................................................................... 75 Figure 2.69: a) Moment–rotation curve, b) moment–shearing rotation
curve, c) moment–gap rotation curve and d) failure mode for JD1 ................................................................................................ 76
Figure 2.70: The steel joints digital database ............................................... 77 Figure 2.71: The digital database structure .................................................. 77 Figure 3.1: Classification by strength and stiffness for A-1 ...................... 82 Figure 3.2: Classification by strength and stiffness for A-2 ...................... 85 Figure 3.3: Classification by strength and stiffness for A-3 ...................... 87 Figure 3.4: Classification by strength and stiffness for A-4 ...................... 90 Figure 3.5: Classification of specimen A-5 .................................................. 92 Figure 3.6: Classification by strength and stiffness for 4E-1.25-1.5-24 ... 95 Figure 3.7: Classification by strength and stiffness for EPC-1 ............... 102 Figure 3.8: Classification by strength and stiffness EPC-2 ..................... 104 Figure 3.9: Classification by strength and stiffness EPC-3 ..................... 107 Figure 3.10: Classification by strength and stiffness EPC-4 ................... 109 Figure 3.11: Classification by strength and stiffness EPC-5 ................... 111 Figure 3.12: Classification by strength and stiffness for JD2.................. 114 Figure 3.13: Classification by strength and stiffness for JD3.................. 117 Figure 3.14: Classification by strength and stiffness for JD4.................. 120 Figure 3.15: Classification by strength and stiffness for JD5.................. 123 Figure 3.16: Classification by strength and stiffness for JD6.................. 125 Figure 3.17: Classification by strength and stiffness for JD7.................. 128 Figure 3.18: Classification by strength and stiffness for JD8.................. 130 Figure 3.19: Classification by strength and stiffness for EP2 ................. 134 Figure 3.20: Classification by strength and stiffness for EP3 ................. 136 Figure 3.21: Classification by strength and stiffness for EP4 ................. 137 Figure 3.22: Classification by strength and stiffness for EP6 ................. 140 Figure 3.23: Classification by strength and stiffness for EP7 ................. 141 Figure 3.24: Classification by strength and stiffness for EP8 ................. 141 Figure 3.25: Classification by strength and stiffness for FE1 ................. 143 Figure 3.26: Classification by strength and stiffness for FP1 ................. 145 Figure 3.27: Classification by strength and stiffness for FP2 ................. 146 Figure 3.28: Classification by strength and stiffness for FP3 ................. 148 Figure 3.29: Classification by strength and stiffness for FP4 ................. 148 Figure 3.30: Classification by strength and stiffness for FP5 ................. 150 Figure 3.31: Classification by strength and stiffness for FP6 ................. 150
ix
Figure 3.32: Classification by strength and stiffness for FP7 ................. 152 Figure 3.33: Classification by strength and stiffness for FP8 ................. 153 Figure 3.34: Classification by strength and stiffness for JD1 .................. 155 Figure 3.35: Theoretical to experimental ratios of the moment resistance
for extended end-plate joints ................................................... 157 Figure 3.36: Theoretical to experimental ratios of the initial stiffness for
extended end-plate joints ......................................................... 157 Figure 3.37: Theoretical to experimental ratios of the yield rotation for
extended end-plate joints ......................................................... 158 Figure 3.38: Theoretical to experimental ratios of the moment resistance
for flush end-plate joints .......................................................... 159 Figure 3.39: Theoretical to experimental ratios of the initial stiffness for
flush end-plate joints ................................................................ 159 Figure 3.40: Theoretical to experimental ratios of yield rotation for flush
end-plate joints .......................................................................... 159 Figure 4.1: Joint mechanical modelling ...................................................... 162 Figure 4.2: Basic joint components and assumptions .............................. 163 Figure 4.3: Accuracy of the analytical equations ....................................... 168 Figure 4.4: Analyzed joint configurations – a) Flush end-plate
connections, b) Extended end-plate connections ................ 169 Figure 4.5: Basic assumptions and arrangements for a) flush end-plate
and b) extended end-plate connections ................................. 170 Figure 4.6: Normalized charts ..................................................................... 171 Figure 4.7: Use of normalized charts .......................................................... 172 Figure 4.8: a) Normalized stiffness b) normalized resistance and c) yield
rotation of extended end-plate connections (column shape: HEM 280; beam shape: IPE 550; steel grade S275; bolt grade 8.8) ............................................................................................... 173
Figure 4.9: a) Normalized stiffness b) normalized resistance and c) yield rotation of extended end-plate connections (column shape: HEM 280; beam shape: IPE 550; steel grade S275; bolt grade 8.8) ............................................................................................... 174
Figure 4.10: Failure modes for an extended end-plate joint (column shape: HEM 280; beam shape: IPE 550; steel grade S275; bolt grade 8.8) ............................................................................ 174
Figure 4.11: Comparison between different joint configurations .......... 176 Figure 5.1: Analysis criteria for rotation capacity ..................................... 178 Figure 5.2: Plastic rotation capacities for Ghobarah et al. (1990)
specimens ................................................................................... 179
x
Figure 5.3: Plastic rotation capacities for specimen 4E-1.25-1.5-24 tested by Sumner and Murray (2002) ................................................ 180
Figure 5.4: Plastic rotation capacities for Shi et al. (2007a) specimens.. 181 Figure 5.5: Plastic rotation capacities for Shi et al. (2007b) specimens . 182
xi
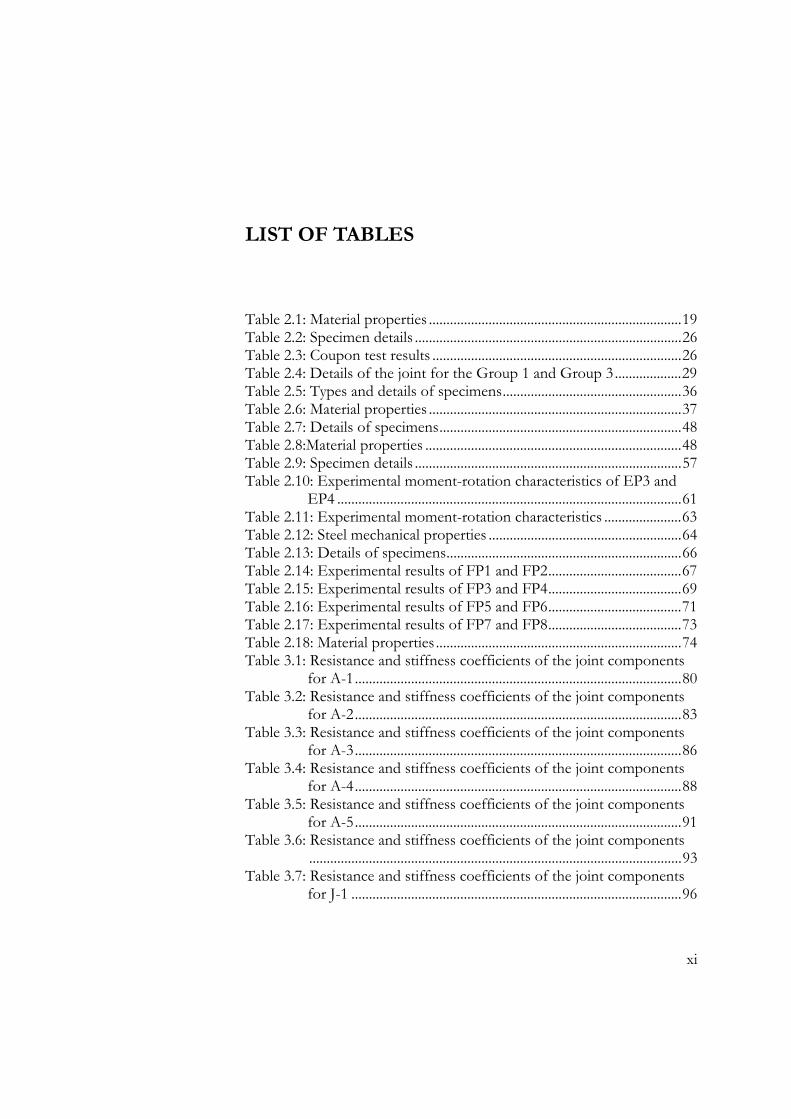
LIST OF TABLES
Table 2.1: Material properties ........................................................................ 19 Table 2.2: Specimen details ............................................................................ 26 Table 2.3: Coupon test results ....................................................................... 26 Table 2.4: Details of the joint for the Group 1 and Group 3 ................... 29 Table 2.5: Types and details of specimens ................................................... 36 Table 2.6: Material properties ........................................................................ 37 Table 2.7: Details of specimens ..................................................................... 48 Table 2.8:Material properties ......................................................................... 48 Table 2.9: Specimen details ............................................................................ 57 Table 2.10: Experimental moment-rotation characteristics of EP3 and
EP4 .................................................................................................. 61 Table 2.11: Experimental moment-rotation characteristics ...................... 63 Table 2.12: Steel mechanical properties ....................................................... 64 Table 2.13: Details of specimens ................................................................... 66 Table 2.14: Experimental results of FP1 and FP2 ...................................... 67 Table 2.15: Experimental results of FP3 and FP4 ...................................... 69 Table 2.16: Experimental results of FP5 and FP6 ...................................... 71 Table 2.17: Experimental results of FP7 and FP8 ...................................... 73 Table 2.18: Material properties ...................................................................... 74 Table 3.1: Resistance and stiffness coefficients of the joint components
for A-1 ............................................................................................. 80 Table 3.2: Resistance and stiffness coefficients of the joint components
for A-2 ............................................................................................. 83 Table 3.3: Resistance and stiffness coefficients of the joint components
for A-3 ............................................................................................. 86 Table 3.4: Resistance and stiffness coefficients of the joint components
for A-4 ............................................................................................. 88 Table 3.5: Resistance and stiffness coefficients of the joint components
for A-5 ............................................................................................. 91 Table 3.6: Resistance and stiffness coefficients of the joint components
.......................................................................................................... 93 Table 3.7: Resistance and stiffness coefficients of the joint components
for J-1 .............................................................................................. 96
xii
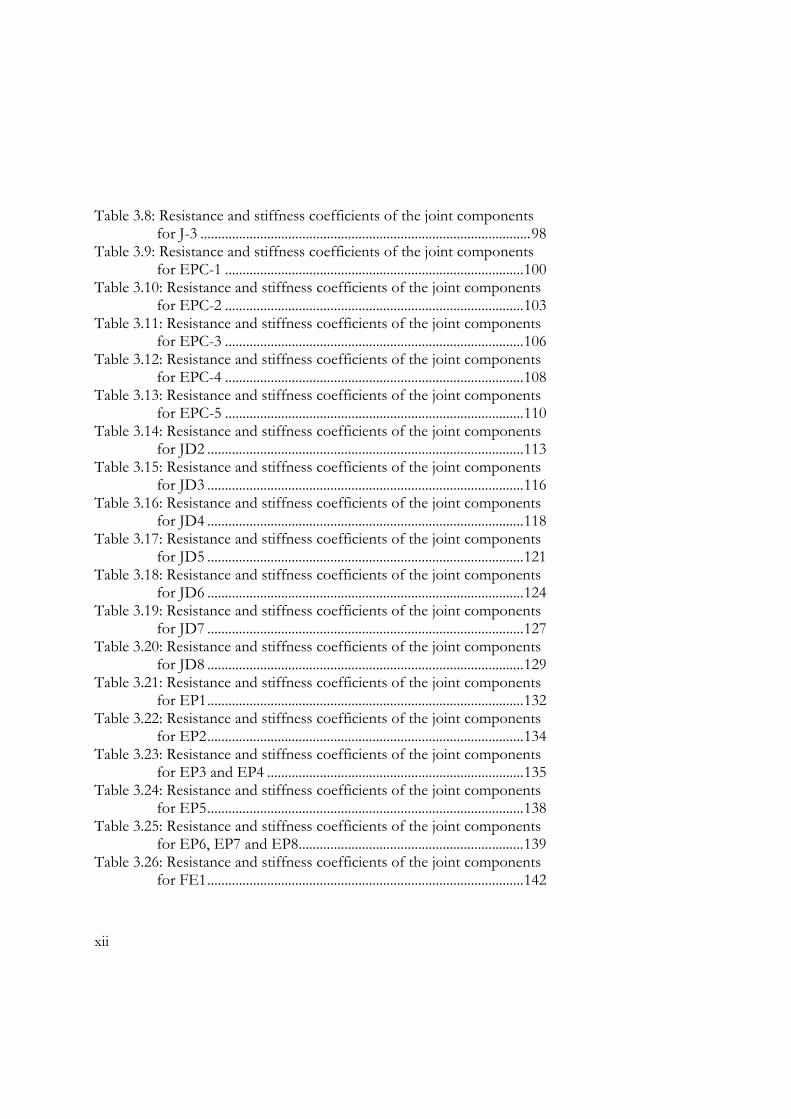
Table 3.8: Resistance and stiffness coefficients of the joint components for J-3 .............................................................................................. 98
Table 3.9: Resistance and stiffness coefficients of the joint components for EPC-1 ..................................................................................... 100
Table 3.10: Resistance and stiffness coefficients of the joint components for EPC-2 ..................................................................................... 103
Table 3.11: Resistance and stiffness coefficients of the joint components for EPC-3 ..................................................................................... 106
Table 3.12: Resistance and stiffness coefficients of the joint components for EPC-4 ..................................................................................... 108
Table 3.13: Resistance and stiffness coefficients of the joint components for EPC-5 ..................................................................................... 110
Table 3.14: Resistance and stiffness coefficients of the joint components for JD2 .......................................................................................... 113
Table 3.15: Resistance and stiffness coefficients of the joint components for JD3 .......................................................................................... 116
Table 3.16: Resistance and stiffness coefficients of the joint components for JD4 .......................................................................................... 118
Table 3.17: Resistance and stiffness coefficients of the joint components for JD5 .......................................................................................... 121
Table 3.18: Resistance and stiffness coefficients of the joint components for JD6 .......................................................................................... 124
Table 3.19: Resistance and stiffness coefficients of the joint components for JD7 .......................................................................................... 127
Table 3.20: Resistance and stiffness coefficients of the joint components for JD8 .......................................................................................... 129
Table 3.21: Resistance and stiffness coefficients of the joint components for EP1 .......................................................................................... 132
Table 3.22: Resistance and stiffness coefficients of the joint components for EP2 .......................................................................................... 134
Table 3.23: Resistance and stiffness coefficients of the joint components for EP3 and EP4 ......................................................................... 135
Table 3.24: Resistance and stiffness coefficients of the joint components for EP5 .......................................................................................... 138
Table 3.25: Resistance and stiffness coefficients of the joint components for EP6, EP7 and EP8 ................................................................ 139
Table 3.26: Resistance and stiffness coefficients of the joint components for FE1 .......................................................................................... 142
xiii
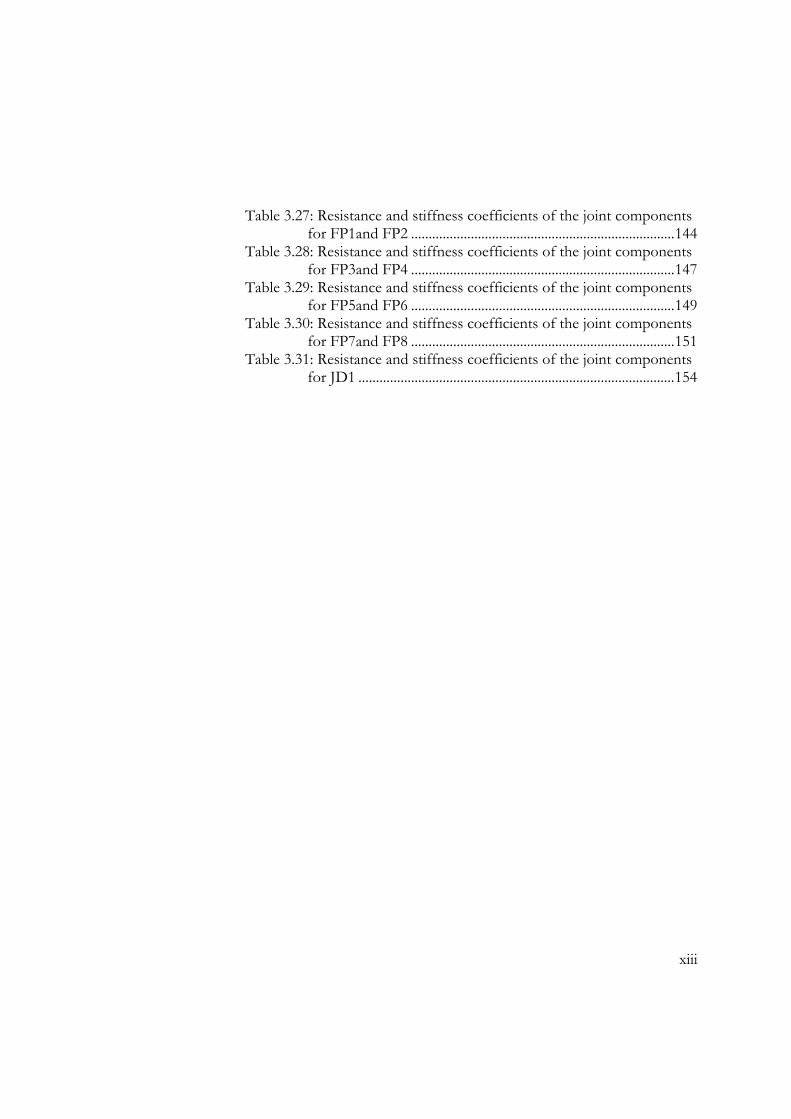
Table 3.27: Resistance and stiffness coefficients of the joint components for FP1and FP2 ........................................................................... 144
Table 3.28: Resistance and stiffness coefficients of the joint components for FP3and FP4 ........................................................................... 147
Table 3.29: Resistance and stiffness coefficients of the joint components for FP5and FP6 ........................................................................... 149
Table 3.30: Resistance and stiffness coefficients of the joint components for FP7and FP8 ........................................................................... 151
Table 3.31: Resistance and stiffness coefficients of the joint components for JD1 .......................................................................................... 154

xiv
xv
ABSTRACT
The deficiencies of traditional force-based design approaches and the recognition of the key-role of displacements and deformations as reliable and direct index of structural damage caused by earthquakes recently produced a shift in seismic design and assessment philosophy. In fact, new performance-based design requirements have strongly emerged internationally in seismic design and analysis. One design concept that was developed in response to these needs is currently known as “displacement-based” design (DBD). A large amount of work has already been undertaken in the field of displacement-based design especially for reinforced concrete structures. Recommendations for steel moment resisting frame (MRF) structures are few and the available proposals have not been fully confirmed. In this context, a research project – named DiSTEEL (Displacement based seismic design of STEEL moment resisting frame structures) and aiming to develop performance-based design guidelines for moment resisting steel frame structures – has been funded by the European Community. The DiSTEEL Project was the framework of the study presented in this thesis. In case of moment resisting steel frames, beam-to-column joints are essential structural components that significantly affect the overall seismic response. Therefore, a first step towards the development of DBD rules for MRFs is the analysis of response of beam-to-column joints with a focus on limit-state deformations. Within the context briefly outlined, the focus of this work is on the features of the inelastic response of beam-to-column end-plate joints. The efforts are addressed to the development of simple yet reliable design equations and tools to predict joint rotations associated with selected limit-states. After a review of some available experimental data, an assessment of existing analytical models for predicting joint rotational stiffness and strength is presented. Using these analytical models the geometrical and material parameters mostly affecting the joint yield rotations are highlighted. Analytical predictions of yield rotations of both flush and extended end-plate joints are subsequently evaluated by comparison with experimental data. Once validated by such a

xvi
comparison, the analytical tools are further developed for design purposes, in the form of design charts to be obtained by an automated application of the analysis tools. Finally, discussion and preliminary evaluation of the rotation capacity of extended end-plate joints are presented.

xvii
ACKNOWLEDGMENTS
(Only in the printed version)

xviii
xix
ABOUT THE AUTHOR
Giusy Terracciano is a Structural Engineer graduated at the University of Naples Federico II in 2009. She attended the PhD course in Construction Engineering at the Department of Structures for Engineering and Architecture from 2010 through 2013. Giusy Terracciano has multiple research interests, including steel structures (connections, cold-formed thin-walled members) and seismic vulnerability and retrofitting of existing masonry and reinforced concrete buildings. She is currently involved in both national and international research projects. She is co-author of about 10 papers published in proceedings of both national and international conferences.

MOTIVATIONS AND OBJECTIVES
The recognition of the key-role of displacements and deformations as direct index of structural damage caused by earthquakes produced in the last decades the development of explicit displacement-based design (DBD) methods. Although current seismic design provisions implement the "Performance-Based Design" (PBD) philosophy, according to a multilevel performance approach (e.g. SEAOC, 1995), the procedures for structural seismic design and assessment are force-based (Force-Based Design, FBD). The limits of this approach and the advantages of alternative displacement-based design methods have been highlighted by several Authors (e.g. Priestley, 1993; Moehle, 1996; Priestley, 1998). Many efforts have been addressed to the development of design guidelines for a number of building structures and bridges (Sullivan et al., 2012), but recommendations for moment resisting frame structures are insufficient yet. In this context, a research project – named DiSTEEL (Displacement based seismic design of STEEL moment resisting frame structures) and aiming to develop performance-based design guidelines for moment resisting steel frame structures – has been funded by the European Community (Research Fund for Coal and Steel (RFCS), grant agreement n. RFSR-CT-2010-00029). Within the DiSTEEL project the University of Naples Federico II (UNINA-WP3) has been involved in the study of flexible full strength joints. It is well known that in the DBD methodology, the original multi degree of freedom (MDOF) structure is substituted with an equivalent single degree of freedom (SDOF) system (Shibata and Sozen, 1976), whose structural properties are estimated using design displacement profiles corresponding to certain drift limit and equivalent viscous damping, the latter accounting for the energy dissipated by the structure. Both maximum displacement profile and equivalent viscous damping are influenced by connection details, especially in case of partial strength connections. On the other hand, beam-to-column joints are essential structural components that significantly affect the overall seismic response (Della Corte et al., 2002).
Motivation and objectives
2
The analysis of response of beam-to-column joints is essential in order to develop DBD rules for moment resisting frame structures. Therefore, the main objective of this work is to characterize the behaviour of beam-to-column joints in steel moment resisting frames, in terms of rotations associated to significant limit states. The focus is on end plate connections, a type widely used in steel frame structures because of the simplicity and economy associated to their fabrication and erection. In the following, after a brief introduction on the DBD procedure and the method of joint modelling, the limit state rotations considered in this study are identified and the analysis methodology is presented (Chapter 1). Then a review of some available experimental data (Chapter 2) and an assessment of existing analytical models for predicting joint rotational stiffness and strength (Chapter 3) are given. Subsequently, a theoretical study on the yield rotation is described and design tools are developed (Chapter 4). Observations on the rotation capacity of extended end-plate joints are finally provided (Chapter 5). Finally, conclusions on the behaviour of beam-to-column end-plate joints are derived (Chapter 6).
1 INTRODUCTION
This Chapter contains a brief description of both the Displacement-based Design procedure and the component method. Subsequently the definitions of the limit state rotations considered in this study are given. Finally, the analysis methodology is presented.
1.1 DISPLACEMENT BASED DESIGN FOR MOMENT
RESISTING FRAME STEEL STRUCTURES
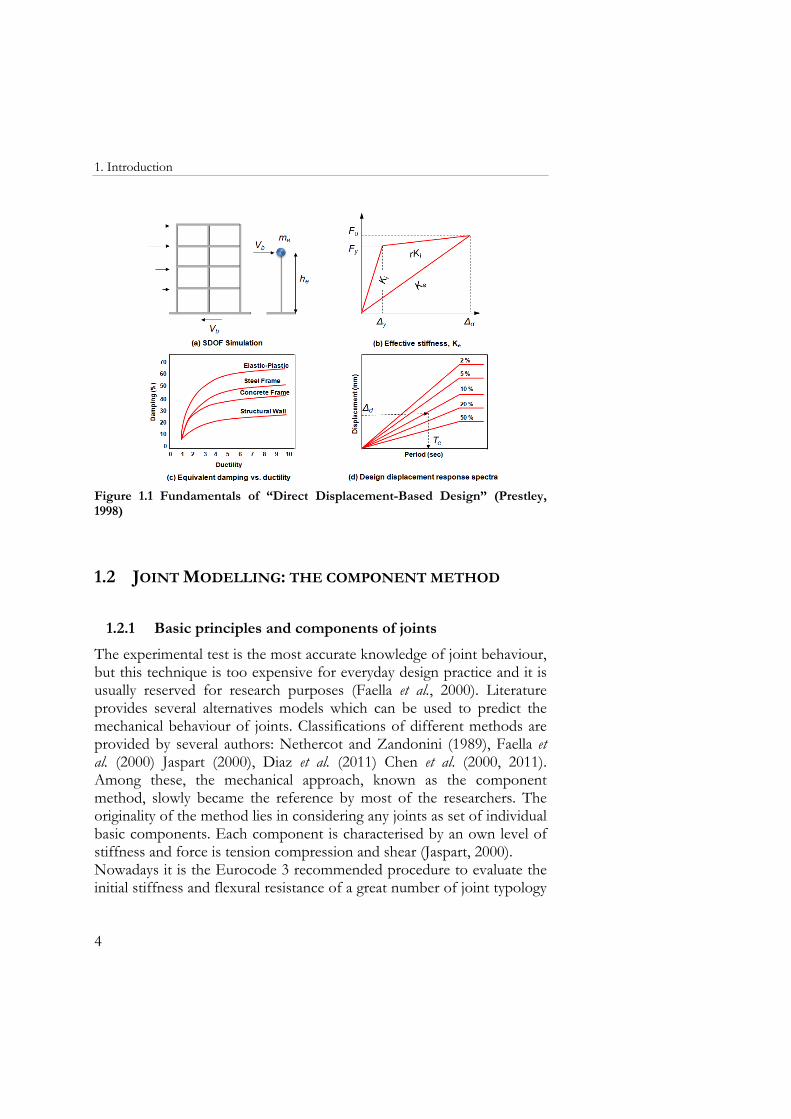
The DBD procedure is based on the substitute structure analysis procedure developed by Shibata and Sozen (1976). The initial MDOF system is replaced by an equivalent SDOF (Figure 1.1 a) characterized by secant stiffness, Ke, at maximum displacement (Figure 1.1 b), Δd, and a level of equivalent viscous damping appropriate to the energy dissipated by the structure. The design displacement Δd is expressed as a function of the masses and displacements of the MDOF structure. By means Δd, the damping is estimated from the expected ductility demand (Figure 1.1 c). The effective period Te at maximum displacement response can be read from a set of design displacement spectra (Figure 1.1 d). Representing the structure (Figure 1.1 a)) as an equivalent SDOF oscillator, the effective stiffness Ke at maximum response displacement can be found by inverting the equation for natural period of a SDOF oscillator. Finally the design base shear Vb of the MDOF structure is obtained as the product of the effective stiffness Ke times the maximum displacement Δd (Priestley M. J. N., 1998). Implementing DBD methodology requires the definitions of the design displacement profiles corresponding to certain drift limit and equivalent viscous damping accounting the energy dissipated by the structure. Both maximum displacement profile and equivalent viscous damping are influenced by connection details, therefore, a first step towards the development of DBD rules for MRFs is the analysis of response of beam-to-column joints.
1. Introduction
4
Figure 1.1 Fundamentals of “Direct Displacement-Based Design” (Prestley, 1998)
1.2 JOINT MODELLING: THE COMPONENT METHOD
1.2.1 Basic principles and components of joints
The experimental test is the most accurate knowledge of joint behaviour, but this technique is too expensive for everyday design practice and it is usually reserved for research purposes (Faella et al., 2000). Literature provides several alternatives models which can be used to predict the mechanical behaviour of joints. Classifications of different methods are provided by several authors: Nethercot and Zandonini (1989), Faella et al. (2000) Jaspart (2000), Diaz et al. (2011) Chen et al. (2000, 2011). Among these, the mechanical approach, known as the component method, slowly became the reference by most of the researchers. The originality of the method lies in considering any joints as set of individual basic components. Each component is characterised by an own level of stiffness and force is tension compression and shear (Jaspart, 2000). Nowadays it is the Eurocode 3 recommended procedure to evaluate the initial stiffness and flexural resistance of a great number of joint typology
1. Introduction
5
subjected to pure bending. The application of the component method requires the following steps:
a) Identification of relevant components; b) Evaluation of the force-deformation response of each
component (initial stiffness design strength); c) Assemblage of the components to evaluate the mechanical
characteristics of the whole joint (initial stiffness, design resistance).
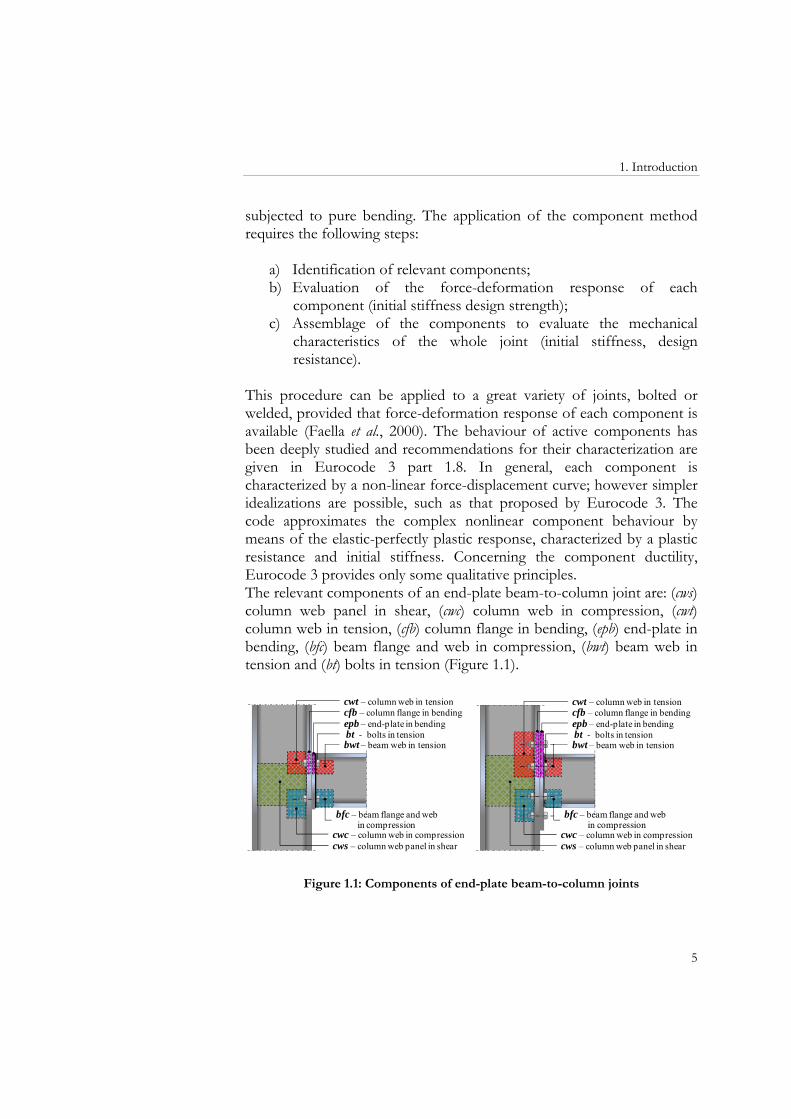
This procedure can be applied to a great variety of joints, bolted or welded, provided that force-deformation response of each component is available (Faella et al., 2000). The behaviour of active components has been deeply studied and recommendations for their characterization are given in Eurocode 3 part 1.8. In general, each component is characterized by a non-linear force-displacement curve; however simpler idealizations are possible, such as that proposed by Eurocode 3. The code approximates the complex nonlinear component behaviour by means of the elastic-perfectly plastic response, characterized by a plastic resistance and initial stiffness. Concerning the component ductility, Eurocode 3 provides only some qualitative principles. The relevant components of an end-plate beam-to-column joint are: (cws) column web panel in shear, (cwc) column web in compression, (cwt) column web in tension, (cfb) column flange in bending, (epb) end-plate in bending, (bfc) beam flange and web in compression, (bwt) beam web in tension and (bt) bolts in tension (Figure 1.1).
cws – column web panel in shear
cwt – column web in tensioncfb – column flange in bendingepb – end-plate in bendingbt - bolts in tension
bfc – beam flange and webin compression
cwc – column web in compression
bwt – beam web in tension
cws – column web panel in shear
cwt – column web in tensioncfb – column flange in bendingepb – end-plate in bendingbt - bolts in tension
bfc – beam flange and webin compression
cwc – column web in compression
bwt – beam web in tension
Figure 1.1: Components of end-plate beam-to-column joints
1. Introduction
6
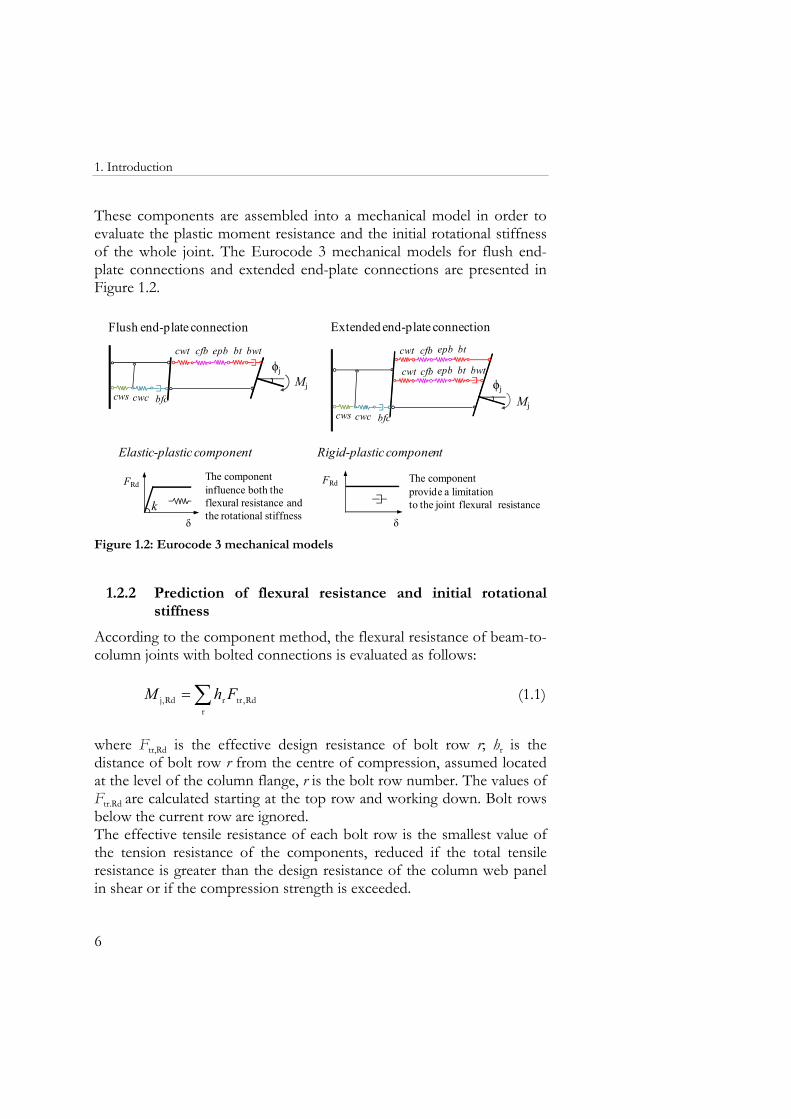
These components are assembled into a mechanical model in order to evaluate the plastic moment resistance and the initial rotational stiffness of the whole joint. The Eurocode 3 mechanical models for flush end-plate connections and extended end-plate connections are presented in Figure 1.2.
Extended end-plate connection
ϕj
cwt epb bt bwtcfb
cwc bfccwsMj
cwt epb btcfbϕj
cwt epb bt bwtcfb
Mjcwc bfccws
Flush end-plate connection
FRd
δk
Elastic-plastic component
The component influence both the flexural resistance and the rotational stiffness
FRd
δ
Rigid-plastic component
The componentprovide a limitation to the joint flexural resistance
Figure 1.2: Eurocode 3 mechanical models
1.2.2 Prediction of flexural resistance and initial rotational stiffness
According to the component method, the flexural resistance of beam-to-column joints with bolted connections is evaluated as follows: ∑=
rRd,trrRd,j FhM (1.1)
where Ftr,Rd is the effective design resistance of bolt row r; hr is the distance of bolt row r from the centre of compression, assumed located at the level of the column flange, r is the bolt row number. The values of Ftr.Rd are calculated starting at the top row and working down. Bolt rows below the current row are ignored. The effective tensile resistance of each bolt row is the smallest value of the tension resistance of the components, reduced if the total tensile resistance is greater than the design resistance of the column web panel in shear or if the compression strength is exceeded.
1. Introduction
7
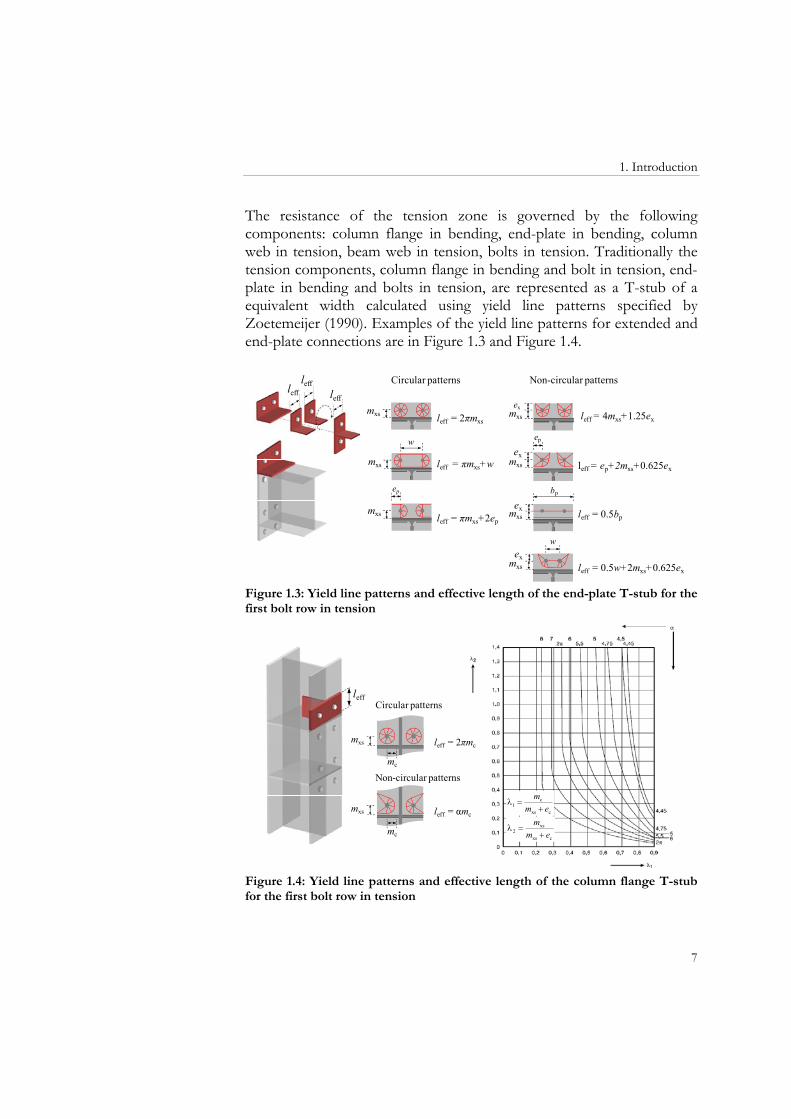
The resistance of the tension zone is governed by the following components: column flange in bending, end-plate in bending, column web in tension, beam web in tension, bolts in tension. Traditionally the tension components, column flange in bending and bolt in tension, end-plate in bending and bolts in tension, are represented as a T-stub of a equivalent width calculated using yield line patterns specified by Zoetemeijer (1990). Examples of the yield line patterns for extended and end-plate connections are in Figure 1.3 and Figure 1.4.
Circular patterns
leff = 2πmxs
leff = πmxs+w
leff = πmxs+2ep
ep
Non-circular patterns
leff = 4mxs+1.25exmxs
ex
leff = ep+2mxs+0.625ex
ep
leff = 0.5bp
bp
leff = 0.5w+2mxs+0.625ex
w
mxs
ex
mxsex
mxs
ex
mxs
mxs
w
mxs
leffleff
leff
Figure 1.3: Yield line patterns and effective length of the end-plate T-stub for the first bolt row in tension
leffCircular patterns
leff = αmc
mc
Non-circular patternsmc
mxs
mxs
leff = 2πmc
cxs
c1 em
m+
=λ
cxs
xs2 em
m+
=λ
Figure 1.4: Yield line patterns and effective length of the column flange T-stub for the first bolt row in tension
1. Introduction
8
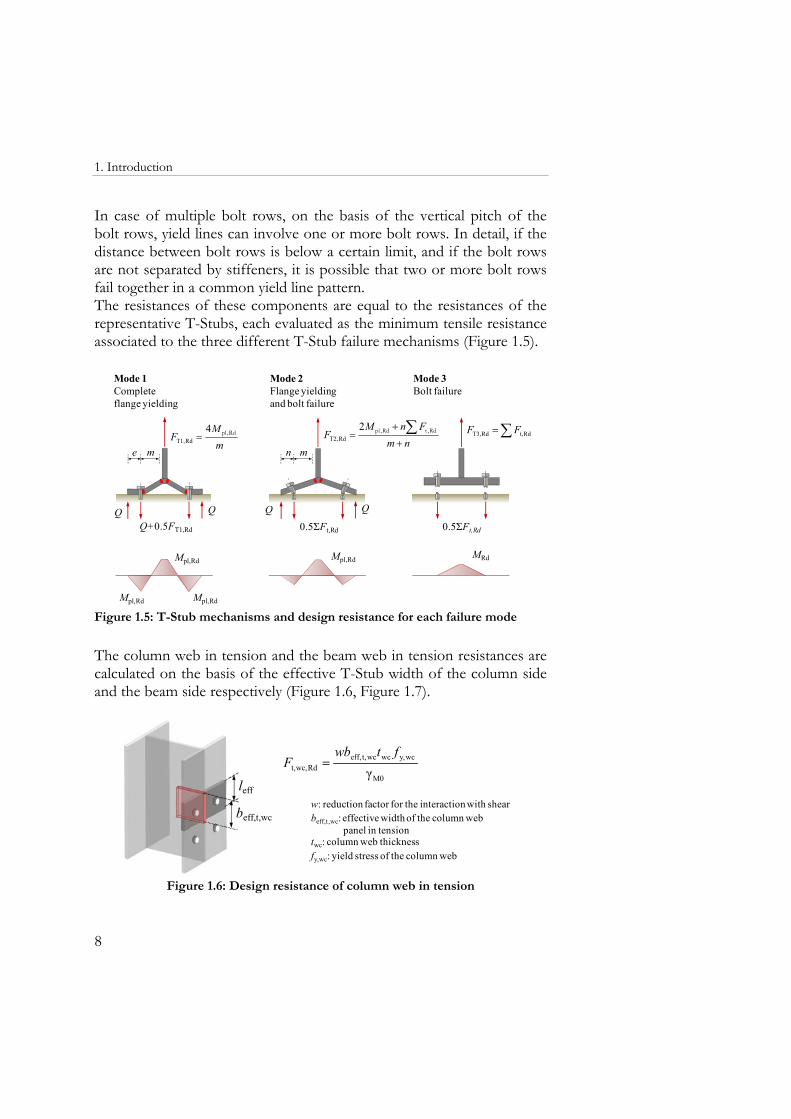
In case of multiple bolt rows, on the basis of the vertical pitch of the bolt rows, yield lines can involve one or more bolt rows. In detail, if the distance between bolt rows is below a certain limit, and if the bolt rows are not separated by stiffeners, it is possible that two or more bolt rows fail together in a common yield line pattern. The resistances of these components are equal to the resistances of the representative T-Stubs, each evaluated as the minimum tensile resistance associated to the three different T-Stub failure mechanisms (Figure 1.5).
Mode 1 Complete flange yielding
mM
F Rd,pl4RdT1, =
QQQ+0.5FT1,Rd
Mpl,Rd
Mpl,RdMpl,Rd
Mode 2 Flange yielding and bolt failure
nmFnM
F+
+= ∑ Rd,tRd,pl2
RdT2,
QQ0.5ΣFt,Rd
Mpl,Rd
n m
Mode 3Bolt failure
∑= Rdt,RdT3, FF
0.5ΣFt,Rd
e m
MRd
Figure 1.5: T-Stub mechanisms and design resistance for each failure mode
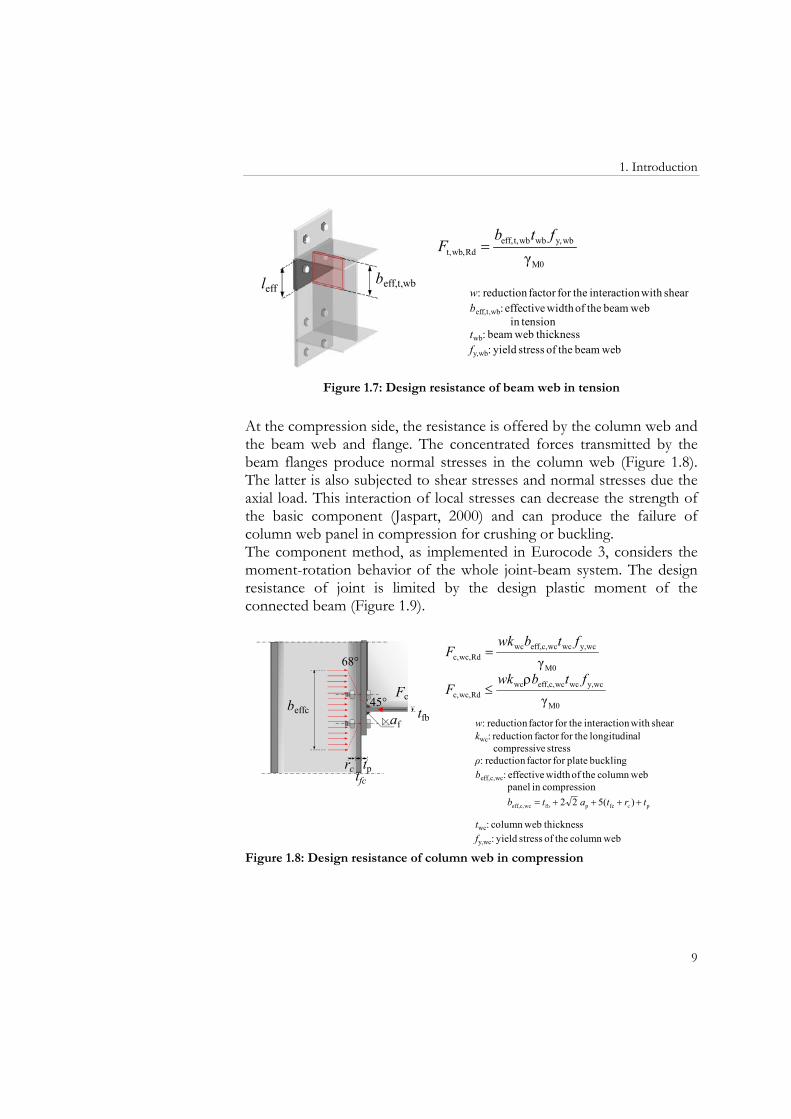
The column web in tension and the beam web in tension resistances are calculated on the basis of the effective T-Stub width of the column side and the beam side respectively (Figure 1.6, Figure 1.7).
beff,t,wc
leffM0
wcy,wcwct,eff,Rdwc,t, γ
ftwbF =
w: reduction factor for the interaction with shearbeff,t,wc: effective width of the column web
panel in tensiontwc: column web thicknessfy,wc: yield stress of the column web
Figure 1.6: Design resistance of column web in tension
1. Introduction
9
leffbeff,t,wb
M0
wby,wbwbt,eff,Rdwb,t, γ
ftbF =
w: reduction factor for the interaction with shearbeff,t,wb: effective width of the beam web
in tensiontwb: beam web thicknessfy,wb: yield stress of the beam web
Figure 1.7: Design resistance of beam web in tension
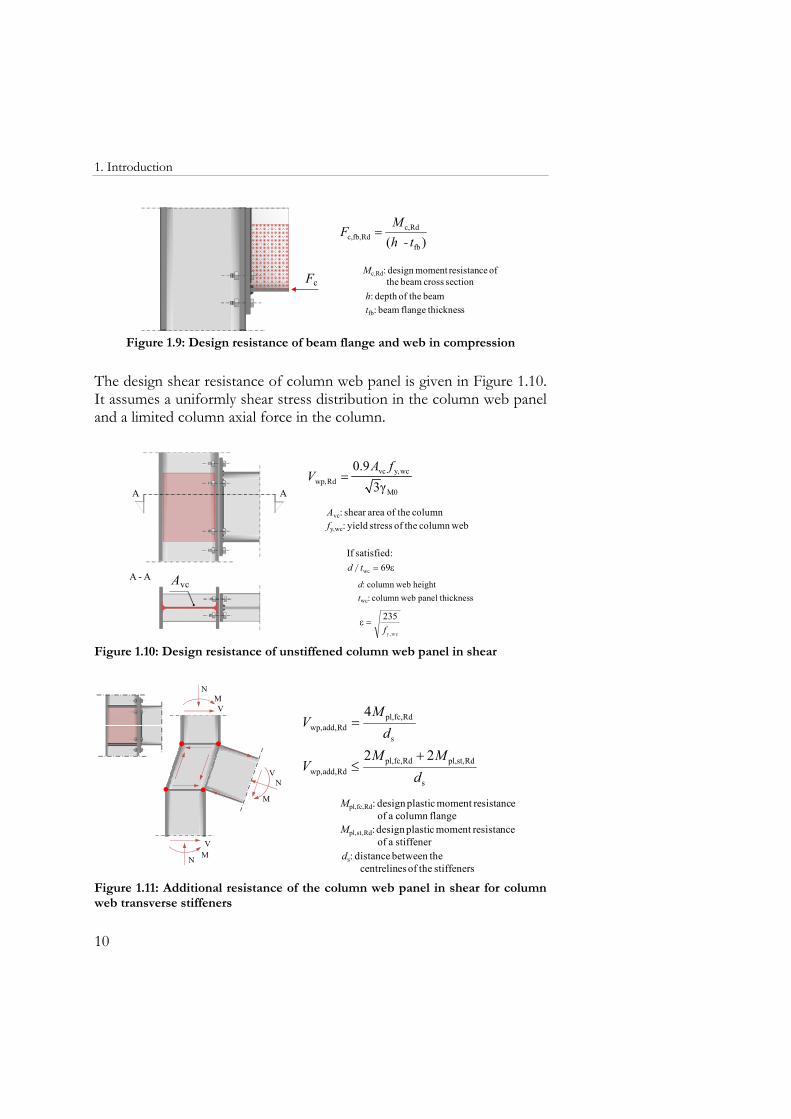
At the compression side, the resistance is offered by the column web and the beam web and flange. The concentrated forces transmitted by the beam flanges produce normal stresses in the column web (Figure 1.8). The latter is also subjected to shear stresses and normal stresses due the axial load. This interaction of local stresses can decrease the strength of the basic component (Jaspart, 2000) and can produce the failure of column web panel in compression for crushing or buckling. The component method, as implemented in Eurocode 3, considers the moment-rotation behavior of the whole joint-beam system. The design resistance of joint is limited by the design plastic moment of the connected beam (Figure 1.9).
beffc45°
68°
rc tfctp
aftfb
Fc
M0
wcy,wcwcc,eff,wcRdwc,c, γ
ftbwkF =
M0
wcy,wcwcc,eff,wcRdwc,c, γ
ftbwkF
ρ≤
ρ: reduction factor for plate bucklingbeff,c,wc: effective width of the column web
panel in compression
twc: column web thicknessfy,wc: yield stress of the column web
pfcpwcc,eff, )5(22 trtatb ++++= cfb
w: reduction factor for the interaction with shearkwc: reduction factor for the longitudinal
compressive stress
Figure 1.8: Design resistance of column web in compression
1. Introduction
10
Fc
)( fb
Rdc,Rdfb,c, t-h
MF =
Mc,Rd: design moment resistance of the beam cross section
h: depth of the beamtfb: beam flange thickness
Figure 1.9: Design resistance of beam flange and web in compression
The design shear resistance of column web panel is given in Figure 1.10. It assumes a uniformly shear stress distribution in the column web panel and a limited column axial force in the column.
AA
AvcA - A
M0
wcy,vcRdwp, γ3
0.9 fAV =
Avc: shear area of the columnfy,wc: yield stress of the column web
ε= 69wctd /If satisfied:
d: column web heighttwc: column web panel thickness
wc,yf235=ε
Figure 1.10: Design resistance of unstiffened column web panel in shear
MV
N
MV
N
N
M
V
s
Rdfc,pl,Rdadd,wp,
4d
MV =
s
Rdst,pl,Rdfc,pl,Rdadd,wp,
22d
MMV
+≤
Mpl,fc,Rd: design plastic moment resistance of a column flange
ds: distance between the centrelines of the stiffeners
Mpl,st,Rd: design plastic moment resistance of a stiffener
Figure 1.11: Additional resistance of the column web panel in shear for column web transverse stiffeners
1. Introduction
11
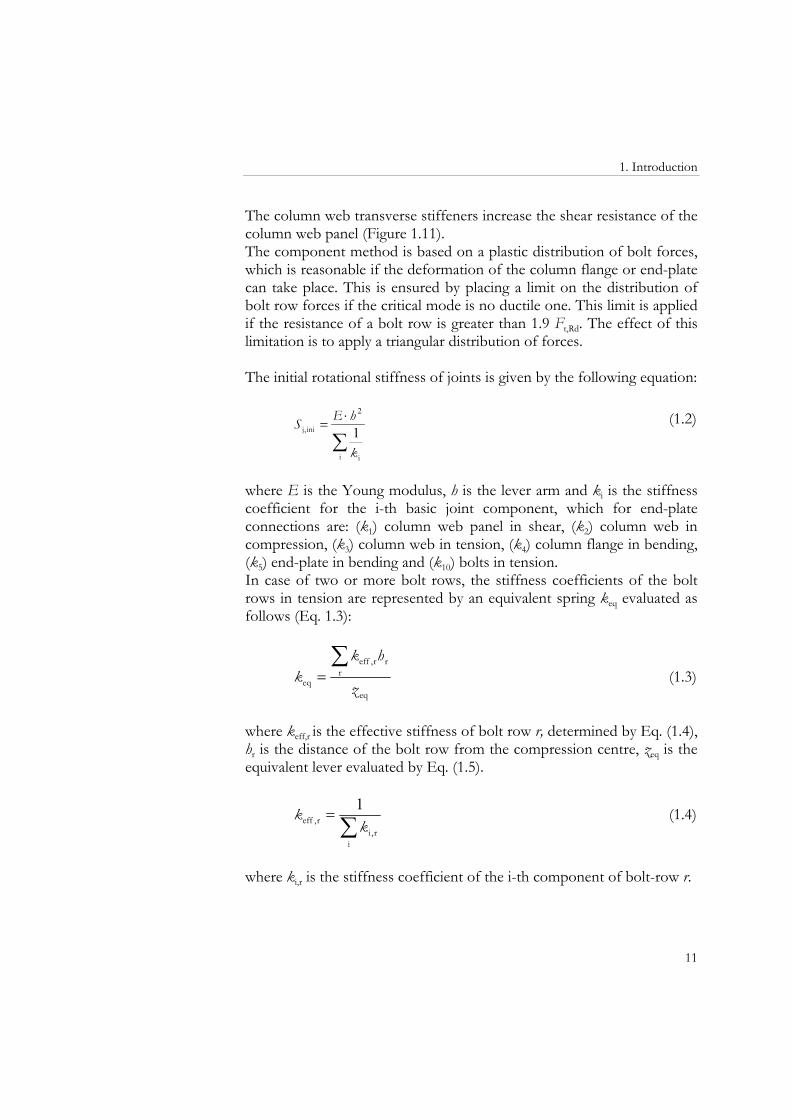
The column web transverse stiffeners increase the shear resistance of the column web panel (Figure 1.11). The component method is based on a plastic distribution of bolt forces, which is reasonable if the deformation of the column flange or end-plate can take place. This is ensured by placing a limit on the distribution of bolt row forces if the critical mode is no ductile one. This limit is applied if the resistance of a bolt row is greater than 1.9 Ft,Rd. The effect of this limitation is to apply a triangular distribution of forces. The initial rotational stiffness of joints is given by the following equation:
∑⋅
=
i i
ini,j
k
hES 1
2 (1.2)
where E is the Young modulus, h is the lever arm and ki is the stiffness coefficient for the i-th basic joint component, which for end-plate connections are: (k1) column web panel in shear, (k2) column web in compression, (k3) column web in tension, (k4) column flange in bending, (k5) end-plate in bending and (k10) bolts in tension. In case of two or more bolt rows, the stiffness coefficients of the bolt rows in tension are represented by an equivalent spring keq evaluated as follows (Eq. 1.3):
eq
rrr,eff
eq z
hkk
∑= (1.3)
where keff,r is the effective stiffness of bolt row r, determined by Eq. (1.4), hr is the distance of the bolt row from the compression centre, zeq is the equivalent lever evaluated by Eq. (1.5).
∑=
ir,i
r,eff kk 1 (1.4)
where ki,r is the stiffness coefficient of the i-th component of bolt-row r.
1. Introduction
12
∑∑
=
rrreff
rrreff
eq hk
hkz
,
,2
(1.5)
The model assumes that the compressive spring and the shear spring are located at the centre of compression which is the centerline of the beam flange, while the tensile springs are at bolt row level (Figure 1.2). The deformations of tensile springs are proportional to their distance from to the compression centre. According to the procedure, the assembly of tension springs in series and in parallel is replaced by an equivalent spring.
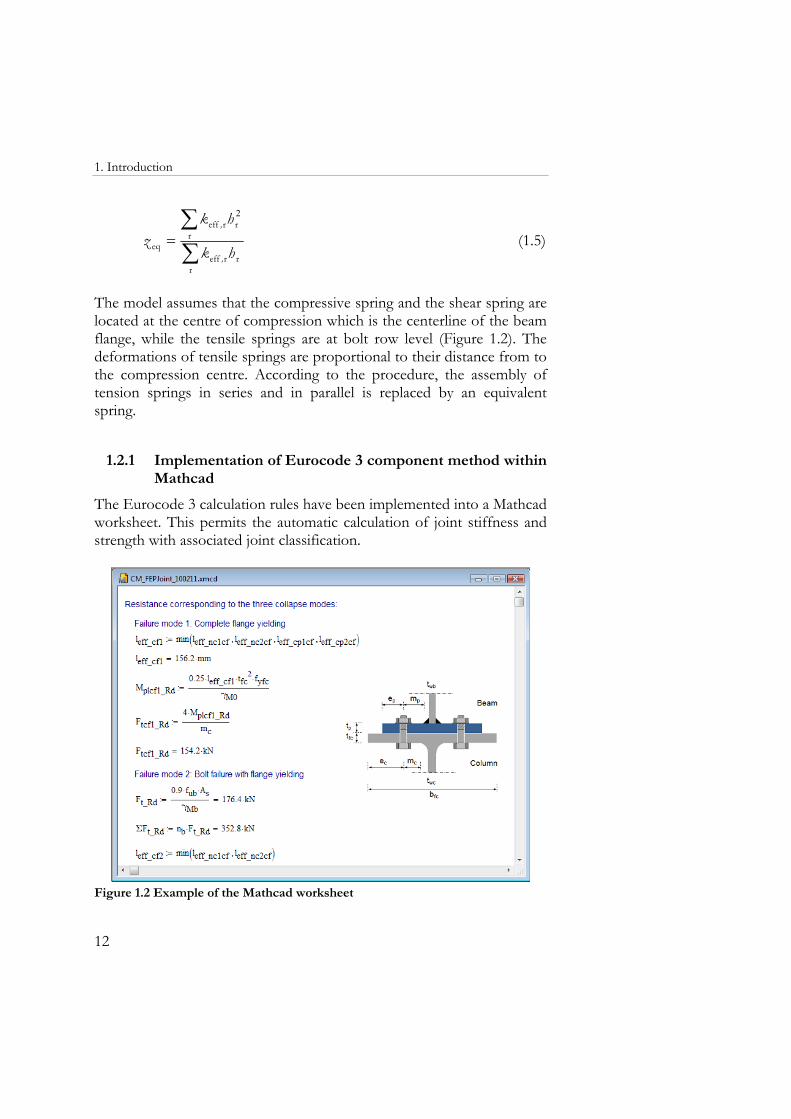
1.2.1 Implementation of Eurocode 3 component method within Mathcad
The Eurocode 3 calculation rules have been implemented into a Mathcad worksheet. This permits the automatic calculation of joint stiffness and strength with associated joint classification.
Figure 1.2 Example of the Mathcad worksheet
1. Introduction
13
The procedure has been implemented for both the flush end-plate and extended end-plate joints. Together with the digital database (presented in the following Chapter), the automated calculation procedure allows the evaluation of the influence that different joint parameters may have on the moment-rotation response.
1.3 MOMENT – ROTATION CURVE REPRESENTATION
Structural joints, particularly bolted connections exhibit a nonlinear behaviour due, for example, to material discontinuity of the subassemblage, yielding of some component parts and local buckling of plates. This complex behaviour is usually approximate introducing drastic simplifications. In general, beam-to-column joints in steel frame structures can transmit axial and shear forces, bending and torsion moments. The bending actions are predominant compared with the axial and shear forces, while the torsion moments are negligible in planar frames. Therefore, the behaviour of beam-to-column joints is represented by a moment-rotation curve (M-ϕ) that describes the relationship between the applied bending moment (M) and the corresponding rotation between the members (ϕ). The mathematical representation of the moment–rotation curve can be performed by means of different relationships and levels of precision. The different mathematical representations of the moment–rotation curve are: a) linear; b) bilinear; c) multilinear; d) nonlinear. The most accurate representation of the beam-o-column behaviour is obtained using continuous nonlinear functions (Faella et al., 2000; Diaz et al., 2011). Eurocode 3 suggests two possible idealizations of the M-ϕ curve, bilinear (elastic-plastic curve) and nonlinear. The stiffness ratio μ, used to define the nonlinear part of the M-ϕ curve is defined as follows (Eq. (1.6)):
ψ
⎟⎟⎠
⎞⎜⎜⎝
⎛=μ
Rd,j
Ed,jEd,j
..
MM
M51
51 (1.6)
1. Introduction
14
Ψ is a coefficient which depends on the type of connection. For bolted end plate connections, it is equal to 2.7. The theoretical study of the yield rotation and the calculation of the plastic rotation capacity of end-plate connection are based on bilinear and elastic-plastic representation of the moment-rotation curve.
1.4 DEFINITIONS OF LIMIT STATE ROTATIONS
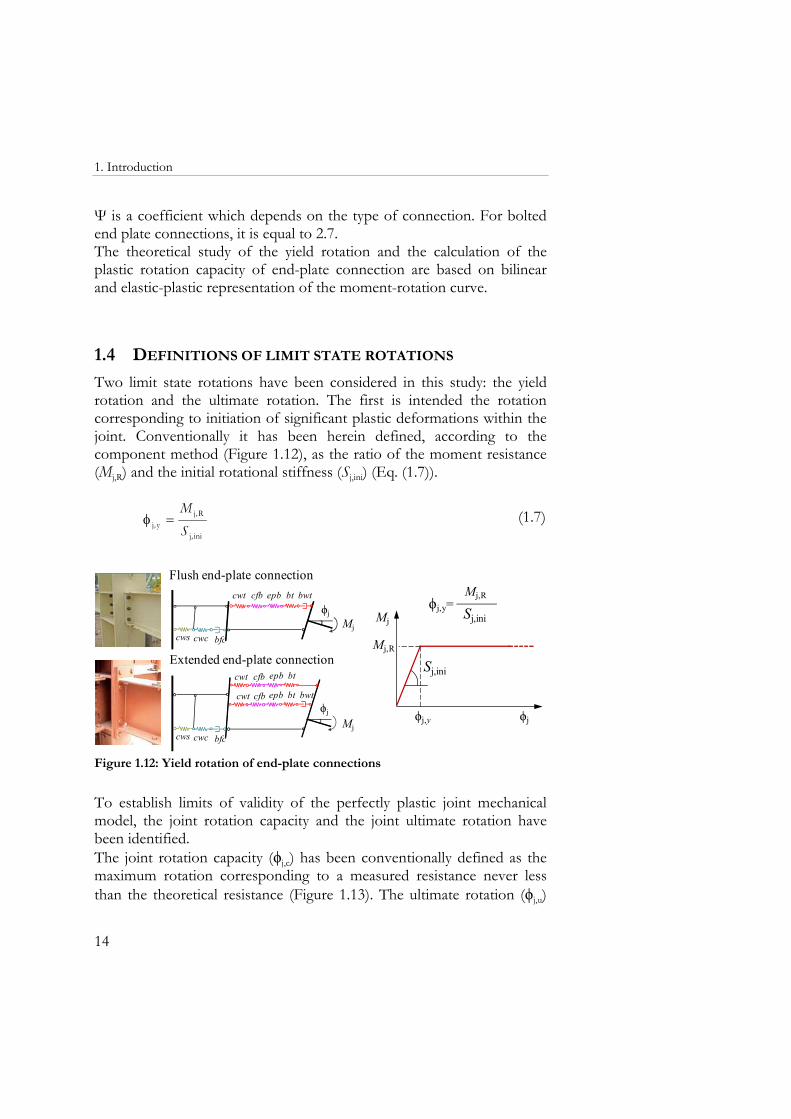
Two limit state rotations have been considered in this study: the yield rotation and the ultimate rotation. The first is intended the rotation corresponding to initiation of significant plastic deformations within the joint. Conventionally it has been herein defined, according to the component method (Figure 1.12), as the ratio of the moment resistance (Mj,R) and the initial rotational stiffness (Sj,ini) (Eq. (1.7)).
inij
Rjyj
,
,, S
M=φ (1.7)
Mj,R
Sj,iniϕj,y=
Flush end-plate connection
Extended end-plate connectionMj,R
Mj
ϕj,y ϕj
Sj,ini
ϕj
cwt epb bt bwtcfb
cwc bfccwsMj
cwt epb btcfb
ϕj
cwt epb bt bwtcfb
Mjcwc bfccws
Figure 1.12: Yield rotation of end-plate connections
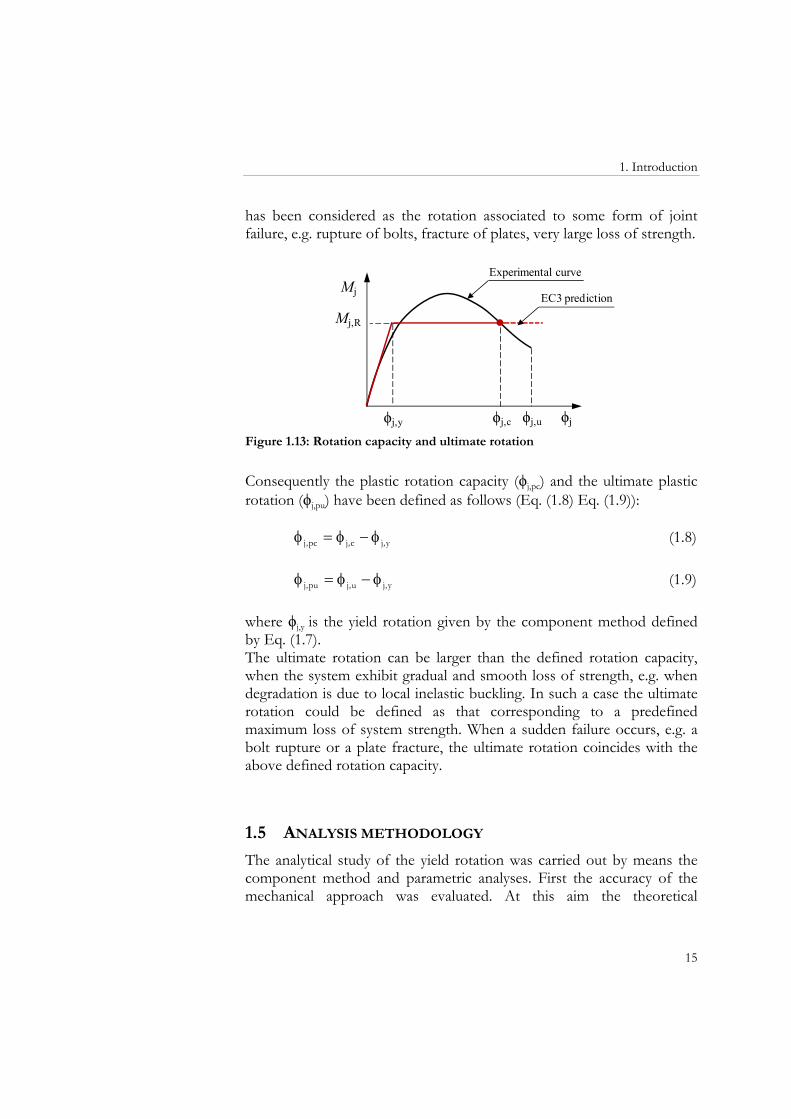
To establish limits of validity of the perfectly plastic joint mechanical model, the joint rotation capacity and the joint ultimate rotation have been identified. The joint rotation capacity (ϕj,c) has been conventionally defined as the maximum rotation corresponding to a measured resistance never less than the theoretical resistance (Figure 1.13). The ultimate rotation (ϕj,u)
1. Introduction
15
has been considered as the rotation associated to some form of joint failure, e.g. rupture of bolts, fracture of plates, very large loss of strength.
Mj,R
Mj
ϕjϕj,c
Experimental curve
EC3 prediction
ϕj,y ϕj,u Figure 1.13: Rotation capacity and ultimate rotation
Consequently the plastic rotation capacity (ϕj,pc) and the ultimate plastic rotation (ϕj,pu) have been defined as follows (Eq. (1.8) Eq. (1.9)):
yjcjpcj ,,, φ−φ=φ (1.8)
yjujpuj ,,, φ−φ=φ (1.9) where ϕj,y is the yield rotation given by the component method defined by Eq. (1.7). The ultimate rotation can be larger than the defined rotation capacity, when the system exhibit gradual and smooth loss of strength, e.g. when degradation is due to local inelastic buckling. In such a case the ultimate rotation could be defined as that corresponding to a predefined maximum loss of system strength. When a sudden failure occurs, e.g. a bolt rupture or a plate fracture, the ultimate rotation coincides with the above defined rotation capacity.
1.5 ANALYSIS METHODOLOGY
The analytical study of the yield rotation was carried out by means the component method and parametric analyses. First the accuracy of the mechanical approach was evaluated. At this aim the theoretical
1. Introduction
16
prediction were compared with experimental results. Therefore, experimental tests on end-plate connections were collected and analyzed in term of yield rotation. From experimental point of view, conventional moment resistance and initial stiffness were considered. The first was assumed equal to the plastic flexural strength of the connected beam for full strength joints, while for partial strength joints the moment resistance was fixed equal to the flexural strength corresponding to a secant stiffness of 1/3 times the initial stiffness. Generally the experimental initial rotational stiffness is provided by Authors. If not available it was determined graphically as the slope of the tangent to the curve in the elastic range. By means the mechanical approach, the theoretical structural properties and the yield rotation of each specimen were evaluated. Once assessed the accuracy of the method, through the mechanical approach, analytical closed-form equations to calculate yield rotation of flush end-plate connections were derived. Starting from the conventional definition of the yield rotation, analytical manipulations of the joint moment resistance and initial stiffness led to the identification of yield rotation equations associated to the different possible failure mode of the connection. The analytical expressions allowed the recognition of the non-dimensional geometrical and material parameters mostly affecting the end-plate joint rotations, relevant for the subsequent parametric study aimed to the identification of the influence of connections detail on the response of beam-to-column joints. Concerning the study on the ultimate rotations, once defined the conventional plastic rotation and the ultimate rotations, the experimental data on extended end-plate connections were analyzed and divided in two different classes depending on the difference noted between the plastic mechanism and the ultimate failure mode. The results were analyzed in order to associate a rotation capacity to a plastic mechanism.
2 EXPERIMENTAL DATA COLLECTION
A large amount of experimental tests were performed by several Authors to investigate the behaviour of end-plate connections. The analysis methodology adopted in this study requires an accurate knowledge of the geometrical and material properties of all specimens, which is not always available. In this study the experimental works carried out by Ghobarah et al. (1990), Sumner and Murray (2002), Nogueiro et al. (2006) Shi et al. (2007), da Silva et al. (2004) and Broderick and Thomson (2002, 2005) are considered. The Chapter contains a detailed description of the experimental programs and the corresponding test results.
2.1 EXTENDED END-PLATE CONNECTIONS
2.1.1 Tests by Ghobarah et al. (1990)
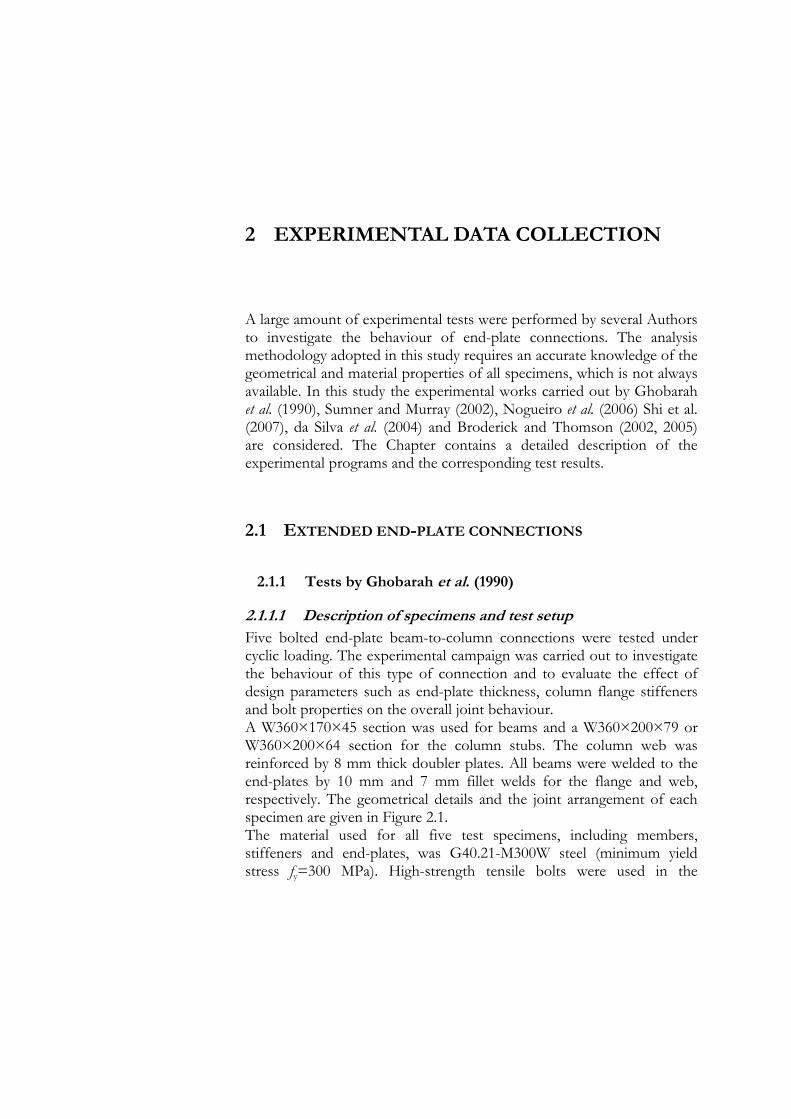
2.1.1.1 Description of specimens and test setup Five bolted end-plate beam-to-column connections were tested under cyclic loading. The experimental campaign was carried out to investigate the behaviour of this type of connection and to evaluate the effect of design parameters such as end-plate thickness, column flange stiffeners and bolt properties on the overall joint behaviour. A W360×170×45 section was used for beams and a W360×200×79 or W360×200×64 section for the column stubs. The column web was reinforced by 8 mm thick doubler plates. All beams were welded to the end-plates by 10 mm and 7 mm fillet welds for the flange and web, respectively. The geometrical details and the joint arrangement of each specimen are given in Figure 2.1. The material used for all five test specimens, including members, stiffeners and end-plates, was G40.21-M300W steel (minimum yield stress fy=300 MPa). High-strength tensile bolts were used in the
Chapter 2
18
connection. The bolt diameter was equal to 25 mm and the grade was ASTM A490M (minimum tensile strength fu=1040 MPa). Coupons from the beam sections were extracted to evaluate the actual properties of members. The results are given in Table 2.1.
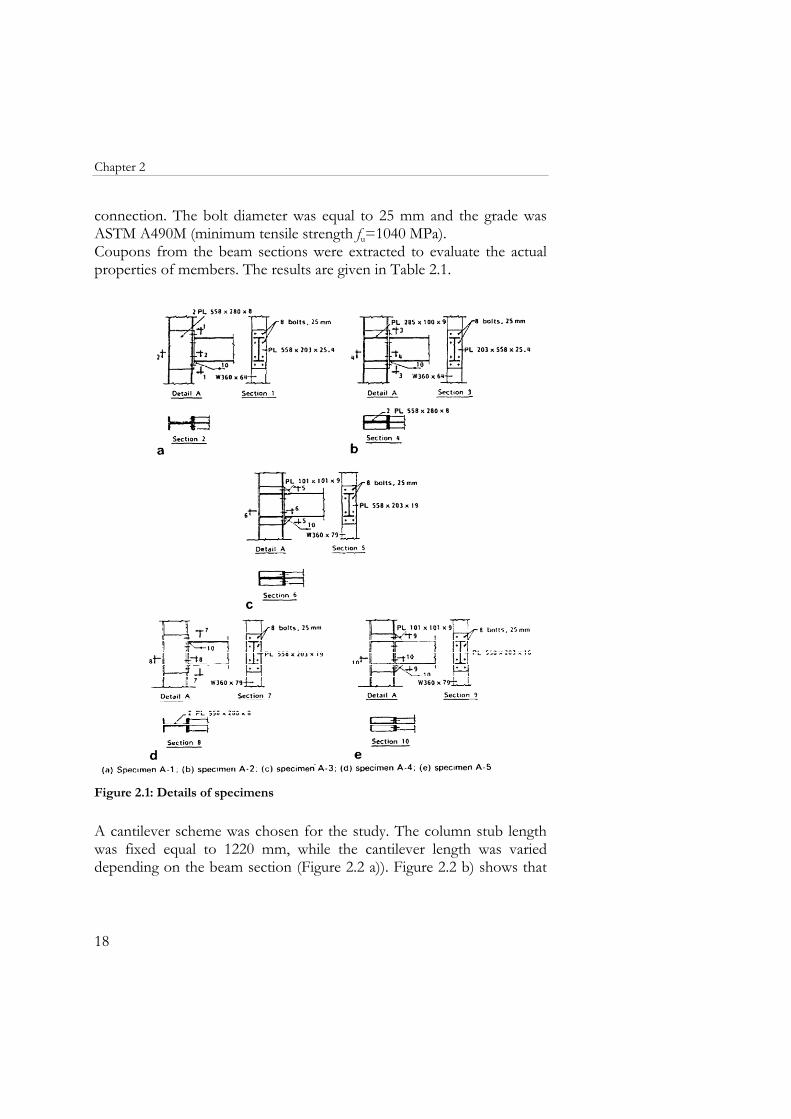
Figure 2.1: Details of specimens
A cantilever scheme was chosen for the study. The column stub length was fixed equal to 1220 mm, while the cantilever length was varied depending on the beam section (Figure 2.2 a)). Figure 2.2 b) shows that
2. Experimental data collection
19
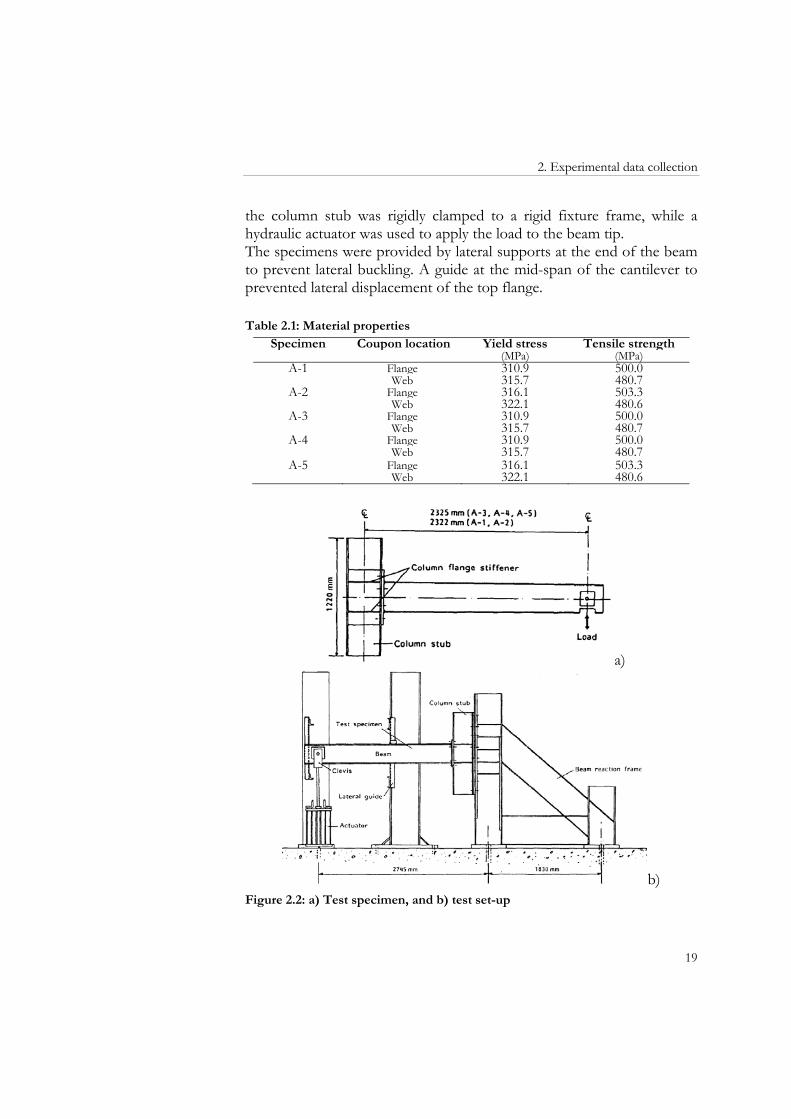
the column stub was rigidly clamped to a rigid fixture frame, while a hydraulic actuator was used to apply the load to the beam tip. The specimens were provided by lateral supports at the end of the beam to prevent lateral buckling. A guide at the mid-span of the cantilever to prevented lateral displacement of the top flange. Table 2.1: Material properties
Specimen Coupon location Yield stress Tensile strength (MPa) (MPa)
A-1 Flange 310.9 500.0 Web 315.7 480.7
A-2 Flange 316.1 503.3 Web 322.1 480.6
A-3 Flange 310.9 500.0 Web 315.7 480.7
A-4 Flange 310.9 500.0 Web 315.7 480.7
A-5 Flange 316.1 503.3 Web 322.1 480.6
a)
b) Figure 2.2: a) Test specimen, and b) test set-up
Chapter 2
20
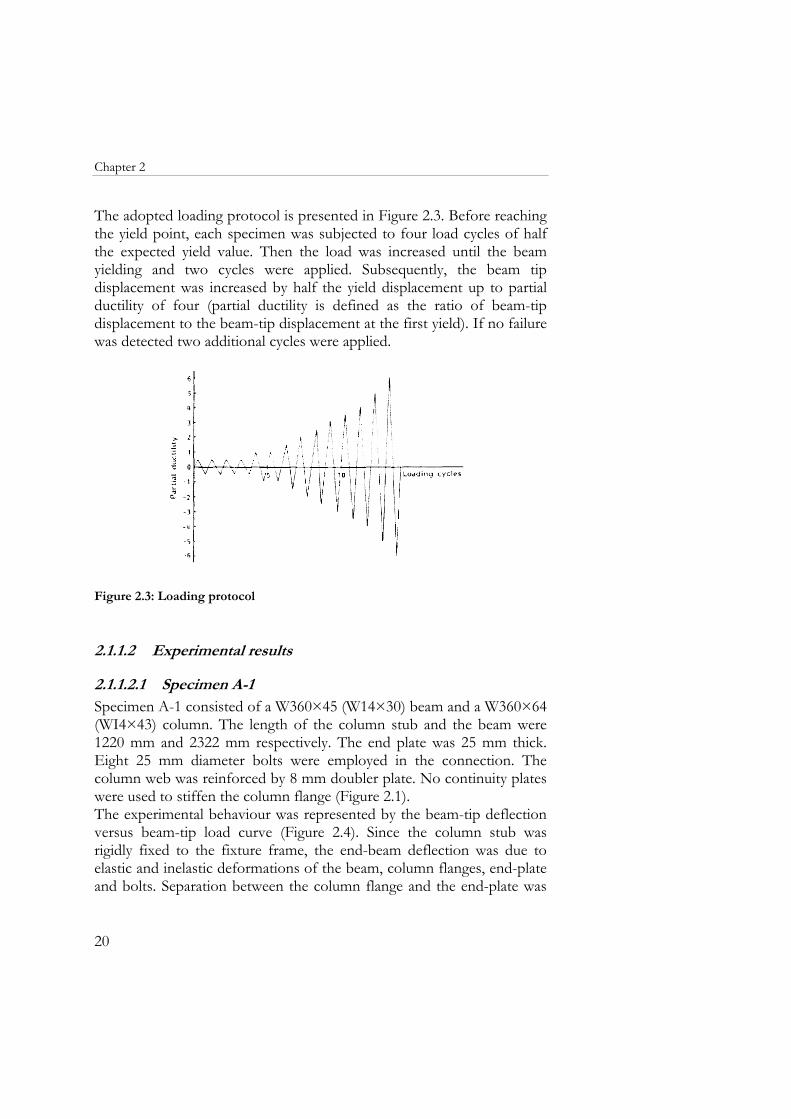
The adopted loading protocol is presented in Figure 2.3. Before reaching the yield point, each specimen was subjected to four load cycles of half the expected yield value. Then the load was increased until the beam yielding and two cycles were applied. Subsequently, the beam tip displacement was increased by half the yield displacement up to partial ductility of four (partial ductility is defined as the ratio of beam-tip displacement to the beam-tip displacement at the first yield). If no failure was detected two additional cycles were applied.
Figure 2.3: Loading protocol
2.1.1.2 Experimental results
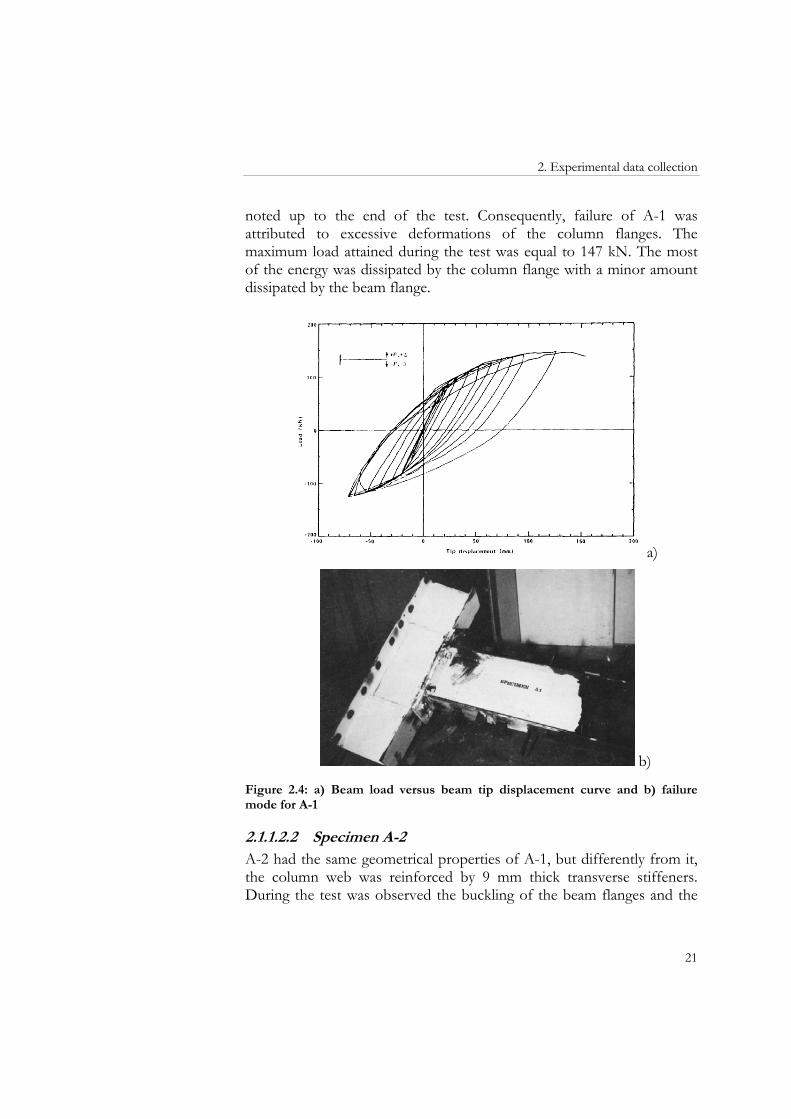
2.1.1.2.1 Specimen A-1 Specimen A-1 consisted of a W360×45 (W14×30) beam and a W360×64 (WI4×43) column. The length of the column stub and the beam were 1220 mm and 2322 mm respectively. The end plate was 25 mm thick. Eight 25 mm diameter bolts were employed in the connection. The column web was reinforced by 8 mm doubler plate. No continuity plates were used to stiffen the column flange (Figure 2.1). The experimental behaviour was represented by the beam-tip deflection versus beam-tip load curve (Figure 2.4). Since the column stub was rigidly fixed to the fixture frame, the end-beam deflection was due to elastic and inelastic deformations of the beam, column flanges, end-plate and bolts. Separation between the column flange and the end-plate was
2. Experimental data collection
21
noted up to the end of the test. Consequently, failure of A-1 was attributed to excessive deformations of the column flanges. The maximum load attained during the test was equal to 147 kN. The most of the energy was dissipated by the column flange with a minor amount dissipated by the beam flange.
a)
b)
Figure 2.4: a) Beam load versus beam tip displacement curve and b) failure mode for A-1
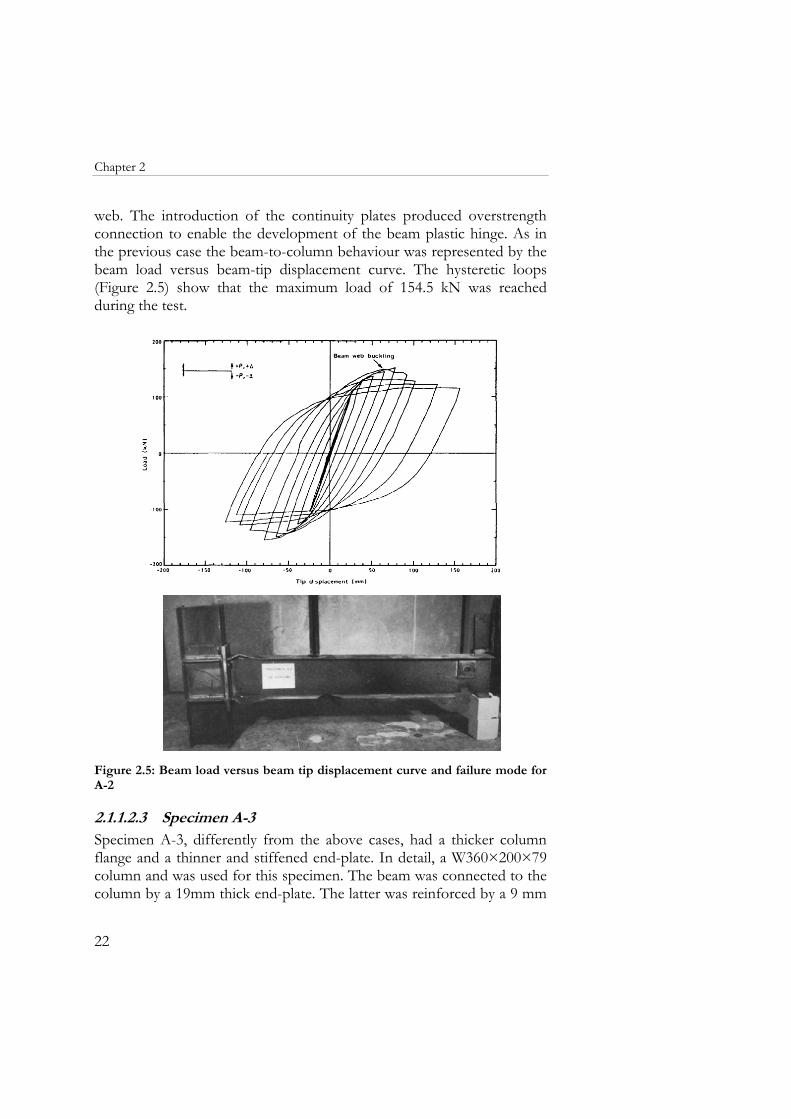
2.1.1.2.2 Specimen A-2 A-2 had the same geometrical properties of A-1, but differently from it, the column web was reinforced by 9 mm thick transverse stiffeners. During the test was observed the buckling of the beam flanges and the
Chapter 2
22
web. The introduction of the continuity plates produced overstrength connection to enable the development of the beam plastic hinge. As in the previous case the beam-to-column behaviour was represented by the beam load versus beam-tip displacement curve. The hysteretic loops (Figure 2.5) show that the maximum load of 154.5 kN was reached during the test.
Figure 2.5: Beam load versus beam tip displacement curve and failure mode for A-2
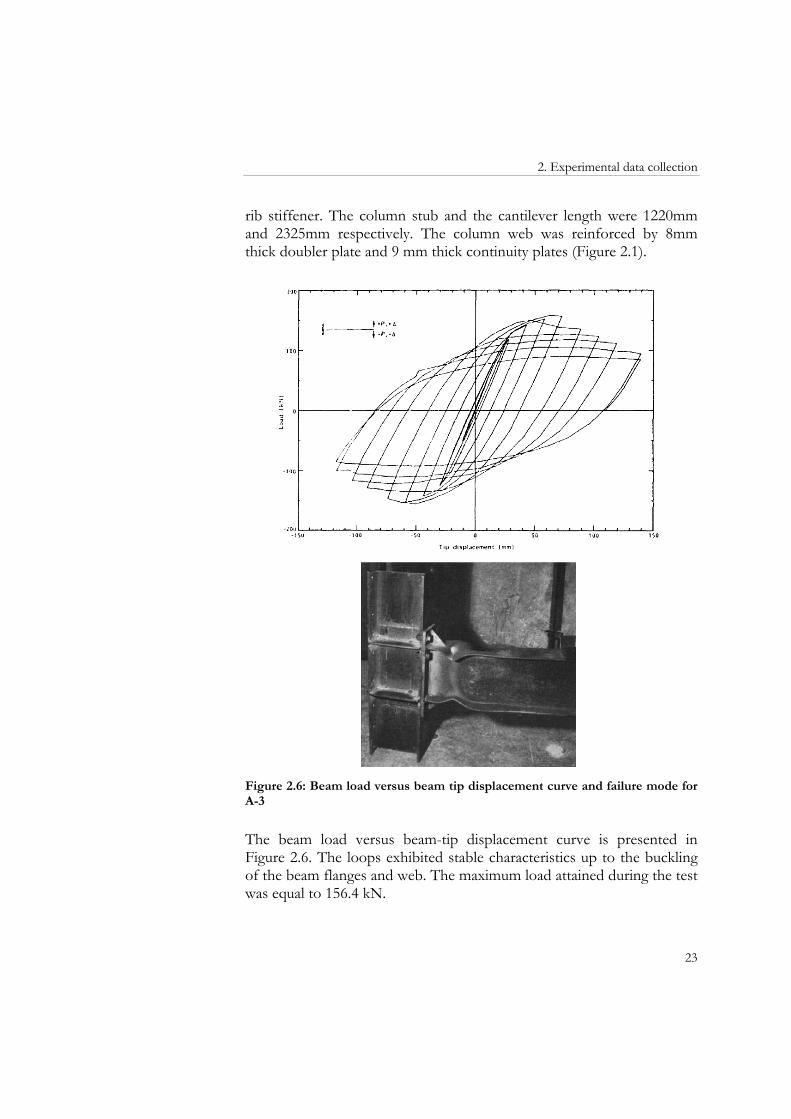
2.1.1.2.3 Specimen A-3 Specimen A-3, differently from the above cases, had a thicker column flange and a thinner and stiffened end-plate. In detail, a W360×200×79 column and was used for this specimen. The beam was connected to the column by a 19mm thick end-plate. The latter was reinforced by a 9 mm
2. Experimental data collection
23
rib stiffener. The column stub and the cantilever length were 1220mm and 2325mm respectively. The column web was reinforced by 8mm thick doubler plate and 9 mm thick continuity plates (Figure 2.1).
Figure 2.6: Beam load versus beam tip displacement curve and failure mode for A-3
The beam load versus beam-tip displacement curve is presented in Figure 2.6. The loops exhibited stable characteristics up to the buckling of the beam flanges and web. The maximum load attained during the test was equal to 156.4 kN.
Chapter 2
24
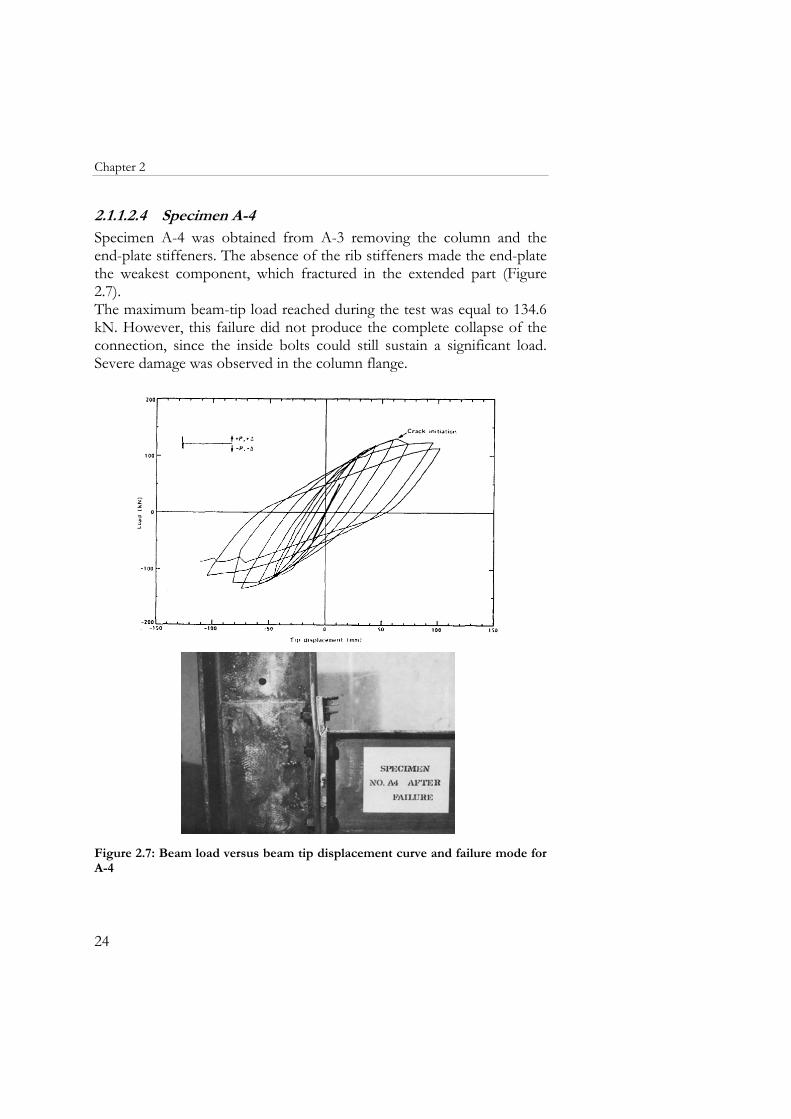
2.1.1.2.4 Specimen A-4 Specimen A-4 was obtained from A-3 removing the column and the end-plate stiffeners. The absence of the rib stiffeners made the end-plate the weakest component, which fractured in the extended part (Figure 2.7). The maximum beam-tip load reached during the test was equal to 134.6 kN. However, this failure did not produce the complete collapse of the connection, since the inside bolts could still sustain a significant load. Severe damage was observed in the column flange.
Figure 2.7: Beam load versus beam tip displacement curve and failure mode for A-4
2. Experimental data collection
25
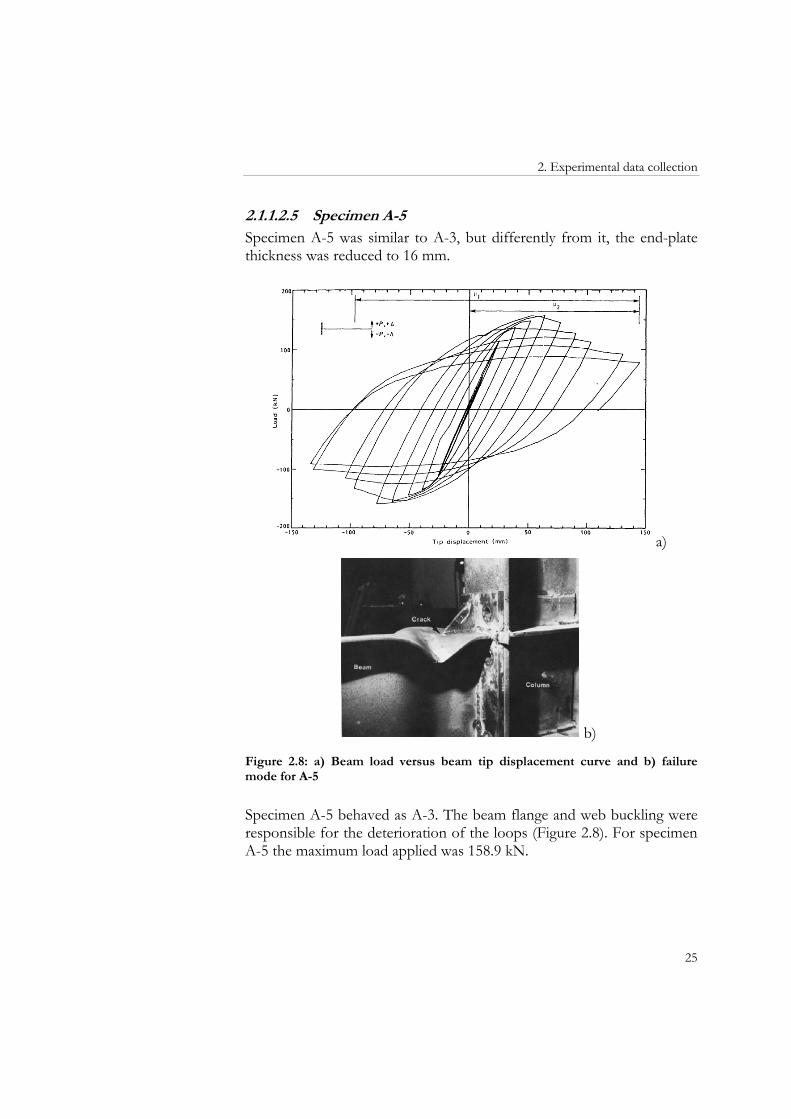
2.1.1.2.5 Specimen A-5 Specimen A-5 was similar to A-3, but differently from it, the end-plate thickness was reduced to 16 mm.
a)
b)
Figure 2.8: a) Beam load versus beam tip displacement curve and b) failure mode for A-5
Specimen A-5 behaved as A-3. The beam flange and web buckling were responsible for the deterioration of the loops (Figure 2.8). For specimen A-5 the maximum load applied was 158.9 kN.
Chapter 2
26
2.1.2 Test by Sumner and Murray (2002)
2.1.2.1 Description of specimen and test set up An extended end-plate beam-to-column connection was tested under cyclic loading. A W610×230×101 beam was connected to the flange of a W360×370×179 column. The end plate was welded to the beam using complete joint penetration groove welds for the flanges and fillet welds for the web (8 mm fillet welds on both sides of the web). The column had continuity plates in line with both connecting beam flanges and a web doubler plate, 9.5 mm thick, attached to one side of the web. The main geometrical details of the specimen are summarised in Table 2.2. Table 2.2: Specimen details
Specimen Beam Column Bolt diameter
End-plate thickness
4E-1.25-1.5-24 W610×230×101 W360×370×179 32 mm (1 1/4 in.)
38 mm (1 1/2 in.)
The beam and column were ASTM A572 Grade 50 steel (nominal yielding stress fy = 50 ksi), while the end plate, continuity plates, and web doubler plates were ASTM A36 steel (nominal yielding stress fy = 36 ksi). The bolts used are ASTM A490 (minimum tensile strength fu =150 ksi). Coupon tests results are given in Table 2.3. Table 2.3: Coupon test results
Material Measured yield strength (ksi)
Measured tensile strength (ksi)
Beam 53.6 70.7Column 52.0 70.6Column web doubler plate 42.1 64.95End-plate 38.1 68.8
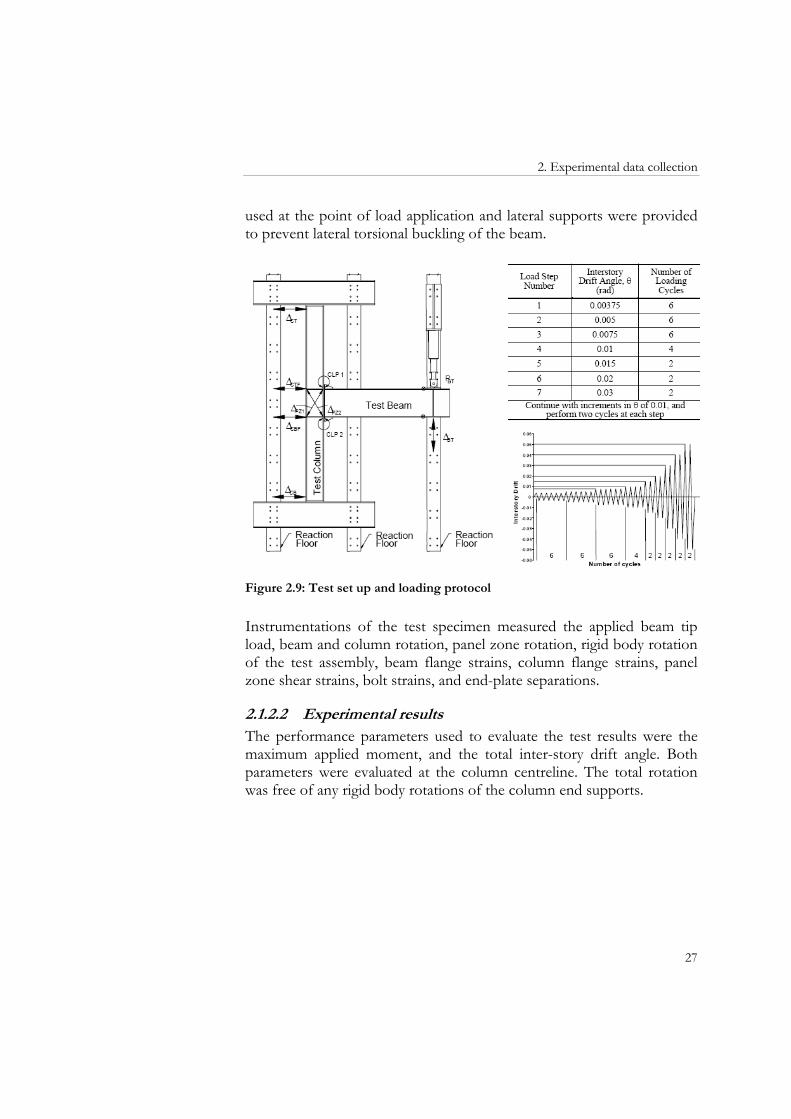
Figure 2.9 shows the test setup details and the loading protocol. The boundary conditions for the column ends were considered partially restrained. The load was applied by a loading jack, at a distance approximately of 900 mm from the beam tip, according to the SAC loading protocol (SAC Joint Venture 1997). A beam web stiffener was
2. Experimental data collection
27
used at the point of load application and lateral supports were provided to prevent lateral torsional buckling of the beam.
Figure 2.9: Test set up and loading protocol
Instrumentations of the test specimen measured the applied beam tip load, beam and column rotation, panel zone rotation, rigid body rotation of the test assembly, beam flange strains, column flange strains, panel zone shear strains, bolt strains, and end-plate separations.
2.1.2.2 Experimental results The performance parameters used to evaluate the test results were the maximum applied moment, and the total inter-story drift angle. Both parameters were evaluated at the column centreline. The total rotation was free of any rigid body rotations of the column end supports.
Chapter 2
28
a)
b)
Figure 2.10: a) Moment rotation curve and b) failure mode for 4E-1.25-1.5-24
The specimen behaved as expected with beam failure exhibiting large ductility, rotation capacity, and energy dissipation. The beam failure involved a combination of flange and web local buckling (Figure 2.10).
2.1.3 Tests by Nogueiro et al. (2006)
2.1.3.1 Description of specimens and test set up Six end-plate beam-to-column steel joints were tested under arbitrary cyclic loading. The experimental programme was divided into two
2. Experimental data collection
29
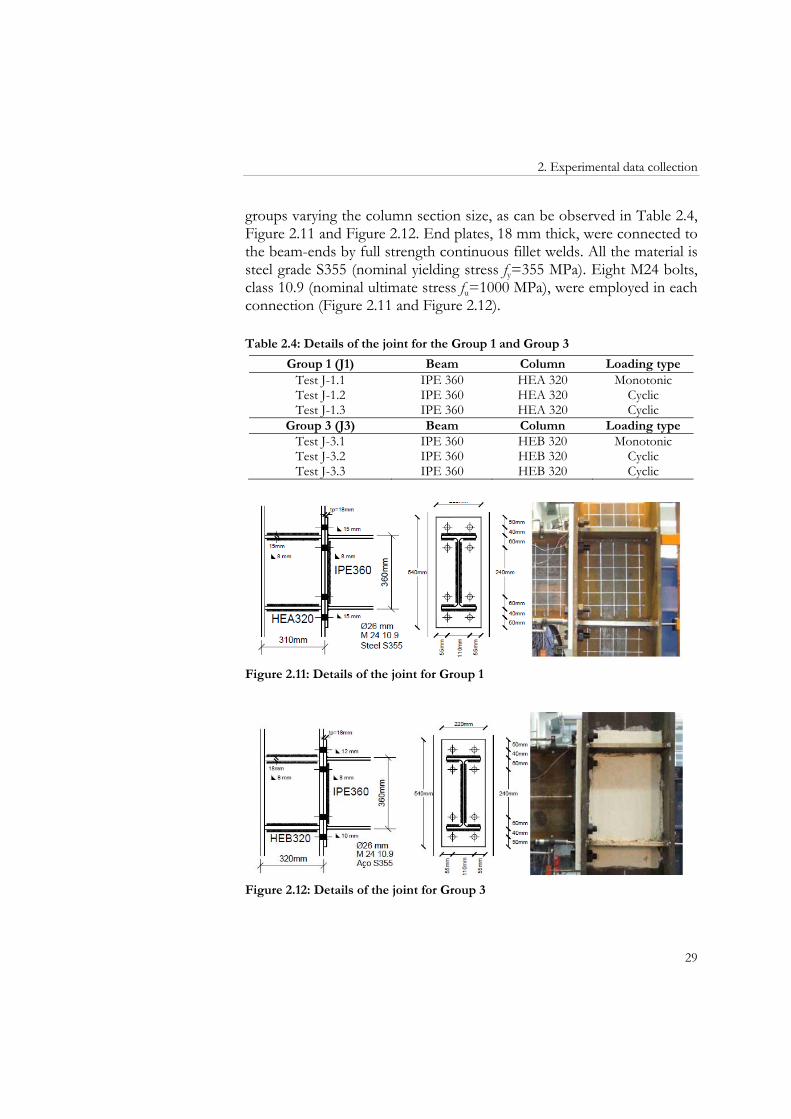
groups varying the column section size, as can be observed in Table 2.4, Figure 2.11 and Figure 2.12. End plates, 18 mm thick, were connected to the beam-ends by full strength continuous fillet welds. All the material is steel grade S355 (nominal yielding stress fy=355 MPa). Eight M24 bolts, class 10.9 (nominal ultimate stress fu=1000 MPa), were employed in each connection (Figure 2.11 and Figure 2.12). Table 2.4: Details of the joint for the Group 1 and Group 3
Group 1 (J1) Beam Column Loading type Test J-1.1 IPE 360 HEA 320 MonotonicTest J-1.2 IPE 360 HEA 320 CyclicTest J-1.3 IPE 360 HEA 320 Cyclic
Group 3 (J3) Beam Column Loading typeTest J-3.1 IPE 360 HEB 320 MonotonicTest J-3.2 IPE 360 HEB 320 CyclicTest J-3.3 IPE 360 HEB 320 Cyclic
Figure 2.11: Details of the joint for Group 1
Figure 2.12: Details of the joint for Group 3
Chapter 2
30
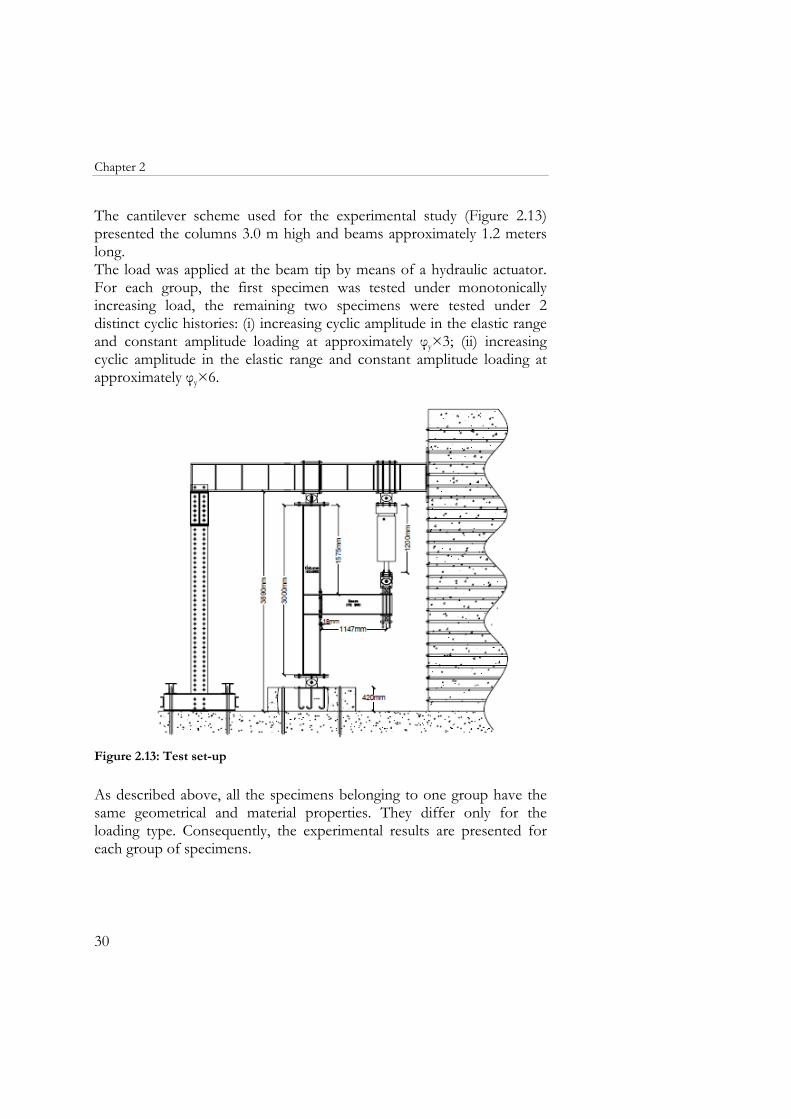
The cantilever scheme used for the experimental study (Figure 2.13) presented the columns 3.0 m high and beams approximately 1.2 meters long. The load was applied at the beam tip by means of a hydraulic actuator. For each group, the first specimen was tested under monotonically increasing load, the remaining two specimens were tested under 2 distinct cyclic histories: (i) increasing cyclic amplitude in the elastic range and constant amplitude loading at approximately φy×3; (ii) increasing cyclic amplitude in the elastic range and constant amplitude loading at approximately φy×6.
Figure 2.13: Test set-up
As described above, all the specimens belonging to one group have the same geometrical and material properties. They differ only for the loading type. Consequently, the experimental results are presented for each group of specimens.
2. Experimental data collection
31
2.1.3.2 Experimental results
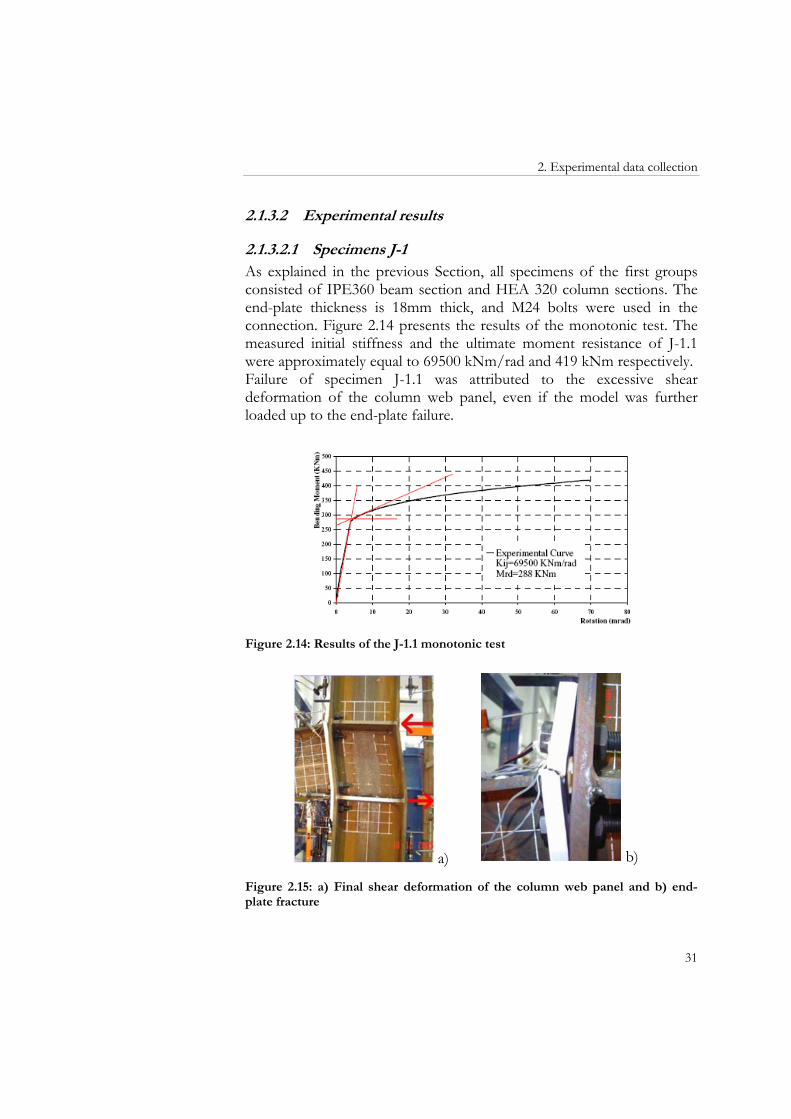
2.1.3.2.1 Specimens J-1 As explained in the previous Section, all specimens of the first groups consisted of IPE360 beam section and HEA 320 column sections. The end-plate thickness is 18mm thick, and M24 bolts were used in the connection. Figure 2.14 presents the results of the monotonic test. The measured initial stiffness and the ultimate moment resistance of J-1.1 were approximately equal to 69500 kNm/rad and 419 kNm respectively. Failure of specimen J-1.1 was attributed to the excessive shear deformation of the column web panel, even if the model was further loaded up to the end-plate failure.
Figure 2.14: Results of the J-1.1 monotonic test
a) b)
Figure 2.15: a) Final shear deformation of the column web panel and b) end-plate fracture
Chapter 2
32
Figure 2.16: M-Ø experimental curves for J-1.2 and J-1.3 tests
Figure 2.16 presents the hysteretic moment-rotation experimental curves, respectively for J-1.2 and J-1.3 tests. Both specimen J-1.2 and J-1.3 exhibited cracking in the extended end plate at the HAZ zone.
Figure 2.17: End-plate failure, column web panel and end-plate deformation for J-1.3
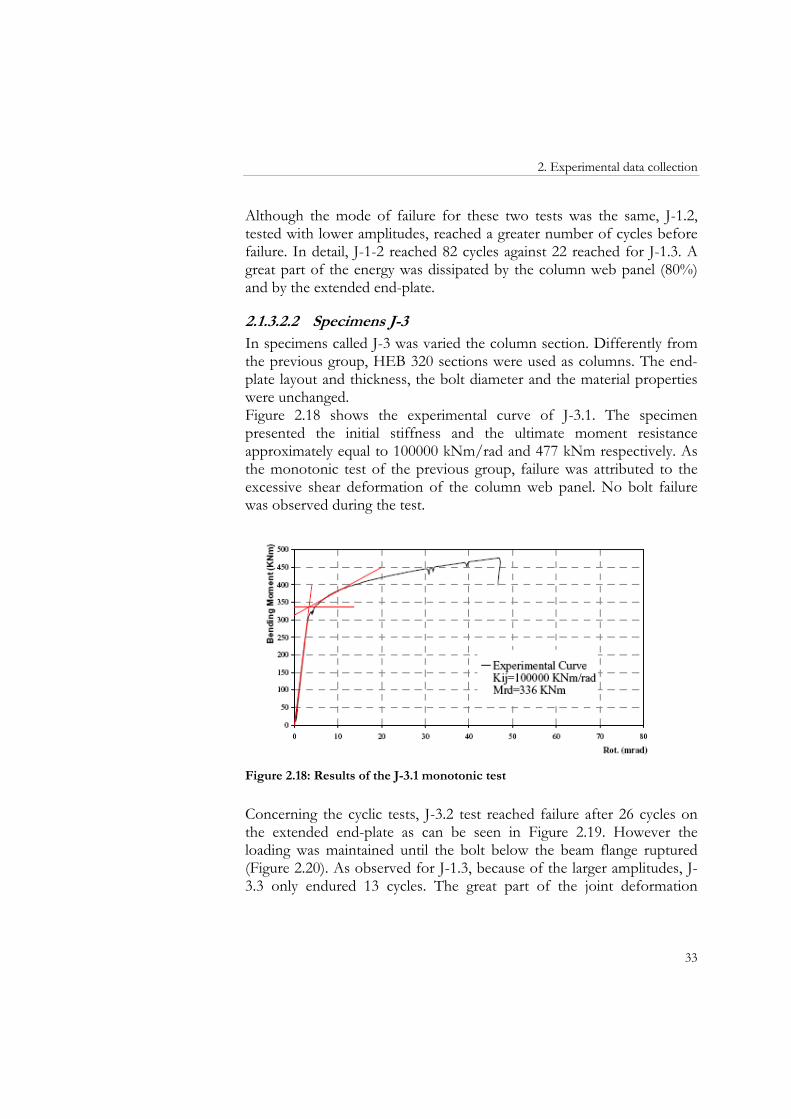
2. Experimental data collection
33
Although the mode of failure for these two tests was the same, J-1.2, tested with lower amplitudes, reached a greater number of cycles before failure. In detail, J-1-2 reached 82 cycles against 22 reached for J-1.3. A great part of the energy was dissipated by the column web panel (80%) and by the extended end-plate.
2.1.3.2.2 Specimens J-3 In specimens called J-3 was varied the column section. Differently from the previous group, HEB 320 sections were used as columns. The end-plate layout and thickness, the bolt diameter and the material properties were unchanged. Figure 2.18 shows the experimental curve of J-3.1. The specimen presented the initial stiffness and the ultimate moment resistance approximately equal to 100000 kNm/rad and 477 kNm respectively. As the monotonic test of the previous group, failure was attributed to the excessive shear deformation of the column web panel. No bolt failure was observed during the test.
Figure 2.18: Results of the J-3.1 monotonic test
Concerning the cyclic tests, J-3.2 test reached failure after 26 cycles on the extended end-plate as can be seen in Figure 2.19. However the loading was maintained until the bolt below the beam flange ruptured (Figure 2.20). As observed for J-1.3, because of the larger amplitudes, J-3.3 only endured 13 cycles. The great part of the joint deformation
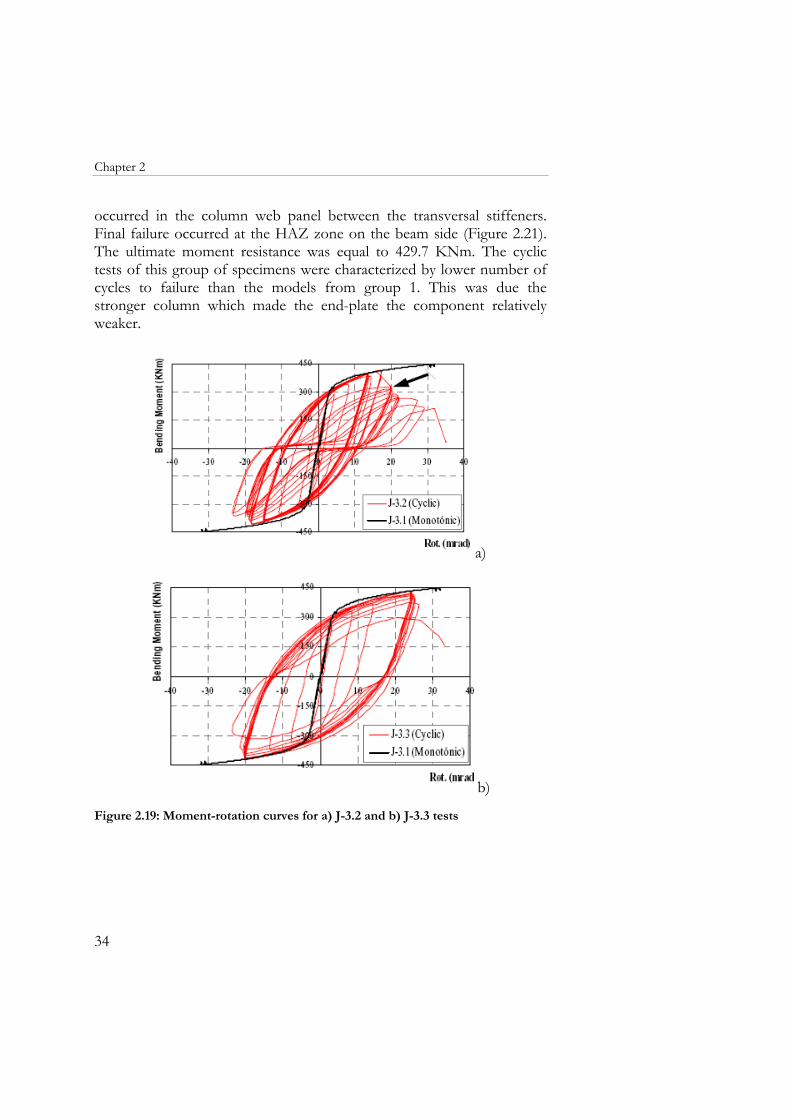
Chapter 2
34
occurred in the column web panel between the transversal stiffeners. Final failure occurred at the HAZ zone on the beam side (Figure 2.21). The ultimate moment resistance was equal to 429.7 KNm. The cyclic tests of this group of specimens were characterized by lower number of cycles to failure than the models from group 1. This was due the stronger column which made the end-plate the component relatively weaker.
a)
b)
Figure 2.19: Moment-rotation curves for a) J-3.2 and b) J-3.3 tests
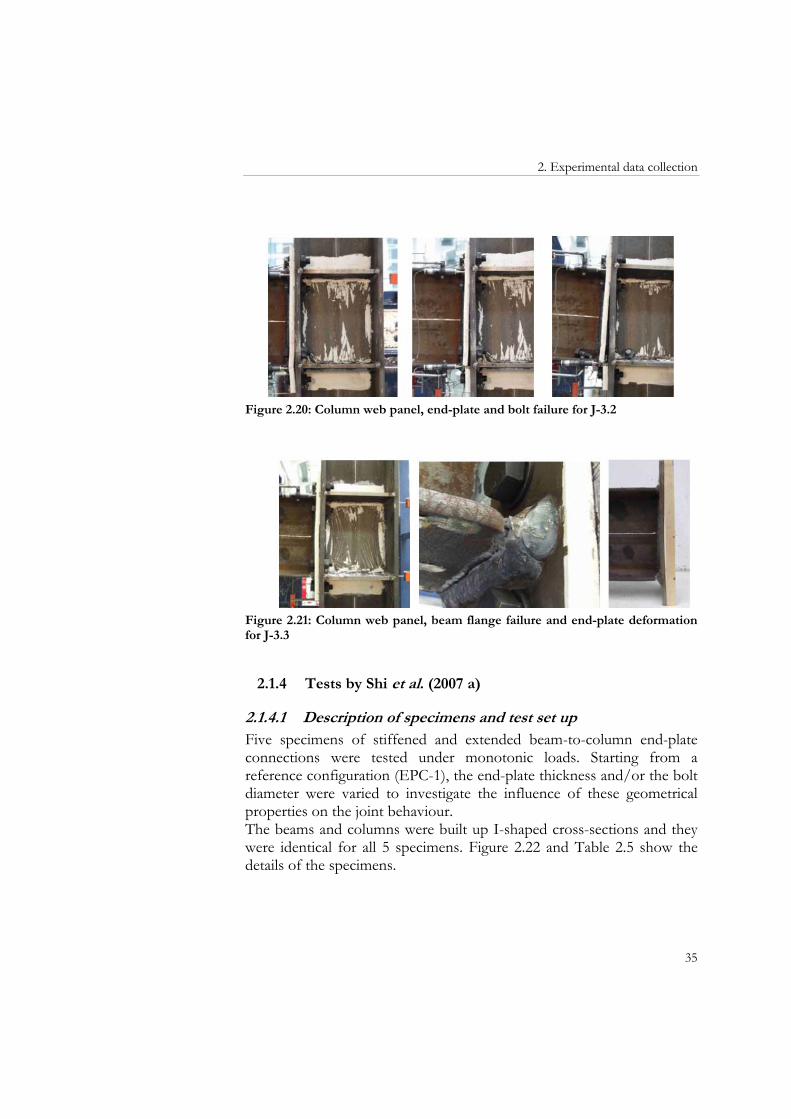
2. Experimental data collection
35
Figure 2.20: Column web panel, end-plate and bolt failure for J-3.2
Figure 2.21: Column web panel, beam flange failure and end-plate deformation for J-3.3
2.1.4 Tests by Shi et al. (2007 a)
2.1.4.1 Description of specimens and test set up Five specimens of stiffened and extended beam-to-column end-plate connections were tested under monotonic loads. Starting from a reference configuration (EPC-1), the end-plate thickness and/or the bolt diameter were varied to investigate the influence of these geometrical properties on the joint behaviour. The beams and columns were built up I-shaped cross-sections and they were identical for all 5 specimens. Figure 2.22 and Table 2.5 show the details of the specimens.
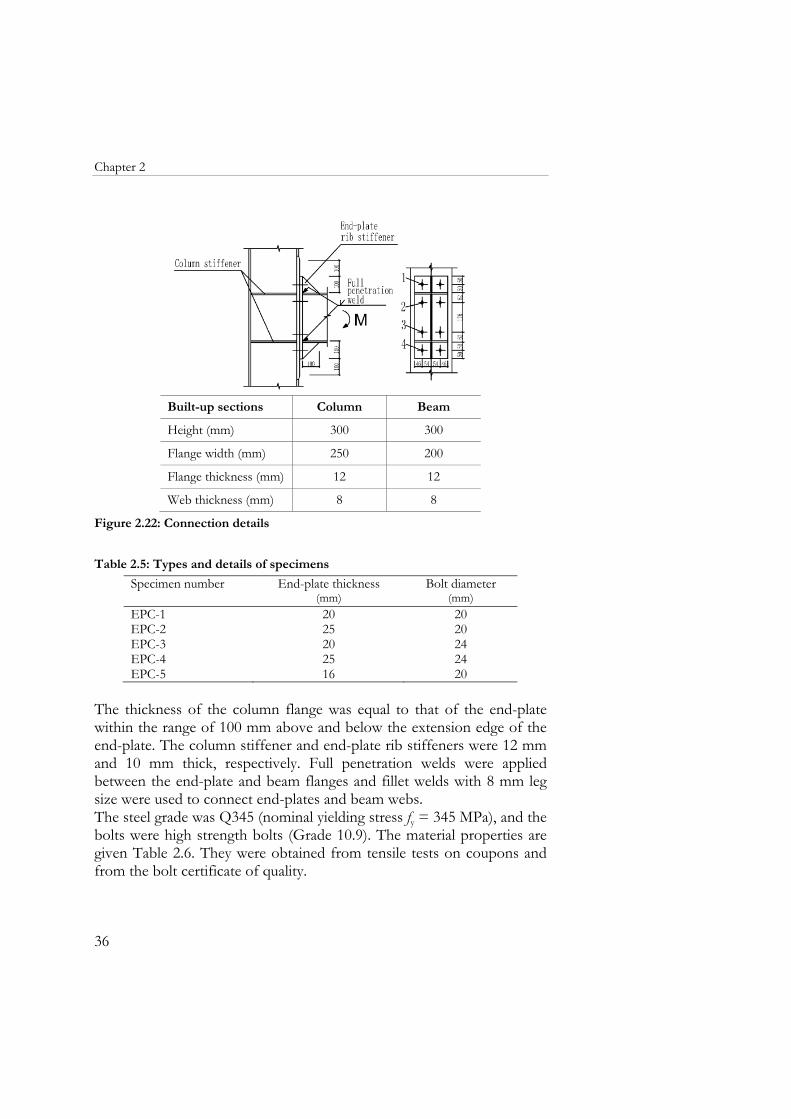
Chapter 2
36
Built-up sections Column Beam
Height (mm) 300 300
Flange width (mm) 250 200
Flange thickness (mm) 12 12
Web thickness (mm) 8 8
Figure 2.22: Connection details
Table 2.5: Types and details of specimens
Specimen number End-plate thickness Bolt diameter (mm) (mm) EPC-1 20 20EPC-2 25 20EPC-3 20 24EPC-4 25 24EPC-5 16 20
The thickness of the column flange was equal to that of the end-plate within the range of 100 mm above and below the extension edge of the end-plate. The column stiffener and end-plate rib stiffeners were 12 mm and 10 mm thick, respectively. Full penetration welds were applied between the end-plate and beam flanges and fillet welds with 8 mm leg size were used to connect end-plates and beam webs. The steel grade was Q345 (nominal yielding stress fy = 345 MPa), and the bolts were high strength bolts (Grade 10.9). The material properties are given Table 2.6. They were obtained from tensile tests on coupons and from the bolt certificate of quality.
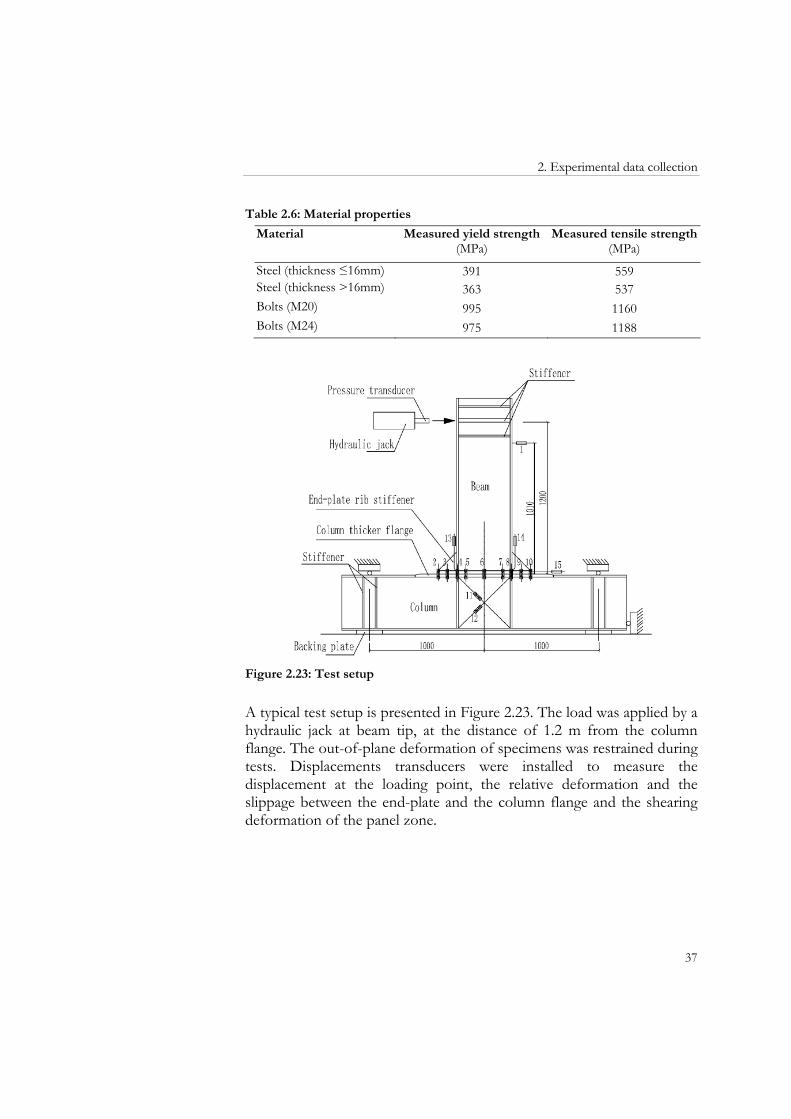
2. Experimental data collection
37
Table 2.6: Material properties
Material Measured yield strength (MPa)
Measured tensile strength (MPa)
Steel (thickness ≤16mm) 391 559 Steel (thickness >16mm) 363 537 Bolts (M20) 995 1160 Bolts (M24) 975 1188
Figure 2.23: Test setup
A typical test setup is presented in Figure 2.23. The load was applied by a hydraulic jack at beam tip, at the distance of 1.2 m from the column flange. The out-of-plane deformation of specimens was restrained during tests. Displacements transducers were installed to measure the displacement at the loading point, the relative deformation and the slippage between the end-plate and the column flange and the shearing deformation of the panel zone.
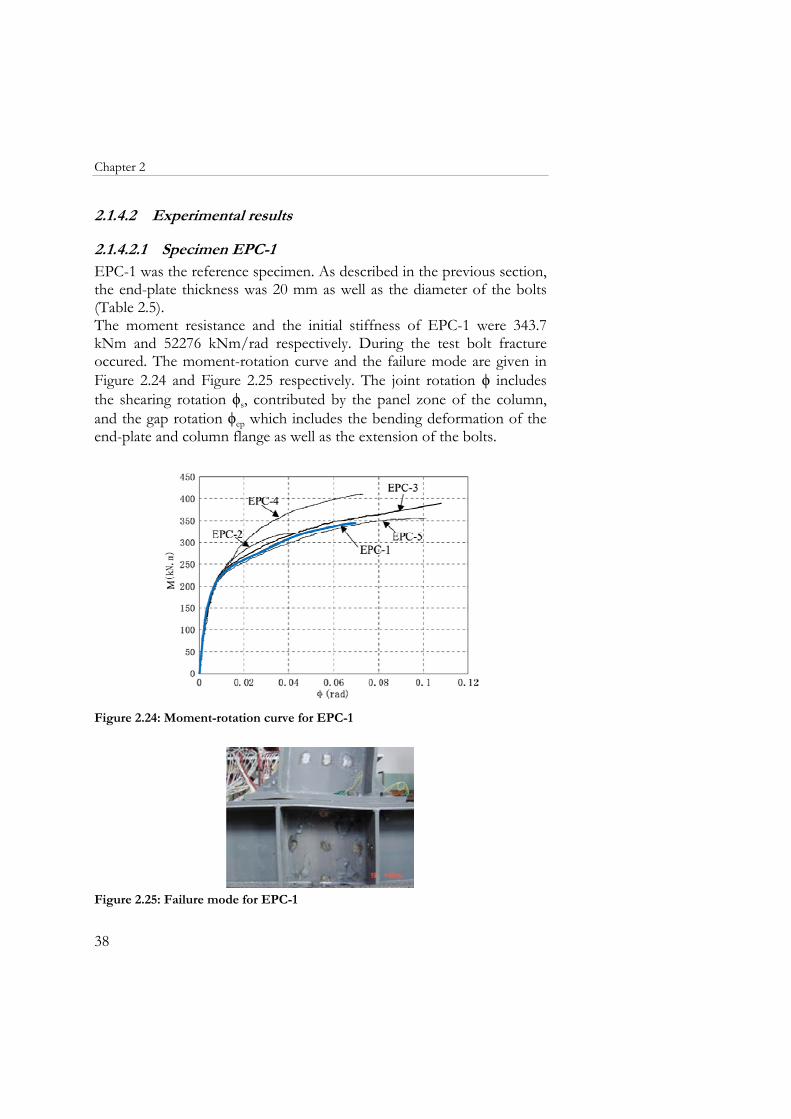
Chapter 2
38
2.1.4.2 Experimental results
2.1.4.2.1 Specimen EPC-1 EPC-1 was the reference specimen. As described in the previous section, the end-plate thickness was 20 mm as well as the diameter of the bolts (Table 2.5). The moment resistance and the initial stiffness of EPC-1 were 343.7 kNm and 52276 kNm/rad respectively. During the test bolt fracture occured. The moment-rotation curve and the failure mode are given in Figure 2.24 and Figure 2.25 respectively. The joint rotation ϕ includes the shearing rotation ϕs, contributed by the panel zone of the column, and the gap rotation ϕep which includes the bending deformation of the end-plate and column flange as well as the extension of the bolts.
Figure 2.24: Moment-rotation curve for EPC-1
Figure 2.25: Failure mode for EPC-1
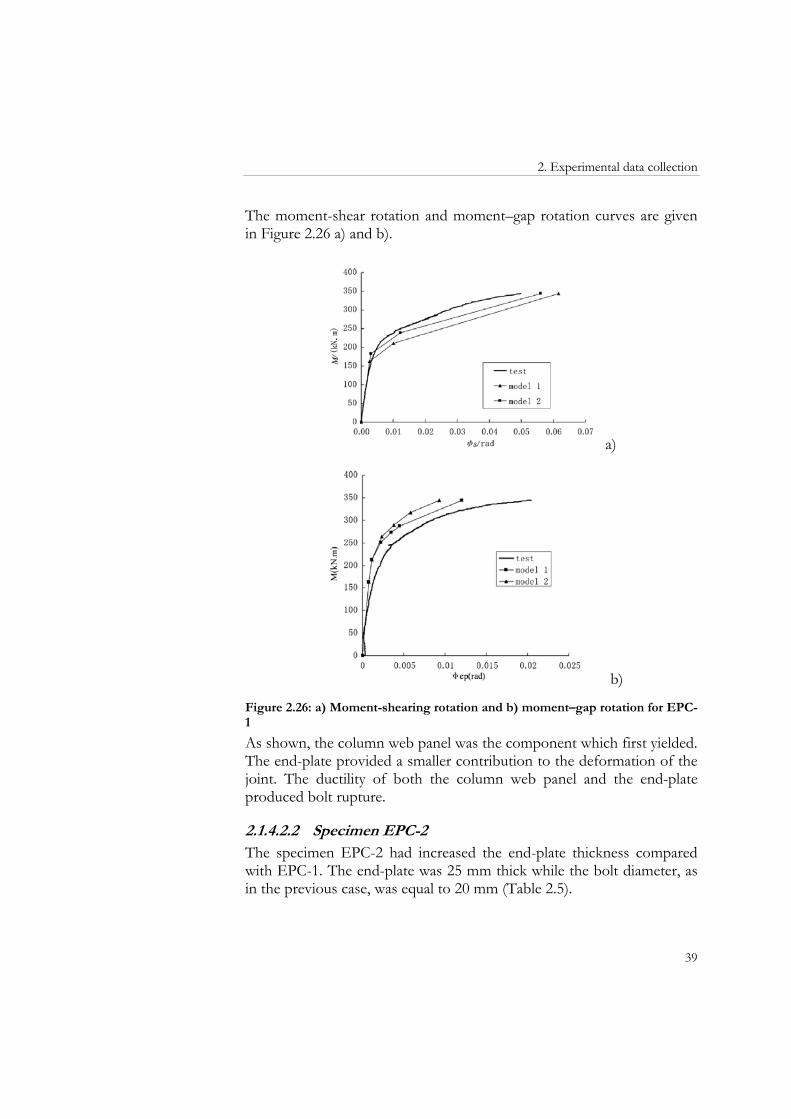
2. Experimental data collection
39
The moment-shear rotation and moment–gap rotation curves are given in Figure 2.26 a) and b).
a)
b)
Figure 2.26: a) Moment-shearing rotation and b) moment–gap rotation for EPC-1
As shown, the column web panel was the component which first yielded. The end-plate provided a smaller contribution to the deformation of the joint. The ductility of both the column web panel and the end-plate produced bolt rupture.
2.1.4.2.2 Specimen EPC-2 The specimen EPC-2 had increased the end-plate thickness compared with EPC-1. The end-plate was 25 mm thick while the bolt diameter, as in the previous case, was equal to 20 mm (Table 2.5).
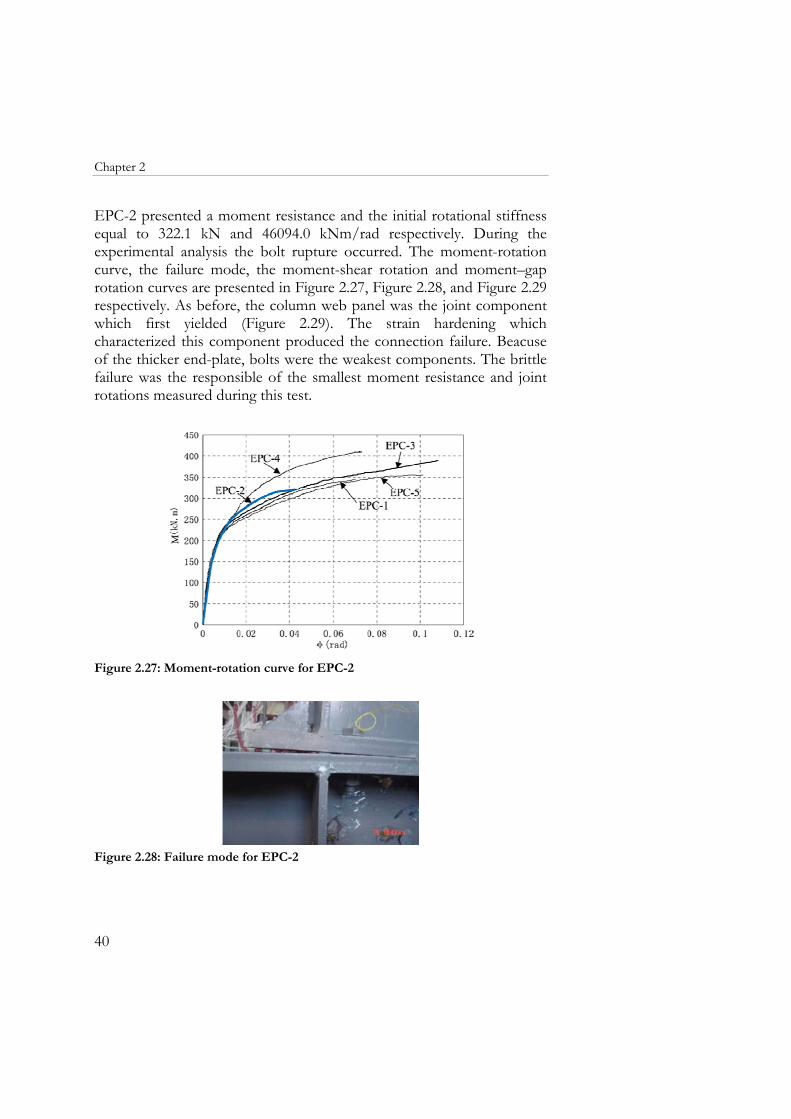
Chapter 2
40
EPC-2 presented a moment resistance and the initial rotational stiffness equal to 322.1 kN and 46094.0 kNm/rad respectively. During the experimental analysis the bolt rupture occurred. The moment-rotation curve, the failure mode, the moment-shear rotation and moment–gap rotation curves are presented in Figure 2.27, Figure 2.28, and Figure 2.29 respectively. As before, the column web panel was the joint component which first yielded (Figure 2.29). The strain hardening which characterized this component produced the connection failure. Beacuse of the thicker end-plate, bolts were the weakest components. The brittle failure was the responsible of the smallest moment resistance and joint rotations measured during this test.
Figure 2.27: Moment-rotation curve for EPC-2
Figure 2.28: Failure mode for EPC-2
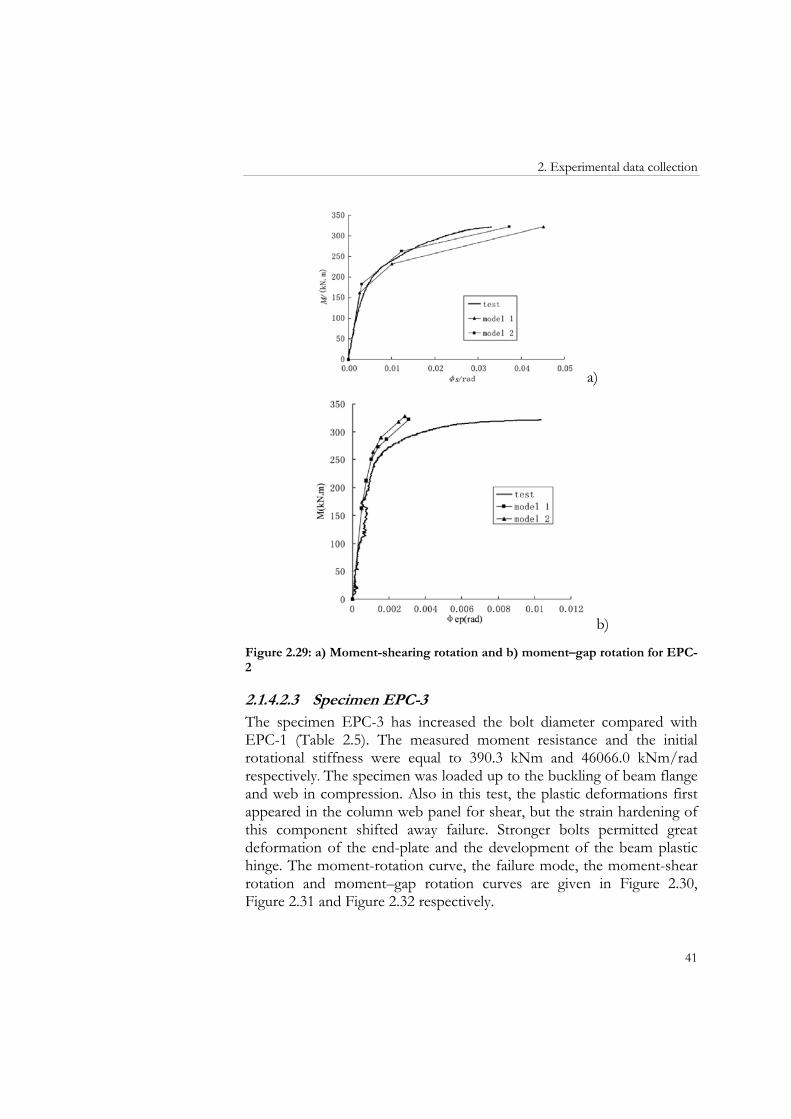
2. Experimental data collection
41
a)
b)
Figure 2.29: a) Moment-shearing rotation and b) moment–gap rotation for EPC-2
2.1.4.2.3 Specimen EPC-3 The specimen EPC-3 has increased the bolt diameter compared with EPC-1 (Table 2.5). The measured moment resistance and the initial rotational stiffness were equal to 390.3 kNm and 46066.0 kNm/rad respectively. The specimen was loaded up to the buckling of beam flange and web in compression. Also in this test, the plastic deformations first appeared in the column web panel for shear, but the strain hardening of this component shifted away failure. Stronger bolts permitted great deformation of the end-plate and the development of the beam plastic hinge. The moment-rotation curve, the failure mode, the moment-shear rotation and moment–gap rotation curves are given in Figure 2.30, Figure 2.31 and Figure 2.32 respectively.
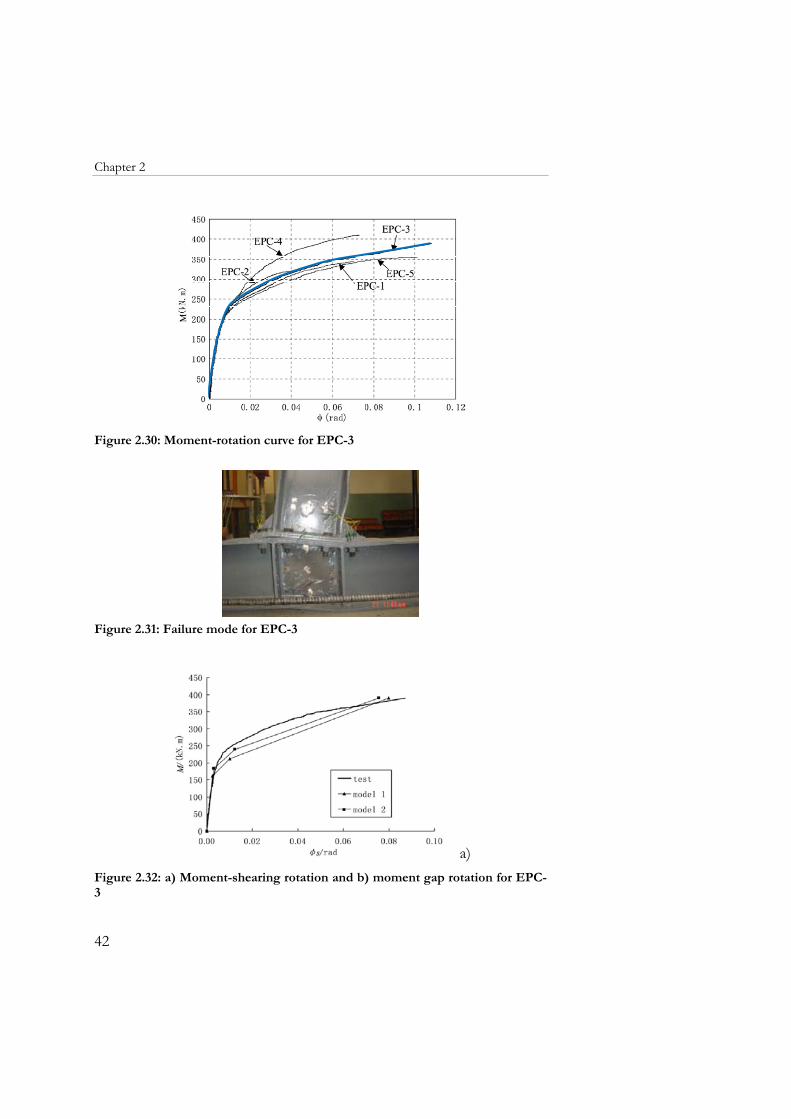
Chapter 2
42
Figure 2.30: Moment-rotation curve for EPC-3
Figure 2.31: Failure mode for EPC-3
a) Figure 2.32: a) Moment-shearing rotation and b) moment gap rotation for EPC-3
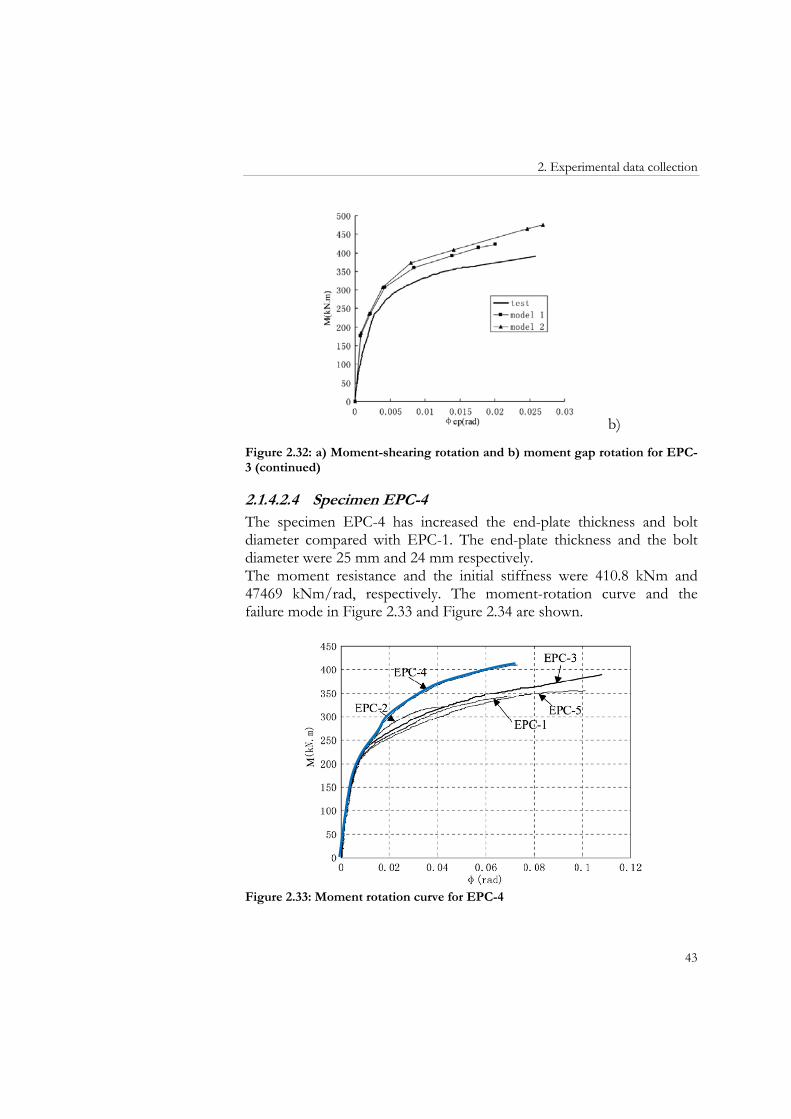
2. Experimental data collection
43
b)
Figure 2.32: a) Moment-shearing rotation and b) moment gap rotation for EPC-3 (continued)
2.1.4.2.4 Specimen EPC-4 The specimen EPC-4 has increased the end-plate thickness and bolt diameter compared with EPC-1. The end-plate thickness and the bolt diameter were 25 mm and 24 mm respectively. The moment resistance and the initial stiffness were 410.8 kNm and 47469 kNm/rad, respectively. The moment-rotation curve and the failure mode in Figure 2.33 and Figure 2.34 are shown.
Figure 2.33: Moment rotation curve for EPC-4
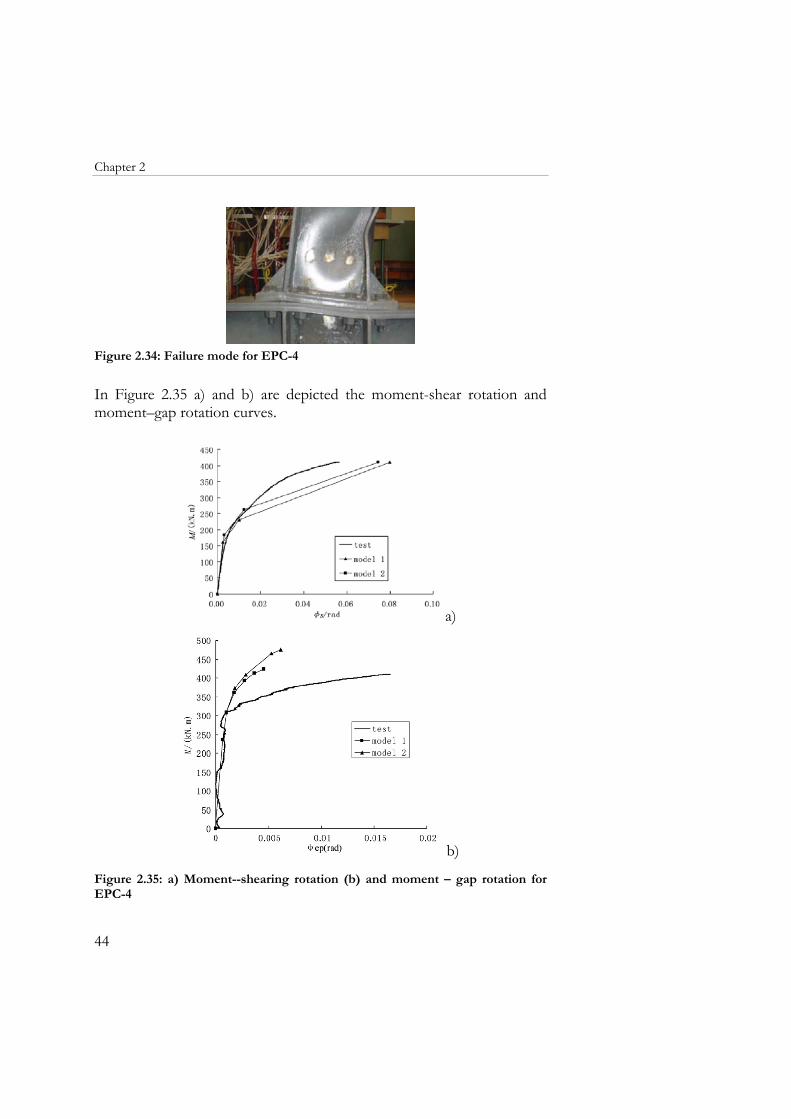
Chapter 2
44
Figure 2.34: Failure mode for EPC-4
In Figure 2.35 a) and b) are depicted the moment-shear rotation and moment–gap rotation curves.
a)
b)
Figure 2.35: a) Moment--shearing rotation (b) and moment – gap rotation for EPC-4
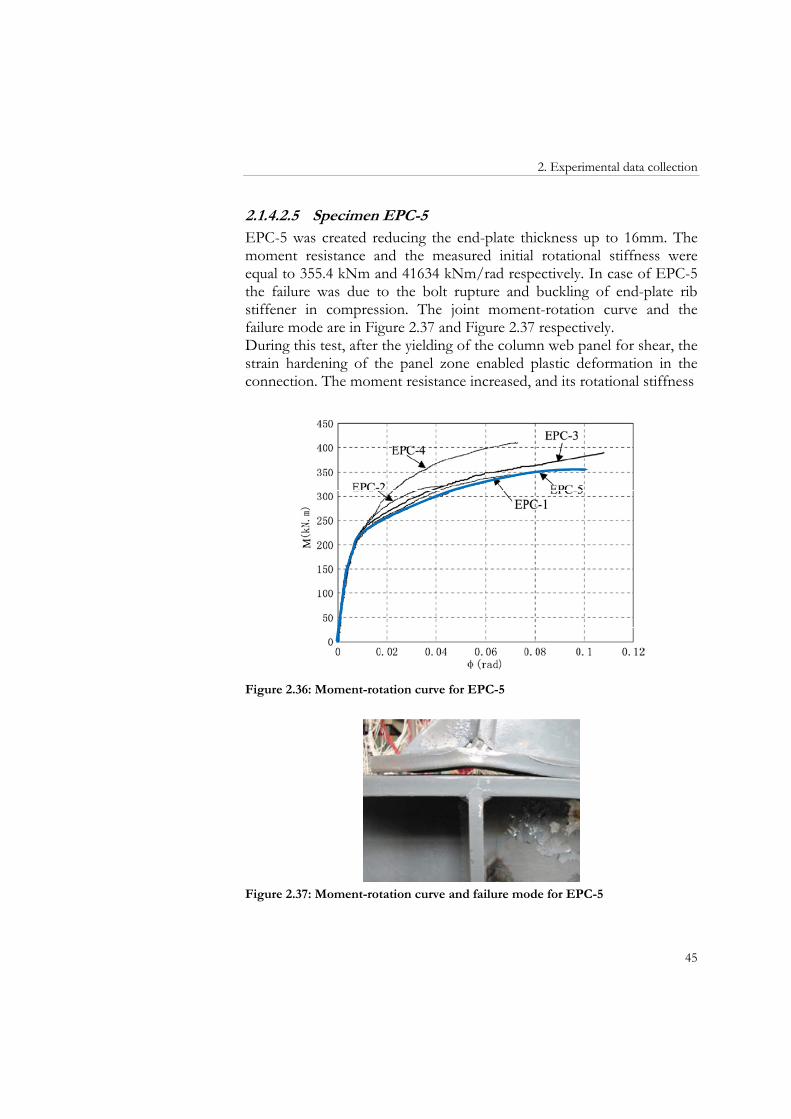
2. Experimental data collection
45
2.1.4.2.5 Specimen EPC-5 EPC-5 was created reducing the end-plate thickness up to 16mm. The moment resistance and the measured initial rotational stiffness were equal to 355.4 kNm and 41634 kNm/rad respectively. In case of EPC-5 the failure was due to the bolt rupture and buckling of end-plate rib stiffener in compression. The joint moment-rotation curve and the failure mode are in Figure 2.37 and Figure 2.37 respectively. During this test, after the yielding of the column web panel for shear, the strain hardening of the panel zone enabled plastic deformation in the connection. The moment resistance increased, and its rotational stiffness
Figure 2.36: Moment-rotation curve for EPC-5
Figure 2.37: Moment-rotation curve and failure mode for EPC-5
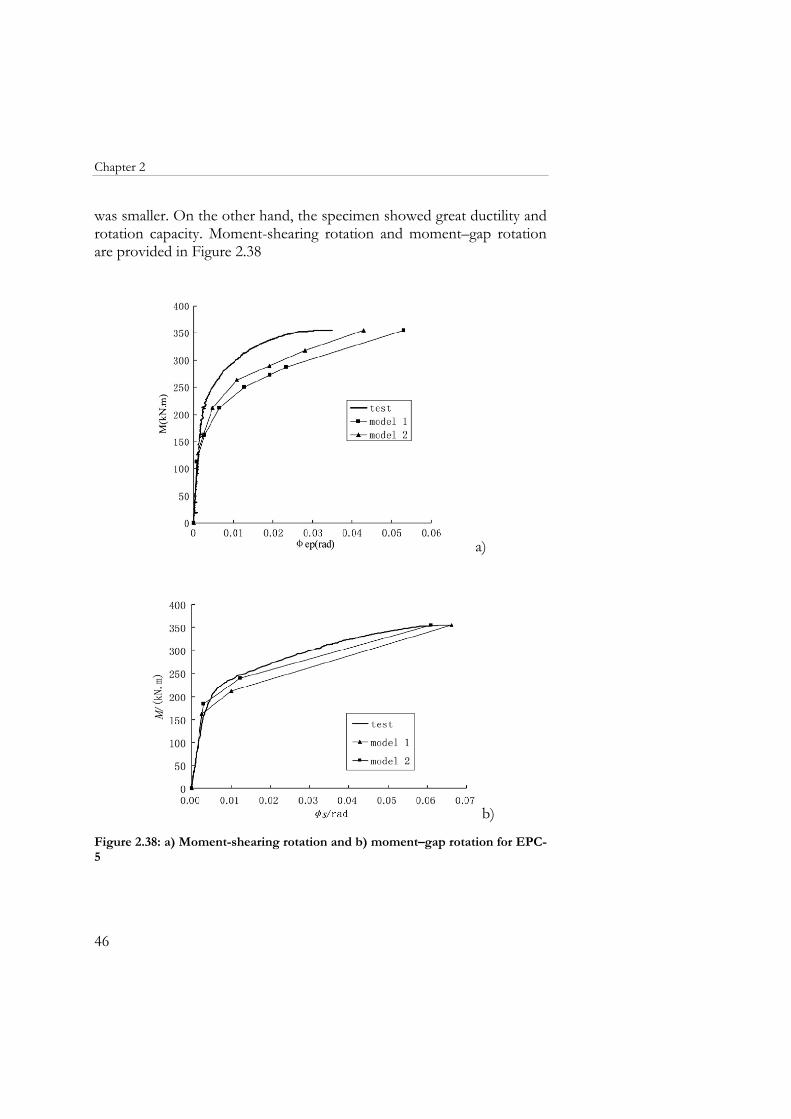
Chapter 2
46
was smaller. On the other hand, the specimen showed great ductility and rotation capacity. Moment-shearing rotation and moment–gap rotation are provided in Figure 2.38
a)
b)
Figure 2.38: a) Moment-shearing rotation and b) moment–gap rotation for EPC-5
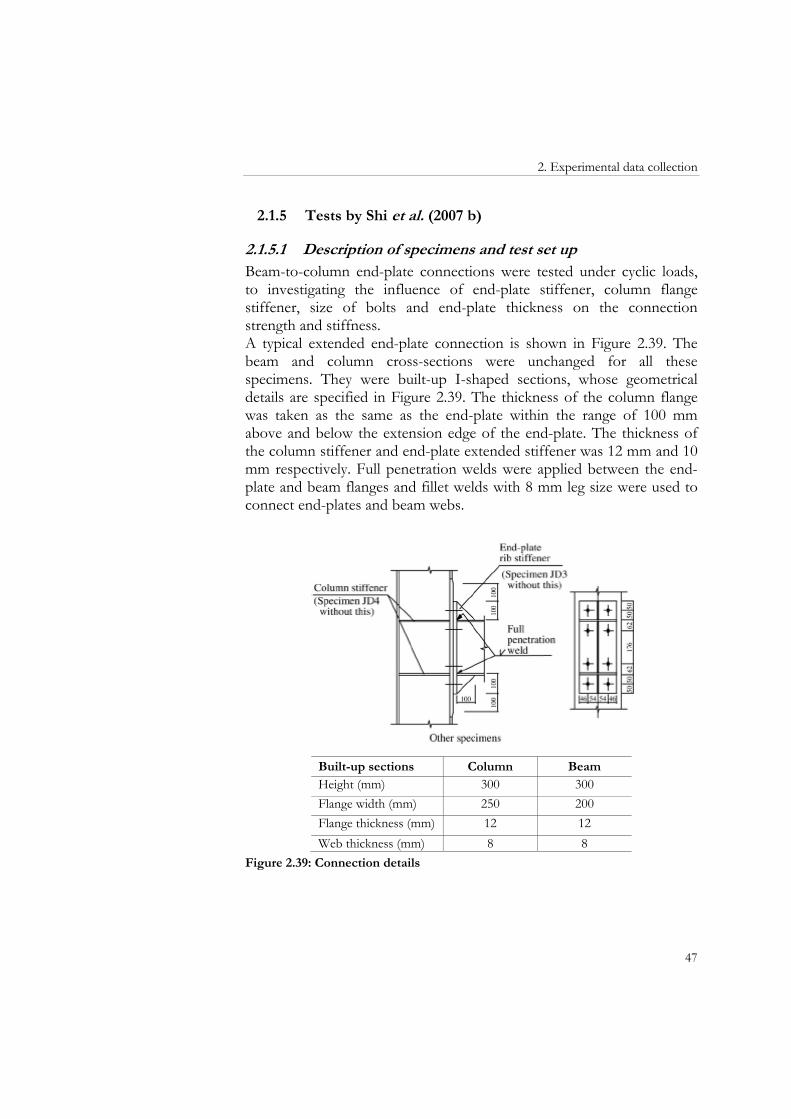
2. Experimental data collection
47
2.1.5 Tests by Shi et al. (2007 b)
2.1.5.1 Description of specimens and test set up Beam-to-column end-plate connections were tested under cyclic loads, to investigating the influence of end-plate stiffener, column flange stiffener, size of bolts and end-plate thickness on the connection strength and stiffness. A typical extended end-plate connection is shown in Figure 2.39. The beam and column cross-sections were unchanged for all these specimens. They were built-up I-shaped sections, whose geometrical details are specified in Figure 2.39. The thickness of the column flange was taken as the same as the end-plate within the range of 100 mm above and below the extension edge of the end-plate. The thickness of the column stiffener and end-plate extended stiffener was 12 mm and 10 mm respectively. Full penetration welds were applied between the end-plate and beam flanges and fillet welds with 8 mm leg size were used to connect end-plates and beam webs.
Built-up sections Column Beam Height (mm) 300 300 Flange width (mm) 250 200 Flange thickness (mm) 12 12 Web thickness (mm) 8 8
Figure 2.39: Connection details
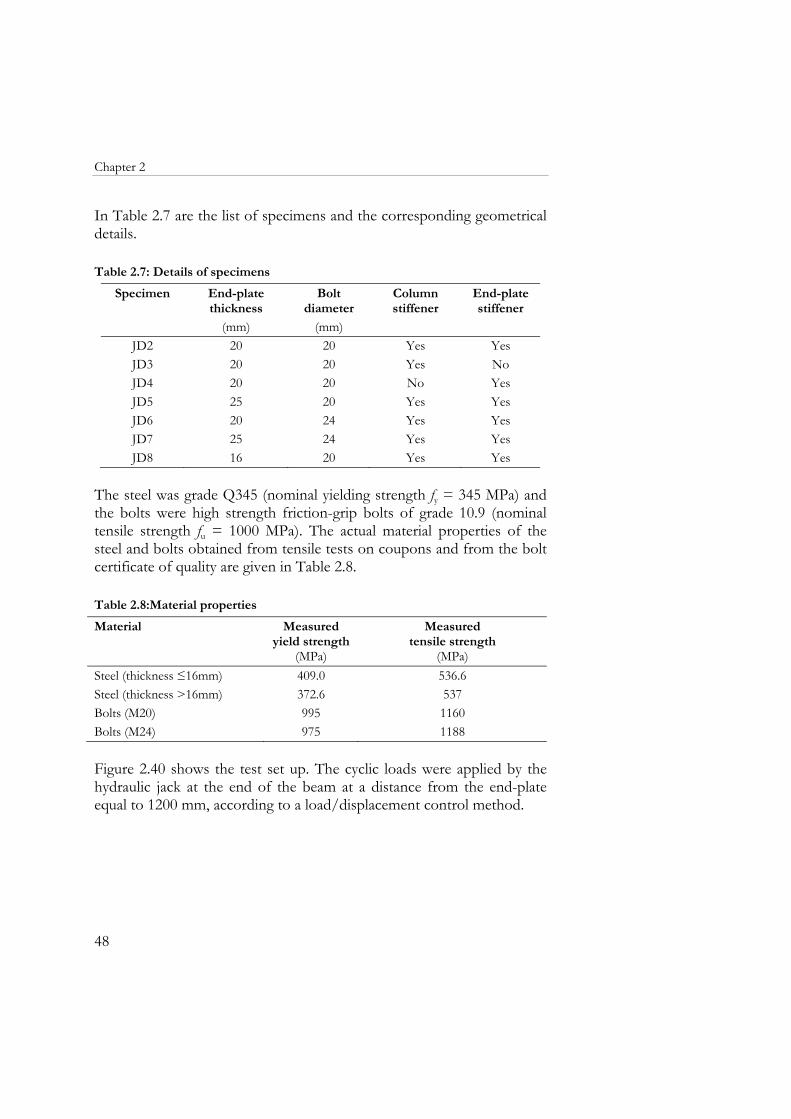
Chapter 2
48
In Table 2.7 are the list of specimens and the corresponding geometrical details. Table 2.7: Details of specimens
Specimen End-plate thickness
Bolt diameter
Column stiffener
End-plate stiffener
(mm) (mm)JD2 20 20 Yes YesJD3 20 20 Yes NoJD4 20 20 No YesJD5 25 20 Yes YesJD6 20 24 Yes YesJD7 25 24 Yes YesJD8 16 20 Yes Yes
The steel was grade Q345 (nominal yielding strength fy = 345 MPa) and the bolts were high strength friction-grip bolts of grade 10.9 (nominal tensile strength fu = 1000 MPa). The actual material properties of the steel and bolts obtained from tensile tests on coupons and from the bolt certificate of quality are given in Table 2.8. Table 2.8:Material properties
Material Measured yield strength
(MPa)
Measured tensile strength
(MPa) Steel (thickness ≤16mm) 409.0 536.6Steel (thickness >16mm) 372.6 537Bolts (M20) 995 1160Bolts (M24) 975 1188 Figure 2.40 shows the test set up. The cyclic loads were applied by the hydraulic jack at the end of the beam at a distance from the end-plate equal to 1200 mm, according to a load/displacement control method.
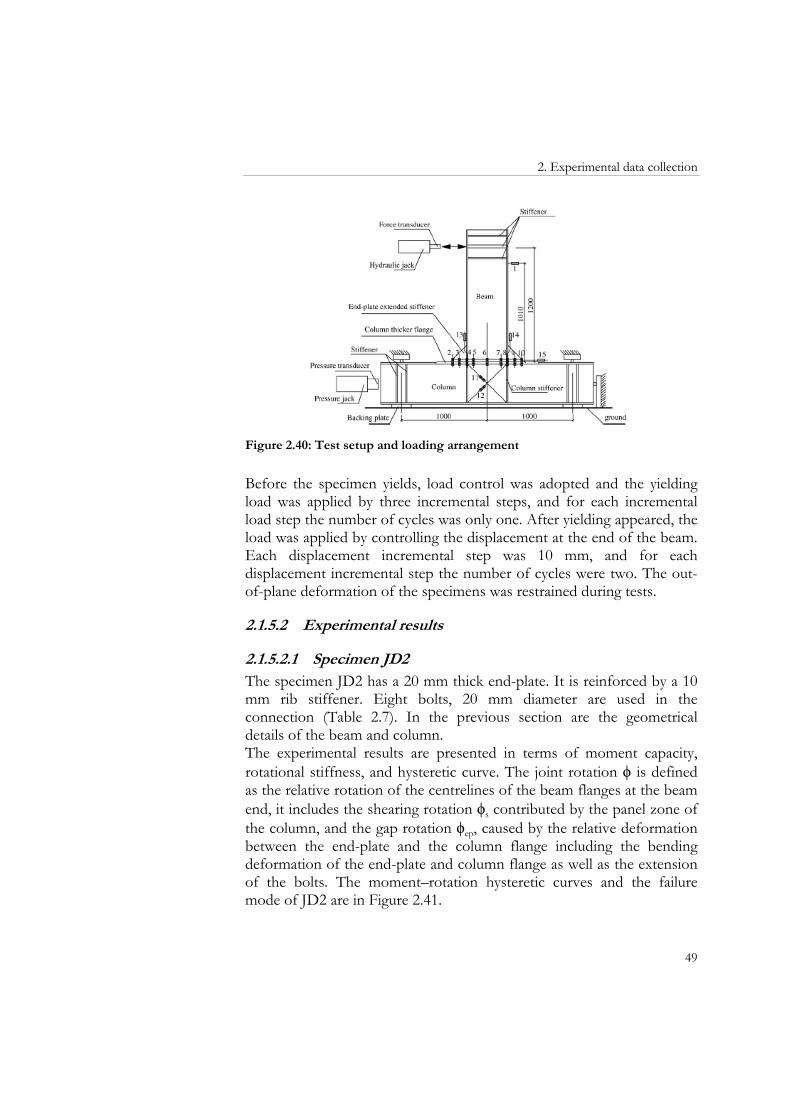
2. Experimental data collection
49
Figure 2.40: Test setup and loading arrangement
Before the specimen yields, load control was adopted and the yielding load was applied by three incremental steps, and for each incremental load step the number of cycles was only one. After yielding appeared, the load was applied by controlling the displacement at the end of the beam. Each displacement incremental step was 10 mm, and for each displacement incremental step the number of cycles were two. The out-of-plane deformation of the specimens was restrained during tests.
2.1.5.2 Experimental results
2.1.5.2.1 Specimen JD2 The specimen JD2 has a 20 mm thick end-plate. It is reinforced by a 10 mm rib stiffener. Eight bolts, 20 mm diameter are used in the connection (Table 2.7). In the previous section are the geometrical details of the beam and column. The experimental results are presented in terms of moment capacity, rotational stiffness, and hysteretic curve. The joint rotation ϕ is defined as the relative rotation of the centrelines of the beam flanges at the beam end, it includes the shearing rotation ϕs contributed by the panel zone of the column, and the gap rotation ϕep, caused by the relative deformation between the end-plate and the column flange including the bending deformation of the end-plate and column flange as well as the extension of the bolts. The moment–rotation hysteretic curves and the failure mode of JD2 are in Figure 2.41.
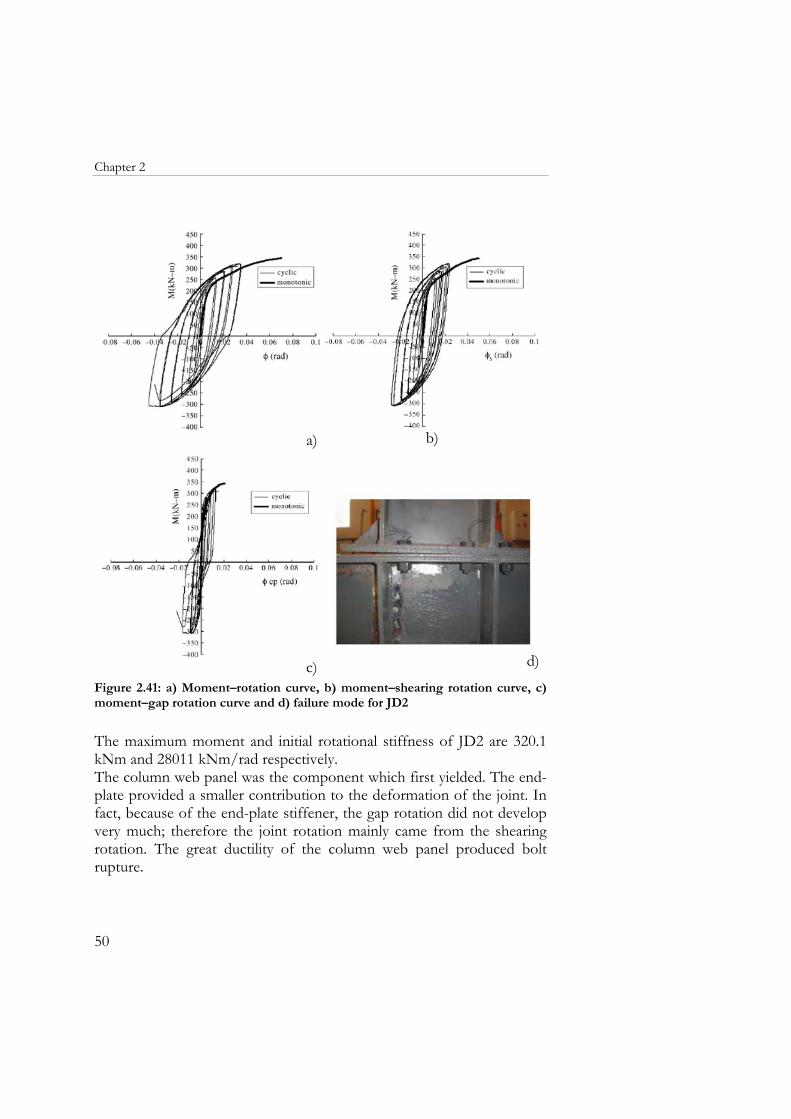
Chapter 2
50
a) b)
c) d)
Figure 2.41: a) Moment–rotation curve, b) moment–shearing rotation curve, c) moment–gap rotation curve and d) failure mode for JD2
The maximum moment and initial rotational stiffness of JD2 are 320.1 kNm and 28011 kNm/rad respectively. The column web panel was the component which first yielded. The end-plate provided a smaller contribution to the deformation of the joint. In fact, because of the end-plate stiffener, the gap rotation did not develop very much; therefore the joint rotation mainly came from the shearing rotation. The great ductility of the column web panel produced bolt rupture.
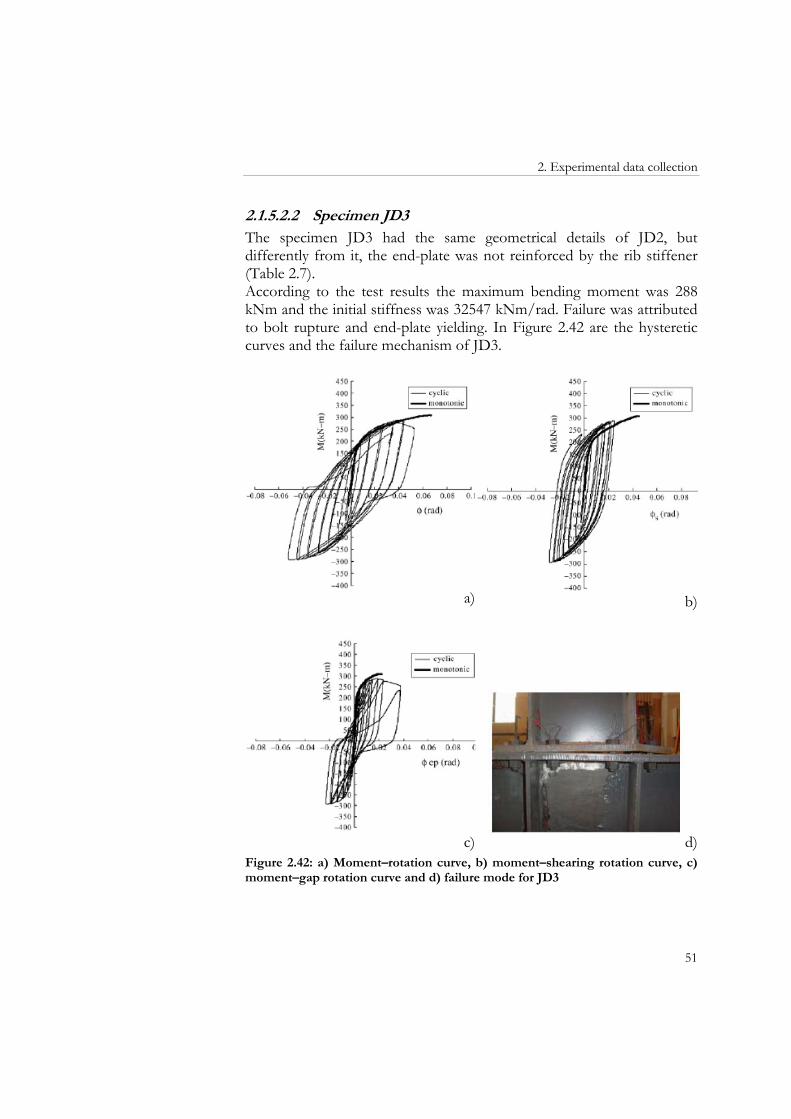
2. Experimental data collection
51
2.1.5.2.2 Specimen JD3 The specimen JD3 had the same geometrical details of JD2, but differently from it, the end-plate was not reinforced by the rib stiffener (Table 2.7). According to the test results the maximum bending moment was 288 kNm and the initial stiffness was 32547 kNm/rad. Failure was attributed to bolt rupture and end-plate yielding. In Figure 2.42 are the hysteretic curves and the failure mechanism of JD3.
a) b)
c)
d)
Figure 2.42: a) Moment–rotation curve, b) moment–shearing rotation curve, c) moment–gap rotation curve and d) failure mode for JD3
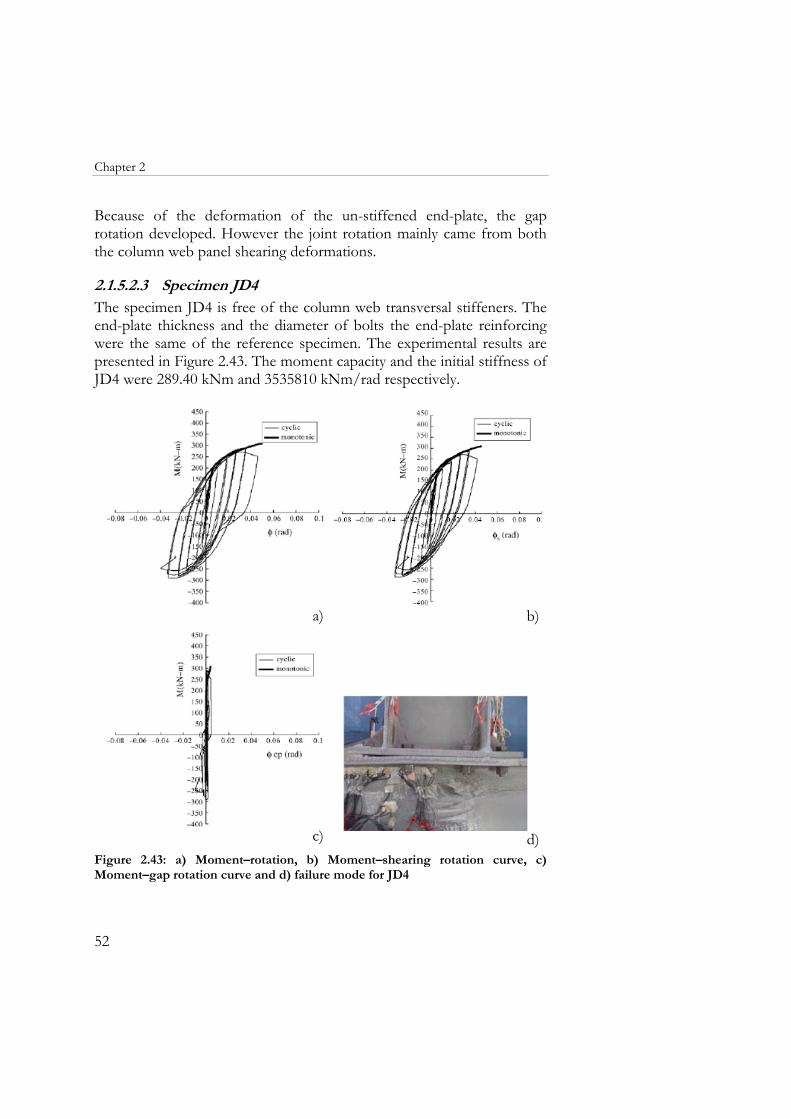
Chapter 2
52
Because of the deformation of the un-stiffened end-plate, the gap rotation developed. However the joint rotation mainly came from both the column web panel shearing deformations.
2.1.5.2.3 Specimen JD4 The specimen JD4 is free of the column web transversal stiffeners. The end-plate thickness and the diameter of bolts the end-plate reinforcing were the same of the reference specimen. The experimental results are presented in Figure 2.43. The moment capacity and the initial stiffness of JD4 were 289.40 kNm and 3535810 kNm/rad respectively.
a) b)
c) d)
Figure 2.43: a) Moment–rotation, b) Moment–shearing rotation curve, c) Moment–gap rotation curve and d) failure mode for JD4
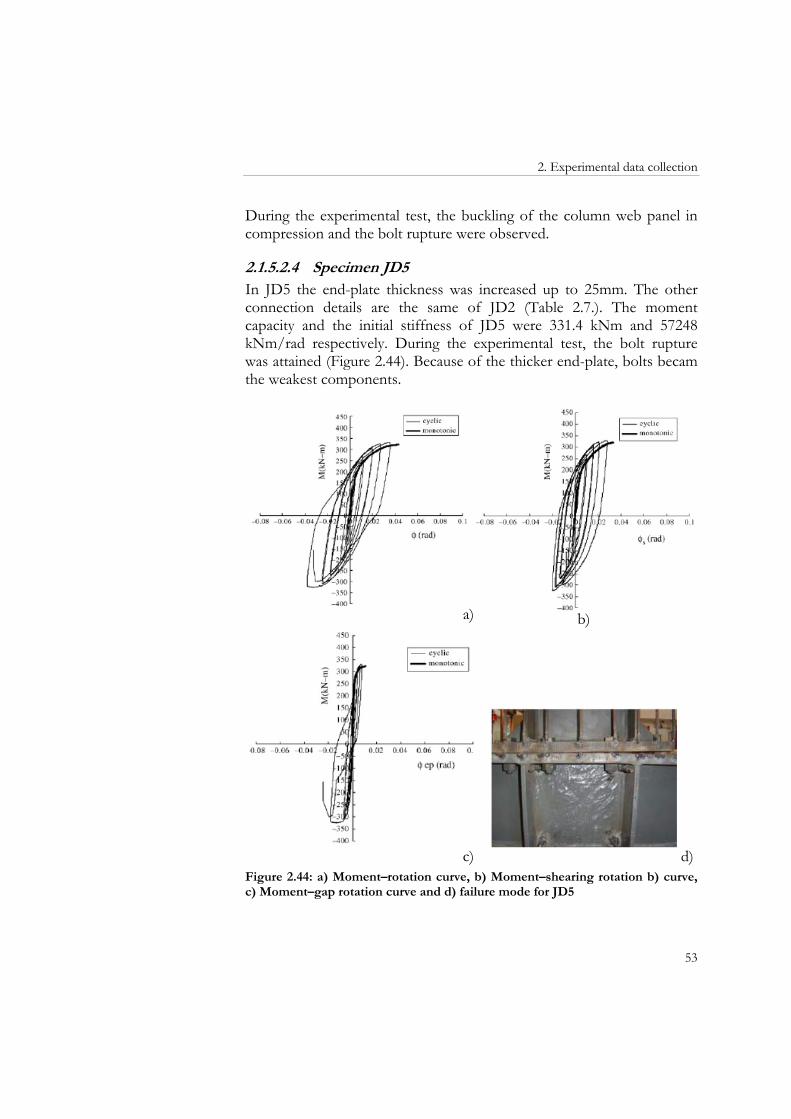
2. Experimental data collection
53
During the experimental test, the buckling of the column web panel in compression and the bolt rupture were observed.
2.1.5.2.4 Specimen JD5 In JD5 the end-plate thickness was increased up to 25mm. The other connection details are the same of JD2 (Table 2.7.). The moment capacity and the initial stiffness of JD5 were 331.4 kNm and 57248 kNm/rad respectively. During the experimental test, the bolt rupture was attained (Figure 2.44). Because of the thicker end-plate, bolts becam the weakest components.
a) b)
c) d)
Figure 2.44: a) Moment–rotation curve, b) Moment–shearing rotation b) curve, c) Moment–gap rotation curve and d) failure mode for JD5
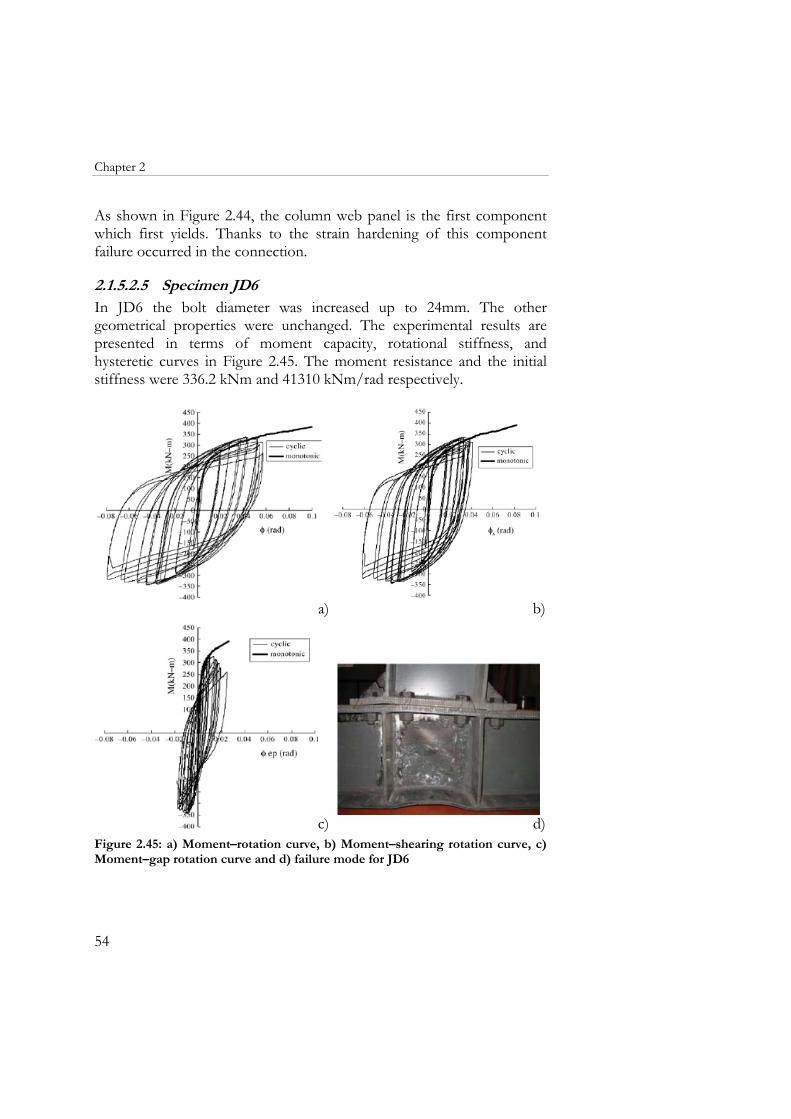
Chapter 2
54
As shown in Figure 2.44, the column web panel is the first component which first yields. Thanks to the strain hardening of this component failure occurred in the connection.
2.1.5.2.5 Specimen JD6 In JD6 the bolt diameter was increased up to 24mm. The other geometrical properties were unchanged. The experimental results are presented in terms of moment capacity, rotational stiffness, and hysteretic curves in Figure 2.45. The moment resistance and the initial stiffness were 336.2 kNm and 41310 kNm/rad respectively.
a) b)
c) d)Figure 2.45: a) Moment–rotation curve, b) Moment–shearing rotation curve, c) Moment–gap rotation curve and d) failure mode for JD6
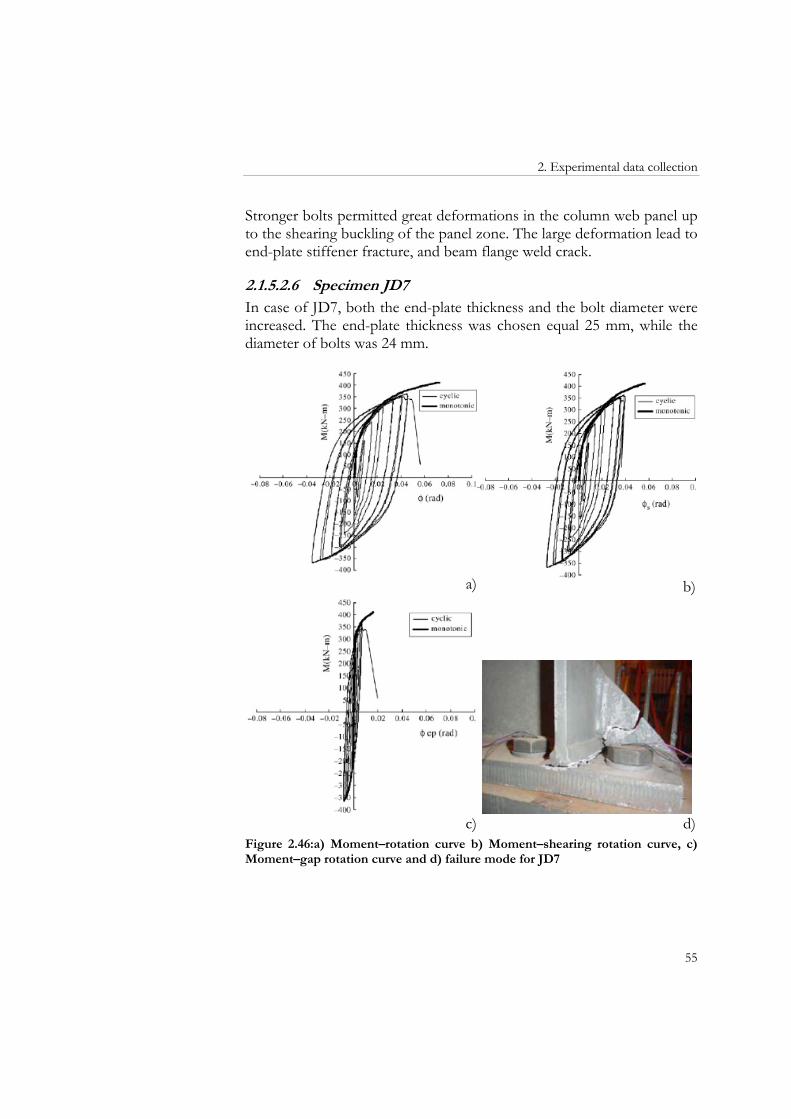
2. Experimental data collection
55
Stronger bolts permitted great deformations in the column web panel up to the shearing buckling of the panel zone. The large deformation lead to end-plate stiffener fracture, and beam flange weld crack.
2.1.5.2.6 Specimen JD7 In case of JD7, both the end-plate thickness and the bolt diameter were increased. The end-plate thickness was chosen equal 25 mm, while the diameter of bolts was 24 mm.
a) b)
c) d)Figure 2.46:a) Moment–rotation curve b) Moment–shearing rotation curve, c) Moment–gap rotation curve and d) failure mode for JD7
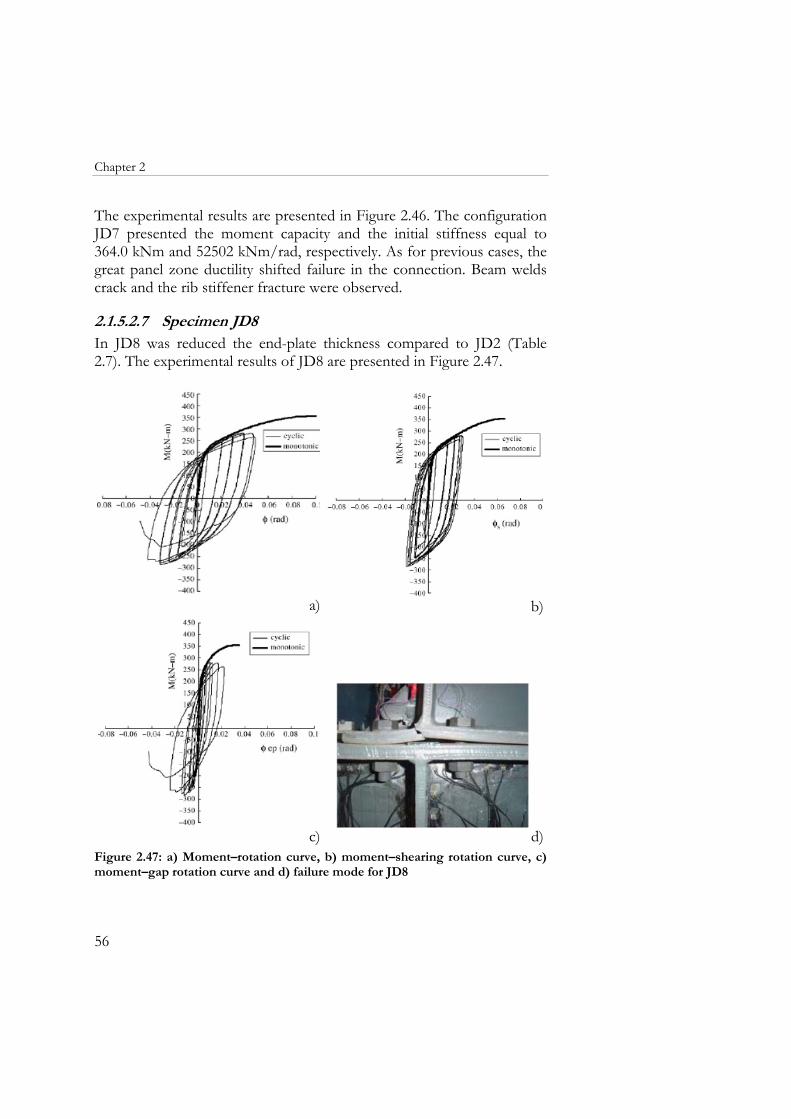
Chapter 2
56
The experimental results are presented in Figure 2.46. The configuration JD7 presented the moment capacity and the initial stiffness equal to 364.0 kNm and 52502 kNm/rad, respectively. As for previous cases, the great panel zone ductility shifted failure in the connection. Beam welds crack and the rib stiffener fracture were observed.
2.1.5.2.7 Specimen JD8 In JD8 was reduced the end-plate thickness compared to JD2 (Table 2.7). The experimental results of JD8 are presented in Figure 2.47.
a) b)
c) d)
Figure 2.47: a) Moment–rotation curve, b) moment–shearing rotation curve, c) moment–gap rotation curve and d) failure mode for JD8
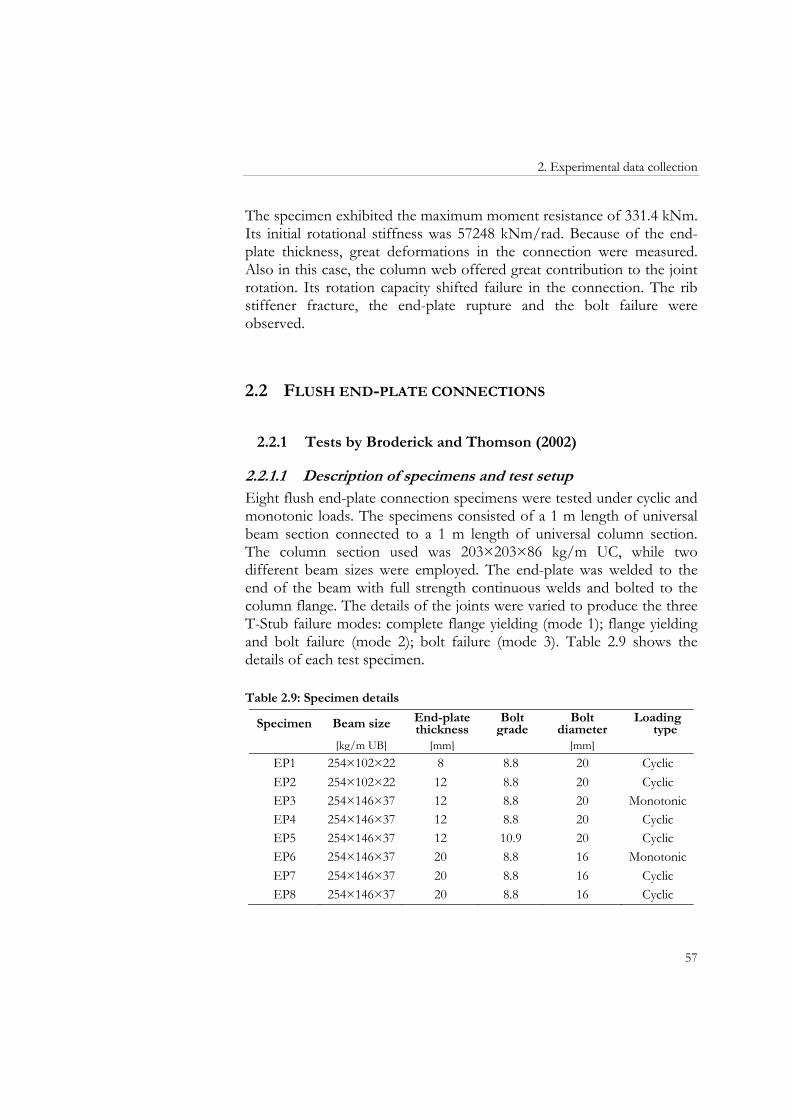
2. Experimental data collection
57
The specimen exhibited the maximum moment resistance of 331.4 kNm. Its initial rotational stiffness was 57248 kNm/rad. Because of the end-plate thickness, great deformations in the connection were measured. Also in this case, the column web offered great contribution to the joint rotation. Its rotation capacity shifted failure in the connection. The rib stiffener fracture, the end-plate rupture and the bolt failure were observed.
2.2 FLUSH END-PLATE CONNECTIONS
2.2.1 Tests by Broderick and Thomson (2002)
2.2.1.1 Description of specimens and test setup Eight flush end-plate connection specimens were tested under cyclic and monotonic loads. The specimens consisted of a 1 m length of universal beam section connected to a 1 m length of universal column section. The column section used was 203×203×86 kg/m UC, while two different beam sizes were employed. The end-plate was welded to the end of the beam with full strength continuous welds and bolted to the column flange. The details of the joints were varied to produce the three T-Stub failure modes: complete flange yielding (mode 1); flange yielding and bolt failure (mode 2); bolt failure (mode 3). Table 2.9 shows the details of each test specimen. Table 2.9: Specimen details
Specimen Beam size End-platethickness
Bolt grade
Bolt diameter
Loading type
[kg/m UB] [mm] [mm] EP1 254×102×22 8 8.8 20 CyclicEP2 254×102×22 12 8.8 20 CyclicEP3 254×146×37 12 8.8 20 MonotonicEP4 254×146×37 12 8.8 20 CyclicEP5 254×146×37 12 10.9 20 CyclicEP6 254×146×37 20 8.8 16 MonotonicEP7 254×146×37 20 8.8 16 CyclicEP8 254×146×37 20 8.8 16 Cyclic
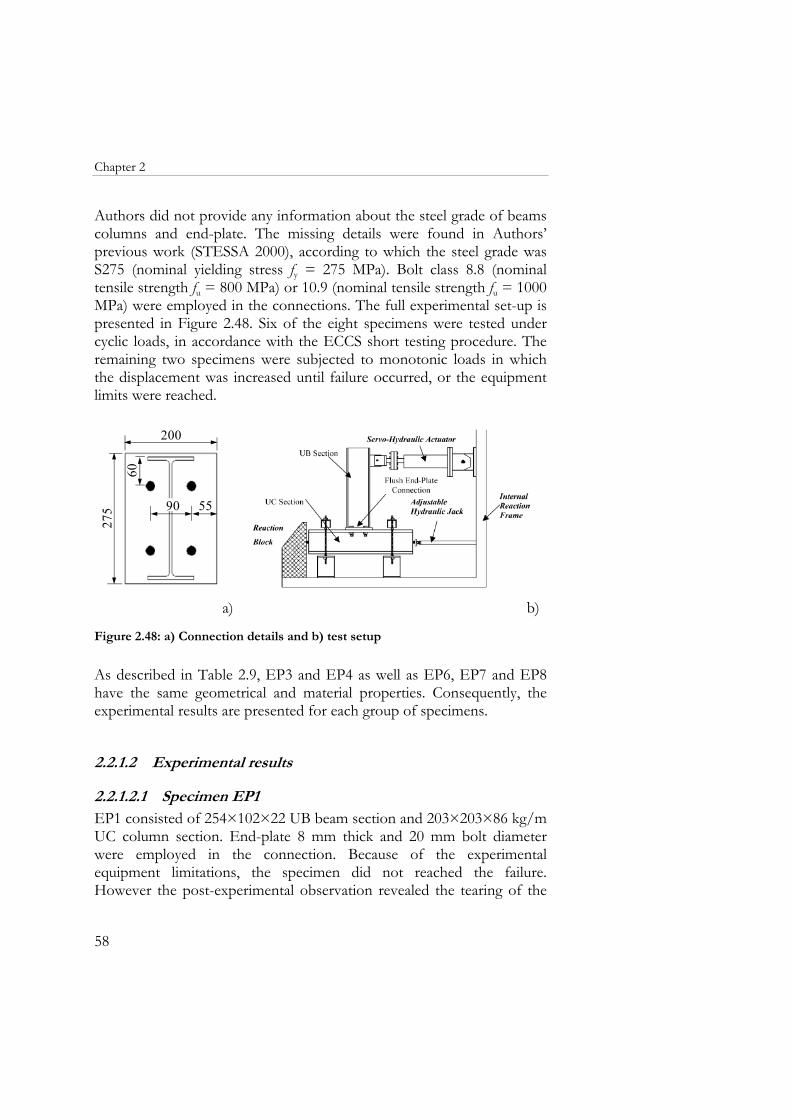
Chapter 2
58
Authors did not provide any information about the steel grade of beams columns and end-plate. The missing details were found in Authors’ previous work (STESSA 2000), according to which the steel grade was S275 (nominal yielding stress fy = 275 MPa). Bolt class 8.8 (nominal tensile strength fu = 800 MPa) or 10.9 (nominal tensile strength fu = 1000 MPa) were employed in the connections. The full experimental set-up is presented in Figure 2.48. Six of the eight specimens were tested under cyclic loads, in accordance with the ECCS short testing procedure. The remaining two specimens were subjected to monotonic loads in which the displacement was increased until failure occurred, or the equipment limits were reached.
200
60
90 55
275
a)
b)
Figure 2.48: a) Connection details and b) test setup
As described in Table 2.9, EP3 and EP4 as well as EP6, EP7 and EP8 have the same geometrical and material properties. Consequently, the experimental results are presented for each group of specimens.
2.2.1.2 Experimental results
2.2.1.2.1 Specimen EP1 EP1 consisted of 254×102×22 UB beam section and 203×203×86 kg/m UC column section. End-plate 8 mm thick and 20 mm bolt diameter were employed in the connection. Because of the experimental equipment limitations, the specimen did not reached the failure. However the post-experimental observation revealed the tearing of the
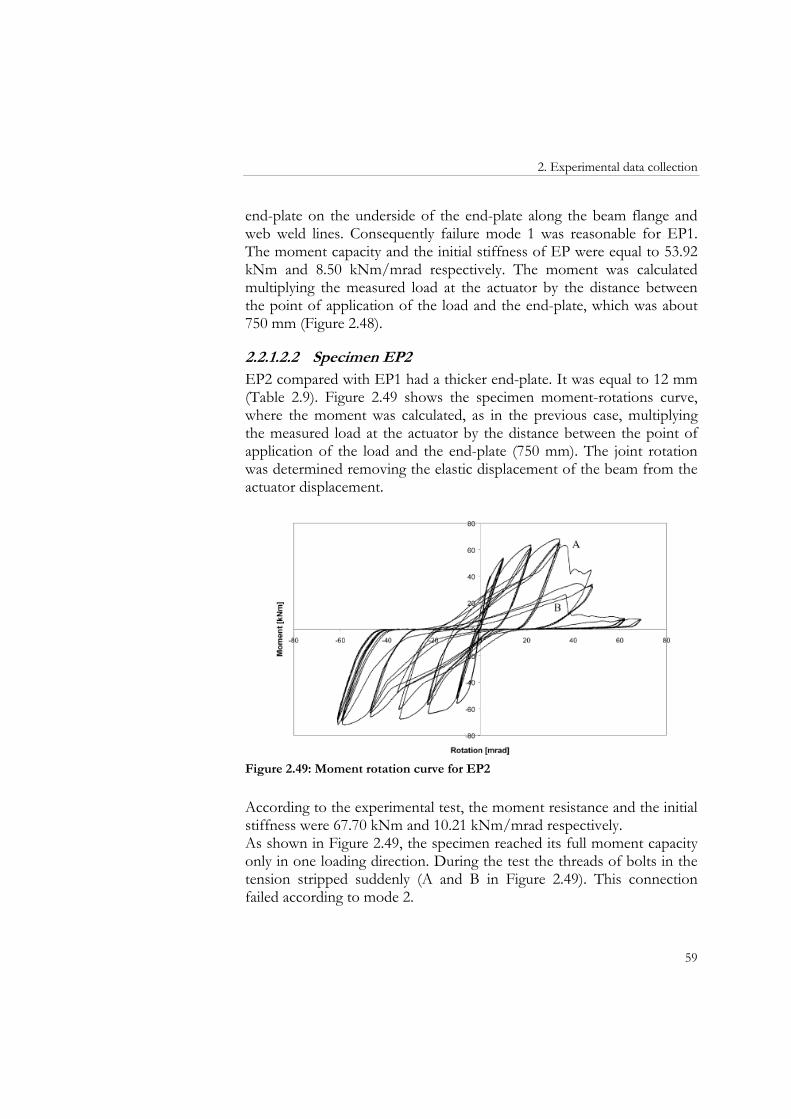
2. Experimental data collection
59
end-plate on the underside of the end-plate along the beam flange and web weld lines. Consequently failure mode 1 was reasonable for EP1. The moment capacity and the initial stiffness of EP were equal to 53.92 kNm and 8.50 kNm/mrad respectively. The moment was calculated multiplying the measured load at the actuator by the distance between the point of application of the load and the end-plate, which was about 750 mm (Figure 2.48).
2.2.1.2.2 Specimen EP2 EP2 compared with EP1 had a thicker end-plate. It was equal to 12 mm (Table 2.9). Figure 2.49 shows the specimen moment-rotations curve, where the moment was calculated, as in the previous case, multiplying the measured load at the actuator by the distance between the point of application of the load and the end-plate (750 mm). The joint rotation was determined removing the elastic displacement of the beam from the actuator displacement.
Figure 2.49: Moment rotation curve for EP2
According to the experimental test, the moment resistance and the initial stiffness were 67.70 kNm and 10.21 kNm/mrad respectively. As shown in Figure 2.49, the specimen reached its full moment capacity only in one loading direction. During the test the threads of bolts in the tension stripped suddenly (A and B in Figure 2.49). This connection failed according to mode 2.
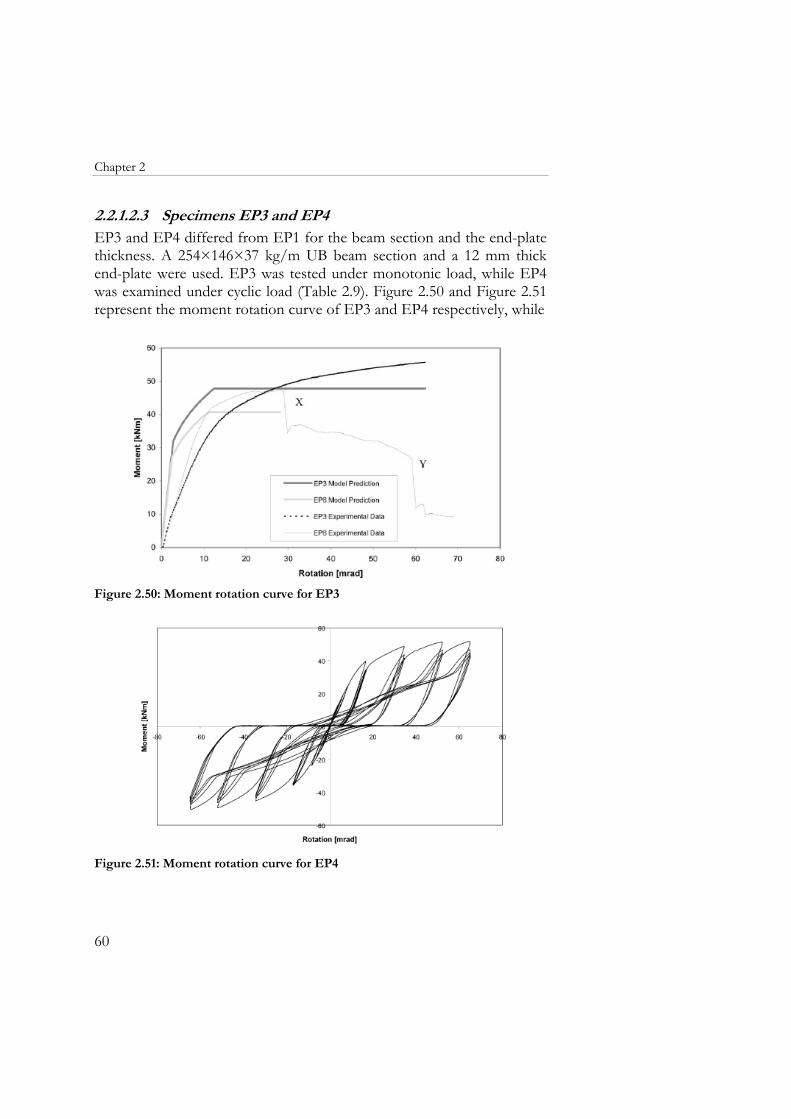
Chapter 2
60
2.2.1.2.3 Specimens EP3 and EP4 EP3 and EP4 differed from EP1 for the beam section and the end-plate thickness. A 254×146×37 kg/m UB beam section and a 12 mm thick end-plate were used. EP3 was tested under monotonic load, while EP4 was examined under cyclic load (Table 2.9). Figure 2.50 and Figure 2.51 represent the moment rotation curve of EP3 and EP4 respectively, while
Figure 2.50: Moment rotation curve for EP3
Figure 2.51: Moment rotation curve for EP4
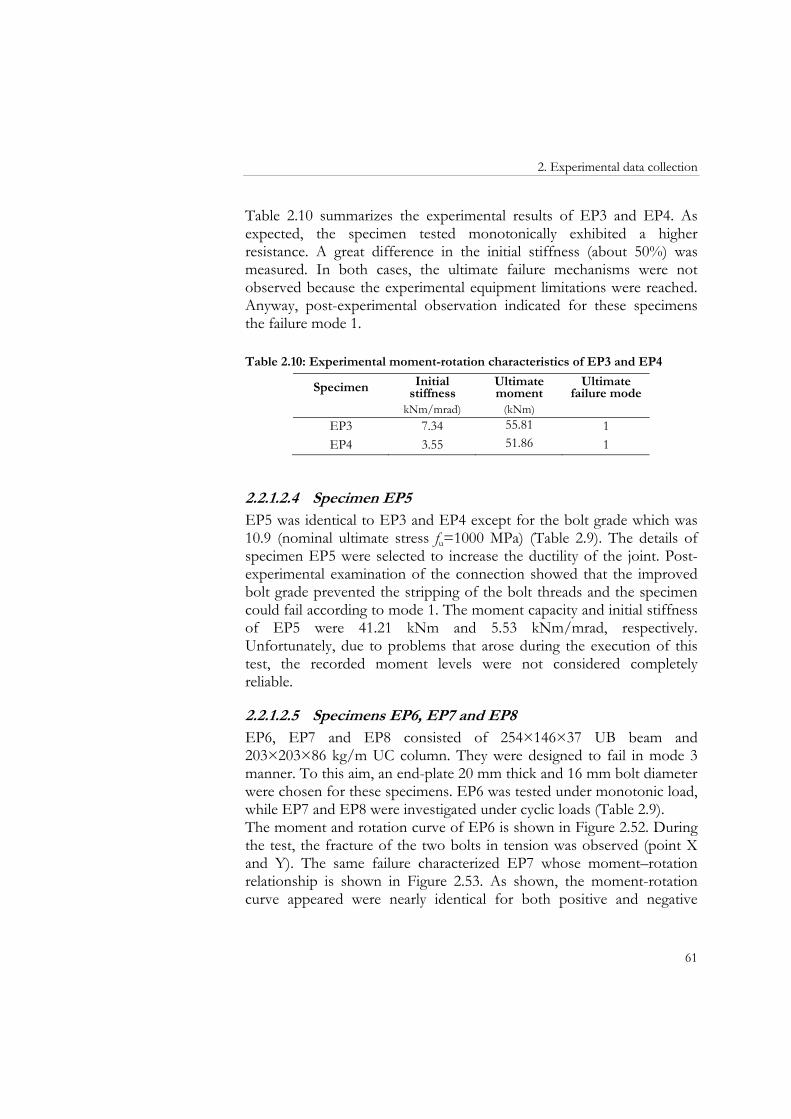
2. Experimental data collection
61
Table 2.10 summarizes the experimental results of EP3 and EP4. As expected, the specimen tested monotonically exhibited a higher resistance. A great difference in the initial stiffness (about 50%) was measured. In both cases, the ultimate failure mechanisms were not observed because the experimental equipment limitations were reached. Anyway, post-experimental observation indicated for these specimens the failure mode 1. Table 2.10: Experimental moment-rotation characteristics of EP3 and EP4
Specimen Initial stiffness
Ultimate moment
Ultimate failure mode
kNm/mrad) (kNm) EP3 7.34 55.81 1 EP4 3.55 51.86 1
2.2.1.2.4 Specimen EP5 EP5 was identical to EP3 and EP4 except for the bolt grade which was 10.9 (nominal ultimate stress fu=1000 MPa) (Table 2.9). The details of specimen EP5 were selected to increase the ductility of the joint. Post-experimental examination of the connection showed that the improved bolt grade prevented the stripping of the bolt threads and the specimen could fail according to mode 1. The moment capacity and initial stiffness of EP5 were 41.21 kNm and 5.53 kNm/mrad, respectively. Unfortunately, due to problems that arose during the execution of this test, the recorded moment levels were not considered completely reliable.
2.2.1.2.5 Specimens EP6, EP7 and EP8 EP6, EP7 and EP8 consisted of 254×146×37 UB beam and 203×203×86 kg/m UC column. They were designed to fail in mode 3 manner. To this aim, an end-plate 20 mm thick and 16 mm bolt diameter were chosen for these specimens. EP6 was tested under monotonic load, while EP7 and EP8 were investigated under cyclic loads (Table 2.9). The moment and rotation curve of EP6 is shown in Figure 2.52. During the test, the fracture of the two bolts in tension was observed (point X and Y). The same failure characterized EP7 whose moment–rotation relationship is shown in Figure 2.53. As shown, the moment-rotation curve appeared were nearly identical for both positive and negative
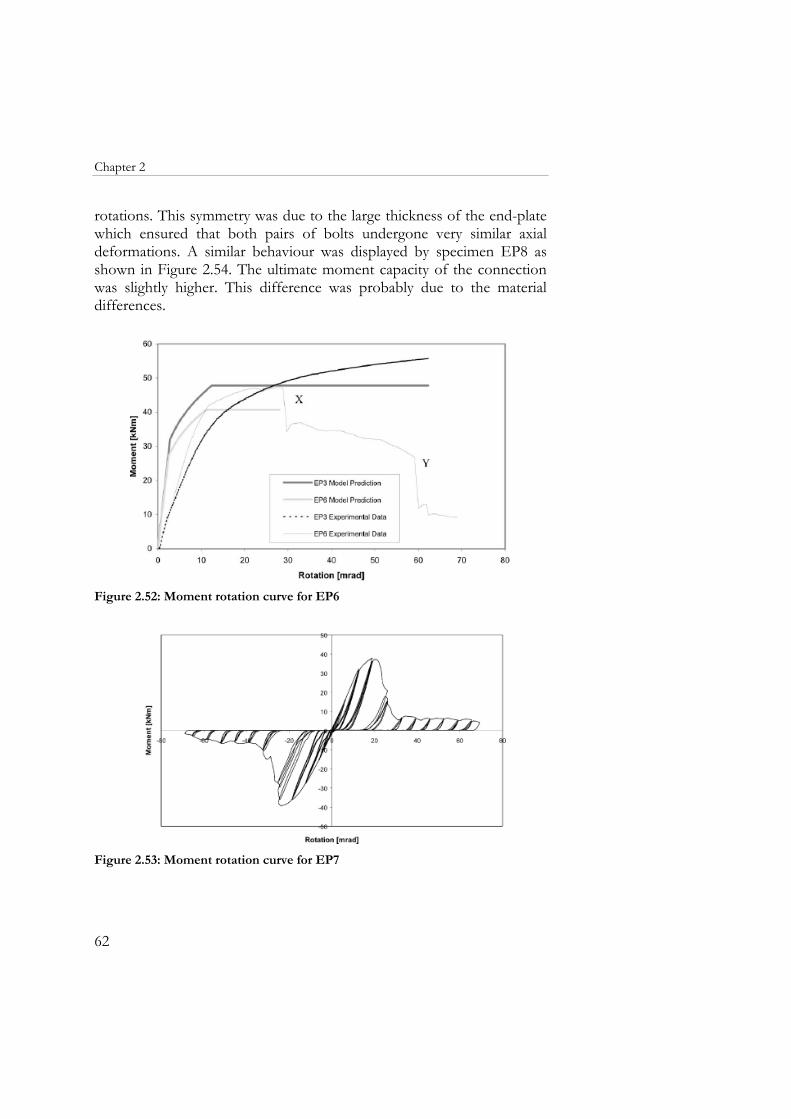
Chapter 2
62
rotations. This symmetry was due to the large thickness of the end-plate which ensured that both pairs of bolts undergone very similar axial deformations. A similar behaviour was displayed by specimen EP8 as shown in Figure 2.54. The ultimate moment capacity of the connection was slightly higher. This difference was probably due to the material differences.
Figure 2.52: Moment rotation curve for EP6
Figure 2.53: Moment rotation curve for EP7
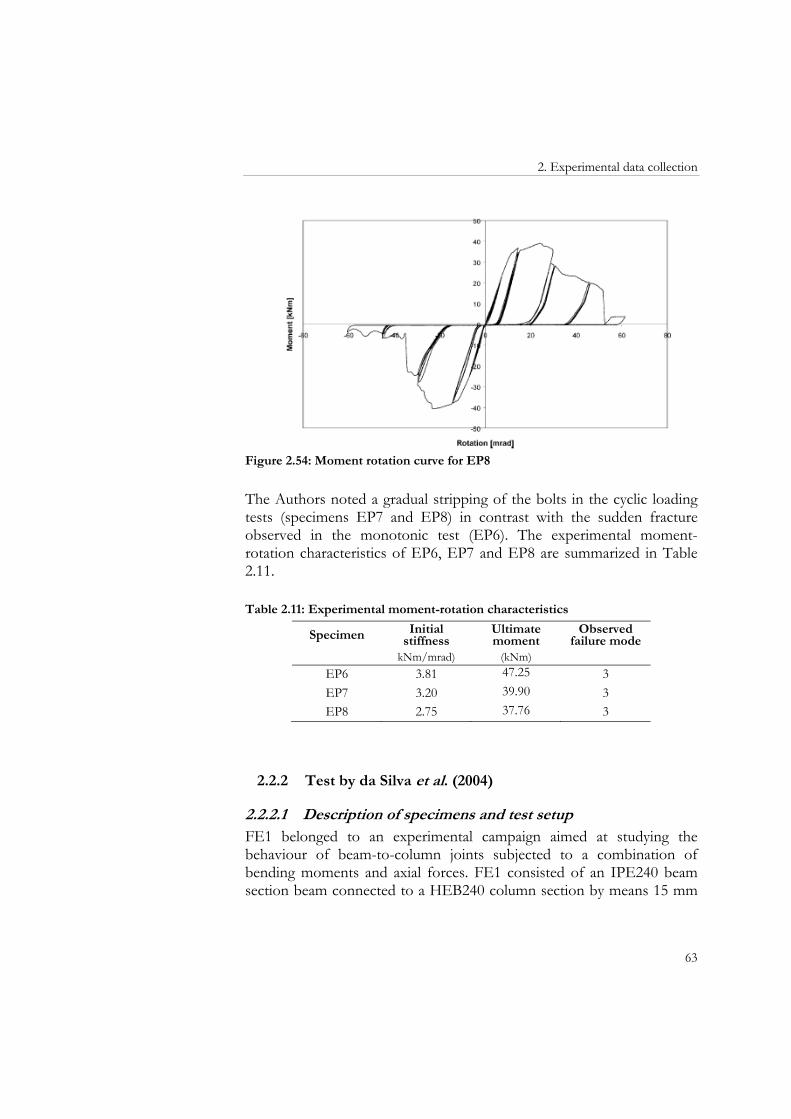
2. Experimental data collection
63
Figure 2.54: Moment rotation curve for EP8
The Authors noted a gradual stripping of the bolts in the cyclic loading tests (specimens EP7 and EP8) in contrast with the sudden fracture observed in the monotonic test (EP6). The experimental moment-rotation characteristics of EP6, EP7 and EP8 are summarized in Table 2.11. Table 2.11: Experimental moment-rotation characteristics
Specimen Initial stiffness
Ultimate moment
Observed failure mode
kNm/mrad) (kNm) EP6 3.81 47.25 3 EP7 3.20 39.90 3 EP8 2.75 37.76 3
2.2.2 Test by da Silva et al. (2004)
2.2.2.1 Description of specimens and test setup FE1 belonged to an experimental campaign aimed at studying the behaviour of beam-to-column joints subjected to a combination of bending moments and axial forces. FE1 consisted of an IPE240 beam section beam connected to a HEB240 column section by means 15 mm
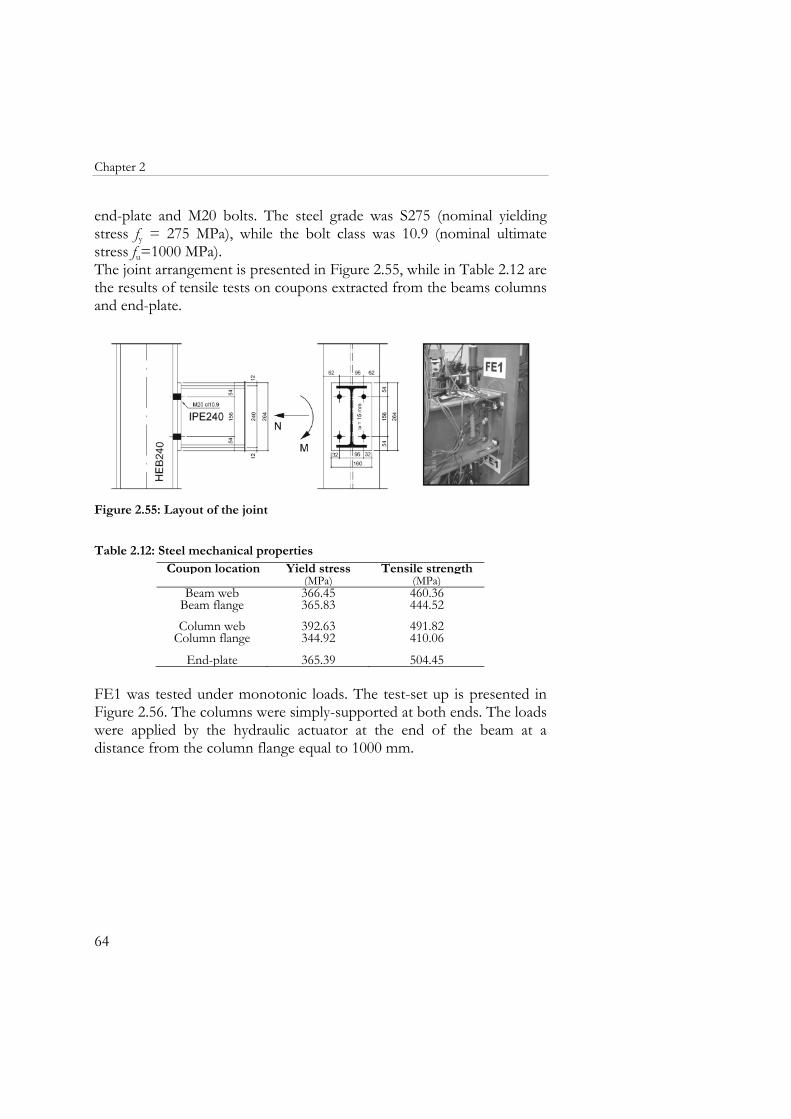
Chapter 2
64
end-plate and M20 bolts. The steel grade was S275 (nominal yielding stress fy = 275 MPa), while the bolt class was 10.9 (nominal ultimate stress fu=1000 MPa). The joint arrangement is presented in Figure 2.55, while in Table 2.12 are the results of tensile tests on coupons extracted from the beams columns and end-plate.
Figure 2.55: Layout of the joint
Table 2.12: Steel mechanical properties
Coupon location Yield stress Tensile strength (MPa) (MPa)
Beam web 366.45 460.36Beam flange 365.83 444.52Column web 392.63 491.82
Column flange 344.92 410.06
End-plate 365.39 504.45 FE1 was tested under monotonic loads. The test-set up is presented in Figure 2.56. The columns were simply-supported at both ends. The loads were applied by the hydraulic actuator at the end of the beam at a distance from the column flange equal to 1000 mm.
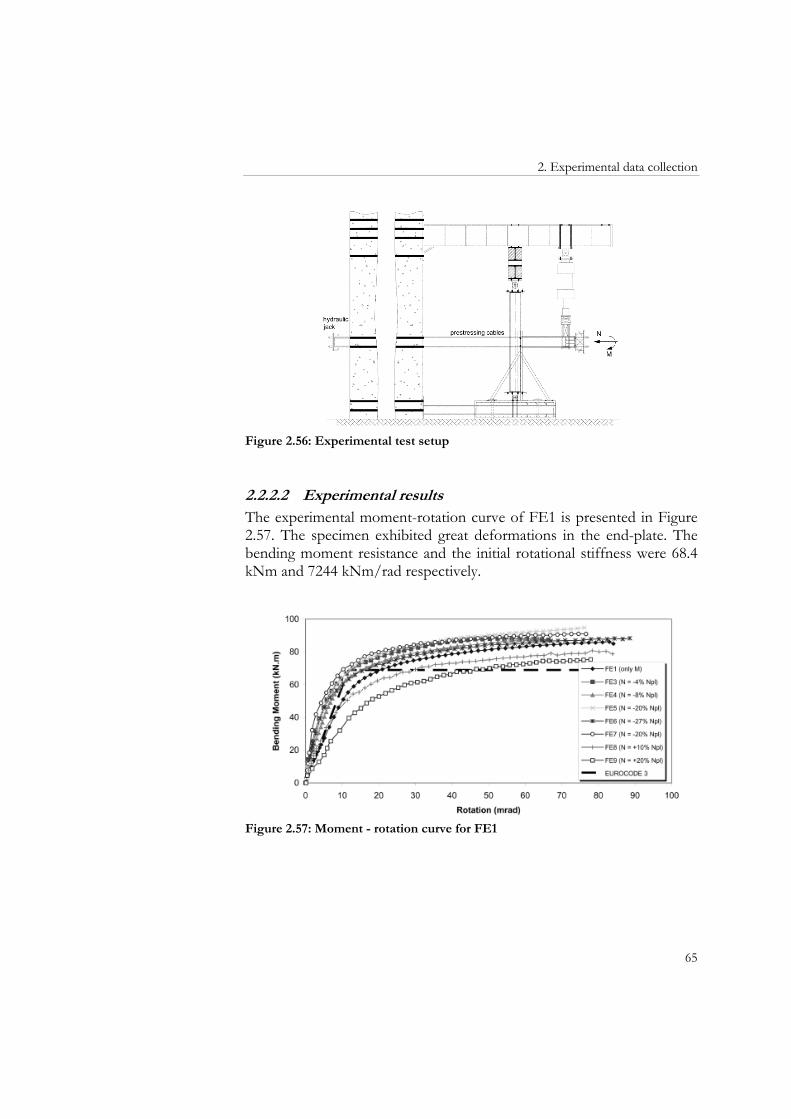
2. Experimental data collection
65
Figure 2.56: Experimental test setup
2.2.2.2 Experimental results The experimental moment-rotation curve of FE1 is presented in Figure 2.57. The specimen exhibited great deformations in the end-plate. The bending moment resistance and the initial rotational stiffness were 68.4 kNm and 7244 kNm/rad respectively.
Figure 2.57: Moment - rotation curve for FE1
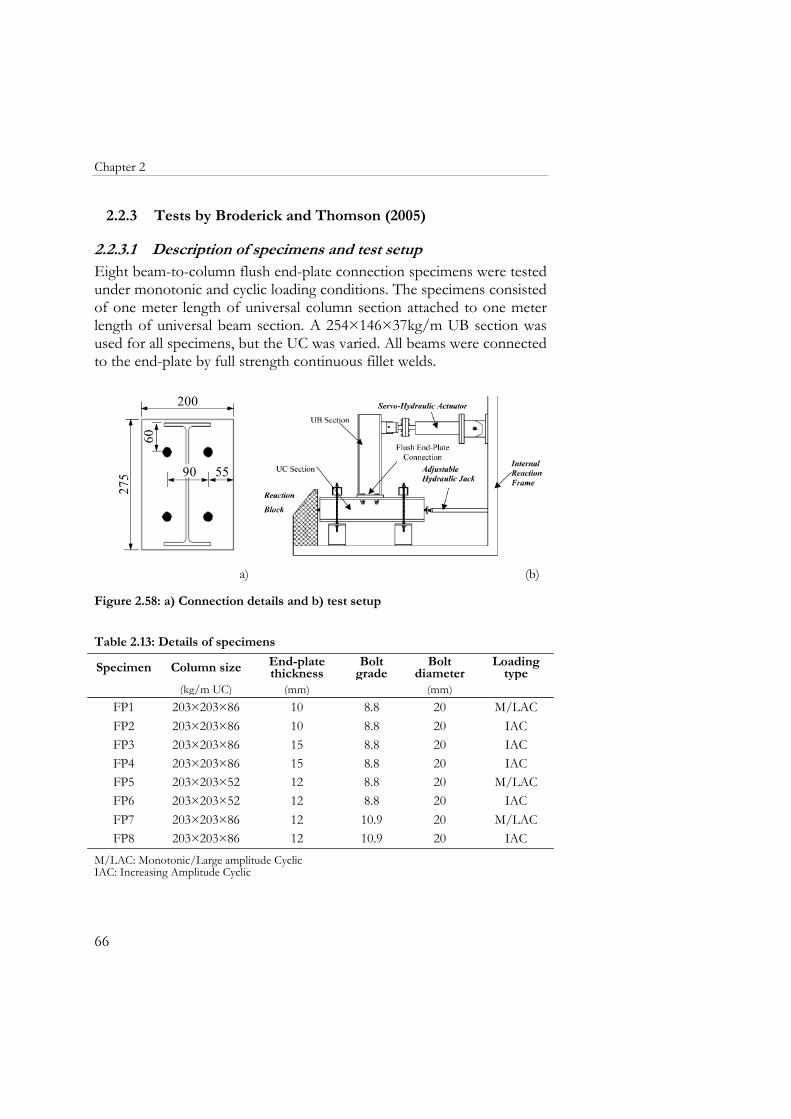
Chapter 2
66
2.2.3 Tests by Broderick and Thomson (2005)
2.2.3.1 Description of specimens and test setup Eight beam-to-column flush end-plate connection specimens were tested under monotonic and cyclic loading conditions. The specimens consisted of one meter length of universal column section attached to one meter length of universal beam section. A 254×146×37kg/m UB section was used for all specimens, but the UC was varied. All beams were connected to the end-plate by full strength continuous fillet welds.
200
60
90 55
275
a) (b)
Figure 2.58: a) Connection details and b) test setup
Table 2.13: Details of specimens
Specimen Column size End-plate thickness
Bolt grade
Bolt diameter
Loading type
(kg/m UC) (mm) (mm)FP1 203×203×86 10 8.8 20 M/LACFP2 203×203×86 10 8.8 20 IACFP3 203×203×86 15 8.8 20 IACFP4 203×203×86 15 8.8 20 IACFP5 203×203×52 12 8.8 20 M/LACFP6 203×203×52 12 8.8 20 IACFP7 203×203×86 12 10.9 20 M/LACFP8 203×203×86 12 10.9 20 IAC
M/LAC: Monotonic/Large amplitude Cyclic IAC: Increasing Amplitude Cyclic
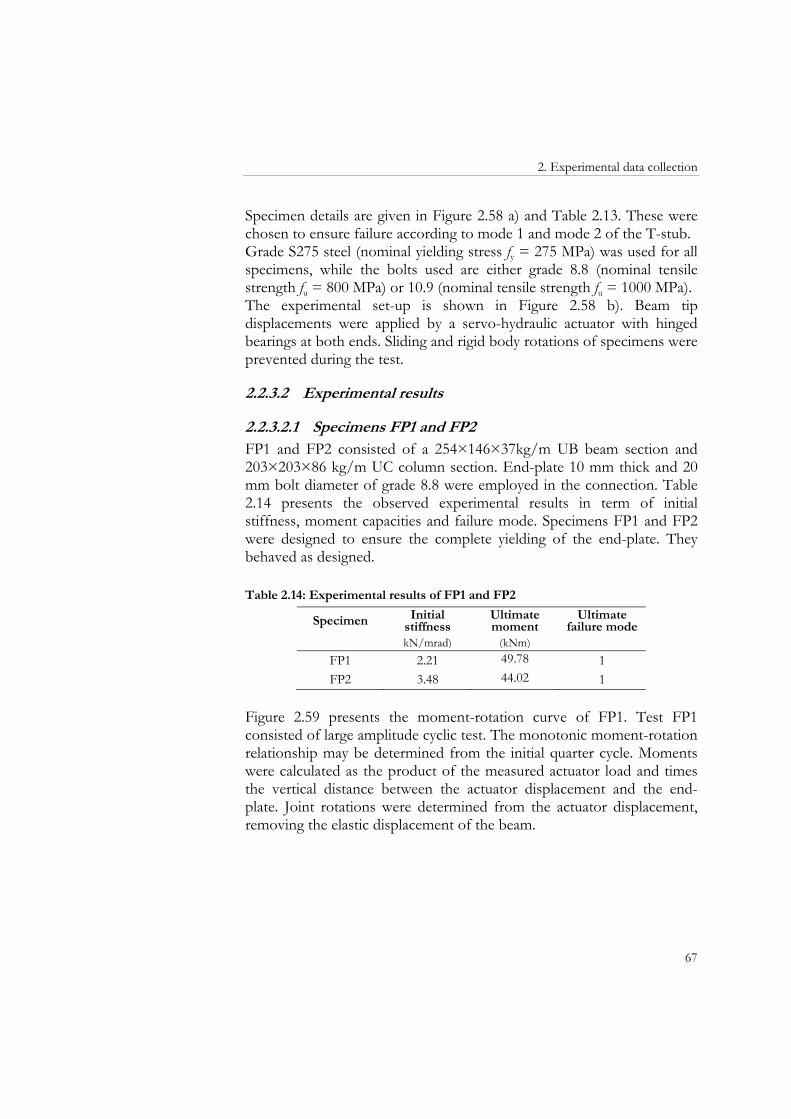
2. Experimental data collection
67
Specimen details are given in Figure 2.58 a) and Table 2.13. These were chosen to ensure failure according to mode 1 and mode 2 of the T-stub. Grade S275 steel (nominal yielding stress fy = 275 MPa) was used for all specimens, while the bolts used are either grade 8.8 (nominal tensile strength fu = 800 MPa) or 10.9 (nominal tensile strength fu = 1000 MPa). The experimental set-up is shown in Figure 2.58 b). Beam tip displacements were applied by a servo-hydraulic actuator with hinged bearings at both ends. Sliding and rigid body rotations of specimens were prevented during the test.
2.2.3.2 Experimental results
2.2.3.2.1 Specimens FP1 and FP2 FP1 and FP2 consisted of a 254×146×37kg/m UB beam section and 203×203×86 kg/m UC column section. End-plate 10 mm thick and 20 mm bolt diameter of grade 8.8 were employed in the connection. Table 2.14 presents the observed experimental results in term of initial stiffness, moment capacities and failure mode. Specimens FP1 and FP2 were designed to ensure the complete yielding of the end-plate. They behaved as designed. Table 2.14: Experimental results of FP1 and FP2
Specimen Initial stiffness
Ultimate moment
Ultimate failure mode
kN/mrad) (kNm) FP1 2.21 49.78 1 FP2 3.48 44.02 1
Figure 2.59 presents the moment-rotation curve of FP1. Test FP1 consisted of large amplitude cyclic test. The monotonic moment-rotation relationship may be determined from the initial quarter cycle. Moments were calculated as the product of the measured actuator load and times the vertical distance between the actuator displacement and the end-plate. Joint rotations were determined from the actuator displacement, removing the elastic displacement of the beam.
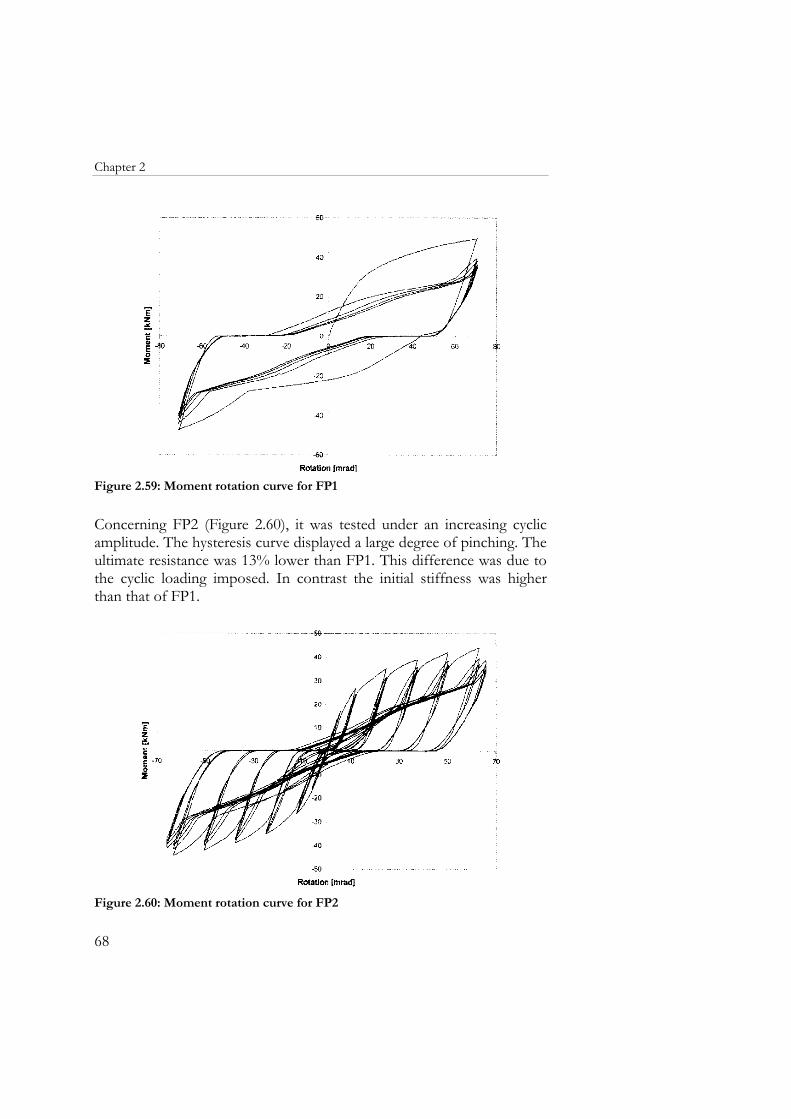
Chapter 2
68
Figure 2.59: Moment rotation curve for FP1
Concerning FP2 (Figure 2.60), it was tested under an increasing cyclic amplitude. The hysteresis curve displayed a large degree of pinching. The ultimate resistance was 13% lower than FP1. This difference was due to the cyclic loading imposed. In contrast the initial stiffness was higher than that of FP1.
Figure 2.60: Moment rotation curve for FP2
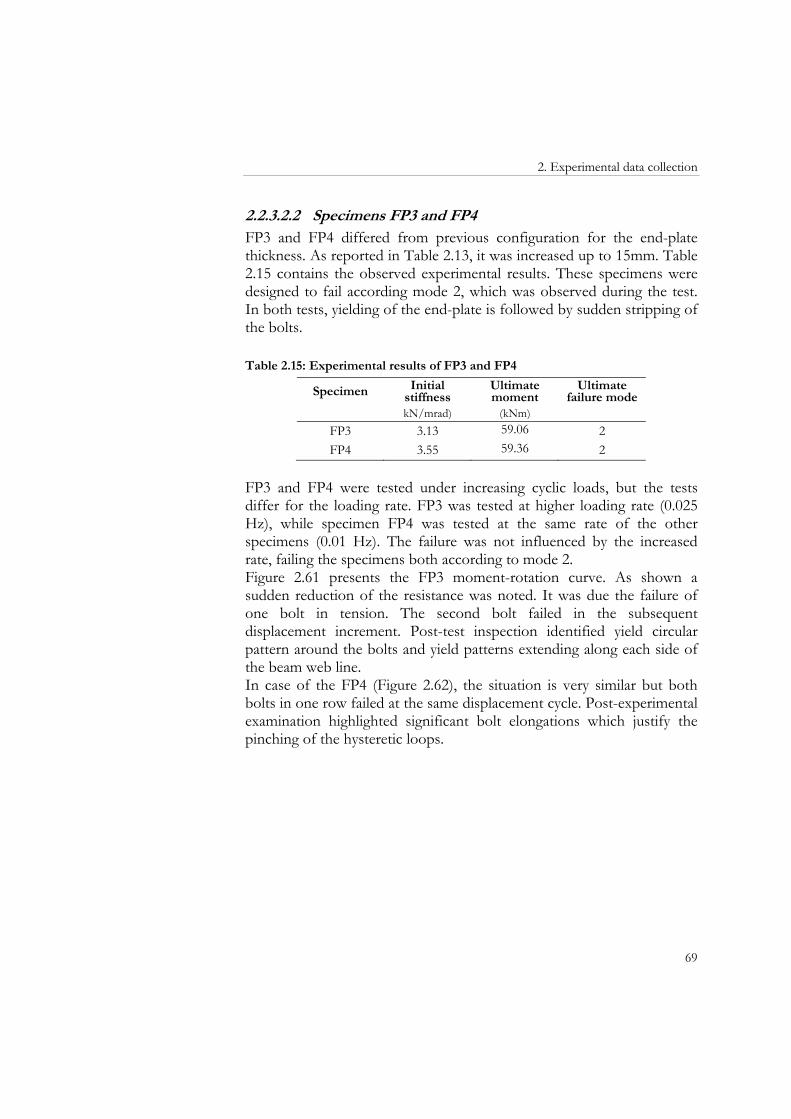
2. Experimental data collection
69
2.2.3.2.2 Specimens FP3 and FP4 FP3 and FP4 differed from previous configuration for the end-plate thickness. As reported in Table 2.13, it was increased up to 15mm. Table 2.15 contains the observed experimental results. These specimens were designed to fail according mode 2, which was observed during the test. In both tests, yielding of the end-plate is followed by sudden stripping of the bolts. Table 2.15: Experimental results of FP3 and FP4
Specimen Initial stiffness
Ultimate moment
Ultimate failure mode
kN/mrad) (kNm) FP3 3.13 59.06 2 FP4 3.55 59.36 2
FP3 and FP4 were tested under increasing cyclic loads, but the tests differ for the loading rate. FP3 was tested at higher loading rate (0.025 Hz), while specimen FP4 was tested at the same rate of the other specimens (0.01 Hz). The failure was not influenced by the increased rate, failing the specimens both according to mode 2. Figure 2.61 presents the FP3 moment-rotation curve. As shown a sudden reduction of the resistance was noted. It was due the failure of one bolt in tension. The second bolt failed in the subsequent displacement increment. Post-test inspection identified yield circular pattern around the bolts and yield patterns extending along each side of the beam web line. In case of the FP4 (Figure 2.62), the situation is very similar but both bolts in one row failed at the same displacement cycle. Post-experimental examination highlighted significant bolt elongations which justify the pinching of the hysteretic loops.
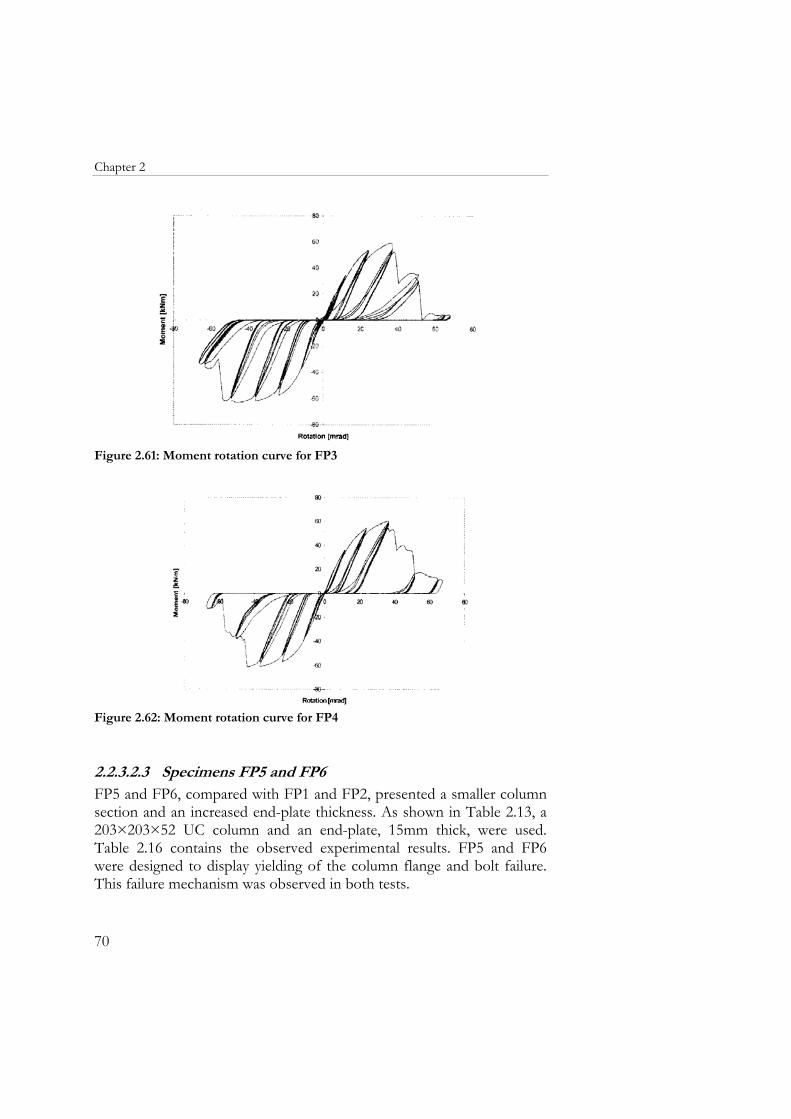
Chapter 2
70
Figure 2.61: Moment rotation curve for FP3
Figure 2.62: Moment rotation curve for FP4
2.2.3.2.3 Specimens FP5 and FP6 FP5 and FP6, compared with FP1 and FP2, presented a smaller column section and an increased end-plate thickness. As shown in Table 2.13, a 203×203×52 UC column and an end-plate, 15mm thick, were used. Table 2.16 contains the observed experimental results. FP5 and FP6 were designed to display yielding of the column flange and bolt failure. This failure mechanism was observed in both tests.
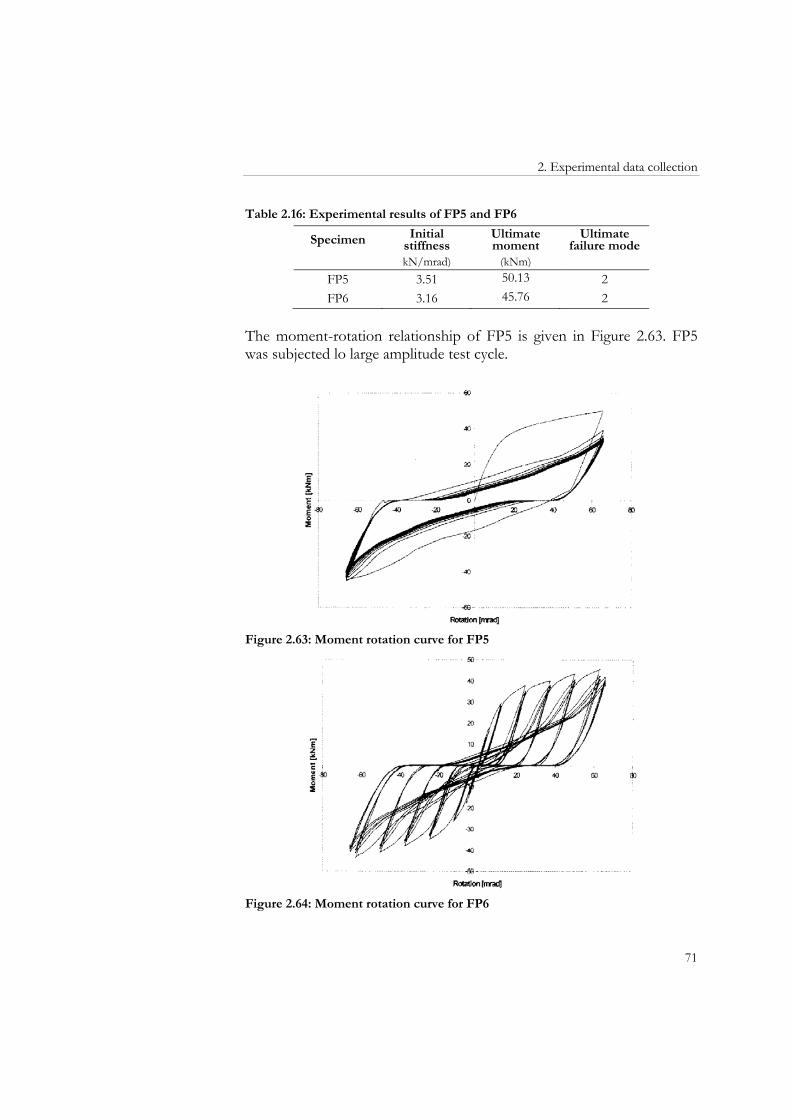
2. Experimental data collection
71
Table 2.16: Experimental results of FP5 and FP6
Specimen Initial stiffness
Ultimate moment
Ultimate failure mode
kN/mrad) (kNm) FP5 3.51 50.13 2 FP6 3.16 45.76 2
The moment-rotation relationship of FP5 is given in Figure 2.63. FP5 was subjected lo large amplitude test cycle.
Figure 2.63: Moment rotation curve for FP5
Figure 2.64: Moment rotation curve for FP6
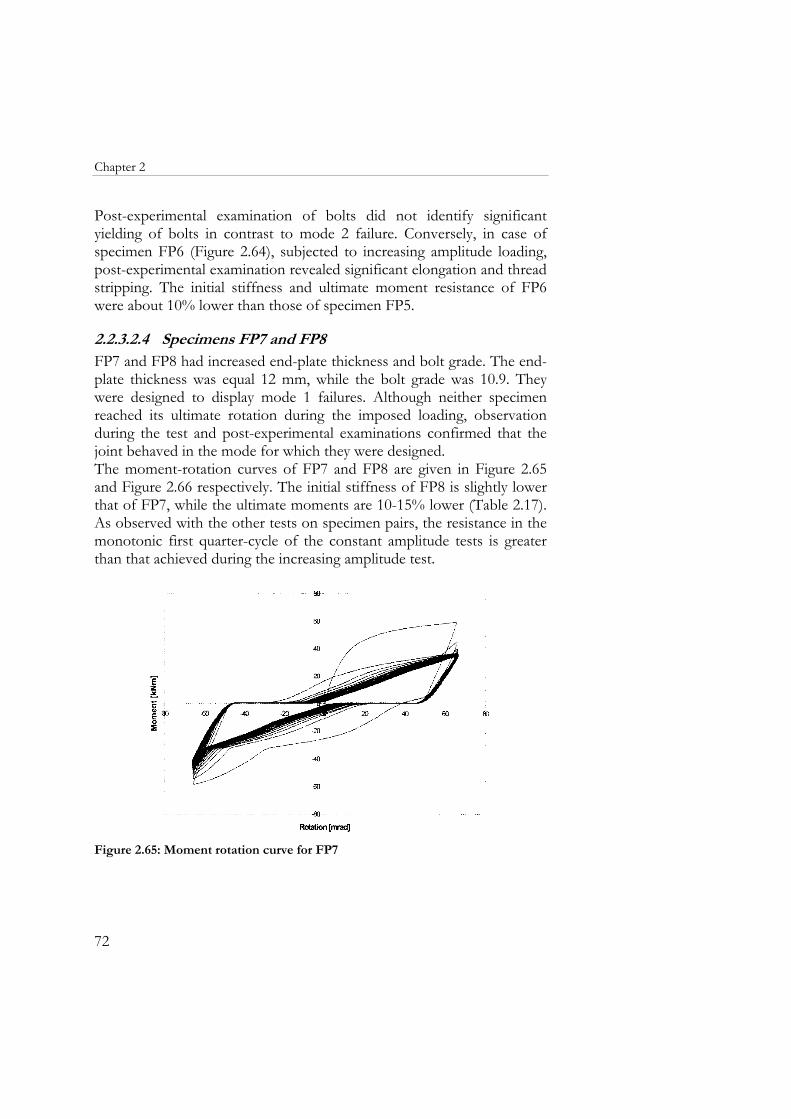
Chapter 2
72
Post-experimental examination of bolts did not identify significant yielding of bolts in contrast to mode 2 failure. Conversely, in case of specimen FP6 (Figure 2.64), subjected to increasing amplitude loading, post-experimental examination revealed significant elongation and thread stripping. The initial stiffness and ultimate moment resistance of FP6 were about 10% lower than those of specimen FP5.
2.2.3.2.4 Specimens FP7 and FP8 FP7 and FP8 had increased end-plate thickness and bolt grade. The end-plate thickness was equal 12 mm, while the bolt grade was 10.9. They were designed to display mode 1 failures. Although neither specimen reached its ultimate rotation during the imposed loading, observation during the test and post-experimental examinations confirmed that the joint behaved in the mode for which they were designed. The moment-rotation curves of FP7 and FP8 are given in Figure 2.65 and Figure 2.66 respectively. The initial stiffness of FP8 is slightly lower that of FP7, while the ultimate moments are 10-15% lower (Table 2.17). As observed with the other tests on specimen pairs, the resistance in the monotonic first quarter-cycle of the constant amplitude tests is greater than that achieved during the increasing amplitude test.
Figure 2.65: Moment rotation curve for FP7
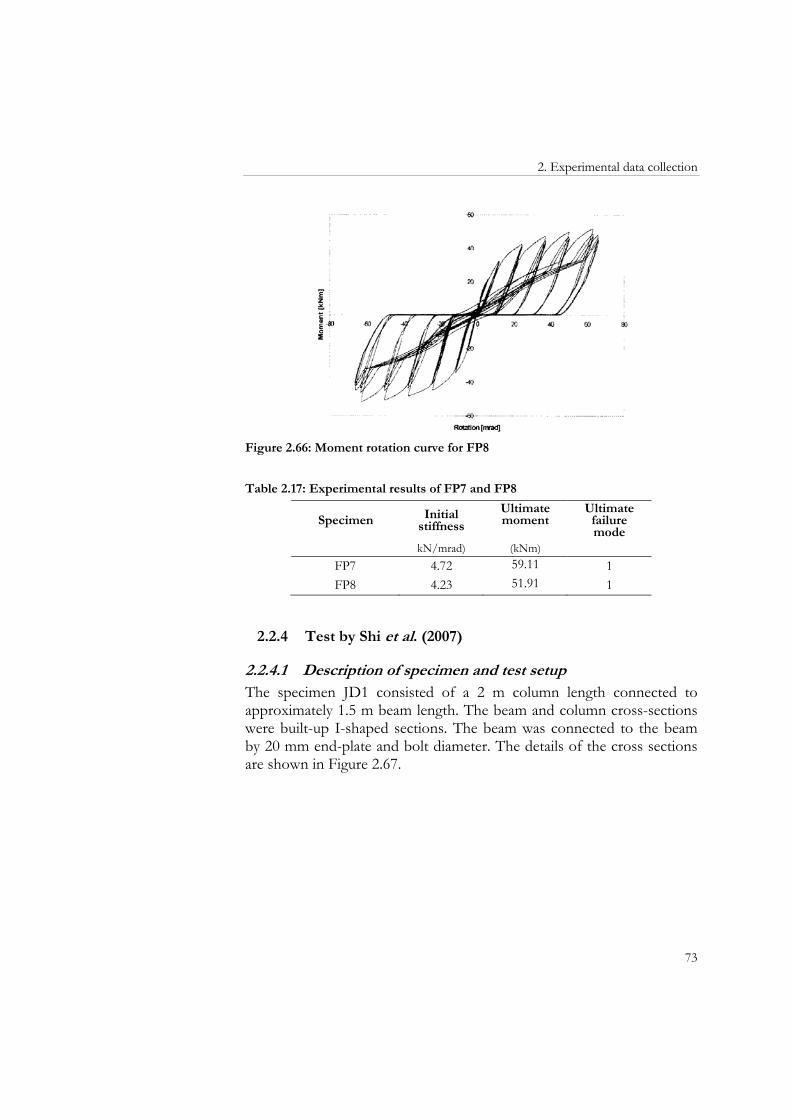
2. Experimental data collection
73
Figure 2.66: Moment rotation curve for FP8
Table 2.17: Experimental results of FP7 and FP8
Specimen Initial stiffness
Ultimate moment
Ultimate failure mode
kN/mrad) (kNm) FP7 4.72 59.11 1 FP8 4.23 51.91 1
2.2.4 Test by Shi et al. (2007)
2.2.4.1 Description of specimen and test setup The specimen JD1 consisted of a 2 m column length connected to approximately 1.5 m beam length. The beam and column cross-sections were built-up I-shaped sections. The beam was connected to the beam by 20 mm end-plate and bolt diameter. The details of the cross sections are shown in Figure 2.67.
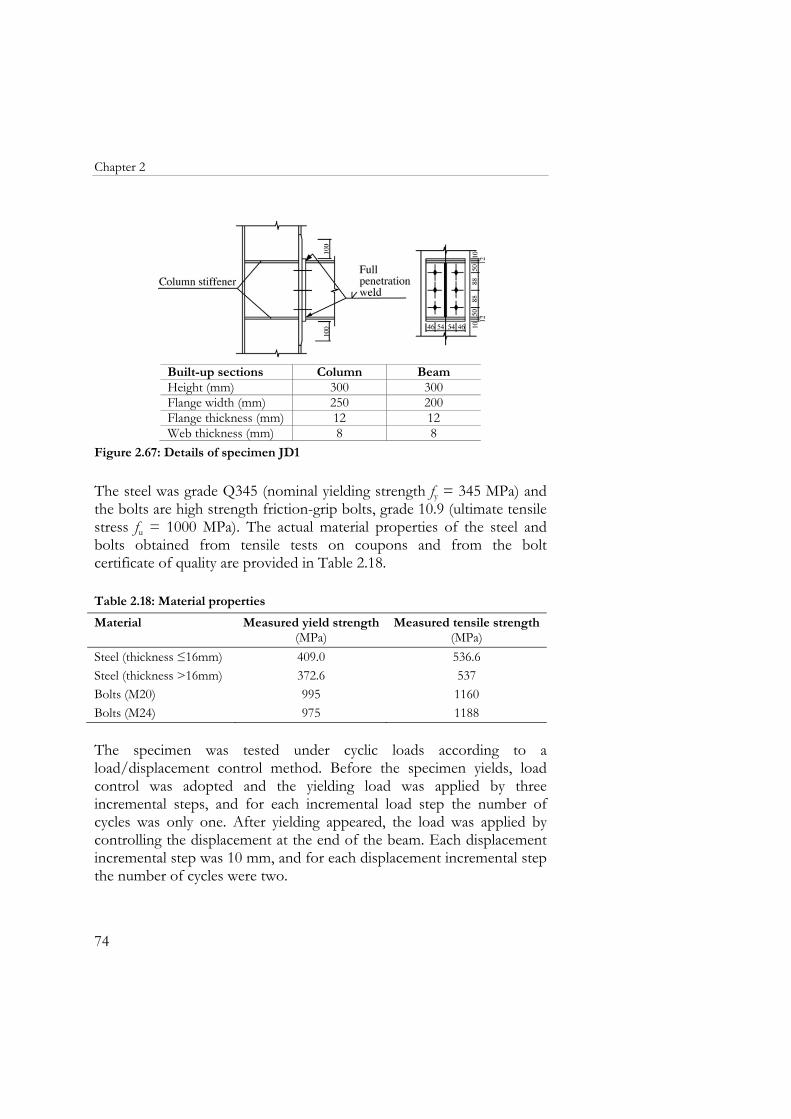
Chapter 2
74
Built-up sections Column BeamHeight (mm) 300 300Flange width (mm) 250 200Flange thickness (mm) 12 12Web thickness (mm) 8 8
Figure 2.67: Details of specimen JD1
The steel was grade Q345 (nominal yielding strength fy = 345 MPa) and the bolts are high strength friction-grip bolts, grade 10.9 (ultimate tensile stress fu = 1000 MPa). The actual material properties of the steel and bolts obtained from tensile tests on coupons and from the bolt certificate of quality are provided in Table 2.18. Table 2.18: Material properties
Material Measured yield strength(MPa)
Measured tensile strength(MPa)
Steel (thickness ≤16mm) 409.0 536.6Steel (thickness >16mm) 372.6 537Bolts (M20) 995 1160Bolts (M24) 975 1188 The specimen was tested under cyclic loads according to a load/displacement control method. Before the specimen yields, load control was adopted and the yielding load was applied by three incremental steps, and for each incremental load step the number of cycles was only one. After yielding appeared, the load was applied by controlling the displacement at the end of the beam. Each displacement incremental step was 10 mm, and for each displacement incremental step the number of cycles were two.
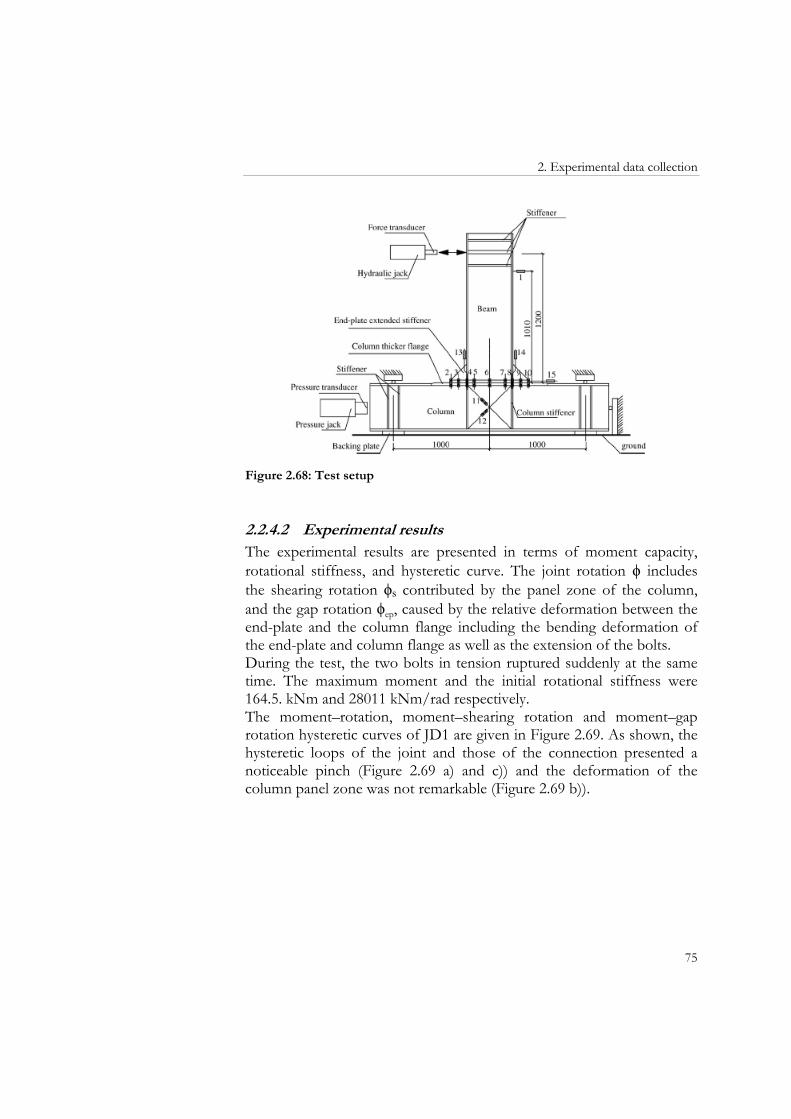
2. Experimental data collection
75
Figure 2.68: Test setup
2.2.4.2 Experimental results The experimental results are presented in terms of moment capacity, rotational stiffness, and hysteretic curve. The joint rotation ϕ includes the shearing rotation ϕs contributed by the panel zone of the column, and the gap rotation ϕep, caused by the relative deformation between the end-plate and the column flange including the bending deformation of the end-plate and column flange as well as the extension of the bolts. During the test, the two bolts in tension ruptured suddenly at the same time. The maximum moment and the initial rotational stiffness were 164.5. kNm and 28011 kNm/rad respectively. The moment–rotation, moment–shearing rotation and moment–gap rotation hysteretic curves of JD1 are given in Figure 2.69. As shown, the hysteretic loops of the joint and those of the connection presented a noticeable pinch (Figure 2.69 a) and c)) and the deformation of the column panel zone was not remarkable (Figure 2.69 b)).
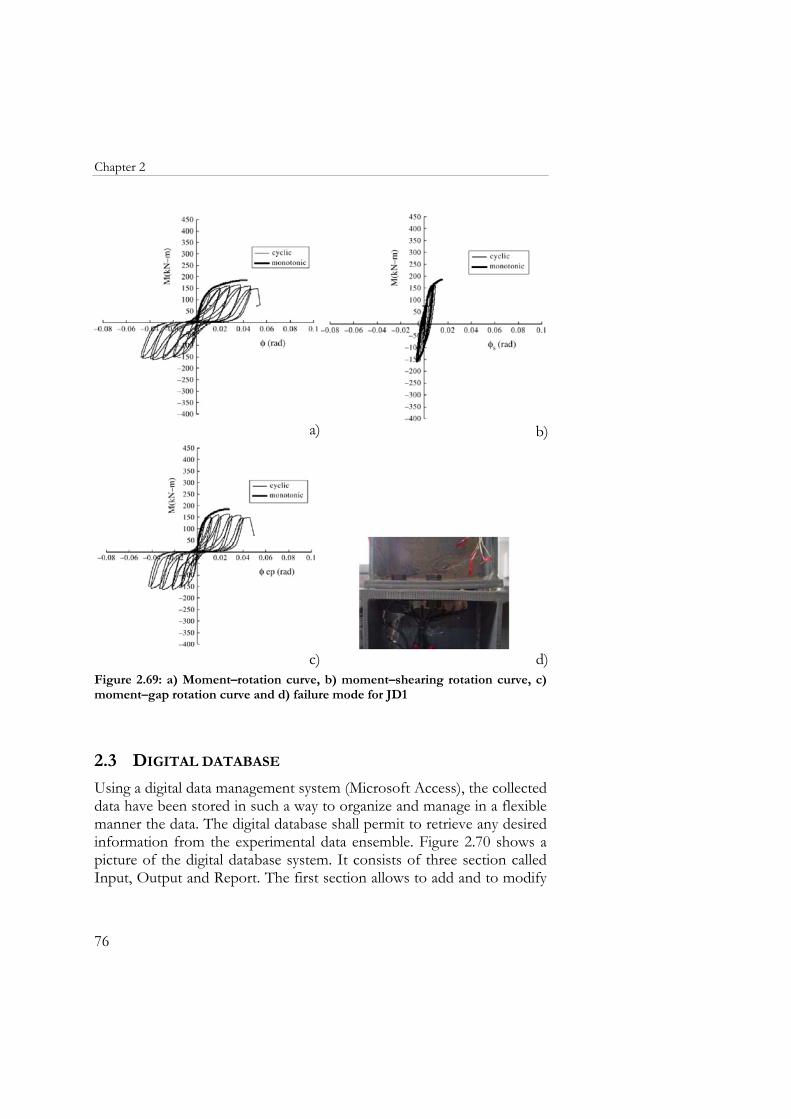
Chapter 2
76
a) b)
c)
d)
Figure 2.69: a) Moment–rotation curve, b) moment–shearing rotation curve, c) moment–gap rotation curve and d) failure mode for JD1
2.3 DIGITAL DATABASE
Using a digital data management system (Microsoft Access), the collected data have been stored in such a way to organize and manage in a flexible manner the data. The digital database shall permit to retrieve any desired information from the experimental data ensemble. Figure 2.70 shows a picture of the digital database system. It consists of three section called Input, Output and Report. The first section allows to add and to modify
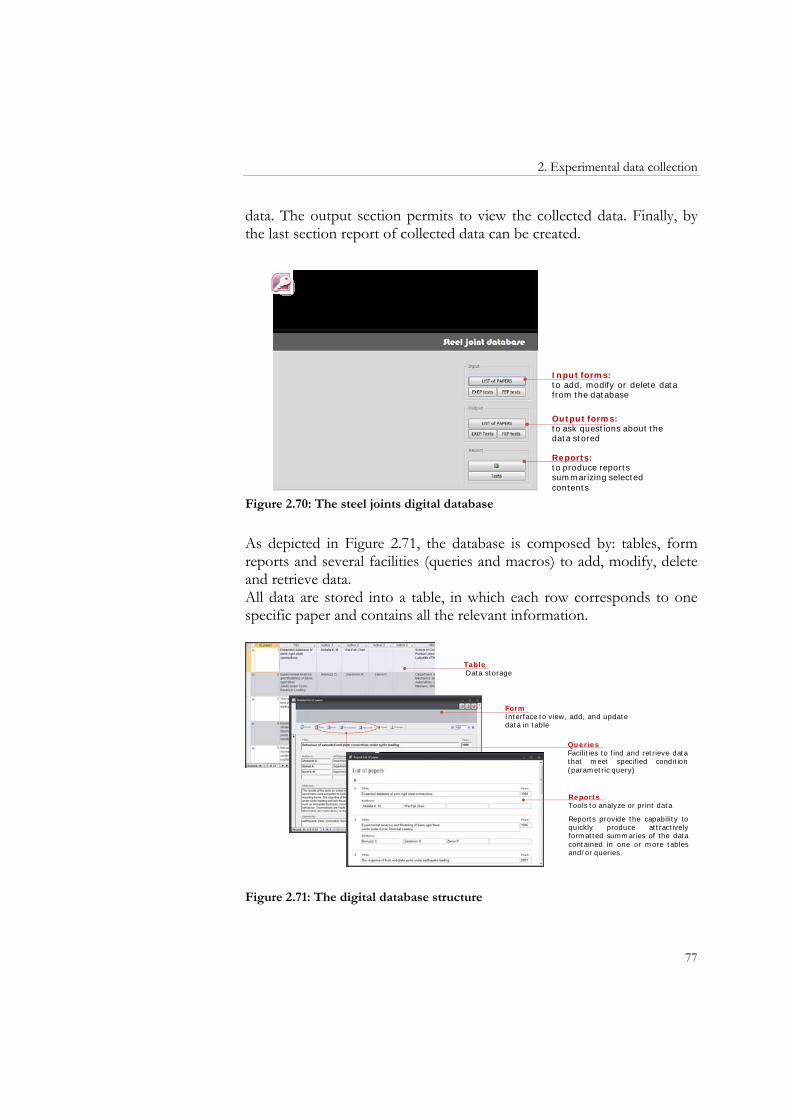
2. Experimental data collection
77
data. The output section permits to view the collected data. Finally, by the last section report of collected data can be created.
Input forms:to add, modify or delete datafrom the database
Output forms:to ask questions about the data stored
Reports:to produce reports summarizing selected contents
Figure 2.70: The steel joints digital database
As depicted in Figure 2.71, the database is composed by: tables, form reports and several facilities (queries and macros) to add, modify, delete and retrieve data. All data are stored into a table, in which each row corresponds to one specific paper and contains all the relevant information.
TableData storage
Form Interface to view, add, and update data in table
QueriesFacilities to find and retrieve datathat meet specified condition(parametric query)
Reports Tools to analyze or print data
Reports provide the capability toquickly produce attractivelyformatted summaries of the datacontained in one or more tablesand/or queries.
Figure 2.71: The digital database structure
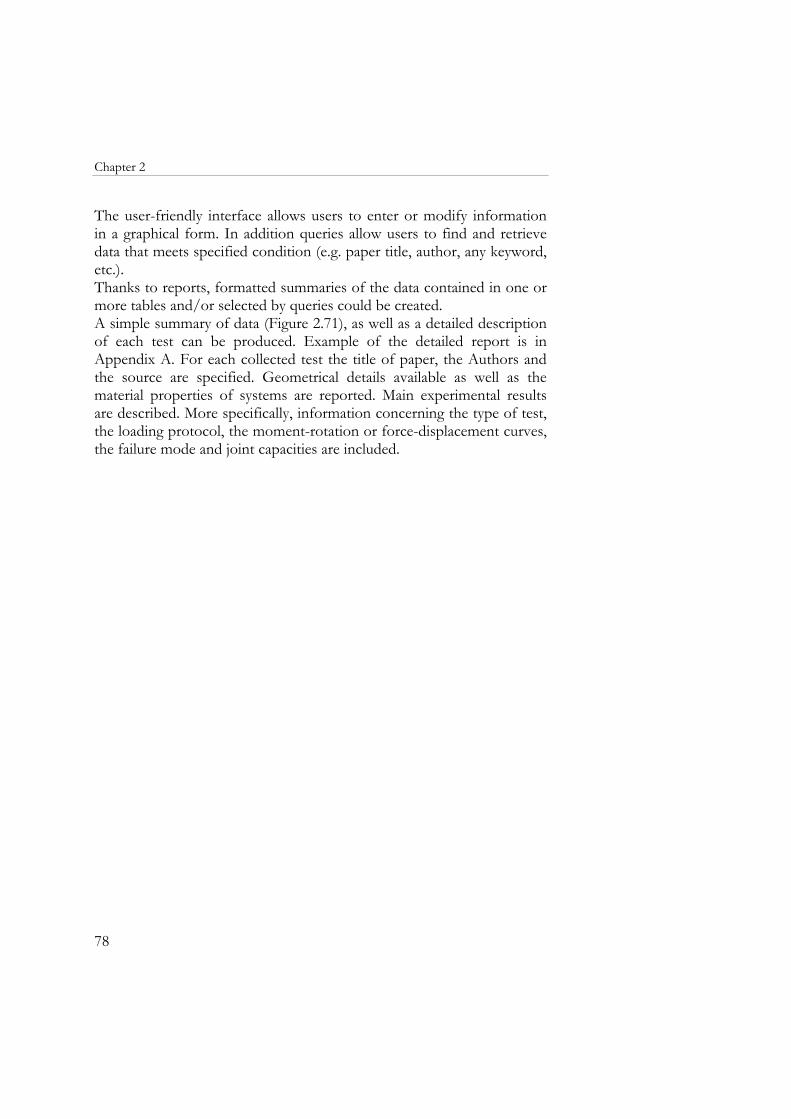
Chapter 2
78
The user-friendly interface allows users to enter or modify information in a graphical form. In addition queries allow users to find and retrieve data that meets specified condition (e.g. paper title, author, any keyword, etc.). Thanks to reports, formatted summaries of the data contained in one or more tables and/or selected by queries could be created. A simple summary of data (Figure 2.71), as well as a detailed description of each test can be produced. Example of the detailed report is in Appendix A. For each collected test the title of paper, the Authors and the source are specified. Geometrical details available as well as the material properties of systems are reported. Main experimental results are described. More specifically, information concerning the type of test, the loading protocol, the moment-rotation or force-displacement curves, the failure mode and joint capacities are included.
3 THEORETICAL PREDICTIONS AND COMPARISON WITH EXPERIMENTAL RESULTS
In this Chapter, the details of the component method applications are presented. Subsequently, the results of the comparison between the theoretical predictions and the experimental results are shown. Classification of each joint, in term of strength and stiffness, according to Eurocodes, is also provided. Finally, first observations about the influence of connection details on the joint structural properties are given.
3.1 EXTENDED END-PLATE CONNECTIONS
3.1.1 Tests by Ghobarah et al. (1990)
3.1.1.1 Specimen A-1 Table 3.1 summarizes the results of calculations according to the Eurocode 3 component method. The components are grouped according to tension, compression and shear loading. For each component, the third and the fourth columns give the strength (FR) and the stiffness coefficient (ki), respectively. The last (fifth) column gives the resisting bending moment (MR) evaluated as the product of the weakest component strength (FR) times the internal lever arm, per each loading type (tension, compression, shear). The theoretical predictions consider nominal geometrical properties of the beam, column and end-plate. Since the details of the end-plate layout were not available, a likely configuration was assumed for it. About the material modelling, the expected value of the yield equal to 394.38 MPa was used for the column, end-plate and column reinforcing plates. It considers a material
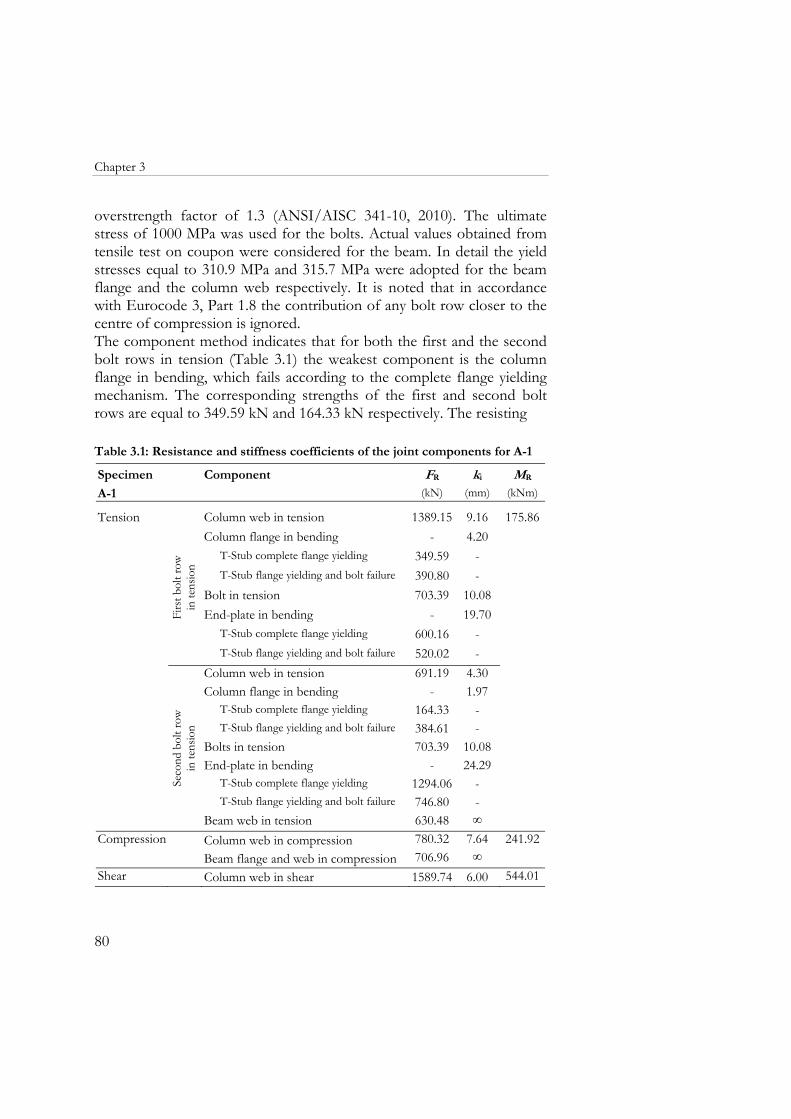
Chapter 3
80
overstrength factor of 1.3 (ANSI/AISC 341-10, 2010). The ultimate stress of 1000 MPa was used for the bolts. Actual values obtained from tensile test on coupon were considered for the beam. In detail the yield stresses equal to 310.9 MPa and 315.7 MPa were adopted for the beam flange and the column web respectively. It is noted that in accordance with Eurocode 3, Part 1.8 the contribution of any bolt row closer to the centre of compression is ignored. The component method indicates that for both the first and the second bolt rows in tension (Table 3.1) the weakest component is the column flange in bending, which fails according to the complete flange yielding mechanism. The corresponding strengths of the first and second bolt rows are equal to 349.59 kN and 164.33 kN respectively. The resisting Table 3.1: Resistance and stiffness coefficients of the joint components for A-1
Specimen Component FR ki MR A-1 (kN) (mm) (kNm)
Tension
Firs
t bol
t row
in
tens
ion
Column web in tension 1389.15 9.16 175.86Column flange in bending - 4.20
T-Stub complete flange yielding 349.59 -T-Stub flange yielding and bolt failure 390.80 -
Bolt in tension 703.39 10.08End-plate in bending - 19.70
T-Stub complete flange yielding 600.16 -T-Stub flange yielding and bolt failure 520.02 -
Seco
nd b
olt r
ow
in te
nsio
n
Column web in tension 691.19 4.30Column flange in bending - 1.97
T-Stub complete flange yielding 164.33 -T-Stub flange yielding and bolt failure 384.61 -
Bolts in tension 703.39 10.08End-plate in bending - 24.29
T-Stub complete flange yielding 1294.06 -T-Stub flange yielding and bolt failure 746.80 -
Beam web in tension 630.48 ∞Compression Column web in compression 780.32 7.64 241.92
Beam flange and web in compression 706.96 ∞Shear Column web in shear 1589.74 6.00 544.01
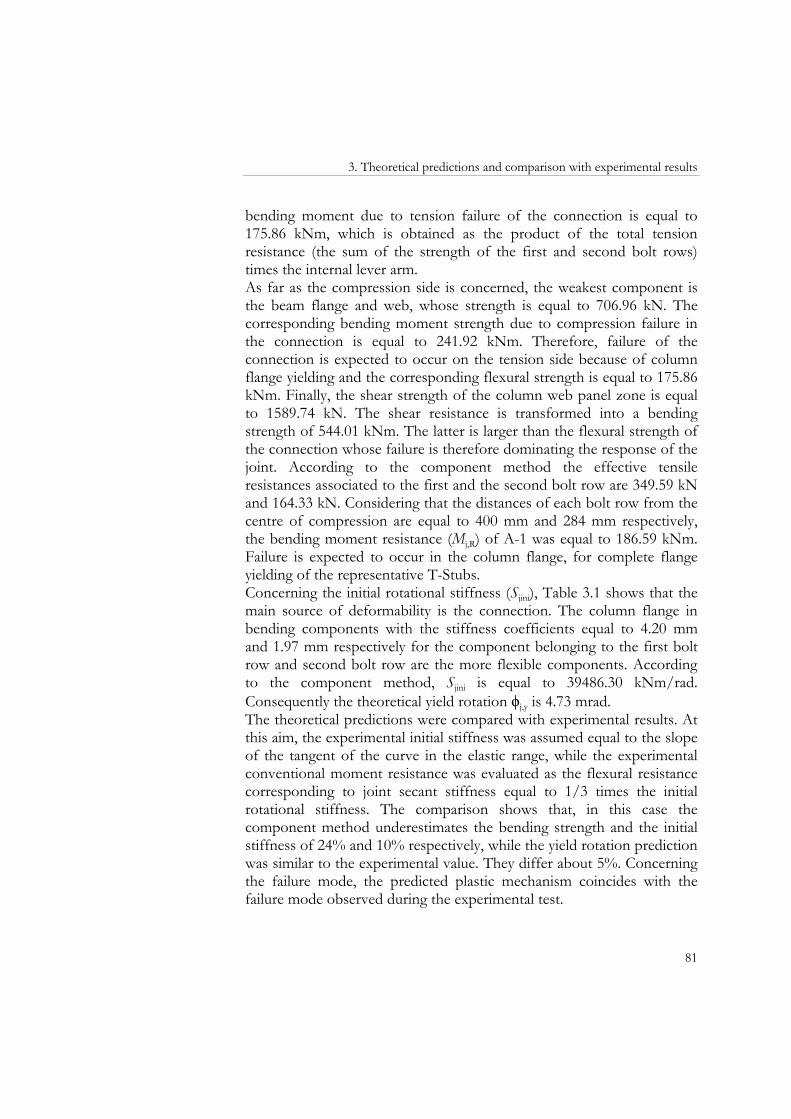
3. Theoretical predictions and comparison with experimental results
81
bending moment due to tension failure of the connection is equal to 175.86 kNm, which is obtained as the product of the total tension resistance (the sum of the strength of the first and second bolt rows) times the internal lever arm. As far as the compression side is concerned, the weakest component is the beam flange and web, whose strength is equal to 706.96 kN. The corresponding bending moment strength due to compression failure in the connection is equal to 241.92 kNm. Therefore, failure of the connection is expected to occur on the tension side because of column flange yielding and the corresponding flexural strength is equal to 175.86 kNm. Finally, the shear strength of the column web panel zone is equal to 1589.74 kN. The shear resistance is transformed into a bending strength of 544.01 kNm. The latter is larger than the flexural strength of the connection whose failure is therefore dominating the response of the joint. According to the component method the effective tensile resistances associated to the first and the second bolt row are 349.59 kN and 164.33 kN. Considering that the distances of each bolt row from the centre of compression are equal to 400 mm and 284 mm respectively, the bending moment resistance (Mj,R) of A-1 was equal to 186.59 kNm. Failure is expected to occur in the column flange, for complete flange yielding of the representative T-Stubs. Concerning the initial rotational stiffness (Sjini), Table 3.1 shows that the main source of deformability is the connection. The column flange in bending components with the stiffness coefficients equal to 4.20 mm and 1.97 mm respectively for the component belonging to the first bolt row and second bolt row are the more flexible components. According to the component method, Sjini is equal to 39486.30 kNm/rad. Consequently the theoretical yield rotation ϕj,y is 4.73 mrad. The theoretical predictions were compared with experimental results. At this aim, the experimental initial stiffness was assumed equal to the slope of the tangent of the curve in the elastic range, while the experimental conventional moment resistance was evaluated as the flexural resistance corresponding to joint secant stiffness equal to 1/3 times the initial rotational stiffness. The comparison shows that, in this case the component method underestimates the bending strength and the initial stiffness of 24% and 10% respectively, while the yield rotation prediction was similar to the experimental value. They differ about 5%. Concerning the failure mode, the predicted plastic mechanism coincides with the failure mode observed during the experimental test.
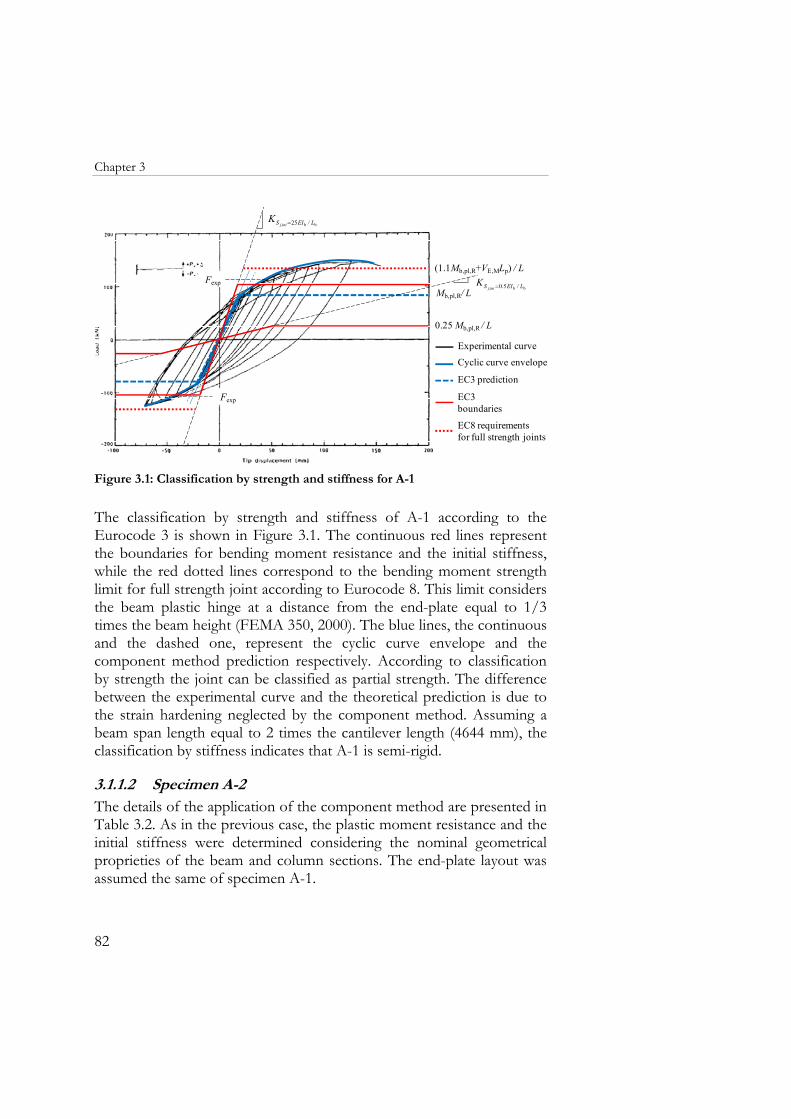
Chapter 3
82
EC3 boundaries
EC8 requirements for full strength joints
EC3 prediction
Experimental curve
0.25 Mb,pl,R / L
bb25 L/EIS inij,K =
bb50 L/EI.S inij,K =
Cyclic curve envelope
Fexp
Fexp
(1.1Mb,pl,R+VE,MLp) / L
Mb,pl,R/ L
Figure 3.1: Classification by strength and stiffness for A-1
The classification by strength and stiffness of A-1 according to the Eurocode 3 is shown in Figure 3.1. The continuous red lines represent the boundaries for bending moment resistance and the initial stiffness, while the red dotted lines correspond to the bending moment strength limit for full strength joint according to Eurocode 8. This limit considers the beam plastic hinge at a distance from the end-plate equal to 1/3 times the beam height (FEMA 350, 2000). The blue lines, the continuous and the dashed one, represent the cyclic curve envelope and the component method prediction respectively. According to classification by strength the joint can be classified as partial strength. The difference between the experimental curve and the theoretical prediction is due to the strain hardening neglected by the component method. Assuming a beam span length equal to 2 times the cantilever length (4644 mm), the classification by stiffness indicates that A-1 is semi-rigid.
3.1.1.2 Specimen A-2 The details of the application of the component method are presented in Table 3.2. As in the previous case, the plastic moment resistance and the initial stiffness were determined considering the nominal geometrical proprieties of the beam and column sections. The end-plate layout was assumed the same of specimen A-1.
3. Theoretical predictions and comparison with experimental results
83
Concerning material properties, the expected yield stress of 394.38 MPa (1.3 × 303.37 MPa) was considered for the column, end-plate and column reinforcing plates. The nominal ultimate stress of 1000 MPa was used for the bolts. Actual values obtained from tensile test on coupon were considered for the beam. In particular the yield stresses equal to 316.1 MPa and 322.1 MPa were adopted for the beam flange and the column web respectively. Table 3.2: Resistance and stiffness coefficients of the joint components for A-2
Specimen Component FR ki MR A-2 (kN) (mm) (kNm)
Tension
Firs
t bol
t row
in
tens
ion
Column web in tension 1494.54 9.98 260.72Column flange in bending - 4.57
T-Stub complete flange yielding 380.94 - T-Stub flange yielding and bolt failure 400.07 -
Bolt in tension 703.39 10.08 End-plate in bending - 44.50
T-Stub complete flange yielding 600.16 - T-Stub flange yielding and bolt failure 520.02 -
Seco
nd b
olt r
ow
in te
nsio
n
Column web in tension 1494.54 9.98 Column flange in bending - 4.57
T-Stub complete flange yielding 380.94 - T-Stub flange yielding and bolt failure 400.07 -
Bolts in tension 703.39 10.08 End-plate in bending - 24.06
T-Stub complete flange yielding 1281.74 - T-Stub flange yielding and bolt failure 746.80 -
Beam web in tension 636.94 ∞ Compression Column web in compression 1595.17 ∞ 245.97
Beam flange and web in compression 718.78 ∞ Shear Column web in shear 1631.27 6.00 558.22 Table 3.2 shows that for both the first and the second bolt rows in tension the weakest component was the column flange in bending which fails according to the complete flange yielding mechanism. The corresponding strengths are equal to 380.94 kN. The corresponding
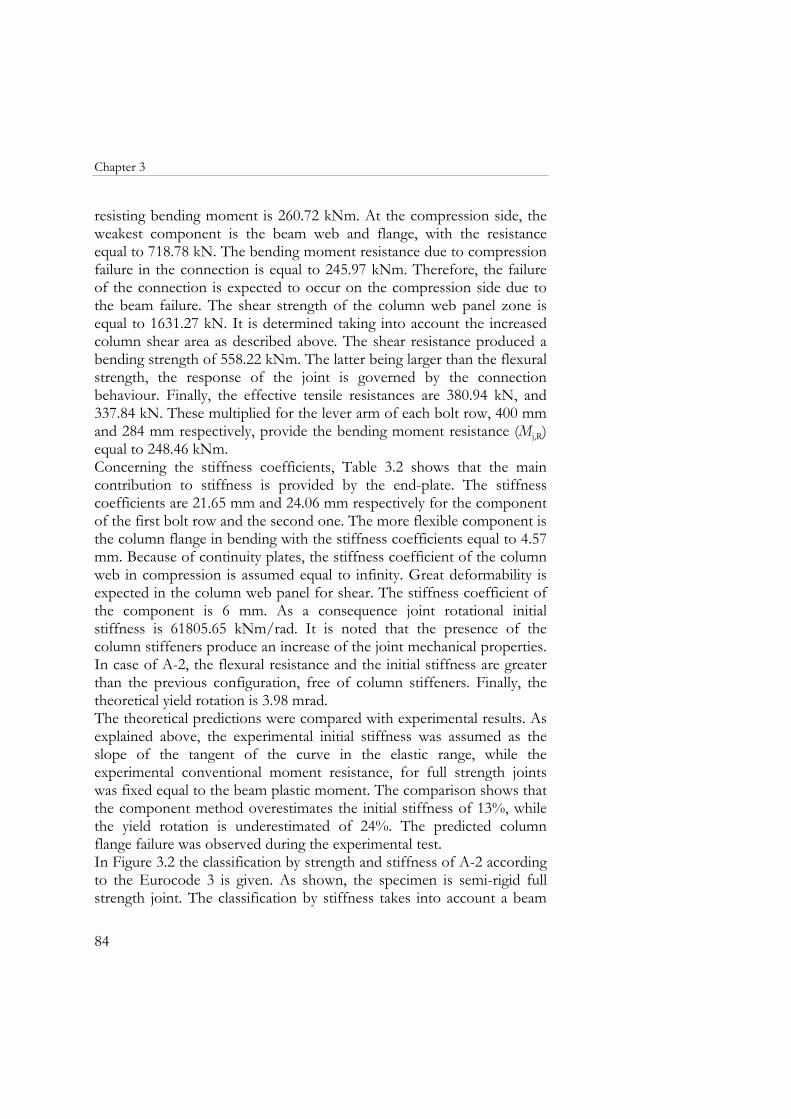
Chapter 3
84
resisting bending moment is 260.72 kNm. At the compression side, the weakest component is the beam web and flange, with the resistance equal to 718.78 kN. The bending moment resistance due to compression failure in the connection is equal to 245.97 kNm. Therefore, the failure of the connection is expected to occur on the compression side due to the beam failure. The shear strength of the column web panel zone is equal to 1631.27 kN. It is determined taking into account the increased column shear area as described above. The shear resistance produced a bending strength of 558.22 kNm. The latter being larger than the flexural strength, the response of the joint is governed by the connection behaviour. Finally, the effective tensile resistances are 380.94 kN, and 337.84 kN. These multiplied for the lever arm of each bolt row, 400 mm and 284 mm respectively, provide the bending moment resistance (Mj,R) equal to 248.46 kNm. Concerning the stiffness coefficients, Table 3.2 shows that the main contribution to stiffness is provided by the end-plate. The stiffness coefficients are 21.65 mm and 24.06 mm respectively for the component of the first bolt row and the second one. The more flexible component is the column flange in bending with the stiffness coefficients equal to 4.57 mm. Because of continuity plates, the stiffness coefficient of the column web in compression is assumed equal to infinity. Great deformability is expected in the column web panel for shear. The stiffness coefficient of the component is 6 mm. As a consequence joint rotational initial stiffness is 61805.65 kNm/rad. It is noted that the presence of the column stiffeners produce an increase of the joint mechanical properties. In case of A-2, the flexural resistance and the initial stiffness are greater than the previous configuration, free of column stiffeners. Finally, the theoretical yield rotation is 3.98 mrad. The theoretical predictions were compared with experimental results. As explained above, the experimental initial stiffness was assumed as the slope of the tangent of the curve in the elastic range, while the experimental conventional moment resistance, for full strength joints was fixed equal to the beam plastic moment. The comparison shows that the component method overestimates the initial stiffness of 13%, while the yield rotation is underestimated of 24%. The predicted column flange failure was observed during the experimental test. In Figure 3.2 the classification by strength and stiffness of A-2 according to the Eurocode 3 is given. As shown, the specimen is semi-rigid full strength joint. The classification by stiffness takes into account a beam
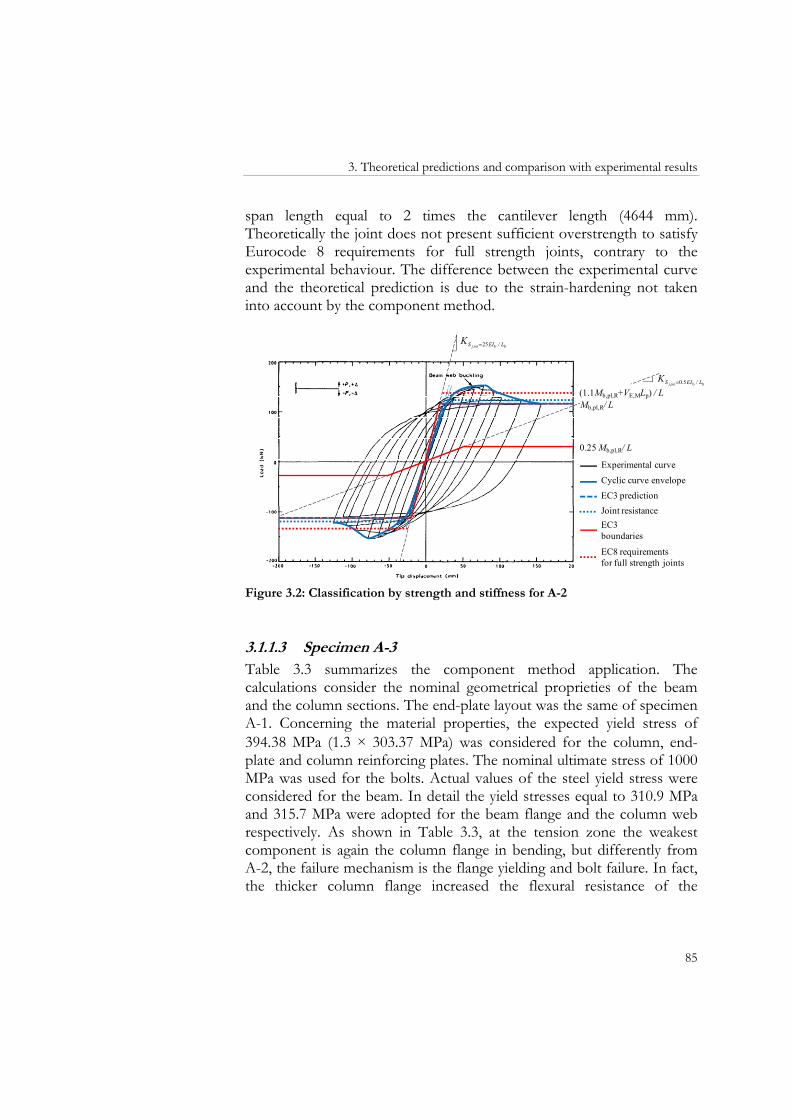
3. Theoretical predictions and comparison with experimental results
85
span length equal to 2 times the cantilever length (4644 mm). Theoretically the joint does not present sufficient overstrength to satisfy Eurocode 8 requirements for full strength joints, contrary to the experimental behaviour. The difference between the experimental curve and the theoretical prediction is due to the strain-hardening not taken into account by the component method.
0.25 Mb,pl,R/ L
Mb,pl,R/ L
bb25 L/EIS inij,K =
(1.1Mb,pl,R+VE,MLp) / Lbb50 L/EI.S inij,
K =
EC3 boundaries
EC8 requirements for full strength joints
EC3 prediction
Experimental curve
Cyclic curve envelope
Joint resistance
Figure 3.2: Classification by strength and stiffness for A-2
3.1.1.3 Specimen A-3 Table 3.3 summarizes the component method application. The calculations consider the nominal geometrical proprieties of the beam and the column sections. The end-plate layout was the same of specimen A-1. Concerning the material properties, the expected yield stress of 394.38 MPa (1.3 × 303.37 MPa) was considered for the column, end-plate and column reinforcing plates. The nominal ultimate stress of 1000 MPa was used for the bolts. Actual values of the steel yield stress were considered for the beam. In detail the yield stresses equal to 310.9 MPa and 315.7 MPa were adopted for the beam flange and the column web respectively. As shown in Table 3.3, at the tension zone the weakest component is again the column flange in bending, but differently from A-2, the failure mechanism is the flange yielding and bolt failure. In fact, the thicker column flange increased the flexural resistance of the
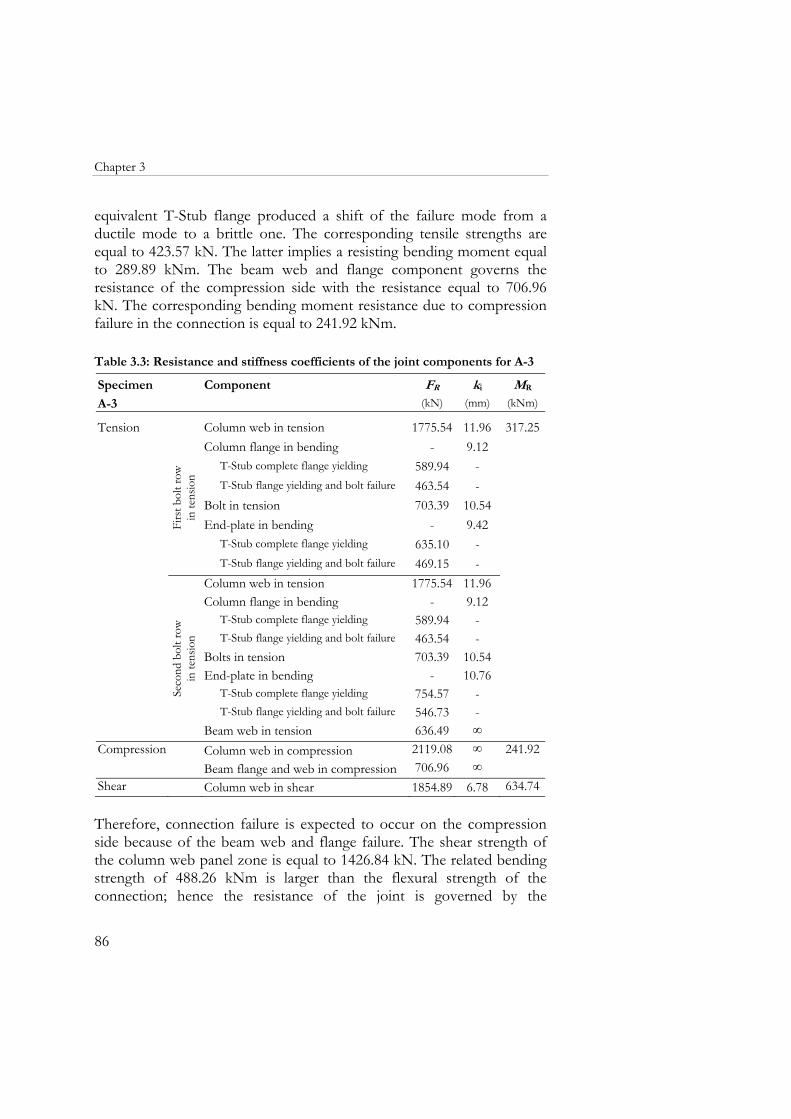
Chapter 3
86
equivalent T-Stub flange produced a shift of the failure mode from a ductile mode to a brittle one. The corresponding tensile strengths are equal to 423.57 kN. The latter implies a resisting bending moment equal to 289.89 kNm. The beam web and flange component governs the resistance of the compression side with the resistance equal to 706.96 kN. The corresponding bending moment resistance due to compression failure in the connection is equal to 241.92 kNm. Table 3.3: Resistance and stiffness coefficients of the joint components for A-3
Specimen Component FR ki MR A-3 (kN) (mm) (kNm)
Tension
Firs
t bol
t row
in
tens
ion
Column web in tension 1775.54 11.96 317.25Column flange in bending - 9.12
T-Stub complete flange yielding 589.94 -T-Stub flange yielding and bolt failure 463.54 -
Bolt in tension 703.39 10.54End-plate in bending - 9.42
T-Stub complete flange yielding 635.10 -T-Stub flange yielding and bolt failure 469.15 -
Seco
nd b
olt r
ow
in te
nsio
n
Column web in tension 1775.54 11.96Column flange in bending - 9.12
T-Stub complete flange yielding 589.94 -T-Stub flange yielding and bolt failure 463.54 -
Bolts in tension 703.39 10.54End-plate in bending - 10.76
T-Stub complete flange yielding 754.57 -T-Stub flange yielding and bolt failure 546.73 -
Beam web in tension 636.49 ∞Compression Column web in compression 2119.08 ∞ 241.92
Beam flange and web in compression 706.96 ∞Shear Column web in shear 1854.89 6.78 634.74 Therefore, connection failure is expected to occur on the compression side because of the beam web and flange failure. The shear strength of the column web panel zone is equal to 1426.84 kN. The related bending strength of 488.26 kNm is larger than the flexural strength of the connection; hence the resistance of the joint is governed by the
3. Theoretical predictions and comparison with experimental results
87
connection one. The effective tensile resistances are 463.54 kN and 243.41 kN and the corresponding distance from the centre of compression joint resistance are equal to 400mm and 284mm respectively. As a consequence the bending moment resistance of A-3 is 241.92 kNm. Failure is expected in the column flange and in the beam web and flange. Concerning the stiffness coefficients, Table 3.3 shows that the main source of deformability is the panel zone in shear. Its stiffness coefficient is equal to 6.78 mm. The theoretical procedure returned the joint rotational initial stiffness of 70889.05 kNm/rad and consequently yield rotation of 3.41 mrad. Although the analytical approach underestimates of 40% the initial rotational stiffness, it provides a good prediction of the flexural strength. The yield rotation is overestimated of 66%. For specimen A-3, the expected failure of the beam flange and web in compression is observed during the experimental test. The classification of A-3 is shown in Figure 3.3. According to Eurocode 3, A-3 is classified as full strength joint. The specimen satisfies Eurocode 8 requirements for full strength joints too. Assuming a beam span length equal to 2 times the cantilever length (4650 mm), according to the classification by stiffness A-3 is semi-rigid.
bb25 L/EIS inij,K =
bb50 L/EI.S inij,K =
0.25 Mb,pl,R / L
Mb,pl,R/ L(1.1Mb,pl,R+VE,MLp) / L
EC3 boundaries
EC8 requirements for full strength joints
EC3 prediction
Experimental curve
Cyclic curve envelope
Joint resistance
Figure 3.3: Classification by strength and stiffness for A-3
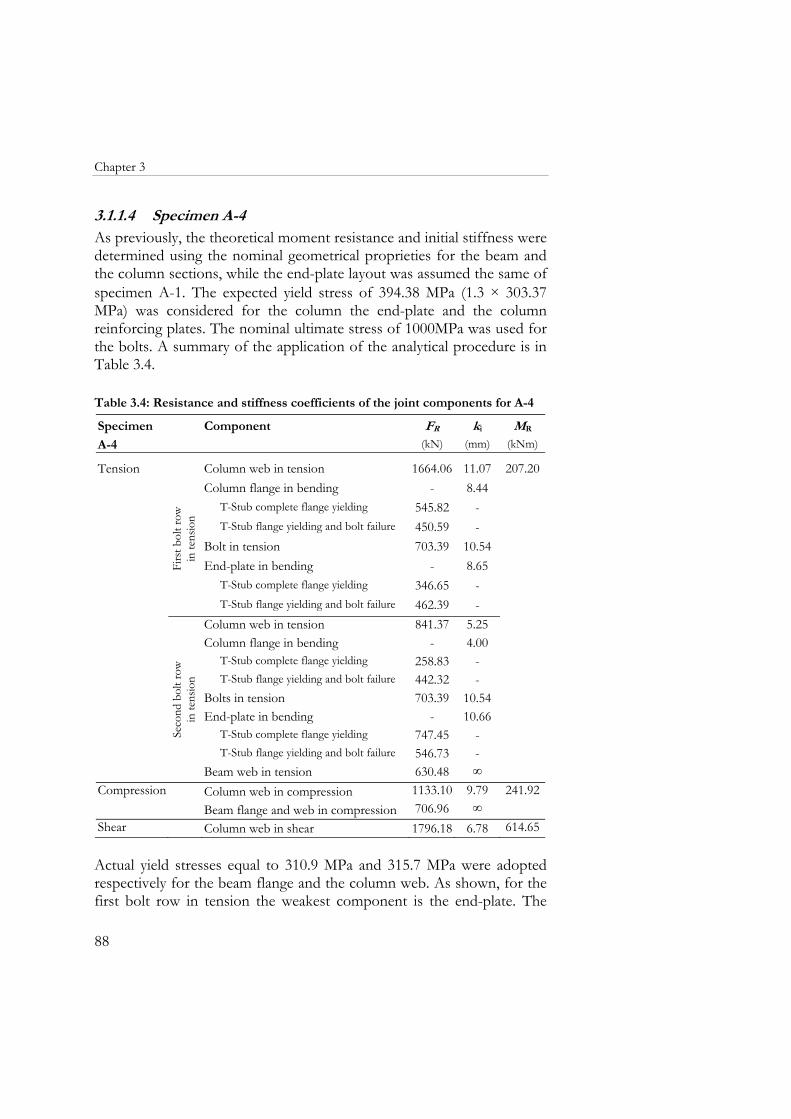
Chapter 3
88
3.1.1.4 Specimen A-4 As previously, the theoretical moment resistance and initial stiffness were determined using the nominal geometrical proprieties for the beam and the column sections, while the end-plate layout was assumed the same of specimen A-1. The expected yield stress of 394.38 MPa (1.3 × 303.37 MPa) was considered for the column the end-plate and the column reinforcing plates. The nominal ultimate stress of 1000MPa was used for the bolts. A summary of the application of the analytical procedure is in Table 3.4. Table 3.4: Resistance and stiffness coefficients of the joint components for A-4
Specimen Component FR ki MR A-4 (kN) (mm) (kNm)
Tension
Firs
t bol
t row
in
tens
ion
Column web in tension 1664.06 11.07 207.20Column flange in bending - 8.44
T-Stub complete flange yielding 545.82 -T-Stub flange yielding and bolt failure 450.59 -
Bolt in tension 703.39 10.54End-plate in bending - 8.65
T-Stub complete flange yielding 346.65 -T-Stub flange yielding and bolt failure 462.39 -
Seco
nd b
olt r
ow
in te
nsio
n
Column web in tension 841.37 5.25Column flange in bending - 4.00
T-Stub complete flange yielding 258.83 -T-Stub flange yielding and bolt failure 442.32 -
Bolts in tension 703.39 10.54End-plate in bending - 10.66
T-Stub complete flange yielding 747.45 -T-Stub flange yielding and bolt failure 546.73 -
Beam web in tension 630.48 ∞Compression Column web in compression 1133.10 9.79 241.92
Beam flange and web in compression 706.96 ∞Shear Column web in shear 1796.18 6.78 614.65 Actual yield stresses equal to 310.9 MPa and 315.7 MPa were adopted respectively for the beam flange and the column web. As shown, for the first bolt row in tension the weakest component is the end-plate. The
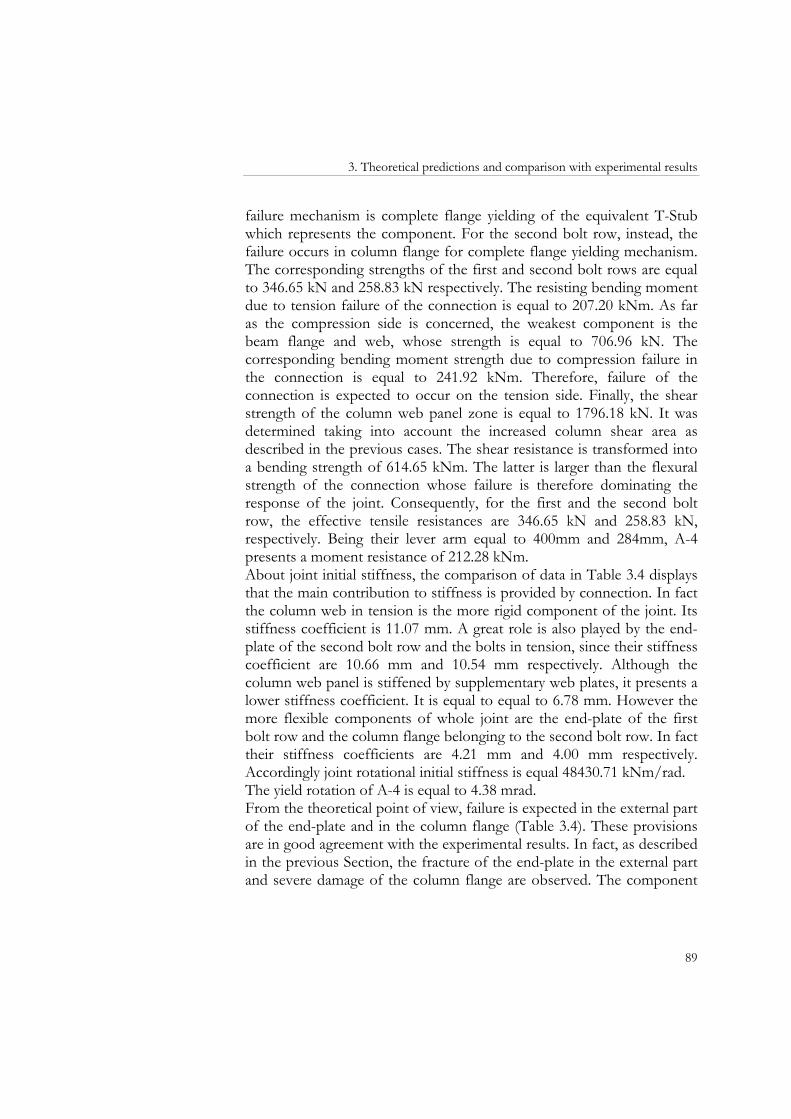
3. Theoretical predictions and comparison with experimental results
89
failure mechanism is complete flange yielding of the equivalent T-Stub which represents the component. For the second bolt row, instead, the failure occurs in column flange for complete flange yielding mechanism. The corresponding strengths of the first and second bolt rows are equal to 346.65 kN and 258.83 kN respectively. The resisting bending moment due to tension failure of the connection is equal to 207.20 kNm. As far as the compression side is concerned, the weakest component is the beam flange and web, whose strength is equal to 706.96 kN. The corresponding bending moment strength due to compression failure in the connection is equal to 241.92 kNm. Therefore, failure of the connection is expected to occur on the tension side. Finally, the shear strength of the column web panel zone is equal to 1796.18 kN. It was determined taking into account the increased column shear area as described in the previous cases. The shear resistance is transformed into a bending strength of 614.65 kNm. The latter is larger than the flexural strength of the connection whose failure is therefore dominating the response of the joint. Consequently, for the first and the second bolt row, the effective tensile resistances are 346.65 kN and 258.83 kN, respectively. Being their lever arm equal to 400mm and 284mm, A-4 presents a moment resistance of 212.28 kNm. About joint initial stiffness, the comparison of data in Table 3.4 displays that the main contribution to stiffness is provided by connection. In fact the column web in tension is the more rigid component of the joint. Its stiffness coefficient is 11.07 mm. A great role is also played by the end-plate of the second bolt row and the bolts in tension, since their stiffness coefficient are 10.66 mm and 10.54 mm respectively. Although the column web panel is stiffened by supplementary web plates, it presents a lower stiffness coefficient. It is equal to equal to 6.78 mm. However the more flexible components of whole joint are the end-plate of the first bolt row and the column flange belonging to the second bolt row. In fact their stiffness coefficients are 4.21 mm and 4.00 mm respectively. Accordingly joint rotational initial stiffness is equal 48430.71 kNm/rad. The yield rotation of A-4 is equal to 4.38 mrad. From the theoretical point of view, failure is expected in the external part of the end-plate and in the column flange (Table 3.4). These provisions are in good agreement with the experimental results. In fact, as described in the previous Section, the fracture of the end-plate in the external part and severe damage of the column flange are observed. The component
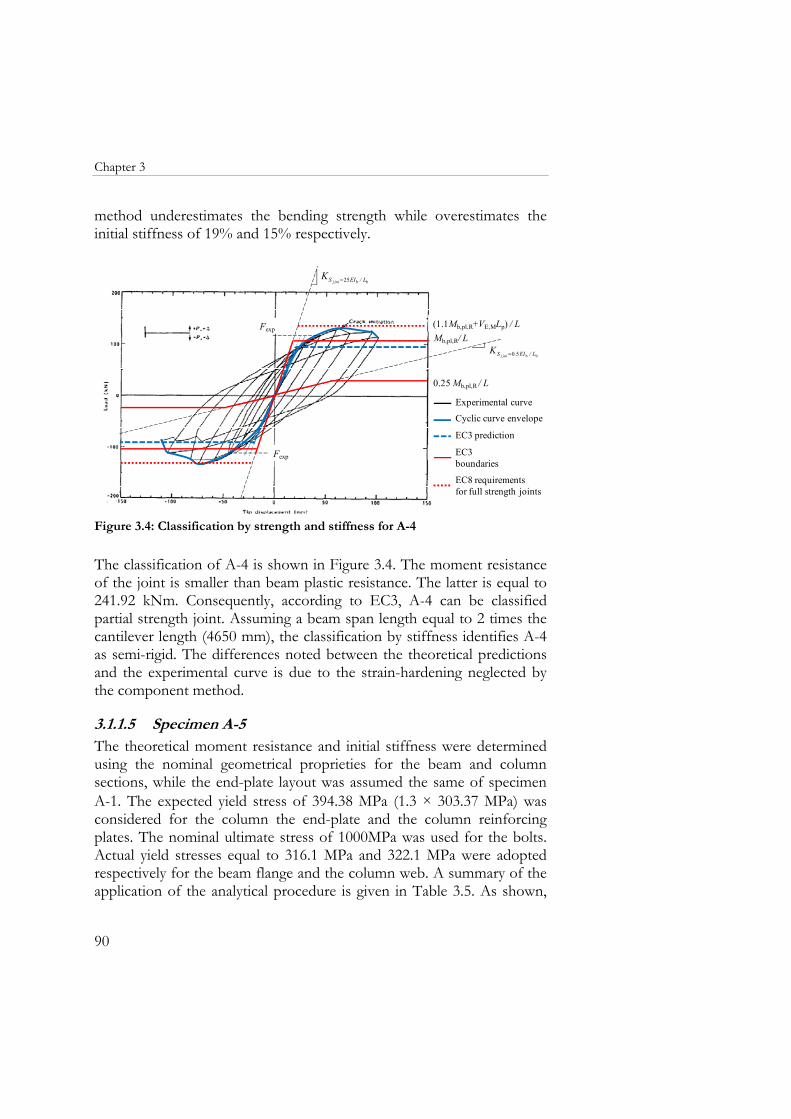
Chapter 3
90
method underestimates the bending strength while overestimates the initial stiffness of 19% and 15% respectively.
bb25 L/EIS inij,K =
0.25 Mb,pl,R / L
Mb,pl,R/ L
bb50 L/EI.S inij,K =
(1.1Mb,pl,R+VE,MLp) / LFexp
Fexp EC3 boundaries
EC8 requirements for full strength joints
EC3 prediction
Experimental curve
Cyclic curve envelope
Figure 3.4: Classification by strength and stiffness for A-4
The classification of A-4 is shown in Figure 3.4. The moment resistance of the joint is smaller than beam plastic resistance. The latter is equal to 241.92 kNm. Consequently, according to EC3, A-4 can be classified partial strength joint. Assuming a beam span length equal to 2 times the cantilever length (4650 mm), the classification by stiffness identifies A-4 as semi-rigid. The differences noted between the theoretical predictions and the experimental curve is due to the strain-hardening neglected by the component method.
3.1.1.5 Specimen A-5 The theoretical moment resistance and initial stiffness were determined using the nominal geometrical proprieties for the beam and column sections, while the end-plate layout was assumed the same of specimen A-1. The expected yield stress of 394.38 MPa (1.3 × 303.37 MPa) was considered for the column the end-plate and the column reinforcing plates. The nominal ultimate stress of 1000MPa was used for the bolts. Actual yield stresses equal to 316.1 MPa and 322.1 MPa were adopted respectively for the beam flange and the column web. A summary of the application of the analytical procedure is given in Table 3.5. As shown,
3. Theoretical predictions and comparison with experimental results
91
for the two bolt rows in tension the weakest component is the end-plate. The failure mechanism is flange yielding and bolt failure of the equivalent T-Stub which represents the component. The corresponding strengths of the first and second bolt rows are equal to 397.30 kN and 444.77 kN respectively. The resisting bending moment due to tension failure of the connection is equal to 287.74 kNm. As far as the compression side is concerned, the weakest component is the beam flange and web, whose strength is equal to 718.78 kN. The corresponding bending moment strength due to compression failure in the connection is equal to 245.97 kNm. Therefore, failure of the connection is expected to occur on compression side. Table 3.5: Resistance and stiffness coefficients of the joint components for A-5
Specimen Component FR ki MR A-5 (kN) (mm) (kNm)
Tension
Firs
t bol
t row
in
tens
ion
Column web in tension 1570.67 11.96 287.74Column flange in bending - 9.12
T-Stub complete flange yielding 521.87 - T-Stub flange yielding and bolt failure 443.55 -
Bolt in tension 703.39 11.10 End-plate in bending - 5.62
T-Stub complete flange yielding 398.41 - T-Stub flange yielding and bolt failure 397.30 -
Seco
nd b
olt r
ow
in te
nsio
n
Column web in tension 1570.67 11.96 Column flange in bending - 9.12
T-Stub complete flange yielding 521.87 - T-Stub flange yielding and bolt failure 443.55 -
Bolts in tension 703.39 11.10 End-plate in bending - 6.43
T-Stub complete flange yielding 473.35 - T-Stub flange yielding and bolt failure 444.77 -
Beam web in tension 649.39 ∞ Compression Column web in compression 1916.84 ∞ 245.97
Beam flange and web in compression 718.78 ∞ Shear Column web in shear 1640.86 6.78 561.50
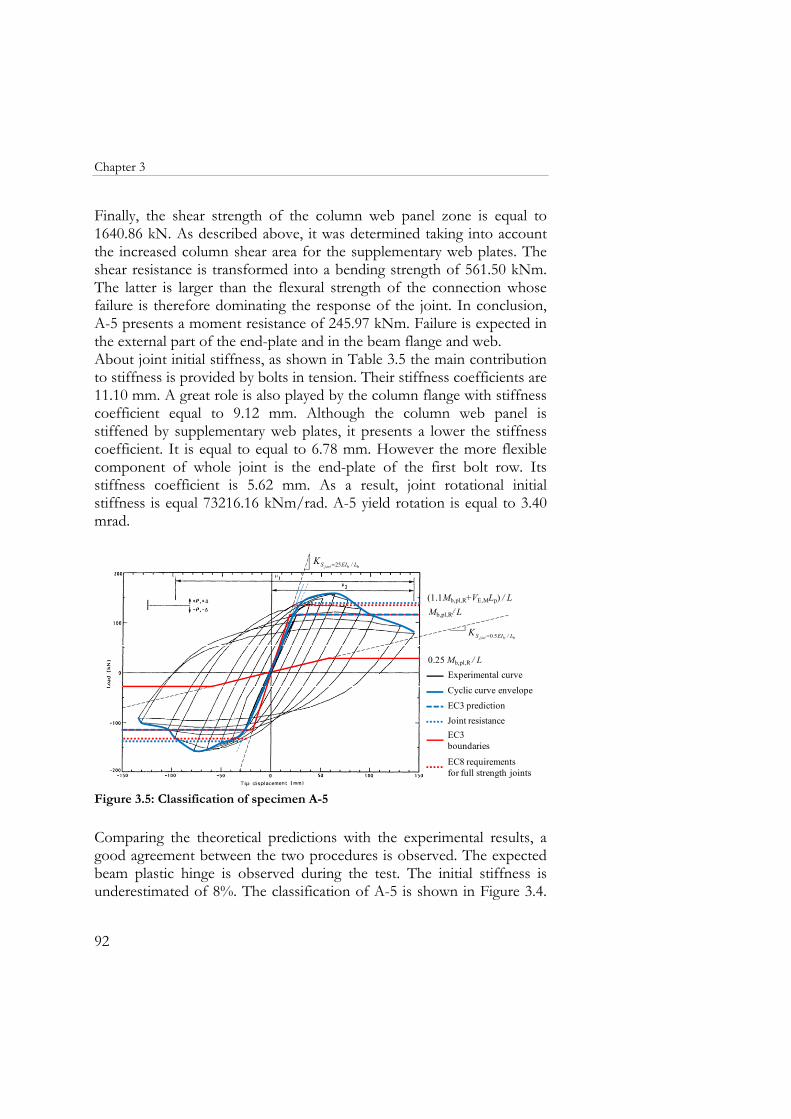
Chapter 3
92
Finally, the shear strength of the column web panel zone is equal to 1640.86 kN. As described above, it was determined taking into account the increased column shear area for the supplementary web plates. The shear resistance is transformed into a bending strength of 561.50 kNm. The latter is larger than the flexural strength of the connection whose failure is therefore dominating the response of the joint. In conclusion, A-5 presents a moment resistance of 245.97 kNm. Failure is expected in the external part of the end-plate and in the beam flange and web. About joint initial stiffness, as shown in Table 3.5 the main contribution to stiffness is provided by bolts in tension. Their stiffness coefficients are 11.10 mm. A great role is also played by the column flange with stiffness coefficient equal to 9.12 mm. Although the column web panel is stiffened by supplementary web plates, it presents a lower the stiffness coefficient. It is equal to equal to 6.78 mm. However the more flexible component of whole joint is the end-plate of the first bolt row. Its stiffness coefficient is 5.62 mm. As a result, joint rotational initial stiffness is equal 73216.16 kNm/rad. A-5 yield rotation is equal to 3.40 mrad.
0.25 Mb,pl,R / L
Mb,pl,R/ L
bb25 L/EIS inij,K =
bb50 L/EI.S inij,K =
(1.1Mb,pl,R+VE,MLp) / L
EC3 boundaries
EC8 requirements for full strength joints
EC3 prediction
Experimental curve
Cyclic curve envelope
Joint resistance
Figure 3.5: Classification of specimen A-5
Comparing the theoretical predictions with the experimental results, a good agreement between the two procedures is observed. The expected beam plastic hinge is observed during the test. The initial stiffness is underestimated of 8%. The classification of A-5 is shown in Figure 3.4.
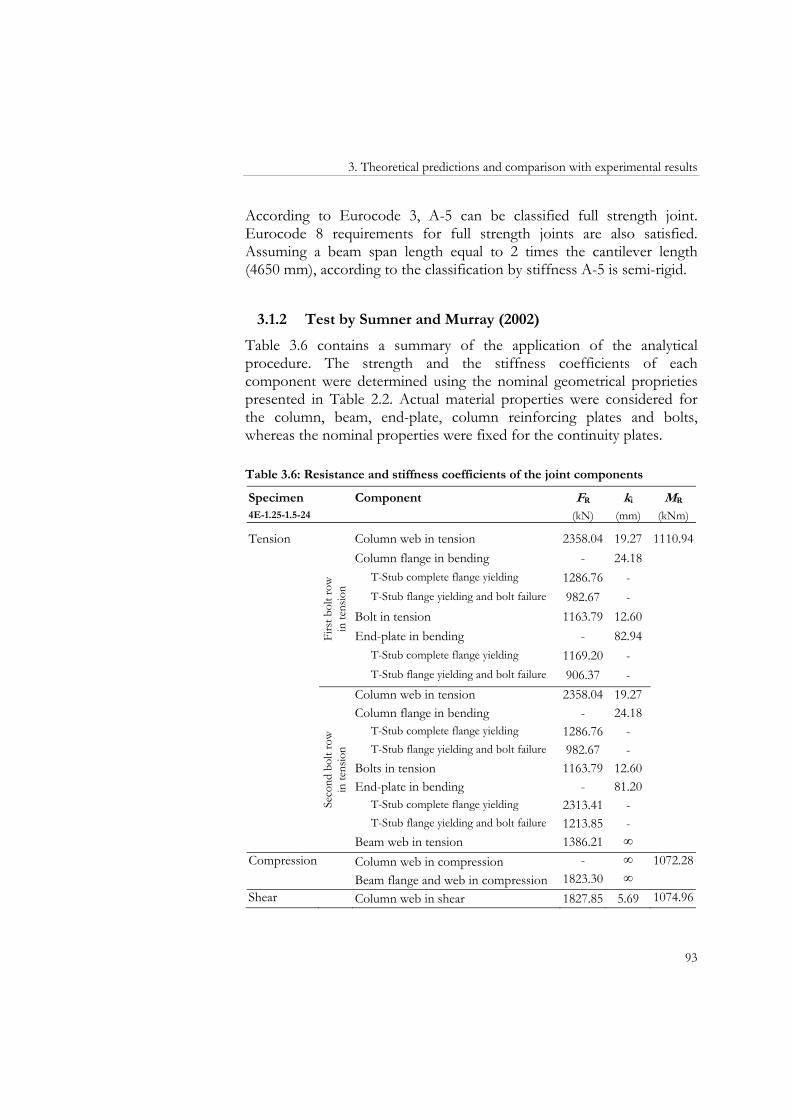
3. Theoretical predictions and comparison with experimental results
93
According to Eurocode 3, A-5 can be classified full strength joint. Eurocode 8 requirements for full strength joints are also satisfied. Assuming a beam span length equal to 2 times the cantilever length (4650 mm), according to the classification by stiffness A-5 is semi-rigid.
3.1.2 Test by Sumner and Murray (2002)
Table 3.6 contains a summary of the application of the analytical procedure. The strength and the stiffness coefficients of each component were determined using the nominal geometrical proprieties presented in Table 2.2. Actual material properties were considered for the column, beam, end-plate, column reinforcing plates and bolts, whereas the nominal properties were fixed for the continuity plates.
Table 3.6: Resistance and stiffness coefficients of the joint components
Specimen Component FR ki MR 4E-1.25-1.5-24 (kN) (mm) (kNm)
Tension
Firs
t bol
t row
in
tens
ion
Column web in tension 2358.04 19.27 1110.94Column flange in bending - 24.18
T-Stub complete flange yielding 1286.76 - T-Stub flange yielding and bolt failure 982.67 -
Bolt in tension 1163.79 12.60 End-plate in bending - 82.94
T-Stub complete flange yielding 1169.20 - T-Stub flange yielding and bolt failure 906.37 -
Seco
nd b
olt r
ow
in te
nsio
n
Column web in tension 2358.04 19.27 Column flange in bending - 24.18
T-Stub complete flange yielding 1286.76 - T-Stub flange yielding and bolt failure 982.67 -
Bolts in tension 1163.79 12.60 End-plate in bending - 81.20
T-Stub complete flange yielding 2313.41 - T-Stub flange yielding and bolt failure 1213.85 -
Beam web in tension 1386.21 ∞ Compression Column web in compression - ∞ 1072.28
Beam flange and web in compression 1823.30 ∞ Shear Column web in shear 1827.85 5.69 1074.96
Chapter 3
94
In detail the yield stresses of 358.53 MPa, 369.56 MPa, 262.69 MPa 290.27 MPa were used respectively for the column, the beam, the end-plate and column web doubler plate. A bolt ultimate stress of 779.11MPa was considered. An expected yield stress of 322.67 MPa was used for continuity plates. The latter consider a material overstrength factor of 1.3 (ANSI/AISC 341-10, 2010). Table 3.6 shows that for the first bolt row in tension the weakest component is the end-plate in bending. The failure mechanism is the flange yielding and the bolt failure of the equivalent T-Stub which represents the component. The corresponding strength is equal to 906.37 kN. The column flange is the weakest component of the second bolt row. It fails also for flange yielding and bolt failure of the corresponding T-Stub. The column flange strength is equal to 982.67 kN. The resisting bending moment due to tension failure of the connection is equal to 1110.94 kNm, which is obtained as the product of the total tension resistance (the sum of the strength of the first and second bolt rows) times the internal lever arm. As far as the compression side is concerned, the weakest component is the beam flange and web, whose strength is equal to 1823.30 kN. The corresponding bending moment strength due to compression failure in the connection is equal to 1072.28 kNm. Therefore, failure of the connection is expected to occur on the compression side. Finally, the shear strength and the bending strength of the column web panel zone are equal to 1827.85 kN and 1074.96 kNm. Being the latter higher than the flexural strength of the connection the last governs the response of the joint. According to the component method the moment resistance of 4E-1.25-1.5-24 is equal to 1072.28 kNm. Failure is expected in the external part of the end-plate and in the beam web and flange. Concerning the theoretical initial stiffness, Table 3.6 shows that the main contribution to joint stiffness is provided by the connection. The end-plate is the more rigid component. The stiffness coefficient of the component belonging to the first bolt row is equal to 82.94 mm. The same component of the second bolt row has the stiffness coefficient of 81.20 mm. The more flexible components of the connection are the bolts. Their stiffness coefficients are equal to 12.60 mm. However the column web in shear is the more flexible component of the whole joint. Its stiffness coefficient is 5.69 mm. As a result the initial rotational stiffness is equal to 270241.99 kNm/rad. Finally the yield rotation is equal to 3.97 mrad.
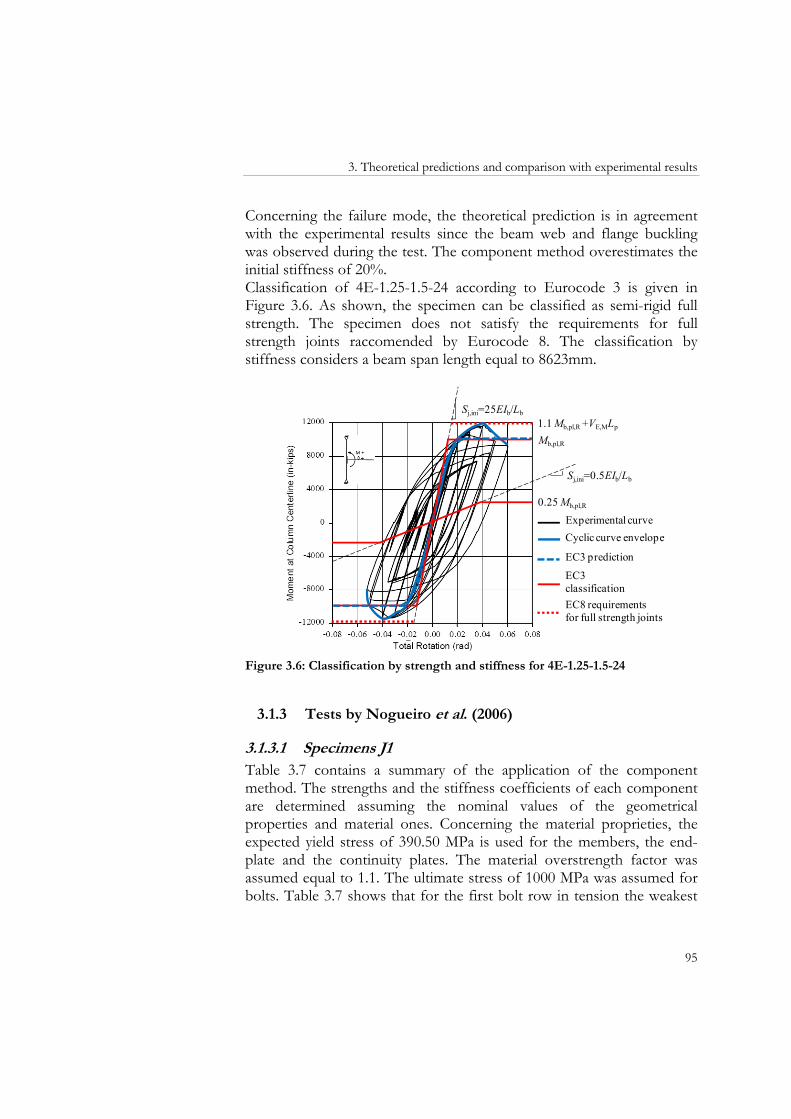
3. Theoretical predictions and comparison with experimental results
95
Concerning the failure mode, the theoretical prediction is in agreement with the experimental results since the beam web and flange buckling was observed during the test. The component method overestimates the initial stiffness of 20%. Classification of 4E-1.25-1.5-24 according to Eurocode 3 is given in Figure 3.6. As shown, the specimen can be classified as semi-rigid full strength. The specimen does not satisfy the requirements for full strength joints raccomended by Eurocode 8. The classification by stiffness considers a beam span length equal to 8623mm.
Mb,pl,R
0.25 Mb,pl,R
Sj,ini=25EIb/Lb
Sj,ini=0.5EIb/Lb
1.1 Mb,pl,R +VE,MLp
EC3 classificationEC8 requirements for full strength joints
EC3 prediction
Experimental curveCyclic curve envelope
Figure 3.6: Classification by strength and stiffness for 4E-1.25-1.5-24
3.1.3 Tests by Nogueiro et al. (2006)
3.1.3.1 Specimens J1 Table 3.7 contains a summary of the application of the component method. The strengths and the stiffness coefficients of each component are determined assuming the nominal values of the geometrical properties and material ones. Concerning the material proprieties, the expected yield stress of 390.50 MPa is used for the members, the end-plate and the continuity plates. The material overstrength factor was assumed equal to 1.1. The ultimate stress of 1000 MPa was assumed for bolts. Table 3.7 shows that for the first bolt row in tension the weakest
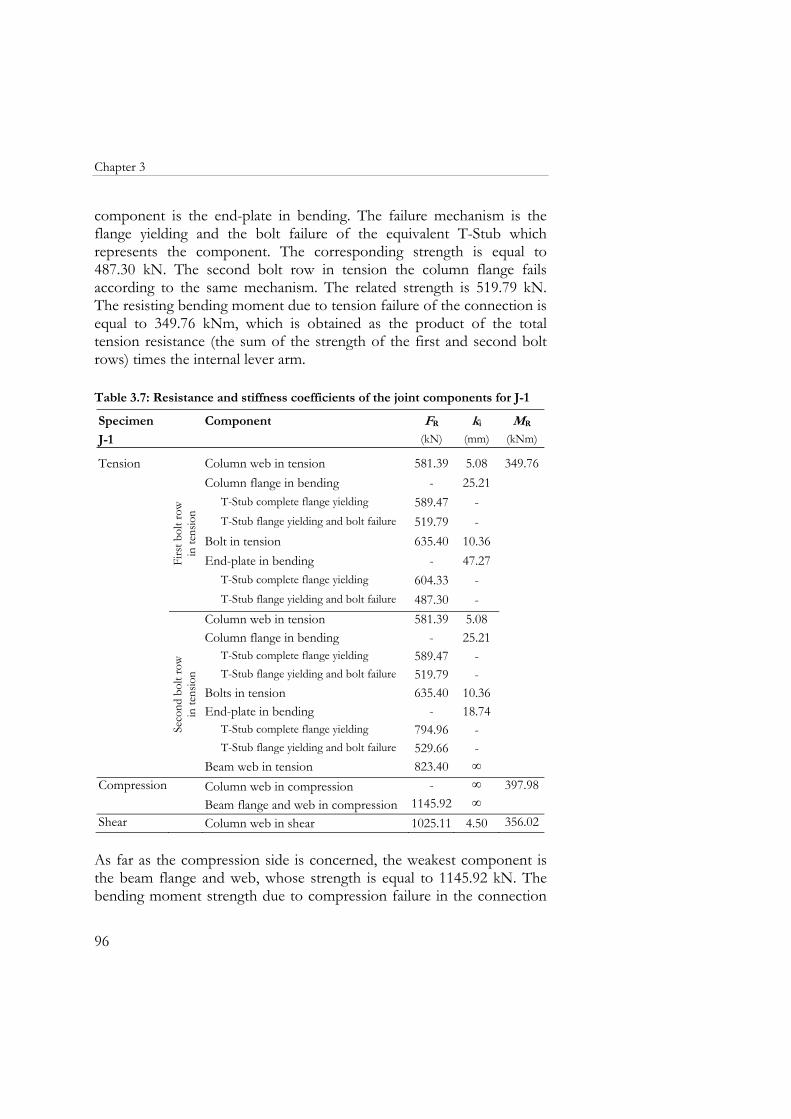
Chapter 3
96
component is the end-plate in bending. The failure mechanism is the flange yielding and the bolt failure of the equivalent T-Stub which represents the component. The corresponding strength is equal to 487.30 kN. The second bolt row in tension the column flange fails according to the same mechanism. The related strength is 519.79 kN. The resisting bending moment due to tension failure of the connection is equal to 349.76 kNm, which is obtained as the product of the total tension resistance (the sum of the strength of the first and second bolt rows) times the internal lever arm. Table 3.7: Resistance and stiffness coefficients of the joint components for J-1
Specimen Component FR ki MR J-1 (kN) (mm) (kNm)
Tension
Firs
t bol
t row
in
tens
ion
Column web in tension 581.39 5.08 349.76Column flange in bending - 25.21
T-Stub complete flange yielding 589.47 -T-Stub flange yielding and bolt failure 519.79 -
Bolt in tension 635.40 10.36End-plate in bending - 47.27
T-Stub complete flange yielding 604.33 -T-Stub flange yielding and bolt failure 487.30 -
Seco
nd b
olt r
ow
in te
nsio
n
Column web in tension 581.39 5.08Column flange in bending - 25.21
T-Stub complete flange yielding 589.47 -T-Stub flange yielding and bolt failure 519.79 -
Bolts in tension 635.40 10.36End-plate in bending - 18.74
T-Stub complete flange yielding 794.96 -T-Stub flange yielding and bolt failure 529.66 -
Beam web in tension 823.40 ∞Compression Column web in compression - ∞ 397.98
Beam flange and web in compression 1145.92 ∞Shear Column web in shear 1025.11 4.50 356.02
As far as the compression side is concerned, the weakest component is the beam flange and web, whose strength is equal to 1145.92 kN. The bending moment strength due to compression failure in the connection
3. Theoretical predictions and comparison with experimental results
97
is equal to 397.98 kNm. As a consequence, failure of the connection is expected to occur on the tension side. Finally, the shear strength of the column web panel zone is equal to 1025.11 kN. The shear resistance is transformed into a bending strength of 356.02 kNm. The latter is greater than the flexural strength of the connection therefore the connection governs the response of the joint. According to the component method the effective tensile resistances associated to the first and the second bolt row are 487.30 kN and 519.79 kN respectively. Considering that the distances of each bolt row from the centre of compression are approximately equal to 394 mm and 301 mm respectively, the bending moment resistance of J-1 is equal to 348.25 kNm. Failure is expected in the end-plate and in the column flange for the mixed mechanism of the T-Stub. Referring to the rotational stiffness, Table 3.7 shows that the main contribution to stiffness is provided by the connection. The column flange, with the stiffness coefficient equal to 25.21 mm, is the more rigid component. The end-plate belonging to the first bolt row is the more rigid component. Its stiffness coefficient is 47.27 mm. The column web in shear is the more flexible component of the joint with the stiffness coefficient of 4.50 mm. As a result J-1 initial rotational stiffness is equal to 61785.12 kNm/rad. Therefore, the yield rotation is equal to 5.60 mrad. The theoretical predictions cannot be compared with experimental results since the expected plastic mechanism is not the same observed during the experimental test. The difference is due to an approximate material modelling not based to actual material properties but on expected yield strength. This approximation does not permit to identify the real hierarchy of the components to yielding.
3.1.3.2 Specimens J3 A summary of the application of the analytical procedure is given in Table 3.8. The strengths and the stiffness coefficients of each component were determined assuming the nominal values of the geometrical properties and material ones. Concerning the material proprieties, the expected yield stress of 390.50 MPa (1.1 × 355 MPa) was used for the members, end-plate and continuity plates. The ultimate stress of 1000 MPa was assumed for bolts. Table 3.8 shows that for the two bolt rows in tension the weakest component is the end-plate in
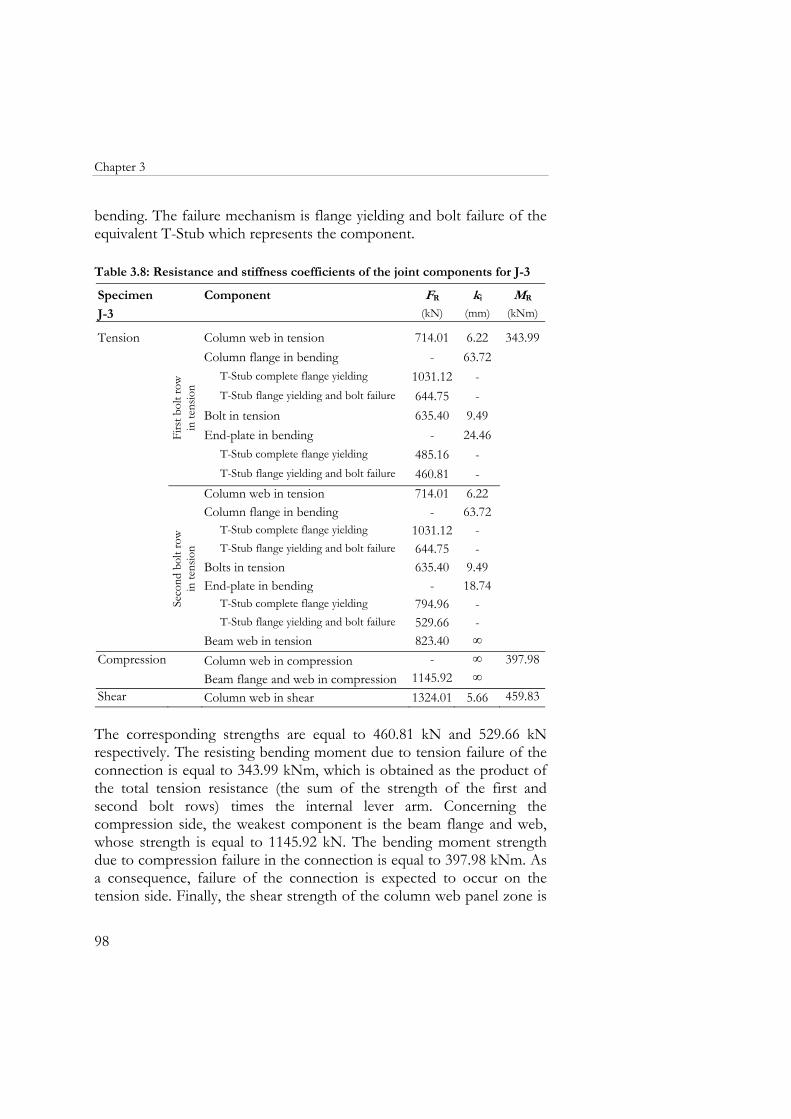
Chapter 3
98
bending. The failure mechanism is flange yielding and bolt failure of the equivalent T-Stub which represents the component. Table 3.8: Resistance and stiffness coefficients of the joint components for J-3
Specimen Component FR ki MR J-3 (kN) (mm) (kNm)
Tension
Firs
t bol
t row
in
tens
ion
Column web in tension 714.01 6.22 343.99Column flange in bending - 63.72
T-Stub complete flange yielding 1031.12 -T-Stub flange yielding and bolt failure 644.75 -
Bolt in tension 635.40 9.49End-plate in bending - 24.46
T-Stub complete flange yielding 485.16 -T-Stub flange yielding and bolt failure 460.81 -
Seco
nd b
olt r
ow
in te
nsio
n
Column web in tension 714.01 6.22Column flange in bending - 63.72
T-Stub complete flange yielding 1031.12 -T-Stub flange yielding and bolt failure 644.75 -
Bolts in tension 635.40 9.49End-plate in bending - 18.74
T-Stub complete flange yielding 794.96 -T-Stub flange yielding and bolt failure 529.66 -
Beam web in tension 823.40 ∞Compression Column web in compression - ∞ 397.98
Beam flange and web in compression 1145.92 ∞Shear Column web in shear 1324.01 5.66 459.83 The corresponding strengths are equal to 460.81 kN and 529.66 kN respectively. The resisting bending moment due to tension failure of the connection is equal to 343.99 kNm, which is obtained as the product of the total tension resistance (the sum of the strength of the first and second bolt rows) times the internal lever arm. Concerning the compression side, the weakest component is the beam flange and web, whose strength is equal to 1145.92 kN. The bending moment strength due to compression failure in the connection is equal to 397.98 kNm. As a consequence, failure of the connection is expected to occur on the tension side. Finally, the shear strength of the column web panel zone is
3. Theoretical predictions and comparison with experimental results
99
equal to 1324.01 kN. The shear resistance is transformed into a bending strength of 459.83 kNm. The flexural strength of the connection is smaller than that of the column web panel, therefore the response of the joint is governed by the connection.The effective tensile resistances associated to the first and the second bolt rows are 460.81 kN and 529.66 kN respectively. Considering that the distances of each bolt row from the centre of compression are approximately equal to 394 mm and 301 mm respectively, the bending moment resistance of J-3 is 340.80 kNm. Failure is expected in the end-plate for complete flange yielding and for flange yielding and bolt failure of the T-Stubs representative of the component of each bolt row. Table 3.8 shows that the main contribution to stiffness is provided by the connection. The column flange, with the stiffness coefficient equal to 63.72 mm, is the more rigid component. The stiffness coefficient of the end-plate component belonging to the first bolt row is 24.46 mm. The column web in shear is the more flexible component of the joint with the stiffness coefficient of 5.66 mm. As a result J-1 initial rotational stiffness, j,iniS , is equal to 73619.34 kNm/rad. Finally the yield rotation is equal to 4.60 mrad. As in case of J-1 specimens, the theoretical predictions cannot be compared with experimental results since the expected plastic mechanism is not the same observed during the experimental test. Also in this case the approximate material modelling does not permit to identify the real hierarchy of the components to yielding.
3.1.4 Tests by Shi et al. (2007 a)
3.1.4.1 Specimen EPC-1 Table 3.9 contains a summary of the application of the mechanical approach. The strength and the stiffness coefficients were determined assuming the nominal values of the geometrical properties of the beam, column, end-plate and bolts. Actual values of the material properties were considered, instead. In particular, the yield stress of 363.37 MPa was considered for the column flange and the end-plate, while 391 MPa for the column web, the beam and the continuity plates. The ultimate stress of 1160 MPa was used for the bolts. Table 3.9 shows that for both the first and the second bolt row the weakest component is the end-plate in bending. The failure mechanism is the flange yielding and the bolt
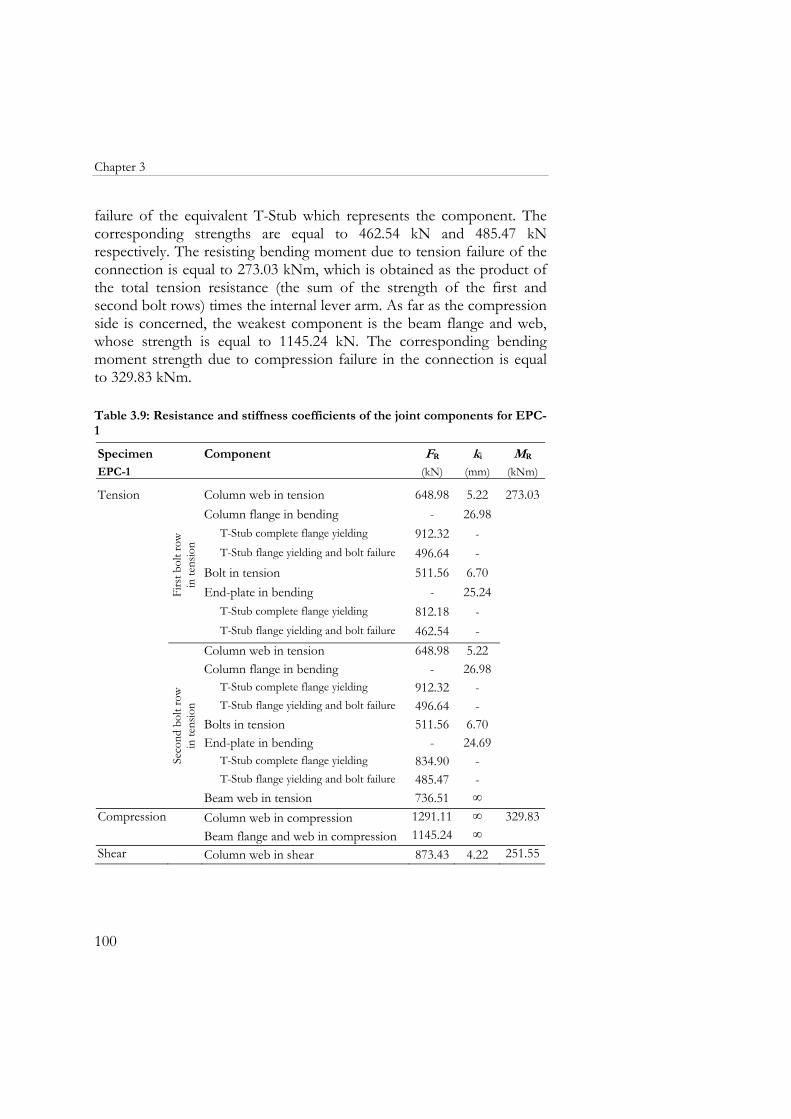
Chapter 3
100
failure of the equivalent T-Stub which represents the component. The corresponding strengths are equal to 462.54 kN and 485.47 kN respectively. The resisting bending moment due to tension failure of the connection is equal to 273.03 kNm, which is obtained as the product of the total tension resistance (the sum of the strength of the first and second bolt rows) times the internal lever arm. As far as the compression side is concerned, the weakest component is the beam flange and web, whose strength is equal to 1145.24 kN. The corresponding bending moment strength due to compression failure in the connection is equal to 329.83 kNm. Table 3.9: Resistance and stiffness coefficients of the joint components for EPC-1
Specimen Component FR ki MR EPC-1 (kN) (mm) (kNm)
Tension
Firs
t bol
t row
in
tens
ion
Column web in tension 648.98 5.22 273.03Column flange in bending - 26.98
T-Stub complete flange yielding 912.32 -T-Stub flange yielding and bolt failure 496.64 -
Bolt in tension 511.56 6.70End-plate in bending - 25.24
T-Stub complete flange yielding 812.18 -T-Stub flange yielding and bolt failure 462.54 -
Seco
nd b
olt r
ow
in te
nsio
n
Column web in tension 648.98 5.22Column flange in bending - 26.98
T-Stub complete flange yielding 912.32 -T-Stub flange yielding and bolt failure 496.64 -
Bolts in tension 511.56 6.70End-plate in bending - 24.69
T-Stub complete flange yielding 834.90 -T-Stub flange yielding and bolt failure 485.47 -
Beam web in tension 736.51 ∞Compression Column web in compression 1291.11 ∞ 329.83
Beam flange and web in compression 1145.24 ∞Shear Column web in shear 873.43 4.22 251.55
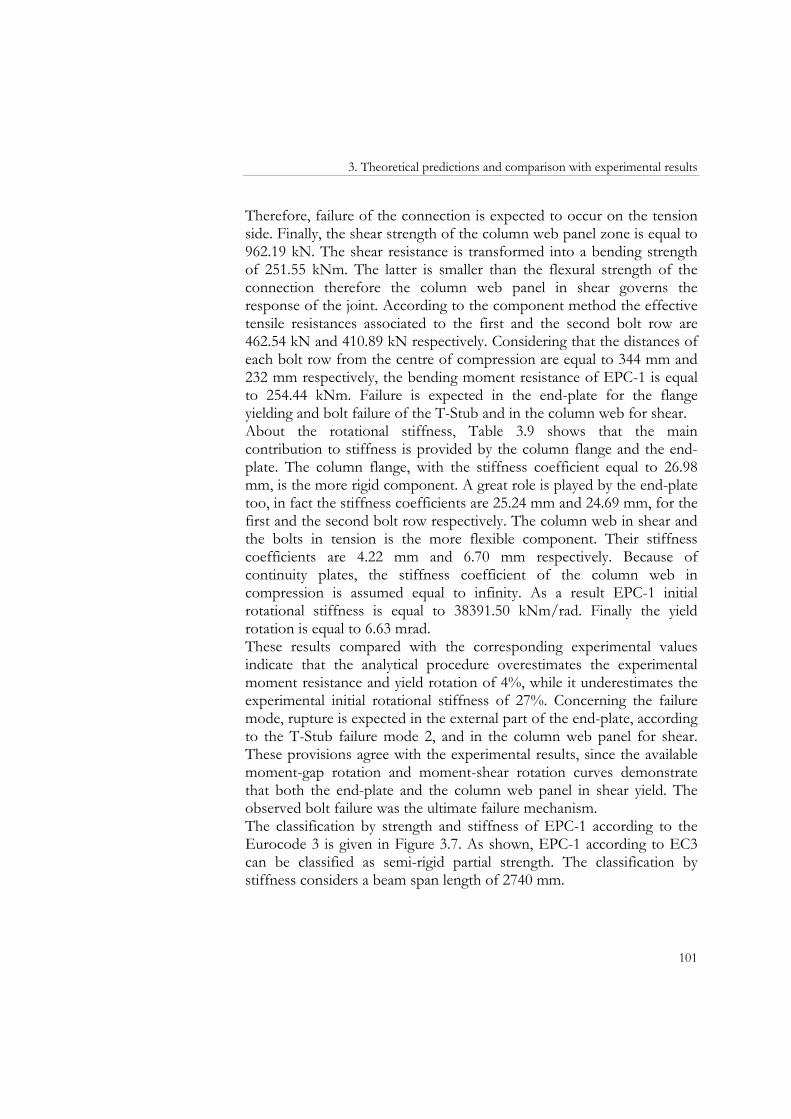
3. Theoretical predictions and comparison with experimental results
101
Therefore, failure of the connection is expected to occur on the tension side. Finally, the shear strength of the column web panel zone is equal to 962.19 kN. The shear resistance is transformed into a bending strength of 251.55 kNm. The latter is smaller than the flexural strength of the connection therefore the column web panel in shear governs the response of the joint. According to the component method the effective tensile resistances associated to the first and the second bolt row are 462.54 kN and 410.89 kN respectively. Considering that the distances of each bolt row from the centre of compression are equal to 344 mm and 232 mm respectively, the bending moment resistance of EPC-1 is equal to 254.44 kNm. Failure is expected in the end-plate for the flange yielding and bolt failure of the T-Stub and in the column web for shear. About the rotational stiffness, Table 3.9 shows that the main contribution to stiffness is provided by the column flange and the end-plate. The column flange, with the stiffness coefficient equal to 26.98 mm, is the more rigid component. A great role is played by the end-plate too, in fact the stiffness coefficients are 25.24 mm and 24.69 mm, for the first and the second bolt row respectively. The column web in shear and the bolts in tension is the more flexible component. Their stiffness coefficients are 4.22 mm and 6.70 mm respectively. Because of continuity plates, the stiffness coefficient of the column web in compression is assumed equal to infinity. As a result EPC-1 initial rotational stiffness is equal to 38391.50 kNm/rad. Finally the yield rotation is equal to 6.63 mrad. These results compared with the corresponding experimental values indicate that the analytical procedure overestimates the experimental moment resistance and yield rotation of 4%, while it underestimates the experimental initial rotational stiffness of 27%. Concerning the failure mode, rupture is expected in the external part of the end-plate, according to the T-Stub failure mode 2, and in the column web panel for shear. These provisions agree with the experimental results, since the available moment-gap rotation and moment-shear rotation curves demonstrate that both the end-plate and the column web panel in shear yield. The observed bolt failure was the ultimate failure mechanism. The classification by strength and stiffness of EPC-1 according to the Eurocode 3 is given in Figure 3.7. As shown, EPC-1 according to EC3 can be classified as semi-rigid partial strength. The classification by stiffness considers a beam span length of 2740 mm.
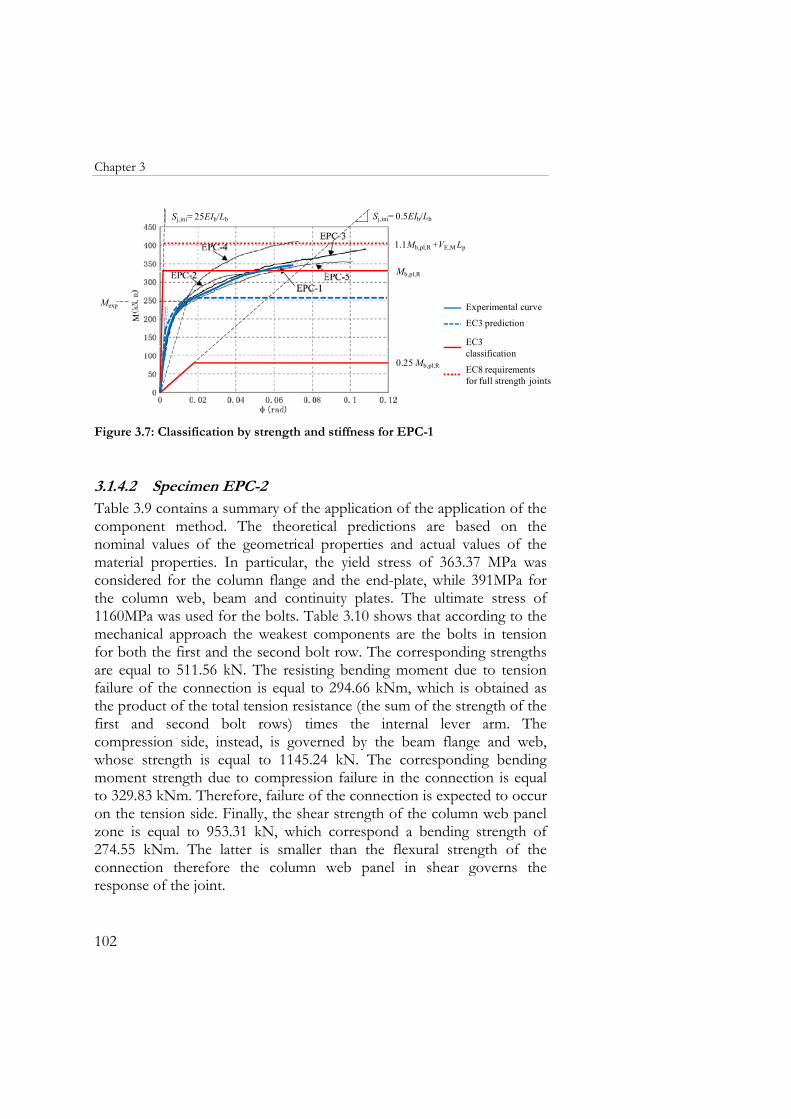
Chapter 3
102
EC3 classification
EC8 requirements for full strength joints
Experimental curve
EC3 prediction
Mb,pl,R
0.25 Mb,pl,R
1.1Mb,pl,R +VE,M Lp
Sj,ini= 0.5EIb/LbSj,ini= 25EIb/Lb
Mexp
Figure 3.7: Classification by strength and stiffness for EPC-1
3.1.4.2 Specimen EPC-2 Table 3.9 contains a summary of the application of the application of the component method. The theoretical predictions are based on the nominal values of the geometrical properties and actual values of the material properties. In particular, the yield stress of 363.37 MPa was considered for the column flange and the end-plate, while 391MPa for the column web, beam and continuity plates. The ultimate stress of 1160MPa was used for the bolts. Table 3.10 shows that according to the mechanical approach the weakest components are the bolts in tension for both the first and the second bolt row. The corresponding strengths are equal to 511.56 kN. The resisting bending moment due to tension failure of the connection is equal to 294.66 kNm, which is obtained as the product of the total tension resistance (the sum of the strength of the first and second bolt rows) times the internal lever arm. The compression side, instead, is governed by the beam flange and web, whose strength is equal to 1145.24 kN. The corresponding bending moment strength due to compression failure in the connection is equal to 329.83 kNm. Therefore, failure of the connection is expected to occur on the tension side. Finally, the shear strength of the column web panel zone is equal to 953.31 kN, which correspond a bending strength of 274.55 kNm. The latter is smaller than the flexural strength of the connection therefore the column web panel in shear governs the response of the joint.
3. Theoretical predictions and comparison with experimental results
103
Table 3.10: Resistance and stiffness coefficients of the joint components for EPC-2
Specimen Component FR ki MR EPC-2 (kN) (mm) (kNm)
Tension
Firs
t bol
t row
in
tens
ion
Column web in tension 659.47 5.22 294.66Column flange in bending - 52.69
T-Stub complete flange yielding 1425.50 - T-Stub flange yielding and bolt failure 623.77 -
Bolt in tension 511.56 5.72 End-plate in bending - 49.29
T-Stub complete flange yielding 1269.03 - T-Stub flange yielding and bolt failure 568.71 -
Seco
nd b
olt r
ow
in te
nsio
n
Column web in tension 659.47 5.22 Column flange in bending - 52.69
T-Stub complete flange yielding 1425.50 - T-Stub flange yielding and bolt failure 623.77 -
Bolts in tension 511.56 5.72 End-plate in bending - 48.22
T-Stub complete flange yielding 1304.53 - T-Stub flange yielding and bolt failure 606.31 -
Beam web in tension 736.51 ∞ Compression Column web in compression 1342.26 ∞ 329.83
Beam flange and web in compression 1145.24 ∞ Shear Column web in shear 953.31 4.43 274.55 The effective tensile resistances are consequently equal to 511.56 kN and 441.75 kN. Considering that the distances of each bolt row from the centre of compression are equal to 344mm and 232mm respectively, the bending moment resistance of EPC-2 is equal to 278.46 kNm. According to the component method, the bolt rupture as well as the column web for shear one are expected. Concerning the stiffness coefficients, Table 3.10 shows that the more flexible components are the column web panel in shear and the bolts in tension with the stiffness coefficients equal to 4.43 mm and 5.89 respectively. The column flange and the end plate in bending are the more rigid components. Because of the continuity plates, the stiffness coefficients corresponding to the column web in compression is
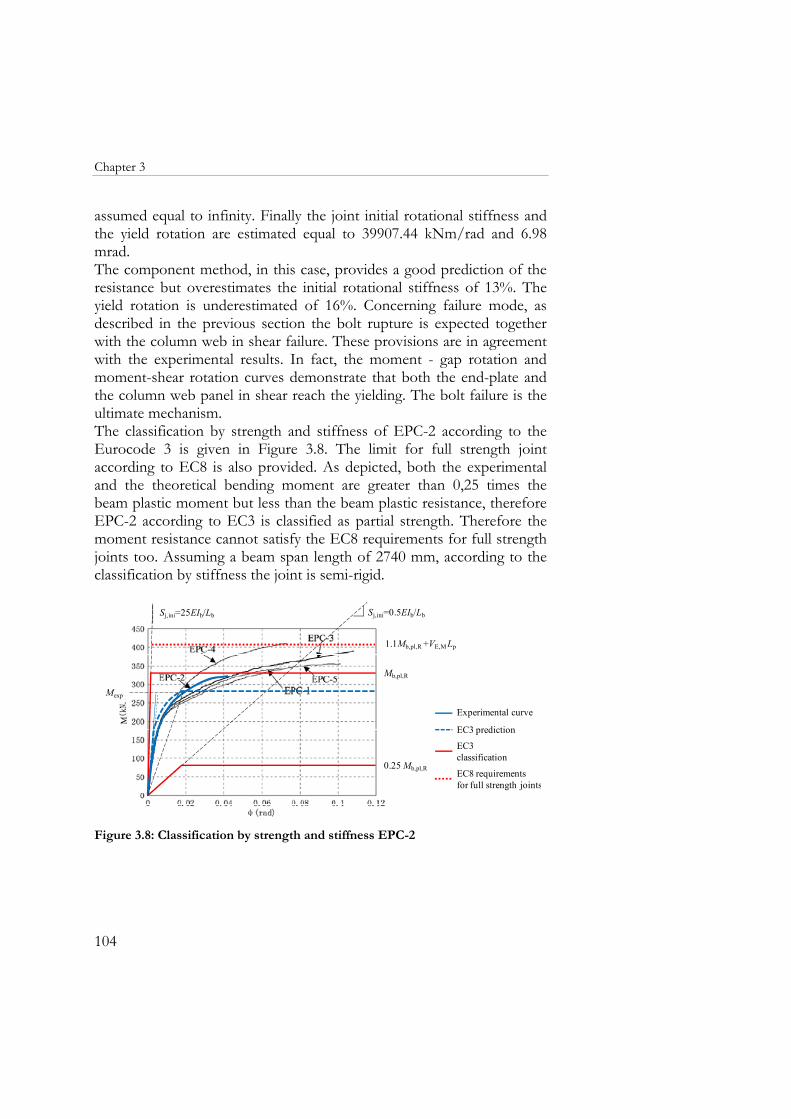
Chapter 3
104
assumed equal to infinity. Finally the joint initial rotational stiffness and the yield rotation are estimated equal to 39907.44 kNm/rad and 6.98 mrad. The component method, in this case, provides a good prediction of the resistance but overestimates the initial rotational stiffness of 13%. The yield rotation is underestimated of 16%. Concerning failure mode, as described in the previous section the bolt rupture is expected together with the column web in shear failure. These provisions are in agreement with the experimental results. In fact, the moment - gap rotation and moment-shear rotation curves demonstrate that both the end-plate and the column web panel in shear reach the yielding. The bolt failure is the ultimate mechanism. The classification by strength and stiffness of EPC-2 according to the Eurocode 3 is given in Figure 3.8. The limit for full strength joint according to EC8 is also provided. As depicted, both the experimental and the theoretical bending moment are greater than 0,25 times the beam plastic moment but less than the beam plastic resistance, therefore EPC-2 according to EC3 is classified as partial strength. Therefore the moment resistance cannot satisfy the EC8 requirements for full strength joints too. Assuming a beam span length of 2740 mm, according to the classification by stiffness the joint is semi-rigid.
EC3 classification
EC8 requirements for full strength joints
Experimental curve
EC3 prediction
Mb,pl,R
0.25 Mb,pl,R
1.1Mb,pl,R +VE,M Lp
Sj,ini=0.5EIb/LbSj,ini=25EIb/Lb
Mexp
Figure 3.8: Classification by strength and stiffness EPC-2
3. Theoretical predictions and comparison with experimental results
105
3.1.4.3 Specimen EPC-3 The details of the analytical procedure in Table 3.11 are shown. The properties of each component were determined assuming nominal values for geometrical properties of the beam, column, end-plate and bolts and actual values of the material properties. In particular the yield stress of 363.37 MPa was taken into account for the column flange and the end-plate, while 391MPa for the column web, beam and continuity plates. The ultimate stress of 1188 MPa was used for the bolts. Table 3.11 displays that the component which governs the tension resistance of the two bolt rows is the end-plate with strengths of 592.75 kN and 614.18 kN, due to the flange yielding and bolt failure of the T-Subs representing the components. The resisting bending moment due to tension failure of the connection is equal to 347.60 kNm, which is obtained as the product of the total tension resistance (the sum of the strength of the first and second bolt rows) times the internal lever arm. The compression side, instead, is governed by the beam flange and web, whose strength is equal to 1145.24 kN. The corresponding bending moment strength due to compression failure in the connection is equal to 329.83 kNm. Therefore, failure of the connection is expected to occur on the compression side. Finally, the shear strength of the column web panel zone is equal to 873.43 kN, which correspond a bending strength of 251.55 kNm. The latter is smaller than the flexural strength of the connection therefore the column web panel in shear governs the response of the joint. According to the component method the effective tensile resistances associated to the first and the second bolt row are 592.75 kN and 280.70 kN respectively. Since the distances of each bolt row from the centre of compression are equal to 344mm and 232mm respectively, the bending moment resistance of EPC-3 is equal to 269.02 kNm. According to the component method, the end-plate failure as well as the column web for shear one are expected. Concerning the stiffness coefficients, Table 3.11 shows that the more flexible components are the column web panel in shear and the bolts in tension with the stiffness coefficients equal to 4.22 mm and 9.26 respectively. The column flange and the end plate in bending are the more rigid components. Combining the axial stiffness the joint initial rotational stiffness is equal to 40291.55 kNm/rad. Finally the yield rotation is 6.68 mrad.
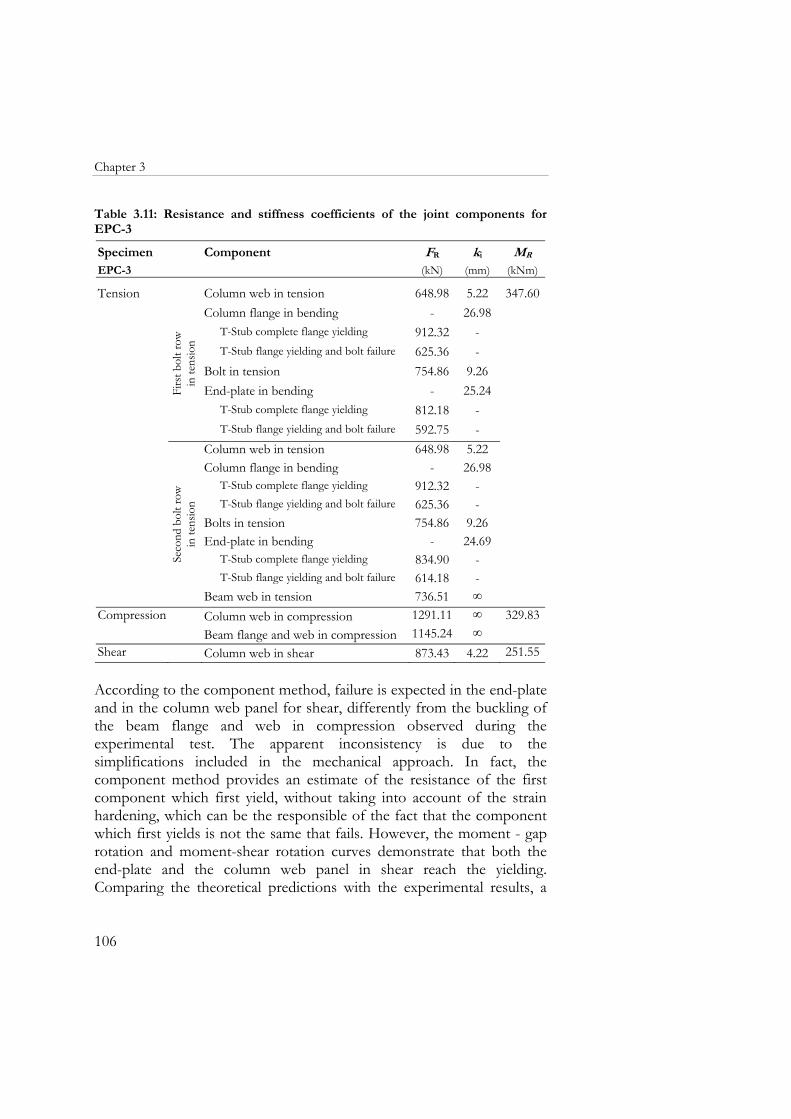
Chapter 3
106
Table 3.11: Resistance and stiffness coefficients of the joint components for EPC-3
Specimen Component FR ki MR EPC-3 (kN) (mm) (kNm)
Tension
Firs
t bol
t row
in
tens
ion
Column web in tension 648.98 5.22 347.60Column flange in bending - 26.98
T-Stub complete flange yielding 912.32 -T-Stub flange yielding and bolt failure 625.36 -
Bolt in tension 754.86 9.26End-plate in bending - 25.24
T-Stub complete flange yielding 812.18 -T-Stub flange yielding and bolt failure 592.75 -
Seco
nd b
olt r
ow
in te
nsio
n
Column web in tension 648.98 5.22Column flange in bending - 26.98
T-Stub complete flange yielding 912.32 -T-Stub flange yielding and bolt failure 625.36 -
Bolts in tension 754.86 9.26End-plate in bending - 24.69
T-Stub complete flange yielding 834.90 -T-Stub flange yielding and bolt failure 614.18 -
Beam web in tension 736.51 ∞Compression Column web in compression 1291.11 ∞ 329.83
Beam flange and web in compression 1145.24 ∞Shear Column web in shear 873.43 4.22 251.55 According to the component method, failure is expected in the end-plate and in the column web panel for shear, differently from the buckling of the beam flange and web in compression observed during the experimental test. The apparent inconsistency is due to the simplifications included in the mechanical approach. In fact, the component method provides an estimate of the resistance of the first component which first yield, without taking into account of the strain hardening, which can be the responsible of the fact that the component which first yields is not the same that fails. However, the moment - gap rotation and moment-shear rotation curves demonstrate that both the end-plate and the column web panel in shear reach the yielding. Comparing the theoretical predictions with the experimental results, a
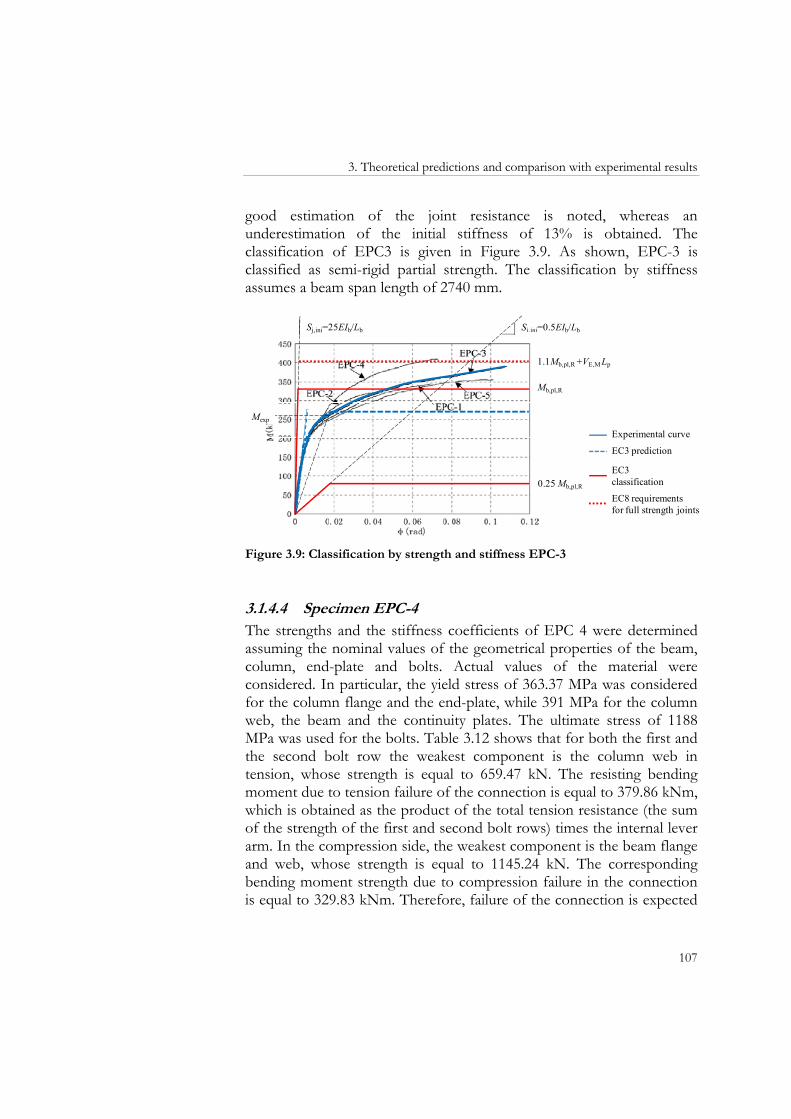
3. Theoretical predictions and comparison with experimental results
107
good estimation of the joint resistance is noted, whereas an underestimation of the initial stiffness of 13% is obtained. The classification of EPC3 is given in Figure 3.9. As shown, EPC-3 is classified as semi-rigid partial strength. The classification by stiffness assumes a beam span length of 2740 mm.
EC3 classification
EC8 requirements for full strength joints
Experimental curve
EC3 prediction
Sj,ini=0.5EIb/Lb
Mb,pl,R
0.25 Mb,pl,R
Sj,ini=25EIb/Lb
1.1Mb,pl,R +VE,M Lp
Mexp
Figure 3.9: Classification by strength and stiffness EPC-3
3.1.4.4 Specimen EPC-4 The strengths and the stiffness coefficients of EPC 4 were determined assuming the nominal values of the geometrical properties of the beam, column, end-plate and bolts. Actual values of the material were considered. In particular, the yield stress of 363.37 MPa was considered for the column flange and the end-plate, while 391 MPa for the column web, the beam and the continuity plates. The ultimate stress of 1188 MPa was used for the bolts. Table 3.12 shows that for both the first and the second bolt row the weakest component is the column web in tension, whose strength is equal to 659.47 kN. The resisting bending moment due to tension failure of the connection is equal to 379.86 kNm, which is obtained as the product of the total tension resistance (the sum of the strength of the first and second bolt rows) times the internal lever arm. In the compression side, the weakest component is the beam flange and web, whose strength is equal to 1145.24 kN. The corresponding bending moment strength due to compression failure in the connection is equal to 329.83 kNm. Therefore, failure of the connection is expected
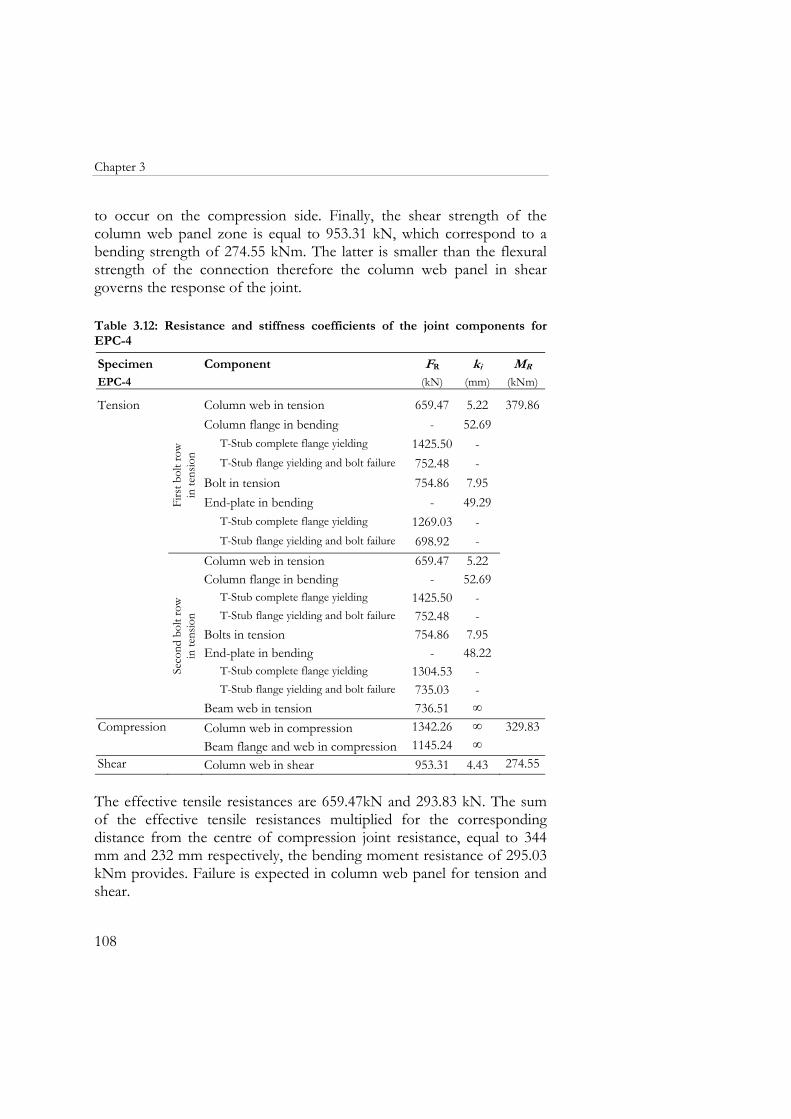
Chapter 3
108
to occur on the compression side. Finally, the shear strength of the column web panel zone is equal to 953.31 kN, which correspond to a bending strength of 274.55 kNm. The latter is smaller than the flexural strength of the connection therefore the column web panel in shear governs the response of the joint. Table 3.12: Resistance and stiffness coefficients of the joint components for EPC-4
Specimen Component FR ki MR EPC-4 (kN) (mm) (kNm)
Tension
Firs
t bol
t row
in
tens
ion
Column web in tension 659.47 5.22 379.86Column flange in bending - 52.69
T-Stub complete flange yielding 1425.50 -T-Stub flange yielding and bolt failure 752.48 -
Bolt in tension 754.86 7.95End-plate in bending - 49.29
T-Stub complete flange yielding 1269.03 -T-Stub flange yielding and bolt failure 698.92 -
Seco
nd b
olt r
ow
in te
nsio
n
Column web in tension 659.47 5.22Column flange in bending - 52.69
T-Stub complete flange yielding 1425.50 -T-Stub flange yielding and bolt failure 752.48 -
Bolts in tension 754.86 7.95End-plate in bending - 48.22
T-Stub complete flange yielding 1304.53 -T-Stub flange yielding and bolt failure 735.03 -
Beam web in tension 736.51 ∞Compression Column web in compression 1342.26 ∞ 329.83
Beam flange and web in compression 1145.24 ∞Shear Column web in shear 953.31 4.43 274.55 The effective tensile resistances are 659.47kN and 293.83 kN. The sum of the effective tensile resistances multiplied for the corresponding distance from the centre of compression joint resistance, equal to 344 mm and 232 mm respectively, the bending moment resistance of 295.03 kNm provides. Failure is expected in column web panel for tension and shear.
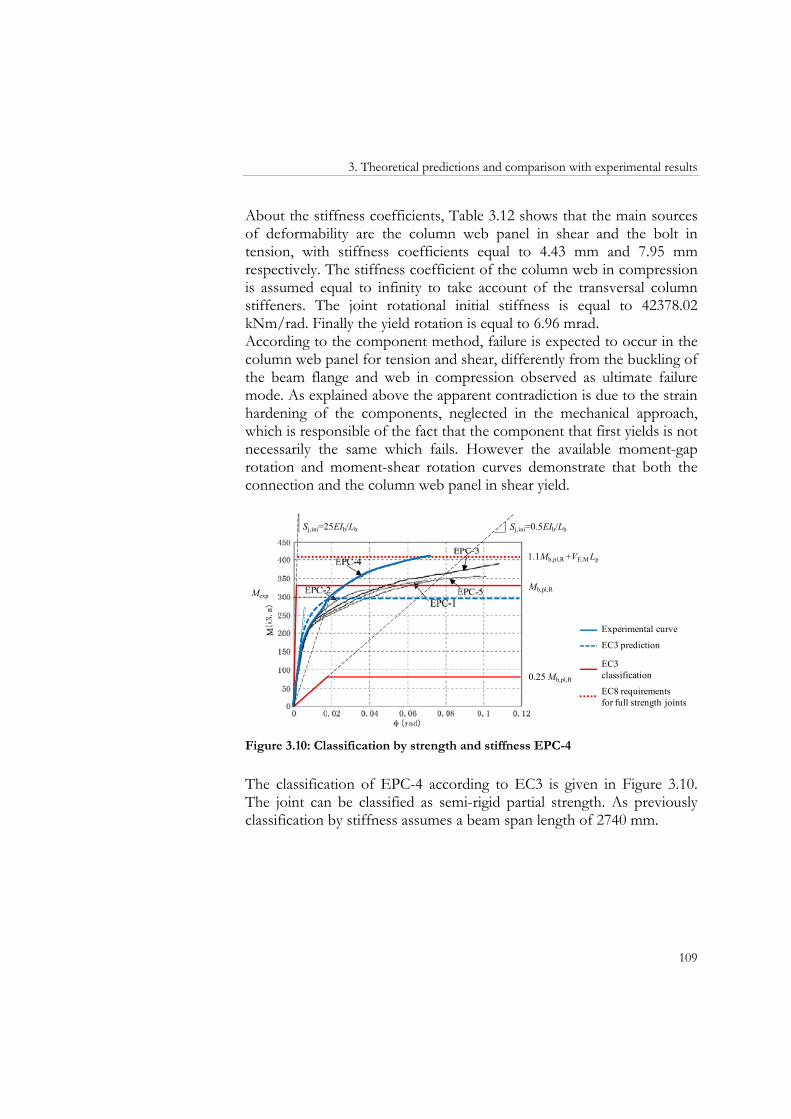
3. Theoretical predictions and comparison with experimental results
109
About the stiffness coefficients, Table 3.12 shows that the main sources of deformability are the column web panel in shear and the bolt in tension, with stiffness coefficients equal to 4.43 mm and 7.95 mm respectively. The stiffness coefficient of the column web in compression is assumed equal to infinity to take account of the transversal column stiffeners. The joint rotational initial stiffness is equal to 42378.02 kNm/rad. Finally the yield rotation is equal to 6.96 mrad. According to the component method, failure is expected to occur in the column web panel for tension and shear, differently from the buckling of the beam flange and web in compression observed as ultimate failure mode. As explained above the apparent contradiction is due to the strain hardening of the components, neglected in the mechanical approach, which is responsible of the fact that the component that first yields is not necessarily the same which fails. However the available moment-gap rotation and moment-shear rotation curves demonstrate that both the connection and the column web panel in shear yield.
Mb,pl,R
0.25 Mb,pl,R
EC3 classification
EC8 requirements for full strength joints
Experimental curve
EC3 prediction
Sj,ini=0.5EIb/LbSj,ini=25EIb/Lb
1.1Mb,pl,R +VE,M Lp
Mexp
Figure 3.10: Classification by strength and stiffness EPC-4
The classification of EPC-4 according to EC3 is given in Figure 3.10. The joint can be classified as semi-rigid partial strength. As previously classification by stiffness assumes a beam span length of 2740 mm.
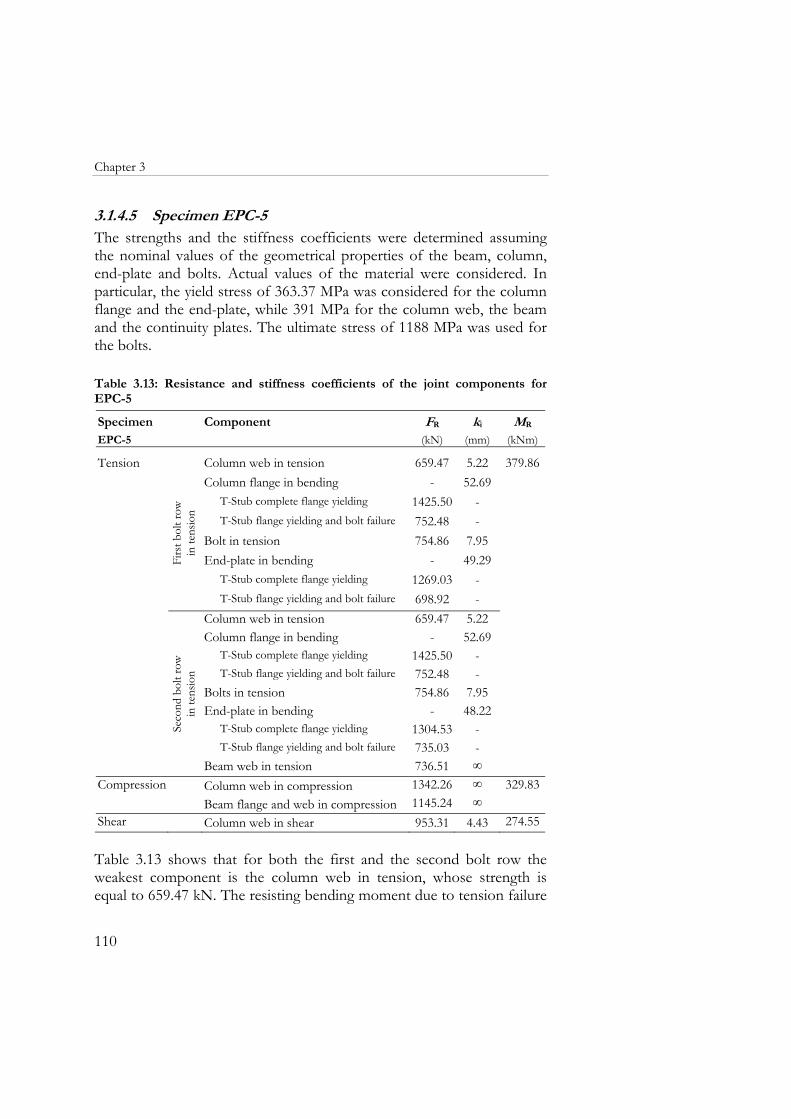
Chapter 3
110
3.1.4.5 Specimen EPC-5 The strengths and the stiffness coefficients were determined assuming the nominal values of the geometrical properties of the beam, column, end-plate and bolts. Actual values of the material were considered. In particular, the yield stress of 363.37 MPa was considered for the column flange and the end-plate, while 391 MPa for the column web, the beam and the continuity plates. The ultimate stress of 1188 MPa was used for the bolts. Table 3.13: Resistance and stiffness coefficients of the joint components for EPC-5
Specimen Component FR ki MR EPC-5 (kN) (mm) (kNm)
Tension
Firs
t bol
t row
in
tens
ion
Column web in tension 659.47 5.22 379.86Column flange in bending - 52.69
T-Stub complete flange yielding 1425.50 -T-Stub flange yielding and bolt failure 752.48 -
Bolt in tension 754.86 7.95End-plate in bending - 49.29
T-Stub complete flange yielding 1269.03 -T-Stub flange yielding and bolt failure 698.92 -
Seco
nd b
olt r
ow
in te
nsio
n
Column web in tension 659.47 5.22Column flange in bending - 52.69
T-Stub complete flange yielding 1425.50 -T-Stub flange yielding and bolt failure 752.48 -
Bolts in tension 754.86 7.95End-plate in bending - 48.22
T-Stub complete flange yielding 1304.53 -T-Stub flange yielding and bolt failure 735.03 -
Beam web in tension 736.51 ∞Compression Column web in compression 1342.26 ∞ 329.83
Beam flange and web in compression 1145.24 ∞Shear Column web in shear 953.31 4.43 274.55 Table 3.13 shows that for both the first and the second bolt row the weakest component is the column web in tension, whose strength is equal to 659.47 kN. The resisting bending moment due to tension failure
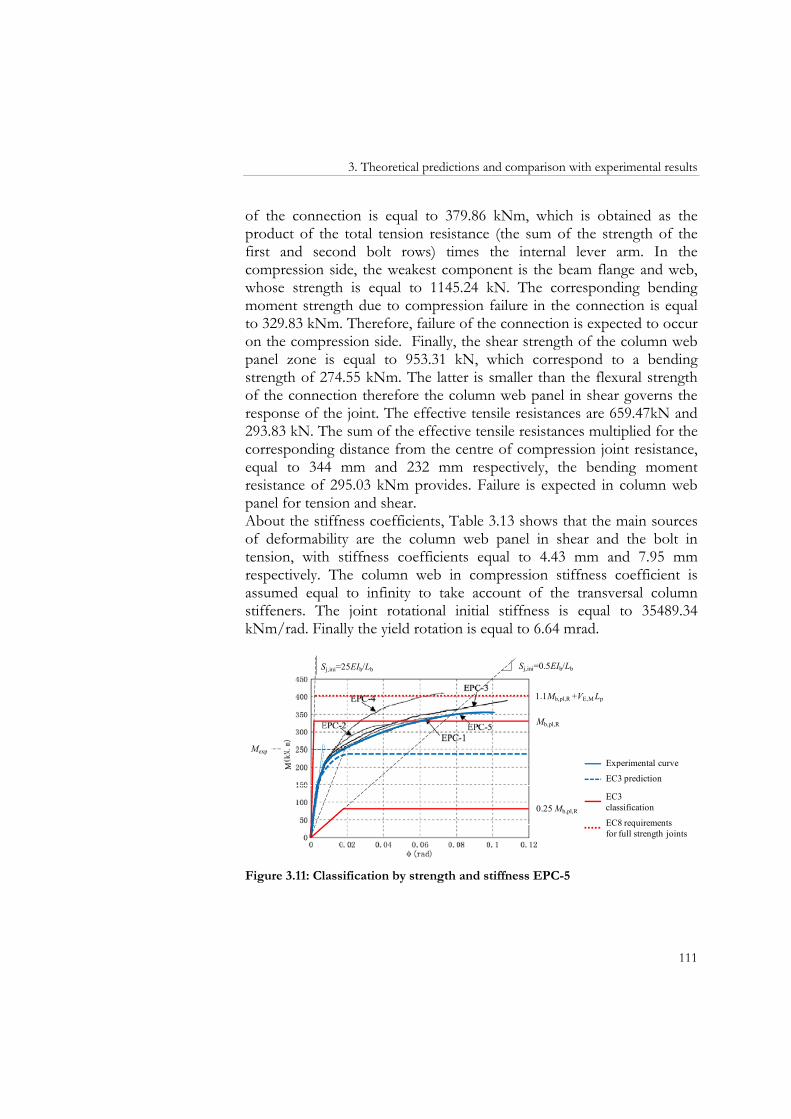
3. Theoretical predictions and comparison with experimental results
111
of the connection is equal to 379.86 kNm, which is obtained as the product of the total tension resistance (the sum of the strength of the first and second bolt rows) times the internal lever arm. In the compression side, the weakest component is the beam flange and web, whose strength is equal to 1145.24 kN. The corresponding bending moment strength due to compression failure in the connection is equal to 329.83 kNm. Therefore, failure of the connection is expected to occur on the compression side. Finally, the shear strength of the column web panel zone is equal to 953.31 kN, which correspond to a bending strength of 274.55 kNm. The latter is smaller than the flexural strength of the connection therefore the column web panel in shear governs the response of the joint. The effective tensile resistances are 659.47kN and 293.83 kN. The sum of the effective tensile resistances multiplied for the corresponding distance from the centre of compression joint resistance, equal to 344 mm and 232 mm respectively, the bending moment resistance of 295.03 kNm provides. Failure is expected in column web panel for tension and shear. About the stiffness coefficients, Table 3.13 shows that the main sources of deformability are the column web panel in shear and the bolt in tension, with stiffness coefficients equal to 4.43 mm and 7.95 mm respectively. The column web in compression stiffness coefficient is assumed equal to infinity to take account of the transversal column stiffeners. The joint rotational initial stiffness is equal to 35489.34 kNm/rad. Finally the yield rotation is equal to 6.64 mrad.
Mb,pl,R
0.25 Mb,pl,R
EC3 classification
EC8 requirements for full strength joints
Experimental curve
EC3 prediction
Sj,ini=0.5EIb/LbSj,ini=25EIb/Lb
1.1Mb,pl,R +VE,M Lp
Mexp
Figure 3.11: Classification by strength and stiffness EPC-5
Chapter 3
112
Also in this case, comparing the theoretical prediction with the experimental results, a difference between the expected plastic mechanism and the ultimate failure mode is noted. This is due to the simplifications included in the mechanical approach. However the available moment-gap rotation and moment-shear rotation curves demonstrate that both the connection and the column web panel in shear yield. The classification of EPC-5 according to EC3 is given in Figure 3.11. As shown it can be classified as semi-rigid partial strength. As previous cases, the classification by stiffness considers a beam span length of 2740 mm.
3.1.5 Tests by Shi et al. (2007 b)
3.1.5.1 Specimen JD2 Table 3.14 contains a synthesis of the application of the component method. The theoretical bending moment strength and initial stiffness of specimen JD2 were determined assuming the nominal values for geometrical properties of the beam, column end-plate and bolts. Actual values of the material properties were instead supposed. In detail, the yield stress of 372.6MPa was considered for the column flange and the end-plate, while the yield stress of 409MPa was used for the column web, the beam and the continuity plates. The ultimate stress of 1160MPa was employed for the bolts. Table 3.14 shows that for both the first and the second bolt row the component which first yields is the end-plate. The failure mechanism is the flange yielding and the bolt failure of the equivalent T-Stub which represents the component. The corresponding strengths are equal to 467.53 kN and 491.15 kN respectively. The resisting bending moment due to tension failure of the connection is equal to 276.10 kNm, which is obtained as the product of the total tension resistance (the sum of the strength of the first and second bolt rows) times the internal lever arm. The compression side is governed by the beam flange and web, whose strength is equal to 1197.96 kN. The corresponding bending moment strength due to compression failure in the connection is equal to 345.01 kNm. Therefore, failure of the connection is expected to occur on the tension side. Finally, the shear strength of the column web panel zone is equal to 912.16 kN. The shear resistance is transformed into a bending strength of 262.70 kNm. The
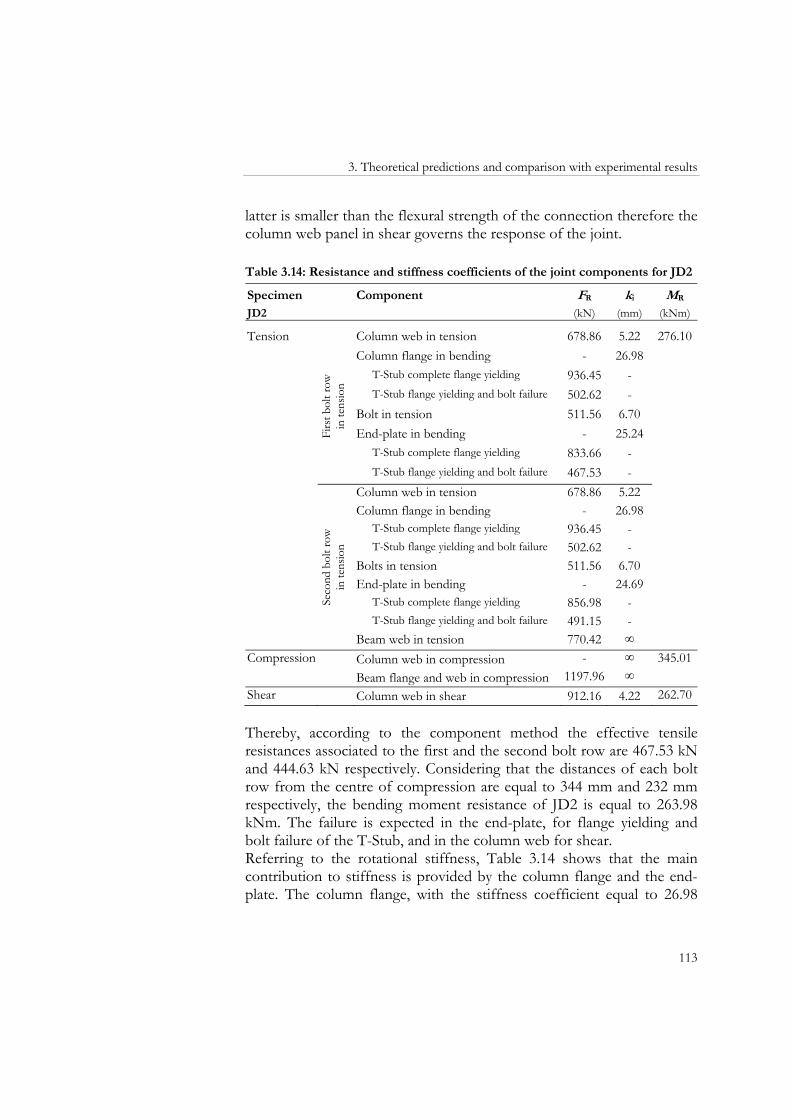
3. Theoretical predictions and comparison with experimental results
113
latter is smaller than the flexural strength of the connection therefore the column web panel in shear governs the response of the joint. Table 3.14: Resistance and stiffness coefficients of the joint components for JD2
Specimen Component FR ki MR JD2 (kN) (mm) (kNm)
Tension Fi
rst b
olt r
ow
in te
nsio
n Column web in tension 678.86 5.22 276.10Column flange in bending - 26.98
T-Stub complete flange yielding 936.45 - T-Stub flange yielding and bolt failure 502.62 -
Bolt in tension 511.56 6.70 End-plate in bending - 25.24
T-Stub complete flange yielding 833.66 - T-Stub flange yielding and bolt failure 467.53 -
Seco
nd b
olt r
ow
in te
nsio
n
Column web in tension 678.86 5.22 Column flange in bending - 26.98
T-Stub complete flange yielding 936.45 - T-Stub flange yielding and bolt failure 502.62 -
Bolts in tension 511.56 6.70 End-plate in bending - 24.69
T-Stub complete flange yielding 856.98 - T-Stub flange yielding and bolt failure 491.15 -
Beam web in tension 770.42 ∞ Compression Column web in compression - ∞ 345.01
Beam flange and web in compression 1197.96 ∞ Shear Column web in shear 912.16 4.22 262.70 Thereby, according to the component method the effective tensile resistances associated to the first and the second bolt row are 467.53 kN and 444.63 kN respectively. Considering that the distances of each bolt row from the centre of compression are equal to 344 mm and 232 mm respectively, the bending moment resistance of JD2 is equal to 263.98 kNm. The failure is expected in the end-plate, for flange yielding and bolt failure of the T-Stub, and in the column web for shear. Referring to the rotational stiffness, Table 3.14 shows that the main contribution to stiffness is provided by the column flange and the end-plate. The column flange, with the stiffness coefficient equal to 26.98
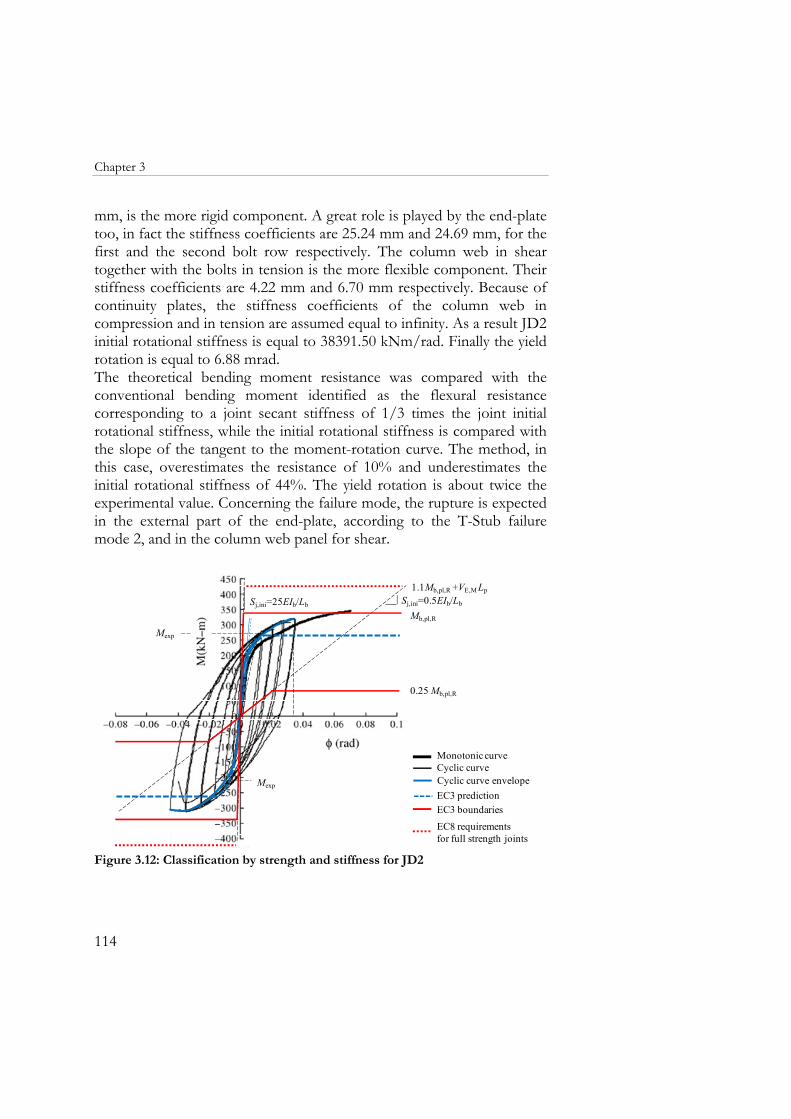
Chapter 3
114
mm, is the more rigid component. A great role is played by the end-plate too, in fact the stiffness coefficients are 25.24 mm and 24.69 mm, for the first and the second bolt row respectively. The column web in shear together with the bolts in tension is the more flexible component. Their stiffness coefficients are 4.22 mm and 6.70 mm respectively. Because of continuity plates, the stiffness coefficients of the column web in compression and in tension are assumed equal to infinity. As a result JD2 initial rotational stiffness is equal to 38391.50 kNm/rad. Finally the yield rotation is equal to 6.88 mrad. The theoretical bending moment resistance was compared with the conventional bending moment identified as the flexural resistance corresponding to a joint secant stiffness of 1/3 times the joint initial rotational stiffness, while the initial rotational stiffness is compared with the slope of the tangent to the moment-rotation curve. The method, in this case, overestimates the resistance of 10% and underestimates the initial rotational stiffness of 44%. The yield rotation is about twice the experimental value. Concerning the failure mode, the rupture is expected in the external part of the end-plate, according to the T-Stub failure mode 2, and in the column web panel for shear.
Monotonic curveCyclic curve
0.25 Mb,pl,R
EC3 boundaries
EC8 requirements for full strength joints
Sj,ini=0.5EIb/LbSj,ini=25EIb/Lb
EC3 predictionCyclic curve envelope
Mb,pl,R
Mexp
1.1Mb,pl,R +VE,M Lp
Mexp
Figure 3.12: Classification by strength and stiffness for JD2
3. Theoretical predictions and comparison with experimental results
115
These provisions agree with the experimental results. In fact, the bolt rupture was observed and the available moment-gap rotation and moment-shear rotation curves demonstrate that both the end-plate and the column web panel in shear yield. The classification by strength and stiffness of JD2 according to the Eurocode 3 is given Figure 3.12. The limit of the bending moment strength which satisfies the recommendations for full strength joint in seismic area according to EC8 is highlighted. As shown, JD2 is classified as semi-rigid partial strength. The classification by stiffness is based on a beam span evaluated as 2 times the specimen beam length (2700mm).
3.1.5.2 Specimen JD3 JD3 components, divided according to their type of loading (tension, compression or shear), are listed in Table 3.15. The same table contains the details of the analytical procedure. For each component the resistance and the stiffened coefficient are specified. The calculations are based on nominal geometrical properties of the beam, column, end-plate and bolts and actual values of the steel yield and ultimate bolt strength. The yield stress of 372.6MPa was considered for the column flange and end-plate, while for the column web, beam and continuity plates the actual yield stress was 409 MPa. The ultimate stress of 1160MP was used for bolts. Comparing data (Table 3.15), on the tension side the minimum resistance is offered by end-plate. For both bolt row, the failure mechanism is flange yielding and bolt failure of the representative T-Stub. The tensile strengths are 330.30 kN and 491.15 kN respectively. At the compression side, the beam web and flange is the component which first yields. Its resistance is equal to 1197.96 kN. The bending strength of the tension side the compression one are 227.30 kNm and 345.01 kNm respectively. Therefore the failure occurs at the tension side of the connection. Concerning the shear strength, it is equal to 912.16 kN, which correspond to the bending strength of 262.70 kNm. The latter is greater than the connection one therefore the tension zone of the connection governs the joint behaviour. As above, the effective tensile resistance of each bolt row are 298.08 kN and 491.15 kN respectively. Since distance of each bolt row from the centre of compression are equal to 344mm and 232mm respectively, the flexural strength of JD3 is 216.49 kNm. Failure is expected to occur in the end-plate for flange yielding and bolt failure.
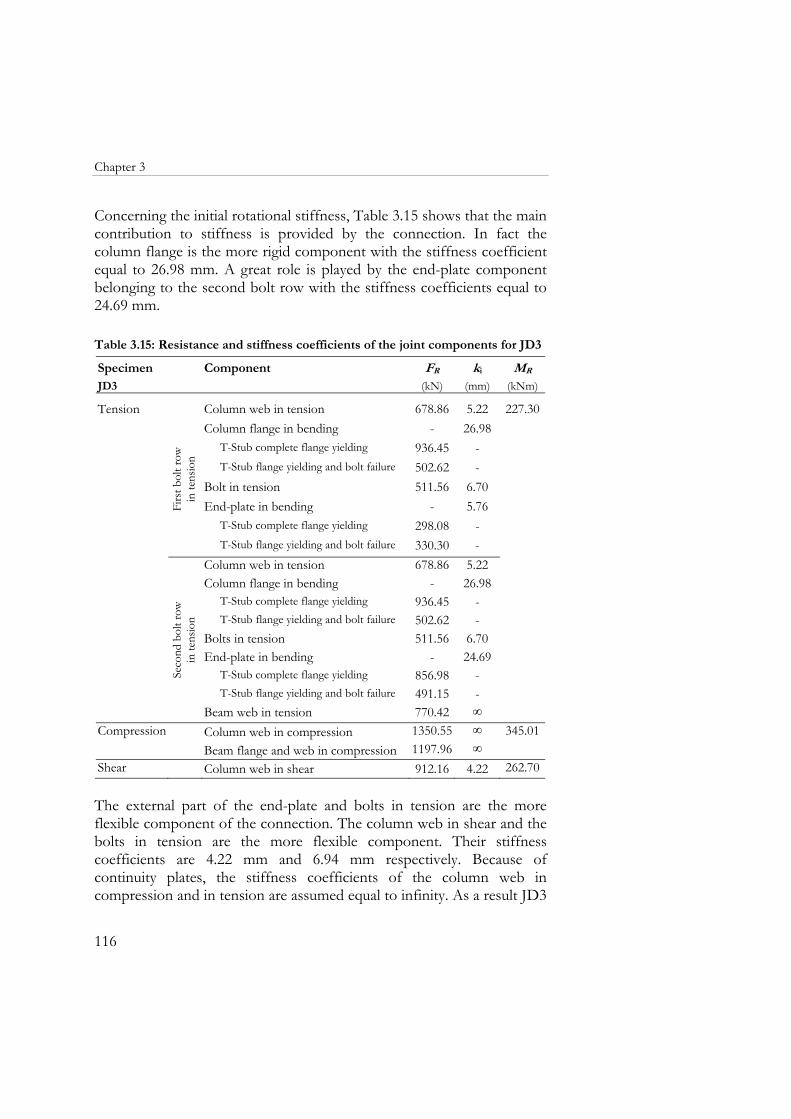
Chapter 3
116
Concerning the initial rotational stiffness, Table 3.15 shows that the main contribution to stiffness is provided by the connection. In fact the column flange is the more rigid component with the stiffness coefficient equal to 26.98 mm. A great role is played by the end-plate component belonging to the second bolt row with the stiffness coefficients equal to 24.69 mm.
Table 3.15: Resistance and stiffness coefficients of the joint components for JD3
Specimen Component FR ki MR JD3 (kN) (mm) (kNm)
Tension
Firs
t bol
t row
in
tens
ion
Column web in tension 678.86 5.22 227.30Column flange in bending - 26.98
T-Stub complete flange yielding 936.45 -T-Stub flange yielding and bolt failure 502.62 -
Bolt in tension 511.56 6.70End-plate in bending - 5.76
T-Stub complete flange yielding 298.08 -T-Stub flange yielding and bolt failure 330.30 -
Seco
nd b
olt r
ow
in te
nsio
n
Column web in tension 678.86 5.22Column flange in bending - 26.98
T-Stub complete flange yielding 936.45 -T-Stub flange yielding and bolt failure 502.62 -
Bolts in tension 511.56 6.70End-plate in bending - 24.69
T-Stub complete flange yielding 856.98 -T-Stub flange yielding and bolt failure 491.15 -
Beam web in tension 770.42 ∞Compression Column web in compression 1350.55 ∞ 345.01
Beam flange and web in compression 1197.96 ∞Shear Column web in shear 912.16 4.22 262.70 The external part of the end-plate and bolts in tension are the more flexible component of the connection. The column web in shear and the bolts in tension are the more flexible component. Their stiffness coefficients are 4.22 mm and 6.94 mm respectively. Because of continuity plates, the stiffness coefficients of the column web in compression and in tension are assumed equal to infinity. As a result JD3
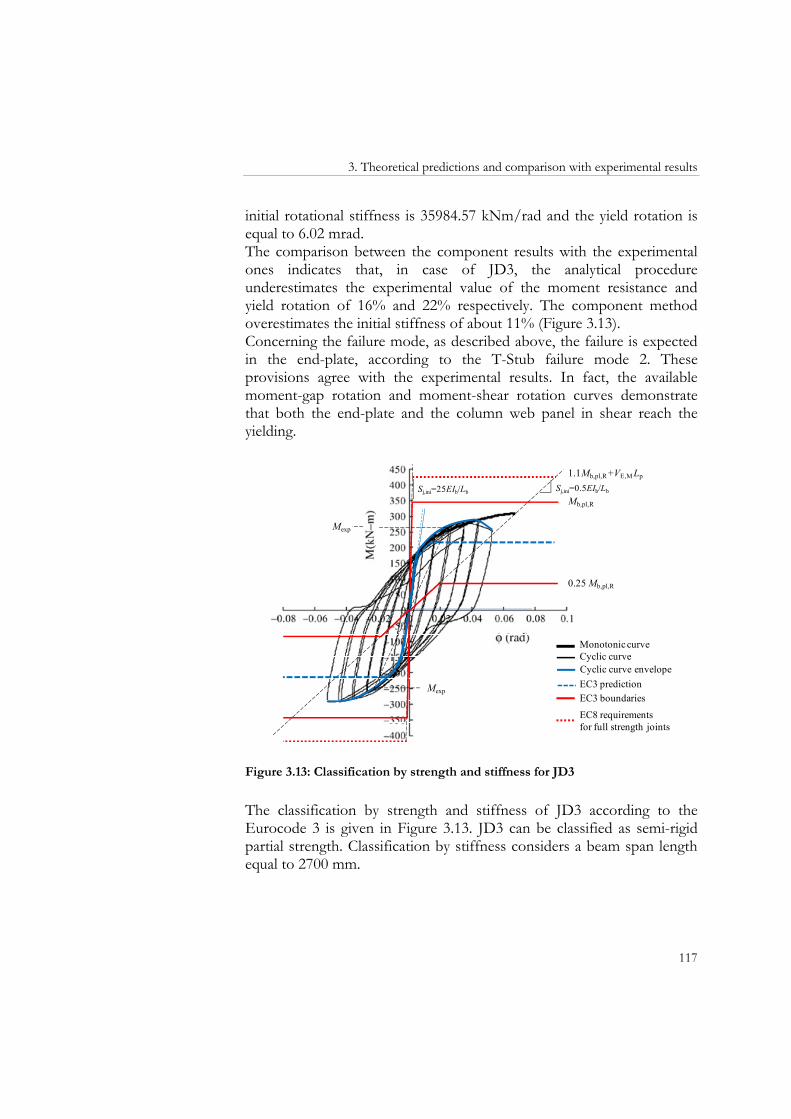
3. Theoretical predictions and comparison with experimental results
117
initial rotational stiffness is 35984.57 kNm/rad and the yield rotation is equal to 6.02 mrad. The comparison between the component results with the experimental ones indicates that, in case of JD3, the analytical procedure underestimates the experimental value of the moment resistance and yield rotation of 16% and 22% respectively. The component method overestimates the initial stiffness of about 11% (Figure 3.13). Concerning the failure mode, as described above, the failure is expected in the end-plate, according to the T-Stub failure mode 2. These provisions agree with the experimental results. In fact, the available moment-gap rotation and moment-shear rotation curves demonstrate that both the end-plate and the column web panel in shear reach the yielding.
Mb,pl,R
0.25 Mb,pl,R
Sj,ini=25EIb/Lb
Mexp
1.1Mb,pl,R +VE,M Lp
Monotonic curveCyclic curve
EC3 boundaries
EC8 requirements for full strength joints
EC3 predictionCyclic curve envelope
Sj,ini=0.5EIb/Lb
Mexp
Figure 3.13: Classification by strength and stiffness for JD3
The classification by strength and stiffness of JD3 according to the Eurocode 3 is given in Figure 3.13. JD3 can be classified as semi-rigid partial strength. Classification by stiffness considers a beam span length equal to 2700 mm.
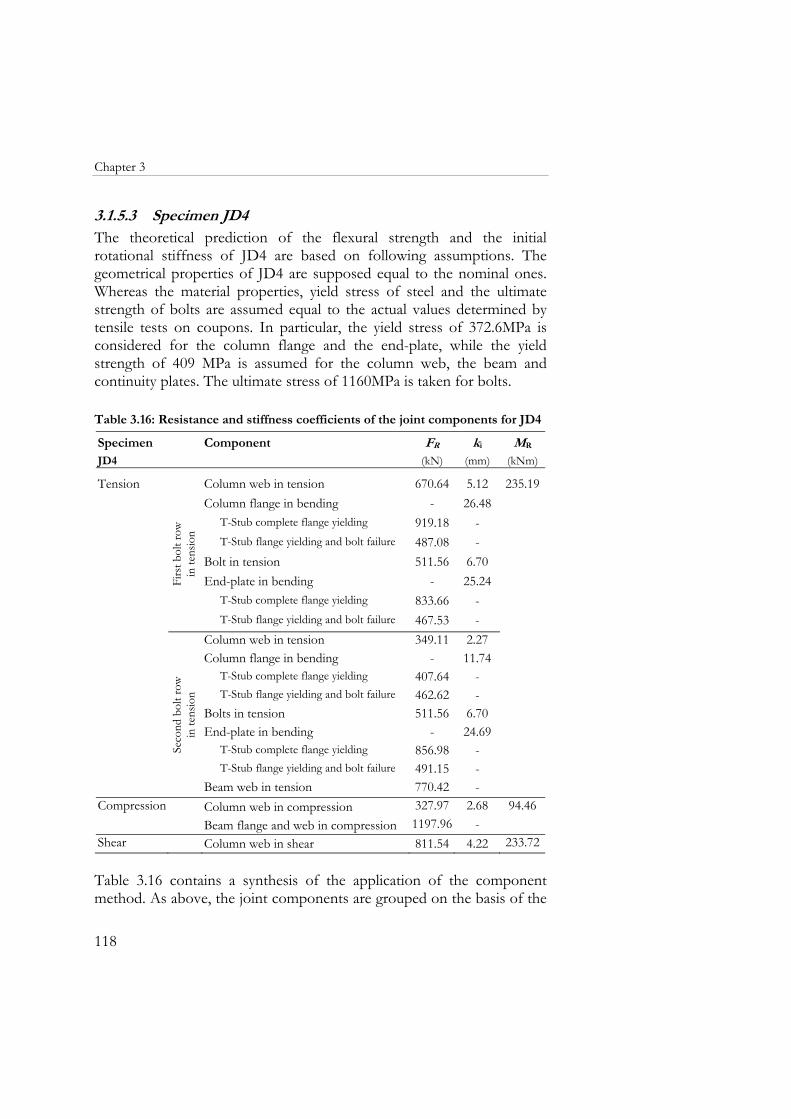
Chapter 3
118
3.1.5.3 Specimen JD4 The theoretical prediction of the flexural strength and the initial rotational stiffness of JD4 are based on following assumptions. The geometrical properties of JD4 are supposed equal to the nominal ones. Whereas the material properties, yield stress of steel and the ultimate strength of bolts are assumed equal to the actual values determined by tensile tests on coupons. In particular, the yield stress of 372.6MPa is considered for the column flange and the end-plate, while the yield strength of 409 MPa is assumed for the column web, the beam and continuity plates. The ultimate stress of 1160MPa is taken for bolts. Table 3.16: Resistance and stiffness coefficients of the joint components for JD4
Specimen Component FR ki MR JD4 (kN) (mm) (kNm)
Tension
Firs
t bol
t row
in
tens
ion
Column web in tension 670.64 5.12 235.19Column flange in bending - 26.48
T-Stub complete flange yielding 919.18 -T-Stub flange yielding and bolt failure 487.08 -
Bolt in tension 511.56 6.70End-plate in bending - 25.24
T-Stub complete flange yielding 833.66 -T-Stub flange yielding and bolt failure 467.53 -
Seco
nd b
olt r
ow
in te
nsio
n
Column web in tension 349.11 2.27Column flange in bending - 11.74
T-Stub complete flange yielding 407.64 -T-Stub flange yielding and bolt failure 462.62 -
Bolts in tension 511.56 6.70End-plate in bending - 24.69
T-Stub complete flange yielding 856.98 -T-Stub flange yielding and bolt failure 491.15 -
Beam web in tension 770.42 -Compression Column web in compression 327.97 2.68 94.46
Beam flange and web in compression 1197.96 -Shear Column web in shear 811.54 4.22 233.72 Table 3.16 contains a synthesis of the application of the component method. As above, the joint components are grouped on the basis of the
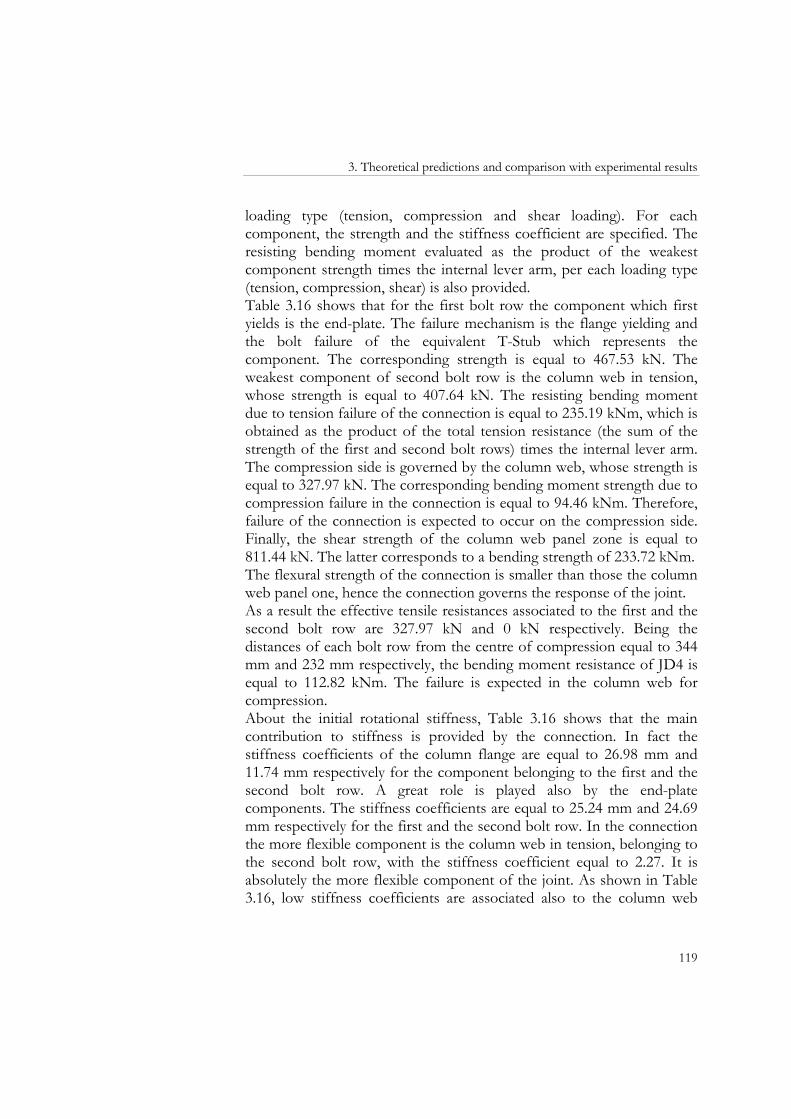
3. Theoretical predictions and comparison with experimental results
119
loading type (tension, compression and shear loading). For each component, the strength and the stiffness coefficient are specified. The resisting bending moment evaluated as the product of the weakest component strength times the internal lever arm, per each loading type (tension, compression, shear) is also provided. Table 3.16 shows that for the first bolt row the component which first yields is the end-plate. The failure mechanism is the flange yielding and the bolt failure of the equivalent T-Stub which represents the component. The corresponding strength is equal to 467.53 kN. The weakest component of second bolt row is the column web in tension, whose strength is equal to 407.64 kN. The resisting bending moment due to tension failure of the connection is equal to 235.19 kNm, which is obtained as the product of the total tension resistance (the sum of the strength of the first and second bolt rows) times the internal lever arm. The compression side is governed by the column web, whose strength is equal to 327.97 kN. The corresponding bending moment strength due to compression failure in the connection is equal to 94.46 kNm. Therefore, failure of the connection is expected to occur on the compression side. Finally, the shear strength of the column web panel zone is equal to 811.44 kN. The latter corresponds to a bending strength of 233.72 kNm. The flexural strength of the connection is smaller than those the column web panel one, hence the connection governs the response of the joint. As a result the effective tensile resistances associated to the first and the second bolt row are 327.97 kN and 0 kN respectively. Being the distances of each bolt row from the centre of compression equal to 344 mm and 232 mm respectively, the bending moment resistance of JD4 is equal to 112.82 kNm. The failure is expected in the column web for compression. About the initial rotational stiffness, Table 3.16 shows that the main contribution to stiffness is provided by the connection. In fact the stiffness coefficients of the column flange are equal to 26.98 mm and 11.74 mm respectively for the component belonging to the first and the second bolt row. A great role is played also by the end-plate components. The stiffness coefficients are equal to 25.24 mm and 24.69 mm respectively for the first and the second bolt row. In the connection the more flexible component is the column web in tension, belonging to the second bolt row, with the stiffness coefficient equal to 2.27. It is absolutely the more flexible component of the joint. As shown in Table 3.16, low stiffness coefficients are associated also to the column web
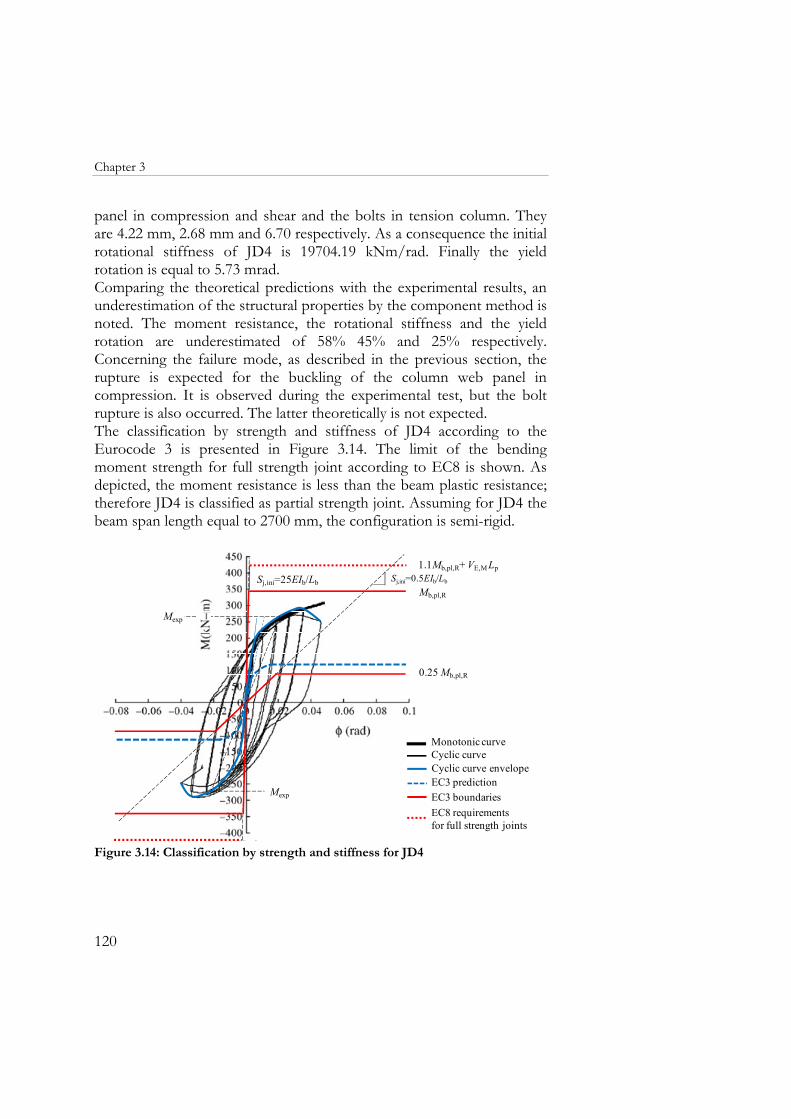
Chapter 3
120
panel in compression and shear and the bolts in tension column. They are 4.22 mm, 2.68 mm and 6.70 respectively. As a consequence the initial rotational stiffness of JD4 is 19704.19 kNm/rad. Finally the yield rotation is equal to 5.73 mrad. Comparing the theoretical predictions with the experimental results, an underestimation of the structural properties by the component method is noted. The moment resistance, the rotational stiffness and the yield rotation are underestimated of 58% 45% and 25% respectively. Concerning the failure mode, as described in the previous section, the rupture is expected for the buckling of the column web panel in compression. It is observed during the experimental test, but the bolt rupture is also occurred. The latter theoretically is not expected. The classification by strength and stiffness of JD4 according to the Eurocode 3 is presented in Figure 3.14. The limit of the bending moment strength for full strength joint according to EC8 is shown. As depicted, the moment resistance is less than the beam plastic resistance; therefore JD4 is classified as partial strength joint. Assuming for JD4 the beam span length equal to 2700 mm, the configuration is semi-rigid.
1.1Mb,pl,R+ VE,M Lp
Mb,pl,R
0.25 Mb,pl,R
Sj,ini=0.5EIb/LbSj,ini=25EIb/Lb
Mexp
Mexp
Monotonic curveCyclic curve
EC3 boundariesEC8 requirements for full strength joints
EC3 predictionCyclic curve envelope
Figure 3.14: Classification by strength and stiffness for JD4
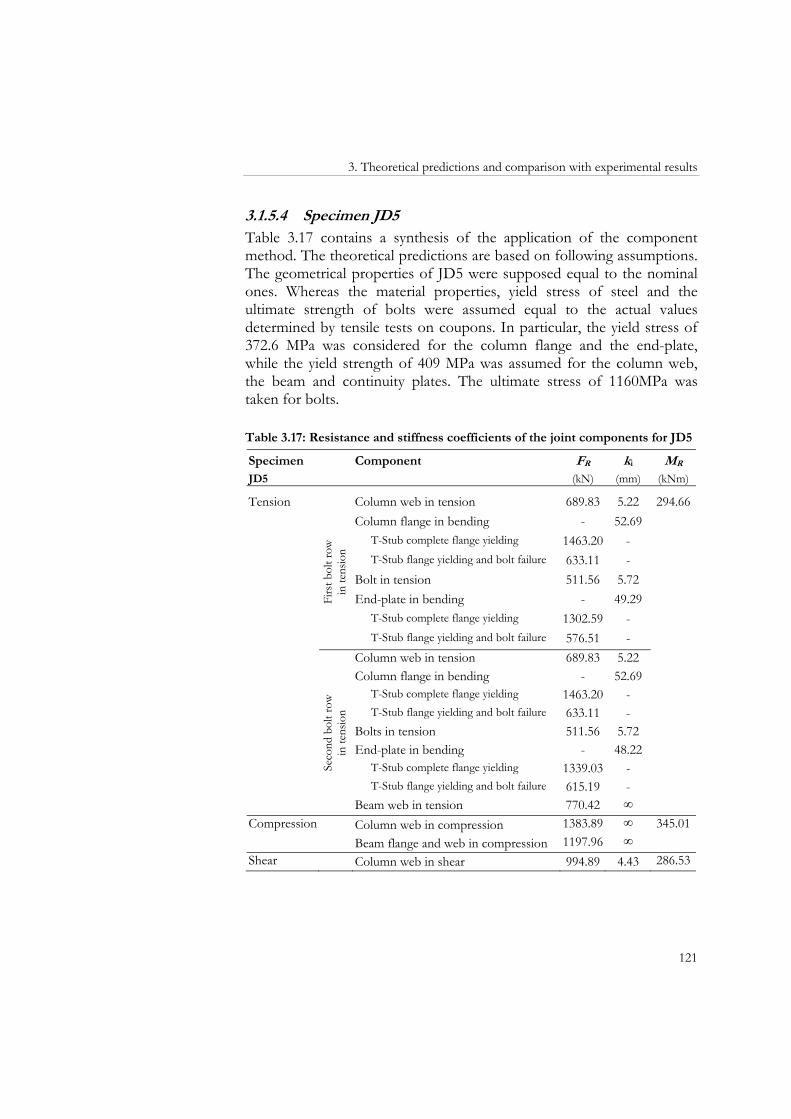
3. Theoretical predictions and comparison with experimental results
121
3.1.5.4 Specimen JD5 Table 3.17 contains a synthesis of the application of the component method. The theoretical predictions are based on following assumptions. The geometrical properties of JD5 were supposed equal to the nominal ones. Whereas the material properties, yield stress of steel and the ultimate strength of bolts were assumed equal to the actual values determined by tensile tests on coupons. In particular, the yield stress of 372.6 MPa was considered for the column flange and the end-plate, while the yield strength of 409 MPa was assumed for the column web, the beam and continuity plates. The ultimate stress of 1160MPa was taken for bolts. Table 3.17: Resistance and stiffness coefficients of the joint components for JD5
Specimen Component FR ki MR JD5 (kN) (mm) (kNm)
Tension
Firs
t bol
t row
in
tens
ion
Column web in tension 689.83 5.22 294.66Column flange in bending - 52.69
T-Stub complete flange yielding 1463.20 - T-Stub flange yielding and bolt failure 633.11 -
Bolt in tension 511.56 5.72 End-plate in bending - 49.29
T-Stub complete flange yielding 1302.59 - T-Stub flange yielding and bolt failure 576.51 -
Seco
nd b
olt r
ow
in te
nsio
n
Column web in tension 689.83 5.22 Column flange in bending - 52.69
T-Stub complete flange yielding 1463.20 - T-Stub flange yielding and bolt failure 633.11 -
Bolts in tension 511.56 5.72 End-plate in bending - 48.22
T-Stub complete flange yielding 1339.03 - T-Stub flange yielding and bolt failure 615.19 -
Beam web in tension 770.42 ∞ Compression Column web in compression 1383.89 ∞ 345.01
Beam flange and web in compression 1197.96 ∞ Shear Column web in shear 994.89 4.43 286.53
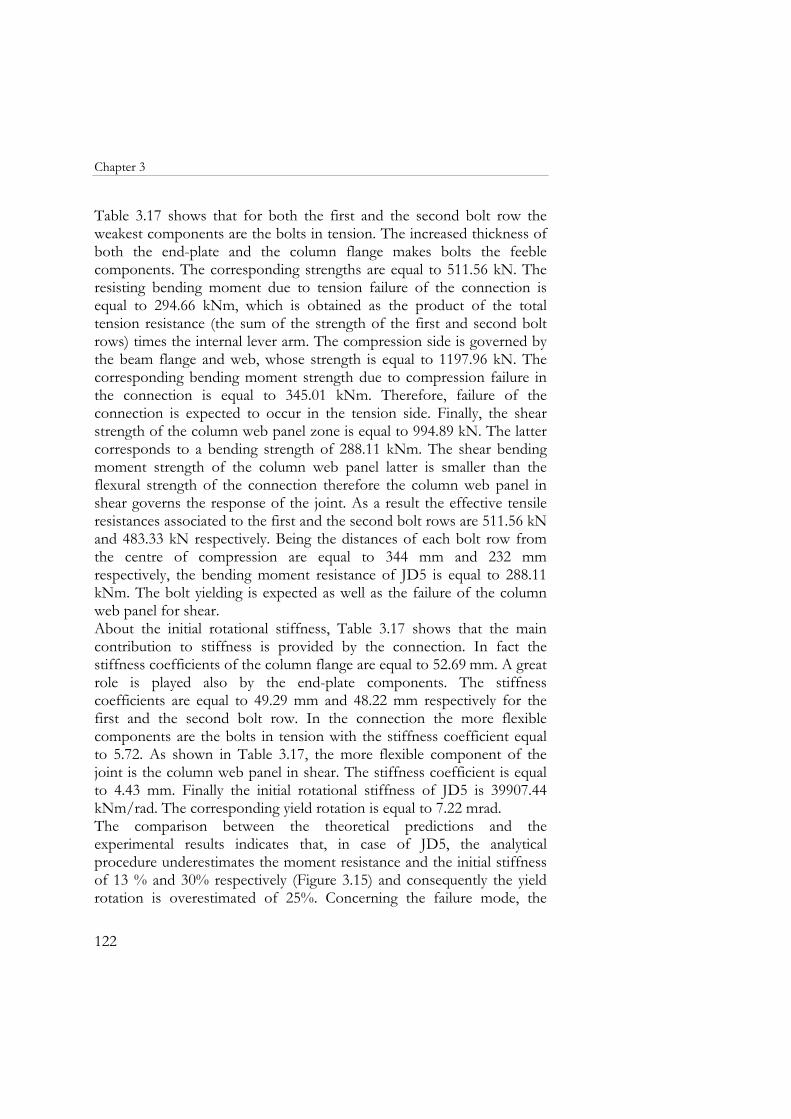
Chapter 3
122
Table 3.17 shows that for both the first and the second bolt row the weakest components are the bolts in tension. The increased thickness of both the end-plate and the column flange makes bolts the feeble components. The corresponding strengths are equal to 511.56 kN. The resisting bending moment due to tension failure of the connection is equal to 294.66 kNm, which is obtained as the product of the total tension resistance (the sum of the strength of the first and second bolt rows) times the internal lever arm. The compression side is governed by the beam flange and web, whose strength is equal to 1197.96 kN. The corresponding bending moment strength due to compression failure in the connection is equal to 345.01 kNm. Therefore, failure of the connection is expected to occur in the tension side. Finally, the shear strength of the column web panel zone is equal to 994.89 kN. The latter corresponds to a bending strength of 288.11 kNm. The shear bending moment strength of the column web panel latter is smaller than the flexural strength of the connection therefore the column web panel in shear governs the response of the joint. As a result the effective tensile resistances associated to the first and the second bolt rows are 511.56 kN and 483.33 kN respectively. Being the distances of each bolt row from the centre of compression are equal to 344 mm and 232 mm respectively, the bending moment resistance of JD5 is equal to 288.11 kNm. The bolt yielding is expected as well as the failure of the column web panel for shear. About the initial rotational stiffness, Table 3.17 shows that the main contribution to stiffness is provided by the connection. In fact the stiffness coefficients of the column flange are equal to 52.69 mm. A great role is played also by the end-plate components. The stiffness coefficients are equal to 49.29 mm and 48.22 mm respectively for the first and the second bolt row. In the connection the more flexible components are the bolts in tension with the stiffness coefficient equal to 5.72. As shown in Table 3.17, the more flexible component of the joint is the column web panel in shear. The stiffness coefficient is equal to 4.43 mm. Finally the initial rotational stiffness of JD5 is 39907.44 kNm/rad. The corresponding yield rotation is equal to 7.22 mrad. The comparison between the theoretical predictions and the experimental results indicates that, in case of JD5, the analytical procedure underestimates the moment resistance and the initial stiffness of 13 % and 30% respectively (Figure 3.15) and consequently the yield rotation is overestimated of 25%. Concerning the failure mode, the
3. Theoretical predictions and comparison with experimental results
123
provisions agree with the experimental results, since the bolt failure was observed and the moment-shear rotation curve demonstrates that web panel in shear yields. In Figure 3.15 the classification of JD5 according to the Eurocode 3 is presented. As depicted, both the experimental and the theoretical bending moment resistance are less than the beam plastic resistance, therefore JD5 is classified as partial strength. Assuming the beam length equal to 2700 mm, the joint is classified semi-rigid.
Mb,pl,R
0.25 Mb,pl,R
Sj,ini=0.5EIb/LbSj,ini=25EIb/Lb
1.1Mb,pl,R+ VE,M Lp
Mexp
Mexp
Monotonic curveCyclic curve
EC3 boundariesEC8 requirements for full strength joints
EC3 predictionCyclic curve envelope
Figure 3.15: Classification by strength and stiffness for JD5
3.1.5.5 Specimen JD6 In Table 3.18 is a summary of the application of the analytical procedure. As before the component strengths and the stiffness coefficients were determined assuming the nominal values of the geometrical properties of the beam, the column, the end-plate and bolts. Actual values of the material properties were considered. In particular, the yield stress of 372.6MPa was counted for the column flange and the end-plate, while409MPa for the column web, the beam and the continuity plates. The ultimate stress of 1188 MPa was used for the bolts. The nominal Young modulus was considered.
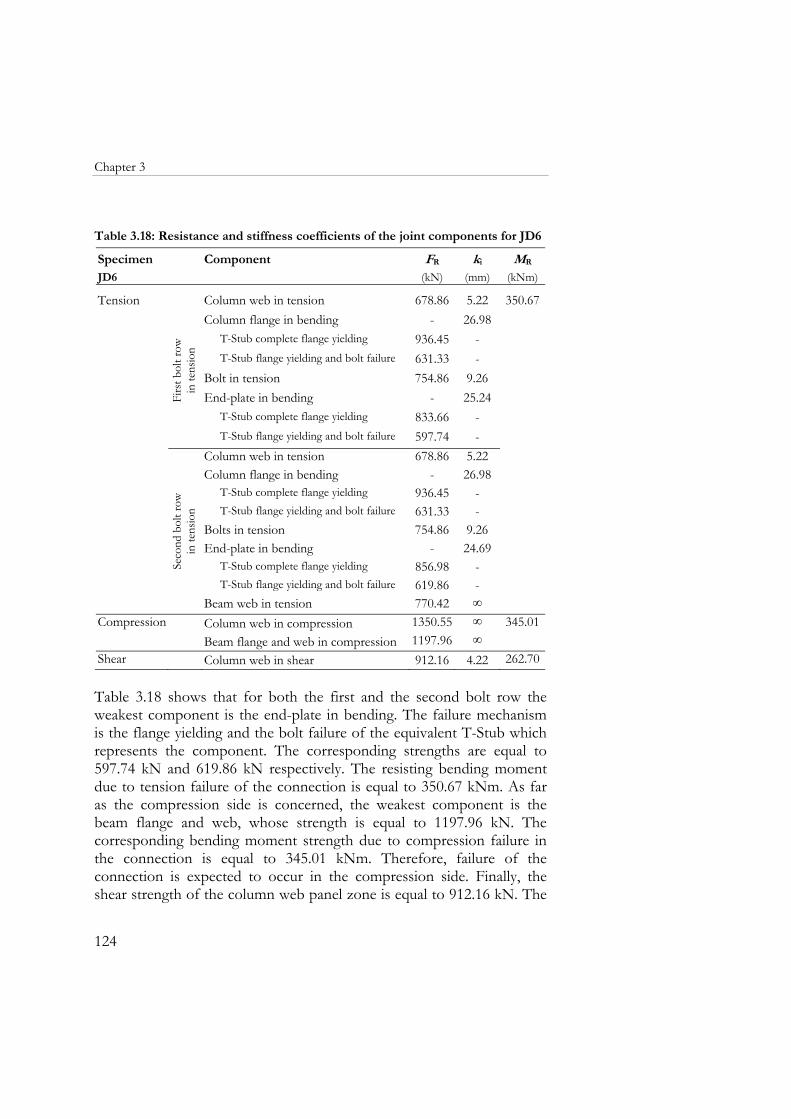
Chapter 3
124
Table 3.18: Resistance and stiffness coefficients of the joint components for JD6
Specimen Component FR ki MR JD6 (kN) (mm) (kNm)
Tension
Firs
t bol
t row
in
tens
ion
Column web in tension 678.86 5.22 350.67Column flange in bending - 26.98
T-Stub complete flange yielding 936.45 -T-Stub flange yielding and bolt failure 631.33 -
Bolt in tension 754.86 9.26End-plate in bending - 25.24
T-Stub complete flange yielding 833.66 -T-Stub flange yielding and bolt failure 597.74 -
Seco
nd b
olt r
ow
in te
nsio
n
Column web in tension 678.86 5.22Column flange in bending - 26.98
T-Stub complete flange yielding 936.45 -T-Stub flange yielding and bolt failure 631.33 -
Bolts in tension 754.86 9.26End-plate in bending - 24.69
T-Stub complete flange yielding 856.98 -T-Stub flange yielding and bolt failure 619.86 -
Beam web in tension 770.42 ∞Compression Column web in compression 1350.55 ∞ 345.01
Beam flange and web in compression 1197.96 ∞Shear Column web in shear 912.16 4.22 262.70 Table 3.18 shows that for both the first and the second bolt row the weakest component is the end-plate in bending. The failure mechanism is the flange yielding and the bolt failure of the equivalent T-Stub which represents the component. The corresponding strengths are equal to 597.74 kN and 619.86 kN respectively. The resisting bending moment due to tension failure of the connection is equal to 350.67 kNm. As far as the compression side is concerned, the weakest component is the beam flange and web, whose strength is equal to 1197.96 kN. The corresponding bending moment strength due to compression failure in the connection is equal to 345.01 kNm. Therefore, failure of the connection is expected to occur in the compression side. Finally, the shear strength of the column web panel zone is equal to 912.16 kN. The
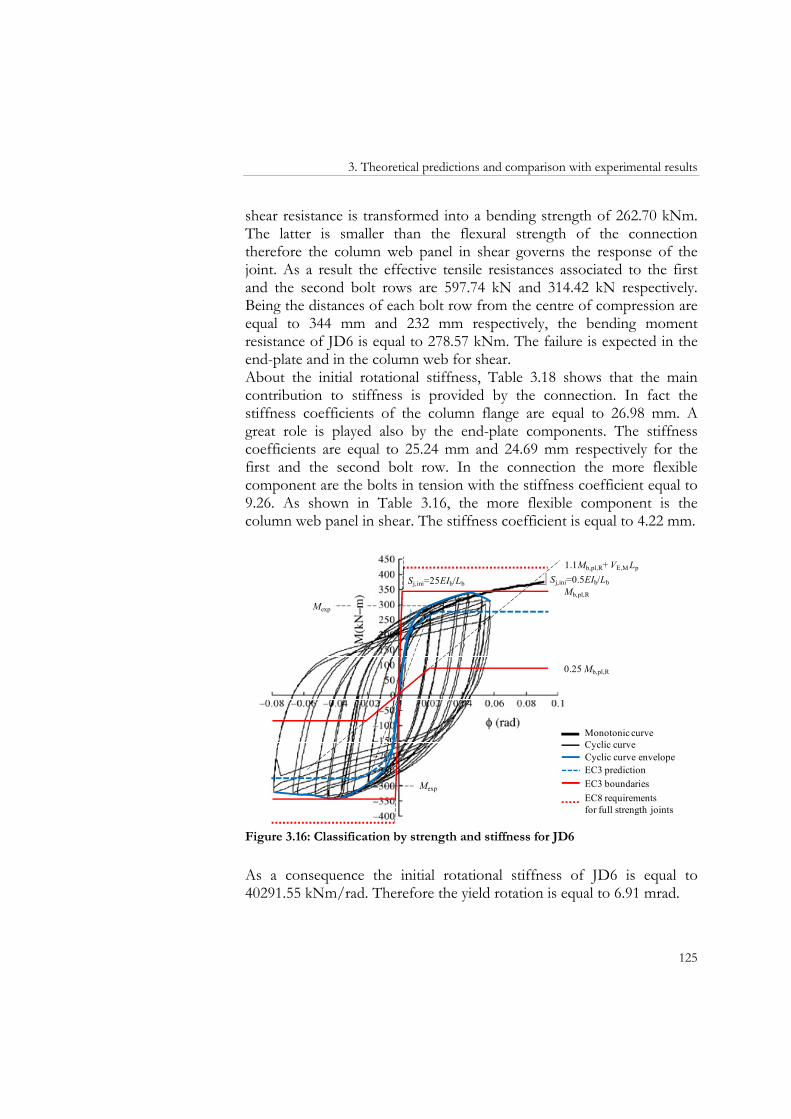
3. Theoretical predictions and comparison with experimental results
125
shear resistance is transformed into a bending strength of 262.70 kNm. The latter is smaller than the flexural strength of the connection therefore the column web panel in shear governs the response of the joint. As a result the effective tensile resistances associated to the first and the second bolt rows are 597.74 kN and 314.42 kN respectively. Being the distances of each bolt row from the centre of compression are equal to 344 mm and 232 mm respectively, the bending moment resistance of JD6 is equal to 278.57 kNm. The failure is expected in the end-plate and in the column web for shear. About the initial rotational stiffness, Table 3.18 shows that the main contribution to stiffness is provided by the connection. In fact the stiffness coefficients of the column flange are equal to 26.98 mm. A great role is played also by the end-plate components. The stiffness coefficients are equal to 25.24 mm and 24.69 mm respectively for the first and the second bolt row. In the connection the more flexible component are the bolts in tension with the stiffness coefficient equal to 9.26. As shown in Table 3.16, the more flexible component is the column web panel in shear. The stiffness coefficient is equal to 4.22 mm.
Mb,pl,R
0.25 Mb,pl,R
Sj,ini=25EIb/Lb Sj,ini=0.5EIb/Lb
1.1Mb,pl,R+ VE,M Lp
Mexp
Mexp
Monotonic curveCyclic curve
EC3 boundariesEC8 requirements for full strength joints
EC3 predictionCyclic curve envelope
Figure 3.16: Classification by strength and stiffness for JD6
As a consequence the initial rotational stiffness of JD6 is equal to 40291.55 kNm/rad. Therefore the yield rotation is equal to 6.91 mrad.
Chapter 3
126
The theoretical predictions are in accordance with the experimental results. The moment resistance, the initial stiffness and the yield rotation are underestimated of 7%, 2% and 5% respectively. The classification by strength and stiffness of JD6 according to the Eurocode 3 is presented in Figure 3.16. As depicted, bending moment resistance is less than the beam plastic resistance; therefore JD6 according to EC3 is classified as partial strength. Assuming the beam span length equal to 2700 mm, the joint is semi-rigid.
3.1.5.6 Specimen JD7 The component method application is briefly summarized in Table 3.19. The prediction of the structural properties is based on some assumptions. The geometrical properties of the beam, the column, the end-plate and bolts are supposed equal to the geometrical values. the material properties are assumed equal to the actual values. In particular, the yield stress of 372.6MPa is considered for the column flange and the end-plate, while 409MPa for the column web, the beam and the continuity plates. The ultimate stress of 1188 MPa is used for the bolts. Finally, the elastic modulus is supposed equal to the nominal value. As shown in Table 3.19, according the component method, the weakest component of both the first and the second bolt row in tension is the column web in tension. The corresponding strengths are equal to 689.83 kN. The resisting bending moment due to tension failure of the connection is equal to 397.34 kNm. Concerning the compression side, the weakest component is the beam flange and web, whose strength is equal to 1197.96 kN. The corresponding bending moment strength due to compression failure in the connection is equal to 345.01 kNm. Therefore, failure of the connection is expected to occur in the compression side. Finally, the shear strength of the column web panel zone is equal to 286.53kN. The shear resistance is transformed into a bending strength of 262.70 kNm. The latter is smaller than the flexural strength of the connection therefore the column web panel in shear governs the response of the joint. As a result the effective tensile resistances associated to the first and the second bolt row are 689.83 kN and 305.06 kN respectively. Being the distances of each bolt row from the centre of compression are equal to 344 mm and 232 mm respectively, the bending moment resistance of JD7 is equal to 308.08 kNm. The failure is expected in the column web for tension and shear.
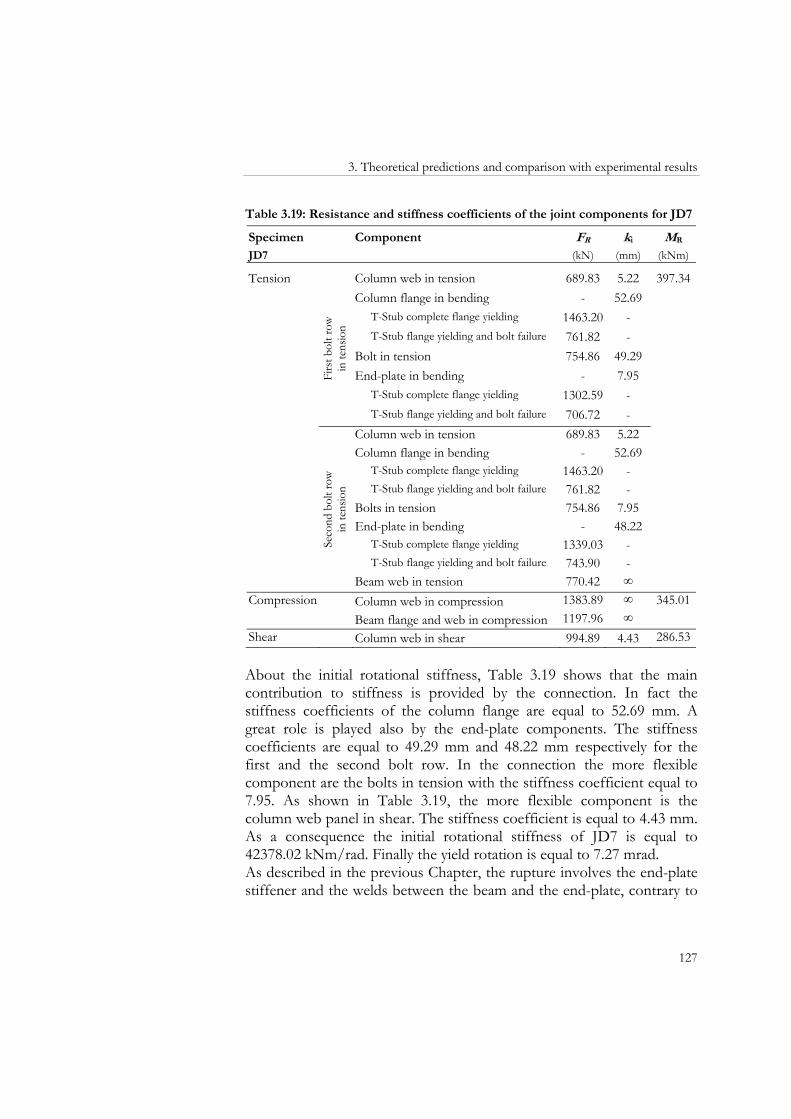
3. Theoretical predictions and comparison with experimental results
127
Table 3.19: Resistance and stiffness coefficients of the joint components for JD7
Specimen Component FR ki MR JD7 (kN) (mm) (kNm)
Tension
Firs
t bol
t row
in
tens
ion
Column web in tension 689.83 5.22 397.34Column flange in bending - 52.69
T-Stub complete flange yielding 1463.20 - T-Stub flange yielding and bolt failure 761.82 -
Bolt in tension 754.86 49.29 End-plate in bending - 7.95
T-Stub complete flange yielding 1302.59 - T-Stub flange yielding and bolt failure 706.72 -
Seco
nd b
olt r
ow
in te
nsio
n
Column web in tension 689.83 5.22 Column flange in bending - 52.69
T-Stub complete flange yielding 1463.20 - T-Stub flange yielding and bolt failure 761.82 -
Bolts in tension 754.86 7.95 End-plate in bending - 48.22
T-Stub complete flange yielding 1339.03 - T-Stub flange yielding and bolt failure 743.90 -
Beam web in tension 770.42 ∞ Compression Column web in compression 1383.89 ∞ 345.01
Beam flange and web in compression 1197.96 ∞ Shear Column web in shear 994.89 4.43 286.53 About the initial rotational stiffness, Table 3.19 shows that the main contribution to stiffness is provided by the connection. In fact the stiffness coefficients of the column flange are equal to 52.69 mm. A great role is played also by the end-plate components. The stiffness coefficients are equal to 49.29 mm and 48.22 mm respectively for the first and the second bolt row. In the connection the more flexible component are the bolts in tension with the stiffness coefficient equal to 7.95. As shown in Table 3.19, the more flexible component is the column web panel in shear. The stiffness coefficient is equal to 4.43 mm. As a consequence the initial rotational stiffness of JD7 is equal to 42378.02 kNm/rad. Finally the yield rotation is equal to 7.27 mrad. As described in the previous Chapter, the rupture involves the end-plate stiffener and the welds between the beam and the end-plate, contrary to
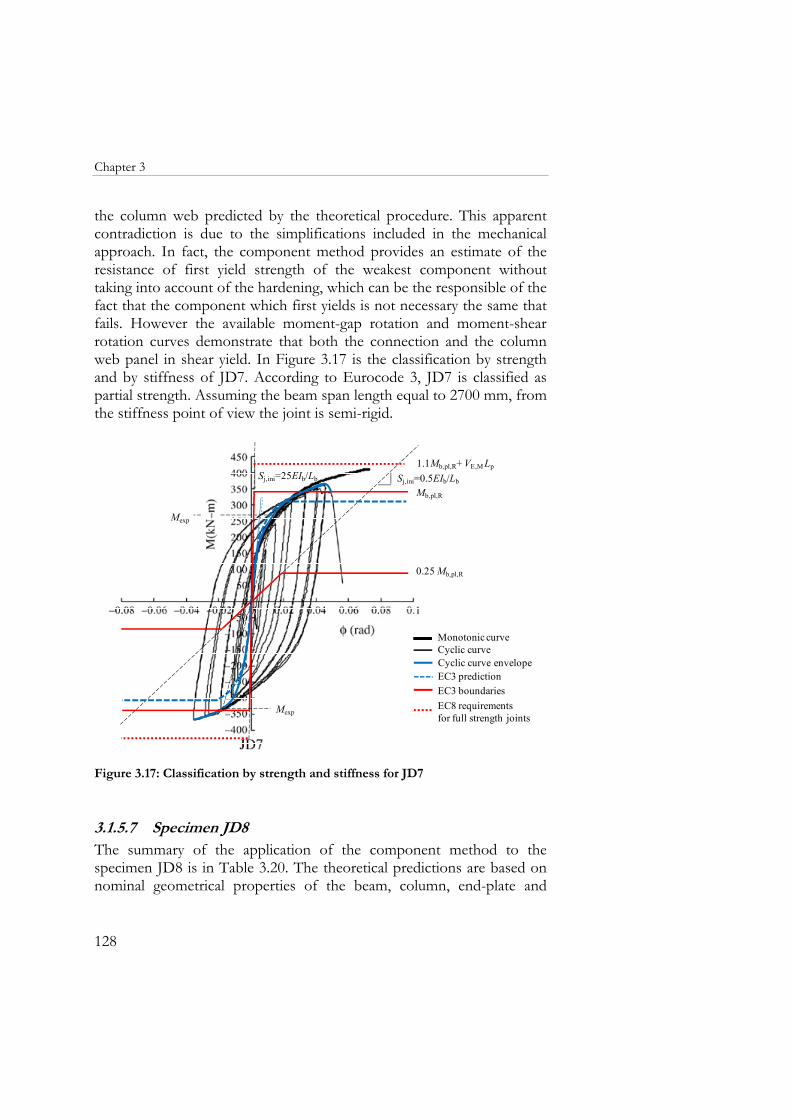
Chapter 3
128
the column web predicted by the theoretical procedure. This apparent contradiction is due to the simplifications included in the mechanical approach. In fact, the component method provides an estimate of the resistance of first yield strength of the weakest component without taking into account of the hardening, which can be the responsible of the fact that the component which first yields is not necessary the same that fails. However the available moment-gap rotation and moment-shear rotation curves demonstrate that both the connection and the column web panel in shear yield. In Figure 3.17 is the classification by strength and by stiffness of JD7. According to Eurocode 3, JD7 is classified as partial strength. Assuming the beam span length equal to 2700 mm, from the stiffness point of view the joint is semi-rigid.
Mb,pl,R
0.25 Mb,pl,R
Sj,ini=0.5EIb/LbSj,ini=25EIb/Lb
1.1Mb,pl,R+ VE,M Lp
Mexp
Mexp
Monotonic curveCyclic curve
EC3 boundariesEC8 requirements for full strength joints
EC3 predictionCyclic curve envelope
Figure 3.17: Classification by strength and stiffness for JD7
3.1.5.7 Specimen JD8 The summary of the application of the component method to the specimen JD8 is in Table 3.20. The theoretical predictions are based on nominal geometrical properties of the beam, column, end-plate and
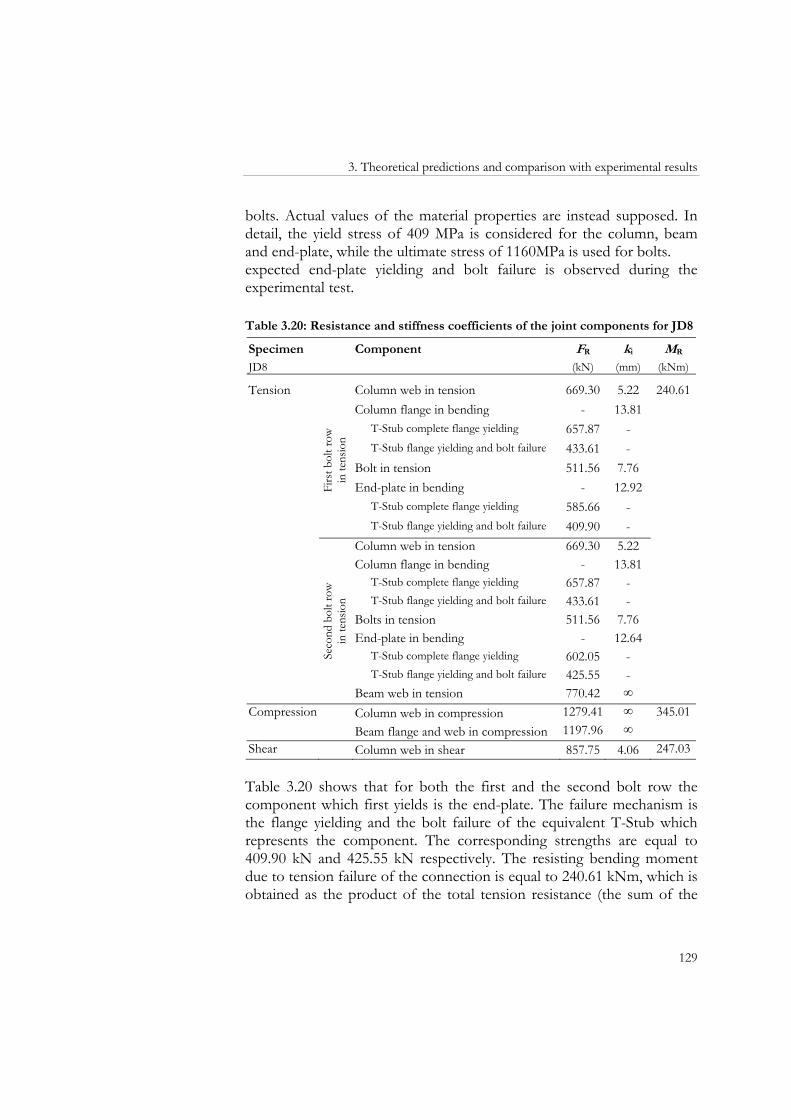
3. Theoretical predictions and comparison with experimental results
129
bolts. Actual values of the material properties are instead supposed. In detail, the yield stress of 409 MPa is considered for the column, beam and end-plate, while the ultimate stress of 1160MPa is used for bolts. expected end-plate yielding and bolt failure is observed during the experimental test. Table 3.20: Resistance and stiffness coefficients of the joint components for JD8
Specimen Component FR ki MR JD8 (kN) (mm) (kNm)
Tension
Firs
t bol
t row
in
tens
ion
Column web in tension 669.30 5.22 240.61Column flange in bending - 13.81
T-Stub complete flange yielding 657.87 - T-Stub flange yielding and bolt failure 433.61 -
Bolt in tension 511.56 7.76 End-plate in bending - 12.92
T-Stub complete flange yielding 585.66 - T-Stub flange yielding and bolt failure 409.90 -
Seco
nd b
olt r
ow
in te
nsio
n
Column web in tension 669.30 5.22 Column flange in bending - 13.81
T-Stub complete flange yielding 657.87 - T-Stub flange yielding and bolt failure 433.61 -
Bolts in tension 511.56 7.76 End-plate in bending - 12.64
T-Stub complete flange yielding 602.05 - T-Stub flange yielding and bolt failure 425.55 -
Beam web in tension 770.42 ∞ Compression Column web in compression 1279.41 ∞ 345.01
Beam flange and web in compression 1197.96 ∞ Shear Column web in shear 857.75 4.06 247.03 Table 3.20 shows that for both the first and the second bolt row the component which first yields is the end-plate. The failure mechanism is the flange yielding and the bolt failure of the equivalent T-Stub which represents the component. The corresponding strengths are equal to 409.90 kN and 425.55 kN respectively. The resisting bending moment due to tension failure of the connection is equal to 240.61 kNm, which is obtained as the product of the total tension resistance (the sum of the
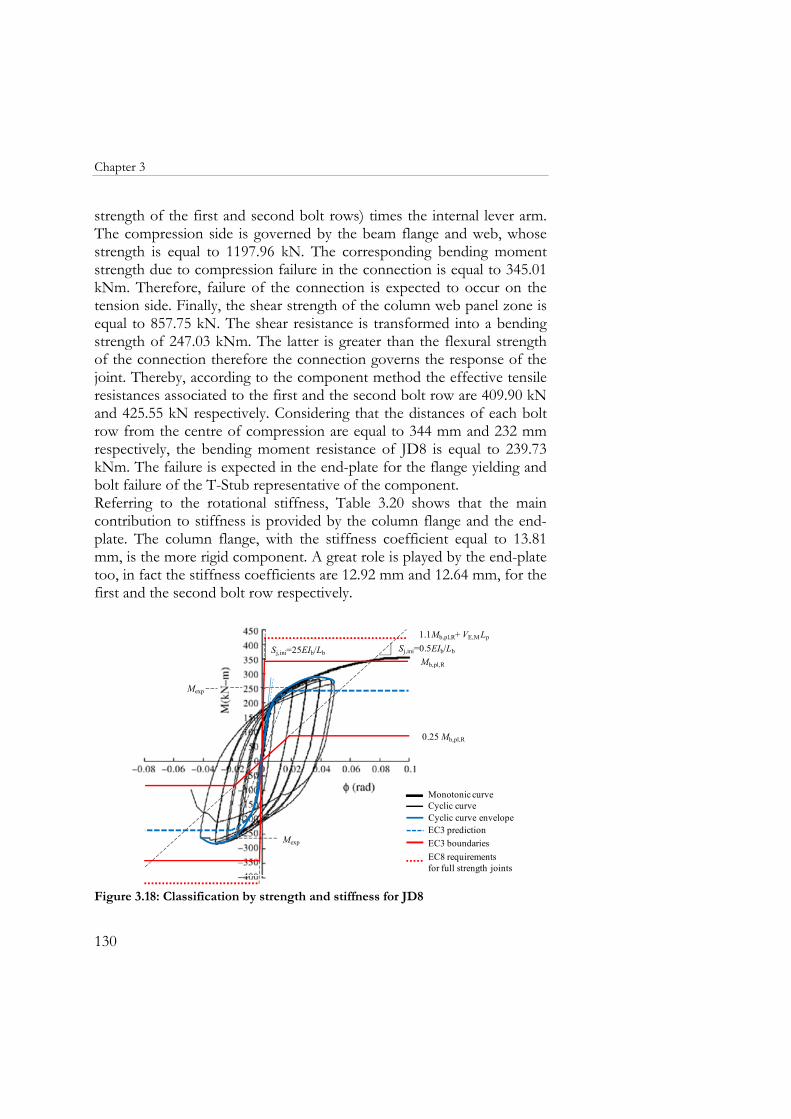
Chapter 3
130
strength of the first and second bolt rows) times the internal lever arm. The compression side is governed by the beam flange and web, whose strength is equal to 1197.96 kN. The corresponding bending moment strength due to compression failure in the connection is equal to 345.01 kNm. Therefore, failure of the connection is expected to occur on the tension side. Finally, the shear strength of the column web panel zone is equal to 857.75 kN. The shear resistance is transformed into a bending strength of 247.03 kNm. The latter is greater than the flexural strength of the connection therefore the connection governs the response of the joint. Thereby, according to the component method the effective tensile resistances associated to the first and the second bolt row are 409.90 kN and 425.55 kN respectively. Considering that the distances of each bolt row from the centre of compression are equal to 344 mm and 232 mm respectively, the bending moment resistance of JD8 is equal to 239.73 kNm. The failure is expected in the end-plate for the flange yielding and bolt failure of the T-Stub representative of the component. Referring to the rotational stiffness, Table 3.20 shows that the main contribution to stiffness is provided by the column flange and the end-plate. The column flange, with the stiffness coefficient equal to 13.81 mm, is the more rigid component. A great role is played by the end-plate too, in fact the stiffness coefficients are 12.92 mm and 12.64 mm, for the first and the second bolt row respectively.
Mb,pl,R
0.25 Mb,pl,R
1.1Mb,pl,R+ VE,M Lp
Mexp
Sj,ini=25EIb/Lb Sj,ini=0.5EIb/Lb
Mexp
Monotonic curveCyclic curve
EC3 boundariesEC8 requirements for full strength joints
EC3 predictionCyclic curve envelope
Figure 3.18: Classification by strength and stiffness for JD8
3. Theoretical predictions and comparison with experimental results
131
The column web in shear and the bolts in tension are the more flexible component. Their stiffness coefficients are 4.06 mm and 7.76 mm respectively. As a result JD8 initial rotational stiffness is equal to 35489.34 kNm/rad. Finally the yield rotation is equal to 6.75 mrad. The theoretical predictions are in agreement with the experimental results. The difference between the experimental values and the theoretical ones do not exceed 5%. The classification by strength and stiffness of JD8 according to the Eurocode 3 is given in Figure 3.18. The bending moment resistance is less than the beam plastic resistance therefore JD8 can classified as partial strength. Assuming for JD8 the beam span length equal to 2700 mm, according to classification by stiffness, the joint is semi-rigid.
3.2 FLUSH END-PLATE CONNECTIONS
3.2.1 Tests by Broderick and Thomson (2002)
3.2.1.1 Specimen EP1 Table 3.21 contains a synthesis of the application of the component method. Similarly to the end-plate connections, the joint components are grouped on the basis of the loading type (tension, compression and shear loading). For each component, the third and the fourth columns give the strength (FR) and the stiffness coefficient (ki), respectively. The last (fifth) column gives, for each component, the moment resistance (MR) evaluated as the product of the component strength (FR) times the internal lever arm. The calculations are based on the nominal geometrical properties of the specimen (Chapter 2). The resistance of each component consider the expected value of the steel yield stress and nominal ultimate strength of bolts. The expected value of the steel yield stress, equal to 316.25 MPa, takes into account of a material overstrength factor of 1.15. Table 3.21 shows that for the bolt row in tension the component which first yields is the end-plate. The failure mechanism is complete flange yielding of the equivalent T-Stub. The corresponding strength is equal to 121.44 kN. The moment resistance corresponding to tension failure of the connection is equal to 23.15 kNm. The beam flange and web governs the compression side, whose strength is equal to
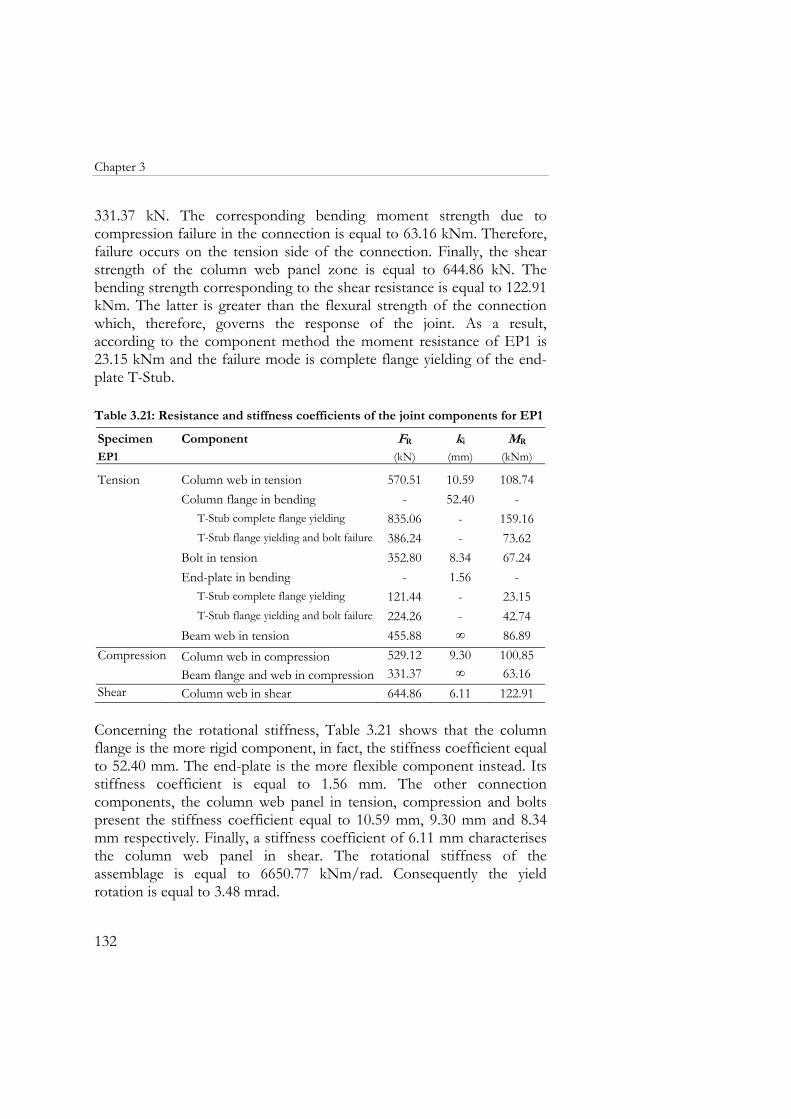
Chapter 3
132
331.37 kN. The corresponding bending moment strength due to compression failure in the connection is equal to 63.16 kNm. Therefore, failure occurs on the tension side of the connection. Finally, the shear strength of the column web panel zone is equal to 644.86 kN. The bending strength corresponding to the shear resistance is equal to 122.91 kNm. The latter is greater than the flexural strength of the connection which, therefore, governs the response of the joint. As a result, according to the component method the moment resistance of EP1 is 23.15 kNm and the failure mode is complete flange yielding of the end-plate T-Stub. Table 3.21: Resistance and stiffness coefficients of the joint components for EP1
Specimen Component FR ki MR
EP1 (kN) (mm) (kNm)
Tension
Column web in tension 570.51 10.59 108.74Column flange in bending - 52.40 -
T-Stub complete flange yielding 835.06 - 159.16T-Stub flange yielding and bolt failure 386.24 - 73.62
Bolt in tension 352.80 8.34 67.24End-plate in bending - 1.56 -
T-Stub complete flange yielding 121.44 - 23.15T-Stub flange yielding and bolt failure 224.26 - 42.74
Beam web in tension 455.88 ∞ 86.89Compression Column web in compression 529.12 9.30 100.85
Beam flange and web in compression 331.37 ∞ 63.16Shear Column web in shear 644.86 6.11 122.91 Concerning the rotational stiffness, Table 3.21 shows that the column flange is the more rigid component, in fact, the stiffness coefficient equal to 52.40 mm. The end-plate is the more flexible component instead. Its stiffness coefficient is equal to 1.56 mm. The other connection components, the column web panel in tension, compression and bolts present the stiffness coefficient equal to 10.59 mm, 9.30 mm and 8.34 mm respectively. Finally, a stiffness coefficient of 6.11 mm characterises the column web panel in shear. The rotational stiffness of the assemblage is equal to 6650.77 kNm/rad. Consequently the yield rotation is equal to 3.48 mrad.
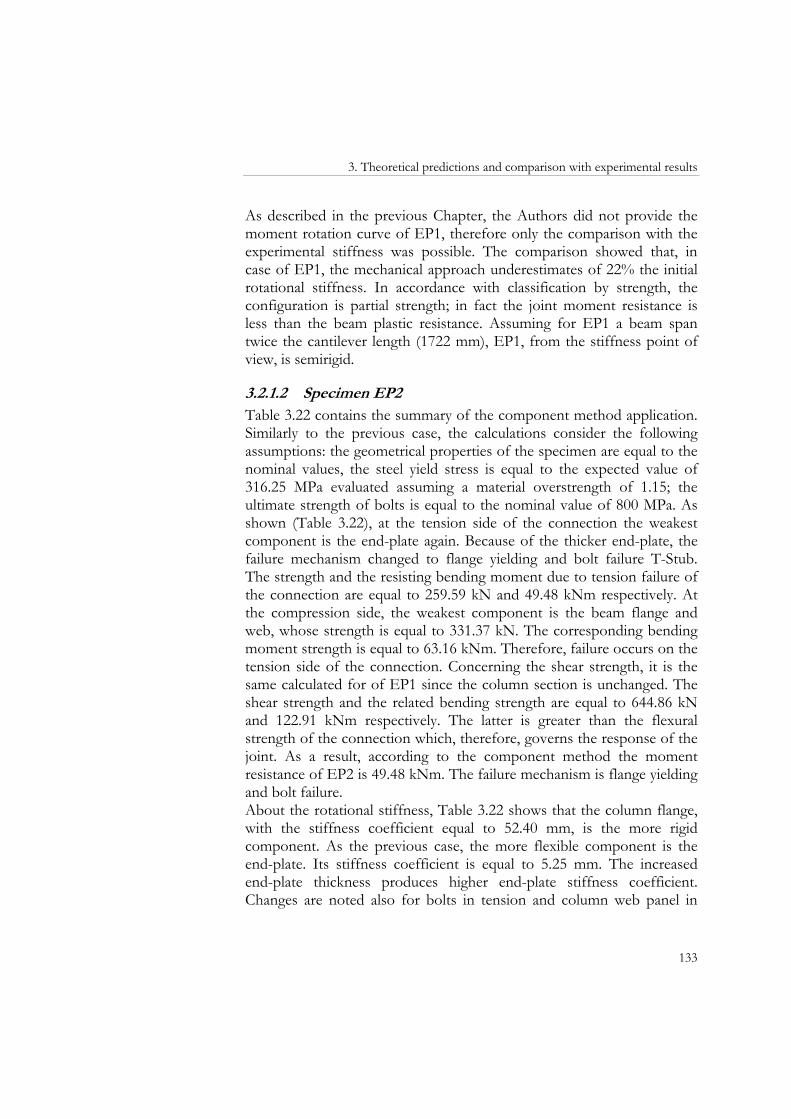
3. Theoretical predictions and comparison with experimental results
133
As described in the previous Chapter, the Authors did not provide the moment rotation curve of EP1, therefore only the comparison with the experimental stiffness was possible. The comparison showed that, in case of EP1, the mechanical approach underestimates of 22% the initial rotational stiffness. In accordance with classification by strength, the configuration is partial strength; in fact the joint moment resistance is less than the beam plastic resistance. Assuming for EP1 a beam span twice the cantilever length (1722 mm), EP1, from the stiffness point of view, is semirigid.
3.2.1.2 Specimen EP2 Table 3.22 contains the summary of the component method application. Similarly to the previous case, the calculations consider the following assumptions: the geometrical properties of the specimen are equal to the nominal values, the steel yield stress is equal to the expected value of 316.25 MPa evaluated assuming a material overstrength of 1.15; the ultimate strength of bolts is equal to the nominal value of 800 MPa. As shown (Table 3.22), at the tension side of the connection the weakest component is the end-plate again. Because of the thicker end-plate, the failure mechanism changed to flange yielding and bolt failure T-Stub. The strength and the resisting bending moment due to tension failure of the connection are equal to 259.59 kN and 49.48 kNm respectively. At the compression side, the weakest component is the beam flange and web, whose strength is equal to 331.37 kN. The corresponding bending moment strength is equal to 63.16 kNm. Therefore, failure occurs on the tension side of the connection. Concerning the shear strength, it is the same calculated for of EP1 since the column section is unchanged. The shear strength and the related bending strength are equal to 644.86 kN and 122.91 kNm respectively. The latter is greater than the flexural strength of the connection which, therefore, governs the response of the joint. As a result, according to the component method the moment resistance of EP2 is 49.48 kNm. The failure mechanism is flange yielding and bolt failure. About the rotational stiffness, Table 3.22 shows that the column flange, with the stiffness coefficient equal to 52.40 mm, is the more rigid component. As the previous case, the more flexible component is the end-plate. Its stiffness coefficient is equal to 5.25 mm. The increased end-plate thickness produces higher end-plate stiffness coefficient. Changes are noted also for bolts in tension and column web panel in
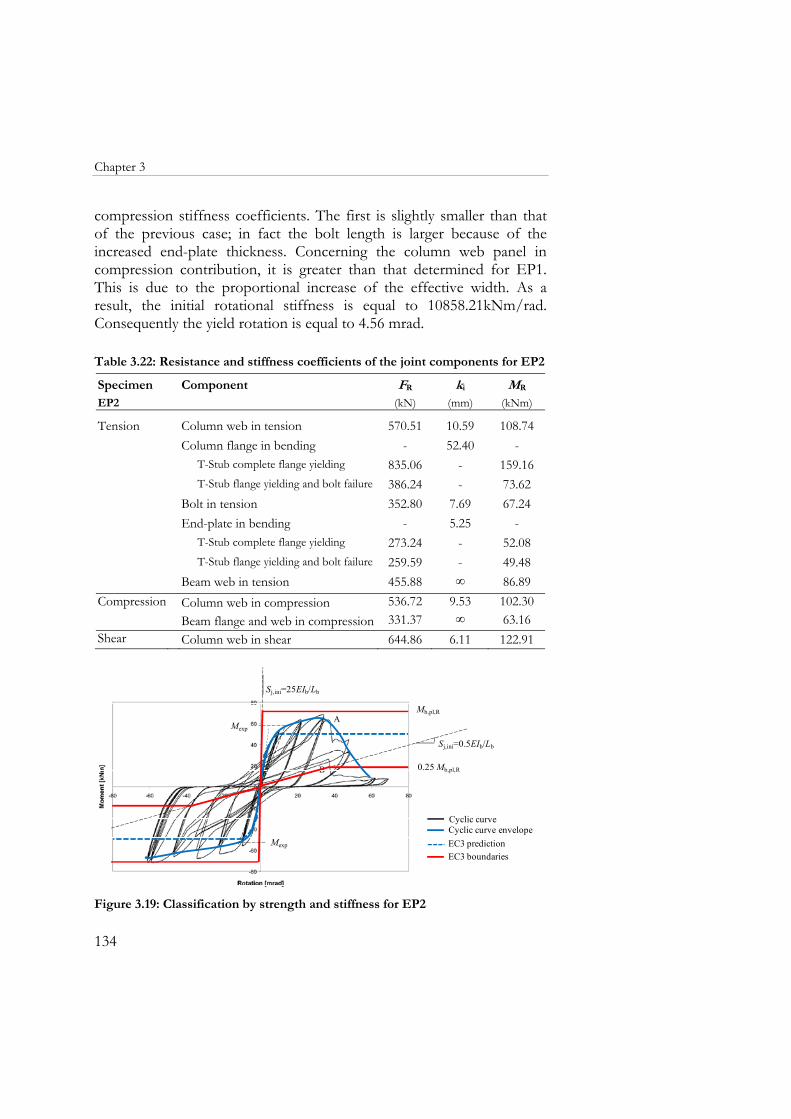
Chapter 3
134
compression stiffness coefficients. The first is slightly smaller than that of the previous case; in fact the bolt length is larger because of the increased end-plate thickness. Concerning the column web panel in compression contribution, it is greater than that determined for EP1. This is due to the proportional increase of the effective width. As a result, the initial rotational stiffness is equal to 10858.21kNm/rad. Consequently the yield rotation is equal to 4.56 mrad. Table 3.22: Resistance and stiffness coefficients of the joint components for EP2
Specimen Component FR ki MR
EP2 (kN) (mm) (kNm)
Tension
Column web in tension 570.51 10.59 108.74Column flange in bending - 52.40 -
T-Stub complete flange yielding 835.06 - 159.16T-Stub flange yielding and bolt failure 386.24 - 73.62
Bolt in tension 352.80 7.69 67.24End-plate in bending - 5.25 -
T-Stub complete flange yielding 273.24 - 52.08T-Stub flange yielding and bolt failure 259.59 - 49.48
Beam web in tension 455.88 ∞ 86.89Compression Column web in compression 536.72 9.53 102.30
Beam flange and web in compression 331.37 ∞ 63.16Shear Column web in shear 644.86 6.11 122.91
Cyclic curve
EC3 boundariesEC3 predictionCyclic curve envelope
Mexp
Sj,ini=0.5EIb/Lb
Sj,ini=25EIb/Lb
Mb,pl,R
0.25 Mb,pl,R
Mexp
Figure 3.19: Classification by strength and stiffness for EP2
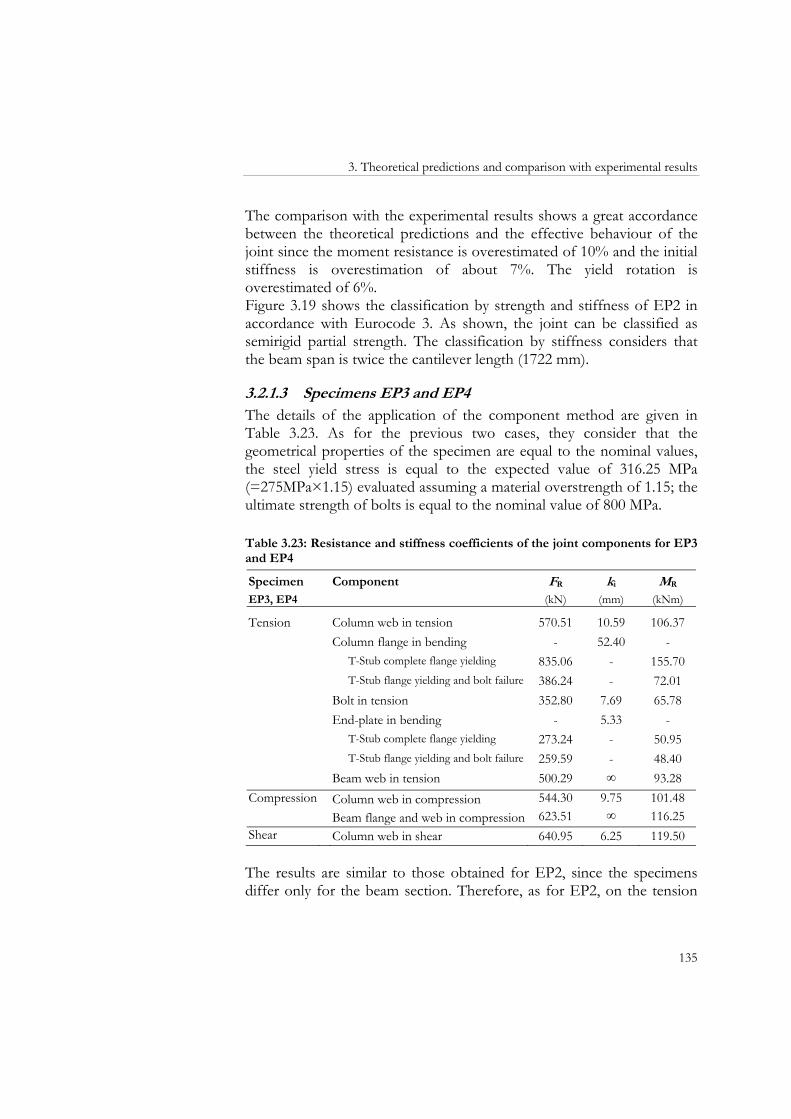
3. Theoretical predictions and comparison with experimental results
135
The comparison with the experimental results shows a great accordance between the theoretical predictions and the effective behaviour of the joint since the moment resistance is overestimated of 10% and the initial stiffness is overestimation of about 7%. The yield rotation is overestimated of 6%. Figure 3.19 shows the classification by strength and stiffness of EP2 in accordance with Eurocode 3. As shown, the joint can be classified as semirigid partial strength. The classification by stiffness considers that the beam span is twice the cantilever length (1722 mm).
3.2.1.3 Specimens EP3 and EP4 The details of the application of the component method are given in Table 3.23. As for the previous two cases, they consider that the geometrical properties of the specimen are equal to the nominal values, the steel yield stress is equal to the expected value of 316.25 MPa (=275MPa×1.15) evaluated assuming a material overstrength of 1.15; the ultimate strength of bolts is equal to the nominal value of 800 MPa. Table 3.23: Resistance and stiffness coefficients of the joint components for EP3 and EP4
Specimen Component FR ki MR
EP3, EP4 (kN) (mm) (kNm)
Tension
Column web in tension 570.51 10.59 106.37Column flange in bending - 52.40 -
T-Stub complete flange yielding 835.06 - 155.70T-Stub flange yielding and bolt failure 386.24 - 72.01
Bolt in tension 352.80 7.69 65.78End-plate in bending - 5.33 -
T-Stub complete flange yielding 273.24 - 50.95T-Stub flange yielding and bolt failure 259.59 - 48.40
Beam web in tension 500.29 ∞ 93.28Compression Column web in compression 544.30 9.75 101.48
Beam flange and web in compression 623.51 ∞ 116.25Shear Column web in shear 640.95 6.25 119.50 The results are similar to those obtained for EP2, since the specimens differ only for the beam section. Therefore, as for EP2, on the tension
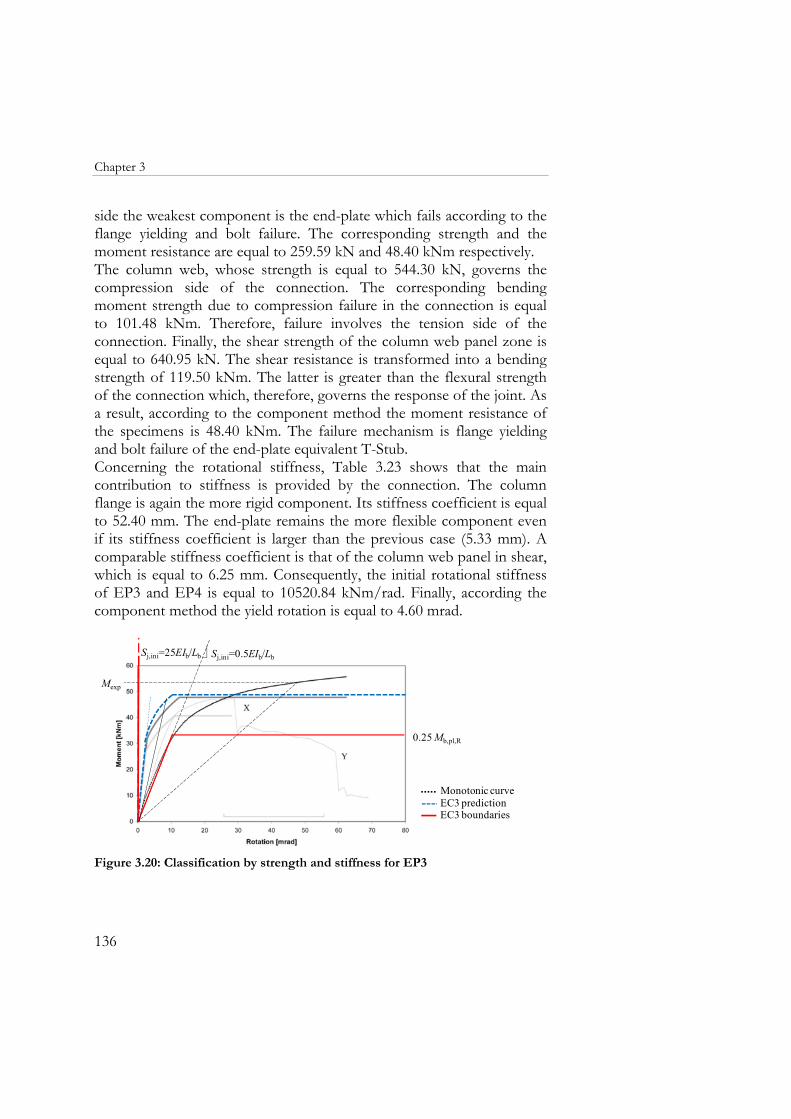
Chapter 3
136
side the weakest component is the end-plate which fails according to the flange yielding and bolt failure. The corresponding strength and the moment resistance are equal to 259.59 kN and 48.40 kNm respectively. The column web, whose strength is equal to 544.30 kN, governs the compression side of the connection. The corresponding bending moment strength due to compression failure in the connection is equal to 101.48 kNm. Therefore, failure involves the tension side of the connection. Finally, the shear strength of the column web panel zone is equal to 640.95 kN. The shear resistance is transformed into a bending strength of 119.50 kNm. The latter is greater than the flexural strength of the connection which, therefore, governs the response of the joint. As a result, according to the component method the moment resistance of the specimens is 48.40 kNm. The failure mechanism is flange yielding and bolt failure of the end-plate equivalent T-Stub. Concerning the rotational stiffness, Table 3.23 shows that the main contribution to stiffness is provided by the connection. The column flange is again the more rigid component. Its stiffness coefficient is equal to 52.40 mm. The end-plate remains the more flexible component even if its stiffness coefficient is larger than the previous case (5.33 mm). A comparable stiffness coefficient is that of the column web panel in shear, which is equal to 6.25 mm. Consequently, the initial rotational stiffness of EP3 and EP4 is equal to 10520.84 kNm/rad. Finally, according the component method the yield rotation is equal to 4.60 mrad.
Mexp
EC3 boundariesEC3 predictionMonotonic curve
Sj,ini=0.5EIb/Lb
0.25 Mb,pl,R
Sj,ini=25EIb/Lb
Figure 3.20: Classification by strength and stiffness for EP3
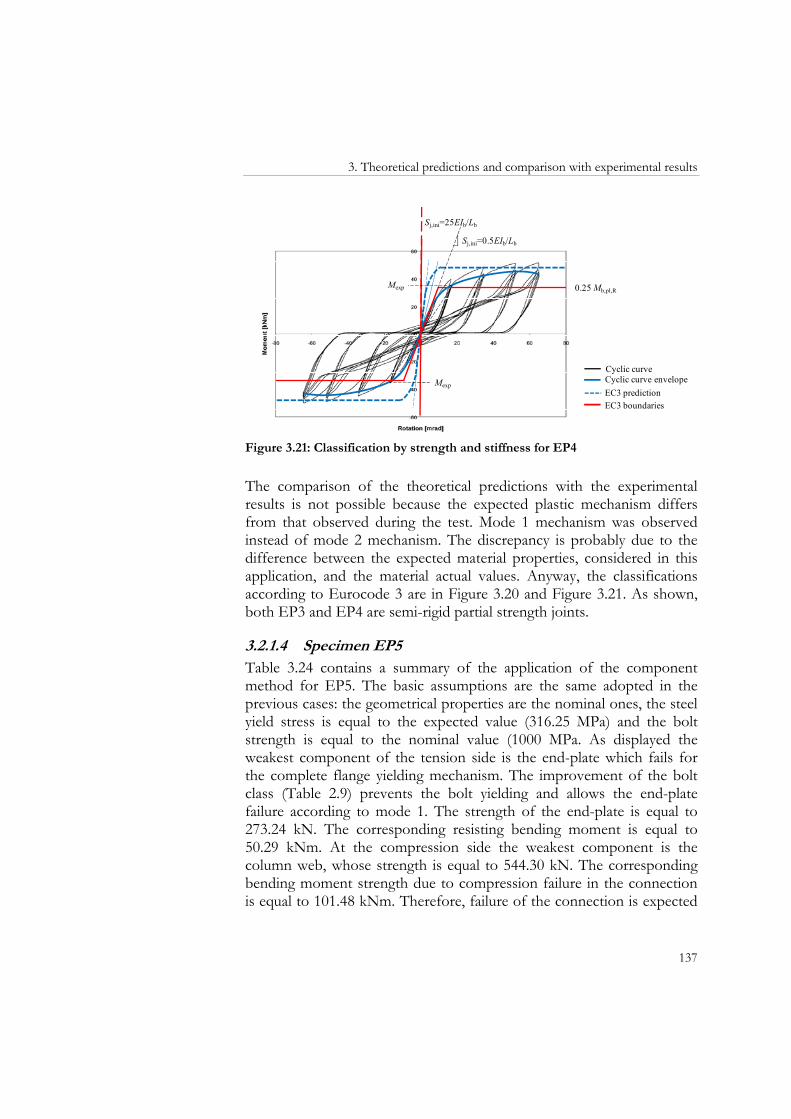
3. Theoretical predictions and comparison with experimental results
137
Cyclic curve
EC3 boundariesEC3 predictionCyclic curve envelope
Sj,ini=0.5EIb/Lb
0.25 Mb,pl,R
Sj,ini=25EIb/Lb
Mexp
Mexp
Figure 3.21: Classification by strength and stiffness for EP4
The comparison of the theoretical predictions with the experimental results is not possible because the expected plastic mechanism differs from that observed during the test. Mode 1 mechanism was observed instead of mode 2 mechanism. The discrepancy is probably due to the difference between the expected material properties, considered in this application, and the material actual values. Anyway, the classifications according to Eurocode 3 are in Figure 3.20 and Figure 3.21. As shown, both EP3 and EP4 are semi-rigid partial strength joints.
3.2.1.4 Specimen EP5 Table 3.24 contains a summary of the application of the component method for EP5. The basic assumptions are the same adopted in the previous cases: the geometrical properties are the nominal ones, the steel yield stress is equal to the expected value (316.25 MPa) and the bolt strength is equal to the nominal value (1000 MPa. As displayed the weakest component of the tension side is the end-plate which fails for the complete flange yielding mechanism. The improvement of the bolt class (Table 2.9) prevents the bolt yielding and allows the end-plate failure according to mode 1. The strength of the end-plate is equal to 273.24 kN. The corresponding resisting bending moment is equal to 50.29 kNm. At the compression side the weakest component is the column web, whose strength is equal to 544.30 kN. The corresponding bending moment strength due to compression failure in the connection is equal to 101.48 kNm. Therefore, failure of the connection is expected
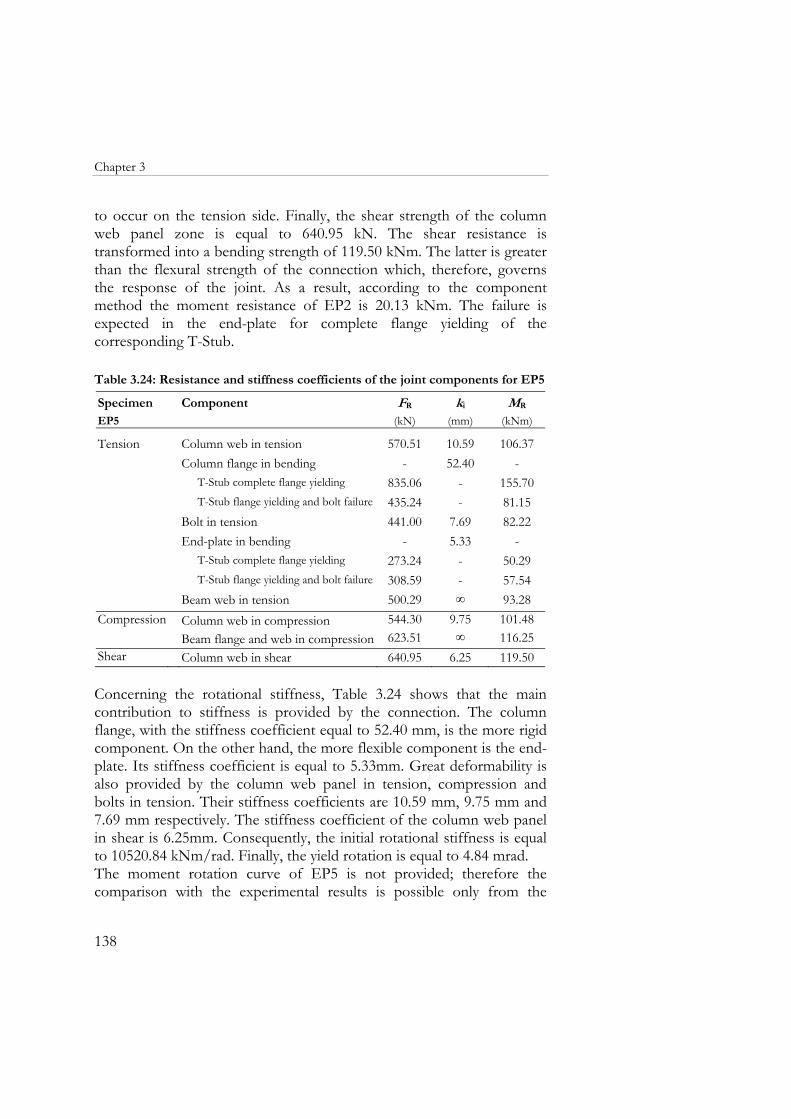
Chapter 3
138
to occur on the tension side. Finally, the shear strength of the column web panel zone is equal to 640.95 kN. The shear resistance is transformed into a bending strength of 119.50 kNm. The latter is greater than the flexural strength of the connection which, therefore, governs the response of the joint. As a result, according to the component method the moment resistance of EP2 is 20.13 kNm. The failure is expected in the end-plate for complete flange yielding of the corresponding T-Stub. Table 3.24: Resistance and stiffness coefficients of the joint components for EP5
Specimen Component FR ki MR
EP5 (kN) (mm) (kNm)
Tension
Column web in tension 570.51 10.59 106.37Column flange in bending - 52.40 -
T-Stub complete flange yielding 835.06 - 155.70T-Stub flange yielding and bolt failure 435.24 - 81.15
Bolt in tension 441.00 7.69 82.22End-plate in bending - 5.33 -
T-Stub complete flange yielding 273.24 - 50.29T-Stub flange yielding and bolt failure 308.59 - 57.54
Beam web in tension 500.29 ∞ 93.28Compression Column web in compression 544.30 9.75 101.48
Beam flange and web in compression 623.51 ∞ 116.25Shear Column web in shear 640.95 6.25 119.50 Concerning the rotational stiffness, Table 3.24 shows that the main contribution to stiffness is provided by the connection. The column flange, with the stiffness coefficient equal to 52.40 mm, is the more rigid component. On the other hand, the more flexible component is the end-plate. Its stiffness coefficient is equal to 5.33mm. Great deformability is also provided by the column web panel in tension, compression and bolts in tension. Their stiffness coefficients are 10.59 mm, 9.75 mm and 7.69 mm respectively. The stiffness coefficient of the column web panel in shear is 6.25mm. Consequently, the initial rotational stiffness is equal to 10520.84 kNm/rad. Finally, the yield rotation is equal to 4.84 mrad. The moment rotation curve of EP5 is not provided; therefore the comparison with the experimental results is possible only from the
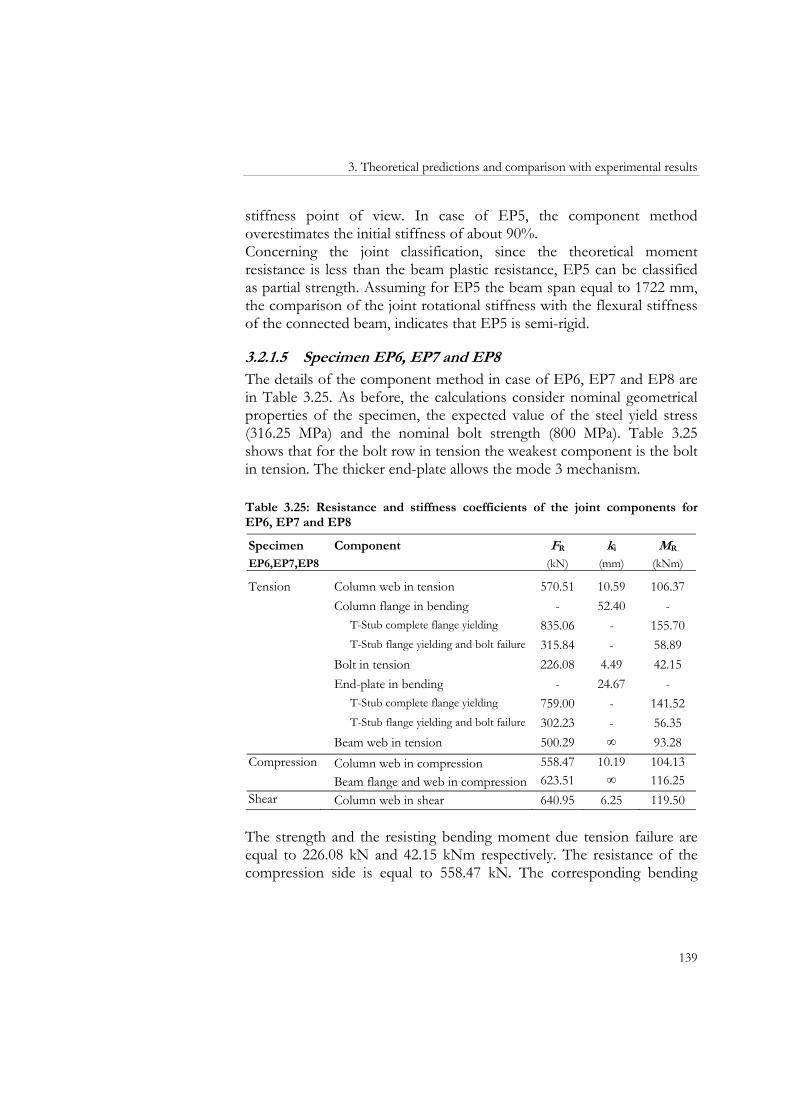
3. Theoretical predictions and comparison with experimental results
139
stiffness point of view. In case of EP5, the component method overestimates the initial stiffness of about 90%. Concerning the joint classification, since the theoretical moment resistance is less than the beam plastic resistance, EP5 can be classified as partial strength. Assuming for EP5 the beam span equal to 1722 mm, the comparison of the joint rotational stiffness with the flexural stiffness of the connected beam, indicates that EP5 is semi-rigid.
3.2.1.5 Specimen EP6, EP7 and EP8 The details of the component method in case of EP6, EP7 and EP8 are in Table 3.25. As before, the calculations consider nominal geometrical properties of the specimen, the expected value of the steel yield stress (316.25 MPa) and the nominal bolt strength (800 MPa). Table 3.25 shows that for the bolt row in tension the weakest component is the bolt in tension. The thicker end-plate allows the mode 3 mechanism. Table 3.25: Resistance and stiffness coefficients of the joint components for EP6, EP7 and EP8
Specimen Component FR ki MR
EP6,EP7,EP8 (kN) (mm) (kNm)
Tension
Column web in tension 570.51 10.59 106.37Column flange in bending - 52.40 -
T-Stub complete flange yielding 835.06 - 155.70T-Stub flange yielding and bolt failure 315.84 - 58.89
Bolt in tension 226.08 4.49 42.15End-plate in bending - 24.67 -
T-Stub complete flange yielding 759.00 - 141.52T-Stub flange yielding and bolt failure 302.23 - 56.35
Beam web in tension 500.29 ∞ 93.28Compression Column web in compression 558.47 10.19 104.13
Beam flange and web in compression 623.51 ∞ 116.25Shear Column web in shear 640.95 6.25 119.50 The strength and the resisting bending moment due tension failure are equal to 226.08 kN and 42.15 kNm respectively. The resistance of the compression side is equal to 558.47 kN. The corresponding bending
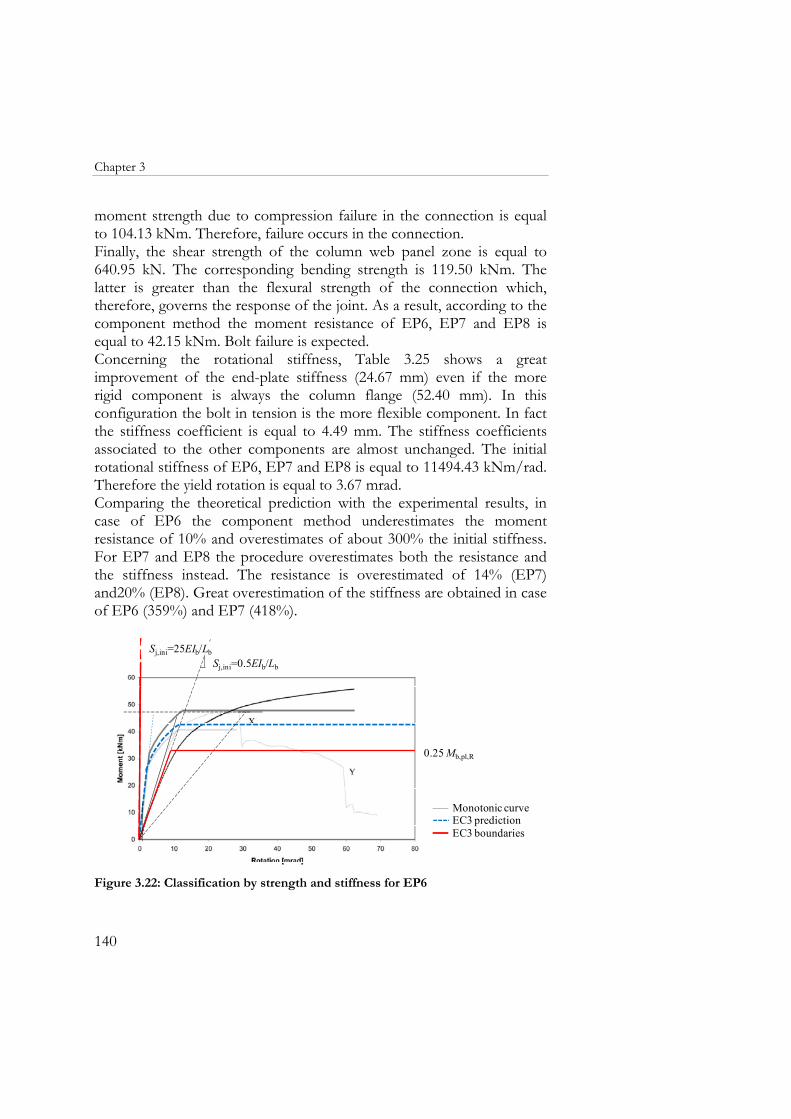
Chapter 3
140
moment strength due to compression failure in the connection is equal to 104.13 kNm. Therefore, failure occurs in the connection. Finally, the shear strength of the column web panel zone is equal to 640.95 kN. The corresponding bending strength is 119.50 kNm. The latter is greater than the flexural strength of the connection which, therefore, governs the response of the joint. As a result, according to the component method the moment resistance of EP6, EP7 and EP8 is equal to 42.15 kNm. Bolt failure is expected. Concerning the rotational stiffness, Table 3.25 shows a great improvement of the end-plate stiffness (24.67 mm) even if the more rigid component is always the column flange (52.40 mm). In this configuration the bolt in tension is the more flexible component. In fact the stiffness coefficient is equal to 4.49 mm. The stiffness coefficients associated to the other components are almost unchanged. The initial rotational stiffness of EP6, EP7 and EP8 is equal to 11494.43 kNm/rad. Therefore the yield rotation is equal to 3.67 mrad. Comparing the theoretical prediction with the experimental results, in case of EP6 the component method underestimates the moment resistance of 10% and overestimates of about 300% the initial stiffness. For EP7 and EP8 the procedure overestimates both the resistance and the stiffness instead. The resistance is overestimated of 14% (EP7) and20% (EP8). Great overestimation of the stiffness are obtained in case of EP6 (359%) and EP7 (418%).
EC3 boundariesEC3 predictionMonotonic curve
0.25 Mb,pl,R
Sj,ini=0.5EIb/Lb
Sj,ini=25EIb/Lb
Figure 3.22: Classification by strength and stiffness for EP6
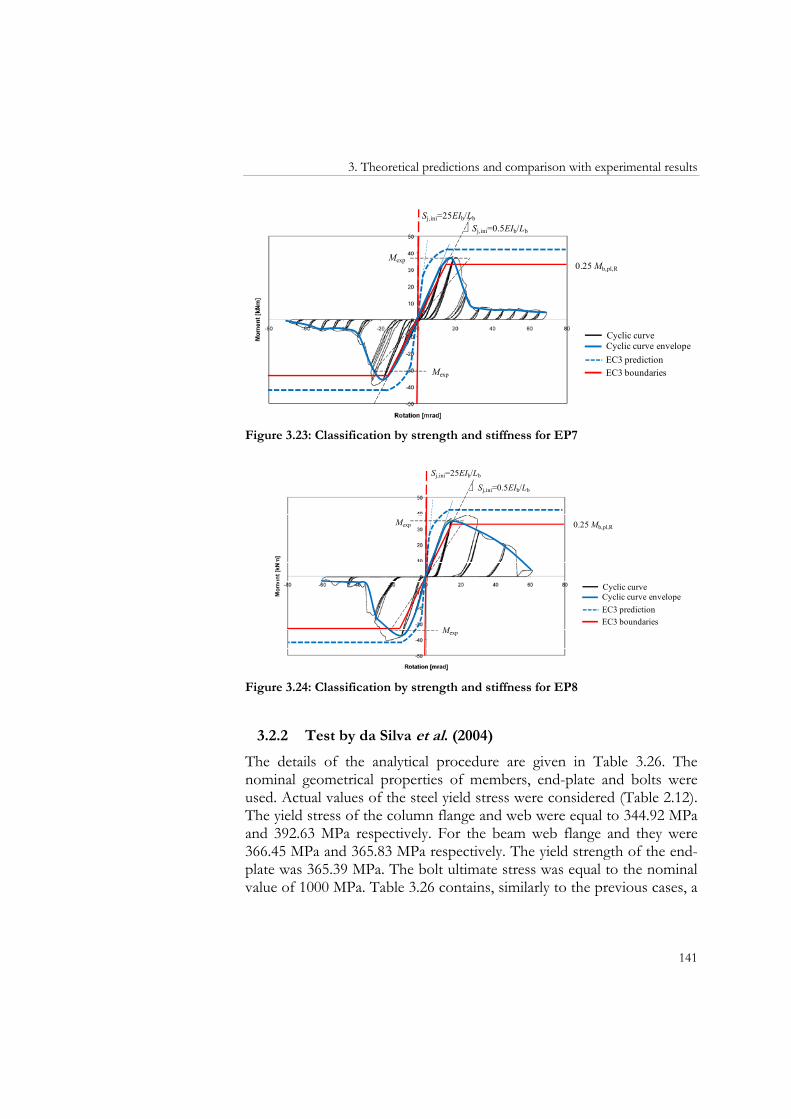
3. Theoretical predictions and comparison with experimental results
141
Sj,ini=25EIb/Lb
Sj,ini=0.5EIb/Lb
Mexp
Cyclic curve
EC3 boundariesEC3 predictionCyclic curve envelope
0.25 Mb,pl,R
Mexp
Figure 3.23: Classification by strength and stiffness for EP7
Sj,ini=25EIb/Lb
Sj,ini=0.5EIb/Lb
Cyclic curve
EC3 boundariesEC3 predictionCyclic curve envelope
0.25 Mb,pl,RMexp
Mexp
Figure 3.24: Classification by strength and stiffness for EP8
3.2.2 Test by da Silva et al. (2004)
The details of the analytical procedure are given in Table 3.26. The nominal geometrical properties of members, end-plate and bolts were used. Actual values of the steel yield stress were considered (Table 2.12). The yield stress of the column flange and web were equal to 344.92 MPa and 392.63 MPa respectively. For the beam web flange and they were 366.45 MPa and 365.83 MPa respectively. The yield strength of the end-plate was 365.39 MPa. The bolt ultimate stress was equal to the nominal value of 1000 MPa. Table 3.26 contains, similarly to the previous cases, a
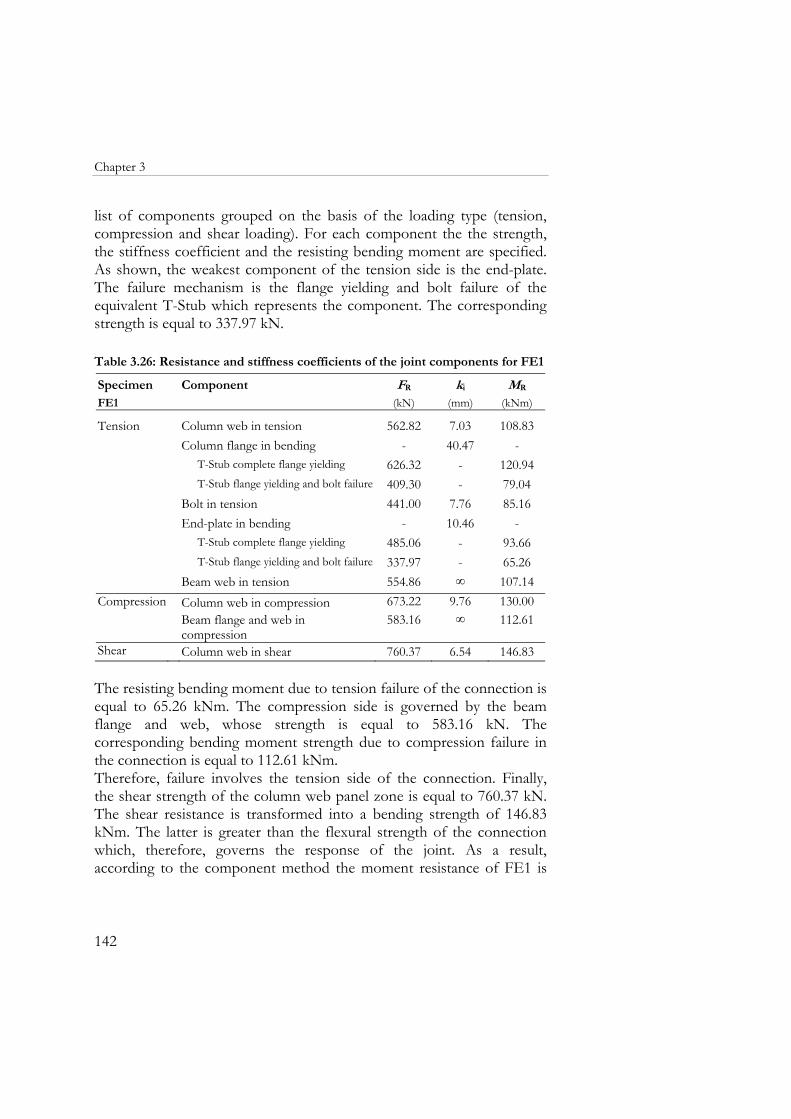
Chapter 3
142
list of components grouped on the basis of the loading type (tension, compression and shear loading). For each component the the strength, the stiffness coefficient and the resisting bending moment are specified. As shown, the weakest component of the tension side is the end-plate. The failure mechanism is the flange yielding and bolt failure of the equivalent T-Stub which represents the component. The corresponding strength is equal to 337.97 kN. Table 3.26: Resistance and stiffness coefficients of the joint components for FE1
Specimen Component FR ki MR
FE1 (kN) (mm) (kNm)
Tension
Column web in tension 562.82 7.03 108.83Column flange in bending - 40.47 -
T-Stub complete flange yielding 626.32 - 120.94T-Stub flange yielding and bolt failure 409.30 - 79.04
Bolt in tension 441.00 7.76 85.16End-plate in bending - 10.46 -
T-Stub complete flange yielding 485.06 - 93.66T-Stub flange yielding and bolt failure 337.97 - 65.26
Beam web in tension 554.86 ∞ 107.14Compression Column web in compression 673.22 9.76 130.00
Beam flange and web in compression
583.16 ∞ 112.61
Shear Column web in shear 760.37 6.54 146.83 The resisting bending moment due to tension failure of the connection is equal to 65.26 kNm. The compression side is governed by the beam flange and web, whose strength is equal to 583.16 kN. The corresponding bending moment strength due to compression failure in the connection is equal to 112.61 kNm. Therefore, failure involves the tension side of the connection. Finally, the shear strength of the column web panel zone is equal to 760.37 kN. The shear resistance is transformed into a bending strength of 146.83 kNm. The latter is greater than the flexural strength of the connection which, therefore, governs the response of the joint. As a result, according to the component method the moment resistance of FE1 is
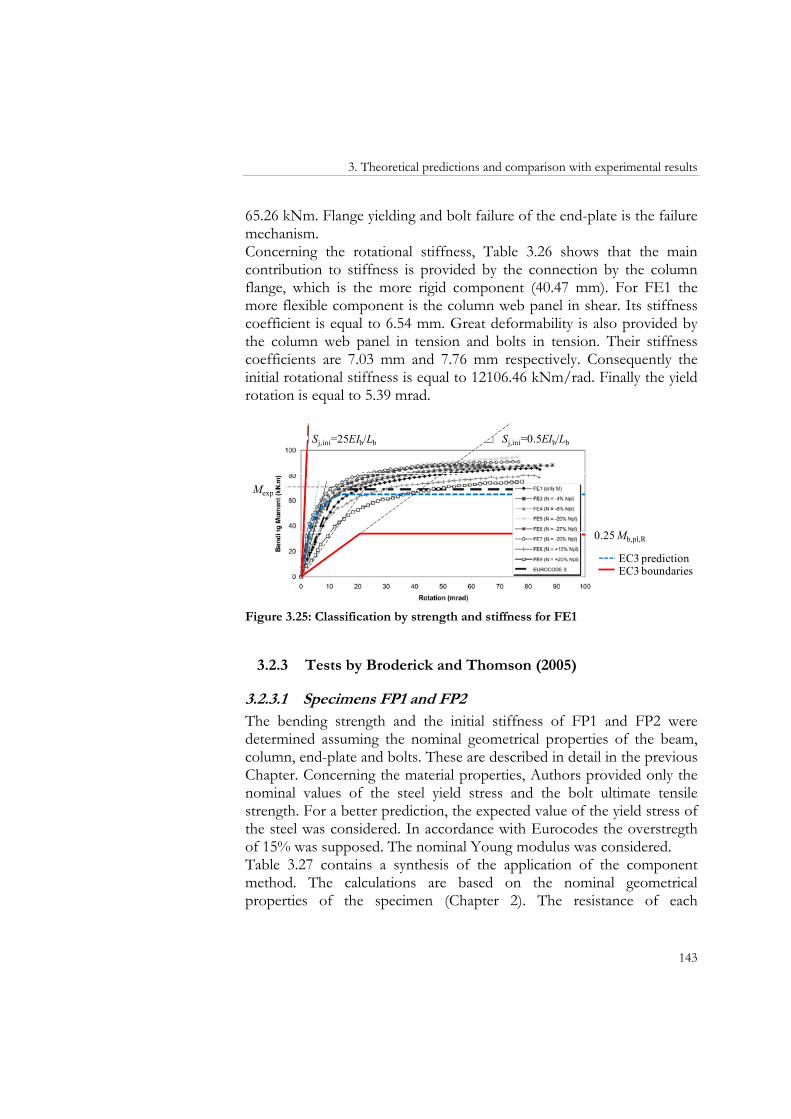
3. Theoretical predictions and comparison with experimental results
143
65.26 kNm. Flange yielding and bolt failure of the end-plate is the failure mechanism. Concerning the rotational stiffness, Table 3.26 shows that the main contribution to stiffness is provided by the connection by the column flange, which is the more rigid component (40.47 mm). For FE1 the more flexible component is the column web panel in shear. Its stiffness coefficient is equal to 6.54 mm. Great deformability is also provided by the column web panel in tension and bolts in tension. Their stiffness coefficients are 7.03 mm and 7.76 mm respectively. Consequently the initial rotational stiffness is equal to 12106.46 kNm/rad. Finally the yield rotation is equal to 5.39 mrad.
EC3 boundariesEC3 prediction
0.25 Mb,pl,R
Sj,ini=25EIb/Lb Sj,ini=0.5EIb/Lb
Mexp
Figure 3.25: Classification by strength and stiffness for FE1
3.2.3 Tests by Broderick and Thomson (2005)
3.2.3.1 Specimens FP1 and FP2 The bending strength and the initial stiffness of FP1 and FP2 were determined assuming the nominal geometrical properties of the beam, column, end-plate and bolts. These are described in detail in the previous Chapter. Concerning the material properties, Authors provided only the nominal values of the steel yield stress and the bolt ultimate tensile strength. For a better prediction, the expected value of the yield stress of the steel was considered. In accordance with Eurocodes the overstregth of 15% was supposed. The nominal Young modulus was considered. Table 3.27 contains a synthesis of the application of the component method. The calculations are based on the nominal geometrical properties of the specimen (Chapter 2). The resistance of each
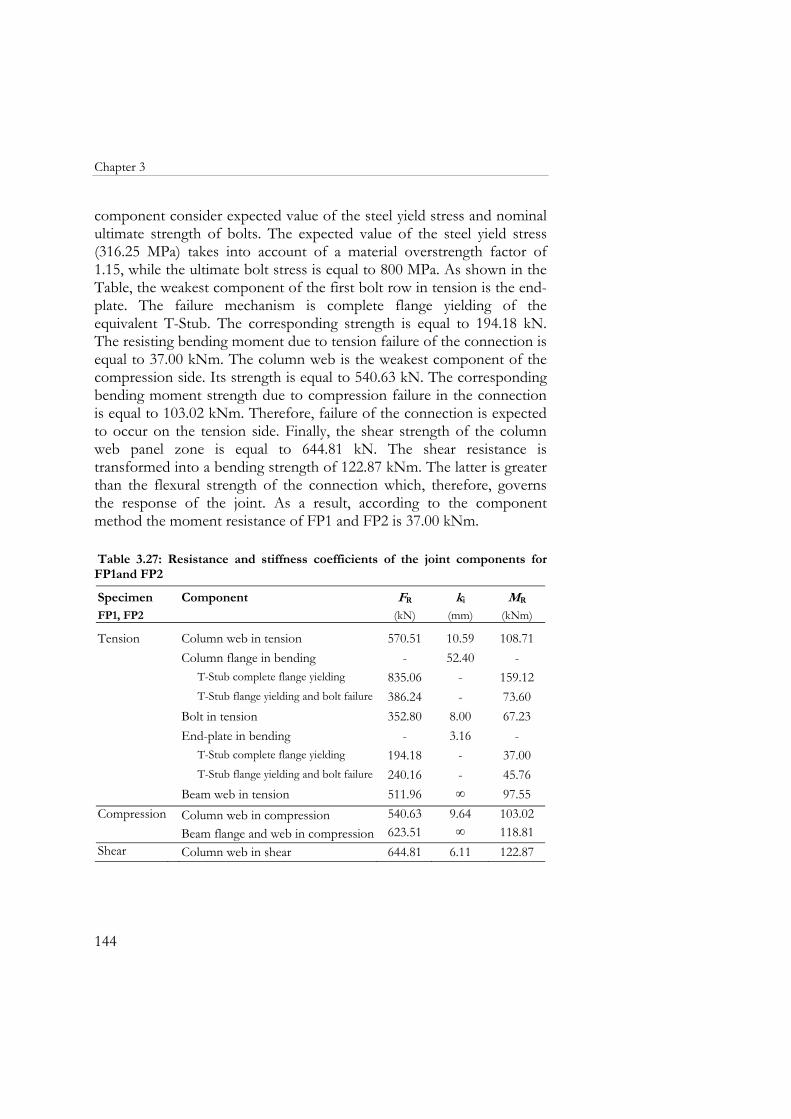
Chapter 3
144
component consider expected value of the steel yield stress and nominal ultimate strength of bolts. The expected value of the steel yield stress (316.25 MPa) takes into account of a material overstrength factor of 1.15, while the ultimate bolt stress is equal to 800 MPa. As shown in the Table, the weakest component of the first bolt row in tension is the end-plate. The failure mechanism is complete flange yielding of the equivalent T-Stub. The corresponding strength is equal to 194.18 kN. The resisting bending moment due to tension failure of the connection is equal to 37.00 kNm. The column web is the weakest component of the compression side. Its strength is equal to 540.63 kN. The corresponding bending moment strength due to compression failure in the connection is equal to 103.02 kNm. Therefore, failure of the connection is expected to occur on the tension side. Finally, the shear strength of the column web panel zone is equal to 644.81 kN. The shear resistance is transformed into a bending strength of 122.87 kNm. The latter is greater than the flexural strength of the connection which, therefore, governs the response of the joint. As a result, according to the component method the moment resistance of FP1 and FP2 is 37.00 kNm. Table 3.27: Resistance and stiffness coefficients of the joint components for FP1and FP2
Specimen Component FR ki MR
FP1, FP2 (kN) (mm) (kNm)
Tension
Column web in tension 570.51 10.59 108.71Column flange in bending - 52.40 -
T-Stub complete flange yielding 835.06 - 159.12T-Stub flange yielding and bolt failure 386.24 - 73.60
Bolt in tension 352.80 8.00 67.23End-plate in bending - 3.16 -
T-Stub complete flange yielding 194.18 - 37.00T-Stub flange yielding and bolt failure 240.16 - 45.76
Beam web in tension 511.96 ∞ 97.55Compression Column web in compression 540.63 9.64 103.02
Beam flange and web in compression 623.51 ∞ 118.81Shear Column web in shear 644.81 6.11 122.87
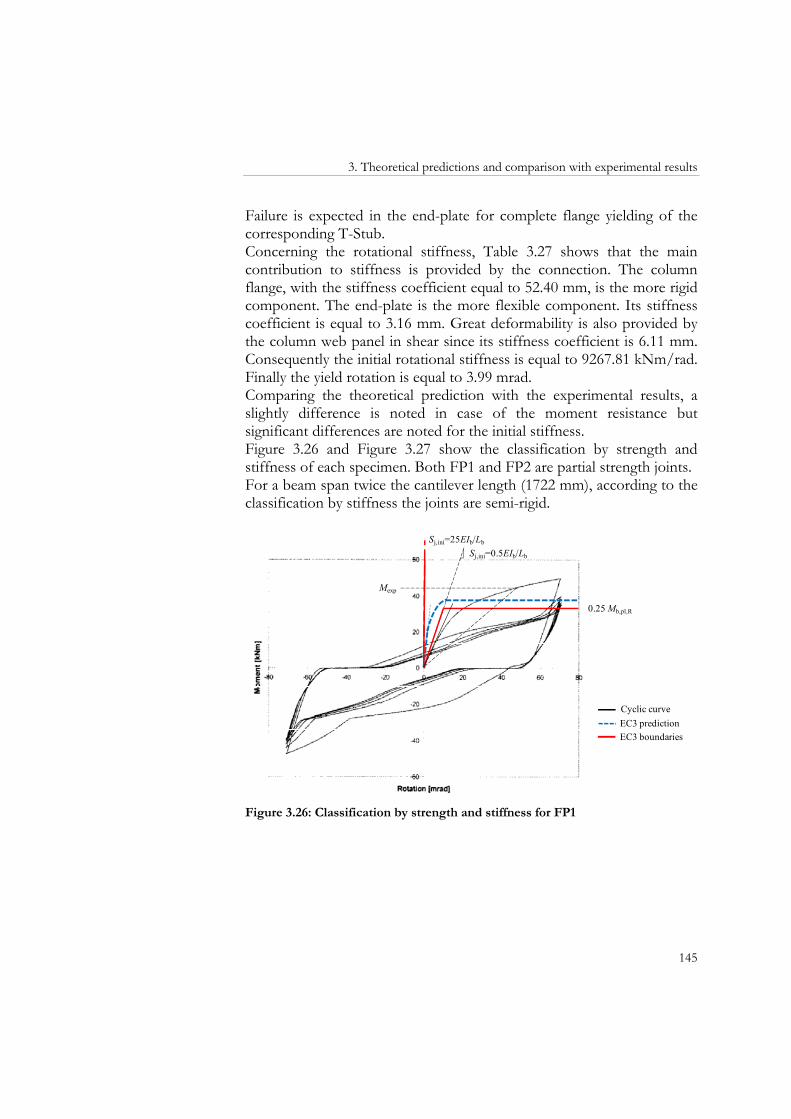
3. Theoretical predictions and comparison with experimental results
145
Failure is expected in the end-plate for complete flange yielding of the corresponding T-Stub. Concerning the rotational stiffness, Table 3.27 shows that the main contribution to stiffness is provided by the connection. The column flange, with the stiffness coefficient equal to 52.40 mm, is the more rigid component. The end-plate is the more flexible component. Its stiffness coefficient is equal to 3.16 mm. Great deformability is also provided by the column web panel in shear since its stiffness coefficient is 6.11 mm. Consequently the initial rotational stiffness is equal to 9267.81 kNm/rad. Finally the yield rotation is equal to 3.99 mrad. Comparing the theoretical prediction with the experimental results, a slightly difference is noted in case of the moment resistance but significant differences are noted for the initial stiffness. Figure 3.26 and Figure 3.27 show the classification by strength and stiffness of each specimen. Both FP1 and FP2 are partial strength joints. For a beam span twice the cantilever length (1722 mm), according to the classification by stiffness the joints are semi-rigid.
Cyclic curve
EC3 boundariesEC3 prediction
Mexp
0.25 Mb,pl,R
Sj,ini=25EIb/Lb
Sj,ini=0.5EIb/Lb
Figure 3.26: Classification by strength and stiffness for FP1
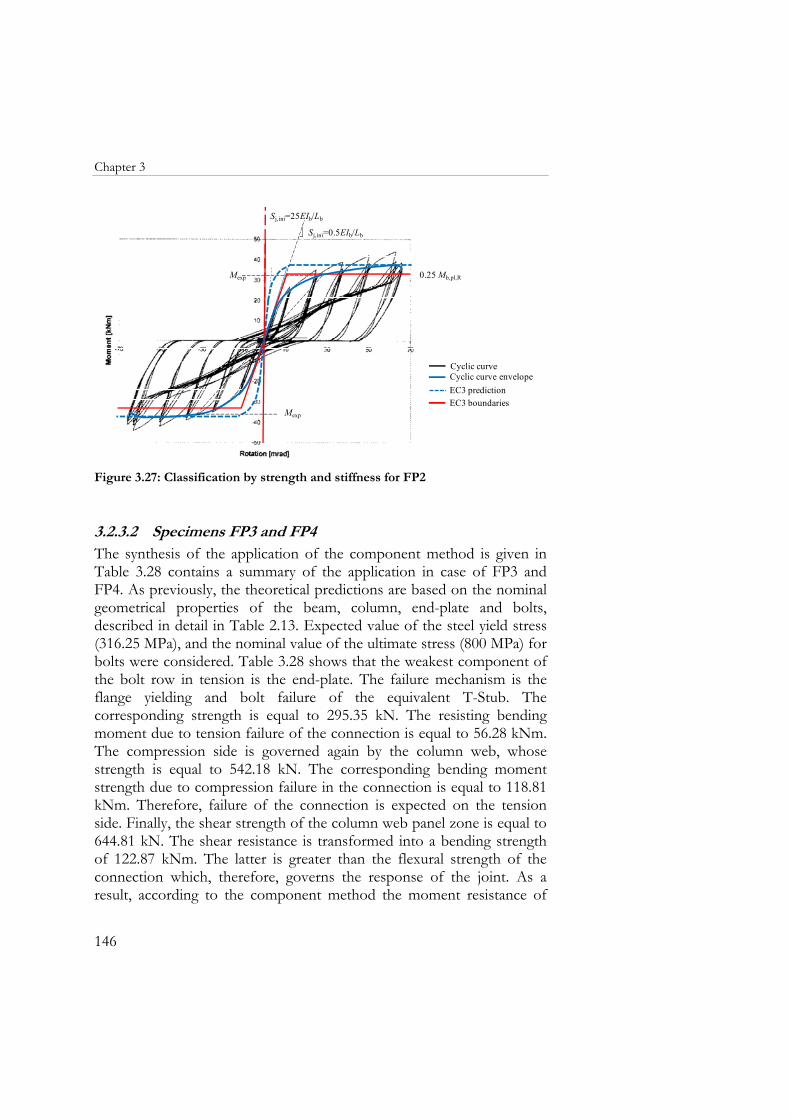
Chapter 3
146
Mexp
Sj,ini=25EIb/Lb
Sj,ini=0.5EIb/Lb
Cyclic curve
EC3 boundariesEC3 predictionCyclic curve envelope
0.25 Mb,pl,R
Mexp
Figure 3.27: Classification by strength and stiffness for FP2
3.2.3.2 Specimens FP3 and FP4 The synthesis of the application of the component method is given in Table 3.28 contains a summary of the application in case of FP3 and FP4. As previously, the theoretical predictions are based on the nominal geometrical properties of the beam, column, end-plate and bolts, described in detail in Table 2.13. Expected value of the steel yield stress (316.25 MPa), and the nominal value of the ultimate stress (800 MPa) for bolts were considered. Table 3.28 shows that the weakest component of the bolt row in tension is the end-plate. The failure mechanism is the flange yielding and bolt failure of the equivalent T-Stub. The corresponding strength is equal to 295.35 kN. The resisting bending moment due to tension failure of the connection is equal to 56.28 kNm. The compression side is governed again by the column web, whose strength is equal to 542.18 kN. The corresponding bending moment strength due to compression failure in the connection is equal to 118.81 kNm. Therefore, failure of the connection is expected on the tension side. Finally, the shear strength of the column web panel zone is equal to 644.81 kN. The shear resistance is transformed into a bending strength of 122.87 kNm. The latter is greater than the flexural strength of the connection which, therefore, governs the response of the joint. As a result, according to the component method the moment resistance of
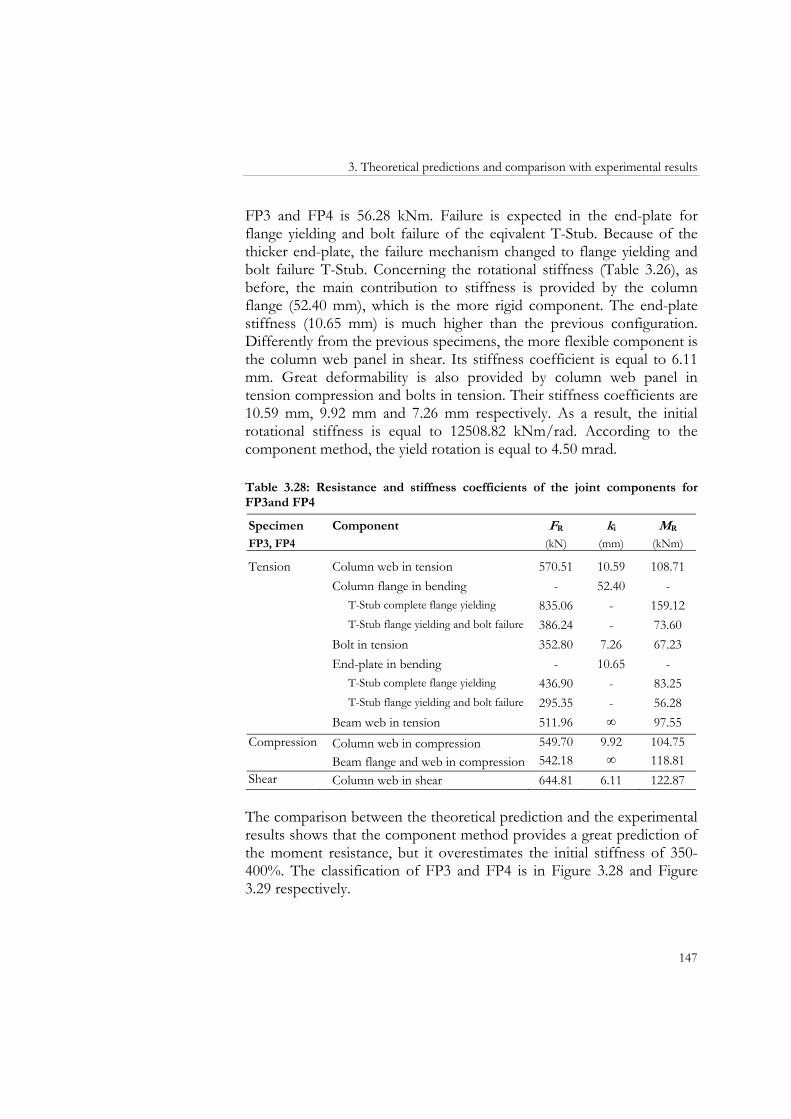
3. Theoretical predictions and comparison with experimental results
147
FP3 and FP4 is 56.28 kNm. Failure is expected in the end-plate for flange yielding and bolt failure of the eqivalent T-Stub. Because of the thicker end-plate, the failure mechanism changed to flange yielding and bolt failure T-Stub. Concerning the rotational stiffness (Table 3.26), as before, the main contribution to stiffness is provided by the column flange (52.40 mm), which is the more rigid component. The end-plate stiffness (10.65 mm) is much higher than the previous configuration. Differently from the previous specimens, the more flexible component is the column web panel in shear. Its stiffness coefficient is equal to 6.11 mm. Great deformability is also provided by column web panel in tension compression and bolts in tension. Their stiffness coefficients are 10.59 mm, 9.92 mm and 7.26 mm respectively. As a result, the initial rotational stiffness is equal to 12508.82 kNm/rad. According to the component method, the yield rotation is equal to 4.50 mrad. Table 3.28: Resistance and stiffness coefficients of the joint components for FP3and FP4
Specimen Component FR ki MR
FP3, FP4 (kN) (mm) (kNm)
Tension
Column web in tension 570.51 10.59 108.71Column flange in bending - 52.40 -
T-Stub complete flange yielding 835.06 - 159.12T-Stub flange yielding and bolt failure 386.24 - 73.60
Bolt in tension 352.80 7.26 67.23End-plate in bending - 10.65 -
T-Stub complete flange yielding 436.90 - 83.25T-Stub flange yielding and bolt failure 295.35 - 56.28
Beam web in tension 511.96 ∞ 97.55Compression Column web in compression 549.70 9.92 104.75
Beam flange and web in compression 542.18 ∞ 118.81Shear Column web in shear 644.81 6.11 122.87 The comparison between the theoretical prediction and the experimental results shows that the component method provides a great prediction of the moment resistance, but it overestimates the initial stiffness of 350-400%. The classification of FP3 and FP4 is in Figure 3.28 and Figure 3.29 respectively.
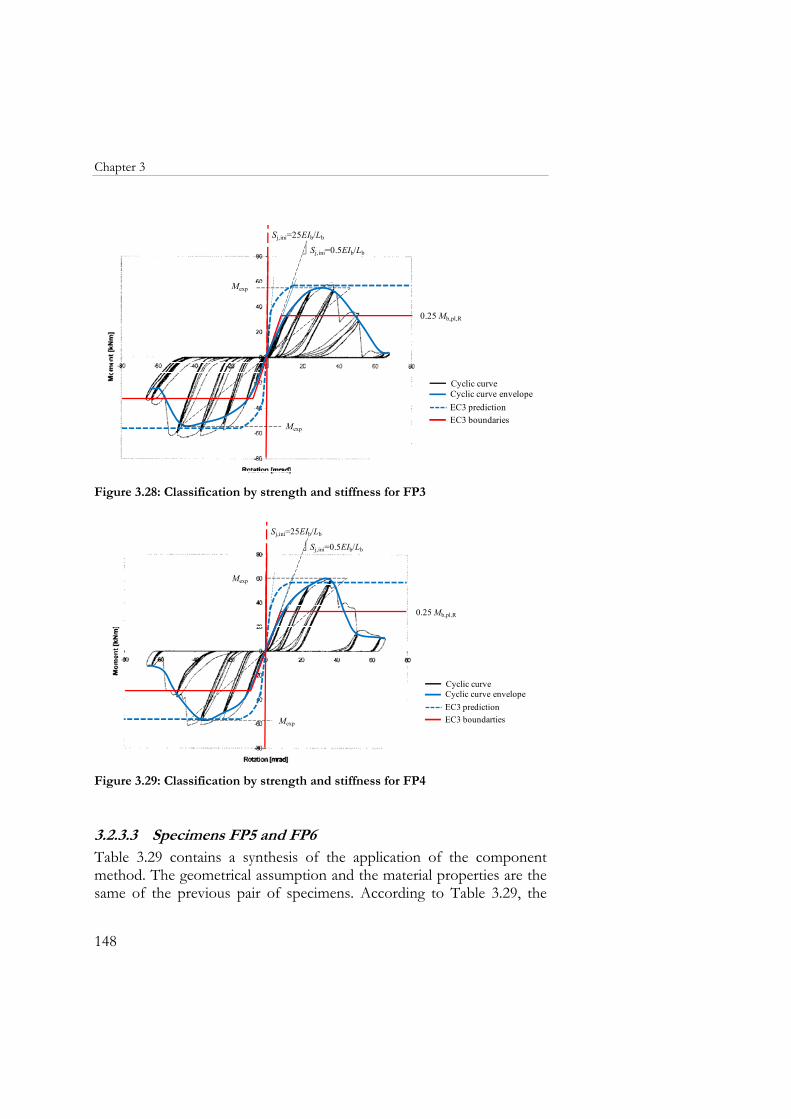
Chapter 3
148
Cyclic curve
EC3 boundariesEC3 predictionCyclic curve envelope
Sj,ini=25EIb/Lb
Sj,ini=0.5EIb/Lb
0.25 Mb,pl,R
Mexp
Mexp
Figure 3.28: Classification by strength and stiffness for FP3
Cyclic curve
EC3 boundartiesEC3 predictionCyclic curve envelope
Sj,ini=0.5EIb/Lb
Sj,ini=25EIb/Lb
0.25 Mb,pl,R
Mexp
Mexp
Figure 3.29: Classification by strength and stiffness for FP4
3.2.3.3 Specimens FP5 and FP6 Table 3.29 contains a synthesis of the application of the component method. The geometrical assumption and the material properties are the same of the previous pair of specimens. According to Table 3.29, the
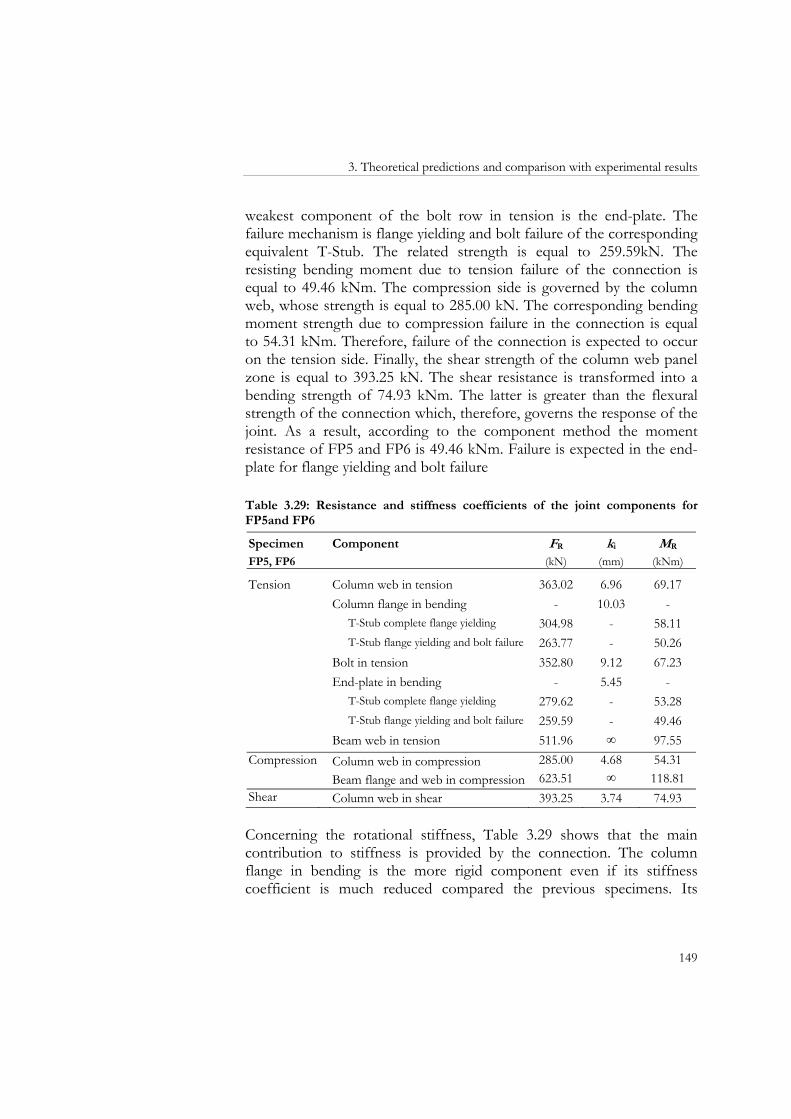
3. Theoretical predictions and comparison with experimental results
149
weakest component of the bolt row in tension is the end-plate. The failure mechanism is flange yielding and bolt failure of the corresponding equivalent T-Stub. The related strength is equal to 259.59kN. The resisting bending moment due to tension failure of the connection is equal to 49.46 kNm. The compression side is governed by the column web, whose strength is equal to 285.00 kN. The corresponding bending moment strength due to compression failure in the connection is equal to 54.31 kNm. Therefore, failure of the connection is expected to occur on the tension side. Finally, the shear strength of the column web panel zone is equal to 393.25 kN. The shear resistance is transformed into a bending strength of 74.93 kNm. The latter is greater than the flexural strength of the connection which, therefore, governs the response of the joint. As a result, according to the component method the moment resistance of FP5 and FP6 is 49.46 kNm. Failure is expected in the end-plate for flange yielding and bolt failure Table 3.29: Resistance and stiffness coefficients of the joint components for FP5and FP6
Specimen Component FR ki MR
FP5, FP6 (kN) (mm) (kNm)
Tension
Column web in tension 363.02 6.96 69.17Column flange in bending - 10.03 -
T-Stub complete flange yielding 304.98 - 58.11T-Stub flange yielding and bolt failure 263.77 - 50.26
Bolt in tension 352.80 9.12 67.23End-plate in bending - 5.45 -
T-Stub complete flange yielding 279.62 - 53.28T-Stub flange yielding and bolt failure 259.59 - 49.46
Beam web in tension 511.96 ∞ 97.55Compression Column web in compression 285.00 4.68 54.31
Beam flange and web in compression 623.51 ∞ 118.81Shear Column web in shear 393.25 3.74 74.93 Concerning the rotational stiffness, Table 3.29 shows that the main contribution to stiffness is provided by the connection. The column flange in bending is the more rigid component even if its stiffness coefficient is much reduced compared the previous specimens. Its
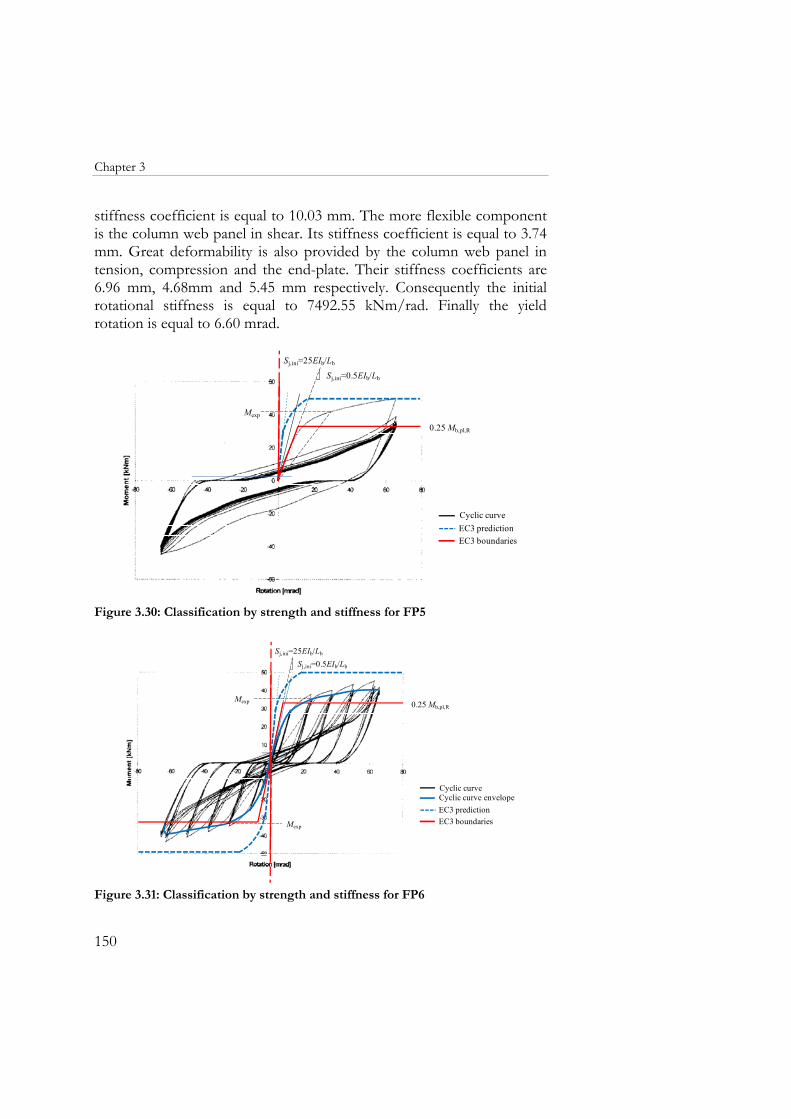
Chapter 3
150
stiffness coefficient is equal to 10.03 mm. The more flexible component is the column web panel in shear. Its stiffness coefficient is equal to 3.74 mm. Great deformability is also provided by the column web panel in tension, compression and the end-plate. Their stiffness coefficients are 6.96 mm, 4.68mm and 5.45 mm respectively. Consequently the initial rotational stiffness is equal to 7492.55 kNm/rad. Finally the yield rotation is equal to 6.60 mrad.
Cyclic curve
EC3 boundariesEC3 prediction
Sj,ini=25EIb/Lb
Sj,ini=0.5EIb/Lb
0.25 Mb,pl,R
Mexp
Figure 3.30: Classification by strength and stiffness for FP5
Sj,ini=25EIb/Lb
Sj,ini=0.5EIb/Lb
Mexp
Cyclic curve
EC3 boundariesEC3 predictionCyclic curve envelope
0.25 Mb,pl,R
Mexp
Figure 3.31: Classification by strength and stiffness for FP6
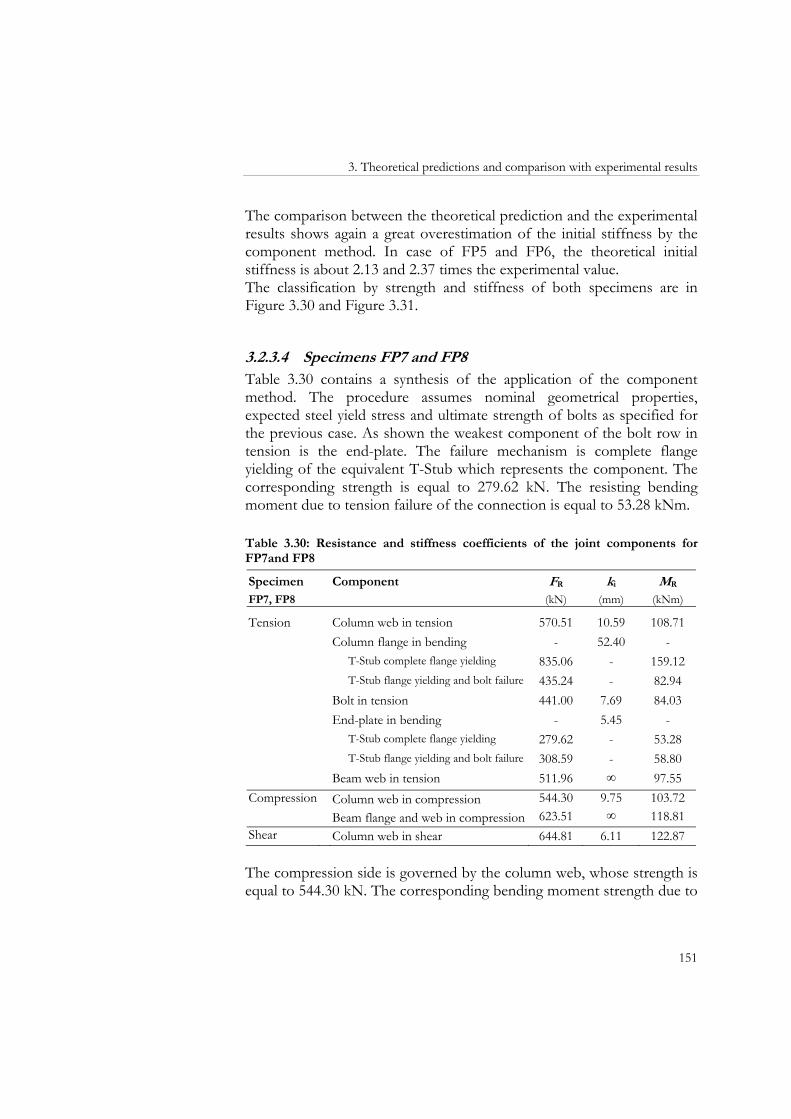
3. Theoretical predictions and comparison with experimental results
151
The comparison between the theoretical prediction and the experimental results shows again a great overestimation of the initial stiffness by the component method. In case of FP5 and FP6, the theoretical initial stiffness is about 2.13 and 2.37 times the experimental value. The classification by strength and stiffness of both specimens are in Figure 3.30 and Figure 3.31.
3.2.3.4 Specimens FP7 and FP8 Table 3.30 contains a synthesis of the application of the component method. The procedure assumes nominal geometrical properties, expected steel yield stress and ultimate strength of bolts as specified for the previous case. As shown the weakest component of the bolt row in tension is the end-plate. The failure mechanism is complete flange yielding of the equivalent T-Stub which represents the component. The corresponding strength is equal to 279.62 kN. The resisting bending moment due to tension failure of the connection is equal to 53.28 kNm. Table 3.30: Resistance and stiffness coefficients of the joint components for FP7and FP8
Specimen Component FR ki MR
FP7, FP8 (kN) (mm) (kNm)
Tension
Column web in tension 570.51 10.59 108.71Column flange in bending - 52.40 -
T-Stub complete flange yielding 835.06 - 159.12T-Stub flange yielding and bolt failure 435.24 - 82.94
Bolt in tension 441.00 7.69 84.03End-plate in bending - 5.45 -
T-Stub complete flange yielding 279.62 - 53.28T-Stub flange yielding and bolt failure 308.59 - 58.80
Beam web in tension 511.96 ∞ 97.55Compression Column web in compression 544.30 9.75 103.72
Beam flange and web in compression 623.51 ∞ 118.81Shear Column web in shear 644.81 6.11 122.87 The compression side is governed by the column web, whose strength is equal to 544.30 kN. The corresponding bending moment strength due to
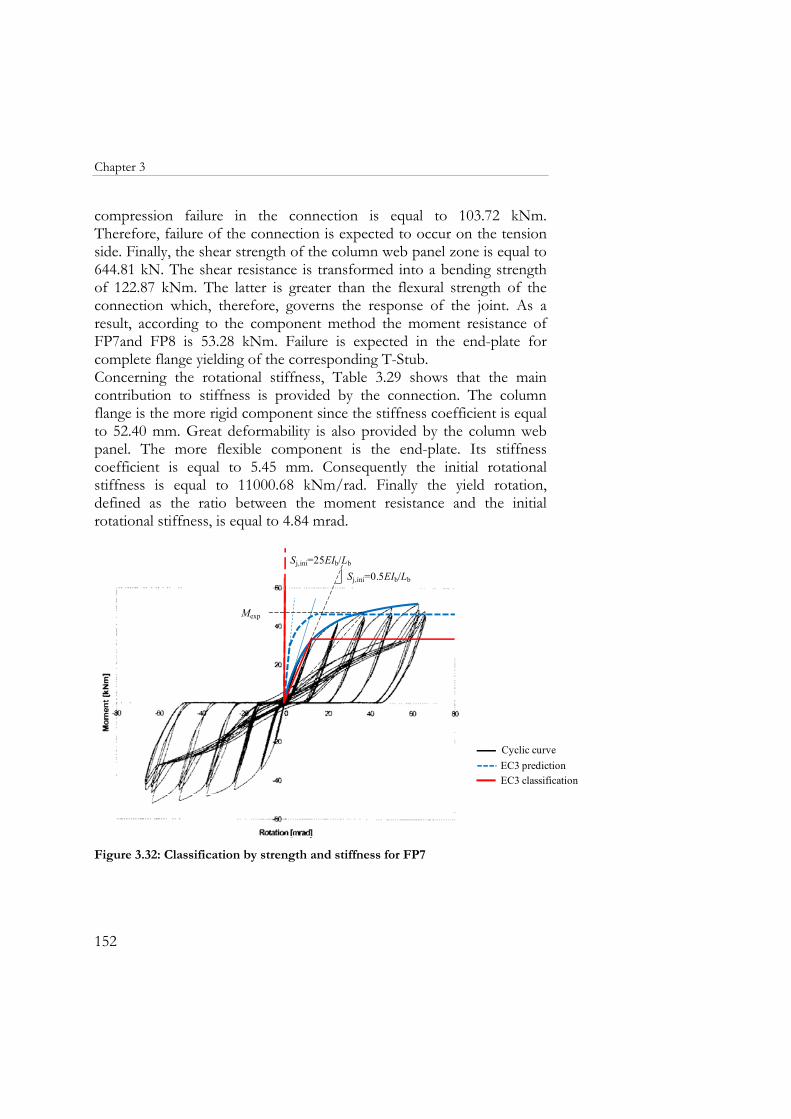
Chapter 3
152
compression failure in the connection is equal to 103.72 kNm. Therefore, failure of the connection is expected to occur on the tension side. Finally, the shear strength of the column web panel zone is equal to 644.81 kN. The shear resistance is transformed into a bending strength of 122.87 kNm. The latter is greater than the flexural strength of the connection which, therefore, governs the response of the joint. As a result, according to the component method the moment resistance of FP7and FP8 is 53.28 kNm. Failure is expected in the end-plate for complete flange yielding of the corresponding T-Stub. Concerning the rotational stiffness, Table 3.29 shows that the main contribution to stiffness is provided by the connection. The column flange is the more rigid component since the stiffness coefficient is equal to 52.40 mm. Great deformability is also provided by the column web panel. The more flexible component is the end-plate. Its stiffness coefficient is equal to 5.45 mm. Consequently the initial rotational stiffness is equal to 11000.68 kNm/rad. Finally the yield rotation, defined as the ratio between the moment resistance and the initial rotational stiffness, is equal to 4.84 mrad.
Sj,ini=0.5EIb/Lb
Sj,ini=25EIb/Lb
Mexp
Cyclic curve
EC3 classificationEC3 prediction
Figure 3.32: Classification by strength and stiffness for FP7
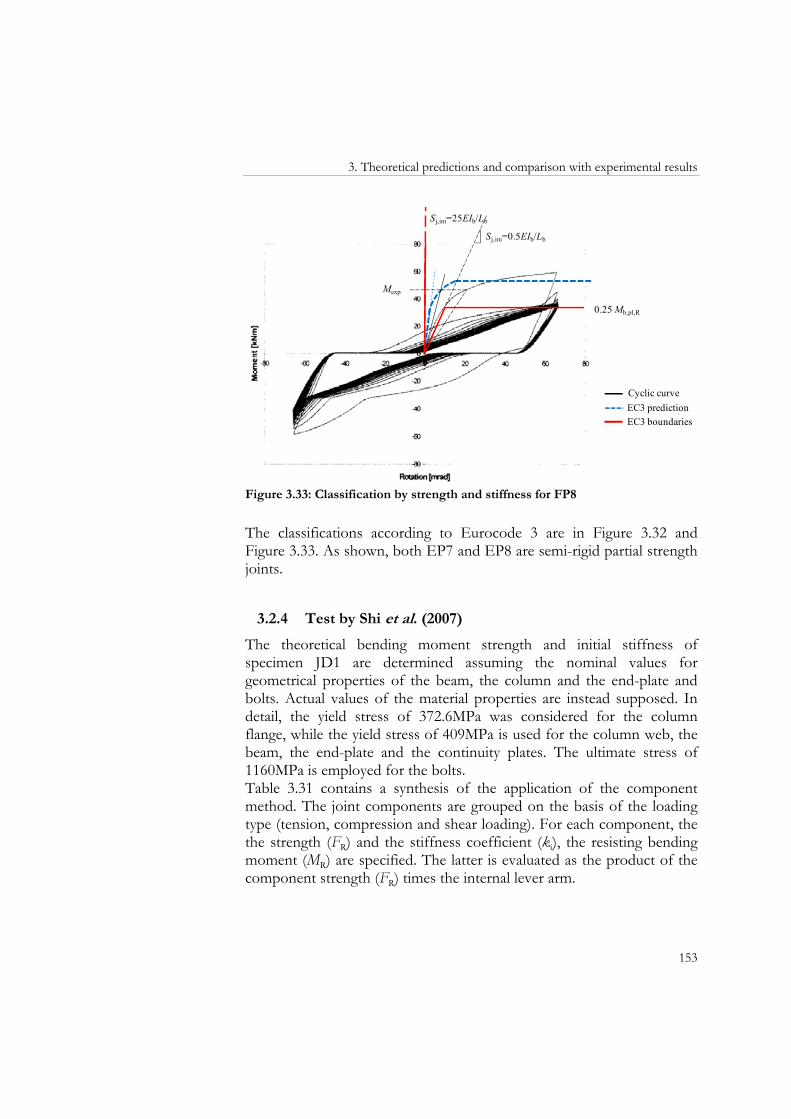
3. Theoretical predictions and comparison with experimental results
153
Sj,ini=0.5EIb/Lb
Cyclic curve
EC3 boundariesEC3 prediction
0.25 Mb,pl,R
Sj,ini=25EIb/Lb
Mexp
Figure 3.33: Classification by strength and stiffness for FP8
The classifications according to Eurocode 3 are in Figure 3.32 and Figure 3.33. As shown, both EP7 and EP8 are semi-rigid partial strength joints.
3.2.4 Test by Shi et al. (2007)
The theoretical bending moment strength and initial stiffness of specimen JD1 are determined assuming the nominal values for geometrical properties of the beam, the column and the end-plate and bolts. Actual values of the material properties are instead supposed. In detail, the yield stress of 372.6MPa was considered for the column flange, while the yield stress of 409MPa is used for the column web, the beam, the end-plate and the continuity plates. The ultimate stress of 1160MPa is employed for the bolts. Table 3.31 contains a synthesis of the application of the component method. The joint components are grouped on the basis of the loading type (tension, compression and shear loading). For each component, the the strength (FR) and the stiffness coefficient (ki), the resisting bending moment (MR) are specified. The latter is evaluated as the product of the component strength (FR) times the internal lever arm.
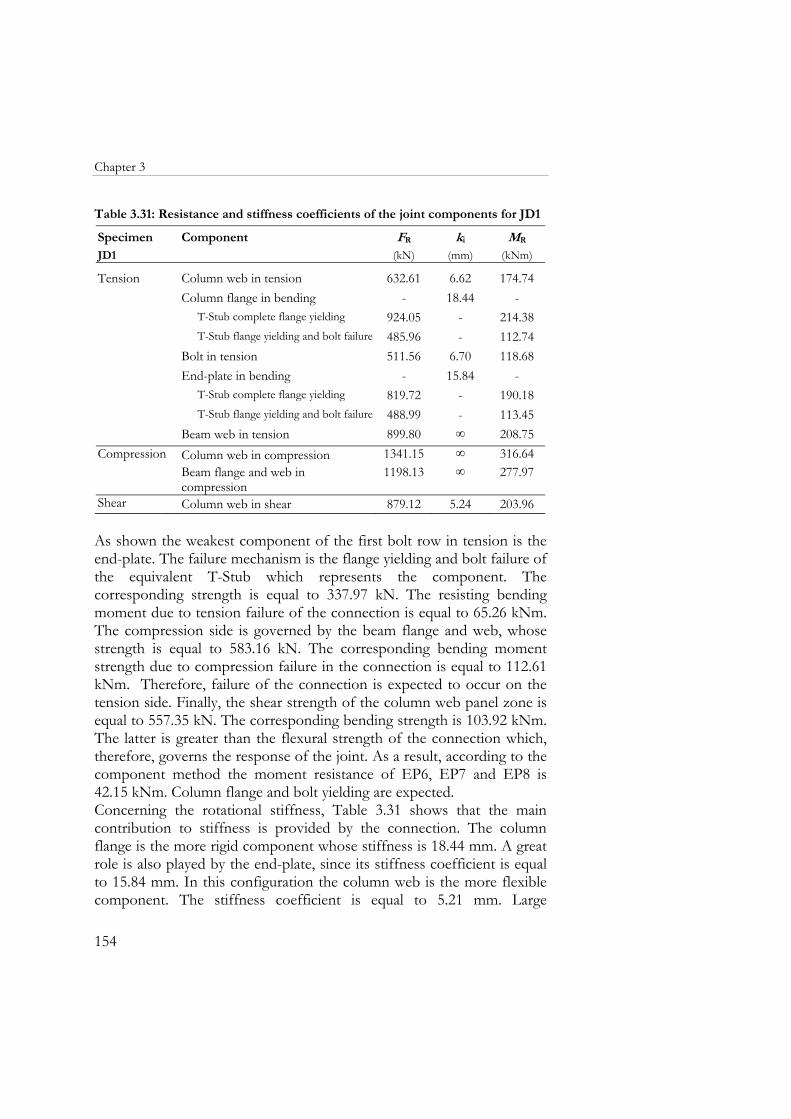
Chapter 3
154
Table 3.31: Resistance and stiffness coefficients of the joint components for JD1
Specimen Component FR ki MR
JD1 (kN) (mm) (kNm)
Tension
Column web in tension 632.61 6.62 174.74Column flange in bending - 18.44 -
T-Stub complete flange yielding 924.05 - 214.38T-Stub flange yielding and bolt failure 485.96 - 112.74
Bolt in tension 511.56 6.70 118.68End-plate in bending - 15.84 -
T-Stub complete flange yielding 819.72 - 190.18T-Stub flange yielding and bolt failure 488.99 - 113.45
Beam web in tension 899.80 ∞ 208.75Compression Column web in compression 1341.15 ∞ 316.64
Beam flange and web in compression
1198.13 ∞ 277.97
Shear Column web in shear 879.12 5.24 203.96 As shown the weakest component of the first bolt row in tension is the end-plate. The failure mechanism is the flange yielding and bolt failure of the equivalent T-Stub which represents the component. The corresponding strength is equal to 337.97 kN. The resisting bending moment due to tension failure of the connection is equal to 65.26 kNm. The compression side is governed by the beam flange and web, whose strength is equal to 583.16 kN. The corresponding bending moment strength due to compression failure in the connection is equal to 112.61 kNm. Therefore, failure of the connection is expected to occur on the tension side. Finally, the shear strength of the column web panel zone is equal to 557.35 kN. The corresponding bending strength is 103.92 kNm. The latter is greater than the flexural strength of the connection which, therefore, governs the response of the joint. As a result, according to the component method the moment resistance of EP6, EP7 and EP8 is 42.15 kNm. Column flange and bolt yielding are expected. Concerning the rotational stiffness, Table 3.31 shows that the main contribution to stiffness is provided by the connection. The column flange is the more rigid component whose stiffness is 18.44 mm. A great role is also played by the end-plate, since its stiffness coefficient is equal to 15.84 mm. In this configuration the column web is the more flexible component. The stiffness coefficient is equal to 5.21 mm. Large
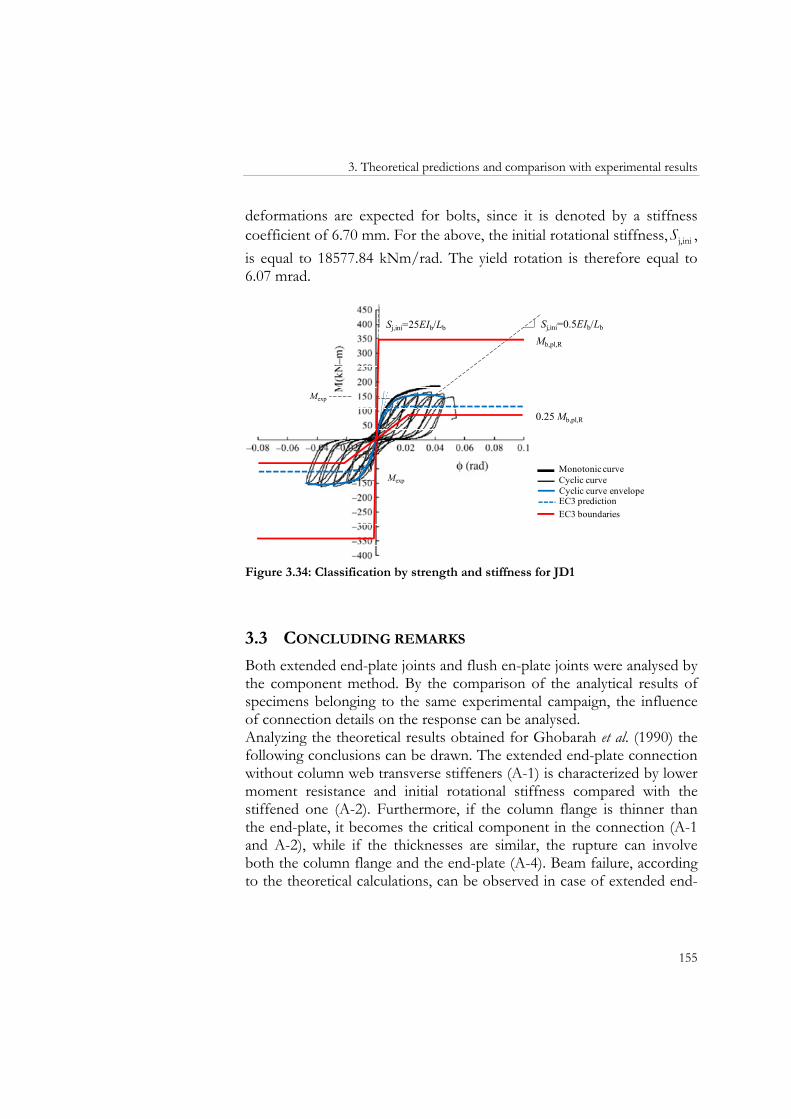
3. Theoretical predictions and comparison with experimental results
155
deformations are expected for bolts, since it is denoted by a stiffness coefficient of 6.70 mm. For the above, the initial rotational stiffness, j,iniS , is equal to 18577.84 kNm/rad. The yield rotation is therefore equal to 6.07 mrad.
Monotonic curveCyclic curve
EC3 boundariesEC3 predictionCyclic curve envelope
Mexp
0.25 Mb,pl,R
Sj,ini=0.5EIb/Lb
Mb,pl,R
Sj,ini=25EIb/Lb
Mexp
Figure 3.34: Classification by strength and stiffness for JD1
3.3 CONCLUDING REMARKS
Both extended end-plate joints and flush en-plate joints were analysed by the component method. By the comparison of the analytical results of specimens belonging to the same experimental campaign, the influence of connection details on the response can be analysed. Analyzing the theoretical results obtained for Ghobarah et al. (1990) the following conclusions can be drawn. The extended end-plate connection without column web transverse stiffeners (A-1) is characterized by lower moment resistance and initial rotational stiffness compared with the stiffened one (A-2). Furthermore, if the column flange is thinner than the end-plate, it becomes the critical component in the connection (A-1 and A-2), while if the thicknesses are similar, the rupture can involve both the column flange and the end-plate (A-4). Beam failure, according to the theoretical calculations, can be observed in case of extended end-
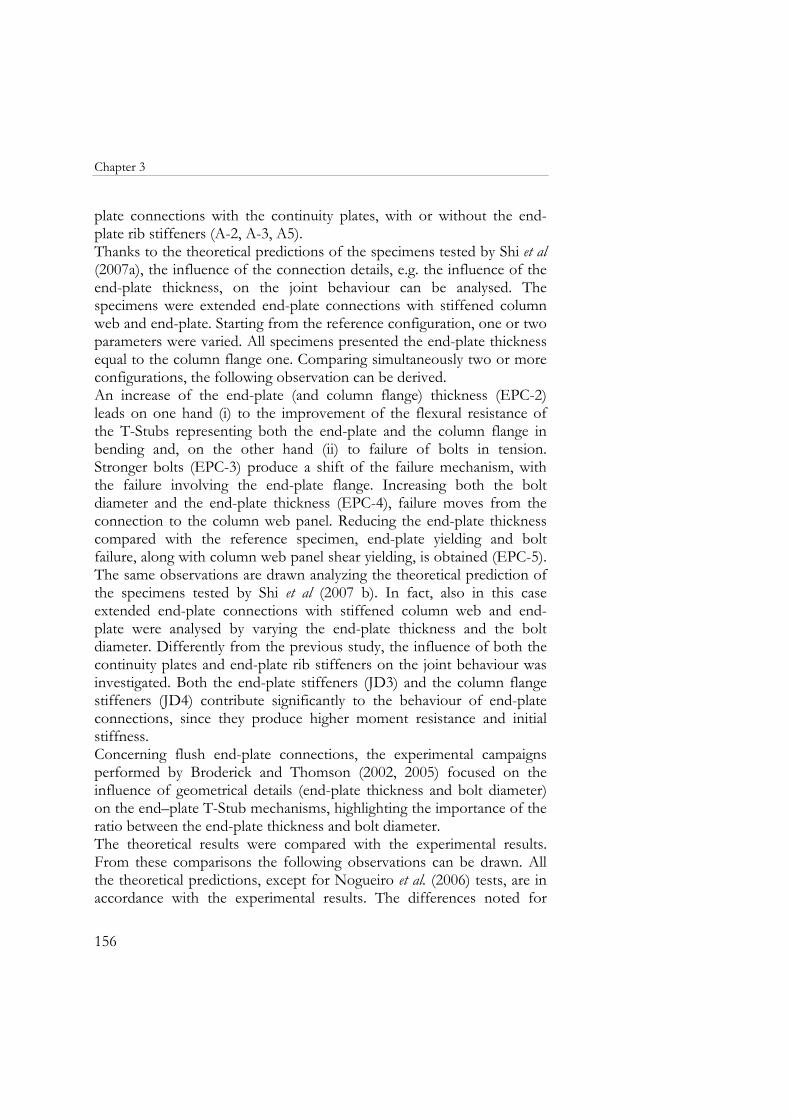
Chapter 3
156
plate connections with the continuity plates, with or without the end-plate rib stiffeners (A-2, A-3, A5). Thanks to the theoretical predictions of the specimens tested by Shi et al (2007a), the influence of the connection details, e.g. the influence of the end-plate thickness, on the joint behaviour can be analysed. The specimens were extended end-plate connections with stiffened column web and end-plate. Starting from the reference configuration, one or two parameters were varied. All specimens presented the end-plate thickness equal to the column flange one. Comparing simultaneously two or more configurations, the following observation can be derived. An increase of the end-plate (and column flange) thickness (EPC-2) leads on one hand (i) to the improvement of the flexural resistance of the T-Stubs representing both the end-plate and the column flange in bending and, on the other hand (ii) to failure of bolts in tension. Stronger bolts (EPC-3) produce a shift of the failure mechanism, with the failure involving the end-plate flange. Increasing both the bolt diameter and the end-plate thickness (EPC-4), failure moves from the connection to the column web panel. Reducing the end-plate thickness compared with the reference specimen, end-plate yielding and bolt failure, along with column web panel shear yielding, is obtained (EPC-5). The same observations are drawn analyzing the theoretical prediction of the specimens tested by Shi et al (2007 b). In fact, also in this case extended end-plate connections with stiffened column web and end-plate were analysed by varying the end-plate thickness and the bolt diameter. Differently from the previous study, the influence of both the continuity plates and end-plate rib stiffeners on the joint behaviour was investigated. Both the end-plate stiffeners (JD3) and the column flange stiffeners (JD4) contribute significantly to the behaviour of end-plate connections, since they produce higher moment resistance and initial stiffness. Concerning flush end-plate connections, the experimental campaigns performed by Broderick and Thomson (2002, 2005) focused on the influence of geometrical details (end-plate thickness and bolt diameter) on the end–plate T-Stub mechanisms, highlighting the importance of the ratio between the end-plate thickness and bolt diameter. The theoretical results were compared with the experimental results. From these comparisons the following observations can be drawn. All the theoretical predictions, except for Nogueiro et al. (2006) tests, are in accordance with the experimental results. The differences noted for
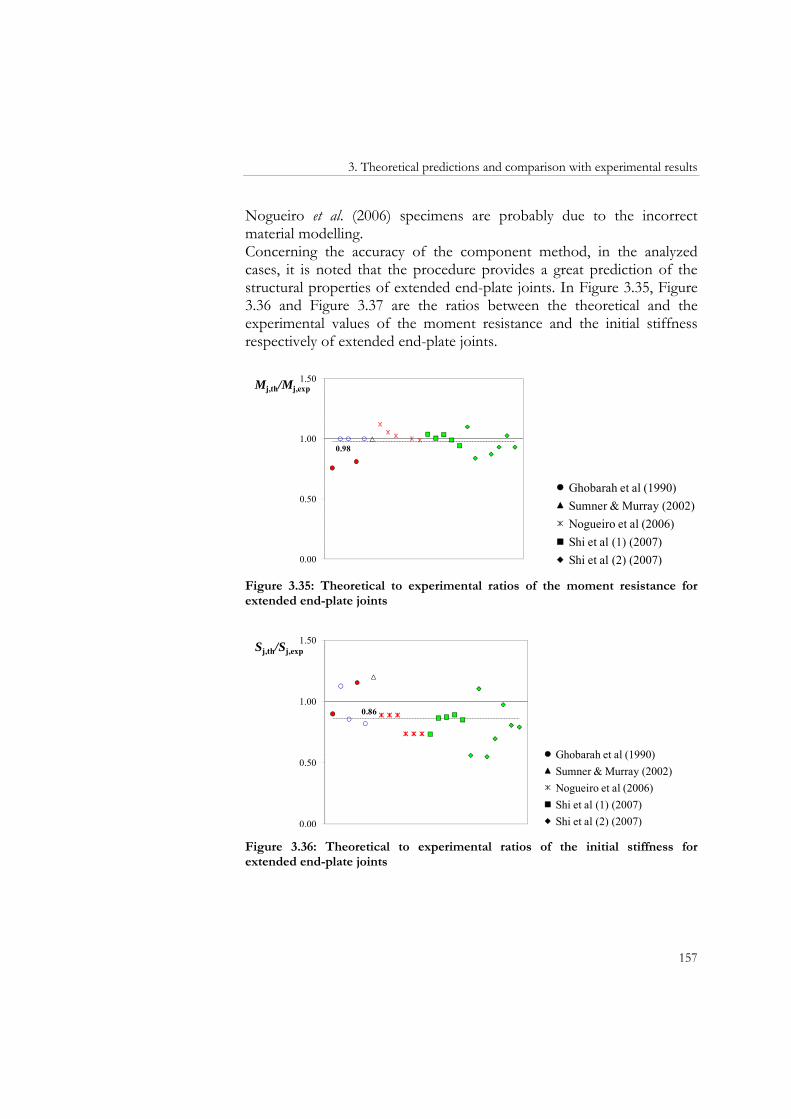
3. Theoretical predictions and comparison with experimental results
157
Nogueiro et al. (2006) specimens are probably due to the incorrect material modelling. Concerning the accuracy of the component method, in the analyzed cases, it is noted that the procedure provides a great prediction of the structural properties of extended end-plate joints. In Figure 3.35, Figure 3.36 and Figure 3.37 are the ratios between the theoretical and the experimental values of the moment resistance and the initial stiffness respectively of extended end-plate joints.
0.98
0.00
0.50
1.00
1.50Mj,th/Mj,exp
Ghobarah et al (1990)Sumner & Murray (2002)Nogueiro et al (2006)Shi et al (1) (2007)Shi et al (2) (2007)
Figure 3.35: Theoretical to experimental ratios of the moment resistance for extended end-plate joints
0.86
0.00
0.50
1.00
1.50Sj,th/Sj,exp
Ghobarah et al (1990)Sumner & Murray (2002)Nogueiro et al (2006)Shi et al (1) (2007)Shi et al (2) (2007)
Figure 3.36: Theoretical to experimental ratios of the initial stiffness for extended end-plate joints
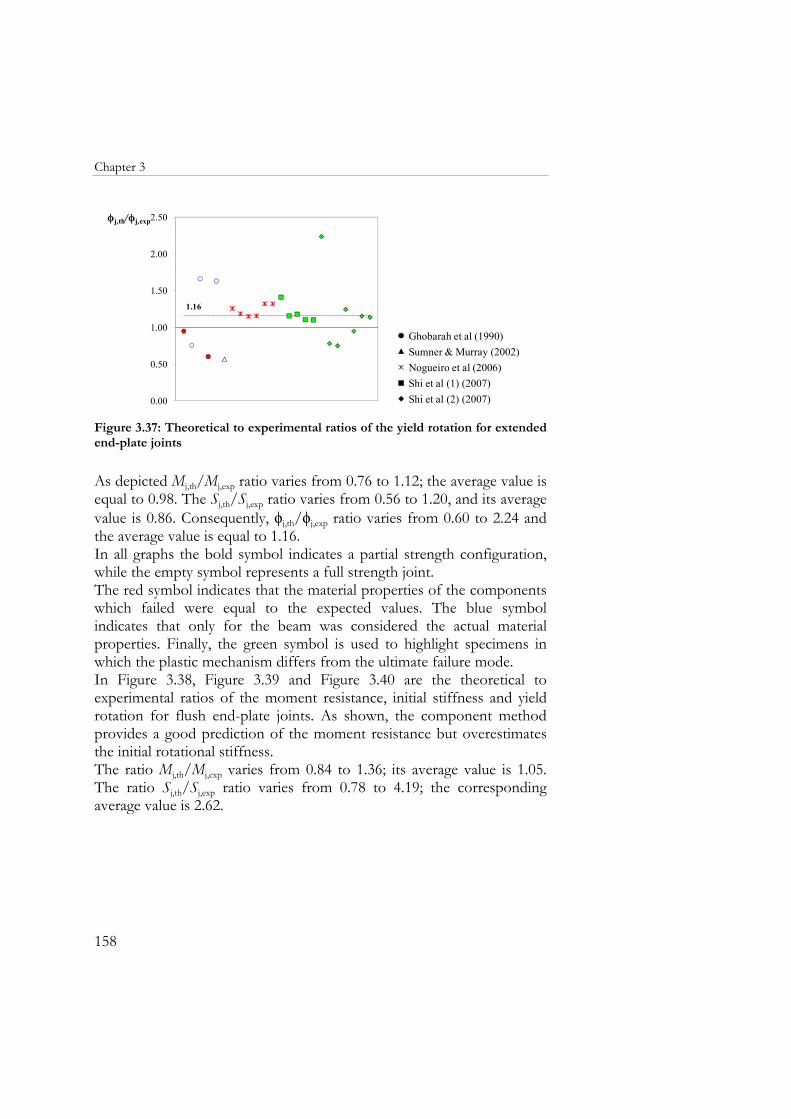
Chapter 3
158
1.16
0.00
0.50
1.00
1.50
2.00
2.50ϕj,th/ϕj,exp
Ghobarah et al (1990)Sumner & Murray (2002)Nogueiro et al (2006)Shi et al (1) (2007)Shi et al (2) (2007)
Figure 3.37: Theoretical to experimental ratios of the yield rotation for extended end-plate joints
As depicted Mj,th/Mj,exp ratio varies from 0.76 to 1.12; the average value is equal to 0.98. The Sj,th/Sj,exp ratio varies from 0.56 to 1.20, and its average value is 0.86. Consequently, ϕj,th/ϕj,exp ratio varies from 0.60 to 2.24 and the average value is equal to 1.16. In all graphs the bold symbol indicates a partial strength configuration, while the empty symbol represents a full strength joint. The red symbol indicates that the material properties of the components which failed were equal to the expected values. The blue symbol indicates that only for the beam was considered the actual material properties. Finally, the green symbol is used to highlight specimens in which the plastic mechanism differs from the ultimate failure mode. In Figure 3.38, Figure 3.39 and Figure 3.40 are the theoretical to experimental ratios of the moment resistance, initial stiffness and yield rotation for flush end-plate joints. As shown, the component method provides a good prediction of the moment resistance but overestimates the initial rotational stiffness. The ratio Mj,th/Mj,exp varies from 0.84 to 1.36; its average value is 1.05. The ratio Sj,th/Sj,exp ratio varies from 0.78 to 4.19; the corresponding average value is 2.62.
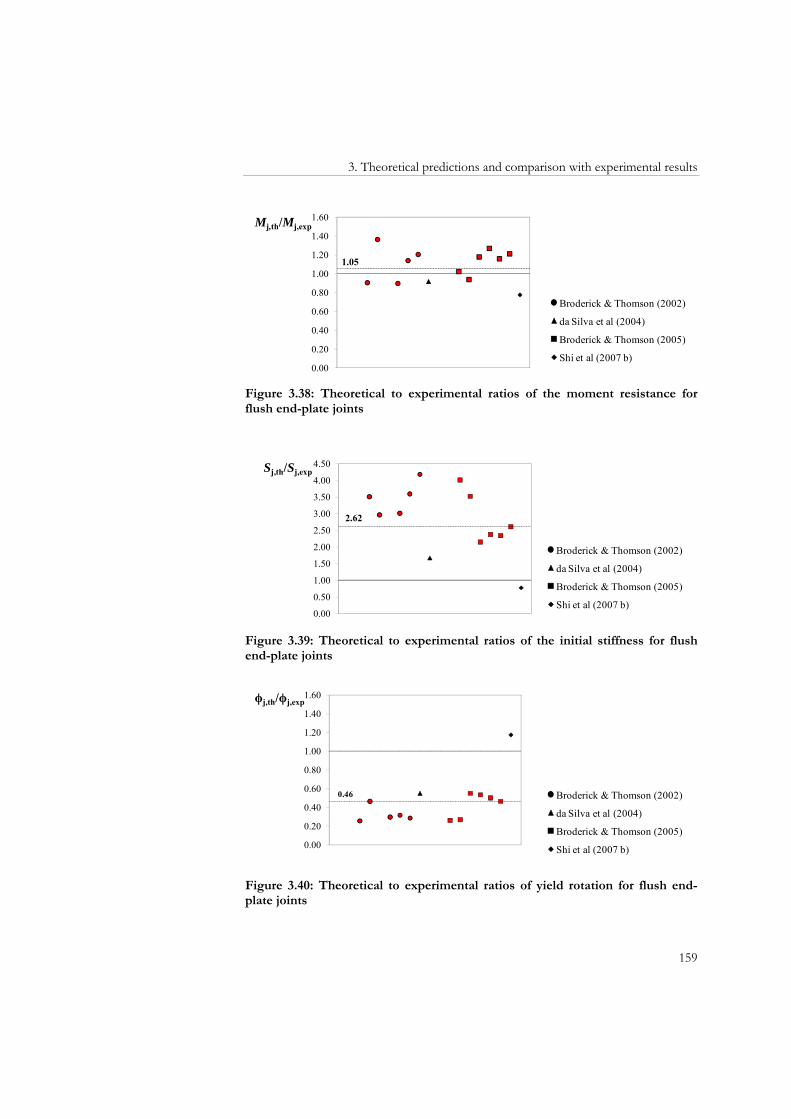
3. Theoretical predictions and comparison with experimental results
159
1.05
0.00
0.20
0.40
0.60
0.80
1.00
1.20
1.40
1.60Mj,th/Mj,exp
Broderick & Thomson (2002)
da Silva et al (2004)
Broderick & Thomson (2005)
Shi et al (2007 b)
Figure 3.38: Theoretical to experimental ratios of the moment resistance for flush end-plate joints
2.62
0.00
0.50
1.00
1.50
2.00
2.50
3.00
3.50
4.00
4.50Sj,th/Sj,exp
Broderick & Thomson (2002)
da Silva et al (2004)
Broderick & Thomson (2005)
Shi et al (2007 b)
Figure 3.39: Theoretical to experimental ratios of the initial stiffness for flush end-plate joints
0.46
0.00
0.20
0.40
0.60
0.80
1.00
1.20
1.40
1.60ϕj,th/ϕj,exp
Broderick & Thomson (2002)
da Silva et al (2004)
Broderick & Thomson (2005)
Shi et al (2007 b)
Figure 3.40: Theoretical to experimental ratios of yield rotation for flush end-plate joints

Chapter 3
160
The great overestimation of the initial stiffness (about 3 times higher than the experimental value) is probably due to the end-plate width of the specimens which were not complying with the typical geometries considered as a reference in the Eurocode 3 method.
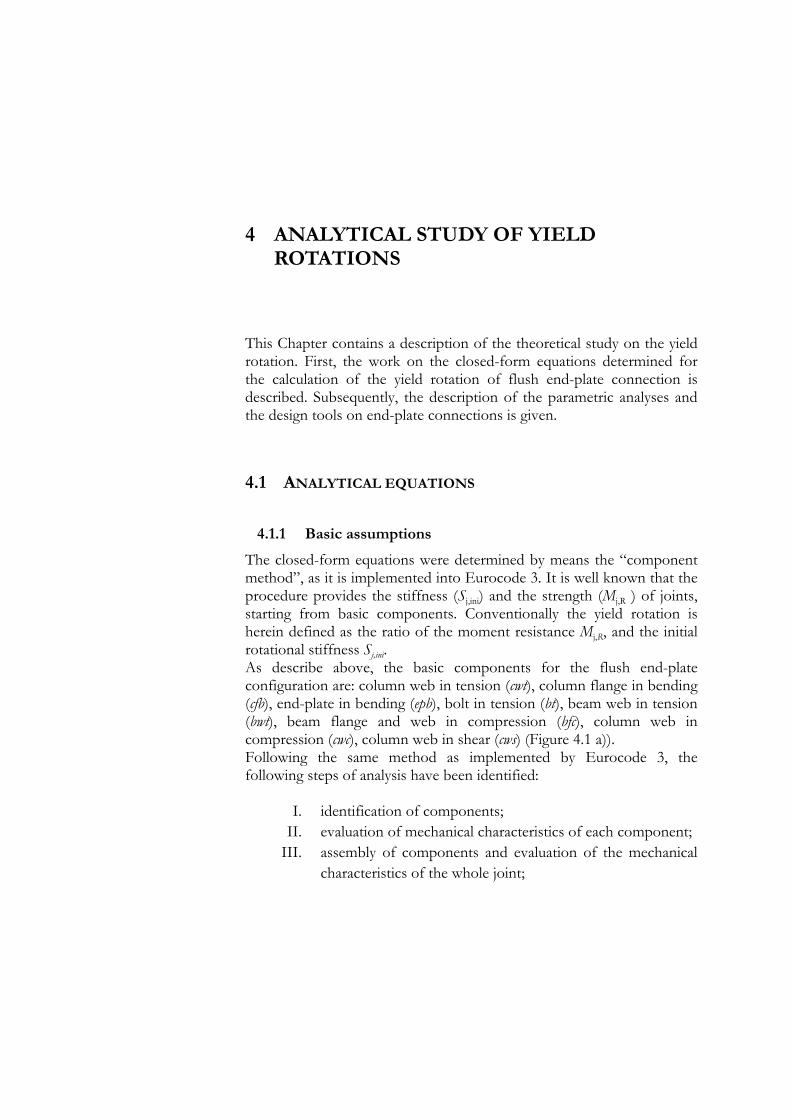
4 ANALYTICAL STUDY OF YIELD ROTATIONS
This Chapter contains a description of the theoretical study on the yield rotation. First, the work on the closed-form equations determined for the calculation of the yield rotation of flush end-plate connection is described. Subsequently, the description of the parametric analyses and the design tools on end-plate connections is given.
4.1 ANALYTICAL EQUATIONS
4.1.1 Basic assumptions
The closed-form equations were determined by means the “component method”, as it is implemented into Eurocode 3. It is well known that the procedure provides the stiffness (Sj,ini) and the strength (Mj,R ) of joints, starting from basic components. Conventionally the yield rotation is herein defined as the ratio of the moment resistance Mj,R, and the initial rotational stiffness Sj,ini. As describe above, the basic components for the flush end-plate configuration are: column web in tension (cwt), column flange in bending (cfb), end-plate in bending (epb), bolt in tension (bt), beam web in tension (bwt), beam flange and web in compression (bfc), column web in compression (cwc), column web in shear (cws) (Figure 4.1 a)). Following the same method as implemented by Eurocode 3, the following steps of analysis have been identified:
I. identification of components; II. evaluation of mechanical characteristics of each component;
III. assembly of components and evaluation of the mechanical characteristics of the whole joint;
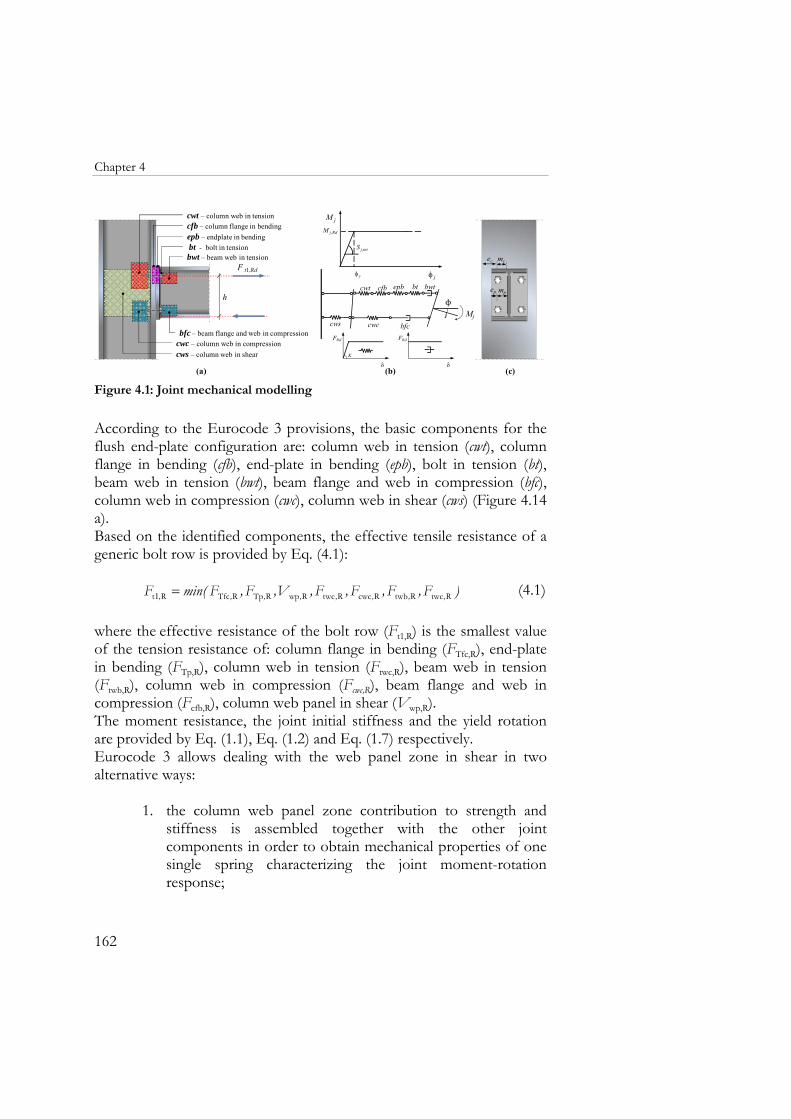
Chapter 4
162
ep mp
ec mcF t1,Rd
h
cws – column web in shear
cwt – column web in tensioncfb – column flange in bendingepb – endplate in bendingbt - bolt in tension
bfc – beam flange and web in compressioncwc – column web in compression
bwt – beam web in tension
(a) (c)(b)
j
cwt epb bt bwtcfb
cwc bfccws
FRd
δK
FRd
δ
jφ
jM
Rd,jM
yφ
ini,jS
Mj
Figure 4.1: Joint mechanical modelling
According to the Eurocode 3 provisions, the basic components for the flush end-plate configuration are: column web in tension (cwt), column flange in bending (cfb), end-plate in bending (epb), bolt in tension (bt), beam web in tension (bwt), beam flange and web in compression (bfc), column web in compression (cwc), column web in shear (cws) (Figure 4.14 a). Based on the identified components, the effective tensile resistance of a generic bolt row is provided by Eq. (4.1): )F,F,F,F,V,F,Fmin(F ,,,,,,,, RtwcRtwbRcwcRtwcRwpRTpRTfcRt =1 (4.1) where the effective resistance of the bolt row (Ft1,R) is the smallest value of the tension resistance of: column flange in bending (FTfc,R), end-plate in bending (FTp,R), column web in tension (Ftwc,R), beam web in tension (Ftwb,R), column web in compression (Fcwc,R), beam flange and web in compression (Fcfb,R), column web panel in shear (Vwp,R). The moment resistance, the joint initial stiffness and the yield rotation are provided by Eq. (1.1), Eq. (1.2) and Eq. (1.7) respectively. Eurocode 3 allows dealing with the web panel zone in shear in two alternative ways:
1. the column web panel zone contribution to strength and stiffness is assembled together with the other joint components in order to obtain mechanical properties of one single spring characterizing the joint moment-rotation response;
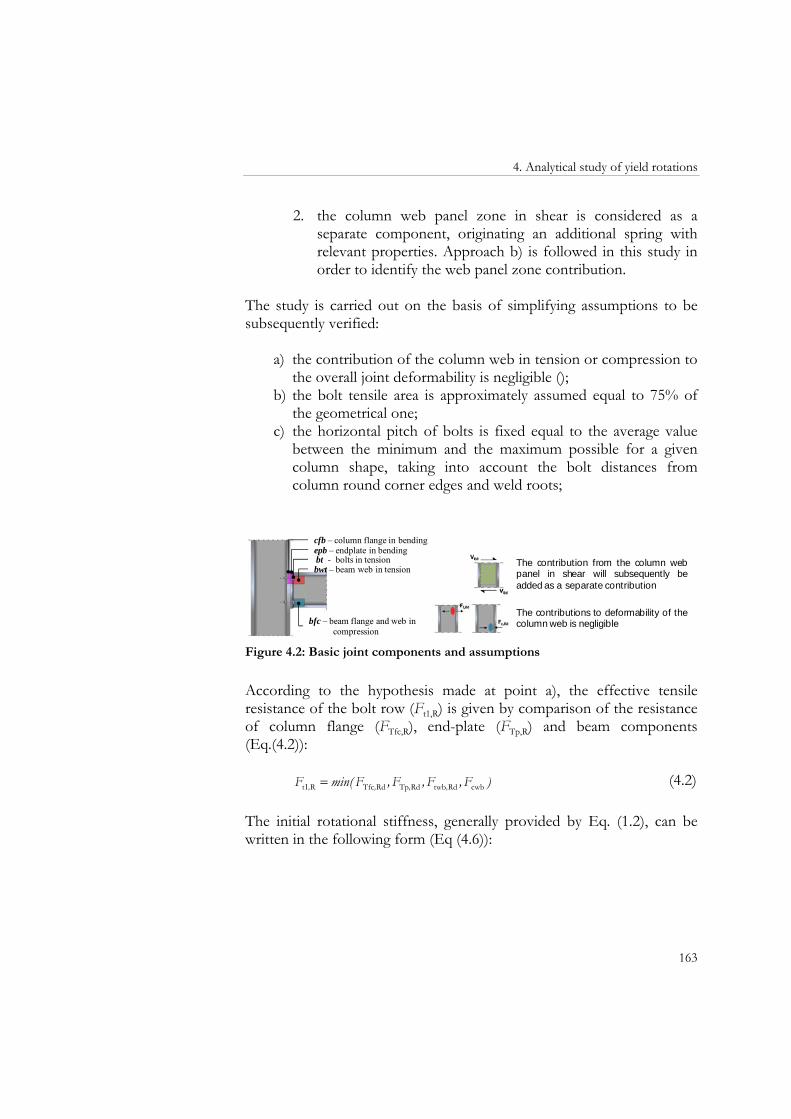
4. Analytical study of yield rotations
163
2. the column web panel zone in shear is considered as a separate component, originating an additional spring with relevant properties. Approach b) is followed in this study in order to identify the web panel zone contribution.
The study is carried out on the basis of simplifying assumptions to be subsequently verified:
a) the contribution of the column web in tension or compression to the overall joint deformability is negligible ();
b) the bolt tensile area is approximately assumed equal to 75% of the geometrical one;
c) the horizontal pitch of bolts is fixed equal to the average value between the minimum and the maximum possible for a given column shape, taking into account the bolt distances from column round corner edges and weld roots;
cfb – column flange in bendingepb – endplate in bendingbt - bolts in tensionbwt – beam web in tension
The contribution from the column webpanel in shear will subsequently beadded as a separate contribution
The contributions to deformability of thecolumn web is negligiblebfc – beam flange and web in
compression Figure 4.2: Basic joint components and assumptions
According to the hypothesis made at point a), the effective tensile resistance of the bolt row (Ft1,R) is given by comparison of the resistance of column flange (FTfc,R), end-plate (FTp,R) and beam components (Eq.(4.2)): )F,F,F,Fmin(F ,,,, cwbRdtwbRdTpRdTfcRt =1 (4.2) The initial rotational stiffness, generally provided by Eq. (1.2), can be written in the following form (Eq (4.6)):
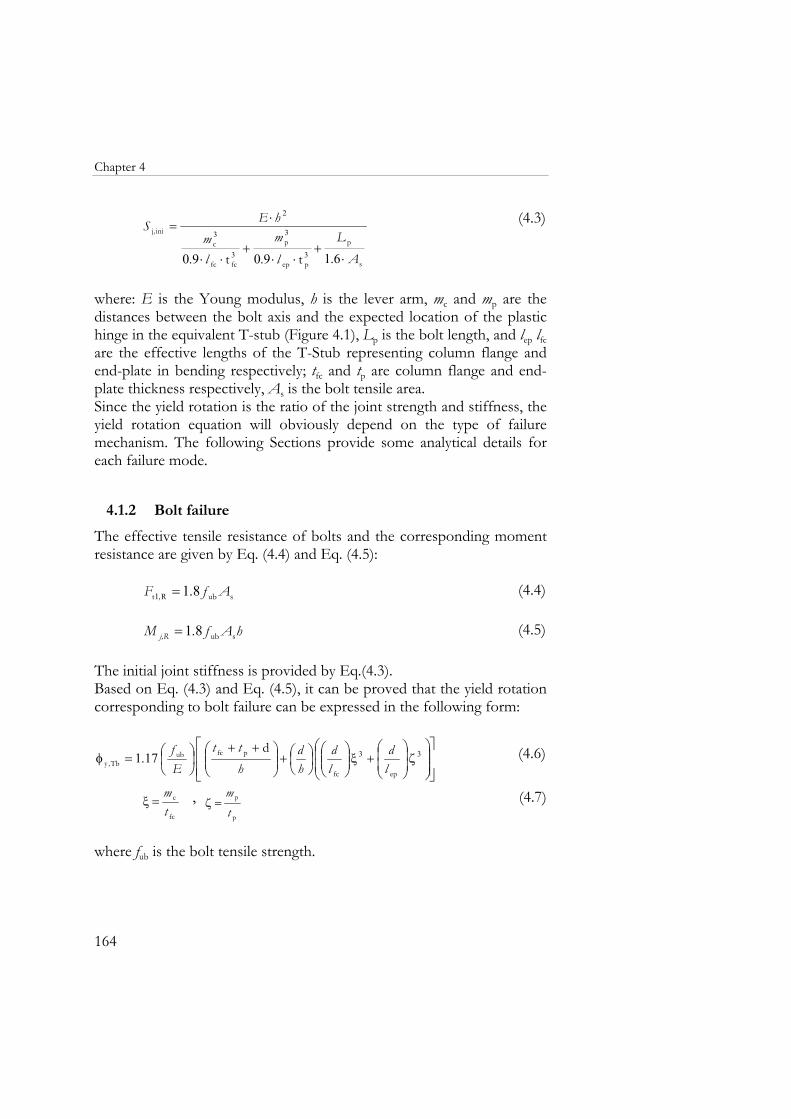
Chapter 4
164
s
p
pep
p
fcfc
c
inij
tt A.L
l.
m
l.m
hES ,
⋅+
⋅⋅+
⋅⋅
⋅=
619090 3
3
3
3
2 (4.3)
where: E is the Young modulus, h is the lever arm, mc and mp are the distances between the bolt axis and the expected location of the plastic hinge in the equivalent T-stub (Figure 4.1), Lp is the bolt length, and lep lfc are the effective lengths of the T-Stub representing column flange and end-plate in bending respectively; tfc and tp are column flange and end-plate thickness respectively, As is the bolt tensile area. Since the yield rotation is the ratio of the joint strength and stiffness, the yield rotation equation will obviously depend on the type of failure mechanism. The following Sections provide some analytical details for each failure mode.
4.1.2 Bolt failure
The effective tensile resistance of bolts and the corresponding moment resistance are given by Eq. (4.4) and Eq. (4.5): subRt Af.F , 811 = (4.4) hAf.M Rj, sub81= (4.5) The initial joint stiffness is provided by Eq.(4.3). Based on Eq. (4.3) and Eq. (4.5), it can be proved that the yield rotation corresponding to bolt failure can be expressed in the following form:
⎥⎥⎦
⎤
⎢⎢⎣
⎡
⎟⎟
⎠
⎞
⎜⎜
⎝
⎛ζ⎟
⎟⎠
⎞⎜⎜⎝
⎛+ξ⎟⎟
⎠
⎞⎜⎜⎝
⎛⎟⎠⎞
⎜⎝⎛+⎟⎟
⎠
⎞⎜⎜⎝
⎛ ++⎟⎠⎞
⎜⎝⎛=φ 33171
ld
ld
hd
htt
Ef
.,epfc
pfcubTby
d (4.6)
fc
c
tm
=ξ , p
p
tm
=ζ (4.7)
where fub is the bolt tensile strength.
4. Analytical study of yield rotations
165
4.1.3 End-plate failure
In case of complete flange yielding, the effective tensile resistance and the design moment resistance are expressed by Eq. (4.8) and Eq. (4.9):
p
epplRt m
MF ,
,1
1
4= (4.8)
hm
ftlh
mM
M ,, ⋅=⋅=
p
yppep
p
epplRj
2114 (4.9)
where Mpl,ep1 is the T-stub flange plastic moment for mode a) (Eurocode 3). Mpl,ep1 is then given by (0.25lep1tp2fyp), with lep1 being the end-plate effective length, computed as lep1=min (2πmp; αmp) and fyp is the plate yield strength. Consequently the yield rotation is given by Eq. (4.10):
( )
lt
lt
d
t dttht
Ef
.,⎥⎥⎦
⎤
⎢⎢⎣
⎡
⎟⎟
⎠
⎞
⎜⎜
⎝
⎛ζ⎟
⎟⎠
⎞⎜⎜⎝
⎛+ξ⎟⎟
⎠
⎞⎜⎜⎝
⎛+⎟⎟
⎠
⎞⎜⎜⎝
⎛ ++=φ 33
21 55ep
p
fc
pppfcpypTpy
(4.10)
In case of a mixed failure mechanism (flange yielding and bolt failure), the effective tensile strength Ft1,R and the moment resistance are given by Eq. (4.11) and Eq. (4.12):
epp
tRepepplRt nm
FnMF ,
+
+= ∑2
1
2 (4.11)
hnmFn
hnm
MM , ⋅
++⋅
+= ∑
epp
tRep
pp
eppljR
22 (4.12)
where Mpl,ep2 is the T-stub flange flexural resistance according to a failure mode of type b). The latter results into a plastic flexural strength of the T-Stub flange given by (0.25lep2tp2fyp), with lep2 equal to (αmp ). Based on Equations (4.12) and (4.3) after some algebraic manipulation, it can be easily shown that the yield rotation for the mixed mode of failure can be expressed in terms of the yield rotations associated to the bare bolt failure and complete flange yielding mechanisms, as shown by Equation (4.22).
Chapter 4
166
( )( )
( ) ⎥⎥⎦
⎤
⎢⎢⎣
⎡
⎟⎟
⎠
⎞
⎜⎜
⎝
⎛ζ⎟
⎟⎠
⎞⎜⎜⎝
⎛+ξ⎟⎟
⎠
⎞⎜⎜⎝
⎛⎟⎠⎞
⎜⎝⎛+⎟⎟
⎠
⎞⎜⎜⎝
⎛ ++
++
+⎥⎥⎦
⎤
⎢⎢⎣
⎡
⎟⎟
⎠
⎞
⎜⎜
⎝
⎛ζ⎟
⎟⎠
⎞⎜⎜⎝
⎛+ξ⎟⎟
⎠
⎞⎜⎜⎝
⎛+⎟⎟
⎠
⎞⎜⎜⎝
⎛ ++
+=φ
33
3322
171
5521
ld
ld
hd
hdtt
Ef
nmn
.
lt
ltt dtt
ht
Ef.
nmm
,
epfc
pfcub
epp
ep
ep
p
fc
pppfcpyp
epp
p
Tpy d (4.13)
4.1.4 Column flange failure
In case of complete column flange yielding, the effective tensile resistance and the moment resistance are given respectively by Eq. (4.26) and Eq. (4.27):
c
fcplRt m
MF ,
,1
1
4= (4.14)
hm
ftlh
mM
M ,, ⋅=⋅=
c
yfcfcfc
c
fcplRj
2114 (4.15)
where Mpl,fc1 is the T-stub flange plastic moment and lfc1 is the effective length for a failure mode of type a). The equivalent T-stub flange plastic moment is given by (0.25lfc1tfc2fyfc), with lfc1 obtained as min (2πmc; 4mc+1,25 mc) (fyfc is the column flange yield strength). Consequently, the yield rotation is given by Eq. (4.28).
( )
lt
lt
d
t dttht
Ef
.,⎥⎥⎦
⎤
⎢⎢⎣
⎡ζ⎟⎟⎠
⎞⎜⎜⎝
⎛+ξ⎟⎟
⎠
⎞⎜⎜⎝
⎛+⎟⎟
⎠
⎞⎜⎜⎝
⎛ ++=φ 33
21 266ep
fc
fc
fcfcpfcfcyfcTfcy
(4.16)
Similar to the case of end-plate failure, also in the case of column flange failure, the yield rotation associated to the combined mechanism (flange yielding and bolts failure) is expressed in terms of yield rotations corresponding to the bare complete flange yielding and bolt failure mechanisms. The effective tensile resistance, the moment resistance and the joint are given by Eq. (4.17), Eq. (4.18) and (4.3) respectively. After some analytical manipulations, Eq. (4.33) is obtained.
epp
tRepfcplRt nm
FnMF ,
+
+= ∑2
1
2 (4.17)
4. Analytical study of yield rotations
167
hnmFn
hnm
M M , ⋅
++⋅
+= ∑
epp
tRep
pp
fcpljR
22 (4.18)
( )( )
( ) ⎥⎥⎦
⎤
⎢⎢⎣
⎡
⎟⎟
⎠
⎞
⎜⎜
⎝
⎛ζ⎟⎟⎠
⎞⎜⎜⎝
⎛+ξ⎟⎟
⎠
⎞⎜⎜⎝
⎛+⎟⎟
⎠
⎞⎜⎜⎝
⎛ ++
++
+⎥⎥⎦
⎤
⎢⎢⎣
⎡
⎟⎟
⎠
⎞
⎜⎜
⎝
⎛ζ⎟⎟⎠
⎞⎜⎜⎝
⎛+ξ⎟⎟
⎠
⎞⎜⎜⎝
⎛+
++
+=φ
hd
ld
ld
hdtt
Ef
nmn.
lt
lt
dt dtt
ht
Ef
nml.
,
33
332
22
171
211
epfc
pfcub
cc
c
ep
fc
fc
fcfcpfcfcyfc
cc
fcTfcy (4.19)
4.1.5 Beam failure
The strength of the beam web in tension is given by Eq. (4.35): ywbwbwbefftRt ftbF ,, =1 (4.35) where befft,wb is the effective width of the tensile zone, which is set by Eurocode 3 equal to the effective length of the equivalent T-stub representing the end-plate in bending, (i.e. befft,wb = min (2πmp; αmp )), twb and fywb are the beam web thickness and yield strength respectively. The corresponding yield rotation can then be expressed in the following form:
( )
ll
d
dtt
dp
h
tE
f.,
⎥⎥⎦
⎤
⎢⎢⎣
⎡⎟⎟⎠
⎞⎜⎜⎝
⎛ζ+ξ⎟⎟
⎠
⎞⎜⎜⎝
⎛+⎟⎟⎠
⎞⎜⎜⎝
⎛ ++=φ 3317211
fc
eppfcwbywbtwby . (4.36)
4.1.6 Analytical equations accuracy
As discussed at the previous Sections, a number of approximations have been made to derive Equations for the yield rotation. The net effect of all the approximations can only be evaluated by comparing the yield rotations calculated by means of the approximate Equations and the Eurocode 3 method. Such a comparison is shown in Figure 4.3. The graph represents the theoretical prediction of the connection yield rotation of the experimental tests described in the previous Chapter. The bold circle indicates the yield rotation calculated via the Eurocode rules (components method, CM), while hollow circles are used for the results of the analytical equations (AE).
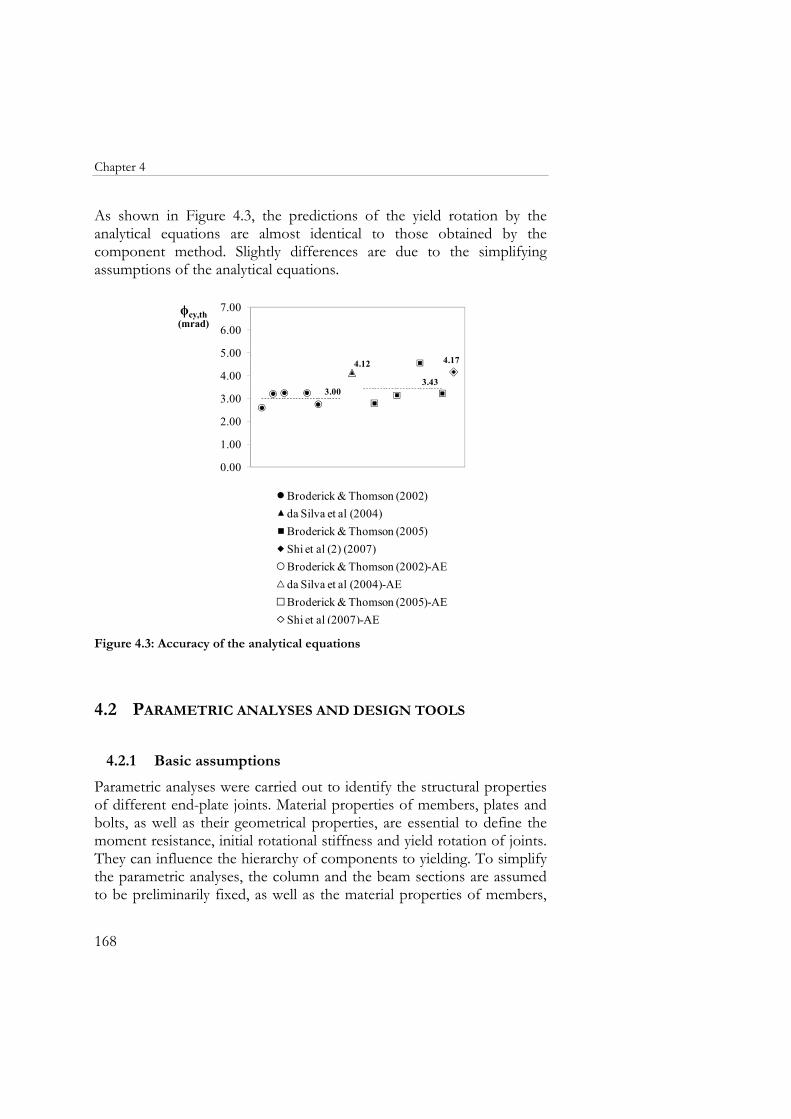
Chapter 4
168
As shown in Figure 4.3, the predictions of the yield rotation by the analytical equations are almost identical to those obtained by the component method. Slightly differences are due to the simplifying assumptions of the analytical equations.
4.12 4.17
3.003.43
0.00
1.00
2.00
3.00
4.00
5.00
6.00
7.00ϕcy,th (mrad)
Broderick & Thomson (2002)da Silva et al (2004)Broderick & Thomson (2005)Shi et al (2) (2007)Broderick & Thomson (2002)-AEda Silva et al (2004)-AEBroderick & Thomson (2005)-AEShi et al (2007)-AE
Figure 4.3: Accuracy of the analytical equations
4.2 PARAMETRIC ANALYSES AND DESIGN TOOLS
4.2.1 Basic assumptions
Parametric analyses were carried out to identify the structural properties of different end-plate joints. Material properties of members, plates and bolts, as well as their geometrical properties, are essential to define the moment resistance, initial rotational stiffness and yield rotation of joints. They can influence the hierarchy of components to yielding. To simplify the parametric analyses, the column and the beam sections are assumed to be preliminarily fixed, as well as the material properties of members,
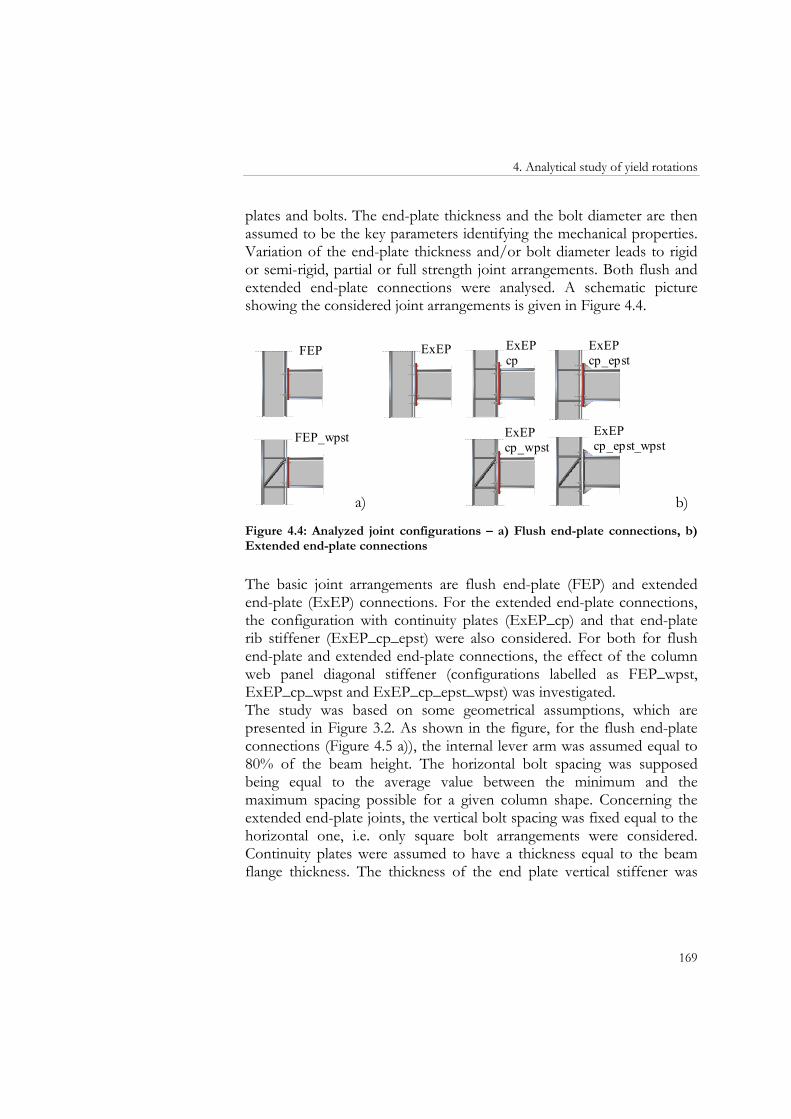
4. Analytical study of yield rotations
169
plates and bolts. The end-plate thickness and the bolt diameter are then assumed to be the key parameters identifying the mechanical properties. Variation of the end-plate thickness and/or bolt diameter leads to rigid or semi-rigid, partial or full strength joint arrangements. Both flush and extended end-plate connections were analysed. A schematic picture showing the considered joint arrangements is given in Figure 4.4.
FEP
FEP_wpst
a)
ExEPcp_wpst
ExEP ExEPcp
ExEPcp_epst
ExEPcp_epst_wpst
b)
Figure 4.4: Analyzed joint configurations – a) Flush end-plate connections, b) Extended end-plate connections
The basic joint arrangements are flush end-plate (FEP) and extended end-plate (ExEP) connections. For the extended end-plate connections, the configuration with continuity plates (ExEP_cp) and that end-plate rib stiffener (ExEP_cp_epst) were also considered. For both for flush end-plate and extended end-plate connections, the effect of the column web panel diagonal stiffener (configurations labelled as FEP_wpst, ExEP_cp_wpst and ExEP_cp_epst_wpst) was investigated. The study was based on some geometrical assumptions, which are presented in Figure 3.2. As shown in the figure, for the flush end-plate connections (Figure 4.5 a)), the internal lever arm was assumed equal to 80% of the beam height. The horizontal bolt spacing was supposed being equal to the average value between the minimum and the maximum spacing possible for a given column shape. Concerning the extended end-plate joints, the vertical bolt spacing was fixed equal to the horizontal one, i.e. only square bolt arrangements were considered. Continuity plates were assumed to have a thickness equal to the beam flange thickness. The thickness of the end plate vertical stiffener was
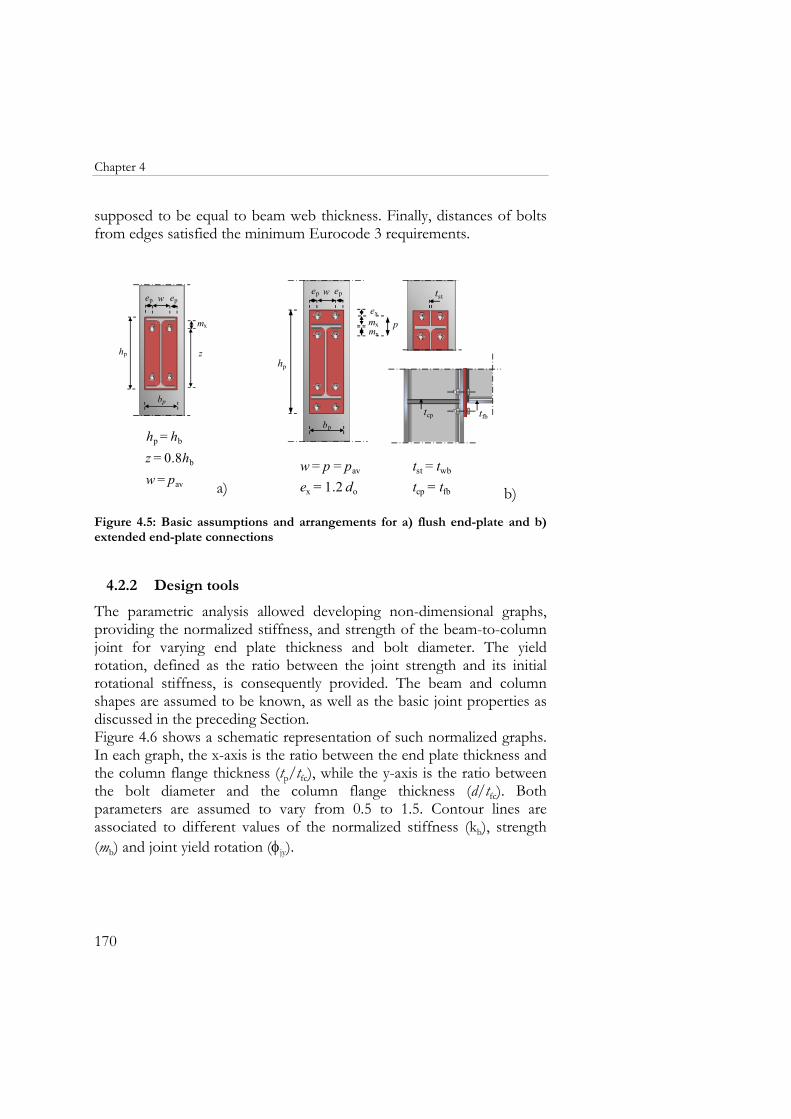
Chapter 4
170
supposed to be equal to beam web thickness. Finally, distances of bolts from edges satisfied the minimum Eurocode 3 requirements.
z = 0.8hb
hp = hb
w = pav
ep w
bp
hp
ep
mx
z
a)
ep w
bp
hp
ep
mxpmx
ex
w = p = pav
ex = 1.2 do
tst = twb
tcp = tfb
tst
tcp tfb
b)
Figure 4.5: Basic assumptions and arrangements for a) flush end-plate and b) extended end-plate connections
4.2.2 Design tools
The parametric analysis allowed developing non-dimensional graphs, providing the normalized stiffness, and strength of the beam-to-column joint for varying end plate thickness and bolt diameter. The yield rotation, defined as the ratio between the joint strength and its initial rotational stiffness, is consequently provided. The beam and column shapes are assumed to be known, as well as the basic joint properties as discussed in the preceding Section. Figure 4.6 shows a schematic representation of such normalized graphs. In each graph, the x-axis is the ratio between the end plate thickness and the column flange thickness (tp/tfc), while the y-axis is the ratio between the bolt diameter and the column flange thickness (d/tfc). Both parameters are assumed to vary from 0.5 to 1.5. Contour lines are associated to different values of the normalized stiffness (kb), strength (mb) and joint yield rotation (φjy).
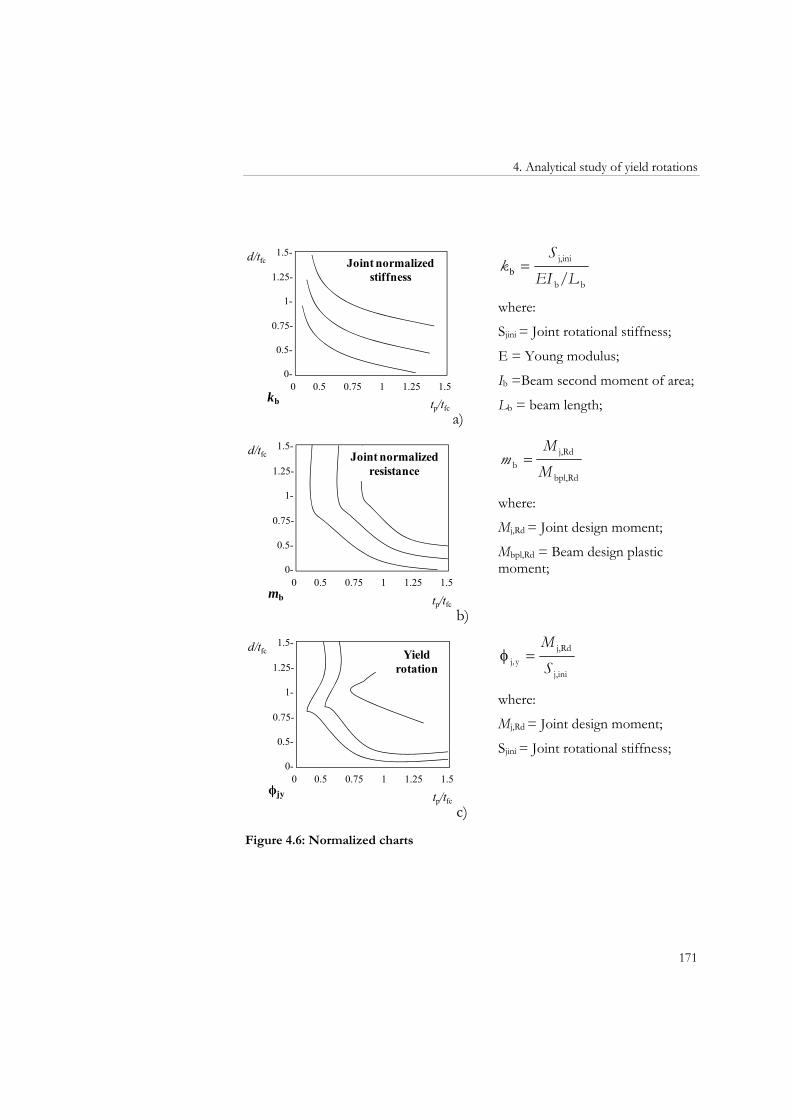
4. Analytical study of yield rotations
171
kb
Joint normalizedstiffness
d/tfc1.5-
1.25-
1-
0.75-
0.5-
0-0 0.5 0.75 1 1.25 1.5
tp/tfc
a)
bb
j,ini
/LEIS
k =b
where:
Sjini = Joint rotational stiffness;
E = Young modulus;
Ib =Beam second moment of area;
Lb = beam length;
mb
Joint normalizedresistance
d/tfc1.5-
1.25-
1-
0.75-
0.5-
0-0 0.5 0.75 1 1.25 1.5
tp/tfc
b)
bpl,Rd
j,Rdb M
Mm =
where:
Mj,Rd = Joint design moment;
Mbpl,Rd = Beam design plastic moment;
ϕjy
Yieldrotation
d/tfc1.5-
1.25-
1-
0.75-
0.5-
0-0 0.5 0.75 1 1.25 1.5
tp/tfc
c)
j,ini
j,Rdyj S
M, =φ
where:
Mj,Rd = Joint design moment;
Sjini = Joint rotational stiffness;
Figure 4.6: Normalized charts
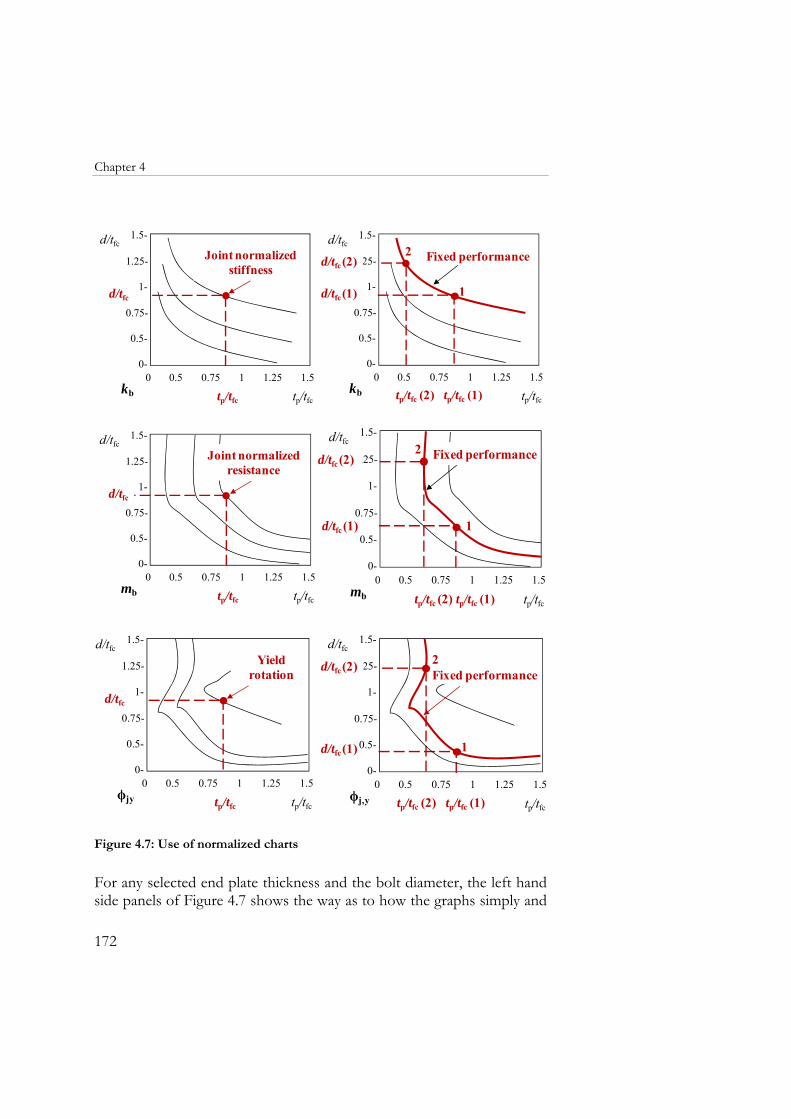
Chapter 4
172
kb tp/tfc
d/tfc
Joint normalizedstiffness
d/tfc1.5-
1.25-
1-
0.75-
0.5-
0-0 0.5 0.75 1 1.25 1.5
tp/tfckb tp/tfc (1)
d/tfc (1)
Fixed performanced/tfc
1.5-
1.25-
1-
0.75-
0.5-
0-0 0.5 0.75 1 1.25 1.5
tp/tfc
d/tfc (2)
tp/tfc (2) tp/tfc (1)
1
2
mb tp/tfc
d/tfc
Joint normalizedresistance
d/tfc1.5-
1.25-
1-
0.75-
0.5-
0-0 0.5 0.75 1 1.25 1.5
tp/tfcmb tp/tfc (1)
d/tfc (1)
d/tfc 1.5-
1.25-
1-
0.75-
0.5-
0-0 0.5 0.75 1 1.25 1.5
tp/tfc
d/tfc (2)
tp/tfc (2) tp/tfc (1)
2
1
Fixed performance
ϕjy tp/tfc
d/tfc
Yieldrotation
d/tfc1.5-
1.25-
1-
0.75-
0.5-
0-0 0.5 0.75 1 1.25 1.5
tp/tfcϕj,y tp/tfc (1)
d/tfc(1)
d/tfc1.5-
1.25-
1-
0.75-
0.5-
0-0 0.5 0.75 1 1.25 1.5
tp/tfc
d/tfc(2)
tp/tfc (2) tp/tfc (1)
1
Fixed performance2
Figure 4.7: Use of normalized charts
For any selected end plate thickness and the bolt diameter, the left hand side panels of Figure 4.7 shows the way as to how the graphs simply and
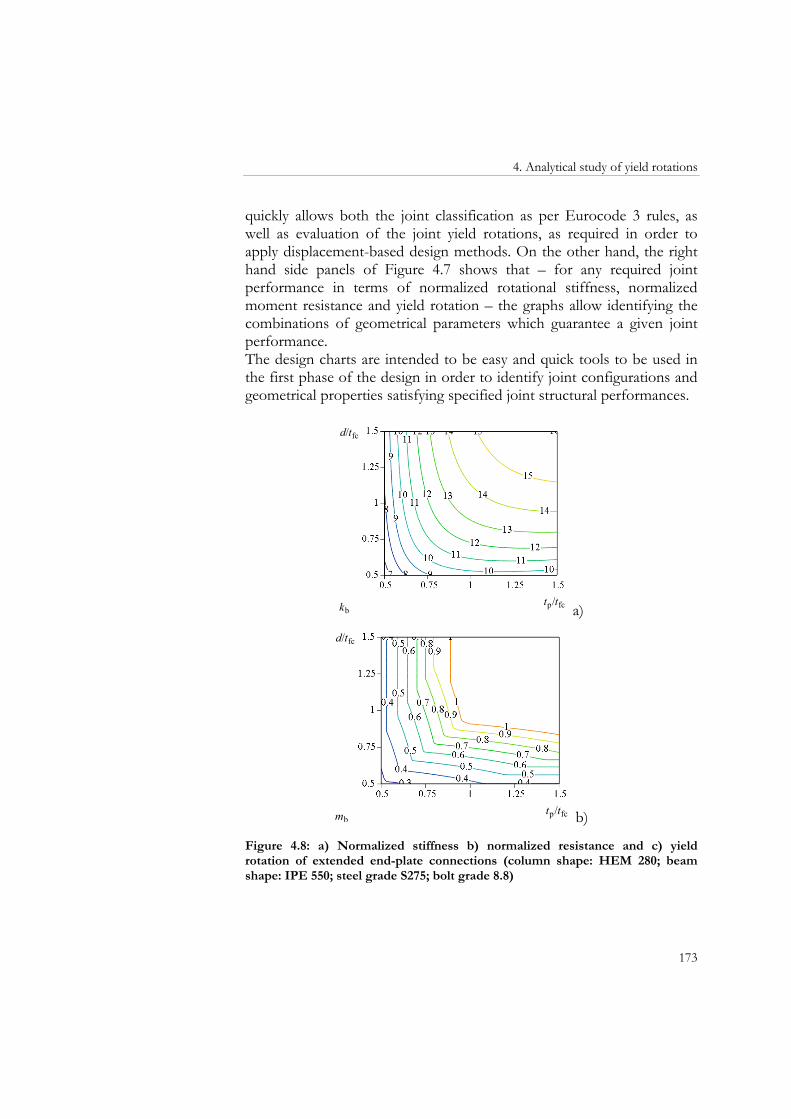
4. Analytical study of yield rotations
173
quickly allows both the joint classification as per Eurocode 3 rules, as well as evaluation of the joint yield rotations, as required in order to apply displacement-based design methods. On the other hand, the right hand side panels of Figure 4.7 shows that – for any required joint performance in terms of normalized rotational stiffness, normalized moment resistance and yield rotation – the graphs allow identifying the combinations of geometrical parameters which guarantee a given joint performance. The design charts are intended to be easy and quick tools to be used in the first phase of the design in order to identify joint configurations and geometrical properties satisfying specified joint structural performances.
d/tfc
tp/tfc kb a)
d/tfc
tp/tfcmb b)
Figure 4.8: a) Normalized stiffness b) normalized resistance and c) yield rotation of extended end-plate connections (column shape: HEM 280; beam shape: IPE 550; steel grade S275; bolt grade 8.8)
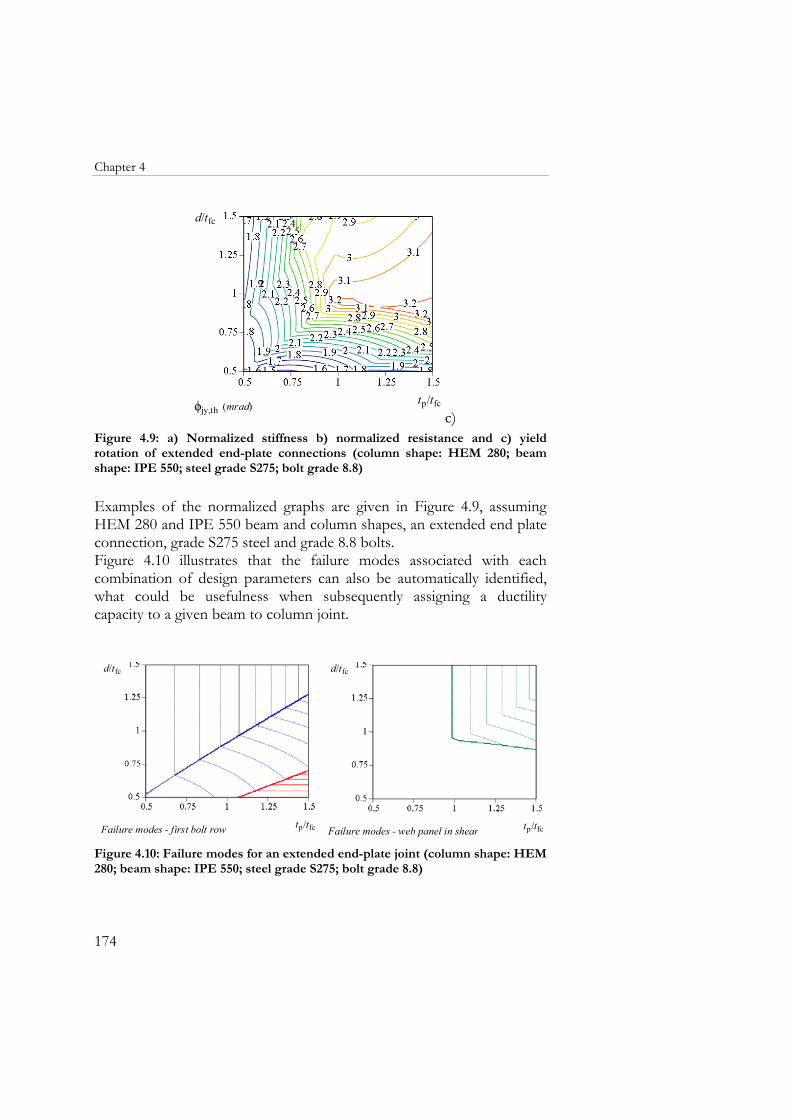
Chapter 4
174
d/tfc
tp/tfc ϕjy,th (mrad) c)
Figure 4.9: a) Normalized stiffness b) normalized resistance and c) yield rotation of extended end-plate connections (column shape: HEM 280; beam shape: IPE 550; steel grade S275; bolt grade 8.8)
Examples of the normalized graphs are given in Figure 4.9, assuming HEM 280 and IPE 550 beam and column shapes, an extended end plate connection, grade S275 steel and grade 8.8 bolts. Figure 4.10 illustrates that the failure modes associated with each combination of design parameters can also be automatically identified, what could be usefulness when subsequently assigning a ductility capacity to a given beam to column joint.
d/tfc
tp/tfcFailure modes - first bolt row
d/tfc
tp/tfcFailure modes - web panel in shear
Figure 4.10: Failure modes for an extended end-plate joint (column shape: HEM 280; beam shape: IPE 550; steel grade S275; bolt grade 8.8)
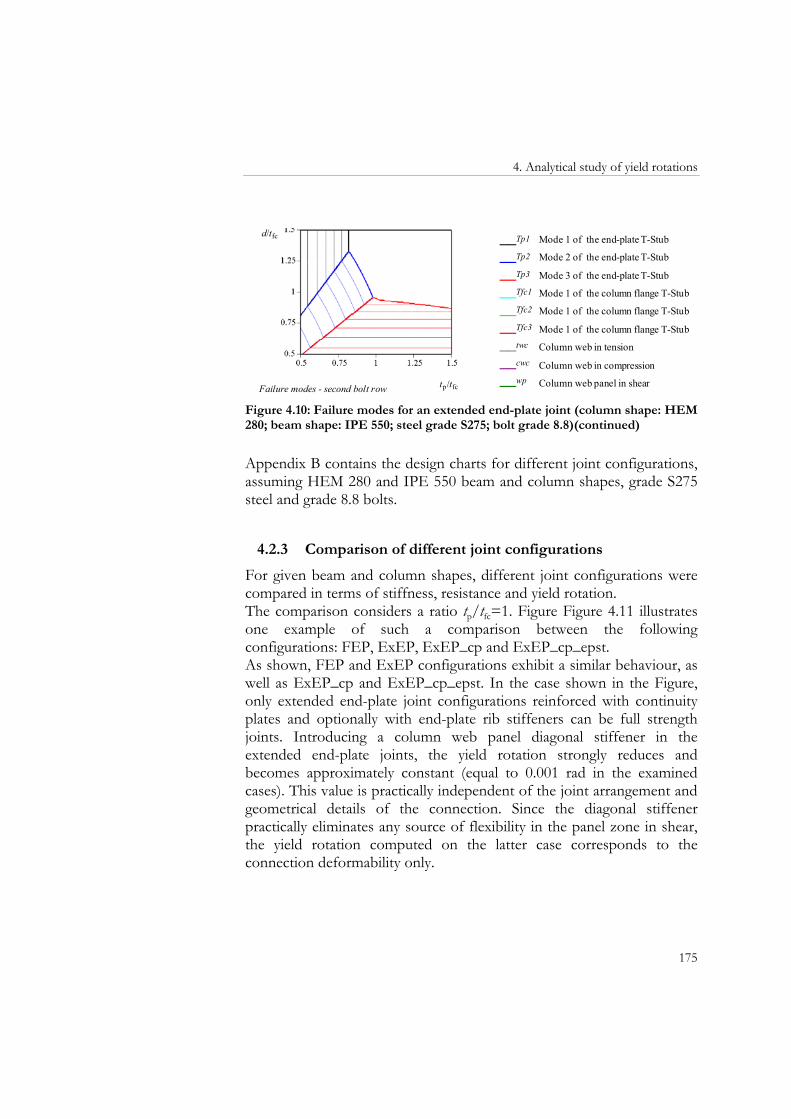
4. Analytical study of yield rotations
175
d/tfc
tp/tfc Failure modes - second bolt row
__Tp1
__Tp2
__Tp3
__Tfc1
__Tfc2
__Tfc3
__twc
__cwc
__wp
Mode 1 of the end-plate T-Stub
Mode 2 of the end-plate T-Stub
Mode 3 of the end-plate T-Stub
Mode 1 of the column flange T-Stub
Mode 1 of the column flange T-Stub
Mode 1 of the column flange T-Stub
Column web in tension
Column web in compression
Column web panel in shear
Figure 4.10: Failure modes for an extended end-plate joint (column shape: HEM 280; beam shape: IPE 550; steel grade S275; bolt grade 8.8)(continued)
Appendix B contains the design charts for different joint configurations, assuming HEM 280 and IPE 550 beam and column shapes, grade S275 steel and grade 8.8 bolts.
4.2.3 Comparison of different joint configurations
For given beam and column shapes, different joint configurations were compared in terms of stiffness, resistance and yield rotation. The comparison considers a ratio tp/tfc=1. Figure Figure 4.11 illustrates one example of such a comparison between the following configurations: FEP, ExEP, ExEP_cp and ExEP_cp_epst. As shown, FEP and ExEP configurations exhibit a similar behaviour, as well as ExEP_cp and ExEP_cp_epst. In the case shown in the Figure, only extended end-plate joint configurations reinforced with continuity plates and optionally with end-plate rib stiffeners can be full strength joints. Introducing a column web panel diagonal stiffener in the extended end-plate joints, the yield rotation strongly reduces and becomes approximately constant (equal to 0.001 rad in the examined cases). This value is practically independent of the joint arrangement and geometrical details of the connection. Since the diagonal stiffener practically eliminates any source of flexibility in the panel zone in shear, the yield rotation computed on the latter case corresponds to the connection deformability only.
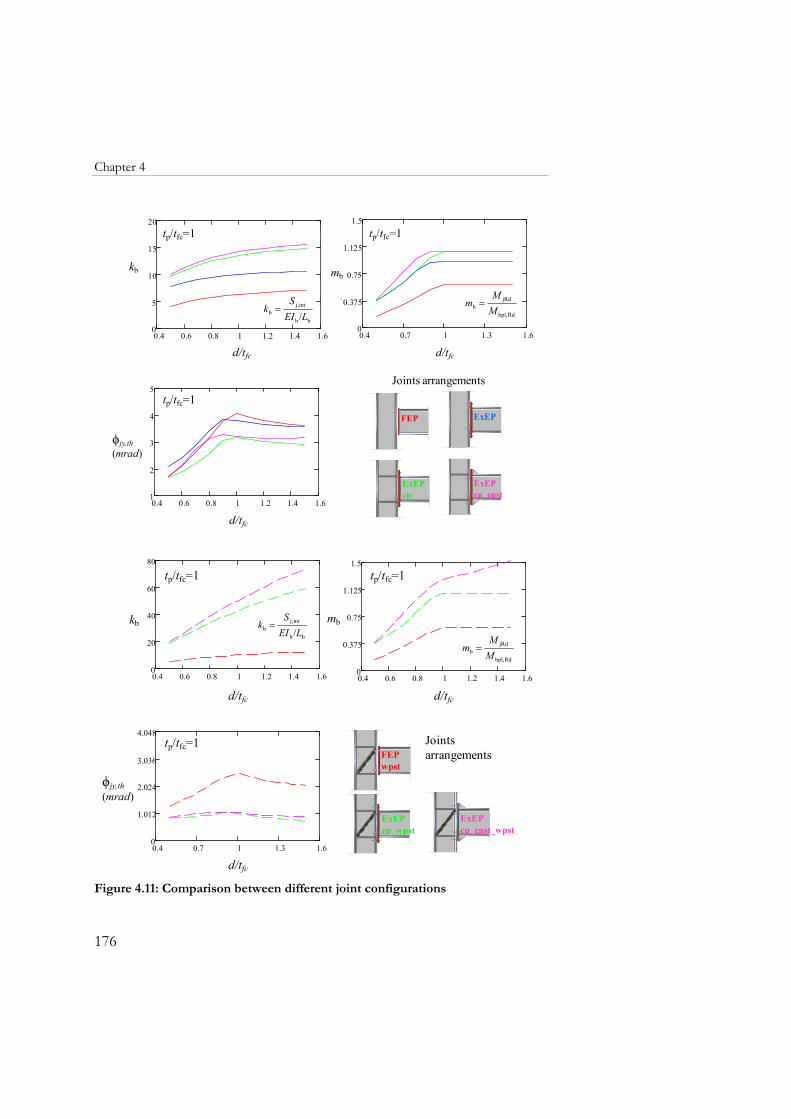
Chapter 4
176
ϕjy,th(mrad)
0.4 0.6 0.8 1 1.2 1.4 1.61
2
3
4
5
t
ρd_tfcd/tfc
Rdbpl,
jRdb M
Mm =
0.4 0.7 1 1.3 1.60
0.375
0.75
1.125
1.5
t
ρd_tfcd/tfc
tp/tfc=1
mb
tp/tfc=1
bb
inij,b /LEI
Sk =
0.4 0.6 0.8 1 1.2 1.4 1.60
5
10
15
20
t
ρd_tfcd/tfc
tp/tfc=1
kb
ExEPcp_epst
ExEPcp
FEP ExEP
Joints arrangements
ExEPcp_epst_wpst
ExEPcp_wpst
FEPwpst
tp/tfc=1
ϕjy,th(mrad)
0.4 0.7 1 1.3 1.60
1.012
2.024
3.036
4.048
ρd_tfcd/tfc
Rdbpl,
jRdb M
Mm =
tp/tfc=1
mb
0.4 0.6 0.8 1 1.2 1.4 1.60
0.375
0.75
1.125
1.5
ρd_tfcd/tfc
0.4 0.6 0.8 1 1.2 1.4 1.60
20
40
60
80
ρd_tfc
bb
inij,b /LEI
Sk =
tp/tfc=1
kb
d/tfc
Joints arrangements
Figure 4.11: Comparison between different joint configurations
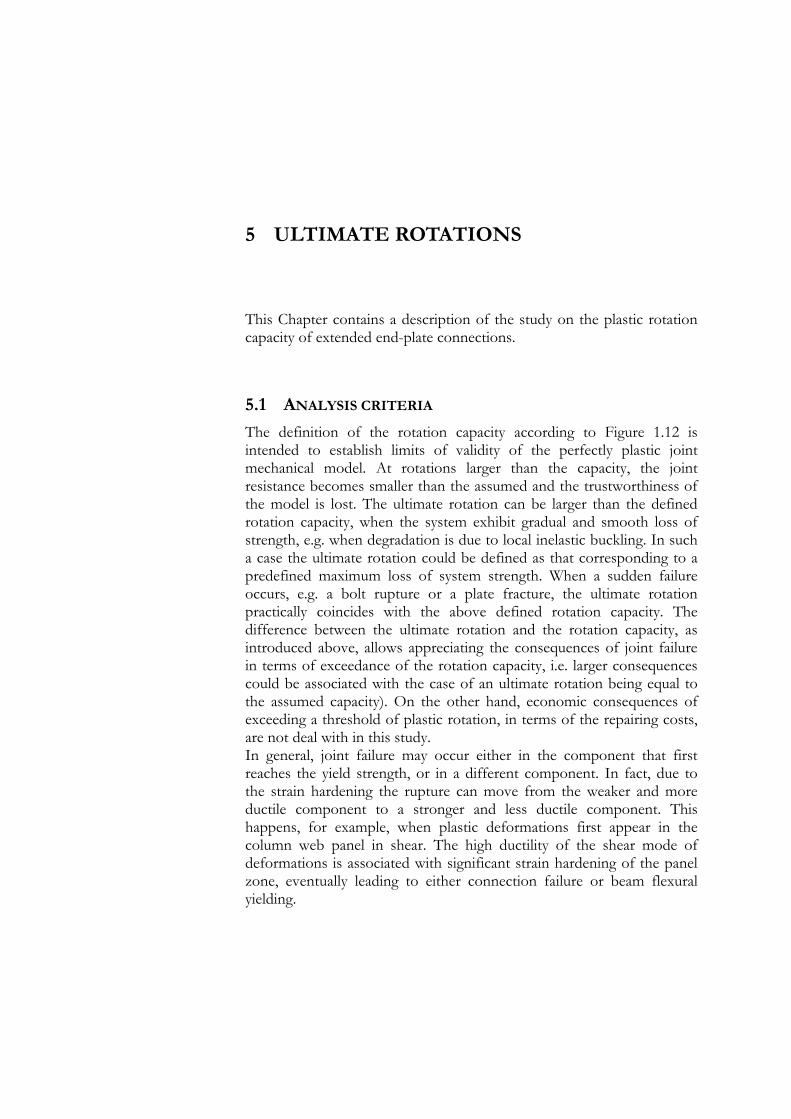
5 ULTIMATE ROTATIONS
This Chapter contains a description of the study on the plastic rotation capacity of extended end-plate connections.
5.1 ANALYSIS CRITERIA
The definition of the rotation capacity according to Figure 1.12 is intended to establish limits of validity of the perfectly plastic joint mechanical model. At rotations larger than the capacity, the joint resistance becomes smaller than the assumed and the trustworthiness of the model is lost. The ultimate rotation can be larger than the defined rotation capacity, when the system exhibit gradual and smooth loss of strength, e.g. when degradation is due to local inelastic buckling. In such a case the ultimate rotation could be defined as that corresponding to a predefined maximum loss of system strength. When a sudden failure occurs, e.g. a bolt rupture or a plate fracture, the ultimate rotation practically coincides with the above defined rotation capacity. The difference between the ultimate rotation and the rotation capacity, as introduced above, allows appreciating the consequences of joint failure in terms of exceedance of the rotation capacity, i.e. larger consequences could be associated with the case of an ultimate rotation being equal to the assumed capacity). On the other hand, economic consequences of exceeding a threshold of plastic rotation, in terms of the repairing costs, are not deal with in this study. In general, joint failure may occur either in the component that first reaches the yield strength, or in a different component. In fact, due to the strain hardening the rupture can move from the weaker and more ductile component to a stronger and less ductile component. This happens, for example, when plastic deformations first appear in the column web panel in shear. The high ductility of the shear mode of deformations is associated with significant strain hardening of the panel zone, eventually leading to either connection failure or beam flexural yielding.
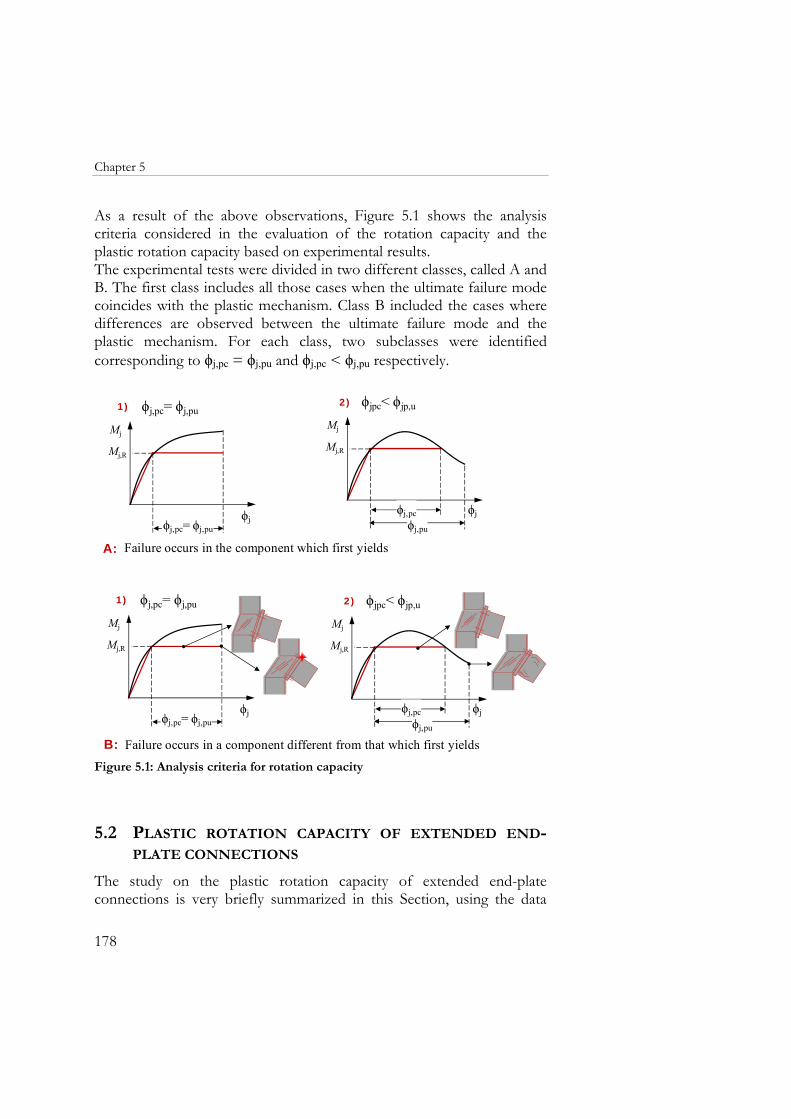
Chapter 5
178
As a result of the above observations, Figure 5.1 shows the analysis criteria considered in the evaluation of the rotation capacity and the plastic rotation capacity based on experimental results. The experimental tests were divided in two different classes, called A and B. The first class includes all those cases when the ultimate failure mode coincides with the plastic mechanism. Class B included the cases where differences are observed between the ultimate failure mode and the plastic mechanism. For each class, two subclasses were identified corresponding to ϕj,pc = ϕj,pu and ϕj,pc < ϕj,pu respectively.
Failure occurs in the component which first yieldsA:
Failure occurs in a component different from that which first yieldsB:
ϕj,pc= ϕj,pu
Mj,R
Mj
ϕj
Mj,R
Mj
ϕj,pu
ϕj,pc ϕj
ϕj,pc= ϕj,pu
Mj,R
Mj
ϕj
Mj,R
Mj
ϕj,pu
ϕj,pc ϕj
2) ϕjpc< ϕjp,u1) ϕj,pc= ϕj,pu
1) ϕj,pc= ϕj,pu 2) ϕjpc< ϕjp,u
Figure 5.1: Analysis criteria for rotation capacity
5.2 PLASTIC ROTATION CAPACITY OF EXTENDED END-PLATE CONNECTIONS
The study on the plastic rotation capacity of extended end-plate connections is very briefly summarized in this Section, using the data
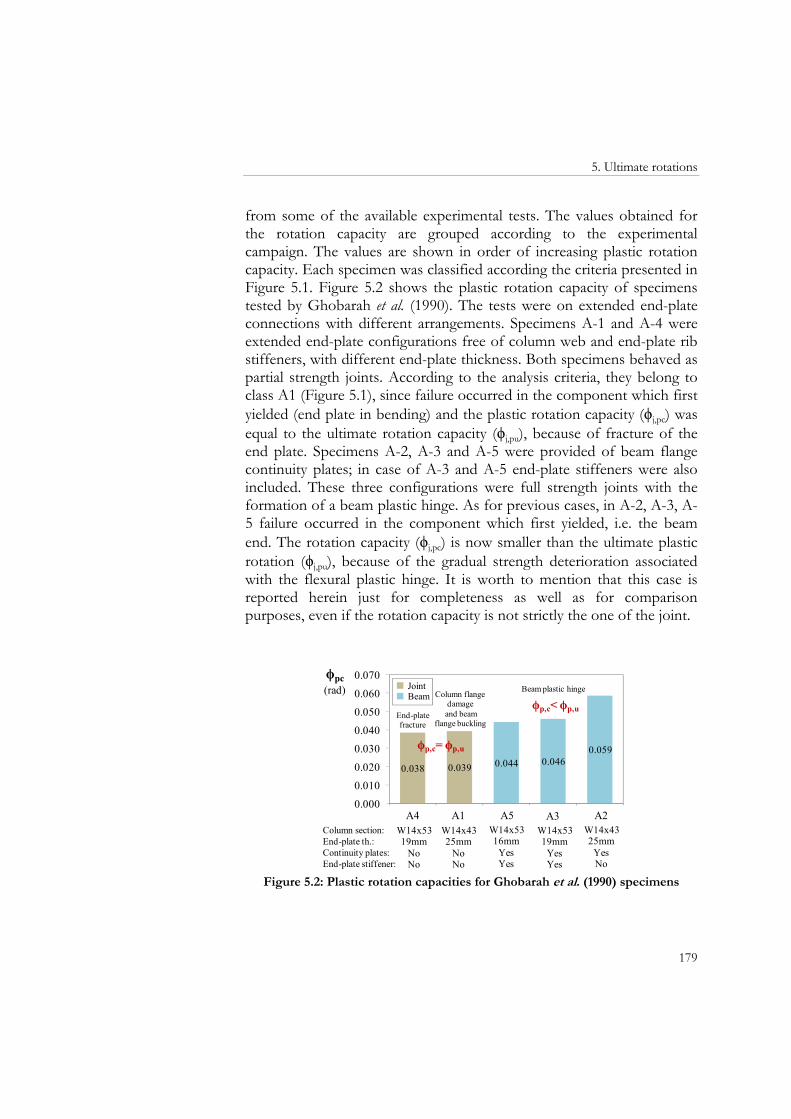
5. Ultimate rotations
179
from some of the available experimental tests. The values obtained for the rotation capacity are grouped according to the experimental campaign. The values are shown in order of increasing plastic rotation capacity. Each specimen was classified according the criteria presented in Figure 5.1. Figure 5.2 shows the plastic rotation capacity of specimens tested by Ghobarah et al. (1990). The tests were on extended end-plate connections with different arrangements. Specimens A-1 and A-4 were extended end-plate configurations free of column web and end-plate rib stiffeners, with different end-plate thickness. Both specimens behaved as partial strength joints. According to the analysis criteria, they belong to class A1 (Figure 5.1), since failure occurred in the component which first yielded (end plate in bending) and the plastic rotation capacity (ϕj,pc) was equal to the ultimate rotation capacity (ϕj,pu), because of fracture of the end plate. Specimens A-2, A-3 and A-5 were provided of beam flange continuity plates; in case of A-3 and A-5 end-plate stiffeners were also included. These three configurations were full strength joints with the formation of a beam plastic hinge. As for previous cases, in A-2, A-3, A-5 failure occurred in the component which first yielded, i.e. the beam end. The rotation capacity (ϕj,pc) is now smaller than the ultimate plastic rotation (ϕj,pu), because of the gradual strength deterioration associated with the flexural plastic hinge. It is worth to mention that this case is reported herein just for completeness as well as for comparison purposes, even if the rotation capacity is not strictly the one of the joint.
0.038 0.039 0.044 0.0460.059
0.000
0.010
0.020
0.030
0.040
0.050
0.060
0.070
1
ϕpu
(rad)
W14x5319mm
NoNo
W14x4325mm
NoNo
W14x5319mm
YesYes
W14x4325mm
YesNo
W14x5316mm
YesYes
A4 A1 A3A5 A2
End-platefracture
Column flange damageand beam
flange buckling
Beam plastic hinge
Column section:End-plate th.:Continuity plates:End-plate stiffener:
JointBeam
ϕpc
ϕp,c< ϕp,u
ϕp,c= ϕp,u
Figure 5.2: Plastic rotation capacities for Ghobarah et al. (1990) specimens
Chapter 5
180
The specimen tested by Sumner and Murray (2002) was an extended end plate connection with beam continuity plates and a column web reinforcing plate. This is one more case where the joint exhibited full strength allowing the formation of a beam plastic hinge. This test is classified as A2 (Figure 5.1). In fact, the plastic mechanism coincides with the ultimate failure mode and the rotation capacity is smaller than the ultimate rotation of the joint (Figure 5.3). The plastic rotation capacity is comparable to the one exhibited in the tests by Ghobarah et al. (Figure 5.2).
EC3 prediction
Experimental curveCyclic curve envelope
ϕ(Mmax)+= 0.042
Mmax+ =11700 kips in
ϕc+ = 0.055
ϕc- = 0.050
ϕ(Mmax)-= 0.040
Mmax- =11600 kips in
Figure 5.3: Plastic rotation capacities for specimen 4E-1.25-1.5-24 tested by Sumner and Murray (2002)
Plastic rotation capacities of the specimens tested by Shi et al. (2007a and b) are given in Figure 5.4 and Figure 5.5. The two Figures are relevant to two different experimental investigations carried out by the Authors. In both cases extended end-plate connections with continuity plates and end-plate rib stiffeners were analyzed. Differences between the two sets of experimental tests were the loading protocols and the investigated joint parameters. In the first experimental activity, the specimens were tested under monotonic loads and the influence of the end-plate thickness and/or the bolt diameter on the joint behaviour was studied. The second experimental campaign considered cyclic loading protocols and, in addition to the geometrical parameters studied with the former
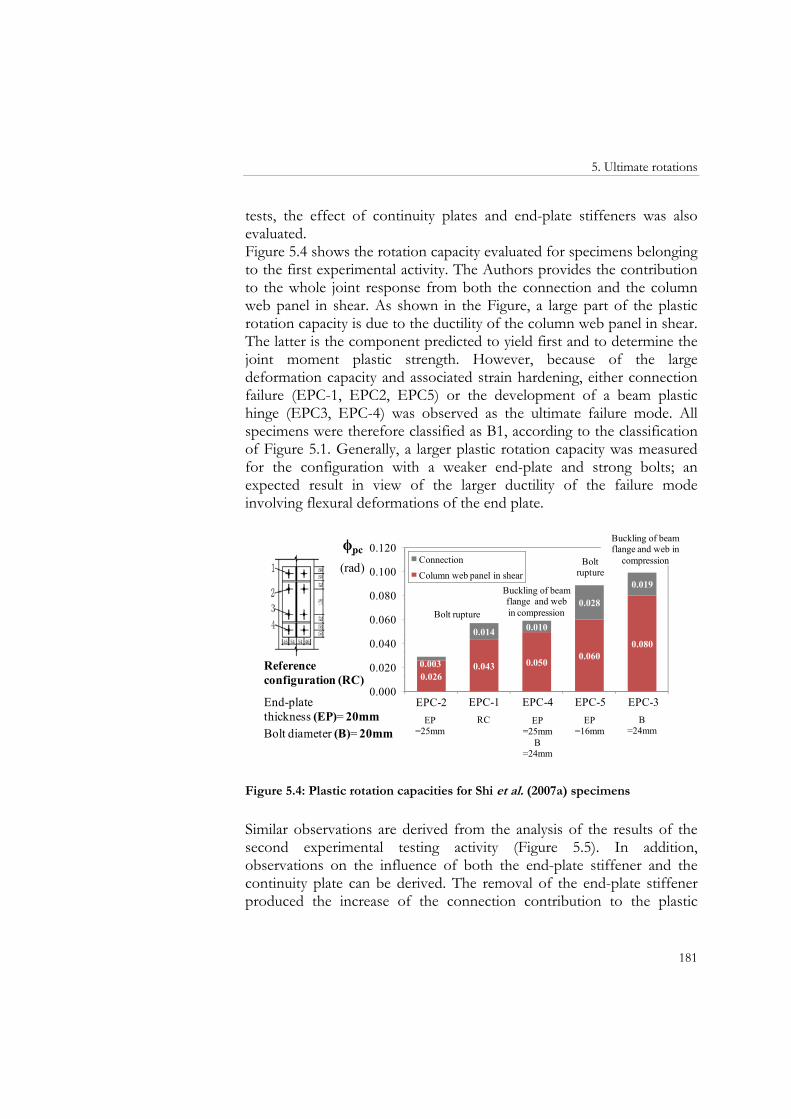
5. Ultimate rotations
181
tests, the effect of continuity plates and end-plate stiffeners was also evaluated. Figure 5.4 shows the rotation capacity evaluated for specimens belonging to the first experimental activity. The Authors provides the contribution to the whole joint response from both the connection and the column web panel in shear. As shown in the Figure, a large part of the plastic rotation capacity is due to the ductility of the column web panel in shear. The latter is the component predicted to yield first and to determine the joint moment plastic strength. However, because of the large deformation capacity and associated strain hardening, either connection failure (EPC-1, EPC2, EPC5) or the development of a beam plastic hinge (EPC3, EPC-4) was observed as the ultimate failure mode. All specimens were therefore classified as B1, according to the classification of Figure 5.1. Generally, a larger plastic rotation capacity was measured for the configuration with a weaker end-plate and strong bolts; an expected result in view of the larger ductility of the failure mode involving flexural deformations of the end plate.
0.0260.043 0.050
0.0600.080
0.003
0.014 0.010
0.028
0.019
0.000
0.020
0.040
0.060
0.080
0.100
0.120
1 2 3 4 5
ϕpu
(rad)ConnectionColumn web panel in shear
EP=25mm
RC B=24mm
EP=25mm
B=24mm
EP=16mm
EPC-2 EPC-1 EPC-4 EPC-5 EPC-3
Bolt rupture
Buckling of beam flange and web in compression
Boltrupture
Buckling of beam flange and web in
compression
Reference configuration (RC)
End-plate thickness (EP)= 20mmBolt diameter (B)= 20mm
ϕpc
Figure 5.4: Plastic rotation capacities for Shi et al. (2007a) specimens
Similar observations are derived from the analysis of the results of the second experimental testing activity (Figure 5.5). In addition, observations on the influence of both the end-plate stiffener and the continuity plate can be derived. The removal of the end-plate stiffener produced the increase of the connection contribution to the plastic
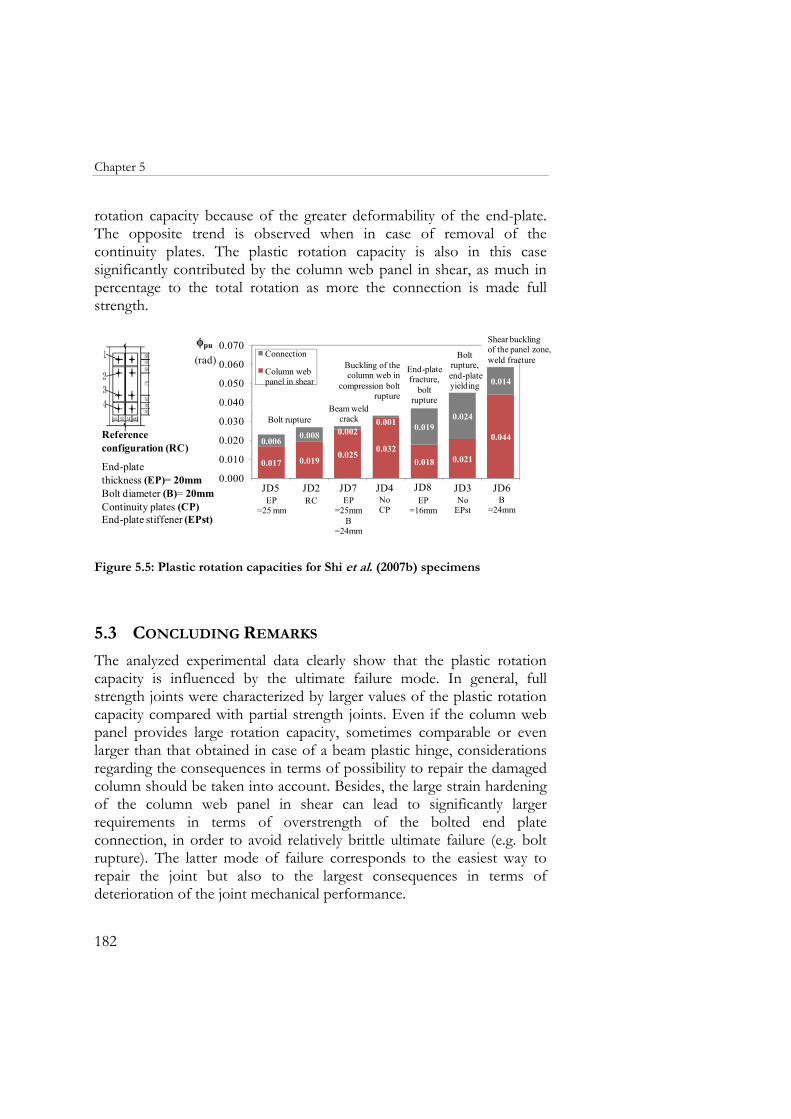
Chapter 5
182
rotation capacity because of the greater deformability of the end-plate. The opposite trend is observed when in case of removal of the continuity plates. The plastic rotation capacity is also in this case significantly contributed by the column web panel in shear, as much in percentage to the total rotation as more the connection is made full strength.
0.017 0.0190.025
0.0320.018 0.021
0.0440.0060.008 0.002
0.001 0.0190.024
0.014
0.000
0.010
0.020
0.030
0.040
0.050
0.060
0.070
19 22 24
ϕpu
(rad) Connection
Column web panel in shear
NoCP
EP=25 mm
EP=16mm
No EPst
B=24mm
RC EP=25mm
B=24mm
JD5 JD2 JD7 JD4 JD8 JD3 JD6
Bolt rupture
Bolt rupture,end-plate yielding
Buckling of the column web in
compression bolt rupture
Shear buckling of the panel zone,weld fracture
Beam weld crack
End-plate fracture,
bolt rupture
Reference configuration (RC)
End-plate thickness (EP)= 20mmBolt diameter (B)= 20mmContinuity plates (CP)End-plate stiffener (EPst)
Figure 5.5: Plastic rotation capacities for Shi et al. (2007b) specimens
5.3 CONCLUDING REMARKS
The analyzed experimental data clearly show that the plastic rotation capacity is influenced by the ultimate failure mode. In general, full strength joints were characterized by larger values of the plastic rotation capacity compared with partial strength joints. Even if the column web panel provides large rotation capacity, sometimes comparable or even larger than that obtained in case of a beam plastic hinge, considerations regarding the consequences in terms of possibility to repair the damaged column should be taken into account. Besides, the large strain hardening of the column web panel in shear can lead to significantly larger requirements in terms of overstrength of the bolted end plate connection, in order to avoid relatively brittle ultimate failure (e.g. bolt rupture). The latter mode of failure corresponds to the easiest way to repair the joint but also to the largest consequences in terms of deterioration of the joint mechanical performance.
5. Ultimate rotations
183
In addition to the above comments, it is noted that when strain hardening is responsible for the ultimate failure mode being different from the main (initial) plastic mechanism, then it is difficult to associate a plastic rotation capacity to the joint response, unless large variations of the real values are accepted as respect to the nominal one. This is because of the many different potential ultimate failure modes and the small quantity of available experimental data. Therefore, a characterization of the strain hardening of joint components is a necessary requisite in view of the development of rational methods to assess the joint rotation capacity.

Chapter 5
184
6 CONCLUSIONS
The recognition of the key role of displacements and deformations as reliable and direct index of structural damage caused by earthquakes recently produced a shift in seismic design and assessment philosophy. Implementing displacement-based design methods for moment-resisting frame structures requires the characterization of limit-state rotations for beam-to-column joints. Within this general framework the study presented in this Thesis was focused on joints between I-shaped beams and columns and with end-plate connections. Two limit-state rotations were considered: the yield rotation, the joint rotation capacity and the ultimate rotation. The yield rotation is intended as the rotation corresponding to initiation of significant plastic deformations within the joint. To establish limits of validity of the perfectly plastic joint mechanical model, the joint rotation capacity and the joint ultimate rotation were identified. The joint rotation capacity was defined as the maximum rotation corresponding to a measured resistance larger or equal than the theoretical resistance, while the ultimate rotation was considered as the rotation associated to some form of joint ultimate failure. When a sudden failure (i.e. an abrupt and large loss of strength) occurs, the ultimate rotation and the rotation capacity coincide. Conversely, if the system exhibit gradual and smooth loss of strength, the ultimate rotation can be larger than the defined rotation capacity. In this case the ultimate rotation could be defined as that corresponding to a predefined loss of system strength. In Europe, with reference to steel structures, advanced methods are available for calculating the stiffness and strength of beam-to-column joints. Among these, the mechanical approach, known as the component method, slowly became the reference to be used by most of the researchers. The ratio between the theoretical resistance and stiffness could be used to calculate the yield rotation, but an experimental verification of any design proposal is anyway required. Besides, information about joint rotation capacity and ductility is still missing or insufficient. Therefore, experimental data on beam-to-column end-plate
Chapter 6
186
joints were collected from the available technical literature. The experimental data were stored into an ad hoc digital data management system developed using Microsoft Access. This tool allows organizing and managing in a flexible manner the recorded data. The digital database permits also to retrieve easily any desired information from the experimental data ensemble. An analytical study of yield rotations was then carried out by means of the component method. The accuracy of the mechanical approach was evaluated by comparing the theoretical moment resistance and rotational stiffness with the experimental data. The comparison showed that the component method provides a good prediction of the resistance and stiffness in case of extended end-plate connections. In fact, the theoretical moment resistance and initial rotational stiffness resulted to underestimate the corresponding experimental values by 2% and 14% on average. This led to an overestimation of the yield rotation by 16% on average. For flush end-plate connections the comparison showed that the component method provides a joint rotational stiffness about 3 times higher than the experimental value. This was presumably due to the large end-plate width of the considered specimens which were not complying with the reference geometry originally used to develop the component method. The theoretical moment resistance resulted to overestimate the corresponding experimental values by about 5%. This produced an underestimation of the yield rotation by about 54%. Starting from the conventional definition of the yield rotation, analytical manipulations of the ratio between the joint moment resistance and initial stiffness led also to the identification of closed-form equations in case of flush end-plate connections. Since multiple failure modes are possible, a different Equation was derived for each of them. The derived Equations allowed recognizing the non-dimensional geometrical and material parameters influencing the joint rotations. Subsequently, exploiting the results of the analytical study carried out for flush connections and performing a parametric application of the component method for all types of connections led to the development of simplified design/analysis tools. Examples of such tools were provided in the form of design charts, allowing to evaluate the joint structural performance in terms of stiffness, resistance, failure mode and yield rotations. The design charts are easy and quick tools to be used in the first phases of the
6. Conclusions
187
design process, in order to identify joint configurations and geometrical properties satisfying specified joint structural performances. Concerning the study on the rotation capacity of extended end-plate connections, the analysis of experimental data highlighted that full strength connections are generally characterized by larger values of the plastic rotation capacity compared with partial strength connections. However, yielding of the column web panel in shear might provide large rotation capacity, sometimes comparable or even larger than that obtained in case of a beam plastic hinge. For partial strength joints, generally, a larger plastic rotation capacity is measured for the configuration with a weaker end-plate and stronger bolts, because of the larger ductility of the failure mode involving flexural deformations of the end plate. Investigations on the influence of both the end-plate stiffener and continuity plates showed that the removal of the end-plate stiffener produces the increase of the connection contribution to the plastic rotation capacity because of the greater deformability of the end-plate. The opposite trend was observed in case of removal of the continuity plates. One main conclusion derived from observation of experimental data is that strain hardening might be responsible for the ultimate failure mode being different from the main (initial) plastic mechanism. The most frequent case is represented by the column web panel in shear, where strain hardening of the shear mechanism can ultimately produce either connection failure or the development of a beam plastic hinge. In these cases, it is difficult to associate a plastic rotation capacity to the whole joint response because of the various potential ultimate failure modes and the small quantity of available experimental data. Therefore, further work should be addressed to a proper characterization of strain hardening of joint components, in view of a possible rational extension of the current component method to evaluate also the joint rotation capacity.

Chapter 6
188
REFERENCES
ANSI/AISC 341-10 (2010). Seismic Provisions for Structural Steel Buildings.
Broderick, B.M. and Thomson, A.W., (2002). The response of flush end-
plate joints under earthquake loading. Journal of Constructional Steel Research, 58:5, 1161-1175.
Broderick, B.M. and Thomson, A.W., (2005). Moment rotation response
of flush end-plate joints under cycling loading. Steel Structures, 5, 441-451.
da Silva, L.S., De Lima, L.R.O., , da S.Vellasco, P.C.G, de Andrade,
S.A.L., (2004). Behaviour of flush end-plate beam-to-column joints under bending and axial force, Steel and Composite structures, 4:2, 77–94.
Della Corte G., De Matteis G., Landolfo R. and Mazzolani F.M. (2002).
Seismic analysis of MR steel frames based on refined hysteretic models of connections. Journal of Constructional Steel Research, 58:10, 1331-1345.
Díaz, C., Martí, P., Victoria, M., Queri, O. M., (2011). Review on the
modelling of joint behaviour in steel frames. Journal of Constructional Steel Research, 67:5, 741-758.
European Committee for Standardisation (CEN) (2005). Eurocode 3.
Design of steel structures, part 1–8: design of joints (EN 1993-1-8:2005). Brussels.
Faella, C., Piluso, V., Rizzano, G., (2000). Structural Steel Semirigid
Connections, CRC Press, Florida, ISBN 0-8493-7433-2.
References
190
FEMA 350 (2000). Recommended Seismic Design Criteria for New Steel Moment-Frame Buildings.
Ghobarah, A., Osman, A., Korol, R.M. (1990). Behaviour of extended
end-plate connections under cyclic loading, Engineering Structures, 12, 15–27.
Jaspart, J.P., (1997) Contributions to recent advances in the field of steel
joints, Column bases and further configurations for bema-to-column joints and beam splices. Aggregation thesis. University of Liege, Liege.
Jaspart, J.P., (2000) General report: session on connections, Journal of
Constructional Steel Research, 55, 69-89. Moehle, J. P., (1996). Displacement based design criteria. Proceeding of
Eleventh World Conference on Earthquake Engineering. Nogueiro, P., Simões da Silva, L., Bento, R., Simões R., (2006).
Experimental behaviour of standardised european end-plate beam-to-column steel joints under arbitrary cyclic loading, Proceeding of Stability and ductility of steel structures. Lisbon, Portugal, September 6-8.
Priestley, M. J. N., (1993). Myth and fallacies in earthquake engineering –
conflicts between design and reality. ACI SP 157, 231-254. Priestley, M. J. N. and Calvi, G. M., (1997). Concepts and procedures for
direct displacement based design in (Fajfar & Krawinkler, eds.) Seismic design methodologies for the next generation of codes, 171-181, Balkema, Rotterdam.
Priestley, M.J.N. (1998). Displacement-Based Approaches to Rational
Limit States Design of New Structures. Keynote Address, Proc. XI European Conference of Earthquake Engineering, Paris.
SEAOC (1995). Vision 2000. Conceptual framework for performance based
seismic engineering of buildings. Structural Engineers Association of California, Sacramento, CA, USA.
References
191
Shibata, A. and Sozen, M. A., (1976). Substitute structure method for seismic design in R/C. Journal of the Structural Division, ASCE, 102:ST1, 1-18.
Shi, G., Shi, Y., Wang, Y., (2007a). Behaviour of end-plate moment
connections under earthquake loading, Engineering Structures, 29, pp. 703–716.
Shi, G., Shi, Y., Wang, Y., (2007b). Experimental and theoretical analysis
of the moment–rotation behaviour of stiffened extended end-plate connections, Journal of Constructional Steel Research, 63, 1279–1293.
Sullivan, T.J., Priestley, M.J.N., Calvi, G.M., (eds) (2012). A Model Code for
the Displacement-Based Seismic Design of Structures. IUSS Press, ISBN: 978-88-6198-072-3.
Sumner, E.A., Mays, TW, Murray, TM., (2000). Cyclic testing of bolted
moment end-plate connections. Research report SAC/BD-00/21. CE/VPI-ST 00/03. Blacksburg (VA): Department of Civil and Environmental Engineering, Virginia Polytechnic Institute and State University.
Sumner, E.A., Murray, T.M., (2002). Behavior of Extended End-Plate
Moment Connections Subject to Cyclic Loading, Journal of Structural Engineering, 128:4, 501-508.
Sumner, E.A., (2003). Unified Design of Extended End-plate Moment
Connection Subject to Cyclic Loading, PhD dissertation. Blackburg (VA), Virginia Polytechnic Institute and State University.
Terracciano, G., Della Corte, G., Di Lorenzo, G., Landolfo, R., (2011).
Displacement based design of Moment Resisting Frame structures with semirigid connections: A preliminary study on connection modeling. (In Italian), Proceedings of XXII C.T.A., Ischia 9-13 October 2011, 759-766, ISBN 978-88-89972-23-6.
Zoetemeijer, P., (1990). Summary of the research on bolted beam-to-
column connections. Report 25-6-90-2. Delft University of
References
192
Technology, Technology, Faculty of Civil Engineering, Stevin Laboratory—Steel Structures.
APPENDIX A
DETAILED REPORT ON EXPERIMENTAL TESTS BY THE
DIGITAL STEEL JOINT DATABASE

Appendix A
194
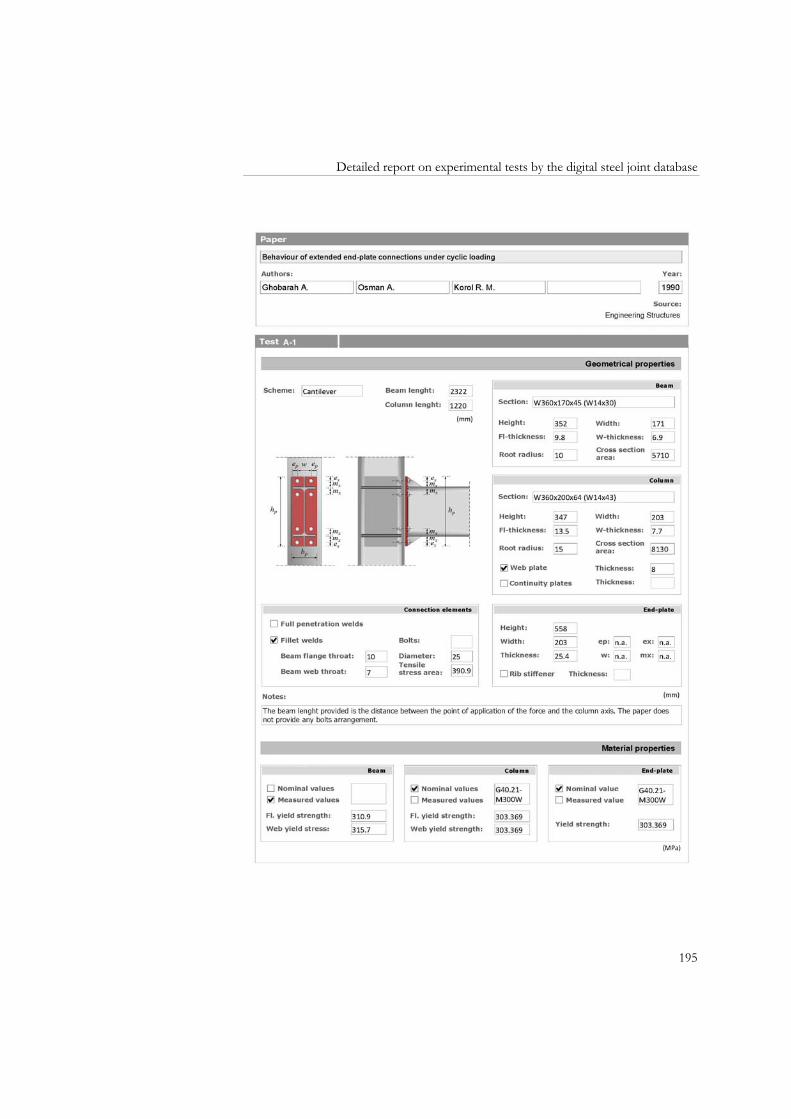
Detailed report on experimental tests by the digital steel joint database
195

Appendix A
196
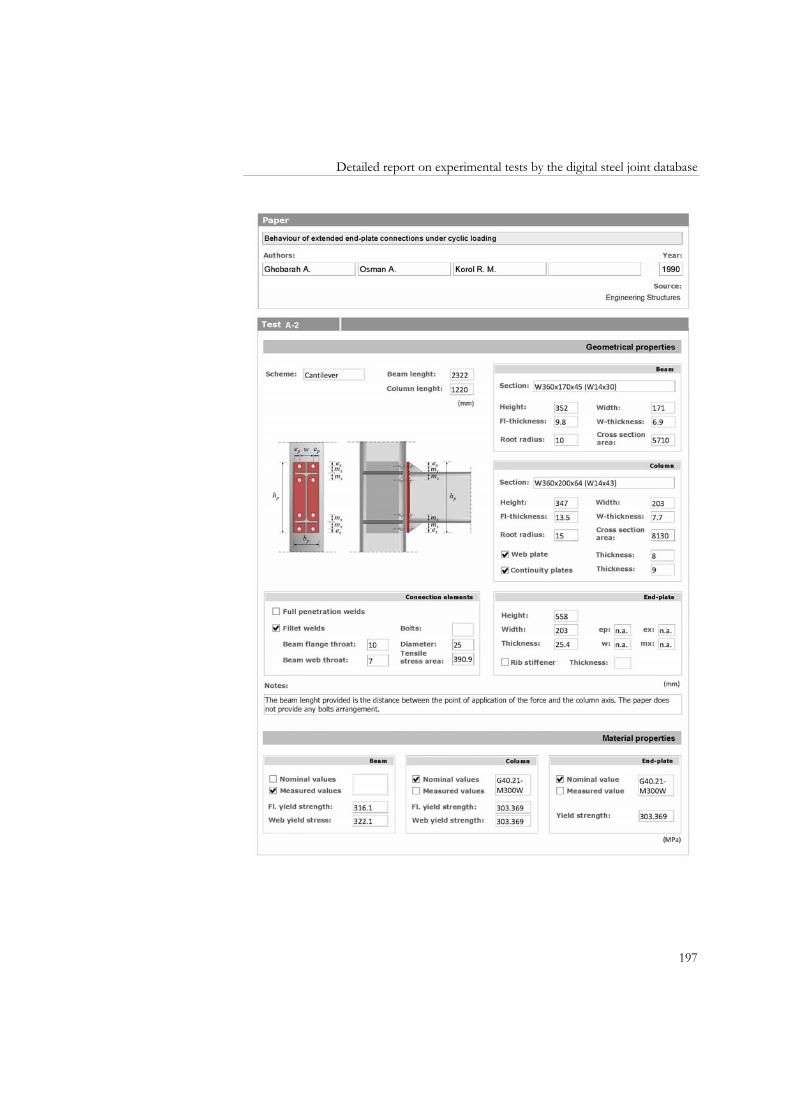
Detailed report on experimental tests by the digital steel joint database
197
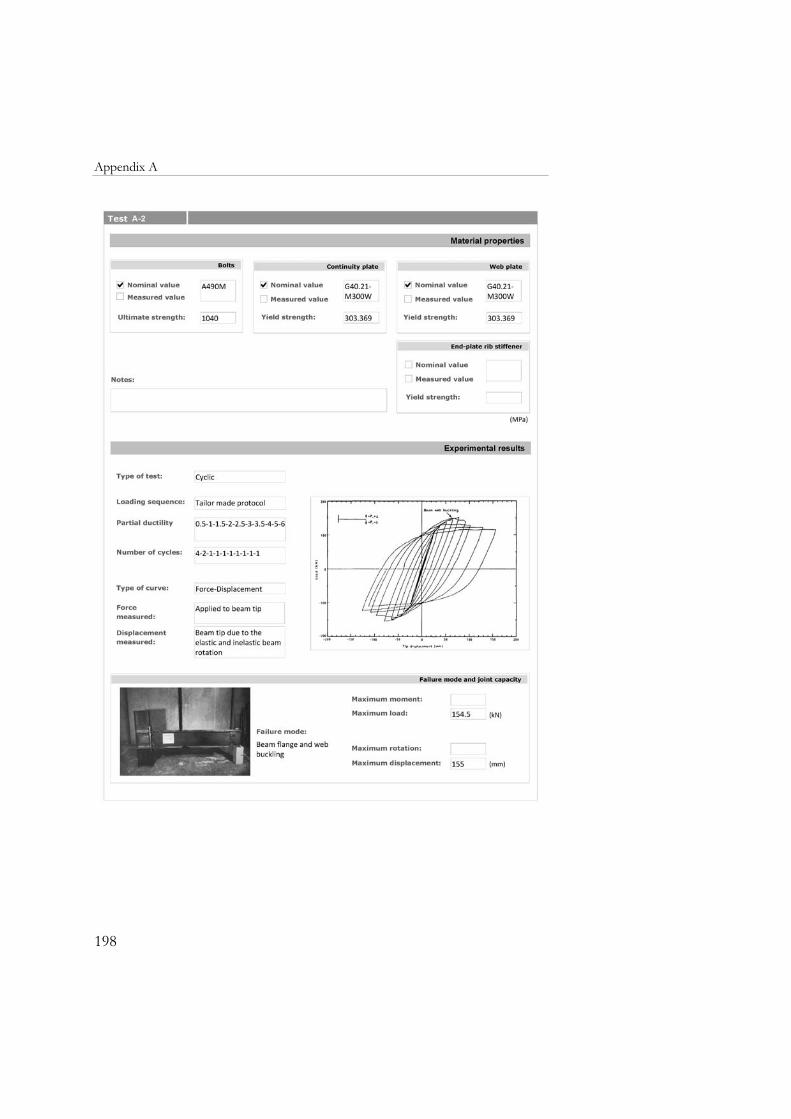
Appendix A
198

Detailed report on experimental tests by the digital steel joint database
199

Appendix A
200

Detailed report on experimental tests by the digital steel joint database
201
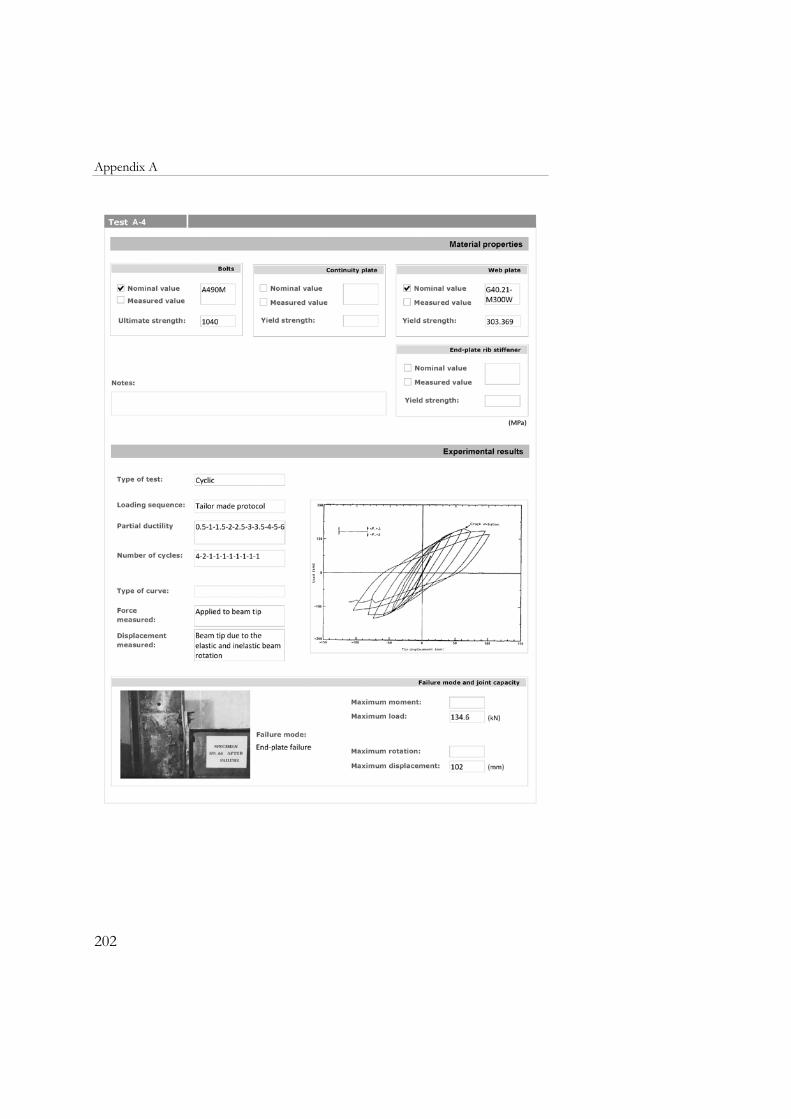
Appendix A
202

Detailed report on experimental tests by the digital steel joint database
203

Appendix A
204

APPENDIX B
DESIGN CHARTS

Appendix B
206
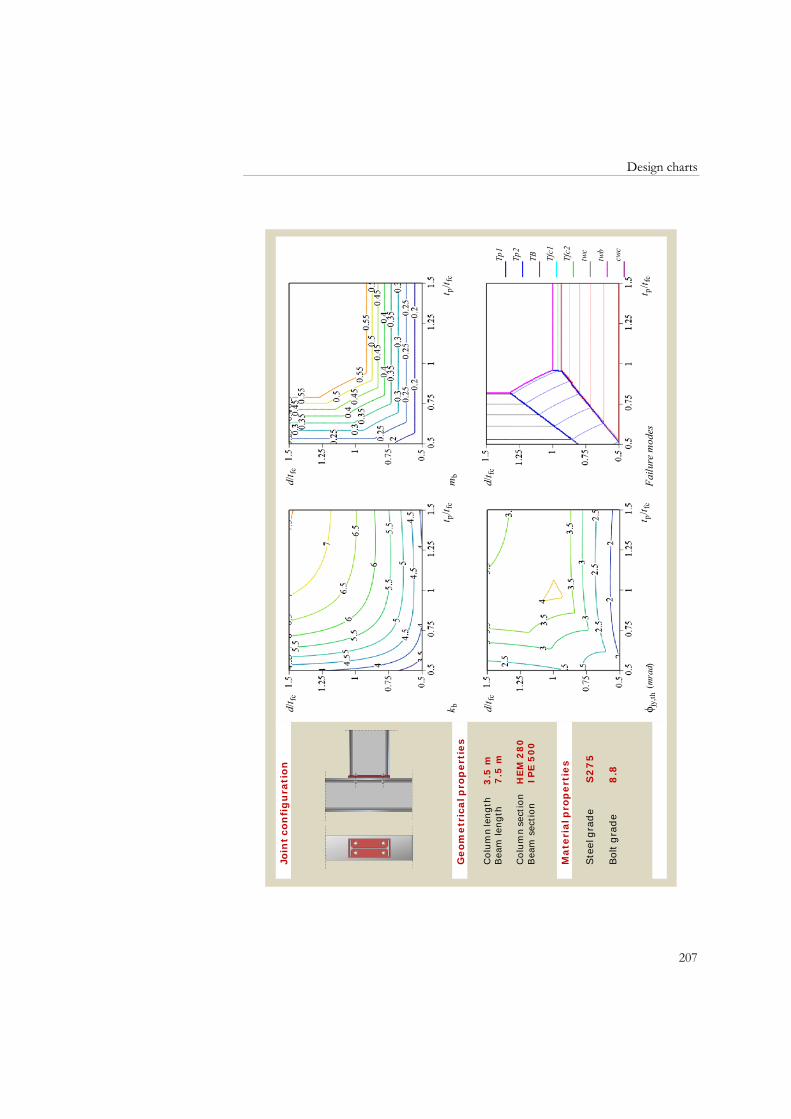
Design charts
207
Col
umn
leng
th
3.5
mB
eam
leng
th
7.5
m
Col
umn
sect
ion
H
EM
28
0B
eam
sec
tion
IP
E5
00
Ste
el g
rade
S2
75
Bol
t gra
de
8.8
Join
t co
nfi
gu
rati
on
Geom
etr
ical p
rop
ert
ies
Mate
rial p
rop
ert
ies
d/t fc
t p/t f
c ϕ
jy,th
(m
rad)
d/t fc
t p/t f
c m
b
d/t fc
t p/t f
c k
b
d/t fc
__Tp
1
__Tp
2
__TB
__Tf
c1
__Tf
c2
__tw
c
__tw
b
__cw
c
t p/t f
c F
ailu
re m
odes
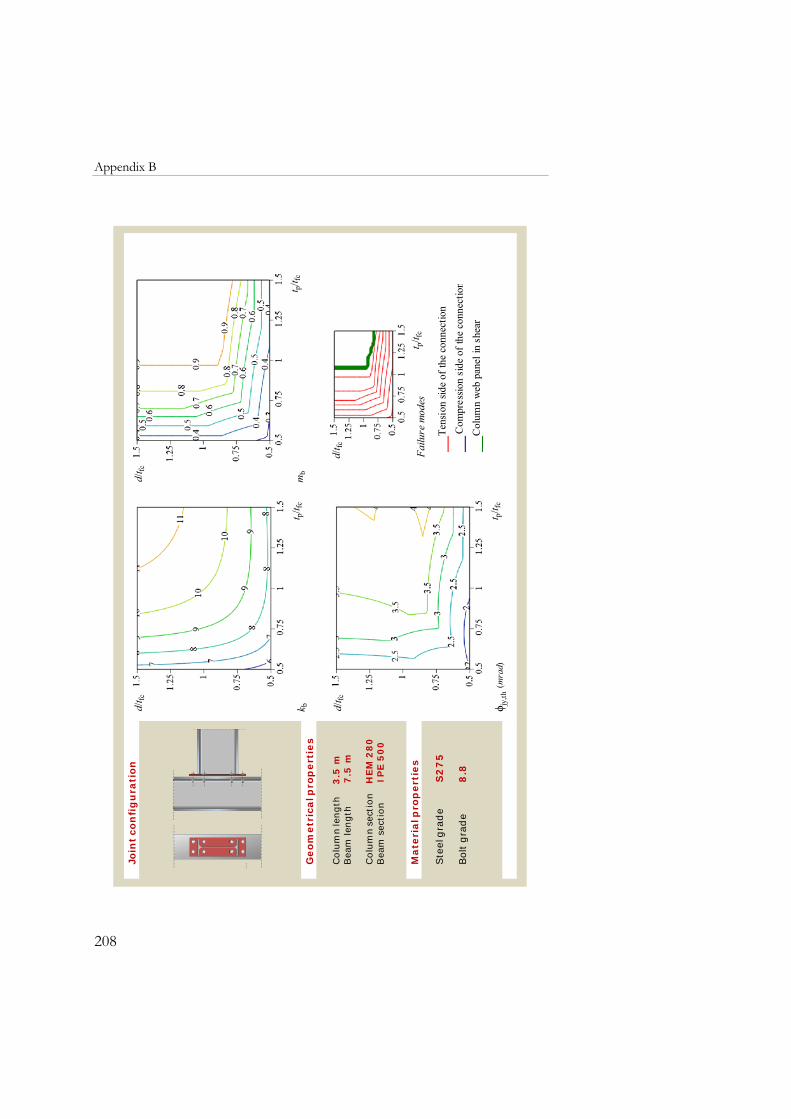
Appendix B
208
Col
umn
leng
th
3.5
mB
eam
leng
th
7.5
m
Col
umn
sect
ion
H
EM
28
0B
eam
sec
tion
IP
E5
00
Ste
el g
rade
S2
75
Bol
t gra
de
8.8
Join
t co
nfi
gu
rati
on
Geom
etr
ical p
rop
ert
ies
Mate
rial p
rop
erti
es
d/t fc
t p/t fc
mb
d/t fc
t p/t fc
kb
d/t fc
t p/t fc
ϕjy
,th (m
rad)
d/t fc
t p/t fc
Failu
re m
odes
__Te
nsio
n sid
e of
the
conn
ectio
n __
Com
pres
sion
side
of t
he c
onne
ctio
n__
Col
umn
web
pan
el in
she
ar

Design charts
209
Col
umn
leng
th
3.5
mB
eam
leng
th
7.5
m
Col
umn
sect
ion
H
EM
28
0B
eam
sec
tion
IP
E5
00
Ste
el g
rade
S2
75
Bol
t gra
de
8.8
Join
t co
nfi
gu
rati
on
Geom
etr
ical p
rop
ert
ies
Mate
rial p
rop
erti
es
__Tp
1
__Tp
2
__Tp
3
__Tf
c1
__Tf
c2
__Tf
c3
__tw
c
__cw
c
__w
p
d/t fc
t p/t fc
Fai
lure
mod
es -
first
bol
t row
d/t fc
t p/t fc
Fai
lure
mod
es -
seco
nd b
olt r
ow
d/t fc
t p/t fc
Fai
lure
mod
es -
web
pan
el in
shea
r
Mod
e 1
of t
he e
nd-p
late
T-S
tub
Mod
e 2
of t
he e
nd-p
late
T-S
tub
Mod
e 3
of t
he e
nd-p
late
T-S
tub
Mod
e 1
of t
he c
olum
n fla
nge
T-St
ub
Mod
e 1
of t
he c
olum
n fla
nge
T-St
ub
Mod
e 1
of t
he c
olum
n fla
nge
T-St
ub
Col
umn
web
in te
nsio
n
Col
umn
web
in c
ompr
essi
on
Col
umn
web
pan
el in
shea
r
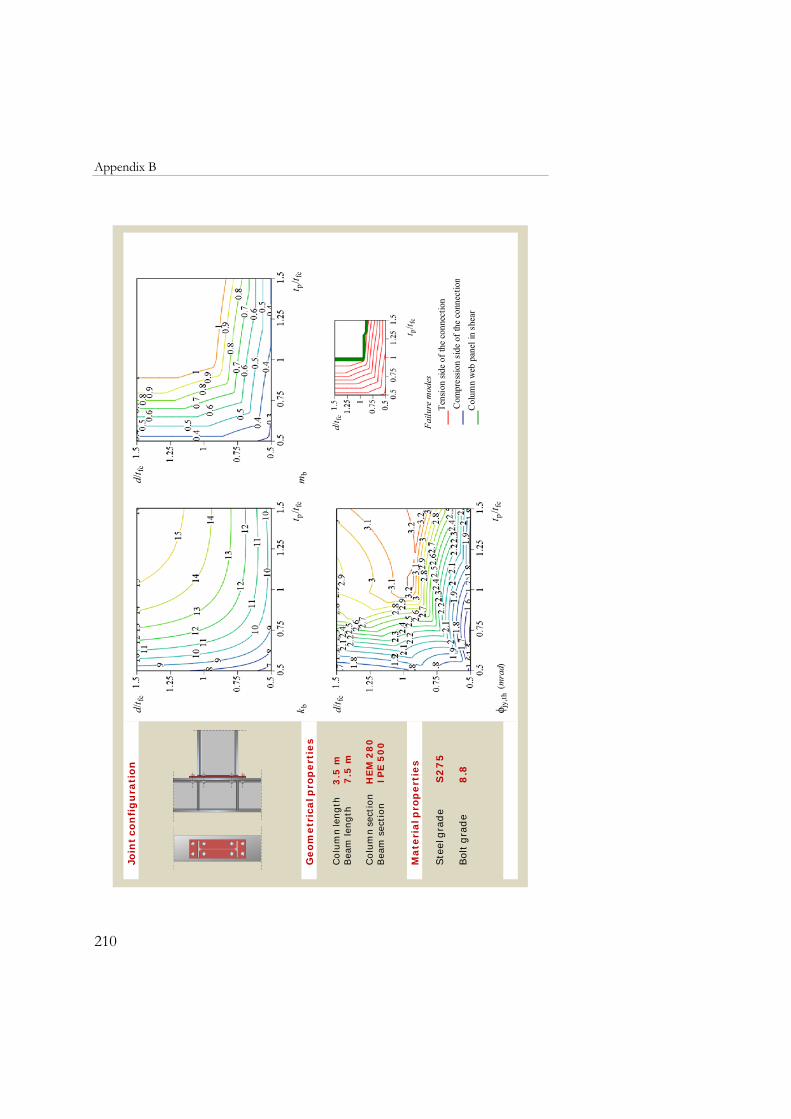
Appendix B
210
Col
umn
leng
th
3.5
mB
eam
leng
th
7.5
m
Col
umn
sect
ion
H
EM
28
0B
eam
sec
tion
IP
E5
00
Ste
el g
rade
S2
75
Bol
t gra
de
8.8
Join
t co
nfi
gu
rati
on
Geom
etr
ical p
rop
ert
ies
Mate
rial p
rop
ert
ies
d/t fc
t p/t f
c m
b
d/t fc
t p/t f
c k
b
d/t fc
t p/t f
c ϕ
jy,th
(m
rad)
d/t fc
t p/t f
c
Failu
re m
odes
__Te
nsio
n sid
e of
the
conn
ectio
n
__ C
ompr
essio
n si
de o
f the
con
nect
ion
__C
olum
n w
eb p
anel
in s
hear
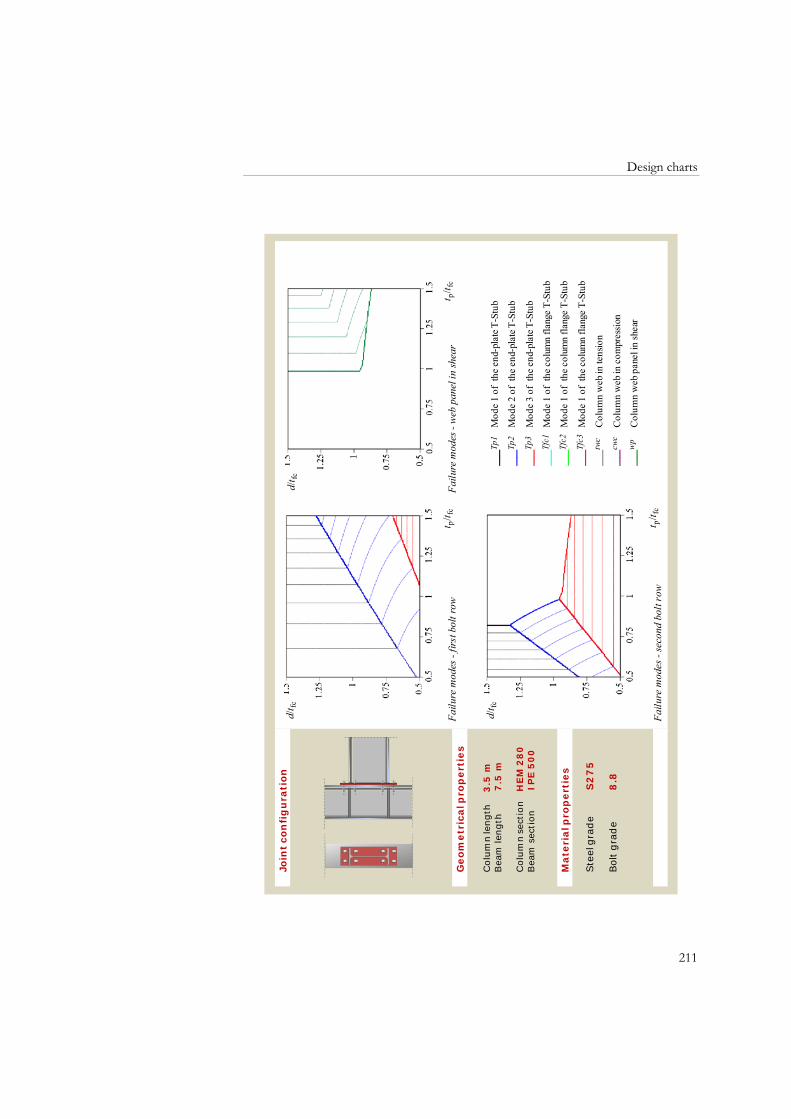
Design charts
211
Col
umn
leng
th
3.5
mB
eam
leng
th
7.5
m
Col
umn
sect
ion
H
EM
28
0B
eam
sec
tion
IP
E5
00
Ste
el g
rade
S2
75
Bol
t gra
de
8.8
Join
t co
nfi
gu
rati
on
Geom
etr
ical p
rop
ert
ies
Mate
rial p
rop
ert
ies
__Tp
1
__Tp
2
__Tp
3
__Tf
c1
__Tf
c2
__Tf
c3
__tw
c
__cw
c
__w
p
Mod
e 1
of t
he e
nd-p
late
T-S
tub
Mod
e 2
of t
he e
nd-p
late
T-S
tub
Mod
e 3
of t
he e
nd-p
late
T-S
tub
Mod
e 1
of t
he c
olum
n fla
nge
T-St
ub
Mod
e 1
of t
he c
olum
n fla
nge
T-St
ub
Mod
e 1
of t
he c
olum
n fla
nge
T-St
ub
Col
umn
web
in te
nsio
n
Col
umn
web
in c
ompr
essi
on
Col
umn
web
pan
el in
shea
r
d/t fc
t p/t f
c F
ailu
re m
odes
- fir
st b
olt r
ow
d/t fc
t p/t f
c F
ailu
re m
odes
- se
cond
bol
t row
d/t fc
t p/t f
c F
ailu
re m
odes
- w
eb p
anel
in sh
ear
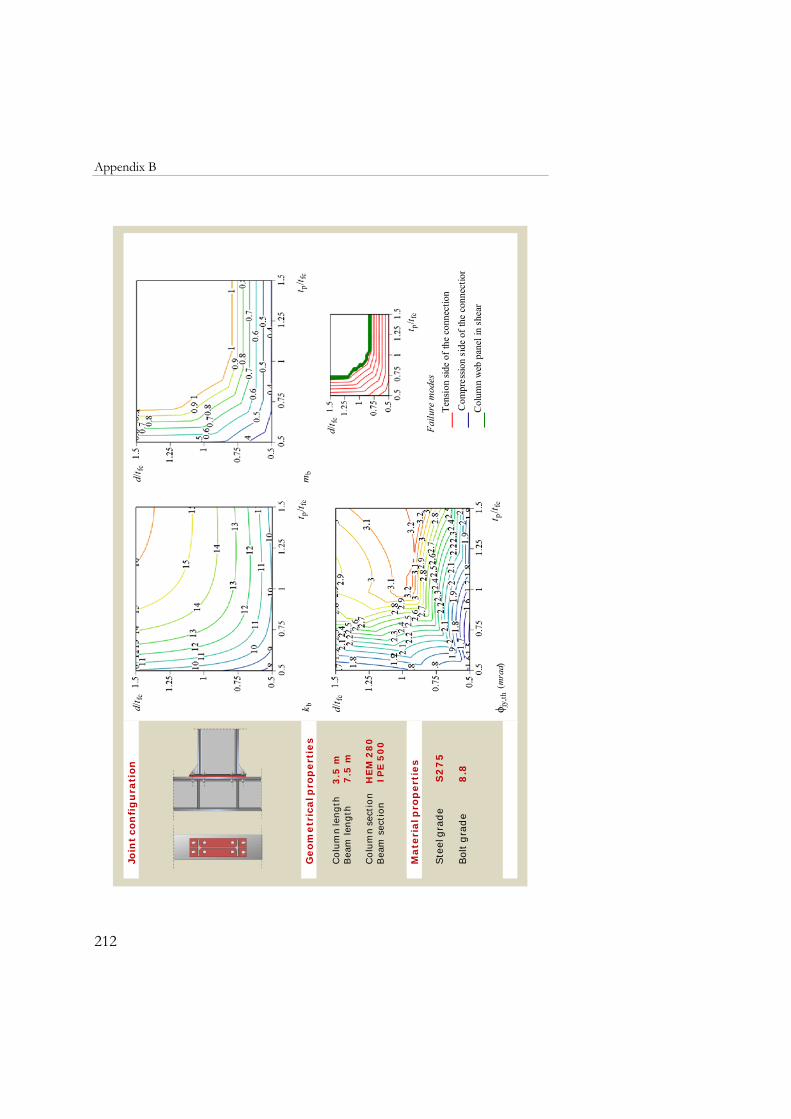
Appendix B
212
Col
umn
leng
th
3.5
mB
eam
leng
th
7.5
m
Col
umn
sect
ion
H
EM
28
0B
eam
sec
tion
IP
E5
00
Ste
el g
rade
S2
75
Bol
t gra
de
8.8
Join
t co
nfi
gu
rati
on
Geom
etr
ical p
rop
ert
ies
Mate
rial p
rop
ert
ies
d/t fc
t p/t f
c ϕ
jy,th
(m
rad)
d/t fc
t p/t f
c k
b
d/t fc
t p/t f
c m
b
d/t fc
t p/t f
c
Failu
re m
odes
__Te
nsio
n sid
e of
the
conn
ectio
n
__ C
ompr
essio
n si
de o
f the
con
nect
ion
__C
olum
n w
eb p
anel
in s
hear

Design charts
213
Col
umn
leng
th
3.5
mB
eam
leng
th
7.5
m
Col
umn
sect
ion
H
EM
28
0B
eam
sec
tion
IP
E5
00
Ste
el g
rade
S2
75
Bol
t gra
de
8.8
Join
t co
nfi
gu
rati
on
Geom
etr
ical p
rop
ert
ies
Mate
rial p
rop
ert
ies
__Tp
1
__Tp
2
__Tp
3
__Tf
c1
__Tf
c2
__Tf
c3
__tw
c
__cw
c
__w
p
Mod
e 1
of t
he e
nd-p
late
T-S
tub
Mod
e 2
of t
he e
nd-p
late
T-S
tub
Mod
e 3
of t
he e
nd-p
late
T-S
tub
Mod
e 1
of t
he c
olum
n fla
nge
T-St
ub
Mod
e 1
of t
he c
olum
n fla
nge
T-St
ub
Mod
e 1
of t
he c
olum
n fla
nge
T-St
ub
Col
umn
web
in te
nsio
n
Col
umn
web
in c
ompr
essi
on
Col
umn
web
pan
el in
shea
r
d/t fc
t p/t f
c F
ailu
re m
odes
- fir
st b
olt r
ow
d/t fc
t p/t f
c F
ailu
re m
odes
- se
cond
bol
t row
d/t fc
t p/t f
c F
ailu
re m
odes
- w
eb p
anel
in sh
ear

Appendix B
214
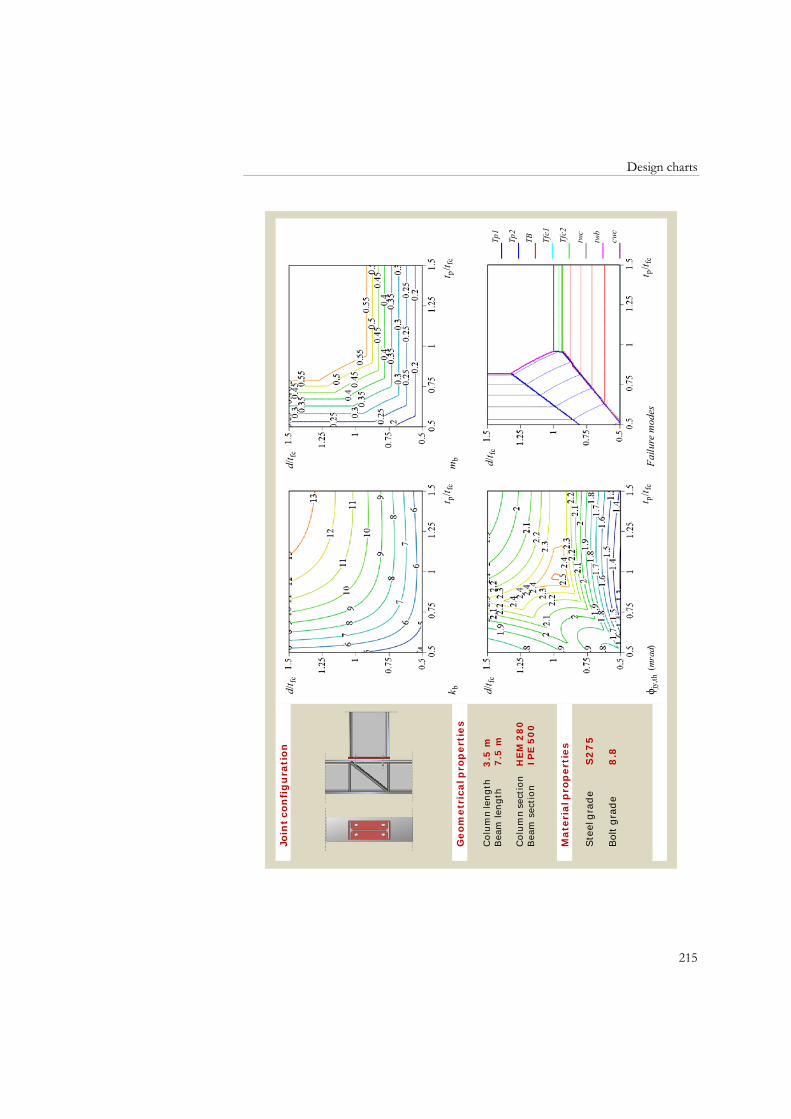
Design charts
215
Col
umn
leng
th
3.5
mB
eam
leng
th
7.5
m
Col
umn
sect
ion
H
EM
28
0B
eam
sec
tion
IP
E5
00
Ste
el g
rade
S2
75
Bol
t gra
de
8.8
Join
t co
nfi
gu
rati
on
Geom
etr
ical p
rop
ert
ies
Mate
rial p
rop
ert
ies
d/t fc
t p/t f
c k
b
d/t fc
t p/t f
c m
b
d/t fc
t p/t f
c ϕ
jy,th
(m
rad)
d/t fc
__Tp
1
__Tp
2
__TB
__Tf
c1
__Tf
c2
__tw
c
__tw
b
__cw
c
t p/t f
c F
ailu
re m
odes
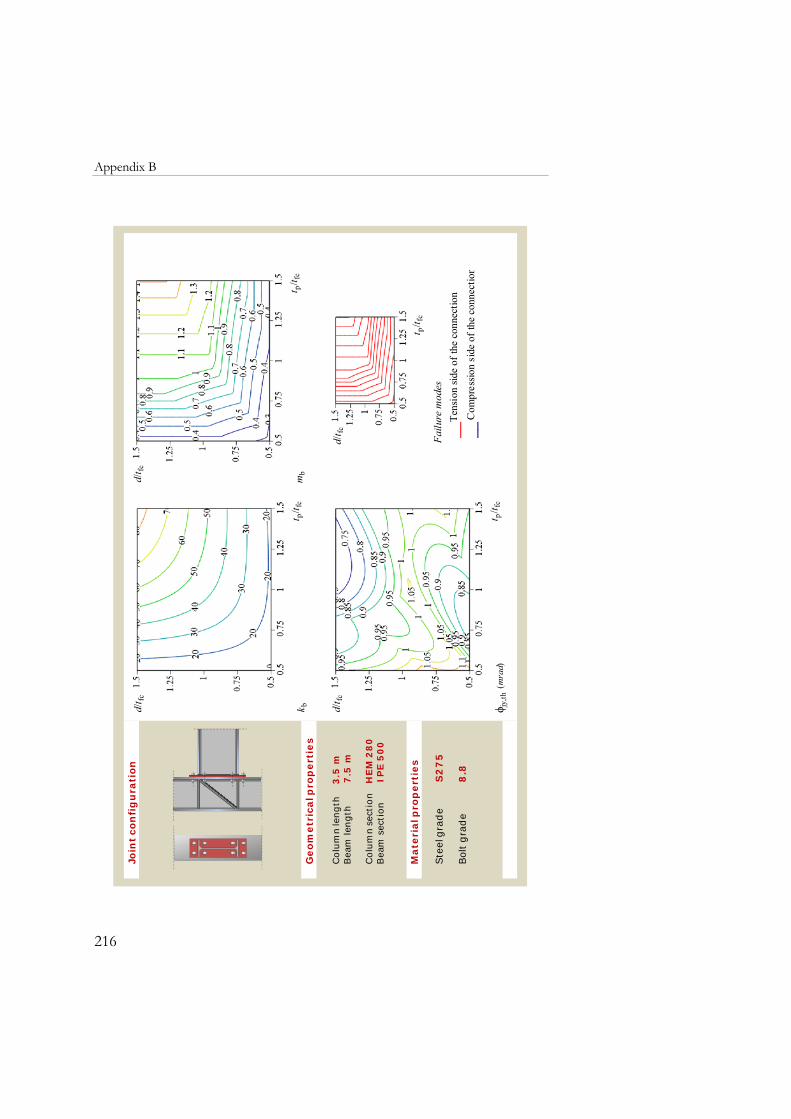
Appendix B
216
Col
umn
leng
th
3.5
mB
eam
leng
th
7.5
m
Col
umn
sect
ion
H
EM
28
0B
eam
sec
tion
IP
E5
00
Ste
el g
rade
S2
75
Bol
t gra
de
8.8
Join
t co
nfi
gu
rati
on
Geom
etr
ical p
rop
ert
ies
Mate
rial p
rop
ert
ies
d/t fc
t p/t f
c ϕ
jy,th
(m
rad)
d/t fc
t p/t f
c k
b
d/t fc
t p/t f
c m
b
d/t fc
t p/t f
c
Failu
re m
odes
__Te
nsio
n sid
e of
the
conn
ectio
n
__ C
ompr
essio
n si
de o
f the
con
nect
ion
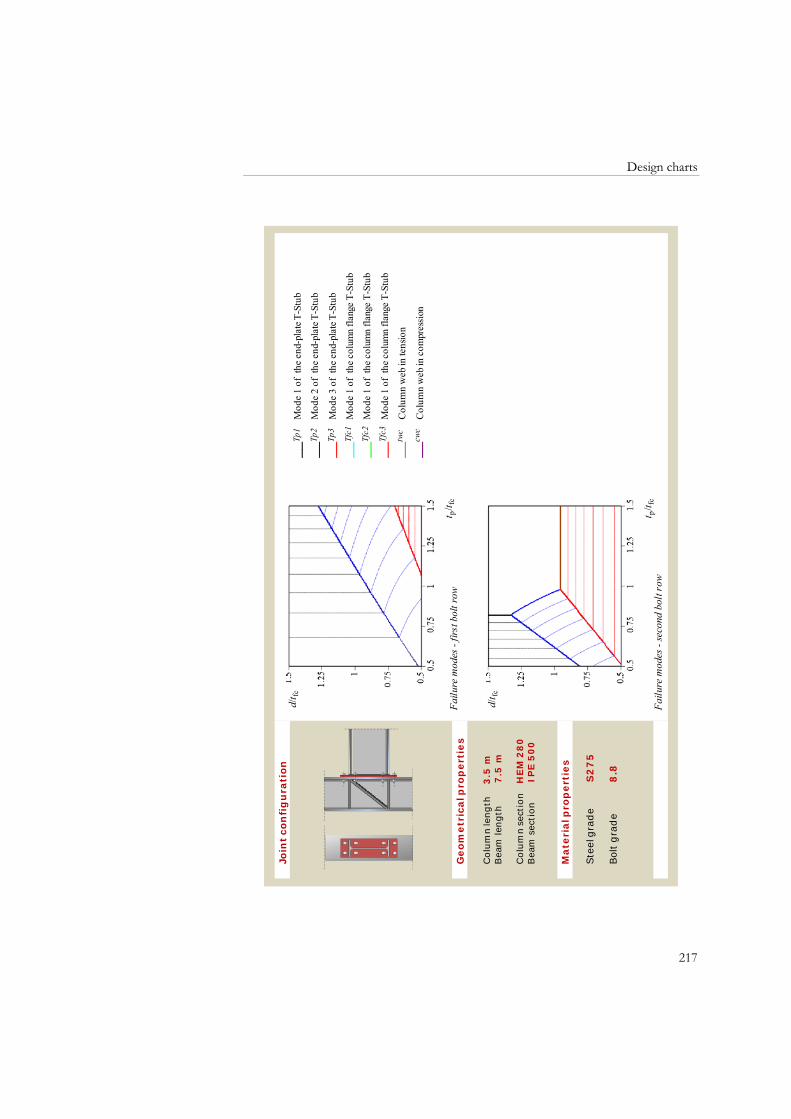
Design charts
217
Col
umn
leng
th
3.5
mB
eam
leng
th
7.5
m
Col
umn
sect
ion
H
EM
28
0B
eam
sec
tion
IP
E5
00
Ste
el g
rade
S2
75
Bol
t gra
de
8.8
Join
t co
nfi
gu
rati
on
Geom
etr
ical p
rop
ert
ies
Mate
rial p
rop
ert
ies
__Tp
1
__Tp
2
__Tp
3
__Tf
c1
__Tf
c2
__Tf
c3
__tw
c
__cw
c
Mod
e 1
of t
he e
nd-p
late
T-S
tub
Mod
e 2
of t
he e
nd-p
late
T-S
tub
Mod
e 3
of t
he e
nd-p
late
T-S
tub
Mod
e 1
of t
he c
olum
n fla
nge
T-St
ub
Mod
e 1
of t
he c
olum
n fla
nge
T-St
ub
Mod
e 1
of t
he c
olum
n fla
nge
T-St
ub
Col
umn
web
in te
nsio
n
Col
umn
web
in c
ompr
essi
on
d/t fc
t p/t f
c F
ailu
re m
odes
- fir
st b
olt r
ow
d/t fc
t p/t f
c F
ailu
re m
odes
- se
cond
bol
t row
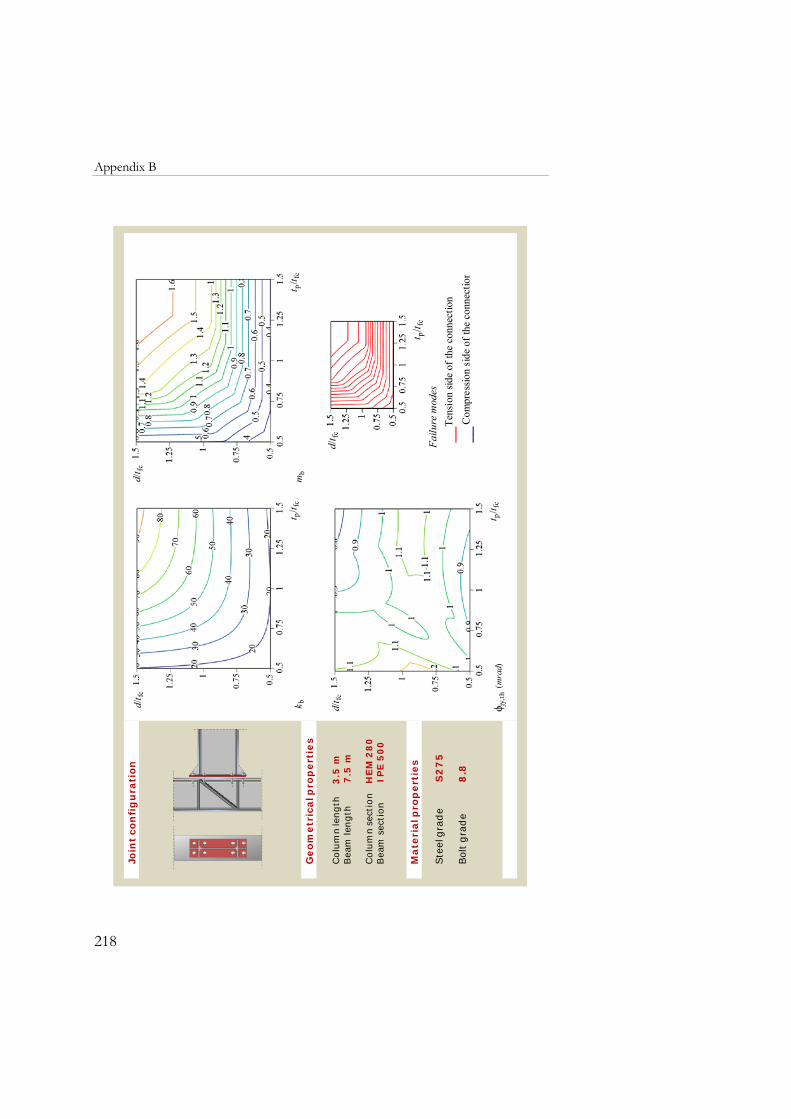
Appendix B
218
Col
umn
leng
th
3.5
mB
eam
leng
th
7.5
m
Col
umn
sect
ion
H
EM
28
0B
eam
sec
tion
IP
E5
00
Ste
el g
rade
S2
75
Bol
t gra
de
8.8
Join
t co
nfi
gu
rati
on
Geom
etr
ical p
rop
ert
ies
Mate
rial p
rop
ert
ies
d/t fc
t p/t f
c m
b
d/t fc
t p/t f
c k
b
d/t fc
t p/t f
c ϕ
jy,th
(m
rad)
d/t fc
t p/t f
c
Failu
re m
odes
__Te
nsio
n sid
e of
the
conn
ectio
n
__ C
ompr
essio
n si
de o
f the
con
nect
ion
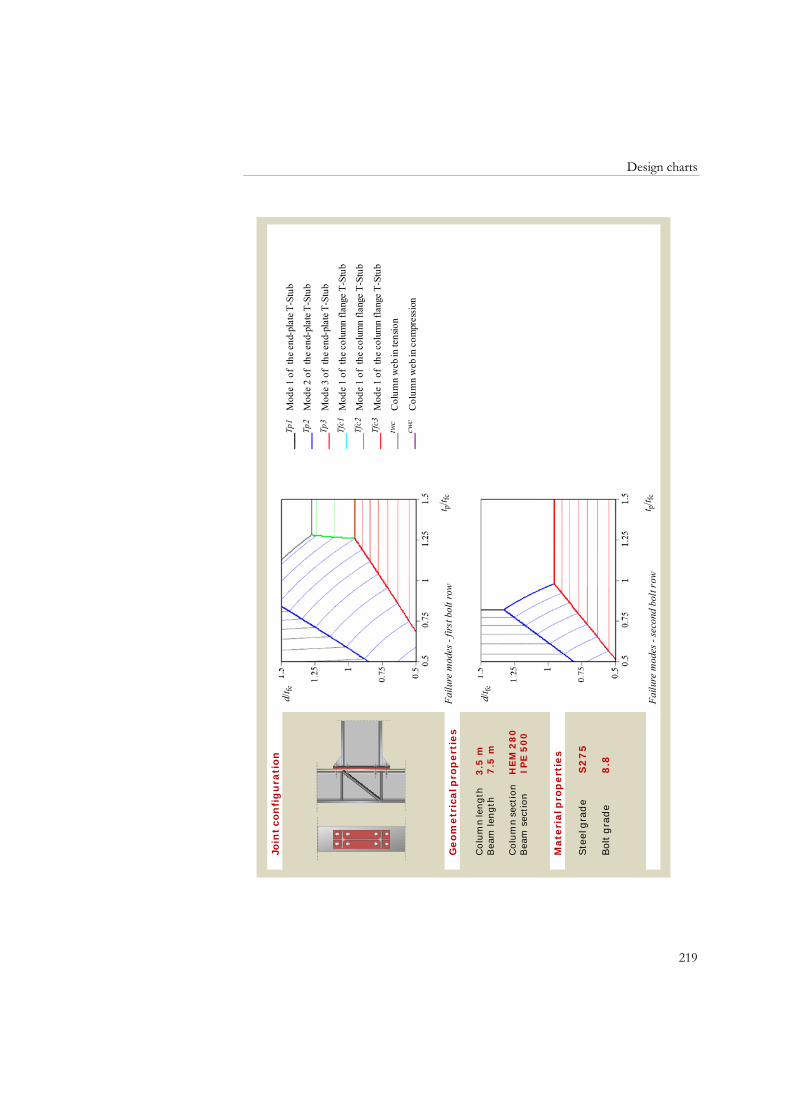
Design charts
219
Col
umn
leng
th
3.5
mB
eam
leng
th
7.5
m
Col
umn
sect
ion
H
EM
28
0B
eam
sec
tion
IP
E5
00
Ste
el g
rade
S2
75
Bol
t gra
de
8.8
Join
t co
nfi
gu
rati
on
Geom
etr
ical p
rop
ert
ies
Mate
rial p
rop
ert
ies
d/t fc
t p/t fc
Fai
lure
mod
es -
seco
nd b
olt r
ow
d/t fc
t p/t fc
Fai
lure
mod
es -
first
bol
t row
__Tp
1
__Tp
2
__Tp
3
__Tf
c1
__Tf
c2
__Tf
c3
__tw
c
__cw
c
Mod
e 1
of t
he e
nd-p
late
T-S
tub
Mod
e 2
of t
he e
nd-p
late
T-S
tub
Mod
e 3
of t
he e
nd-p
late
T-S
tub
Mod
e 1
of t
he c
olum
n fla
nge
T-St
ub
Mod
e 1
of t
he c
olum
n fla
nge
T-St
ub
Mod
e 1
of t
he c
olum
n fla
nge
T-St
ub
Col
umn
web
in te
nsio
n
Col
umn
web
in c
ompr
essi
on


221