Embed Size (px)
Citation preview
UNIVERSITI PUTRA MALAYSIA
AN EXAMINATION OF THE CONDITIONAL AND UNCONDITIONAL RELATIONS BETWEEN RISK AND RETURN ON THE
KUALA LUMPUR STOCK EXCHANGE
MOHD NIZAL BIN HANIFF
GSM 2001 11
AN EXAMINATION OF THE CONDmONAL AND UNCONDITIONAL RELATIONS BETWEEN RISK AND RETURN ON THE KUALA LUMPUR
STOCK EXCHANGE
by
MOHD NIZAL BIN HANIFF
Thesis Submitted in FulfIlment of the Requirements for the Degree of Master of Science in Finance at the Malaysian Graduate School of Management
Universiti Putra Malaysia
May 2001
Abstract of thesis presented to the Senate of Universiti Putra Malaysia in fulfilment of the requirements for the degree of Master of Science
AN EXAMINATION OF THE CONDITIONAL AND UNCONDITIONAL RELATIONS BETWEEN RISK AND RETURN ON THE KUALA LUMPUR
STOCK EXCHANGE
Chairman Faculty
BY
MOHD NIZAL HANIFF
2001
: Mohamad Ali Abdul Hamid, PhD : Graduate School of Management
Previous empirical tests of the Capital Asset Pricing Model (CAPM) in mature and
emerging capital markets focused on the premise that there is a positive linear
relationship between portfolio betas and portfolio returns. The CAPM predicts that
the expected return for any asset is a positive function of only three variables namely,
beta (the covariance of asset return and market return), the risk free rate and the
expected market return.
Earlier findings by Black, Jensen and Scholes (1972) and Fama and MacBeth (1973)
in the US stock markets generally found a weak but positive relationship between
portfolio returns and beta over the entire sample periods. However, this assertion was
seriously challenged by the findings of Banz (1981) and Fama and French (1992)
which evidence indicated the absence of a systematic relationship between beta and
portfolio returns. Further evidence indicated that other variables such as size of the
finn and the ratio of the book value of a finn's common equity to its market value
2
seemed to do better than beta in explaining the cross-sectional variations in average
asset returns. Pettengill, Sundaram and Mathur (1995) offered a new interpretation of
systematic relationship and introduced a new methodology to test the CAPM, which
assumes a conditional relationship between portfolio returns and beta depending on
whether the excess market return is positive or negative.
The main objective of the study is to examine this conditional relationship between
beta and returns as proposed by Pettengill, Sundaram and Mathur (1995) to
Malaysian stock returns. To study this relationship, monthly data for a period of 15
years between January 1985 and December 1999 were used. The study also looked at
the impact of non-synchronous trading problem on the KLSE. In addition, the study
also examined the impact of portfolio size on the systematic and conditional as well
as unconditional relationships between beta and portfolio returns.
The results indicated that there was a very weak evidence of a significant risk
premium on beta when the unconditional relationship between beta and portfolio
returns was considered. When the sample was split into periods whether the excess
market return is positive or negative, there was a significant relationship between
portfolio returns and beta. The evidence also indicated that the size of portfolio had a
positive linear relationship with' the value of the cross-sectional coefficient under
conditional relationship. However, the results did not support any positive reward for
holding market risk during the sample period.
3
Abstrak thesis yang dikemukakan kepada Senat Universiti Putra Malaysia sebagai memenuhi keperluan untuk ijazah Master Sains
SUATU PEMERIKSAAN KE ATAS HUBUNGAN BERSYARAT DAN HUBUNGAN TIDAK BERSYARAT DI ANTARA RISIKO DAN PULANGAN
DI DALAM BURSA SAHAM KUALA LUMPUR
Pengerusi Fakulti
OLEH
MOHD NIZAL HANIFF
2001
: Mohamad Ali Abdul Hamid, PhD : Pusat Pengajian Siswazah Pengurusan
Ujian-ujian emperikal yang lalu ke atas Model Perletakan Harga Aset Modal (Capital
Asset Pricing Model, CAPM) di dalam pasaran modal yang matang dan membangun
menekankan kewujudan hubungan positif dan linear di antara beta sesuatu portfolio
dan pulangannya. CAPM meramalkan bahawa jangkaan pulangan bagi sesuatu aset
ialah fungsi positif ke atas tiga pembolehubah iaitu beta (kovarian bagi pulangan aset
dan pulangan pasaran), kadar pulangan tanpa risiko dan jangkaan pulangan pasaran.
Hasil kajian terdahulu oleh Black, Jensen dan Scholes (1972) dan Fama dan
MacBeth (1973) ke atas pasaran saham di Amerika Syarikat mendapati secara
keseluruhan, terdapat hubungan positif yang lemah di antara pulangan portfolio dan
beta ke atas tempoh jangka waktu sampel yang diambiL Walaubagaimanapun,
kenyataan ini telah disanggah keras oleh hasil-hasil kajian Banz (1981) dan Fama
dan French (1992) yang membuktikan ketidakwujudan hubungan sistematik di antara
4

beta dan pulangan portfolio. Bukti-bukti lain menunjukkan bahawa terdapat
pembolehubah lain seperti saiz syarikat dan nisbah di antara nilai buku dengan nilai
pasaran saham sesebuah syarikat, lebih mampu memberi penjelasan yang lebih nyata
dari beta mengenai variasi keratan-lintang ke atas pulangan purata aset. Pettengill,
Sundaram dan Mathur (1995) telah mengenengahkan suatu intepretasi bam mengenai
hubungan sistematik di antara beta dan pulangan, dan memperkenalkan kaedah baru
untuk menguji CAPM, dengan andaian bahawa wujudnya hubungan bersyarat di
antara pulangan portfolio dan beta berdasarkan samada lebihan pulangan pasaran itu
positif atau negatif.
Objektif utama kajian ini ialah untuk mengkaji hubungan bersyarat di antara beta dan
pulangan seperti yang diajukan oleh Pettengill, Sundaram dan Mathur (1995), ke at as
pulangan saham di Malaysia. Untuk meneliti hubungan ini, data bulanan bagi tempoh
15 tahun di antara January 1985 dan Disember 1999 telah digunakan. Kajian ini juga
memeriksa kesan ke atas masalah dagangan tidak synchronous di BSKL. Kajian ini
juga meneliti kesan saiz portfolio ke atas hubungan sistematik dan bersyarat, dan
juga tidak bersyarat, di antara pulangan dan beta sesuatu portfolio.
HasH kajian menunjukkan bahawa terdapat bukti yang sangat lemah mengenai kesan
premium risiko ke atas beta apabila hubungan tidak bersyarat dikenakan ke atas beta
dan pulangan portfolio. Setelah sampel dipecahkan mengikut jangka waktu samada
lebihan pulangan pasaran itu positif atau negatif, suatu hubungan nyata di antara
pulangan dan beta portfolio wujud. Bukti juga menunjukkan bahawa saiz portfolio
mempunyai hubungan linear positif dengan nilai koefisyen keratan lintang di dalam
5

hubungan bersyarat. Walaubagaimanapun, hasil kajian tidak menyokong sebarang
hasil pulangan positif dari memegang risiko pasaran sepanjang tempoh sampel
tersebut.
6

ACKNOWLEDGEMENT
I would like to express my gratitude to the Almighty Allah - Syukur Alhamdulillah -
for without His blessings this thesis would not have been completed in time.
I would also like to extend my appreciation to my thesis committee members,
Associate Professor Dr. Mohamad Ali Abdul Hamid, Professor Dr. Annuar Md.
Nassir and Dr. Huson Joher Alliahmed for their guidance, encouragement and
patience throughout the preparation of this thesis.
I would like to express my love and appreciation to my family especially to my wife,
Suzana who had been at my side offering support, love, patience and help in the
preparation of this thesis. My loves also go to my lovely children Farah, Hariz and
Sarah for brightening up my days throughout this demanding period.
Finally, my thanks also go to my dear friends Shukur, Norli and Shamsuwadt Zuha
for their unselfish support, advice and encouragement. The same is also extended to
all the staff ofUPM who has been instrumental in the completion of this thesis.
7

I certify that an Examination Committee met on 8th of June 2001 to conduct the final examination ofMohd. Nizal Bin Haniff on his Master of Science thesis entitled" An Examination of the Conditional and Unconditional Relations Between Risk and Return on the Kuala Lumpur Stock Exchange" in accordance with Universiti Pertanian Malaysia (Higher Degree) Act 1980. The committee recommends that the candidate be awarded the relevant degree. Members of the Examination Committee are as follows:
Raduan Che Rose, Ph.D. Graduate School of Management Universiti Putra Malaysia (Chairman)
Mohamad Ali Abdul Hamid, Ph.D. Chairman for Master of Science Thesis Supervisory Committee Graduate School of Management Universiti Putra Malaysia (Member)
Annuar Md. Nassif, Ph.D. ProfessorlHead of Department of Finance and Accounting Graduate School of Management Universiti Putra Malaysia (Member)
Huson Joher Aliahmed, Ph.D. Graduate School of Management Universiti Putra Malaysia (Member)
ah t Salleh, Ph.D. ssociate ProfessorlDeputy Dean
Graduate School of Management Universiti Putra Malaysia
Date:
8

This thesis was submitted to the Senate of Universiti Putra Malaysia and has been accepted as fulfilment of the requirement for the degree of Master of Science.
-= �. "
Zainal Abidin Kidam Associate ProfessorlDean Graduate School of Management Universiti Putra Malaysia
Date:
9

DECLARA nON
I hereby declare that the thesis is based on my original work except for quotations and citations, which have been duly acknowledged. I also declare that it has not been previously or concurrently submitted for any other degree at UPM or other institutions.
June 2001
10
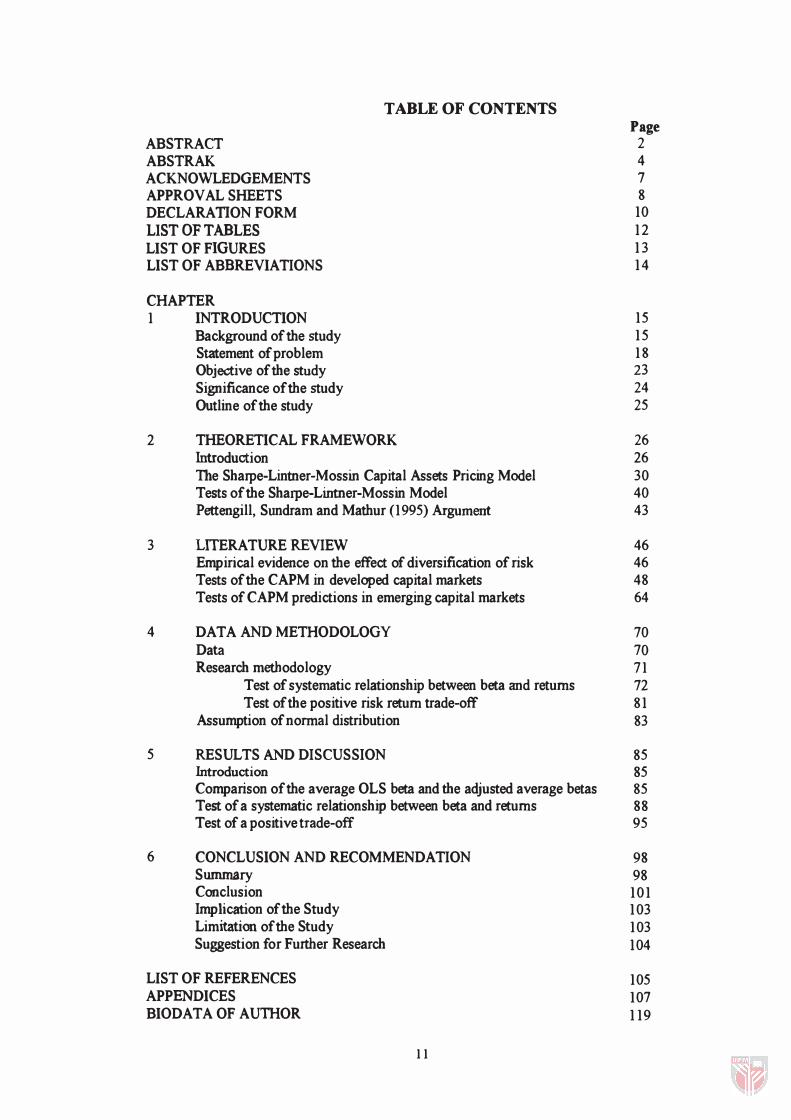
TABLE OF CONTENTS
ABSTRACT ABSTRAK ACKNOWLEDGEMENTS APPROVAL SHEETS DECLARATION FORM LIST OF TABLES LIST OF FIGURES LIST OF ABBREVIATIONS
CHAPTER 1 INTRODUCTION
2
Background of the study Statement of problem Objective of the study Significance of the study Outline of the study
THEORETICAL FRAMEWORK Introduction The Sharpe-Lintner-Mossin Capital Assets Pricing Model Tests of the Sharpe-Lintner-Mossin Model
3
4
5
6
Pettengill, Sundram and Mathur (1995) Argument
LITERATURE REVIEW Empirical evidence on the effect of diversification of risk Tests of the CAPM in developed capital markets Tests of CAPM predictions in emerging capital markets
DATA AND METHODOLOGY Data Research methodology
Test of systematic relationship between beta and returns Test of the positive risk return trade-off
Assumption of nonnal distribution
RESULTS AND DISCUSSION Introduction Comparison of the average OLS beta and the adjusted average betas Test of a systematic relationship between beta and returns Test of a positive trade-off
CONCLUSION AND RECOMMENDATION Summary Conclusion Implication of the Study Limitation of the Study Suggestion for Further Research
LIST OF REFERENCES APPENDICES BIODATA OF AUTHOR
1 1
Page 2 4 7 8
10 12 13 14
15 15 18 23 24 25
26 26 30 40 43
46 46 48 64
70 70 71 72 81 83
85 85 85 88 95
98 98
101 103 103 104
105 107 119
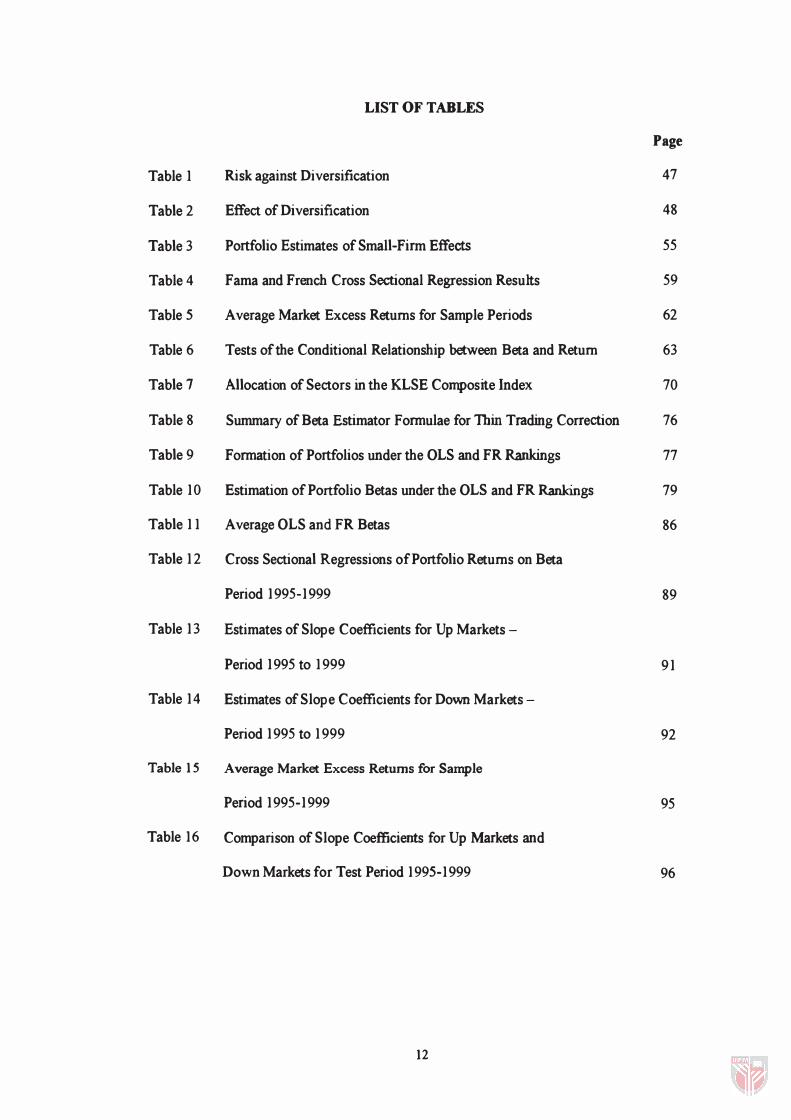
LIST OF TABLES
Page
Table 1 Risk against Diversification 47
Table 2 Effect of Diversification 48
Table 3 Portfolio Estimates of Small-Firm Effects 55
Table 4 Fama and French Cross Sectional Regression Resuhs 59
Table 5 Average Market Excess Returns for Sample Periods 62
Table 6 Tests of the Conditional Relationship between Beta and Return 63
Table 7 Allocation of Sectors in the KLSE Composite Index 70
Table 8 Summary of Beta Estimator Formulae for Thin Trading Correction 76
Table 9 Formation of Portfolios under the OLS and FR Rankings 77
Table 10 Estimation of Portfolio Betas under the OLS and FR Rankings 79
Table 11 Average OLS and FR Betas 86
Table 12 Cross Sectional Regressions of Portfolio Returns on Beta
Period 1995-1999 89
Table 13 Estimates of Slope Coefficients for Up Markets -
Period 1995 to 1999 91
Table 14 Estimates of Slope Coefficients for Down Markets -
Period 1995 to 1999 92
Table 1 5 Average Market Excess Returns for Sample
Period 1995-1999 95
Table 16 Comparison of Slope Coefficients for Up Markets and
Down Markets for Test Period 1995-1999 96
12

LIST OF FIGURES
Figure 1 The Efficient Frontier
Figure 2 The Caprtal Market Line
Figure 3 Portfolios Made up of Security i and the Market Portfolio
Figure 4 The Security Market Line
1 3
Page
32
33
34
39

AC
AMEX
CAPM
CML
CRSP
FR
KLSE
BSKL
NYSE
NASDAQ
OLS
SES
SML
UK
USA
LIST OF ABBREVIA nONS
Aggregated Coefficient
American Stock Exchange
Capital Asset Pricing Model
Capital Market Line
Centre for Research in Securities Prices
Fowler Rorke
Kuala Lumpur Stock Exchange
Bursa Saham Kuala Lumpur
New York Stock Exchange
National Association of Automatic Quote System
Ordinary Least Squares
Stock Exchange of Singapore
Security Market Line
United Kingdom
United States of America
14
CHAPTERl
INTRODUCTION
Background of the Study
Modem portfolio theory categorises the risks inherent in common stocks into
systematic and unsystematic risks. Systematic risk is the degree of correspondence of
a security's price movements with the general stock market and this cannot be
mitigated by means of diversification. Unsystematic risk on the other hand refers to
company related risks and can be minimised without affecting expected portfolio
returns either through the naIve or efficient diversification techniques (Jensen, 1968).
The development of the concept risk coefficient popularly referred to as beta
IS based on the Capital Asset Pricing Model (CAPM) (Sharpe-Lintner-Mossin)
developed in the early 1960s. In theory, beta represents the non-diversifiable,
systematic risk of an individual security or portfolio of securities. It reflects a risk for
which a return should be expected. Securities' returns are undoubtedly affected by
many economic factors, which include inflation, levels of productivity and resources
prices. Since the market as a whole will also be affected by these forces the CAPM
assumes that a security's sensitivity to movements of the market portfolio captures
its sensitivity to all underlying forces as well. Thus, the single key risk factor is a
security's sensitivity to the market portfolio. This relative sensitivity is called beta.
The CAPM, which is predicated on the assumption of a positive risk-return trade-off,
asserts that the expected return for any asset is a positive function of only three
variables: beta (the covariance of asset return and market return), the risk-free rate
and the expected market return. In this manner, the CAPM suggests that the
appropriate measure of systematic risk for both efficiently and naively diversified
1 5
portfolios given an efficient market is beta. This suggestion implies that an asset's
responsiveness to general market movements is the only variable to cause systematic
differences in returns between assets. Therefore on average, the excess returns from
a security an investor can expect above the risk-free rate is dependent solely on beta,
which is the sensitivity of the security's return to the changes in market return. Thus
a security with a beta of 1.0 is just as risky as the market. One with a beta of 0.5 is
less risky and one with a beta of more than 1.0 are riskier than the market.
It is clear however, that the CAPM rests on a number of assumptions that are
not strictly true in the real world. All investors are assumed to be risk averse and to
have identical preferences about risk and return. Investors are assumed to care only
about risk and return, so that their utility function admits only the mean and variance
of the distribution of returns. In addition, the model assumes that all investors have
identical expectations about the future risks and returns of all securities. All investors
are also assumed to have the same tax rates and are able to borrow and lend at the
risk-free rate without limits on the amount borrowed or lent and that no risky assets
are excluded from the investment portfolio. Finally, the model assumes that there are
no transaction costs and no costs of research. These in tum complicate the empirical
testing of the model since its validity can only be assessed by examining how well it
predicts real world phenomena.
Betas can be used by investment analysts as a benchmark to design portfolios
to match the risk preferences of their clients i.e. for high risk (high return) profile,
they should choose high beta stocks and for low risk (low return) profile, they should
choose low beta stocks. The method can also be used to monitor the performance of
portfolios of stocks against the market portfolio. A high beta portfolio may be
expected to outperform the market when stock prices are rising. However, the
16
portfolio is expected to perform well if it performs better than predicted by theory.
For example, if the portfolio has a beta of 1.5 and the market has an average return of
10 percent, then it is expected that the portfolio give a 15 percent return. A 12
percent return from the portfolio, even though better then the market, would be
judged to be poor given the level of systematic risk (as measured by beta) of the
portfolio. The use of beta has also enable financial managers to estimate the cost of
equity capital using the CAPM. This equates the cost of equity to the risk free rate
plus a market premium for risk depending on the beta of the firm. The great
advantage claimed for using the CAPM over other methods of estimating the cost of
equity is that the finance manager can calculate a cost which reflects investors'
perceptions of the relative riskiness of their company's shares.
The model is quite versatile when combined with the cost of other sources of
financing. It can be used to calculate the weighted average cost of capital, which can
then be used as a cut-off rate to discount cash flows and determine the acceptability
of capital investment proposals. For a number of years most large companies have
built into their capital budgeting process the CAPM (see Jagannathan and McGrattan
( 1995». This model was apparently successful in assessing the risk of the cash flow
from a potential investment project, to estimate the project's cost of capital and the
expected rate of return that investors will demand if they are to invest in the project.
Thus to evaluate projects effectively, managers must understand how investors assess
that risk and how they determine what risk premium to demand. According to the
CAPM, the only relevant measure of a project's risk is a variable unique to this
model, known as the project's beta. In other words, in the CAPM, the cost of capital
is an exact linear function of the rate on a risk-free project and the beta of the project
being evaluated. A manager who has an estimate of the beta of a potential project can
17
use the CAPM to estimate the cost of capital for the project. It is then argued that if
the CAPM captures investors' behaviour adequately, then historical data should
reveal a positive linear relation between the average return on financial assets and
their betas. It is also argued that no other measure of risk should be able to explain
the differences in average returns across financial assets that are not explained by
CAPM betas.
Statement of Problem
Empirical tests of the positive risk-return trade-off, using average realised
returns to proxy for expected returns and an index of equity security returns as a
proxy for market returns, initially supported the validity of the CAPM (see Fama and
MacBeth (1973)). However, the usefulness of beta as the single measure of risk for a
security has been challenged by at least two arguments. First, research has
challenged the concept of beta as the most efficient measure of systematic risk for
individual securities. Chen, Roll and Ross (1986) for example, have argued in favour
of measuring systematic responsiveness to several macroeconomic variables that
include inflation, interest rate, risk premium and industrial production. They find that
there is a significant relationship between the variables and the statistically identified
systematic factors in stock returns. Furthermore, when beta was introduced as an
additional variable along with the sensitivity of each portfolio to the macroeconomic
variables, it did not show up as statistically significant in the cross-sectional
regression. The second argument against beta is due to empirical findings by some
researchers implying that either there is no risk-return trade-off or beta simply does
not measure risk. Banz (1981) tested the CAPM by checking whether the size of the
firms involved can explain the residual variation in average returns across assets that 18
is not explained by the CAPM's beta. Banz challenges the CAPM by showing that
size does explain the cross-sectional variation in average returns on a particular
collection of assets better than beta. He finds that during the 1936-1975, the average
return to stocks of small firms in the USA (those with low values of market equity)
was substantially higher than the average return to stocks of large firms after
adjusting for risk using the CAPM. This observation has become known as the size
effect.
Fama and French ( 1992) supported the above finding by Banz (1981). In a
study for the period from July 1963 to December 1990 on stocks of firms listed on
the New York Stock Exchange (NYSE), the American Stock Exchange (AMEX) and
the National Association of Security Dealers Automatic Quote System (NASDAQ),
they concluded that the size effect is significant with or without betas. Their
estimates indicate that for a large collection of stocks, beta has no ability to explain
the cross-sectional variation in average returns, whereas size has substantial
explanatory power. Fama and French (1992) also consider the ability of other
attributes to account for this cross-sectional variation. When they include the ratio of
the book value of a firm's common equity to its market value as an explanatory
variable in addition to size, they find that this ratio can account for a substantial
portion of the cross-sectional variation in average returns. In fact, book-to-market
equity appears to be more powerful than size.
The absence of a systematic relationship between beta and security returns as
discovered by Fama and French (1992) made later researchers scrambling to figure
out just what was going on. Must the CAPM be abandoned and a new model
developed? Or can the CAPM be modified in some way to make it a useful tool?
Although Fama and French (1992) make a persuasive case against the CAPM, recent
19
studies have challenged their results. Kothari, Shanken, and Sloan (1995), for
example, argue that Fama and French (I992) findings depend critically on how one
interprets their statistical tests. They focus on Fama and French's estimates for the
coefficient on beta, which have high standard errors therefore imply that a wide
range of economically plausible risk premiums that cannot be rejected statistically.
There have also been modifications of the original model of the CAPM not
considered by Fama and French (1992) that appear to be consistent with data.
Pettengill, Sundaram and Mathur (I995) argue that the use of beta may be justified as
a measure of risk, even if beta is less efficient than alternative measures of systematic
risk or is an incomplete measure of risk. However, if there is no systematic
relationship between cross-sectional returns and beta, continued reliance on beta as a
measure of risk is inappropriate. So far, evidences have not been conclusive on this.
Despite these debates on the relevance of beta, F ama (1991) asserts that " ... market
professionals (and academics) still think about risk in terms of market beta." This
preference for beta presumably results from the convenience of using a single factor
to measure risk and the intuitive appeal of beta.
An alternative explanation of the flat relationship between portfolio return
and beta advanced by Fama and French (1992) was proposed by Pettengill,
Sundaram and Mathur (1995). They argued that the statistical methodology used by
Fama and French (1992) to evaluate the relationship between beta and return requires
adjustment to take into account of the fact that realised returns and not ex ante
returns have been used in the tests. This is because the CAPM treats beta as a
subjective estimate made by each individual of what the future might hold. It is an ex
ante opinion of likely systematic risk during the next period of time. In practice
however, it is rare that subjective estimates of beta are made, instead beta estimates 20
are usually based on the market model in which historical returns on a security in
excess of a risk-free rate are regressed against excess returns on a proxy for the
market portfolio. This ex post measure is commonly used as proxy for ex ante data.
This in tum creates two possible biases in such beta estimates. The first bias is
concerning the use of historical data in obtaining beta estimates. Historical data could
be a poor predictor of the future as estimates will depend to a large degree on the
time period chosen, and such estimates are often inaccurate predictors. The second
bias looks at the reliability of beta over time. If the composition of the portfolio has
changed over time, the beta associated with current holdings will not be the beta
calculated from the past returns of different holdings and thus the beta measured will
not be the beta for the current portfolio.
To tackle these limitations, Pettengill, Sundaram and Mathur (1995),
developed a methodology which assumes a conditional relationship between return
and beta, depending on whether, the excess return on the market index is positive or
negative. In periods when the excess market return is positive (up market), there
should be a positive relationship between beta and return. In periods when the excess
market return is negative (down market), there should be a negative relationship
between beta and return. They find that when the expectation concerning negative
market excess returns are adjusted, there is a consistent and significant relationship
between beta and returns for the entire sample, for sub sample periods, and for data
divided by months in a year. This is because high beta stocks are more sensitive to
the negative market excess return and will have a lower return than low beta stocks.
The evidence in Pettengill, Sundaram and Mathur (1995) shows that for the period
1936-1990, there is a strong support for beta when the sample period is divided into
up market and down market months. In addition, they also found that there is support
2 1
for a positive payment for beta risk. They concluded that since the concerns
regarding the weak correlation between beta and the cross-section of returns
appeared to be unfounded, the results support the continued use of beta as a measure
of market risk.
Fletcher (1997) in the United Kingdom conducted a study using similar
methodology. He studied the conditional relationship between beta and return in the
UK between January 1975 and December 1994 and found that when the sample
period was split into periods of whether the excess market return was positive or not,
there was a significant positive relationship between beta and return in periods of
positive excess market returns, and a significant negative relationship between beta
and return in periods of negative excess market return. This is consistent with
Pettengill, Sundaram and Mathur (1995), and suggests the need to focus on
conditional relationship between beta and return. However, the conditional
relationship between beta and return in up market and down market months was not
symmetrical, as predicted by Pettengill, Sundaram and Mathur (1995). The
relationship was stronger in down markets. This contradicts one of the conditions of
the positive risk and return trade-off suggested by Pettengill, Sundaram and Mathur
(1995). However, the results suggest that the market beta is still valid and useful as a
measure of systematic risk.
Previous empirical studies in emerging capital markets also focused on the
positive linear relationship (the unconditional relationship) between portfolio returns
and beta. The findings of Ariff(1990), Bark (1991) and Annuar and Ariff(1998) do
not seem to support the unconditional relationship between portfolio returns and
systematic risk. In many of the cases, the tests for linear risk-return relationship and
positive risk premium produced results, which appeared inconclusive. Thus the
22
validity of beta as a single measure of systematic risk could not be supported. The
above two studies by Pettengill, Sundaram and Mathur (1995) and Fletcher (1997)
were done in relation to developed and mature stock markets i.e. the USA and the
UK stock markets. Could similar findings be found in an emerging market like the
Malaysian stock market? If similar findings could be extended to emerging capital
markets like the KLSE, it may well be that beta could still be a valid single measure
of systematic risk. A review of past studies on testing the CAPM is exhibited in
Appendix 1.
Objective of the Study
This paper exammes the crucial assertion that beta has no systematic
relationship with return. It will attempt to examine the cross sectional relationship
between beta and return in Malaysian stock returns between January 1985 and
December 1999. The main objective of the paper is to examine the conditional
relationship between beta and return proposed by Pettengill, Sundaram and Mathur
(1995) to Malaysian stock returns. The examination is done in order to compare the
results of findings on an emerging capital market with similar test results in
developed markets discussed above. More specifically the main objectives of this
study may be outlined as follows:
1. To examine empirically the systematic relationship between realised portfolio
returns and portfolio beta using the procedures developed by Fama and
MacBeth (1973) on stock returns on the KLSE.
2. To investigate empirically the impact of the alternate interpretation of
systematic relationship i.e. the Conditional Relation between beta and return
23
as proposed by Pettengill, Sundaram and Mathur (1995) on stock returns on
theKLSE.
3. To test empirically whether a positive long-run trade-off between beta and
average portfolio returns can be observed as predicted by the Capital Asset
Pricing Model under both situation (1) and (2) above.
4 . To examine whether size of portfolio has any impact on the systematic
relationship between beta and realised return investigated in point (1) and (2)
above.
As suggested by Pettengill, Sundaram and Mathur (1995), this study
explicitly recognises the impact of using realised market returns to proxy for
expected market returns. This study will not however address the influence of
macroeconomic variables in describing returns as forwarded by Chen, Roll and Ross
(1986). Finally, this study will take into account the impact of non-synchronous
trading problem in emerging markets. The appropriate beta correction method will be
applied to counter this problem. In this aspect the impact of uncorrected and
corrected estimated betas on the systematic relationship between beta and portfolio
return will be observed.
Significance of the Study
The new methodology introduced by Pettengill, Sundaram and Mathur (1995)
focused on the conditional relationship between portfolio returns and beta. This
offers a new angle on the interpretation of the systematic risk-return relationship and
provides a new avenue in testing the validity of the CAPM. Recent findings by
Fletcher (1997) generally supported the findings of Pettengill, Sundaram and Mathur
24